Embed Size (px)
Citation preview

AUDITED ANNUAL FINANCIAL STATEMENTS
FOR THE YEAR ENDED DECEMBER 31, 2017
March 14, 2018

TABLE OF CONTENTS
REPORT OF INDEPENDENT REGISTERED PUBLIC ACCOUNTING FIRM ........................................................... 2 CONSOLIDATED FINANCIAL STATEMENTS ............................................................................................................... 6
Consolidated Statements of Earnings.................................................................................................................................... 6 Consolidated Statements of Comprehensive Income ............................................................................................................ 7 Consolidated Statements of Financial Position ..................................................................................................................... 8 Consolidated Statements of Changes in Equity .................................................................................................................... 10 Consolidated Statements of Cash Flows ............................................................................................................................... 11
NOTES TO THE CONSOLIDATED FINANCIAL STATEMENTS ................................................................................. 12 1. Nature of business ............................................................................................................................................................. 12 2. Summary of significant accounting policies ..................................................................................................................... 12 3. Recent accounting pronouncements .................................................................................................................................. 27 4. Change in accounting estimate ......................................................................................................................................... 29 5. Segmental information ...................................................................................................................................................... 30 6. Expenses classified by nature ........................................................................................................................................... 32 7. Gain (loss) from investments ............................................................................................................................................ 32 8. Income taxes ..................................................................................................................................................................... 34 9. Earnings per share ............................................................................................................................................................. 36 10. Goodwill and intangible assets........................................................................................................................................ 36 11. Property and equipment .................................................................................................................................................. 38 12. Investments in associates ................................................................................................................................................ 39 13. Investments ..................................................................................................................................................................... 40 14. Accounts receivable ........................................................................................................................................................ 41 15. Cash and cash equivalents, restricted cash advances and collateral ................................................................................ 42 16. Prepaid expenses and deposits ........................................................................................................................................ 42 17. Assets held for sale ......................................................................................................................................................... 42 18. Credit facility .................................................................................................................................................................. 43 19. Long-term debt ................................................................................................................................................................ 43 20. Capital management ........................................................................................................................................................ 45 21. Derivatives ...................................................................................................................................................................... 45 22. Commitments .................................................................................................................................................................. 48 23. Other payables ................................................................................................................................................................ 48 24. Provisions ........................................................................................................................................................................ 48 25. Customer deposits ........................................................................................................................................................... 49 26. Share capital .................................................................................................................................................................... 50 27. Reserves .......................................................................................................................................................................... 51 28. Fair value ........................................................................................................................................................................ 55 29. Statement of cash flows .................................................................................................................................................. 59 30. Contingent liabilities ....................................................................................................................................................... 59 31. Financial instruments ...................................................................................................................................................... 60 32. Related party transactions ............................................................................................................................................... 63 33. Subsequent events ........................................................................................................................................................... 63
2
Deloitte LLP 2 New Street Square London EC4A 3BZ
Phone: +44 (0)20 7936 3000 Fax: +44 (0)20 7583 1198 www.deloitte.co.uk
Report of Independent Registered Public Accounting Firm
To the Shareholders and the Board of Directors of The Stars Group Inc.
Opinion on the Consolidated Financial Statements
We have audited the accompanying consolidated financial statements of The Stars Group Inc. and subsidiaries (the “Company”), which comprise the consolidated statements of financial position as at December 31, 2017 and December 31, 2016, the consolidated statements of earnings, consolidated statements of comprehensive income, consolidated statements of changes in equity and consolidated statements of cash flows for the years then ended, and the related notes, including a summary of significant accounting policies and other explanatory information (collectively referred to as the “financial statements”).
In our opinion, the financial statements present fairly, in all material respects, the financial position of the Company as at December 31, 2017 and December 31, 2016, and its financial performance and its cash flows for the years then ended in accordance with International Financial Reporting Standards as issued by the International Accounting Standards Board.
Report on Internal Control over Financial Reporting
We have also audited, in accordance with the standards of the Public Company Accounting Oversight Board (United States) (PCAOB), the Company’s internal control over financial reporting as of December 31, 2017, based on criteria established in Internal Control - Integrated Framework (2013) issued by the Committee of Sponsoring Organizations of the Treadway Commission and our report dated March 14, 2018 expressed an unqualified opinion on the Company’s internal control over financial reporting.
Basis for Opinion
Management’s Responsibility for the Financial Statements
Management is responsible for the preparation and fair presentation of these financial statements in accordance with International Financial Reporting Standards as issued by the International Accounting Standards Board, and for such internal control as management determines is necessary to enable the preparation of financial statements that are free from material misstatement, whether due to fraud or error.
Auditor’s Responsibility
Our responsibility is to express an opinion on these financial statements based on our audits. We conducted our audits in accordance with Canadian generally accepted auditing standards and the standards of the PCAOB. Those standards require that we plan and perform the audit to obtain reasonable assurance about whether the financial statements are free from material misstatement, whether due to fraud or error. Those standards also require that we comply with ethical requirements.

3
We are a public accounting firm registered with the PCAOB and are required to be independent with respect to the Company in accordance with the U.S. federal securities laws and the applicable rules and regulations of the Securities and Exchange Commission and the PCAOB. Further, we are required to be independent of the Company in accordance with the ethical requirements that are relevant to our audit of the financial statements in Canada and to fulfill our other ethical responsibilities in accordance with these requirements.
An audit includes performing procedures to assess the risks of material misstatement of the financial statements, whether due to fraud or error, and performing procedures that respond to those risks. Such procedures include examining, on a test basis, evidence regarding the amounts and disclosures in the financial statements. The procedures selected depend on our judgment, including the assessment of the risks of material misstatement of the financial statements, whether due to fraud or error. In making those risk assessments, we consider internal control relevant to the Company’s preparation and fair presentation of the financial statements in order to design audit procedures that are appropriate in the circumstances. An audit also includes evaluating the appropriateness of accounting policies and principles used and the reasonableness of accounting estimates made by management, as well as evaluating the overall presentation of the financial statements.
We believe that the audit evidence we have obtained in our audits is sufficient and appropriate to provide a reasonable basis for our audit opinion.
/s/ Deloitte LLP
Deloitte LLP
London, United Kingdom
March 14, 2018
We have served as the Company's auditor since 2015.

4
Deloitte LLP 2 New Street Square London EC4A 3BZ
Phone: +44 (0)20 7936 3000 Fax: +44 (0)20 7583 1198 www.deloitte.co.uk
Report of Independent Registered Public Accounting Firm
To the Shareholders and the Board of Directors of The Stars Group Inc.
Opinion on Internal Control over Financial Reporting
We have audited the internal control over financial reporting of The Stars Group Inc. and subsidiaries (the “Company”) as of December 31, 2017, based on criteria established in Internal Control—Integrated Framework (2013) issued by the Committee of Sponsoring Organizations of the Treadway Commission (COSO). In our opinion, the Company maintained, in all material respects, effective internal control over financial reporting as of December 31, 2017, based on criteria established in Internal Control — Integrated Framework (2013) issued by COSO.
We have also audited, in accordance with the standards of the Public Company Accounting Oversight Board (United States) (PCAOB) and Canadian generally accepted auditing standards, the consolidated financial statements as of and for the year ended December 31, 2017, of the Company and our report dated March 14, 2018, expressed an unmodified/unqualified opinion on those financial statements.
Basis for Opinion
The Company’s management is responsible for maintaining effective internal control over financial reporting and for its assessment of the effectiveness of internal control over financial reporting, included in the accompanying Management’s Annual Report on Internal Control Over Financial Reporting. Our responsibility is to express an opinion on the Company’s internal control over financial reporting based on our audit. We are a public accounting firm registered with the PCAOB and are required to be independent with respect to the Company in accordance with the U.S. federal securities laws and the applicable rules and regulations of the Securities and Exchange Commission and the PCAOB.
We conducted our audit in accordance with the standards of the PCAOB. Those standards require that we plan and perform the audit to obtain reasonable assurance about whether effective internal control over financial reporting was maintained in all material respects. Our audit included obtaining an understanding of internal control over financial reporting, assessing the risk that a material weakness exists, testing and evaluating the design and operating effectiveness of internal control based on the assessed risk, and performing such other procedures as we considered necessary in the circumstances. We believe that our audit provides a reasonable basis for our opinion.
Definition and Limitations of Internal Control over Financial Reporting
A company’s internal control over financial reporting is a process designed to provide reasonable assurance regarding the reliability of financial reporting and the preparation of financial statements for external purposes in accordance with International Financial Reporting Standards as issued by the International Accounting Standards Board.

5
A company’s internal control over financial reporting includes those policies and procedures that (1) pertain to the maintenance of records that, in reasonable detail, accurately and fairly reflect the transactions and dispositions of the assets of the company; (2) provide reasonable assurance that transactions are recorded as necessary to permit preparation of financial statements in accordance with International Financial Reporting Standards as issued by the International Accounting Standards Board, and that receipts and expenditures of the company are being made only in accordance with authorizations of management and directors of the company; and (3) provide reasonable assurance regarding prevention or timely detection of unauthorized acquisition, use, or disposition of the company’s assets that could have a material effect on the financial statements. Because of its inherent limitations, internal control over financial reporting may not prevent or detect misstatements. Also, projections of any evaluation of effectiveness to future periods are subject to the risk that controls may become inadequate because of changes in conditions, or that the degree of compliance with the policies or procedures may deteriorate. /s/ Deloitte LLP Deloitte LLP London, United Kingdom March 14, 2018

6
CONSOLIDATED FINANCIAL STATEMENTS
CONSOLIDATED STATEMENTS OF EARNINGS
Year Ended December 31,
U.S. dollars Note
2017 $000’s
(except per share amounts)
2016 $000’s
(except per share amounts)
(As reclassified*) Revenues 5 1,312,315 1,155,247 Expenses 5,6 Selling 192,709 162,785 General and administrative 571,258 585,123 Financial 163,039 138,299 Gaming duty 130,771 113,102 Acquisition-related costs — 199 Total expenses 1,057,777 999,508 Gain (loss) from investments 7 34,524 (19,278 ) Net (loss) earnings from associates 12 (2,569 ) 623 Gain on settlement of deferred consideration 24 — 2,466 Net earnings before income taxes 286,493 139,550 Income taxes 8 27,208 4,000 Net earnings 259,285 135,550 Net earnings (loss) attributable to Shareholders of The Stars Group Inc. 259,231 136,144 Non-controlling interest 54 (594 ) Net earnings 259,285 135,550 Basic earnings per Common Share 9 $ 1.77 $ 0.96 Diluted earnings per Common Share 9 $ 1.27 $ 0.70
* See notes 5 and 6 for further details on reclassifications.
See accompanying notes.

7
CONSOLIDATED STATEMENTS OF COMPREHENSIVE INCOME
Year Ended December 31, 2017 2016
U.S. dollars Note $000’s $000’s Net earnings 259,285 135,550
Items that are or may be reclassified to net earnings Available-for-sale investments – gain (loss) in fair value * 27 32,474 (2,095 ) Available-for-sale investments – reclassified to net earnings 27 (37,090 ) 4,394 Foreign operations – unrealized foreign currency translation differences 27 (189,012 ) 22,969
Cash flow hedges – effective portion of changes in fair value † 27 (151,311 ) 50,865 Cash flow hedges – reclassified to net earnings † 27 160,069 (42,263 )
Other comprehensive (loss) income (184,870 ) 33,870 Total comprehensive income 74,415 169,420 Total comprehensive income (loss) attributable to
Shareholders of The Stars Group Inc. 74,361 170,014 Non-controlling interest 54 (594 )
Total comprehensive income 74,415 169,420
* Net of income tax recovery of $160,380 for the year ended December 31, 2017 (December 31, 2016 – net of income tax expense of$146,000)† Net of income tax of $nil for the year ended December 31, 2017 (December 31, 2016 - $nil)
See accompanying notes.

8
CONSOLIDATED STATEMENTS OF FINANCIAL POSITION As at December 31, 2017 2016 U.S. dollars Note $000’s $000’s ASSETS Current assets Cash and cash equivalents - operational 15 283,225 129,459 Cash and cash equivalents - customer deposits 25 227,098 138,225 Total cash and cash equivalents 510,323 267,684 Restricted cash advances and collateral 15 7,862 5,767 Current investments — 59,977 Current investments - customer deposits 25 122,668 228,510 Total current investments 13 122,668 288,487 Accounts receivable 14 100,409 81,557 Inventories 302 515 Prepaid expenses and deposits 16 29,393 22,567 Assets held for sale 17 — 6,972 Income tax receivable 16,540 16,838 Derivatives 21 2,037 — Total current assets 789,534 690,387 Non-current assets Restricted cash advances and collateral 15 45,834 45,728 Prepaid expenses and deposits 16 16,514 20,798 Investments in associates 12 — — Long-term accounts receivable 11,818 9,458 Long-term investments 13 6,981 6,921 Promissory note — 4,827 Property and equipment 11 44,837 40,800 Investment tax credits receivable 3,056 1,892 Income tax receivable 14,061 — Deferred income taxes 8 5,141 1,054 Derivatives 21 — 52,038 Goodwill and intangible assets 10 4,477,350 4,588,572 Total non-current assets 4,625,592 4,772,088 Total assets 5,415,126 5,462,475 LIABILITIES Current liabilities Accounts payable and accrued liabilities 151,473 135,777 Other payables 23 42,714 56,588 Provisions 24 17,590 212,780 Customer deposits 25 349,766 366,735 Income tax payable 35,941 23,616 Current maturity of long-term debt 19 4,990 47,750 Derivatives 21 — 4,922 Total current liabilities 602,474 848,168 Non-current liabilities Long-term debt 19 2,353,579 2,380,829 Provisions 24 3,093 8,942 Derivatives 21 111,762 5,594 Income tax payable 24,277 — Deferred income taxes 8 16,510 17,214 Total non-current liabilities 2,509,221 2,412,579 Total liabilities 3,111,695 3,260,747 EQUITY Share capital 26 1,884,219 1,862,789 Reserves 27 (142,340 ) 35,847 Retained earnings 561,519 302,288 Equity attributable to the Shareholders of The Stars Group Inc. 2,303,398 2,200,924 Non-controlling interest 33 804 Total equity 2,303,431 2,201,728 Total liabilities and equity 5,415,126 5,462,475

9
See accompanying notes. Approved and authorized for issue on behalf of the Board on March 14, 2018. (Signed) “Divyesh (Dave) Gadhia”, Director
(Signed) “David Lazzarato”, Director
Divyesh (Dave) Gadhia, Chairman of the Board
David Lazzarato, Chairman of the Audit Committee

10
CONSOLIDATED STATEMENTS OF CHANGES IN EQUITY
For the years ended December 31, 2017 and 2016.
Share Capital
U.S. dollars
Note
Common Shares number
Convertible Preferred
Shares number
Common Shares amount $000’s
Convertible Preferred
Shares amount $000’s
Reserves (note 27)
$000’s
Retained Earnings
$000’s
Equity attributable
to the Shareholders of The Stars Group Inc.
$000's
Non-controlling
interest $000’s
Total equity $000’s
Balance – January 1, 2016 133,426,193 1,139,249 887,015 684,385 280,964 166,144 2,018,508 1,398 2,019,906 Net earnings (loss) — — — — — 136,144 136,144 (594 ) 135,550 Other comprehensive income — — — — 33,870 — 33,870 — 33,870 Total comprehensive income (loss) — — — — 33,870 136,144 170,014 (594 ) 169,420 Issue of Common Shares in relation to exercised warrants 26,27 11,266,575 — 290,174 — (288,982 ) — 1,192 — 1,192 Issue of Common Shares in relation to exercised employee stock options 26,27 408,359 — 1,215 — (294 ) — 921 — 921 Stock-based compensation 27 — — — — 10,289 — 10,289 — 10,289 Balance – December 31, 2016 145,101,127 1,139,249 1,178,404 684,385 35,847 302,288 2,200,924 804 2,201,728 Net earnings — — — — — 259,231 259,231 54 259,285 Other comprehensive loss — — — — (184,870 ) — (184,870 ) — (184,870 ) Total comprehensive (loss) income — — — — (184,870 ) 259,231 74,361 54 74,415 Issue of Common Shares in relation to Equity awards 26,27 2,923,184 — 21,923 — (5,258 ) — 16,665 — 16,665 Share cancellation 26,27 (76,437 ) — (493 ) — 493 — — — — Stock-based compensation 27 — — — — 10,622 — 10,622 — 10,622 Deferred tax on stock-based compensation — — — — 359 — 359 — 359 Acquisition of non-controlling interest — — — — 467 — 467 (825 ) (358 ) Balance – December 31, 2017 147,947,874 1,139,249 1,199,834 684,385 (142,340 ) 561,519 2,303,398 33 2,303,431
See accompanying notes.

11
CONSOLIDATED STATEMENTS OF CASH FLOWS Year Ended December 31,
2017 2016 $000’s $000’s
U.S. dollars Note Operating activities Net earnings 259,285 135,550 Dormant accounts recognized as income 1,596 (9,160 ) Stock-based compensation 10,622 10,289 Interest accretion 40,373 36,433 Interest expense 116,469 130,848 Income tax expense recognized in net earnings 27,208 4,000 Depreciation of property and equipment 8,925 8,181 Amortization of intangible assets 127,986 125,760 Amortization of deferred development costs 10,275 5,942 Unrealized gain on foreign exchange (10,324 ) (17,571 ) Unrealized (gain) loss on investments (170 ) 6,703 (Reversal of) Impairment of assets held for sale, associates and intangible assets (6,799 ) 16,931 Net loss (earnings) from associates 2,569 (623 ) Gain on settlement of deferred consideration (44 ) (2,466 ) Realized (gain) loss on current investments, promissory note and other (50,038 ) 2,906 Income taxes paid (9,357 ) (1,699 ) Changes in non-cash operating elements of working capital 29 (3,801 ) (32,019 ) Customer deposit liability movement (30,924 ) (70,992 ) Other 749 923 Net cash inflows from operating activities 494,600 349,936 Financing activities Issuance of common shares in relation to exercised warrants — 1,192 Issuance of common shares in relation to exercised employee stock options 16,665 921 Settlement of brokerage margin account 29 (7,602 ) — Payment of deferred consideration 29 (197,510 ) (200,000 ) Repayment of long-term debt 29 (139,913 ) (46,353 ) Transaction costs on repricing of long-term debt 29 (4,719 ) — Interest paid (124,627 ) (131,346 ) Gain on settlement of derivative 13,904 — Net cash outflows from financing activities (443,802 ) (375,586 ) Investing activities Additions in deferred development costs (23,212 ) (20,961 ) Purchase of property and equipment (10,997 ) (6,806 ) Acquired intangible assets (1,893 ) (7,669 ) Sale (purchase) of investments 7 88,760 (5,722 ) Cash movement (into) from restricted cash advances and collateral (1,298 ) 66,969 Settlement of minimum revenue guarantee (9,311 ) (16,070 ) Settlement of promissory note 8,084 — Net sale of investments utilizing customer deposits 117,106 22,679 Acquisition of further interests in subsidiary (6,516 ) (3,549 ) Investment in associate (2,000 ) — Proceeds on disposal of interest in associate classified as held for sale 16,127 — Net cash inflows from investing activities 174,850 28,871 Increase in cash and cash equivalents 225,648 3,221 Cash and cash equivalents – beginning of period 267,684 274,359 Unrealized foreign exchange difference on cash and cash equivalents 16,991 (9,896 ) Cash and cash equivalents - end of period 510,323 267,684 See accompanying notes.

12
NOTES TO THE CONSOLIDATED FINANCIAL STATEMENTS 1. NATURE OF BUSINESS
The Stars Group Inc. (“The Stars Group” or the “Corporation”), is a leading provider of technology-based products and services in the global gaming and interactive entertainment industries. As at December 31, 2017, The Stars Group had two major lines of operations within its gaming business, real-money online poker (“Poker”) and real-money online casino and sportsbook (“Casino & Sportsbook”). As it relates to these two business lines, online revenues include revenues generated through the Corporation’s real-money online, mobile and desktop client platforms.
Through Stars Interactive Holdings (IOM) Limited and its subsidiaries and affiliates (collectively, “Stars Interactive Group”), The Stars Group’s gaming business operates globally and conducts its principal activities from its headquarters in the Isle of Man. Through its Stars Interactive Group division, the Corporation ultimately owns and operates gaming and related interactive entertainment businesses, which it offers under several owned brands including, among others, PokerStars, PokerStars Casino, BetStars, Full Tilt, and the PokerStars Players No Limit Hold’em Championship, European Poker Tour, PokerStars Caribbean Adventure, Latin American Poker Tour, Asia Pacific Poker Tour, PokerStars Festival, and PokerStars MEGASTACK live poker tour and event brands.
The Stars Group was incorporated on January 30, 2004 under the Companies Act (Quebec) and continued under the Business Corporations Act (Ontario) on August 1, 2017. The registered head office is located at 200 Bay Street, South Tower, Suite 3205, Toronto, Ontario, Canada, M5J 2J3 and its common shares (“Common Shares”) are listed on the Toronto Stock Exchange (the “TSX”) under the symbol “TSGI”, and the Nasdaq Global Select Market (“Nasdaq”) under the symbol “TSG”. 2. SUMMARY OF SIGNIFICANT ACCOUNTING POLICIES
Basis of Accounting
The Corporation’s consolidated financial statements have been prepared in accordance with International Financial Reporting Standards (“IFRS”) as issued by the International Accounting Standards Board (“IASB”).
The consolidated financial statements of the Corporation have been prepared on the historical cost basis, except derivative financial instruments and financial instruments at fair value through profit or loss which are each measured at fair value.
Unless otherwise indicated, all references to a specific “note” refer to these notes to the Corporation’s consolidated financial statements.
Going Concern
The Board of Directors of the Corporation (the “Board”) have, at the time of approving the consolidated financial statements, a reasonable expectation that the Corporation has adequate resources to continue in operational existence for the foreseeable future. As such, the Corporation continues to adopt the going concern basis of accounting in preparing the consolidated financial statements.
Principles of Consolidation
A subsidiary is an entity controlled by the Corporation. As such, the Corporation is exposed, or has rights, to variable returns from its involvement with such entity and has the ability to affect those returns through its current ability to direct such entity’s relevant activities (i.e., control over the entity).
The existence and effect of substantive voting rights that the Corporation potentially has the practical ability to exercise (i.e., substantive rights) are considered when assessing whether the Corporation controls another entity.
The Corporation’s consolidated financial statements include the accounts of the Corporation and its subsidiaries. Upon consolidation, all inter-entity transactions and balances have been eliminated.
Non-controlling interests in subsidiaries are identified separately from the Corporation’s equity therein. Those non-controlling interests that are present ownership interests entitling their holders to a proportionate share of net assets upon liquidation may initially be measured at fair value or at the non-controlling interests’ proportionate share of the fair value of the subsidiary’s identifiable net assets. The choice of measurement is made on an acquisition-by-acquisition basis. Other non-controlling interests are initially measured at fair value. Subsequent to acquisition, the carrying amount of non-controlling interests is the amount of those interests at

13
initial recognition plus the non-controlling interests’ share of subsequent changes in equity. “Total comprehensive income” is attributed to non-controlling interests even if this results in the non-controlling interests having a deficit balance.
Upon the loss of control of a subsidiary, the Corporation’s profit or loss on disposal is calculated as the difference between (i) the fair value of the consideration received and of any investment retained in the former subsidiary and (ii) the previous carrying amount of the assets (including any goodwill) and liabilities of the subsidiary and any non-controlling interests.
Revenue Recognition
Gaming revenue
Revenue from the gaming business consists primarily of Poker and Casino & Sportsbook revenue and is recognized when it is probable that the economic benefits will flow to the Corporation and the amount of revenue can be reliably measured. Revenue is recognized in the accounting periods in which the transactions occurred after deduction of certain offsets, such as promotional bonuses and rewards granted to customers through the Stars Rewards cross vertical loyalty program, and is measured at the fair value of the consideration received or receivable.
Poker revenue represents primarily the commission charged at the conclusion of each poker hand in cash games (i.e., rake) and entry fees for participation in poker tournaments, and is net of certain promotional expenses. In poker tournaments, entry fee revenue is recognized when the tournament has concluded. Revenues are presented gross of gaming duties, which are presented within expenses.
Casino revenue represents primarily the difference between the amounts of bets placed by the customer less amounts won (i.e., net house win) and is net of certain promotional expenses. Casino revenues are presented gross of gaming duties, which are presented within expenses.
Sportsbook revenue represents primarily bets placed less payouts to customers and is net of certain promotional expenses. Open betting positions are carried at fair value and gains and losses arising on these positions are recognized in revenue. Sportsbook revenues are presented gross of gaming duties, which are presented within expenses.
The gaming business operates loyalty programs for its customers that award customer rewards based on a number of factors, including volume of play, player impact on the overall ecosystem, whether the player is a net withdrawing versus net depositing player, and product and game selection. The value of customer rewards is estimated with reference to the redemption value of the applicable reward through the Corporation’s product offerings, including in an online store operated by the Corporation and accessible through such product offerings, and the probability of use of such rewards by customers. In accordance with International Financial Reporting Interpretations Committee 13, Customer loyalty programmes, the fair value attributed to the awarded customer reward is deferred as a liability and recognized as either a customer deposit or offset against the cost of merchandise bought in the online store upon redemption of the reward.
Revenue from conversion margins
Revenue from conversion margins is the revenue earned on the processing of real-money deposits and cash outs in specified currencies. Revenue from customer cross currency deposits and withdrawals is recognized when the transaction is complete. Revenue is recognized with reference to the underlying arrangement and agreement with the players.
Income from player funds
A portion of customer deposits is held as current investments. Any realized income on these current investments is recognized as income.
Other income
Play-money gaming revenue
Customers can participate in online poker tournaments and social casino games using play-money, or virtual currency. Customers can purchase additional play-money chips online to participate in the poker tournaments and social casino games. The revenue is recognized when the customer has purchased such chips as all risks and rewards have been transferred to the customer. Once a customer has purchased such chips they are non-refundable and non-cancellable.

14
Leases
Leases are classified as finance leases whenever the terms of the lease transfer substantially all the risks and rewards of ownership to the lessee. All other leases are classified as operating leases. The Stars Group considers all its leases to be operating leases.
The group as lessor
Rental income from operating leases is recognized on a straight-line basis over the term of the relevant lease. Initial direct costs incurred in negotiating and arranging an operating lease are added to the carrying amount of the leased asset and recognized on a straight-line basis over the lease term.
The group as lessee
Rents payable under operating leases are recognized as an expense on a straight-line basis over the term of the relevant lease except where another more systematic basis is more representative of the time pattern in which economic benefits from the leased asset are consumed. Contingent rentals arising under operating leases are recognized as an expense in the period in which they are incurred.
In the event that lease incentives are received to enter into operating leases, such incentives are recognized as a liability. The aggregate benefit of any such incentive is recognized as a reduction of rental expense on a straight-line basis over the lease term, except where another systematic basis is more representative of the time pattern in which economic benefits from the leased asset are consumed.
Translation of Foreign Operations and Foreign Currency Transactions
Functional and presentation currency
IFRS requires entities to consider primary and secondary indicators when determining functional currency. Primary indicators are closely linked to the primary economic environment in which the entity operates and are given more weight. Secondary indicators provide supporting evidence to determine an entity’s functional currency. Once the functional currency of an entity is determined, it should be used consistently, unless significant changes in economic factors, events and conditions indicate that the functional currency has changed.
A change in functional currency is accounted for prospectively from the date of the change by translating all items into the new functional currency using the exchange rate at the date of the change.
Based on an analysis of the primary and secondary indicators, the functional currency of each of the Corporation and its subsidiaries have been determined. The Corporation’s consolidated financial statements are presented in U.S. dollars.
Transactions and balances
Foreign currency transactions are translated into the applicable functional currency using the exchange rates prevailing on the dates of the transactions or valuation where items are re-measured. Foreign exchange gains and losses resulting from the settlement of such transactions and from the translation at year-end exchange rates of monetary assets and liabilities denominated in foreign currencies are recognized within expenses.
Group companies
The results and financial position of the Corporation’s subsidiaries that have a functional currency different from the Corporation’s presentation currency are translated into the presentation currency as follows:
(i) assets and liabilities for each statement of financial position presented are translated at the closing exchange rate on the date of that statement of financial position;
(ii) income and expenses for each statement of net earnings (loss) and statement of other comprehensive income are translated at the rates of exchange prevailing on the dates of the transactions; and
(iii) all resulting exchange rate differences are recognized in other comprehensive income (loss) and are transferred to net earnings (loss) as part of gain (loss) on sale of subsidiaries.
15
The following foreign currencies are referred to herein: Currency Symbol Currency Description USD, USD $, $ United States Dollar CDN, CDN $ Canadian Dollar EUR, € European Euro GBP Great Britain Pound Sterling
Business Combination
Business combinations are accounted for using the acquisition method. Under this method, the identifiable assets acquired and liabilities assumed, including contingent liabilities, are recognized, regardless of whether they have been previously recognized in the acquiree’s financial statements prior to the acquisition. On initial recognition, the assets and liabilities of the acquired entity are included in the consolidated statements of financial position at their respective fair values. Goodwill is recorded based on the excess of the fair value of the consideration transferred over the fair value of the Corporation’s interest in the acquiree’s net identifiable assets on the date of the acquisition. Any excess of the identifiable net assets over the consideration transferred is immediately recognized in the consolidated statements of earnings.
The consideration transferred by the Corporation to acquire control of an entity is calculated as the sum of the acquisition-date fair values of the assets transferred, liabilities incurred and equity interests issued by the Corporation, including the fair value of all the assets and liabilities resulting from a deferred payment arrangement. Acquisition-related costs are expensed as incurred.
Operating Segments
For the year ended December 31, 2017, the Corporation had one reportable and operating segment, gaming, which for the purposes of the financial statements is further divided into the Poker and Casino & Sportsbook product lines. All products are played on one gaming platform using one wallet.
The Stars Group’s gaming business, which it operates primarily through its two business lines, Poker and Casino & Sportsbook, was acquired through the Corporation’s acquisition of Stars Interactive Group on August 1, 2014 (the “Stars Interactive Group Acquisition”). The Corporation’s segments are organized around the markets they serve and are reported in a manner consistent with the internal reporting provided to the Corporation’s key management. An operating segment is a component of the Corporation that engages in business activities from which it may earn revenues and incur expenses, including revenues and expenses relating to transactions with other components of the Corporation.
The Corporation presents separate information on an operating segment when any of the following criteria are met:
(i) reported revenue of the segment is 10% or more of the consolidated revenue; or (ii) the absolute amount of reported profit or loss of the segment is 10% or more of consolidated profit or loss; or (iii) assets of the segment are 10% or more of consolidated assets.
Financial Instruments
Financial assets
Financial assets are initially recognized at fair value and are classified as one of the following: “fair value through profit or loss”; “available-for-sale”; or “loans and receivables”. The classification depends on the purpose for which the financial instruments were acquired and their respective characteristics. Except in very limited circumstances, the classification may not be changed subsequent to initial recognition.
Fair value through profit or loss
Financial assets at fair value through profit or loss are financial assets held-for-trading and derivatives. A financial asset is classified in this category if acquired principally for the purpose of selling in the short-term or as otherwise determined by management to be in this category. Financial assets classified at fair value through profit or loss are measured at fair value with the realized and unrealized changes in fair value recognized each reporting period in the consolidated statements of earnings. The Corporation has current investments and derivatives classified as fair value through profit or loss.

16
Available-for-sale
Available-for-sale assets are non-derivative financial assets that are either designated in this category or not classified in any of the other categories. Such assets are included in other non-current financial assets unless management intends to dispose of them within 12 months of the date of the consolidated statements of financial position. Financial assets classified as available-for-sale are carried at fair value with changes in fair value recorded in the consolidated statements of comprehensive income. Interest on available-for-sale assets is calculated using the effective interest rate method and is recognized in the consolidated statements of earnings. When a decline in fair value is determined to be significant and prolonged, the cumulative loss included in accumulated other comprehensive income (loss) is removed as such and then recognized in the consolidated statements of earnings. Gains and losses realized on the disposal of available-for-sale assets are recognized in the consolidated statements of earnings. The Corporation has current and non-current investments classified as available-for-sale.
Loans and receivables
Loans and receivables are non-derivative financial assets with fixed or determinable payments but which are not quoted in an active market. All such assets with maturities equal to or less than 12 months from the date of the consolidated statements of financial position are classified as current assets, while those with maturities greater than 12 months from such date are classified as non-current assets. Financial instruments classified as loans and receivables are initially recorded at fair value and subsequently measured at amortized cost using the effective interest method. Cash, restricted cash, accounts receivable and promissory notes are classified as loans and receivables.
Cash and cash equivalents
Cash and cash equivalents comprise cash in hand, bank deposits and other short-term highly liquid investments with maturities of three months or less, which are generally used by the Corporation to meet short-term liquidity requirements.
Impairment
At the end of each reporting period, the Corporation assesses whether a financial asset or a group of financial assets, other than those classified as fair value through profit or loss, is impaired. If there is objective evidence that impairment exists, the loss is recognized in the consolidated statements of earnings. The impairment loss is measured as the difference between the acquisition cost and the current fair value, less any impairment loss on that financial asset previously recognized in the consolidated statements of earnings.
Financial liabilities
Financial liabilities are classified as either financial liabilities “at fair value through profit or loss” or “other financial liabilities”.
At fair value through profit or loss
Financial liabilities are classified as “at fair value through profit or loss” when the financial liability is designated as such.
A financial liability is designated as “at fair value through profit or loss” upon initial recognition if:
• such designation eliminates or significantly reduces a measurement or recognition inconsistency that would otherwise arise; or
• the financial liability is managed and its performance is evaluated on a fair value basis.
Financial liabilities “at fair value through profit or loss”, such as certain derivatives, are stated at fair value, with any gains or losses arising on remeasurement recognized in the consolidated statements of earnings.
Other financial liabilities
Other financial liabilities, including borrowings, are initially measured at fair value, net of transaction costs. Other financial liabilities are subsequently measured at amortized cost using the effective interest method.
The effective interest method is a method of calculating the amortized cost of a financial liability and of allocating interest expense over the relevant period. The effective interest rate is the rate that exactly discounts estimated future cash payments through the expected life of the financial liability (or a shorter period where appropriate) to the net carrying amount on initial recognition.

17
Debt modification
From time to time, the Corporation pursues amendments to its credit agreements based on prevailing market conditions. Such amendments, when completed, are considered by the Corporation to be debt modifications. The accounting treatment of a debt modification depends on whether the modified terms are substantially different than the previous terms. Terms of an amended debt agreement are considered to be substantially different when the discounted present value of the cash flows under the new terms discounted using the original effective interest rate, is at least ten percent different from the discounted present value of the remaining cash flows of the original debt. If the modification is not substantially different, it will be considered as a modification with any costs or fees incurred adjusting the carrying amount of the liability and amortized over the remaining term of the liability. If the modification is substantially different then the transaction is accounted for as an extinguishment of the old debt instrument with an adjustment to the carrying amount of the liability being recorded in the consolidated statements of earnings immediately.
Transaction costs
Transaction costs that are directly attributable to the acquisition or issuance of financial assets and financial liabilities (other than financial assets and financial liabilities that are classified as through profit or loss) are added to or deducted from, as applicable, the fair value of the financial instrument on initial recognition. These costs are expensed to financial expenses on the consolidated statements of earnings over the term of the related financial asset or financial liability using the effective interest method. When a debt facility is retired by the Corporation, any remaining balance of related debt transaction costs is expensed to financial expenses on the consolidated statements of earnings in the period that the debt facility is retired. Transaction costs related to financial instruments at fair value through profit or loss are expensed when incurred.
Compound financial instruments
Debt and equity instruments issued by the Corporation and its subsidiaries are classified as either financial liabilities or as equity in accordance with the substance of the contractual arrangements and the definitions of a financial liability and an equity instrument. The Corporation has issued, and in the future may issue, compound financial instruments comprising both financial liability and equity components. The financial liability component is initially recognized at the fair value of a similar liability. The proceeds are then allocated between the financial liability and the equity components using the residual method. Any directly attributable transaction costs are allocated to the financial liability and equity components in proportion to their initial carrying amounts. The financial liability component of a compound financial instrument is subsequently re-measured at amortized cost using the effective interest method. The equity components are not re-measured subsequent to their initial recognition.
Embedded derivatives
Derivatives may be embedded in other financial and non-financial instruments (i.e., the host instrument). Embedded derivatives are treated as separate derivatives when their economic characteristics and risks are not closely related to those of the host instrument, the terms of the embedded derivative are the same as those of a stand-alone derivative and the combined instrument (i.e., the embedded derivative plus the host instrument) is not held-for-trading or designated at fair value. These embedded derivatives are measured at fair value with subsequent changes recognized in the consolidated statements of earnings.
Derivatives
The Corporation uses derivative instruments for risk management purposes. The Corporation does not use derivative instruments for speculative trading purposes. All derivatives are recorded at fair value on the consolidated statements of financial position. The resulting gain or loss is immediately recognized in the consolidated statements of earnings unless the derivative is designated and effective as a hedging instrument, in which event the timing of the recognition in the consolidated statements of earnings depends on the nature of the hedge relationship.
Derivatives are measured at fair value using pricing and valuation models whenever possible, including market-based inputs to models, broker or dealer quotations or alternative pricing sources. To qualify for hedge accounting, the relationship between the hedged item and the hedging instrument must meet several strict conditions on documentation, probability of occurrence, hedge effectiveness and reliability of measurement. If these conditions are not met, then the relationship does not qualify for hedge accounting treatment and both the hedged item and the hedging instrument are reported independently, as if there was no hedging relationship.
Cash flow hedges
The Corporation uses derivatives for cash flow hedges. The effective portion of the change in fair value of the hedging instrument is recorded in other comprehensive income and accumulated under the heading derivative reserve, while the ineffective portion is

18
recognized immediately in the consolidated statements of earnings. Gains and losses on cash flow hedges accumulated in other comprehensive income are reclassified to the consolidated statements of earnings in the same period the hedged item affects the consolidated statements of earnings. If the forecast transaction is no longer expected to occur, the hedge no longer meets the criteria for hedge accounting, the hedging instrument expires or is sold, terminated or exercised, or the designation is revoked, the hedge accounting is discontinued prospectively. If the forecast transaction is no longer expected to occur, then the amount accumulated in equity is reclassified to the consolidated statements of earnings.
Net investment hedges
Hedges of net investments in foreign operations are accounted for similarly to cash flow hedges. Any gain or loss on the hedging item relating to the effective portion of the hedge is recognized in other comprehensive income and accumulated under the heading cumulative translation adjustments reserve. The gain or loss relating to the ineffective portion is recognized immediately in the consolidated statements of earnings. Gains and losses accumulated in other comprehensive income are reclassified to the consolidated statements of earnings when the foreign operation is partially disposed of or sold.
Determination of fair value
Fair value is the price that would be received to sell an asset or paid to transfer a liability in an orderly transaction between market participants at the applicable measurement date. When measuring the fair value of an asset or a liability, the Corporation uses market observable data to the extent possible. If the fair value of an asset or a liability is not directly observable, it is estimated by the Corporation using valuation techniques that maximize the use of relevant observable inputs and minimize the use of unobservable inputs (e.g., by the use of the market comparable approach that reflects recent transaction prices for similar items, discounted cash flow analysis, or option pricing models refined to reflect the Corporation’s specific circumstances). Inputs used are consistent with the characteristics of the asset or liability that market participants would take into account.
For the Corporation’s financial instruments which are recognized in the consolidated statements of financial position at fair value, the fair value measurements are categorized based on the lowest level input that is significant to the fair value measurement in its entirety and the degree to which the inputs are observable. The significance levels are classified as follows in the fair value hierarchy:
Level 1 – Quoted prices (unadjusted) in active markets for identical assets or liabilities;
Level 2 – Inputs other than quoted prices included in Level 1 that are observable for the asset or liability, either directly or indirectly; and
Level 3 – Inputs for the asset or liability that are not based on observable market data.
Transfers between levels of the fair value hierarchy are recognized by the Corporation at the end of the reporting period during which the transfer occurred.
Prepaid Expenses and Deposits
Prepaid expenses and deposits consist of amounts paid in advance or deposits made for which the Corporation will receive goods or services.
Property and Equipment
Property and equipment which have finite lives are recorded at cost less accumulated depreciation and impairment losses. Depreciation is expensed from the month the particular asset is available for use, over the estimated useful life of such asset at the following rates, which in each case are intended to reduce the carrying value of the asset to the estimated residual value: Furniture and fixtures Straight-line 5 years Computer equipment Straight-line 5 years Building Straight-line 25 years
19
Intangible Assets
Intangible assets which have finite lives are recorded at cost less accumulated amortization and impairment losses. Amortization is expensed from the month the particular asset is available for use, over the estimated useful life of such asset at the following rates, which in each case are intended to reduce the carrying value of the asset to the estimated residual value: Software technology Straight-line 5 years Software technology (Defensive intangible asset)
Straight-line 2 years
Customer relationships Straight-line 15 years Brands N/A Indefinite useful life The amortization method, useful life and residual values are assessed annually and the assets are tested for impairment, whenever events or changes in circumstances indicate that the carrying amount may not be recoverable.
Upon retirement or disposal, the cost of the asset disposed of and the related accumulated amortization are removed from the consolidated statement of financial position and any gain or loss is reflected in the consolidated statements of earnings. Expenditures for repairs and maintenance are expensed as incurred.
The Corporation determined that its owned brands have indefinite useful lives as they have no foreseeable limit to the period over which such assets are expected to contribute to the Corporation’s cash flows. In addition, the Corporation expects to continue to support its brands with ongoing marketing efforts.
The Corporation tests its owned brands for impairment at least annually, or more frequently if circumstances such as significant declines in expected sales, net earnings or cash flows indicate that the cash-generating units (“CGUs”) to which such brands relate might be impaired.
Goodwill
Goodwill represents the excess of the purchase price over the fair value of the identifiable net assets acquired in a business acquisition. After initial recognition, goodwill is measured at cost less any accumulated impairment losses.
Goodwill is tested for impairment at least annually, or more frequently if circumstances such as significant declines in expected sales, net earnings or cash flows indicate that that the CGUs to which goodwill is allocated might be impaired.
Research and Development
Research and development costs are expensed except in cases where development costs meet certain identifiable criteria for deferral. Deferred development costs, which have probable future economic benefits, can be clearly defined and measured, and are incurred for the development of new products or technologies, are capitalized. These development costs, net of related research and development investment tax credits, are not amortized until the products or technologies are commercialized or when the asset is available for use, at which time, they are amortized over the estimated life of the commercial production of such products or technologies.
The amortization method and the life of the commercial production are assessed annually and the assets are tested for impairment whenever an indication exists that an asset might be impaired.
The Corporation claims research and development investment tax credits as a result of incurring scientific research and experimental development expenditures. Research and development investment tax credits are recognized when the related expenditures are incurred and there is reasonable assurance of their realization. Investment tax credits are accounted for by the cost reduction method whereby the amounts of tax credits are applied as a reduction of the expense or deferred development costs.
Investments
Investments are stated at the lower of cost and fair market value. Cost is determined on a weighted average basis at a consolidated level.

20
Investments in Associates
An associate is an entity over which the Corporation has significant influence and that is neither a subsidiary nor an interest in a joint venture. Significant influence is the power to participate in the financial and operating policy decisions of the associate but is not the control or joint control over those policy decisions.
The results and assets and liabilities of associates are incorporated in these consolidated financial statements using the equity method of accounting, except when the investment is classified as held for sale, in which case it is accounted for in accordance with IFRS 5 Non-current Assets Held for Sale and Discontinued Operations.
Under the equity method, an investment in an associate is initially recognized in the consolidated statements of financial position at cost and adjusted thereafter to recognize the Corporation’s share of the profit or loss and other comprehensive income of the associate. When the Corporation's share of losses of an associate exceeds the Corporation's interest in that associate (which includes any long-term interests that, in substance, form part of the Corporation's net investment in the associate), the Corporation discontinues recognizing its share of further losses. Additional losses are recognized only to the extent that the Corporation has incurred legal or constructive obligations or made payments on behalf of the associate.
An investment in an associate is accounted for using the equity method from the date on which the investee becomes an associate. On acquisition of the investment in an associate, any excess of the cost of the investment over the Corporation's share of the net fair value of the identifiable assets and liabilities of the associate is recognized as goodwill, which is included within the carrying amount of the investment. Any excess of the Corporation's share of the net fair value of the identifiable assets and liabilities over the cost of the investment, after reassessment, is recognized immediately in the consolidated statements of earnings in the period in which the investment is acquired.
The requirements of International Accounting Standard (“IAS”) 36, Impairment of Assets are applied to determine whether it is necessary to recognize any impairment loss with respect to the Corporation’s investment in an associate. When necessary, the entire carrying amount of the investment (including goodwill) is tested for impairment in accordance with IAS 36, Impairment of Assets as a single asset by comparing its recoverable amount (higher of value in use and fair value less costs of disposal) with its carrying amount, any impairment loss recognized forms part of the carrying amount of the investment. Any reversal of that impairment loss is recognized in accordance with IAS 36, Impairment of Assets to the extent that the recoverable amount of the investment subsequently increases. Assets Held For Sale Non-current assets and disposal groups are classified as held for sale if their carrying amount will be recovered principally through a sale transaction rather than through continuing use. This condition is regarded as met only when the asset (or disposal group) is available for immediate sale in its present condition subject only to terms that are usual and customary for sales of such asset (or disposal group) and its sale is highly probable. Management must be committed to the sale, which should be expected to qualify for recognition as a completed sale within one year from the date of classification. When the Corporation is committed to a sale plan involving disposal of an investment, or a portion of an investment, in an associate or joint venture, the investment or the portion of the investment that will be disposed of is classified as held for sale when the criteria described above are met, and the Corporation discontinues the use of the equity method in relation to the portion that is classified as held for sale. Any retained portion of an investment in an associate or a joint venture that has not been classified as held for sale continues to be accounted for using the equity method. The Corporation discontinues the use of the equity method at the time of disposal when the disposal results in the Corporation losing significant influence over the associate or joint venture. After the disposal takes place, the Corporation accounts for any retained interest in the associate or joint venture in accordance with IAS 39, Financial Instruments: Recognition and Measurement unless the retained interest continues to be an associate or a joint venture, in which case the Corporation uses the equity method. Non-current assets (or disposal groups) classified as held for sale are measured at the lower of their carrying amount and fair value less costs to sell.
Impairment of Non-Current Assets
Management assesses, at the end of the reporting period, whether there is an indication that an asset may be impaired. If any indication exists, or when annual impairment testing for an asset is required, the Corporation estimates the asset’s recoverable amount. An asset’s or CGU’s recoverable amount is the higher of the asset’s or CGU’s fair value less costs of disposal and its value in use. When the

21
carrying amount of an asset or CGU exceeds its recoverable amount, the asset is considered impaired and is written down to its recoverable amount.
In assessing value in use, the estimated future cash flows are discounted to their present value using a pre-tax discount rate that reflects current market assessments of the time value of money and the risks specific to the asset. In determining fair value less costs of disposal, recent market transactions are taken into account. If no such transactions can be identified, an appropriate valuation model is used. These calculations are corroborated by valuation multiples, quoted share prices for publicly traded companies or other available fair value indicators.
The Corporation bases its impairment calculation on detailed budgets and forecast calculations, which are prepared for the Corporation’s assets or CGU to which such assets are allocated. These budgets and forecast calculations generally cover a period of three to five years. A long-term growth rate is calculated and applied to project future cash flows after the final year included in the forecast.
Impairment losses of continuing operations are recognized in the consolidated statements of earnings in expense categories consistent with the function of the impaired asset. An impairment loss recognized for goodwill may not be reversed. At the end of the reporting period, the Corporation assesses if there is an indication that impairment losses recognized in previous periods for other assets have decreased or no longer exist. Where an impairment loss is subsequently reversed, the carrying amount of the asset or CGU is increased to the revised estimate of its recoverable amount provided that the increased carrying amount does not exceed the carrying amount that would have been determined had no impairment loss been recognized in prior years. A reversal of an impairment loss is recognized immediately in profit or loss, unless the relevant asset is carried at a revalued amount, in which case the reversal of the impairment loss is treated as a revaluation increase.
Taxation
Income tax expense represents the sum of current and deferred taxes. Current and deferred taxes are recognized in the consolidated statements of earnings, except to the extent they relate to items recognized in the consolidated statements of comprehensive income or directly in the statements of changes in equity.
Current tax
Current tax payable is based on taxable income for the year. Taxable income differs from earnings as reported in the consolidated statements of earnings because of items of income or expense that are taxable or deductible in other years and items that are never taxable or deductible. The Corporation’s liability for current tax is calculated using tax rates that have been enacted or substantively enacted by the end of the particular reporting period.
Deferred tax
Deferred tax is recognized on temporary differences between the carrying amounts of assets and liabilities in the Corporation’s consolidated financial statements and the corresponding tax bases used in the computation of taxable income. Deferred tax liabilities are generally recognized for all taxable temporary differences. Deferred tax assets are recognized for all deductible temporary differences to the extent that it is probable that taxable income will be available against which those deductible temporary differences can be utilized. Such deferred tax assets and liabilities are not recognized if the temporary difference arises from the initial recognition of goodwill or from the initial recognition (other than in a business combination) of other assets and liabilities in a transaction that affects neither the taxable income nor the accounting earnings.
Deferred tax liabilities are recognized for taxable temporary differences associated with investments and interests in subsidiaries and associates, except where the Corporation is able to control the reversal of the temporary difference and it is probable that the temporary difference will not reverse in the foreseeable future. Deferred tax assets arising from deductible temporary differences associated with such investments and interests are only recognized to the extent that it is probable that there will be sufficient taxable income against which to utilize the benefits of the temporary differences and they are expected to reverse in the foreseeable future.
The carrying amount of deferred tax assets is reviewed at the end of each reporting period and reduced to the extent that it is no longer probable that sufficient taxable income will be available to allow all or part of any such asset to be recovered.
Deferred tax assets and liabilities are measured at the tax rates that are expected to apply in the period in which the liability is settled or the asset is realized, in each case based on tax rates and tax laws that have been enacted or substantively enacted by the end of the reporting period. The measurement of deferred tax liabilities and assets reflects the tax consequences that would follow from the

22
manner in which the Corporation expects, at the end of the particular reporting period, to recover or settle the carrying amount of its assets and liabilities.
Deferred tax assets and liabilities are offset when there is a legally enforceable right to set off current tax assets against current tax liabilities and when they relate to income taxes levied by the same taxation authority and the Corporation intends to settle its current tax assets and liabilities on a net basis. Deferred tax assets and liabilities are not discounted. Current and deferred tax are recognized in the consolidated statements of earnings, except when they relate to items that are recognized in other comprehensive income or directly in equity, in which case, the current and deferred tax are also recognized in other comprehensive income or directly in equity, respectively. Where current tax or deferred tax arises from the initial accounting for a business combination, the tax effect is included in the accounting for the business combination.
Stock-Based Compensation
The Corporation maintains an equity-based long-term incentive award program to align interests of its management team with those of its Shareholders by focusing the management team on long-term objectives over a multi-year period, with the value of the award fluctuating based on stock price appreciation. The Corporation has two equity-based award plans and accounts for grants under these plans in accordance with the fair value-based method of accounting for stock-based compensation for the applicable period. The Corporation currently makes its equity grants under its Equity Incentive Plan dated June 22, 2015 (the “2015 Equity Incentive Plan”), which provides for grants of stock options (“Options”), Restricted Share Units (“RSU”), Deferred Share Units (“DSU”), Performance Share Units (“PSU”), Restricted Shares (“RS”), and other Common Share-based awards as the Board may determine. Prior to the Corporation’s 2015 annual shareholder meeting (the “2015 Annual Meeting”), equity-based awards were granted solely under the Corporation’s 2010 stock option plan, as amended from time to time (the “2010 Stock Option Plan” and together with the 2015 Equity Incentive Plan, the “Plans”) and consisted only of Options. The Corporation no longer grants Options under the 2010 Stock Option Plan, but it remains in effect only to govern the terms of outstanding Options granted prior to the date of the 2015 Annual Meeting.
Stock Options
Compensation expense for equity-settled stock options awarded to participants under the plans is measured at the fair value at the grant date using the Black-Scholes valuation model and is recognized using the graded vesting method over the vesting period of the options granted. Stock-based compensation expense recognized is adjusted to reflect the number of options that has been estimated by management for which conditions attaching to service will be fulfilled as of the grant date until the vesting date so that the recognized expense corresponds to the options that have vested. The stock-based compensation expense credit is attributed to reserves when the expense is recognized in the consolidated statements of earnings. When options are exercised, any consideration received from participants as well as the related compensation cost recorded as reserves are credited to share capital.
Non-employee equity-settled share-based payments are measured at the fair value of the goods and services received, except where that fair value cannot be estimated reliably. If the fair value cannot be measured reliably, non-employee equity-settled share-based payments are measured at the fair value of the equity instrument granted as measured at the date the entity obtains the goods or the counterparty renders the service. The Corporation subsequently re-measures non-employee equity-settled share-based payments at each vesting period and settlement date with any changes in fair value recognized in the consolidated statements of earnings. Stock-based compensation expense is recognized over the contract life of the options or the option settlement date, whichever is earlier.
Other Equity-Based Awards Under the 2015 Equity Incentive Plan
The Corporation’s equity-based long-term incentive award program historically consisted solely of stock option grants on an irregular, discretionary schedule. Effective for 2017, the Corporation replaced the stock option component of the long-term incentive program for its management team with a regular, annual grant program to be comprised of 67% PSUs and 33% RSUs. The RSUs and the PSUs are subject to service, market and non-market vesting conditions and no dividends are expected to be paid during the vesting period. Therefore, the fair market value of an RSU and PSU is equal to the market price of the underlying Common Share at the grant date. The Corporation also offers DSUs, RSUs and RS for members of its Board of Directors, in addition to the cash retainers paid.
On the grant date, the fair value of the awards is measured using the closing TSX stock price, or the closing Nasdaq stock price if the Common Shares are not traded on the TSX. Share-based compensation expense is recognized over the vesting period in the consolidated statements of earnings at the end of every reporting period with a corresponding increase to reserves. Once the awards are exercised and transferred to the counterparty, the related amount recorded as reserves is credited to share capital.

23
Restricted Share Units An RSU is a unit equivalent in value to a Common Share which entitles the holder to receive Common Shares after a specified vesting period determined by the Plan Administrator of the 2015 Equity Incentive Plan (the “Plan Administrator”), in its sole discretion. Upon settlement, holders will receive one fully paid Common Share in respect of each vested RSU. The RSUs vest in equal annual installments over a four-year period (graded vesting method), generally subject to continued employment through each vesting date.
Performance Share Units A PSU is a unit equivalent in value to a Common Share which entitles the holder to receive Common Shares based on the achievement of performance goals established by the Plan Administrator, including in consultation with management, over a performance period. The PSUs vest on the third anniversary of the date of the grant (cliff vesting), and based on a weighted mix of revenue and Adjusted EBITDA targets of the Corporation for the applicable three-year performance period and subject to an additional total shareholder return condition (the “TSR Condition”) as well as the individual remaining employed by, or continuing to provide services to, the Corporation. The grantee is eligible for additional PSUs up to 50% of the PSUs granted on the grant date to the extent the TSR Condition and other performance conditions are met. The additional PSUs have a service, non-market and market (i.e., the TSR Condition) vesting conditions, all of which need to be satisfied to vest. The fair market value is based on a valuation to reflect the probability of the market condition to be met. The service and non-market condition, will not affect the fair value at grant date. Market conditions, such as the TSR Condition upon which vesting is conditioned, is considered when estimating the fair value of the equity instruments granted. Market conditions are reflected as an adjustment (discount) to the initial estimate of fair value at grant date of the instrument to be received and there is no true-up for differences between estimated and actual vesting due to market conditions.
Upon settlement, holders will receive fully paid Common Shares in proportion to the number of vested PSUs held and the level of performance achieved. Any unearned PSUs will be forfeited.
For the PSUs, the grant date for calculating the compensation expense is considered to occur only when the non-market conditions are determined and communicated to employees.
Deferred Share Units The Corporation offers DSU grants to the members of the Board. Upon settlement, holders will receive one fully paid Common Share in respect of each vested DSU. The Corporation recognizes services received in a share-based payment transaction as an expense over the requisite service period and recognizes a corresponding increase in equity as the services are received in an equity-settled share-based payment transaction. Vesting for the DSU grants begins on the accounting grant date and will vest over either a one-, two- or three-year period. The accounting grant date is the date on which the Corporation and the Directors have a shared understanding of all the terms and conditions of the arrangement. If the accounting grant date occurs after the service commencement date, then the Corporation estimates the grant-date fair value of the DSUs for the purpose of recognizing the expense from the service commencement date until the accounting grant date. All grants are subject to forfeiture if the director ceases to serve as a director prior to vesting and vested DSUs can only be settled at such time. DSU’s are only subject to service conditions and because no dividends are expected to be paid during the vesting period, the fair market value of a DSU is equal to the market price of the underlying Common Share at the grant date.
Restricted Shares
An RS is a fully paid Common Share that is subject to restrictions on transfer and a risk of forfeiture for a period of time, and which shall be held by the Corporation or its designee in escrow until such time as the restricted period lapses. The Plan Administrator shall have the authority to determine at the time of grant, the duration of the restricted period and other restrictions applicable to the restricted Common Shares. Except for the restrictions applicable to the restricted Common Shares, during the restricted period, the holder shall have all the rights and privileges of a holder of Common Shares as to the restricted Common Shares, including the right to vote.

24
Dividend Equivalents
RSUs, PSUs and DSUs may be credited with dividend equivalents in the form of additional RSUs, PSUs, DSUs and other share-based awards, as applicable. Dividend equivalents shall vest in proportion to the awards to which they relate. Such dividend equivalents shall be computed by dividing: (i) the amount obtained by multiplying the amount of the dividend declared and paid per Common Share by the number of RSUs, PSUs, DSUs or other share-based awards, as applicable, held by the participant on the record date for the payment of such dividend, by (ii) the highest closing price of the Common Shares on any stock exchange on which the Common Shares are then listed on the date of grant, at the close of the first business day immediately following the dividend record-date.
Provisions
Provisions represent liabilities of the Corporation for which the amount or timing of payment is uncertain. Provisions are recognized when the Corporation has a present legal or constructive obligation as a result of past events, it is probable that an outflow of resources will be required to settle the obligation, and the amount can be reliably estimated. Provisions are measured at the present value of the expected expenditures required to settle the obligation using a discount rate that reflects current market assessments of the time value of money and the risks specific to the obligation. The increase in provisions due to the passage of time is recognized in financial expenses on the consolidated statements of earnings.
Provision for jackpots
The Corporation offers progressive jackpot games. Each time a progressive jackpot game is played, a portion of the amount wagered by the player is contributed to the jackpot for that specific game or group of games. Once a jackpot is won, the progressive jackpot is reset with a predetermined base amount. The Corporation maintains a provision for the reset of each jackpot and the progressive element added as the jackpot game is played. The provision for jackpots at the reporting date is included in provisions. The Corporation believes that its provisions are sufficient to cover the full amount of any required payout.
Deferred consideration
The acquisition-date fair value of any deferred consideration is recognized as part of the consideration transferred by the Corporation in exchange for the acquiree. Changes in the fair value of deferred consideration that result from additional information obtained during the measurement period (i.e., a maximum of one year from the acquisition date) about facts and circumstances that existed at the acquisition date are adjusted retrospectively against goodwill. The Corporation estimates, based on expected future cash flows, the amount that would be required to settle the applicable obligation and recognizes the present value of the same.
Provision for minimum revenue guarantee
A provision for minimum revenue guarantee is recognized pursuant to an agreement with the vendor in connection with the terms of certain of the Corporation’s past divestitures. The Corporation estimates, based on expected future cash flows, the amount that would be required to settle the applicable obligation and recognizes the present value of the same.
Contingent liabilities
Contingent liabilities are not recognized in the consolidated statements of financial position but are reported in the notes. They may arise from uncertainty as to the existence of a liability or represent a liability in respect of which the amount cannot be reliably measured.
Critical Accounting Estimates and Judgments
The preparation of the Corporation’s consolidated financial statements in accordance with IFRS requires management to make estimates and assumptions that can have a significant effect on the reported amounts of assets and liabilities, disclosure of contingent assets and liabilities at the date of the consolidated financial statements, and the reported amounts of revenues and expenses during the reporting period.
Estimates and judgments are significant when:
• the outcome is highly uncertain at the time the estimates are made; or • different estimates or judgments could reasonably have been used that would have had a material impact on the
consolidated financial statements.

25
The consolidated financial statements include estimates based on currently available information and management’s judgment as to the outcome of future conditions and circumstances. Management uses historical experience, general economic conditions and trends, and assumptions regarding probable future outcomes as the basis for determining estimates.
Estimates and their underlying assumptions are reviewed on a regular basis and the effects of any changes are recognized immediately. Changes in the status of certain facts or circumstances could result in material changes to the estimates used in the preparation of the consolidated financial statements and actual results could differ from the estimates and assumptions.
Set forth below are descriptions of items that management believes require its most critical estimates and judgments.
Key Sources of Estimation Uncertainty
Goodwill impairment
Goodwill impairment exists when the carrying value of a CGU exceeds its recoverable amount. Management uses estimates in determining the value in use or fair value less costs of disposal of the CGUs to which goodwill has been allocated. The estimates include but are not limited to the control premium, the implied trading multiple, costs of disposal, expected cash flows, growth rates and discount rates. A change in future earnings or any other assumptions may have a material impact on the fair value of the CGU, and could result in an impairment loss. Refer to note 10 for further details.
Tax provision in respect of prior years
Determining the Corporation’s income tax and its provisions for income taxes involves a significant degree of estimation and judgement, particularly in respect of open tax returns relating to prior years where the liabilities remain to be agreed with the local tax authorities. Provisions for income taxes are recognized based on management’s best estimate of the outcome after taking into consideration all available evidence, and where appropriate, after taking external advice. The tax provision recorded in the Corporation’s 2017 consolidated financial statements in respect of prior years relate to intercompany trading arrangements entered into in the normal course of business. Due to the uncertainty associated with such tax items it is possible that at a future date, on resolution of the open tax matters, the final outcome may vary significantly and there is the potential for a material adjustment to the carrying amounts of the liability recorded as a result of this estimation and uncertainty.
Fair value measurement and valuation process
The Corporation measures certain financial assets and liabilities at fair value for financial reporting purposes (see note 28). Management has a review process which is designed to ensure that fair values are calculated in a consistent manner. The valuation techniques and inputs are reviewed by management to ensure consistency and any changes are analyzed and approved. Valuations for financial assets and liabilities are performed and reviewed on a quarterly basis, and are reviewed and approved by key management.
In estimating the fair value, management uses market observable data to the extent it is available. Where observable market data does not exist for non-derivative financial assets and liabilities, the Corporation internally calculates the fair value using valuation techniques that maximize the use of observable inputs. These inputs are reviewed and approved by management.
Deferred consideration
The Corporation has made and may make acquisitions which include deferred payments as part of the consideration for the acquiree. The Corporation re-evaluates the fair value of any deferred consideration, including an “earn out”, on its business acquisitions at the end of each reporting period. Significant estimates are required to determine the fair value of the deferred consideration. The Corporation considers the key inputs of the particular arrangement and market participant assumptions when developing the projected cash flows that are used to determine the fair value of the deferred consideration. This includes the need to estimate the likelihood and timing of achieving the relevant milestones of such deferred consideration or “earn out”. The Corporation exercises judgment when applying a probability assessment for each of the potential outcomes. In addition, the Corporation must consider the time value of money. In determining the discount rate applied to the estimated cash outflows, the Corporation considers the risks inherent to the payment of the particular deferred consideration, such as projection risks, credit risks and liquidity risks.

26
Judgments
Useful lives of long-lived assets
Judgment is used to estimate each component of an asset’s useful life and is based on an analysis of all pertinent factors including, but not limited to, the expected use of the asset and, in the case of an intangible asset, contractual provisions that enable the renewal or extension of the asset’s legal or contractual life without substantial cost, as well as renewal history. Incorrect estimates of useful lives could result in an increase or decrease in the annual amortization expense and future impairment charges.
Functional currency
The Corporation’s worldwide operations expose the Corporation to transactions denominated in a number of different currencies, which are required to be translated into one currency for consolidated financial statement reporting purposes. The Corporation’s foreign currency translation policy is designed to reflect the economic exposure of the Corporation’s operations to various currencies.
The Corporation’s foreign operations (including subsidiaries, joint ventures, associates and branches) based mainly outside Canada may have different functional currencies. The functional currency of an operation is the currency of the primary economic environment to which it is exposed. In order to determine the functional currency, management will first consider the currency that influences sales prices of the goods and services provided by the operations and the currency that influences the costs incurred by the operations. Then, if based on these two primary factors, the functional currency is not obvious, management will examine secondary factors such as the currency in which funds from financing are obtained, the currency in which cash receipts are retained and the levels of interactions with the parent company. In determining the functional currency of an operation, management uses its judgment to determine the functional currency that most faithfully represents the economic effects of the underlying transactions, events and conditions.
Investments in associates
Management assesses the relationship with investees to determine if the Corporation has control or significant influence over such investee. Management determines that it has control over an investee when it is exposed, or has rights, to variable returns from its investment in an entity and has the ability to affect those returns through its power over the investee.
When the Corporation does not have control over an investee but has the power to participate in the financial and operating policy decisions of the investee, management determines that it has significant influence over the investee.
Impairment of investments
The Corporation needs to use judgment when assessing whether the investments held are impaired. The Corporation determines whether the investment’s decline is significant or prolonged by analyzing the historical volatility of the investment as well as the period of time over which the investment value has been depressed. Generally, the Corporation will judge that a decrease of 25% in the value of the investment or a decline for a period of 12 months to be significant and prolonged respectively.
Contingent liabilities
The Corporation reviews outstanding legal cases following developments in legal proceedings at each balance sheet date, considering, among other things: the nature of the litigation, claim or assessment; the legal processes and potential level of damages in the jurisdiction in which the litigation, claim or assessment has been brought; the progress of the case (including progress after the date of the financial statements but before those statements are issued); the opinions or views of legal counsel and other advisors; experience of similar cases; and any decision of the Corporation’s management as to how it will respond to the litigation, claim or assessment. The Corporation assesses the probability of an outflow of resources to settle the obligation as well as if the outflow can be reliably measured. If these conditions are not met, no provision will be recorded and the relevant facts will be disclosed as a contingent liability. To the extent that the Corporation’s assessments at any time do not reflect subsequent developments or the eventual outcome of any claim, its future financial statements may be materially affected, with a favourable or adverse impact on the Corporation’s business, financial condition or results of operations.

27
3. RECENT ACCOUNTING PRONOUNCEMENTS
New Accounting Pronouncements – Not Yet Effective
At the date of authorization of these financial statements, the Corporation has not applied the following new and revised standards that have been issued but are not yet effective:
IFRS 9 Financial instruments
IFRS 15 Revenue from contracts with customers
IFRS 16 Leases
IFRS 17 Insurance contracts
IFRS 2 (amendments) Classification and measurement of share-based payment transactions
IFRS 4 (amendments) Applying IFRS 9 financial instruments with IFRS 4 insurance contracts
IFRS 9 (amendments) Prepayment features with negative compensation
IFRS 10 & 28 (amendments) Sale or contribution of assets between an investor and its associate or joint venture
IAS 7 (amendments) Disclosure initiative
IAS 12 (amendments) Recognition of deferred tax assets for unrealized losses
IAS 28 (amendments) Long-term interests in associates and joint ventures
IAS 40 (amendments) Transfers of investment property
IFRS 15 (clarifications) Clarifications to IFRS 15 revenue from contracts with customers
IFRIC 22 Foreign currency transactions and advance considerations
IFRIC 23 Uncertainty over income tax treatments
Annual improvements Annual improvements to IFRS: 2014 – 16 cycle – IFRS 12 amendments
Annual improvements Annual improvements to IFRS: 2014 – 16 cycle – IFRS 1 and IAS 28 amendments
Subject to full analysis the Corporation does not expect that the adoption of the standards listed above will have a material impact on the financial statements of The Stars Group in future periods, except as noted below: IFRS 9, Financial Instruments The IASB issued IFRS 9 relating to the classification and measurement of financial instruments. IFRS 9 uses a single approach to determine whether a financial asset is measured at amortized cost or fair value, and this approach replaces the previous requirements of IAS 39, Financial Instruments: Recognition and Measurement. The approach in IFRS 9 is based on how an entity manages its financial assets (i.e., its business model) and the contractual cash flow characteristics of those financial assets. IFRS 9 also amends the impairment criteria by introducing a new expected credit losses model for calculating impairment on financial assets and commitments to extend credit. The standard also introduces minor changes applicable to financial liabilities. Further, IFRS 9 includes new hedge accounting requirements that align hedge accounting more closely with risk management. These new requirements do not fundamentally change the types of hedging relationships or the requirement to measure and recognize ineffectiveness, but do allow more hedging strategies that are used for risk management to qualify for hedge accounting and for more judgment by management in assessing the effectiveness of those hedging relationships, replacing the rules-based approach to assessing hedge effectiveness under IAS 39. Extended disclosures in respect of risk management activity will also be required under the new standard. Based on the analysis undertaken to date, the Corporation expects the following impact on its consolidated financial statements and disclosures as a result of the adoption of the new standard on January 1, 2018: Certain equity investments that are currently classified as available-for-sale ($7.0 million as at December 31, 2017) will be reclassified to financial assets at fair value through profit or loss on January 1, 2018. Related fair value gains of $nil will be transferred from the available-for-sale financial assets reserve to retained earnings on January 1, 2018 and fair value gains related to these investments amounting to $nil were recognized in profit or loss in the 2017 financial year as these investments are currently held at cost.

28
Investment in debt instruments held by the Corporation (i.e., bonds) that are currently classified as available-for-sale will satisfy the conditions for classification as at fair value through other comprehensive income and hence there will be no change to the accounting for these assets. Related fair value gains of $nil will be transferred from the available-for-sale financial assets reserve to the financial assets at fair value through other comprehensive income reserve on January 1, 2018. The other financial assets held by the Corporation include debt instruments currently measured at amortized cost which continue to meet the conditions for classification at amortized cost under IFRS 9. Accordingly, the Corporation does not expect the new guidance to affect the classification and measurement of these financial assets. The new impairment model requires the recognition of impairment provisions based on expected credit losses rather than only incurred credit losses as is the case under IAS 39. It applies to financial assets classified at amortized cost, debt instruments measured at fair value through other comprehensive income, contract assets under IFRS 15, Revenue from Contracts with Customers, lease receivables, loan commitments and certain financial guarantee contracts. Based on the assessments undertaken to date, the Corporation does not expect a material increase in the loss allowance against these assets. The impact of historic modifications arising on the Corporation’s existing long-term debt are required to be recognized on transition to the new standard. This will result in an adjustment to the carrying amount of long-term debt and a corresponding adjustment in the opening balance of retained earnings on January 1, 2018. The de-recognition rules remain unchanged from IAS 39 Financial Instruments: Recognition and Measurement. As permitted by IFRS 9, the Corporation intends to elect to continue to apply the hedge accounting requirements of IAS 39 to all of its hedging relationships, rather than apply the new requirements of IFRS 9 upon adoption of the new standard on January 1, 2018. The new standard also introduces requirements for expanded disclosure and changes in presentation. These requirements are expected to change the nature and extent of the Corporation’s disclosures about its financial instruments, particularly in the year of adoption. The Corporation will apply the new rules retrospectively from January 1, 2018, with the practical expedients permitted under the standard. Comparative information for 2017 will not be restated. IFRS 15, Revenues from Contracts with Customers The Financial Accounting Standards Board and IASB issued converged standards in respect of revenue recognition. IFRS 15 affects any entity entering into contracts with customers, unless those contracts fall within the scope of other standards such as insurance contracts, financial instruments or lease contracts. IFRS 15 supersedes the revenue recognition requirements in IAS 18, Revenue, IFRIC 13, Customer Loyalty Programs, and the majority of other industry-specific guidance. The standard contains a single model that applies to contracts with customers and two approaches to recognizing revenue, i.e., at a point in time or over time. The model features a contract-based five-step analysis of transactions to determine whether, how much and when revenue is recognized. New estimates and judgmental thresholds have been introduced, which may affect the amount or timing of revenue recognized. The Corporation has completed its analysis and expects the following impact on its consolidated financial statements and disclosures as a result of the adoption of the new standard on January 1, 2018: The timing and amount of revenue recognized is not expected to be materially affected as a result of adoption, but the Corporation does expect an impact on presentation and disclosure due to the requirement to present revenue from contracts with customers separately from other sources of income. The Corporation does not believe contract assets and liabilities as of January 1, 2018 will be material such that they require separate disclosure in the consolidated statement of financial position or in the notes to the consolidated financial statements. The new standard will be applied using the modified retrospective approach, whereby the cumulative impact of adoption will be recognized in retained earnings as of January 1, 2018 and comparative information for 2017 will not be restated. The Corporation does not believe this approach will result in an adjustment to the opening balance of retained earnings on adoption.

29
IFRS 16, Leases
The IASB recently issued IFRS 16 to replace IAS 17, Leases. This standard introduces a single lessee accounting model and requires a lessee to recognize assets and liabilities for all leases with a term of more than 12 months, unless the underlying asset is of low value. A lessee is required to recognize a right-of-use asset representing its right to use the underlying asset and a lease liability representing its obligation to make lease payments.
This standard substantially carries forward the lessor accounting requirements of IAS 17, while requiring enhanced disclosures to be provided by lessors.
The Corporation intends to adopt IFRS 16 from its effective date of January 1, 2019. The Corporation is currently evaluating the impact of this standard, and does not anticipate applying it prior to its effective date. 4. CHANGE IN ACCOUNTING ESTIMATE
During the year ended December 31, 2016, the Corporation determined that it was necessary to accelerate the amortization of the Full Tilt software no longer used as a result of the previously announced migration of the Full Tilt brand and players to the PokerStars platform reducing the remaining life from 39 to 24 months. Although the software will no longer be used, the Corporation determined that there is value in preventing its use by others. This change in accounting estimate results in an increase in amortization of intangibles expense from approximately $11.28 million to approximately $18.10 million annually from May 2016 through April 2018.
In connection with the Innova Offering (as defined below in note 12) the Corporation entered into an EBITDA support agreement with Innova Gaming Group Inc. (TSX: IGG) (“Innova”) pursuant to which the Corporation agreed to pay Innova each year until June 30, 2020 a maximum of CDN$2 million per year based on any applicable EBITDA shortfall recognized by Innova in each such year. During the year ended December 31, 2016, Innova informed the Corporation that its EBITDA expectations would result in a shortfall in each of the remaining four years and as a result, the Corporation recorded a provision of $5.33 million, representing the present value of the expected remaining EBITDA support payments. For information regarding the disposition of the Corporation’s ownership in Innova and the corresponding reclassification, see notes 12 and 17.

30
5. SEGMENTAL INFORMATION
For the years ended December 31, 2017 and 2016, the Corporation had one reportable segment, primarily related to online gaming, which for the purposes of the financial statements is further divided into the Poker and Casino & Sportsbook product lines. The Corporation’s “Chief Operating Decision Makers” receive product revenue information throughout the year for the purposes of assessing their respective performance. Other gaming related sources of revenue are aggregated into “Other Gaming”, while certain other nominal sources of revenue and corporate costs are included in “Corporate”.
Segmental net earnings for the year ended December 31, 2017:
Year Ended December 31, 2017
Poker Casino &
Sportsbook Other
Gaming Total
Gaming Corporate Total $000’s $000’s $000’s $000’s $000’s $000’s
Revenue 877,296 384,012 50,322 1,311,630 685 1,312,315 Selling (192,271 ) (438 ) (192,709 ) General and administrative (523,011 ) (48,247 ) (571,258 ) Financial (161,790 ) (1,249 ) (163,039 ) Gaming duty (130,771 ) — (130,771 ) Gain from investments 29,919 4,605 34,524 Net loss from associates (2,569 ) — (2,569 ) Net earnings (loss) before income taxes 331,137 (44,644 ) 286,493 Income taxes 26,281 927 27,208 Net earnings (loss) 304,856 (45,571 ) 259,285 Other segmental information Depreciation & amortization 147,027 159 147,186 Bad debt 7,171 — 7,171 Total Assets 5,398,310 16,816 5,415,126 Total Liabilities 3,089,732 21,963 3,111,695 Segmental net earnings for the year ended December 31, 2016:
Year ended December 31, 2016 (As reclassified * )
Poker Casino &
Sportsbook Other
Gaming Total
Gaming Corporate Total $000’s $000’s $000’s $000’s $000’s $000’s
Revenue 846,059 264,114 44,966 1,155,139 108 1,155,247 Selling (162,642 ) (143 ) (162,785 ) General and administrative (514,105 ) (71,018 ) (585,123 ) Financial (142,563 ) 4,264 (138,299 ) Gaming duty (113,102 ) — (113,102 ) Acquisition-related costs (199 ) — (199 ) Gain (loss) from investments 879 (20,157 ) (19,278 ) Net earnings from associates — 623 623 Gain on settlement of deferred consideration 2,466 — 2,466 Net earnings (loss) before income taxes 225,873 (86,323 ) 139,550 Income taxes 4,027 (27 ) 4,000 Net earnings (loss) 221,846 (86,296 ) 135,550 Other segmental information Depreciation & amortization 139,301 582 139,883 Bad debt 4,142 1,938 6,080 Total Assets 5,412,449 50,026 5,462,475 Total Liabilities 3,230,806 29,941 3,260,747

31
(*) The Corporation reclassified interest revenue previously included within “Revenue”, to “Gain (loss) from investments” totaling $0.65 million for the year ended December 31, 2016. The Corporation has determined that the impact of these corrections is immaterial. The Corporation also evaluates revenue performance by geographic region based on the primary jurisdiction where the Corporation is licensed or approved to offer, or offers through third party licenses or approvals, its products and services. The following tables set out the proportion of revenue attributable to each gaming license or approval (as opposed to the jurisdiction where the customer was located) that either generated a minimum of 5% of total consolidated revenue for the year ended December 31, 2017 or 2016, or that the Corporation otherwise deems relevant based on its historical reporting of the same or otherwise: Year Ended December 31, 2017
Poker Casino &
Sportsbook Other Gaming Total Gaming Corporate Total $000’s $000’s $000’s $000’s $000’s $000’s
Geographic Area Isle of Man 349,375 29,338 1 378,714 — 378,714 Malta 210,742 224,101 2 434,845 — 434,845 Italy 82,106 52,284 575 134,965 — 134,965 United Kingdom 56,155 15,140 258 71,553 — 71,553 Spain 47,912 34,842 669 83,423 — 83,423 France 50,214 10,410 508 61,132 — 61,132 Other licensed or approved jurisdictions 80,792 17,897 48,309 146,998 685 147,683
877,296 384,012 50,322 1,311,630 685 1,312,315 Year ended December 31, 2016 (As reclassified)
Poker Casino &
Sportsbook Other Gaming Total Gaming Corporate Total $000’s $000’s $000’s $000’s $000’s $000’s
Geographic Area Isle of Man 339,513 19,187 3 358,703 — 358,703 Malta 225,974 166,198 4 392,176 — 392,176 Italy 77,646 31,693 624 109,963 — 109,963 United Kingdom 56,837 13,439 387 70,663 — 70,663 Spain 42,326 24,370 653 67,349 — 67,349 France 51,989 2,356 573 54,918 — 54,918 Other licensed or approved jurisdictions 51,774 6,871 42,722 101,367 108 101,475
846,059 264,114 44,966 1,155,139 108 1,155,247

32
The distribution of some of the Corporation’s non-current assets (goodwill, intangible assets and property and equipment) by geographic region is as follows: As at December 31, 2017 2016 $000’s $000’s Geographic Area
Canada 53,394 39,993 Isle of Man 4,446,503 4,567,314 Malta — — Italy 35 47 United Kingdom 6,511 6,380 France — — Other licensed or approved jurisdictions 15,744 15,638
4,522,187 4,629,372 6. EXPENSES CLASSIFIED BY NATURE Year Ended December 31,
2017
$000’s 2016
$000’s Note (As reclassified) Financial Interest and bank charges 160,201 167,945 Foreign exchange loss (gain) 2,838 (29,646 ) 163,039 138,299 General and administrative Processor costs 69,518 56,555 Office 81,174 73,713 Salaries and fringe benefits 170,422 182,080 Research and development salaries 25,180 27,661 Stock-based compensation 27 10,622 10,289 Depreciation of property and equipment 11 8,925 8,181 Amortization of deferred development costs 10 10,275 5,942 Amortization of intangible assets 10 127,986 125,760 Professional fees 66,185 71,008 (Reversal of) Impairment of assets held for sale, associates and intangible assets (6,799 ) 16,931
Bad debt 7,171 6,080 Loss on disposal of assets 599 923 571,258 585,123 Selling Marketing 162,437 142,205 Royalties 30,272 20,580 192,709 162,785 Gaming duty 130,771 113,102 Acquisition-related costs Professional fees — 199 — 199 The Corporation changed the presentation of certain items within its consolidated statements of earnings for the comparative period to conform to the current year’s presentation. The Corporation reclassified $7.71 million travel and entertainment costs previously included within “Selling” expenses to “Office” expenses. The Corporation has determined that the impact of this correction is

33
immaterial. The Corporation also segregated Selling expenses into “Marketing” and “Royalties” in order to provide a better understanding to the readers of the distribution of expenses within Selling expenses. None of these reclassifications had a net earnings impact on the consolidated statements of earnings. During the year ended December 31, 2017, the Corporation received $5.77 million in indemnification proceeds from the sellers of Stars Interactive Group for gaming duty, professional fees and taxes owed for periods prior to the Stars Interactive Group Acquisition. The amounts received from the sellers were classified as Gaming duty, Professional fees and Income taxes. In addition, the Corporation received a refund of $2.85 million in taxes and penalties from the Belgian tax authorities, and insurance indemnification proceeds of $2.91 million in respect of Autorité des marchés financiers (AMF) and other investigation professional fees. The amount received from the Belgian tax authorities was classified as Income taxes and the insurance indemnification was classified as Professional fees. 7. GAIN (LOSS) FROM INVESTMENTS NYX Gaming Group Limited In connection with the Corporation’s December 2014 sale of Ongame Network Ltd. to what was then known as NYX Gaming Group Limited (“NYX Gaming Group”), the Corporation and NYX Gaming Group entered into a strategic investment transaction pursuant to which the Corporation purchased from NYX Gaming Group CDN$9 million unsecured convertible debentures (initially CDN$10 million but the Corporation subsequently sold and assigned an aggregate of CDN$1 million to four individuals), which were later amended to, among other things, adjust the repayment terms such that they would be repayable solely in cash. The debenture was redeemed in full during the year ended December 31, 2017 (see note 13). In July 2015, the Corporation announced that it completed the sale of CryptoLogic Ltd. (“CryptoLogic”) to NYX Gaming Group and Amaya (Alberta) Inc. (formerly Chartwell Technology Inc.) (“Chartwell”) to NYX Digital Gaming (Canada) ULC, a subsidiary of NYX Gaming Group (the “NYX Sub”) (together, the “Chartwell/Cryptologic Sale”) for gross proceeds of approximately CDN$150 million, subject to adjustment, of which CDN$110 million was paid in cash and CDN$40 million was paid by the NYX Sub through the issuance of exchangeable preferred shares (the “NYX Sub Preferred Shares”). The Corporation used the majority of the cash net proceeds from the Chartwell/Cryptologic Sale for deleveraging, including the 2015 refinancing of the debt incurred as part of the financing for the Stars Interactive Group Acquisition. In November 2017, the Corporation completed the disposition of all its securities of NYX Gaming Group, including NYX Gaming Group ordinary shares, NYX Gaming Group ordinary share purchase warrants, and the NYX Sub Preferred Shares, representing approximately 13.7% of NYX Gaming Group’s ordinary shares on a partially diluted basis, for net cash proceeds of $27.9 million and a gain of $14.0 million, when Scientific Games Corporation (NYSE: SGMS) acquired NYX Gaming Group. Jackpotjoy plc In connection with the January 2017 London Stock Exchange (“LSE”) listing of Jackpotjoy plc (LSE: JPJ) (“Jackpotjoy”), parent company of The Intertain Group Ltd. (“Intertain”) and WagerLogic Malta Holdings Ltd. (“WagerLogic”), a former subsidiary of the Corporation which it sold in February 2014, and in exchange for its 4,920,000 Intertain common shares (which the Corporation acquired between 2014 and 2015, including through open market purchases, the exercise of common share purchase warrants and an exchange for shares it acquired from the purchaser of WagerLogic) and the conversion of certain CDN$3.85 million 5.0% Intertain convertible debentures, the Corporation, after exchanging certain exchangeable shares, received 5,561,666 Jackpotjoy ordinary shares. In December 2017, the Corporation completed the sale of its ordinary shares in Jackpotjoy, representing approximately 7.5% of Jackpotjoy’s then issued and outstanding ordinary shares, for net cash proceeds of $59.8 million and a gain of $15.0 million.

34
8. INCOME TAXES
Details of income tax expense were as follows: Year Ended December 31, 2017 2016 $000’s $000’S Current income tax expense 9,391 8,521 Current income tax expense (recovery) - prior year adjustment 21,923 (137 ) Deferred income tax recovery relating to the origination and reversal of temporary differences (3,568 ) (4,386 ) Deferred income tax (recovery) expense - prior year adjustment (538 ) 2 Income tax expense 27,208 4,000
The Corporation’s applicable Canadian statutory tax rate is equal to the Federal and Provincial combined tax rate for the period applicable in the jurisdiction within Canada where the Corporation’s head office is registered (i.e., Ontario, previously Quebec). Income taxes reported differ from the amount computed by applying the statutory rates to earnings before income taxes. The reconciliation is as follows: Year Ended December 31, 2017 2016 $000’s $000’s Net earnings before income taxes 286,493 139,550 Canadian statutory tax rate 26.7 % 26.9 % Statutory income taxes 76,494 37,539 Non-taxable income (143 ) (99 ) Non-deductible expenses 3,590 4,710 Differences in effective income tax rates in foreign jurisdictions (117,153 ) (102,206 ) Deferred tax assets not recognized 43,035 64,191 Adjustment in respect of prior years 21,385 (135 ) Income tax expense 27,208 4,000 The Corporation operates in and earns revenues from many jurisdictions and is therefore subject to a variety of taxes, duties and levies including, without limitation, gaming duties, value added taxes (“VAT”), corporate income taxes, employment related taxes, withholding taxes and business rate taxes. As a result, the Corporation pays significant levels of tax globally with its total tax contribution for the year ended December 31, 2017 being in excess of $190 million (December 31, 2016 – in excess of $160 million). The Corporation’s effective income tax rate for the year ended December 31, 2017, excluding prior year adjustments, was 2.03% (December 31, 2016 – 2.96%), significantly lower than the main Canadian corporate income tax rate. The main driver of this is that the Corporation primarily operates from the Isle of Man and Malta, which are jurisdictions with low corporate income tax rates. During the year ended December 31, 2017, the Corporation received notification of a proposed tax assessment from the Canadian tax authorities relating to transfer pricing. The proposed assessment covers periods prior to the Stars Interactive Group Acquisition covering the 2003 to 2007 tax years. For the year ended December 31, 2017 the Corporation has recorded a tax provision based on the proposed assessment for both Federal and Provincial tax of $26.5 million including interest. The Corporation received the Federal tax assessment after the balance sheet date, but has not yet received a Provincial tax assessment. The Corporation intends to vigorously defend its position against the assessment and any future related assessments.

35
Deferred Tax Recognized deferred tax assets and liabilities Significant components of the Corporation’s deferred income tax balance at December 31, 2017 and 2016 were as follows:
Property & Equipment
Transaction Costs Intangibles Tax Losses Other Total
$000’s $000’s $000’s $000’s $000’s $000’s At January 1, 2016 38 4,284 (19,112 ) 301 (5,987 ) (20,476 ) (Charged) / credited to net earnings (10 ) — 1,808 (174 ) 2,760 4,384 Reclassification — (4,284 ) — — 4,284 — (Charged) / credited to other comprehensive income (3 ) — — 12 (81 ) (72 ) Impairment — — 4 — — 4 At December 31, 2016 25 — (17,300 ) 139 976 (16,160 ) Credited to net earnings 131 — 426 170 3,379 4,106 Reclassification — — — — — — Credited to other comprehensive income — — 14 — 146 160 Charge direct to equity - share-based payment transactions — — — — 359 359 Acquisition of subsidiary — — (72 ) — — (72 ) Foreign exchange on translation — — 253 (1 ) (14 ) 238 At December 31, 2017 156 — (16,679 ) 308 4,846 (11,369 ) Unrecognized deferred tax assets Deferred tax assets have not been recognized in respect of the items shown below. The amounts shown are the gross temporary differences and to calculate the potential deferred asset it is necessary to multiply the amounts by the tax rates in each case. As at December 31, 2017 2016 $000’s $000’S Tax losses 1,293,846 687,620 Other temporary differences 19,567 34,150 Total deferred tax asset unrecognized 1,313,413 721,770 Deferred tax assets have not been recognized in respect of these items because it is not probable that future taxable profits will be available in these jurisdictions against which the Corporation can utilize the benefit from them. Included in tax losses not recognized as at December 31, 2017 are Canadian non-capital tax losses of $100.22 million (December 31, 2016 - $77.56 million) that may be applied against earnings for up to 20 years from the end of the year the losses were generated. Tax losses also include foreign subsidiary non-capital losses of $1,193.62 million (December 31, 2016 - $610.06 million) that may be applied against future years. The majority of those losses ($1,170.09 million; December 31, 2016 - $582.64 million) can be carried forward for up to 9 years from the end of the year the tax losses were generated. No deferred tax liability has been recognized for unremitted earnings totaling $1,127.1 million (December 31, 2016 - $695.9 million), as the Corporation controls the reversal of the temporary difference and it is probable that the temporary differences will not reverse in the foreseeable future.

36
9. EARNINGS PER SHARE
The following table sets forth the computation of basic and diluted earnings per Common Share for the following periods:
Year Ended December 31, 2017 2016
Numerator Numerator for basic and diluted earnings per Common Share - net earnings $ 259,231,000 $ 136,144,000 Denominator Denominator for basic earnings per Common Share – weighted average number of Common Shares 146,818,764 141,463,244 Effect of dilutive securities Stock options 558,996 1,585,173 Performance share units 18,748 — Restricted share units 17,076 — Warrants 717,792 — Convertible Preferred Shares 55,576,213 52,384,503 Effect of dilutive securities 56,888,825 53,969,676 Dilutive potential for diluted earnings per Common Share 203,707,589 195,432,920 Basic earnings per Common Share $ 1.77 $ 0.96 Diluted earnings per Common Share $ 1.27 $ 0.70 10. GOODWILL AND INTANGIBLE ASSETS
For the year ended December 31, 2017:
Software Technology Acquired through Business
Combinations $000’s
Other Software
Technology $000’s
Customer Relationships
$000’s
Brands $000’s
Deferred Development
Costs $000’s
Goodwill $000’s
Total $000’s
Cost Balance – January 1, 2017 116,079 15,673 1,423,719 485,253 48,808 2,810,681 4,900,213 Additions — 1,893 — — 23,212 — 25,105 Additions through business combination 1,413 — — — — — 1,413
Reclassification — — — — (201 ) — (201 ) Translation — 1,146 — — — — 1,146 Balance – December 31, 2017 117,492 18,712 1,423,719 485,253 71,819 2,810,681 4,927,676 Accumulated amortization and impairments
Balance – January 1, 2017 61,163 5,798 229,377 — 9,832 5,471 311,641 Amortization 29,909 3,162 94,915 — 10,275 — 138,261 Translation — 424 — — — — 424 Balance – December 31, 2017 91,072 9,384 324,292 — 20,107 5,471 450,326 Net carrying amount At January 1, 2017 54,916 9,875 1,194,342 485,253 38,976 2,805,210 4,588,572 At December 31, 2017 26,420 9,328 1,099,427 485,253 51,712 2,805,210 4,477,350

37
For the year ended December 31, 2016:
Software Technology Acquired through Business
Combinations $000’s
Other Software
Technology $000’s
Customer Relationships
$000’s
Brands $000’s
Deferred Development
Costs $000’s
Goodwill $000’s
Total $000’s
Cost Balance – January 1, 2016 115,283 19,992 1,423,719 485,253 30,309 2,810,470 4,885,026 Additions — 7,669 — — 20,961 — 28,630 Additions through business combination 824 — — — — 200 1,024
Disposals — (11,646 ) — — (1,784 ) — (13,430 ) Reclassification — — — — (678 ) — (678 ) Translation (28 ) (342 ) — — — 11 (359 ) Balance – December 31, 2016 116,079 15,673 1,423,719 485,253 48,808 2,810,681 4,900,213 Accumulated amortization and impairments
Balance – January 1, 2016 32,122 13,966 134,462 — 3,122 — 183,672 Amortization 27,478 3,367 94,915 — 5,942 — 131,702 Disposals — (11,634 ) — — (1,784 ) — (13,418 ) Impairment 1,563 155 — — 2,552 5,471 9,741 Translation — (56 ) — — — — (56 ) Balance – December 31, 2016 61,163 5,798 229,377 — 9,832 5,471 311,641 Net carrying amount At January 1, 2016 83,161 6,026 1,289,257 485,253 27,187 2,810,470 4,701,354 At December 31, 2016 54,916 9,875 1,194,342 485,253 38,976 2,805,210 4,588,572 The Corporation recognized impairment losses (classified in general and administrative expenses) related to goodwill and software technology acquired through business combinations of $7.19 million during the year ended December 31, 2016. The Corporation recognized impairment losses of $2.55 million during the year ended December 31, 2016 related to deferred development costs. The primary factors leading to the recognition of the impairment losses in 2016 were as follows:
• $4.7 million of goodwill and $1.0 million in software technology acquired through business combinations that was recognized on the acquisition of a subsidiary was derecognized due to the lack of positive revenue and cashflow forecasts in the subsidiary.
• The Corporation determined that a capitalized research and development cost which had not met certain identifiable criteria was to be terminated during the development stage. As a result, the Corporation recognized an impairment loss of $2.55 million in 2016 in deferred development costs.
Impairment Testing
The Corporation performed an annual impairment test for its gaming operations in connection with the preparation of its financial statements for the year ended December 31, 2017. The Corporation identified the gaming operations as a single CGU for impairment testing purposes.
The recoverable amount of the CGU is determined from value in use calculations. The key assumptions for the value in use calculations are those regarding the discount rate, growth rate, cash flows and Adjusted EBITDA forecasts. Adjusted EBITDA is defined by the Corporation as net earnings (loss) before interest and financing costs (net of interest income), income taxes, depreciation and amortization, stock-based compensation, restructuring and certain other items. These assumptions have been revised in the year ended December 31, 2017. Management estimates discount rates using pre-tax rates that reflect current market assessments of the time value of money and the risks specific to the CGU.
The Corporation prepares cash flow forecasts derived from the most recent financial budgets approved by management for the next three to five years and extrapolates cash flows based on an estimated growth rate of 1.9% and a discount rate of 9.7% (December 31,

38
2016 – 1.9% and 11.7%, respectively). The estimated growth rate is based on the inflation rates of many of the European markets in which the Corporation is operating.
The Corporation believes that any reasonable change to these principal assumptions is unlikely to cause the CGU’s carrying value to exceed its recoverable amount. This fair value measurement is a level 3 measurement in the fair value hierarchy.
Goodwill
Based on the goodwill impairment test performed, the recoverable amount of the CGU was in excess of its carrying amount and accordingly, there is no impairment of the carrying value of the goodwill.
Brand
Based on the indefinite life intangible asset impairment test performed, the fair value of the asset was in excess of its carrying amount and accordingly, there is no impairment of the carrying value of the intangible asset.
11. PROPERTY AND EQUIPMENT
For the year ended December 31, 2017:
Revenue- Producing
Assets $000’s
Furniture and Fixtures
$000’s
Computer Equipment
$000’s
Building $000’s
Total $000’s
Cost Balance – January 1, 2017 84 9,356 18,627 21,605 49,672 Additions — 2,724 8,273 — 10,997 Disposals (84 ) (571 ) (1,251 ) — (1,906 ) Translation — 988 506 2,323 3,817 Balance – December 31, 2017 — 12,497 26,155 23,928 62,580
Accumulated depreciation Balance – January 1, 2017 24 2,017 5,239 1,592 8,872 Depreciation — 3,198 4,764 963 8,925 Disposals (24 ) (301 ) (860 ) — (1,185 ) Translation — 410 259 462 1,131 Balance – December 31, 2017 — 5,324 9,402 3,017 17,743
Net carrying amount At January 1, 2017 60 7,339 13,388 20,013 40,800 At December 31 2017 — 7,173 16,753 20,911 44,837

39
For the year ended December 31, 2016:
Revenue- Producing
Assets $000’s
Furniture and Fixtures
$000’s
Computer Equipment
$000’s
Building $000’s
Total $000’s
Cost Balance – January 1, 2016 117 11,099 14,589 26,351 52,156 Additions 3 1,536 5,267 — 6,806 Disposals (40 ) (2,762 ) (965 ) — (3,767 ) Translation 4 (517 ) (264 ) (4,746 ) (5,523 ) Balance – December 31, 2016 84 9,356 18,627 21,605 49,672 Accumulated depreciation Balance – January 1, 2016 29 1,536 2,143 1,356 5,064 Depreciation 16 3,023 4,144 998 8,181 Disposals (22 ) (1,971 ) (742 ) — (2,735 ) Translation 1 (571 ) (306 ) (762 ) (1,638 ) Balance – December 31, 2016 24 2,017 5,239 1,592 8,872 Net carrying amount At January 1, 2016 88 9,563 12,446 24,995 47,092 At December 31 2016 60 7,339 13,388 20,013 40,800 12. INVESTMENTS IN ASSOCIATES In May 2015, the Corporation completed the spin-off of Diamond Game Enterprises, which it had purchased in February 2014 for approximately $25 million, through the initial public offering (the “Innova Offering”) of common shares of what was then known as Innova. The Innova Offering resulted in the Corporation receiving aggregate net proceeds of approximately CDN$34.1 million and maintaining ownership of approximately 40% of the issued and outstanding common shares of Innova.
During the year ended December 31, 2016, the Corporation recognized an impairment loss (classified in general and administrative expenses) of $4.21 million as a result of the significant and prolonged decline in the fair market value of the Innova common shares before the shares were reclassified. On October 28, 2016, the Corporation decided to pursue a potential disposition of its ownership in Innova. The investment was therefore reclassified to assets held for sale as of that date (see note 17).
During the year ended December 31, 2017, the Corporation acquired a 21.13% ownership interest in the fully diluted share capital of Mediarex Enterprises Limited (“Mediarex”). The Corporation recognized an impairment loss of $2.57million in respect of the Mediarex investment as a result of a significant decline in earnings and expected cash flows. The following table shows a reconciliation from the opening balance to the closing balance for investment in associates:
Note $000’s Balance – January 1, 2016 10,734 Income included in net earnings from associates 623 Reclassified to long-term investments (501 ) Impairment loss included in general and administrative expenses 6 (4,206 ) Translation 487 Reclassified to assets held for sale 17 (7,137 ) Balance – December 31, 2016 — Acquired during the year 2,569 Impairment loss included in net loss from associates (2,569 ) Balance – December 31, 2017 — All associates are accounted for using the equity method in these consolidated financial statements as described in note 2.

40
13. INVESTMENTS
The Corporation held the following investments: As at December 31, 2017 2016 $000’s $000’s
Carrying value &
fair value Carrying value &
fair value Funds – Available-for-sale 7,045 65,427 Bonds – Available-for-sale 115,343 91,696 Debentures – Fair value through profit/loss1 — 7,556 Equity in quoted companies – Available-for-sale 280 123,808 Equity in private companies – Available-for-sale 6,981 6,921 Total investments 129,649 295,408 Current portion 122,668 288,487 Non-current portion 6,981 6,921 1 A financial asset is designated as fair value through profit or loss on initial recognition if it is part of a contract containing one or
more embedded derivatives and the entire contract is designated as such.
Investments relate primarily to customer deposits held in accounts segregated from investments held for operational purposes. As of December 31, 2017, Customer deposits were covered by $122.7 million in investments and $227.1 million in cash.
During the year ended December 31, 2017, a wholly owned subsidiary of the Corporation entered into a support agreement (the “Support Agreement”) with Scientific Games relating to the proposed acquisition by Scientific Games of all outstanding ordinary shares of NYX Gaming Group. After entering into the Support Agreement, the Corporation completed the disposition of all its NYX Gaming Group investments to Scientific Games (note 7). The gains are presented in income from investments in the consolidated statements of earnings.
The Corporation also completed the sale of its investments in Jackpotjoy during the year ended December 31, 2017, (note 7). The gains are presented in income from investments in the consolidated statements of earnings.
There were no impairments recognized on investments during the year ended December 31, 2017 (December 31, 2016: $3.19 million). See note 31 for details on credit risk.
The following table provides information about the carrying value of bonds and debentures held by the Corporation that are due over the current and non-current terms:
1 year or less $000’s
1 to 5 years $000’s
Greater than 5 years $000’s
Bonds 38,014 72,645 4,684 Total 38,014 72,645 4,684 For the year ended December 31, 2017, the Corporation recognized a gain from current investments as follows:
Funds $000’s
Bonds $000’s
Debentures $000’s
Equity in quoted
companies $000’s
Equity in private
companies $000’s
Total $000’s
Investment income earned 473 2,647 253 1,182 186 4,741 Realized gains 3,657 2,330 — 35,096 — 41,083 Unrealized losses (4,299 ) (1,969 ) — (78 ) — (6,346 ) Changes in fair value through profit/loss — — — — 13 13 Total (169 ) 3,008 253 36,200 199 39,491 Investment income from bonds and debentures includes interest income and premium and discount amortization. Income from funds and equity includes dividends and distributions from quoted companies.

41
Debentures – Fair value through profit or loss
During the year ended December 31, 2014, the Corporation acquired then-convertible debentures for a total cost of CDN$9 million from NYX Gaming Group, which bear interest at 6.00% per annum (the Corporation originally acquired CDN$10 million of such debentures but subsequently sold and assigned CDN$1 million of the same soon thereafter). The debentures previously had a maturity date of November 17, 2016 and were convertible at the Corporation’s option into fully paid common shares of NYX Gaming Group at any time prior to the maturity date at a conversion price of CDN$3.20 per common share. However, pursuant to an amendment to the debentures, the Corporation and NYX Gaming Group extended the maturity date of the debentures and agreed that they would be repaid solely in cash monthly payments of CDN$1 million beginning on May 17, 2017 until the balance due date of April 17, 2018, subject to certain automatic set-off rights against a supplier licensing agreement the Corporation had entered into with NYX Gaming Group (the “Licensing Agreement”) (see note 24 where this commitment is presented as the minimum revenue guarantee related to the Chartwell/Cryptologic Sale). The debentures were fully repaid during the year ended December 31, 2017.
Debentures $000’s
As at January 1, 2016 12,260 Realized gain on investment 1,035 Unrealized loss on investment (909 ) Converted to equity (5,310 ) Translation 480 As at December 31, 2016 7,556 Realized gain on investment 253 Redemption of debenture (8,365 ) Translation 556 As at December 31, 2017 —
Subsidiaries
As at December 31, 2017, the Corporation had the following significant subsidiaries:
Name of principal subsidiary Country of
incorporation Principal business
Percentage of
ownership Stars Group Holdings B.V.
Netherlands
Intermediate holding company and investment
vehicle 100 % Stars Interactive Holdings (IOM) Limited Isle of Man Intermediate holding company 100 % Worldwide Independent Trust Limited Isle of Man Treasury 100 % REEL Italy Limited Malta Various 100 % Rational Entertainment Enterprises Limited Isle of Man Gaming services 100 % Naris Limited Isle of Man Treasury 100 % Stars Interactive Limited Isle of Man Intermediate holding company 100 % RG Cash Plus Limited Isle of Man Treasury 100 % Rational Gaming Europe Limited Malta Various 100 % REEL Spain Plc Malta Gaming services 100 % 14. ACCOUNTS RECEIVABLE The Corporation’s accounts receivable balances at December 31, 2017 and December 31, 2016 consist of the following;
As at December 31, 2017 2016 $000’s $000’s Balances held with processors 75,147 62,002 Balances due from live events 10,260 5,910 VAT receivable 6,684 6,292 Other receivables 8,318 7,353 Total accounts receivable balance 100,409 81,557

42
15. CASH AND CASH EQUIVALENTS, RESTRICTED CASH ADVANCES AND COLLATERAL
Cash and cash equivalents
Cash and cash equivalents – operational includes an amount of $24.7 million held by a subsidiary of the Corporation that is subject to exchange controls in the country of operation. This balance is not available for general use by the Corporation or any of its other subsidiaries.
Restricted cash advances and collateral
Restricted cash held by the Corporation consists of the following components: As at December 31,
2017 2016 $000’s $000’s
Guarantees in connection with licenses held 4,333 5,728 Funds in connection with hedging contracts 5,113 2,879 Segregated funds in respect of payment processors 2,749 2,625 Guarantee in connection with acquisition of a subsidiary 1,201 — Cash portion of Kentucky Bond Collateral * 40,000 40,000 Other 300 263 Restricted cash advances and collateral – total 53,696 51,495 Restricted cash advances and collateral – current portion 7,862 5,767 Restricted cash advances and collateral – non-current portion 45,834 45,728
* During the year ended December 31, 2016, $40 million of restricted cash was collateralized as part of the Kentucky Bond Collateral (as defined in note 18 below) and currently appears in Cash portion of the Kentucky Bond Collateral. The Kentucky Bond Collateral will be held until there is legal evidence conclusively showing final discharge or release from the bond, a final appellate ruling reversing the applicable judgment or court order releasing the bond.
16. PREPAID EXPENSES AND DEPOSITS
As at December 31, 2017 2016 $000’s $000’s Prepaid royalties 5,704 6,184 Prepaid expenses 22,281 14,888 Vendor deposits 1,408 1,495 Total current portion of prepaid expenses and deposits 29,393 22,567 Prepaid royalties 16,444 20,698 Vendor deposits 70 100 Total non-current portion of prepaid expenses and deposits 16,514 20,798 Prepaid royalties include prepaid revenue share paid to business partners. Prepaid expenses are included within selling and general and administrative expenses. 17. ASSETS HELD FOR SALE
In connection with the Corporation’s ownership of approximately 40% of the issued and outstanding common shares of Innova, senior management committed to a plan to dispose of its ownership in Innova and classified the investment as assets held for sale during the three months ended December 31, 2016 (see note 12). During the year ended December 31, 2017, the Corporation completed the disposition of all of its ownership of the issued and outstanding common shares in Innova for an amount of CDN $20.5 million (USD $16.1 million). Nil gain (loss) was recognized on sale.

43
18. CREDIT FACILITY
The Corporation obtained a first lien revolving credit facility of $100 million on August 1, 2014 in connection with the Stars Interactive Group Acquisition (the “Credit Facility”). Maturing on August 1, 2019, the Credit Facility can be used to fund working capital needs and for general corporate purposes. The interest rate under the Credit Facility is, at the Corporation's option, either LIBOR plus 4.00% or ABR plus 3.00%. The applicable commitment fee on the Credit Facility is based on a first lien leverage ratio of 3.75 to 1.00 and could range from 0.375% to 0.50%. Borrowings under the Credit Facility are subject to the satisfaction of customary conditions, including the absence of a default or an event of default and compliance with certain representations and warranties. As at December 31, 2017 and December 31, 2016 there were no amounts outstanding under the Credit Facility. However, in connection with the Kentucky Proceeding (as defined in note 30 below) on February 22, 2016, the Corporation filed a notice of appeal to the Kentucky Court of Appeals and posted a $100 million supersedeas bond to stay enforcement of the order for damages during the pendency of the appeals process. The posting of the bond required the delivery of cash collateral in the amount of $40 million and letters of credit in the aggregate amount of $30 million (collectively, the “Kentucky Bond Collateral”), thereby reducing the availability under the Credit Facility to $70 million as of the date hereof.
19. LONG-TERM DEBT
The following is a summary of long-term debt outstanding at December 31, 2017, 2016 and 2015 (all capitalized terms used in the table below relating to such long-term debt are defined below in this note):
Interest rate
December 31, 2017,
Principal outstanding balance in
local denominated
currency
December 31, 2017
Carrying amount
December 31, 2016,
Principal outstanding balance in
local denominated
currency
December 31, 2016
Carrying amount
December 31, 2015,
Principal outstanding balance in
local denominated
currency
December 31,
2015 Carrying amount
000’s $000’s 000’s $000’s 000’s $000’s USD First Lien Term Loan 4.83% 1,895,654 1,848,397 2,021,097 1,965,928 2,041,616 1,978,763 EUR First Lien Term Loan 3.75% 382,222 453,540 286,143 296,198 289,048 307,584 USD Second Lien Term Loan 8.33% 95,000 56,632 210,000 166,453 210,000 161,524 CDN 2013 Debentures 7.50% — — — — 30,000 21,556 Total long-term debt 2,358,569 2,428,579 2,469,427 Current portion 4,990 47,750 32,889 Non-current portion 2,353,579 2,380,829 2,436,538 During the year ended December 31, 2017, the Corporation incurred the following interest on its then-outstanding long-term debt:
Effective interest rate Interest $000's
Interest Accretion
$000's
Total Interest $000's
USD First Lien Term Loan 5.54% 76,851 11,817 88,668 EUR First Lien Term Loan 4.37% 16,824 1,271 18,095 USD Second Lien Term Loan 16.05% 14,340 5,179 19,519 Total 108,015 18,267 126,282 During the year ended December 31, 2016, the Corporation incurred the following interest on its then-outstanding long-term debt:
Effective interest rate
Interest $000's
Interest Accretion
$000's
Total Interest $000's
USD First Lien Term Loan 5.71 % 95,356 7,721 103,077 EUR First Lien Term Loan 5.68 % 16,950 1,241 18,191 USD Second Lien Term Loan 13.26 % 17,082 4,929 22,011 CDN 2013 Debentures 7.50 % — 125 125 Total 129,388 14,016 143,404

44
The Corporation’s debt balance for the year ended December 31, 2017 was as follows:
Opening Balance $000's
Principal Movements
$000's
Transaction costs
$000's
Accretion $000's
Translation $000's
Total $000's
Current $000's
Long-term $000's
USD First Lien Term Loan 1,965,928 (125,442 ) (3,906 ) 11,817 — 1,848,397 7,042 1,841,355 EUR First Lien Term Loan 296,198 100,529 (829 ) 1,271 56,371 453,540 3,299 450,241 USD Second Lien Term Loan 166,453 (115,000 ) — 5,179 — 56,632 (5,351 ) 61,983 Total 2,428,579 (139,913 ) (4,735 ) 18,267 56,371 2,358,569 4,990 2,353,579 The Corporation’s debt balance for the year ended December 31, 2016 was as follows:
Opening Balance $000's
Principal Movements
$000's
Transaction costs
$000's
Accretion $000's
Translation
$000's
Total $000's
Current $000's
Long-term $000's
USD First Lien Term Loan 1,978,763 (20,587 ) — 7,752 — 1,965,928 45,848 1,920,080 EUR First Lien Term Loan 307,584 (3,204 ) — 1,241 (9,423 ) 296,198 7,512 288,686 USD Second Lien Term Loan 161,524 — — 4,929 — 166,453 (5,610 ) 172,063 CDN 2013 Debentures 21,556 (22,561 ) — — 1,005 — — — Total 2,469,427 (46,352 ) — 13,922 (8,418 ) 2,428,579 47,750 2,380,829 The principal repayments of the Corporation’s currently outstanding long-term debt over the next five years, as adjusted for revised estimates of excess cash flow allocations to the principal repayment of the First Lien Term Loans, amount to the following:
1 Year $000's
2 Years $000's
3 Years $000's
4 Years $000's
5 Years $000's
USD First Lien Term Loan 19,443 19,443 19,443 1,837,326 — EUR First Lien Term Loan 4,709 4,709 4,709 444,960 — USD Second Lien Term Loan — — — — 95,000 Total 24,152 24,152 24,152 2,282,286 95,000
(a) First and Second Lien Term Loans
On August 1, 2014, the Corporation completed the Stars Interactive Group Acquisition, which was partly financed through the issuance of long-term debt, allocated into first and second lien term loans. Giving effect to a previously disclosed refinancing in August 2015 (the “Refinancing”), and the Repricing (as defined below), as at December 31, 2017, the first lien term loans consisted of a $1.85 billion first lien term loan priced at LIBOR plus 3.50% (the “USD First Lien Term Loan”) and a €378 million seven-year first lien term loan priced at EURIBOR plus 3.75% (the “EUR First Lien Term Loan” and, together with the USD First Lien Term Loan, the “First Lien Term Loans”), with 1.00% LIBOR and 0% EURIBOR floors respectively, and each repayable on August 22, 2021. Also without giving effect to the Refinancing, Repricing and Prepayments (as defined below), as at December 31, 2017, the second lien term loan consisted of a $95 million loan priced at LIBOR plus 7.00%, with a 1.00% LIBOR floor and repayable on August 1, 2022 (the “USD Second Lien Term Loan”).
On March 3, 2017, the Corporation completed the repricing and retranching of the First Lien Term Loans and amended the applicable credit agreement (collectively, the “Repricing”). The Repricing included reducing the applicable interest rate margin on the First Lien Term Loans by 0.5% to LIBOR plus 3.5% with a LIBOR floor of 1% to EURIBOR plus 3.75% with a 0% EURIBOR floor, respectively, and retranching such loans by raising €100 million of incremental debt on the EUR First Lien Term Loan and using the proceeds to reduce the USD First Lien Term Loan by $106 million. The Corporation and the lenders also amended the credit agreement for the First Lien Term Loans to, among other things, reflect the Repricing and waive the required 2016 and 2017 excess cash flow repayments (as defined and described in the credit agreement) previously due on March 31, 2017 and March 31, 2018, respectively.
The Repricing has been accounted for as a debt modification as the terms of the amended credit agreement were not considered to be substantially different than the previous terms and as a result there was no significant impact on the carrying amount.
On August 8, 2017, and September 20, 2017, the Corporation made principal prepayments without penalty (the “Prepayments”) of $40 million and $75 million, respectively, under the USD Second Lien Term Loan using cash on its balance sheet, cash flow from operations, or a combination thereof.

45
First Lien Term Loans
Except as set forth above, the Corporation is required to allocate up to 50% of the excess cash flow of the Corporation to the principal repayment of the First Lien Term Loans. Excess cash flow is referred to as EBITDA of Stars Group Holdings B.V. on a consolidated basis for such excess cash flow period (i.e., each fiscal year commencing with the fiscal year ending on December 31, 2015), minus, without duplication, debt service, capital expenditures, permitted business acquisitions and investments, taxes paid in cash, increases in working capital, cash expenditures in respect of swap agreements, any extraordinary, unusual or nonrecurring loss, income or gain on asset dispositions, and plus, without any duplication, decreases in working capital, capital expenditures funded with the proceeds of the issuance of debt or the issuance of equity, cash payments received in respect of swap agreements, any extraordinary, unusual or nonrecurring gain realized in cash and cash interest income to the extent deducted in the computation of EBITDA.
The percentage allocated to the principal repayment can fluctuate based on the following:
• If the total secured leverage ratio at the end of the applicable excess cash flow period is less than or equal to 4.75 to 1.00 but is greater than 4.00 to 1.00, the repayments will be 25% of the excess cash flow.
• If the total secured leverage ratio at the end of the applicable excess cash flow period is less than or equal to 4.00 to 1.00, the repayment will be 0% of the excess cash flow.
The agreement for the First Lien Term Loans restricts Stars Group Holdings B.V. and its subsidiaries from, among other things, incurring additional debt or granting additional liens on its assets and equity, distributing equity interests and distributing any assets to third parties.
Second Lien Term Loan
Giving effect to the Refinancing and Prepayments, the principal balance of the USD Second Lien Term Loan decreased during the year, with $95 million outstanding at December 31, 2017. The applicable and effective interest rates are noted in the tables above.
(b) 2013 Debentures
On February 7, 2013, the Corporation closed a private placement of units, issuing and selling 30,000 units at a price of CDN $1,000 per unit for aggregate gross proceeds of CDN $30 million. Each unit consisted of certain non-convertible subordinated debentures (the “CDN 2013 Debentures”) and non-transferable Common Share purchase warrants. The CDN 2013 Debentures matured on January 31, 2016 and CDN $30 million was repaid on February 1, 2016 and the then-remaining outstanding warrants expired on January 31, 2016. As of such date, the Corporation had no further obligations under or with respect to the same. 20. CAPITAL MANAGEMENT
The Corporation’s objective in managing capital is to ensure a sufficient liquidity position to manage its business and growth objectives while maximizing return to shareholders through the optimization of debt and equity. On an ongoing basis, liquidity is necessary to finance its marketing activities, research and development activities, general and administrative expenses, working capital and overall capital expenditures.
The Corporation has historically financed its liquidity needs, primarily through borrowings, hybrid instruments and issuance of capital stock. Since the Stars Interactive Group Acquisition, the Corporation has met all its current liquidity requirements from the cash flow generated from operations.
The capital structure of the Corporation and its subsidiaries consists of net debt, which includes long-term debt, and is offset by cash balances, and total equity attributable to shareholders. The Corporation’s capital management objectives are to optimize its capital structure with a view to both deleverage existing operations and minimize dilution by focusing on, among other things, improving profitability, repaying debt and undertaking stock buy-back programs.
For additional information regarding the Corporation’s liquidity risk, see note 31. 21. DERIVATIVES
The Corporation is exposed to interest rate and currency risk. The Corporation uses derivative financial instruments for risk management purposes and anticipates that such instruments will mitigate interest rate and currency risk, as applicable. As such, any change in cash flows associated with derivative instruments is expected to be offset by changes in cash flows related to the hedged position.

46
Cash flow hedge accounting
On March 2, 2015, a subsidiary of the Corporation entered into cross-currency interest rate swap agreements (the “March 2015 Swap Agreements”). A USD notional amount of $1.74 billion was designated in cash flow hedge relationships to hedge the interest rate and foreign exchange risk of the USD First Lien Term Loan bearing a minimum floating interest rate of 5.0% (USD three-month LIBOR plus a 4.0% margin, with a LIBOR floor of 1.0%). The March 2015 Swap Agreements, which mature in August 2019, fixed the Euro to USD exchange rate at 1.1102 and fixed the Euro interest payments at an average rate of 4.6016%.
In connection with the Refinancing (see note 19), a subsidiary of the Corporation entered into two additional cross-currency interest rate swap agreements to hedge the interest rate and foreign exchange risk, effective August 12, 2015, for a USD notional amount of $325 million (the “August 2015 Swap Agreements” and together with the March 2015 Swap Agreements, the “Swap Agreements” or “CCIRS”). A portion of the August 2015 Swap Agreements (USD notional amount of $302 million) was designated in cash flow hedge relationships to hedge the interest rate and foreign exchange risk of the USD First Lien Term Loan bearing a minimum floating interest rate of 5.0% (USD three-month LIBOR plus a 4.0% margin, with a LIBOR floor of 1.0%). The August 2015 Swap Agreements, which mature in August 2019, fixed the Euro to USD exchange rate of 1.094 and fixed the Euro interest payments at an average rate of 4.657%. During the year ended December 31, 2017, the Corporation unwound and settled a notional principal amount of $616.54 million of the CCIRS for a gain of $13.9 million.
As part of the Repricing (see note 19), the Corporation reduced the applicable interest rate margin on the First Lien Term Loans by 50 basis points to LIBOR plus 350 basis points with a LIBOR floor of 100 basis points. As a result, the Corporation de-designated and re-designated the applicable hedging instruments in new hedge accounting relationships. An amount of $17.53 million was recognized as Financial expenses during the year ended December 31, 2017 relating to the amortization of the Other comprehensive income balance brought forward from the previous hedge accounting relationship.
During the year ended December 31, 2017, there was no ineffectiveness with respect to the cash flow hedge (December 31, 2016 – ineffectiveness gain of $470,000) recognized in financial expenses. At the end of 2017, there were forward contracts to sell USD and purchase a notional amount of GBP67.5 million to hedge the Corporation’s exposure to GBP expenses in 2018. These contracts have been designated as cashflow hedges. There were no equivalent contracts outstanding at the end of 2016.
During the year ended December 31, 2017, $16.58 million (December 31, 2016 - $7.75 million) was reclassified from “Reserves” to the consolidated statements of earnings as Financial expenses. The fair value of the Swap Agreements in hedging relationships included in the derivative liabilities of the Corporation as at December 31, 2017 was $111.76 million (December 31, 2016 – derivative asset of $52.04 million).
Net investment hedge accounting
During the year ended December 31, 2017 and during a portion of the year ended December 31, 2016, the Corporation designated a portion of the USD First Lien Term Loan, its entire principal amount of the USD Second Lien Term Loan and its then-outstanding deferred consideration (i.e., the deferred purchase price for the Stars Interactive Group Acquisition) as a foreign exchange hedge of its net investment in its foreign operations. Accordingly, the portion of the losses arising from the translation of the USD-denominated liabilities (net of transaction costs) that was determined to be an effective hedge during the period was recognized in other comprehensive income under the heading foreign currency translation reserve, offsetting a portion of the losses arising from translation of the Corporation’s net investment in its foreign operations.
During the years ended December 31, 2017 and December 31, 2016, there was no ineffectiveness with respect to the net investment hedge.
For the year ended December 31, 2017, the Corporation recorded an unrealized exchange loss on translation of $134.72 million (December 31, 2016 - $48.29 million) in the “Cumulative translation adjustment” in reserves related to the translation of a portion of the USD First Lien Term Loan, USD Second Lien Term Loan and the deferred consideration.
Derivative instruments without hedge accounting
At December 31, 2017, the Corporation had a series of forward foreign exchange contracts in place to protect against the translation of non-USD monetary balance sheet items. These contracts had a maturity date of January 31, 2018. As at December 31, 2016, the Corporation had a series of forward foreign exchange contracts to sell USD for Euros. These economic hedges are intended to mitigate the impact of the fluctuation of the USD to Euro exchange rates on foreign currency liabilities. The series of contracts were for the sale of $ 125.52 million for €114.34 million at a rate of $1.0978 to €1.0000 with a maturity date of March 31, 2017.

47
For the year ended December 31, 2017, the Corporation recognized a loss of $7.11 million. For the year ended December 31, 2016, the Corporation recognized a realized loss in income on forward foreign exchange contracts of $1.47 million and an unrealized loss in income of $4.92 million.
Put liabilities
In connection with the July 31, 2015 acquisition of Stars Fantasy Sports Subco, LLC (“Stars Fantasy”), which currently provides software development and related services and support to the Corporation’s BetStars brand, the Corporation granted a put option to the sellers whereby such sellers had the right, but not the obligation, to sell to the Corporation all the equity interests then held by such sellers. During the year ended December 31, 2017, the Corporation acquired the remaining equity interests from the sellers for an amount of $5.95 million. At December 31, 2016 the derivative was recorded at the present value of $5.59 million. The put option was categorized as a Level 3 within the fair value hierarchy and used a 5.7% discount rate to determine its fair value.
The following table summarizes the fair value of derivatives as at December 31, 2017 and 2016 and the change in fair value for the years ended December 31, 2017 and 2016:
Derivative Assets Forward Contracts $000's
Cross-currency interest rate swap
contracts $000's
Currency options $000's
Total $000's
Opening balance, as at January 1, 2016 4,012 9,473 — 13,485 Unrealized (loss) gain in fair value (4,012 ) 42,565 — 38,553 Total derivative asset as at December 31, 2016 — 52,038 — 52,038 Acquisition — — 906 906 Realized gain — — (375 ) (375 ) Settlement — (13,904 ) 726 (13,178 ) Unrealized gain (loss) in fair value 2,037 (38,134 ) (1,257 ) (37,354 ) Total derivative asset as at December 31, 2017 2,037 — — 2,037 Current portion 2,037 — — 2,037 Non-current portion — — — —
Derivative Liabilities Forward Contracts
$000's
Cross-currency interest rate swap
contracts $000's
Put Liability $000's
Total $000's
Opening balance, as at January 1, 2016 2,184 16,538 6,102 24,824 Unrealized loss (gain) in fair value 3,106 (16,538 ) (815 ) (14,247 ) Accretion — — 307 307 Translation (368 ) — — (368 ) Total derivative liability as at December 31, 2016 4,922 — 5,594 10,516 Unrealized (gain) loss in fair value (1,826 ) 110,855 — 109,029 Realized gain on settlement (2,829 ) — — (2,829 ) Settlement (177 ) — (5,594 ) (5,771 ) Translation (90 ) 907 — 817 Total derivative liability as at December 31, 2017 — 111,762 — 111,762 Current portion — — — — Non-current portion — 111,762 — 111,762

48
22. COMMITMENTS
The Group as Lessee
At December 31, 2017, the Corporation’s future minimum lease payments under non-cancellable operating leases and other obligations aggregate to $61.6 million and are payable as follows:
Within one year $000’s
Later than one year but not later than
5 years $000’s
More than 5 years $000’s
Rent 9,400 28,323 23,828 Other 18 — — Total 9,418 28,323 23,828 The Group as Lessor At December 31, 2017, the Corporation’s future minimum lease receipts under non-cancellable operating leases aggregate to $17.6 million and are receivable as follows;
Within one year $000’s
Later than one year but not later than
5 years $000’s
More than 5 years $000’s
Rent 1,964 7,855 7,806 Total 1,964 7,855 7,806 23. OTHER PAYABLES
The Corporation’s other payables at December 31, 2017 primarily comprise customer rewards and value-added tax (“VAT”) as described below. The customer rewards relate to the Stars Rewards cross vertical loyalty program Stars Rewards include randomized rewards, such as “Stars Coins”, which can be used to make a wide variety of purchases and entry into tournaments, in lieu of cash. The VAT payable primarily relates to a provision for VAT for prior periods which has arisen following recent engagement with the Swiss tax authority on the application of the law. As at December 31, 2017 2016 $000’s $000’s Austria gaming duty — 7,245 VAT payable 12,990 — Customer rewards 29,508 40,396 Brokerage account payable — 7,397 Bonuses payable to employees 195 1,550 Other payables 21 — Total current portion of other payable 42,714 56,588 24. PROVISIONS
The provisions in the consolidated statements of financial position include, among other items, the provision for jackpots, which are repayable in accordance with applicable terms and conditions, the provision for the then-outstanding deferred consideration primarily relating to the deferred payment for the Stars Interactive Group Acquisition and the minimum revenue guarantee or EBITDA support agreement, as applicable, in connection with the sale of WagerLogic, the Chartwell/Cryptologic Sale and the Innova Offering (see notes 4 and 12). The minimum revenue guarantee is a quarterly payment, which is not contingent on future events.

49
Deferred Consideration
The purchase price for the Stars Interactive Group Acquisition included a deferred payment of $400 million payable on February 1, 2017. The fair value of the deferred payment as at December 31, 2016 of $195.51 million was recorded in Provisions. The fair value measurement at December 31, 2016 was calculated utilizing a discounted cash flow approach using a 6% discount rate and categorized as a Level 3 within the fair value hierarchy. A 1% change in the discount rate would have impacted the value by $9.4 million. The Corporation paid the remaining balance of the deferred consideration in full during the year ended December 31, 2017.
The carrying amounts and the movements in the provisions during the year ended December 31, 2017 and 2016 are as follows:
Player bonuses
and jackpots $000’s
Deferred consideration
(*) $000’s
Minimum revenue
guarantee $000’s
Other $000’s
Total $000’s
Balance at January 1, 2016 2,688 382,728 19,395 1,087 405,898 Adjustment to provision recognized 13,885 — 5,762 4,613 24,260 Payments (15,013 ) (200,000 ) (8,998 ) (5,700 ) (229,711 ) Accretion of discount — 22,277 1,095 — 23,372 Gain on settlement of deferred consideration — (2,466 ) — — (2,466 ) Foreign exchange translation losses (gains) 11 (24 ) 382 — 369 Balance at December 31, 2016 1,571 202,515 17,636 — 221,722 Adjustment to provision recognized 48,146 (815 ) (121 ) — 47,210 Payments (44,121 ) (197,510 ) (9,311 ) — (250,942 ) Accretion of discount — 2,048 839 — 2,887 Reclassification (1,444 ) — — — (1,444 ) Foreign exchange translation losses 113 62 1,075 — 1,250 Balance at December 31, 2017 4,265 6,300 10,118 — 20,683 Current portion at December 31, 2016 1,571 202,515 8,694 — 212,780 Non-current portion at December 31, 2016 — — 8,942 — 8,942 Current portion at December 31, 2017 4,265 6,300 7,025 — 17,590 Non-current portion at December 31, 2017 — — 3,093 — 3,093 (*) Deferred consideration of $6.30 million as at December 31, 2017 was recognized on acquisition of Diamond Game and is contingent on future events. The payout of player bonuses and jackpots are dependent on when a player decides to cash out his or her winnings or deposits or when a player hits a jackpot. 25. CUSTOMER DEPOSITS
The Corporation holds customer deposits, along with winnings and any bonuses in trust accounts from which money may not be removed if it would result in a shortfall of such deposits. These deposits are included in current assets in the consolidated statements of financial position under Cash - customer deposits and Current investments – customer deposits and includes cash and short term, highly liquid investments. Customer deposits are segregated as follows: As at December 31, 2017 2016 $000's $000's Cash - customer deposits 227,098 138,225 Current investments - customer deposits 122,668 228,510 Total 349,766 366,735 Customer deposits liability 349,766 366,735 Customer deposit liabilities relate to customer deposits which are held in multiple bank and investment accounts that are segregated from those holding operational funds.

50
26. SHARE CAPITAL The authorized share capital of the Corporation consists of an unlimited number of Common Shares, with no par value, and an unlimited number of convertible preferred shares (“Preferred Shares”), with no par value, issuable in series. As at December 31, 2017, 147,947,874 shares were issued and fully paid (December 31, 2016 - 145,101,127).
Common Shares
Number
Preferred Shares
Number
Common Shares $000’s
Preferred Shares $000’s
Opening balance, as at January 1, 2016 133,426,193 1,139,249 887,015 684,385 Exercise of stock options 408,359 — 1,215 — Exercise of warrants 11,266,575 — 290,174 — Ending balance, as at December 31, 2016 145,101,127 1,139,249 1,178,404 684,385 Exercise of stock options and other equity awards 2,923,184 — 21,923 — Repurchase of Common Shares (76,437 ) — (493 ) — Ending balance, as at December 31, 2017 147,947,874 1,139,249 1,199,834 684,385 As at December 31, 2017, the Preferred Shares are convertible into 58,084,801 Common Shares (December 31, 2016 – 54,750,496). The Preferred Shares rank senior to the Common Shares with respect to amounts payable in the event of its liquidation, dissolution or winding-up. The Preferred Shares are not entitled to receive dividends and have no voting rights (or any related notice rights, including notice of shareholder meetings) except with respect to amendments to the terms of the Preferred Shares or as otherwise required under applicable laws. Each Preferred Share is convertible at the holder’s option at any time in whole or in part, initially into 41.67 Common Shares (the “Conversion Ratio”), based on an initial conversion price of CDN $24.00 per Common Share (the “Initial Conversion Price”). The Conversion Ratio will be adjusted each February 1 and August 1 by multiplying the Conversion Ratio then in effect immediately prior to such adjustment by 1.03. The Corporation may give notice to holders of Preferred Shares to force conversion (in whole or in part under certain circumstances) if the following two conditions are satisfied: (i) the closing share price of the Common Shares has been in excess of 175% of the Initial Conversion Price on any 20 trading days within a 30 consecutive day period, and (ii) except in certain circumstances, the average daily volume on any 20 trading days within the 30 consecutive day period referred to above was at least 1.75 million Common Shares. Any mandatory conversion will also be subject to specified regulatory and consent conditions.
The Preferred Shares also contain anti-dilution Conversion Ratio adjustments for certain dividends or distributions (cash, shares or otherwise), share splits, share combinations, below-market equity issuances, or rights, options or warrant issuances, tender offer or exchange offer payments, and reorganization events. In addition, upon a “fundamental change”, additional Common Shares may be issuable to holders of Preferred Shares as a premium. Under the terms of the Preferred Shares, for so long as each of GSO Capital Partners LP (“GSO”) and BlackRock Financial Management, Inc. (“BlackRock”) holds 50% or more of the Preferred Shares issued to it on August 1, 2014, the Corporation undertakes:
• not to incur indebtedness unless (i) the ratio of Consolidated Net Debt to LTM EBITDA (as each term is defined in the Corporation’s current articles) would be 6.7 to 1 or less on a pro forma basis, or (ii) such indebtedness is Permitted Debt (as defined in the Corporation’s current articles);
• not to issue equity securities ranking equal or superior to the Preferred Shares;
• not to make acquisitions that (i) individually exceed US$250.0 million, or (ii) since August 1, 2014, total US$500.0 million or more (subject to specified ordinary course of business and consent exceptions);
• (i) not to require a mandatory conversion of Preferred Shares if such mandatory conversion would require a regulatory filing or waiver for any holder of Preferred Shares in excess of that required for an institutional investor waiver in the State of New Jersey, and (ii) to notify GSO and BlackRock in writing at least 60 days prior to any action that will require a regulatory filing or waiver for any holder of Preferred Shares in excess of that required for an institutional investor waiver in New Jersey;
• to cooperate with holders of Preferred Shares in connection with anti-trust or competition filings relating to their investment in the Corporation and/or conversion of Preferred Shares;
• to maintain the listing of the Common Shares on the Nasdaq; and
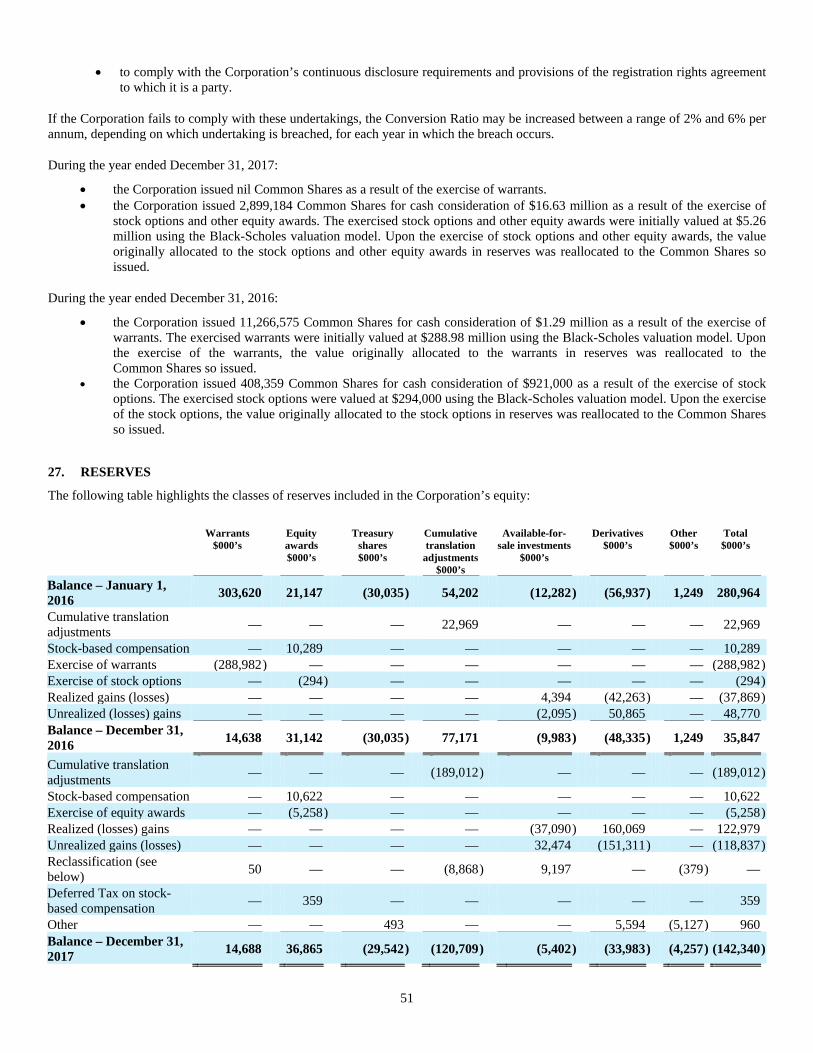
51
• to comply with the Corporation’s continuous disclosure requirements and provisions of the registration rights agreementto which it is a party.
If the Corporation fails to comply with these undertakings, the Conversion Ratio may be increased between a range of 2% and 6% per annum, depending on which undertaking is breached, for each year in which the breach occurs.
During the year ended December 31, 2017:
• the Corporation issued nil Common Shares as a result of the exercise of warrants.• the Corporation issued 2,899,184 Common Shares for cash consideration of $16.63 million as a result of the exercise of
stock options and other equity awards. The exercised stock options and other equity awards were initially valued at $5.26million using the Black-Scholes valuation model. Upon the exercise of stock options and other equity awards, the valueoriginally allocated to the stock options and other equity awards in reserves was reallocated to the Common Shares soissued.
During the year ended December 31, 2016:
• the Corporation issued 11,266,575 Common Shares for cash consideration of $1.29 million as a result of the exercise ofwarrants. The exercised warrants were initially valued at $288.98 million using the Black-Scholes valuation model. Uponthe exercise of the warrants, the value originally allocated to the warrants in reserves was reallocated to theCommon Shares so issued.
• the Corporation issued 408,359 Common Shares for cash consideration of $921,000 as a result of the exercise of stockoptions. The exercised stock options were valued at $294,000 using the Black-Scholes valuation model. Upon the exerciseof the stock options, the value originally allocated to the stock options in reserves was reallocated to the Common Sharesso issued.
27. RESERVES
The following table highlights the classes of reserves included in the Corporation’s equity:
Warrants $000’s
Equity awards $000’s
Treasury shares $000’s
Cumulative translation
adjustments $000’s
Available-for-sale investments
$000’s
Derivatives $000’s
Other $000’s
Total $000’s
Balance – January 1, 2016 303,620 21,147 (30,035 ) 54,202 (12,282 ) (56,937 ) 1,249 280,964
Cumulative translation adjustments — — — 22,969 — — — 22,969
Stock-based compensation — 10,289 — — — — — 10,289 Exercise of warrants (288,982 ) — — — — — — (288,982 ) Exercise of stock options — (294 ) — — — — — (294 ) Realized gains (losses) — — — — 4,394 (42,263 ) — (37,869 ) Unrealized (losses) gains — — — — (2,095 ) 50,865 — 48,770 Balance – December 31, 2016 14,638 31,142 (30,035 ) 77,171 (9,983 ) (48,335 ) 1,249 35,847
Cumulative translation adjustments — — — (189,012 ) — — — (189,012 )
Stock-based compensation — 10,622 — — — — — 10,622 Exercise of equity awards — (5,258 ) — — — — — (5,258 ) Realized (losses) gains — — — — (37,090 ) 160,069 — 122,979 Unrealized gains (losses) — — — — 32,474 (151,311 ) — (118,837 ) Reclassification (see below) 50 — — (8,868 ) 9,197 — (379 ) —
Deferred Tax on stock-based compensation — 359 — — — — — 359
Other — — 493 — — 5,594 (5,127 ) 960 Balance – December 31, 2017 14,688 36,865 (29,542 ) (120,709 ) (5,402 ) (33,983 ) (4,257 ) (142,340 )

52
During the year ended December 31, 2017, the principal reclassification made by the Corporation was $9.19 million from the Cumulative translation adjustments reserves to the “available-for-sale investments” reserve to correct an error in the recording of the change in valuation of the available-for-sale investments as at December 31, 2015. The reclassification in the period does not impact the Corporation’s net assets as at December 31, 2015, December 31, 2016 or December 31, 2017 or Net earnings for the years ending December 31, 2015, December 31, 2016 or December 31, 2017. There was also no impact to Total comprehensive income as reported for the year ending December 31, 2015. For the year ending December 31, 2015, the loss in fair value reported in the available-for-sale investments in Other comprehensive income of $17.02 million was overstated by $9.19 million and the unrealized foreign currency translation gain from continuing operations reported as $81.58 million was overstated by $9.19 million.
Treasury Shares Chartwell acquisition “sunset” clause The Corporation cancelled 76,437 common shares related to the acquisition of Chartwell in 2011 that were unclaimed and surrendered to the Corporation. These securities were cancelled due to the expiration of the “sunset” provisions set forth in the arrangement agreement for the purchase, which provided for the cancellation of a right of the holder to receive cash consideration, for any certificates formerly representing Chartwell shares that were not deposited with all other documents as required by the applicable plan arrangement on or before the fourth anniversary of the date of purchase. The difference between the aggregate purchase price and the book value of the reclaimed shares was accounted for in the Treasury shares account in Reserves within Equity during the first quarter of 2017. Share repurchase under 2015 Normal Course Issuer Bid (“NCIB”) On February 13, 2015, the TSX approved the Corporation’s 2015 NCIB to purchase for cancellation up to 6,644,737 common shares, representing approximately 5% of the Corporation’s issued and outstanding common shares as of January 26, 2015. The Corporation purchased and cancelled an aggregate of 1,455,300 common shares pursuant to the 2015 NCIB for an aggregate purchase price of approximately CDN $45.5 million. The 2015 NCIB terminated on February 17, 2016.
Cumulative Translation Adjustments
Exchange differences relating to the translation of the net assets of the Corporation’s foreign operations from their functional currency into the Corporation’s presentational currency are recognized directly in the Cumulative translation adjustment reserve.
Available-for-sale Investments
This reserve recognizes the realized and unrealized gain and loss movements in the available-for-sale investments that are held by the Corporation. See note 28.
Derivatives
This reserve recognizes the realized and unrealized gain and loss movements in the hedge instruments held by the Corporation. See note 28.
Stock Options
See note 2 for details on Stock Options.
The following table provides information about outstanding stock options issued under the Plans:
As at December 31, 2017 As at December 31, 2016
Number of
options
Weighted average exercise
price CDN $ Number of
options
Weighted average exercise
price CDN $ Beginning balance 10,358,475 20.54 12,000,819 20.69 Transactions during the period: Issued 202,000 18.30 65,000 20.35 Exercised (2,899,184 ) 7.47 (408,359 ) 3.01 Forfeited (785,675 ) 27.56 (1,298,985 ) 27.45 Ending balance 6,875,616 25.24 10,358,475 20.54

53
During the year ended December 31, 2017, the Corporation granted an aggregate of 202,000 stock options under the Plans.
The outstanding stock options issued under the Plans are exercisable at prices ranging from CDN$2.85 to CDN$35.30 per share and have a weighted average contractual term of 4.08 years. The weighted average share price of options exercised during the year ended December 31, 2017 was CDN$7.47 (December 31, 2016 – CDN$3.01).
A summary of exercisable options per stock option grant under the Plans is as follows:
Outstanding options Exercisable options
Exercise prices CDN $
Number of options
Weighted average
outstanding maturity
period (years)
Number of options
Exercise price
CDN $ 2.85 to 7.95 402,066 0 to 3 402,066 2.85 to 7.95
8.43 to 35.30 6,245,050 3 to 5 3,986,875 18.48 to
35.30 16.00 to 18.30 228,500 5 to 7 10,000 16 6,875,616 4.08 4,398,941 25.16 The Corporation recorded a compensation expense for the year ended December 31, 2017 of $10.6 million (December 31, 2016 – $10.29 million). As at December 31, 2017, the Corporation had $4.3 million of compensation expense related to the issuance of stock options to be recorded in future periods.
The stock options issued during the years ended December 31, 2017 and 2016 were accounted for at their grant date fair value of $579,000 and $209,000, respectively, as determined by the Black-Scholes valuation model using the following weighted-average assumptions:
2017 2016 Expected volatility 55 % 54 % Expected life 4.75 years 4.75 years Expected forfeiture rate 17 % 17 % Risk-free interest rate 1.02 % 1.07 % Dividend yield Nil Nil Weighted average share price CDN $18.30 CDN $20.35 Weighted average fair value of options at grant date CDN $4.46 CDN $4.31 The expected life of the options is estimated using the average of the vesting period and the contractual life of the options. The expected volatility is estimated based on the Corporation’s public trading history on the TSX for the last 4.75 years. Expected forfeiture rate is estimated based on a combination of historical forfeiture rates and expected turnover rates. RSUs The following table provides information about outstanding RSUs issued by the Corporation under the 2015 Equity Incentive Plan. See note 2 for details on RSUs.
2017
No. of units Weighted Average Exercise
Price Balance as at January 1, 2017 — — Issued 153,064 $22.41 Exercised (12,000 ) $21.80 Forfeited — — Balance as at December 31, 2017 141,064

54
PSUs The following table provides information about outstanding PSUs issued and potential additional PSUs issuable by the Corporation under the 2015 Equity Incentive Plan. See note 2 for details on PSUs.
2017
No. of units Weighted Average Exercise
Price Balance as at January 1, 2017 — — Issued 282,036 $22.47 Exercised — — Forfeited — — Balance as at December 31, 2017 282,036 RSs The following table provides information about outstanding RSs issued by the Corporation under the 2015 Equity Incentive Plan. See note 2 for details on RSs.
2017
No. of units Weighted Average Exercise
Price Balance as at January 1, 2017 — — Issued 12,000 $21.80 Exercised (12,000 ) $21.80 Forfeited — — Balance as at December 31, 2017 — DSUs The following table provides information about outstanding DSUs issued by the Corporation under the 2015 Equity Incentive Plan. See note 2 for details on DSUs.
2017
No. of units Weighted Average Exercise
Price Balance as at January 1, 2017 — — Issued 92,703 $15.26 Exercised — — Forfeited — — Balance as at December 31, 2017 92,703 Dividend Equivalents During the year ended December 31, 2017, no dividends were declared. Warrants The following table provides information about outstanding warrants at December 31, 2017 and 2016:
As at December 31, 2017 As at December 31, 2016
Number of warrants
Weighted average exercise
price CDN $ Number of warrants
Weighted average exercise
price CDN $ Beginning balance 4,000,000 19.17 15,274,584 5.14 Issued — — — — Exercised — — (11,273,902 ) 0.16 Expired — — (682 ) 6.25 Ending balance 4,000,000 19.17 4,000,000 19.17

55
The following table provides information about outstanding warrants per particular warrant grant:
Grant date Expiry date Number of warrants Exercise price CDN $
May 15, 2014 May 15, 2024 4,000,000 19.17 4,000,000 19.17
The warrants issued in 2014 were accounted for at their grant date fair value, as determined by the Black-Scholes valuation model using the following weighted-average assumptions:
2014 Expected volatility 60 % Expected life 10 years Expected forfeiture rate 0 % Risk-free interest rate 1.17 % Dividend yield Nil Weighted average fair value of warrants at grant date CDN $28.64 28. FAIR VALUE
The Corporation determined that the carrying values of its short-term financial assets and liabilities approximate their fair value because of the relatively short periods to maturity of these instruments and low risk of credit.
Certain of the Corporation’s financial assets and liabilities are measured at fair value at the end of each reporting period. The following table provides information about how the fair values of these financial assets and liabilities are determined as at each of December 31, 2017 and December 31, 2016:
As at December 31, 2017
Fair value & carrying
value
Level 1 Level 2 Level 3 $000’s $000’s $000’s $000’s
Funds - Available-for-sale 7,045 7,045 — — Bonds - Available-for-sale 115,343 115,343 — — Equity in private companies - Available-for-sale 6,981 — — 6,981 Equity in quoted companies - Available-for-sale 281 281 — — Total available-for-sale 129,650 122,669 — 6,981 Derivatives 2,037 — 2,037 — Total financial assets 131,687 122,669 2,037 6,981 Derivatives 111,762 — 111,762 — Total financial liabilities 111,762 — 111,762 —
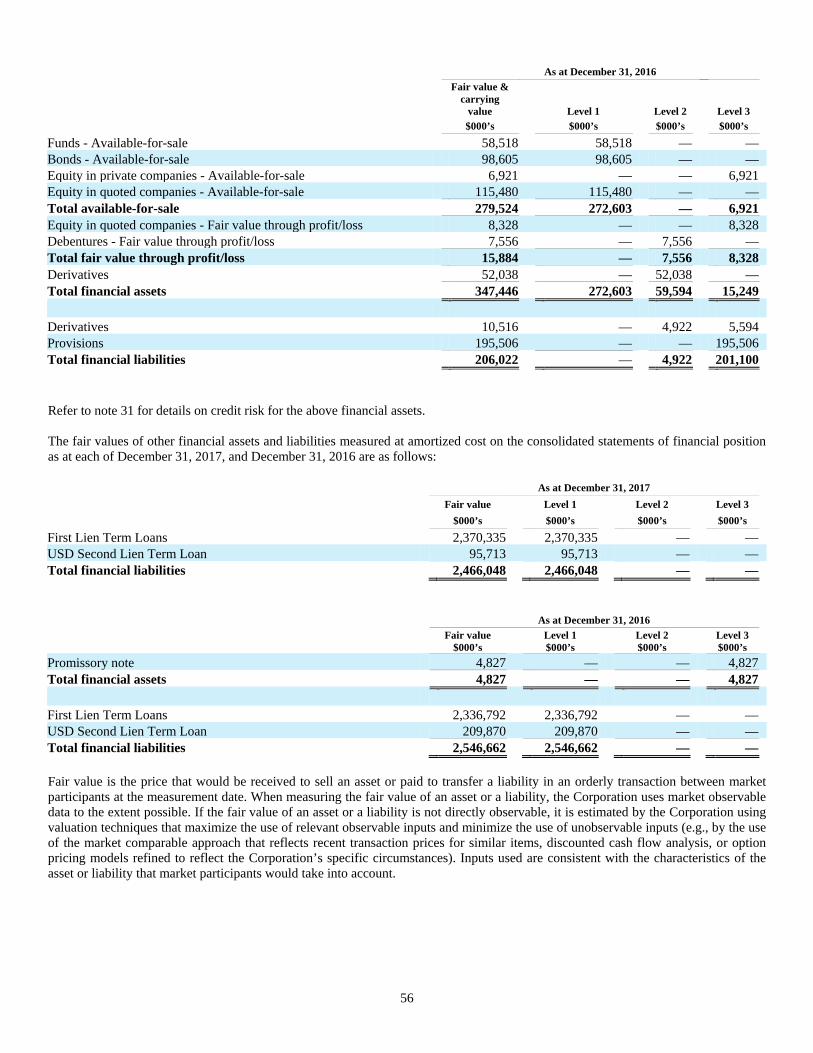
56
As at December 31, 2016
Fair value & carrying
value Level 1 Level 2 Level 3 $000’s $000’s $000’s $000’s
Funds - Available-for-sale 58,518 58,518 — — Bonds - Available-for-sale 98,605 98,605 — — Equity in private companies - Available-for-sale 6,921 — — 6,921 Equity in quoted companies - Available-for-sale 115,480 115,480 — — Total available-for-sale 279,524 272,603 — 6,921 Equity in quoted companies - Fair value through profit/loss 8,328 — — 8,328 Debentures - Fair value through profit/loss 7,556 — 7,556 — Total fair value through profit/loss 15,884 — 7,556 8,328 Derivatives 52,038 — 52,038 — Total financial assets 347,446 272,603 59,594 15,249 Derivatives 10,516 — 4,922 5,594 Provisions 195,506 — — 195,506 Total financial liabilities 206,022 — 4,922 201,100 Refer to note 31 for details on credit risk for the above financial assets. The fair values of other financial assets and liabilities measured at amortized cost on the consolidated statements of financial position as at each of December 31, 2017, and December 31, 2016 are as follows:
As at December 31, 2017
Fair value Level 1 Level 2 Level 3 $000’s $000’s $000’s $000’s
First Lien Term Loans 2,370,335 2,370,335 — — USD Second Lien Term Loan 95,713 95,713 — — Total financial liabilities 2,466,048 2,466,048 — — As at December 31, 2016
Fair value
$000’s Level 1 $000’s
Level 2 $000’s
Level 3 $000’s
Promissory note 4,827 — — 4,827 Total financial assets 4,827 — — 4,827 First Lien Term Loans 2,336,792 2,336,792 — — USD Second Lien Term Loan 209,870 209,870 — — Total financial liabilities 2,546,662 2,546,662 — — Fair value is the price that would be received to sell an asset or paid to transfer a liability in an orderly transaction between market participants at the measurement date. When measuring the fair value of an asset or a liability, the Corporation uses market observable data to the extent possible. If the fair value of an asset or a liability is not directly observable, it is estimated by the Corporation using valuation techniques that maximize the use of relevant observable inputs and minimize the use of unobservable inputs (e.g., by the use of the market comparable approach that reflects recent transaction prices for similar items, discounted cash flow analysis, or option pricing models refined to reflect the Corporation’s specific circumstances). Inputs used are consistent with the characteristics of the asset or liability that market participants would take into account.

57
For the Corporation’s financial instruments which are recognized in the consolidated statements of financial position at fair value, the fair value measurements are categorized based on the lowest level input that is significant to the fair value measurement in its entirety and the degree to which the inputs are observable. The significance levels are classified as follows in the fair value hierarchy:
• Level 1 – Quoted prices (unadjusted) in active markets for identical assets or liabilities; • Level 2 – Inputs other than quoted prices included in Level 1 that are observable for the asset or liability, either
directly or indirectly; and • Level 3 – Inputs for the asset or liability that are not based on observable market data.
Transfers between levels of the fair value hierarchy are recognized by the Corporation at the end of the reporting period during which the transfer occurred as part of its periodic review of fair values. There were transfers out of Level 3 and into Level 2 during Q3 2017 in respect of the NYX Sub Preferred Shares (see Level 3 fair value table below). Following this transfer, the Corporation sold the NYX Sub Preferred Shares as part of its disposition of all its NYX Gaming Group investments to Scientific Games during the year ended December 31, 2017 (note 7).
Valuation of Level 2 fair values
Derivative Financial Instruments
Currently, the Corporation uses cross currency swap and interest rate swap agreements to manage its interest rate and foreign currency risk and foreign currency forward and option contracts to manage foreign currency risk. The valuation of these instruments is determined using widely accepted valuation techniques including discounted cash flow analysis on the expected cash flows of each derivative. This analysis reflects the contractual terms of the derivatives, including the period to maturity, and uses observable market-based inputs, including interest rate curves, spot and forward rates, as well as option volatility. To comply with the provisions of IFRS 13, Fair value measurement, the Corporation incorporates credit valuation adjustments to appropriately reflect both its own non-performance risk and the respective counterparty’s non-performance risk in the fair value measurements. In adjusting the fair value of its derivative contracts for the effect of non-performance risk, the Corporation has considered the impact of netting and any applicable credit enhancements, such as collateral postings, thresholds, mutual puts, and guarantees. Although the Corporation has determined that the majority of the inputs used to value its derivatives fall within Level 2 (excluding, as at December 31, 2016, the put option in relation to Stars Fantasy) of the fair value hierarchy, the credit valuation adjustments associated with its derivatives utilize Level 3 inputs, such as estimates of current credit spreads to evaluate the likelihood of default by itself and its counterparties. However, as of December 31, 2017 and December 31, 2016, the Corporation has assessed the significance of the impact of the credit valuation adjustments on the overall valuation of its derivative positions and has determined that the credit valuation adjustments are not significant to the overall valuation of its derivatives. As a result, the Corporation has determined that its derivative valuations in their entirety are classified in Level 2 of the fair value hierarchy. The put option in relation to Stars Fantasy, previously classified as Level 3 in the fair value hierarchy, was settled during the year end December 31, 2017. NYX Sub Preferred Shares The Corporation changed its valuation methodology for the NYX Sub Preferred Shares from a binomial valuation approach to a net present value approach using a discount rate of 2.3%, during the period ended September 30, 2017, based on the offer price from Scientific Games. Prior to this the investment was classified as a Level 3 financial asset (2016: Level 3 financial asset). The Corporation disposed of all its investments in NYX Gaming Group during the period ended December 31, 2017 (see note 13).

58
Reconciliation of Level 3 fair values
Some of the Corporation’s financial assets and liabilities are classified as Level 3 of the fair value hierarchy because the respective fair value determinations use inputs that are not based on observable market data. As at December 31, 2016 and December 31, 2017, for each Level 3 asset or liability the valuation techniques and key inputs used by the Corporation were as follows:
- Equity in private companies (Level 3 Asset): Given the nature of the investee’s business, there is no readily available market data to carry an extensive valuation. The Corporation assesses for impairment on an annual basis using latest management budgets, long-term revenue growth rates and pre-tax operating margins.
- Promissory note (Level 3 Promissory note): The Corporation received the full balance of the Promissory note during the year ended December 31, 2017 (2016 – 11.3% discount rate).
- Deferred consideration (Level 3 Liability): The Corporation paid the remaining balance of the deferred consideration for the Stars Interactive Group Acquisition in full during the year ended December 31, 2017. See also note 24.
- Stars Fantasy put option (Level 3 Liability): The option was exercised during the year ended December 31, 2017. See also note 21.
- Innova EBITDA support agreement (Level 3 Liability): As previously disclosed, in connection with the Innova Offering, the Corporation entered into an EBITDA support agreement with Innova. The Corporation uses a net present value approach for the Innova EBITDA support agreement using a 5.7% discount rate (2016 – 5.7% discount rate). The higher the discount rate, the lower the fair value. If the discount rate was 3.9% higher/lower while all other variables were held constant, the carrying amount would decrease/increase by CDN$0.1 million. See also note 24.
- Licensing Agreement (Level 3 Liability): As previously disclosed, in connection with the Chartwell/Cryptologic Sale, a subsidiary of the Corporation entered into the Licensing Agreement. The Corporation uses a net present value approach for the Licensing Agreement using a 5.7% discount rate, 9% revenue share percentage and long-term revenue forecast (2016 – 5.7% and 9% respectively). The higher the discount rate, the lower the fair value. If the discount rate was 3.9% higher/lower while all other variables were held constant, the carrying amount would decrease/increase by CDN$0.15 million. See also note 13.
The following table shows a reconciliation from opening balances to the closing balances for Level 3 fair values:
Level 3 Asset Level 3 Promissory
note $000’s $000’s
Balance – January 1, 2016 27,679 7,700 Loss included in gain (loss) from investments (14,124 ) — Interest and accretion included in income from investments and financial expenses — 888 Purchases 11,754 — Sales (2,566 ) — Reclassification 501 — Conversion of Level 3 instruments (8,377 ) — Loss on settlement — (3,761 ) Unrealized gain included in other comprehensive income 382 — Balance – December 31, 2016 15,249 4,827 Gain included in income from investments (398 ) — Interest accretion included in financial expenses — 256 Gain on settlement — 3,001 Settlement of promissory note — (8,084 ) Unrealized gain included in other comprehensive income 656 — NYX Sub Preferred Shares transfer out of Level 3 (see notes above) (8,526 ) — Balance – December 31, 2017 6,981 —
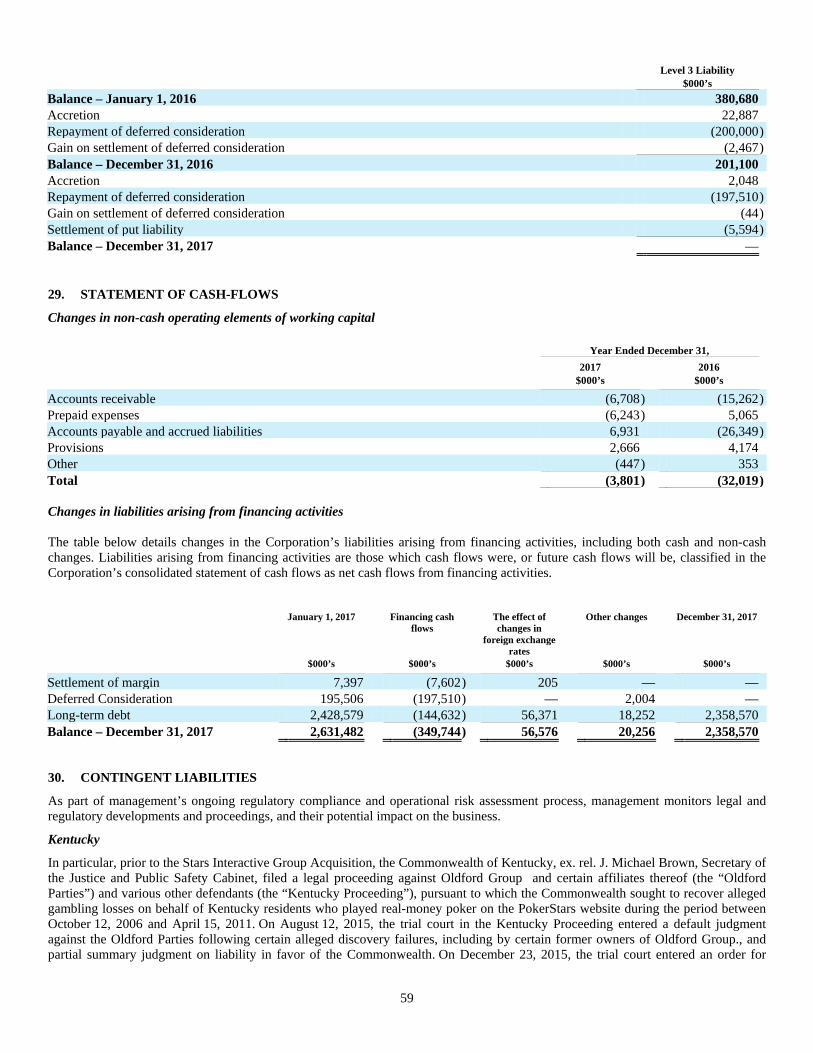
59
Level 3 Liability $000’s
Balance – January 1, 2016 380,680 Accretion 22,887 Repayment of deferred consideration (200,000 ) Gain on settlement of deferred consideration (2,467 ) Balance – December 31, 2016 201,100 Accretion 2,048 Repayment of deferred consideration (197,510 ) Gain on settlement of deferred consideration (44 ) Settlement of put liability (5,594 ) Balance – December 31, 2017 — 29. STATEMENT OF CASH-FLOWS
Changes in non-cash operating elements of working capital
Year Ended December 31, 2017 2016 $000’s $000’s
Accounts receivable (6,708 ) (15,262 ) Prepaid expenses (6,243 ) 5,065 Accounts payable and accrued liabilities 6,931 (26,349 ) Provisions 2,666 4,174 Other (447 ) 353 Total (3,801 ) (32,019 ) Changes in liabilities arising from financing activities The table below details changes in the Corporation’s liabilities arising from financing activities, including both cash and non-cash changes. Liabilities arising from financing activities are those which cash flows were, or future cash flows will be, classified in the Corporation’s consolidated statement of cash flows as net cash flows from financing activities.
January 1, 2017 Financing cash flows
The effect of changes in
foreign exchange rates
Other changes
December 31, 2017
$000’s $000’s $000’s $000’s $000’s
Settlement of margin 7,397 (7,602 ) 205 — — Deferred Consideration 195,506 (197,510 ) — 2,004 — Long-term debt 2,428,579 (144,632 ) 56,371 18,252 2,358,570 Balance – December 31, 2017 2,631,482 (349,744 ) 56,576 20,256 2,358,570 30. CONTINGENT LIABILITIES
As part of management’s ongoing regulatory compliance and operational risk assessment process, management monitors legal and regulatory developments and proceedings, and their potential impact on the business.
Kentucky
In particular, prior to the Stars Interactive Group Acquisition, the Commonwealth of Kentucky, ex. rel. J. Michael Brown, Secretary of the Justice and Public Safety Cabinet, filed a legal proceeding against Oldford Group and certain affiliates thereof (the “Oldford Parties”) and various other defendants (the “Kentucky Proceeding”), pursuant to which the Commonwealth sought to recover alleged gambling losses on behalf of Kentucky residents who played real-money poker on the PokerStars website during the period between October 12, 2006 and April 15, 2011. On August 12, 2015, the trial court in the Kentucky Proceeding entered a default judgment against the Oldford Parties following certain alleged discovery failures, including by certain former owners of Oldford Group., and partial summary judgment on liability in favor of the Commonwealth. On December 23, 2015, the trial court entered an order for

60
damages in the amount of approximately $290 million, which the trial court trebled to approximately $870 million. The Corporation believes the action is frivolous and will vigorously dispute the liability and therefore no provision has been recorded regarding this matter. The Corporation, through certain subsidiaries, has filed a notice of appeal to the Kentucky Court of Appeals and posted a $100 million supersedeas bond to stay enforcement of the order for damages during the pendency of the appeals process, which the Corporation continues to pursue. The posting of the bond required the delivery of cash collateral in the amount of $40 million and letters of credit in the aggregate amount of $30 million Kentucky Bond Collateral, thereby reducing the availability under the Credit Facility to $70 million as of the date hereof. To the extent the Oldford Parties may be ultimately obligated to pay any amounts pursuant to a final adjudication following exhaustion of all appeals and other legal options, the Corporation intends to seek recovery against the former owners of Oldford Group Ltd. There can be no assurance that the Corporation will be successful in its defense or that any such amounts will be recovered or reimbursed by the former owners of the Oldford Group or otherwise.
In addition, there are also two currently pending class action complaints (one in the State of New Jersey, United States and one in Quebec, Canada) against the Corporation and certain other defendants, each of which were filed during the year ended December 31, 2016 and generally allege, among other things, that the Corporation violated certain securities laws by misrepresenting or failing to disclose information related to the charges made by the Autorité des marchés financiers against the former Chief Executive Officer (the Quebec class action also alleges that the Corporation did not properly disclose that it had inadequate or ineffective internal controls and that one or more of its directors and its former Chief Executive Officer were in breach of its Code of Business Conduct). The class actions seek damages stemming from losses that the plaintiffs claim to have suffered as a result of the foregoing. The Corporation believes that the class actions are without merit and intends to vigorously defend itself against them; however, there can be no assurance that the Corporation will be successful in its defense. No provision has been recorded regarding these matters.
Given the nature of the legal and regulatory landscape of the industry in which it operates, from time to time the Corporation has also received notices, communications and legal actions from regulatory authorities in various jurisdictions and other parties in respect of its activities. The Corporation has taken legal advice as to the manner in which it should respond and the likelihood of success of such actions. Based on this advice and the nature of the actions, no provisions have been recorded with respect to any such legal or regulatory notices, communications or actions for the year ended December 31, 2017. 31. FINANCIAL INSTRUMENTS
Foreign Exchange Risk
As at December 31, 2017, the Corporation’s significant foreign exchange currency exposure on its financial instruments by currency was as follows (in U.S. dollar equivalents):
CDN EUR GBP $000’s $000’s $000’s
Cash 12,735 94,674 6,655 Restricted cash — 925 — Available-for-sale investments — 7,460 — Accounts receivable 8,519 48,207 9,594 Derivatives 6 (176 ) 2,308 Accounts payable and accrued liabilities (12,247 ) (37,126 ) (24,816 ) Other payables (21 ) (8,192 ) — Long-term debt — (445,322 ) — Derivatives — (111,762 ) — Customer deposits (1,984 ) (75,416 ) (6,360 ) The table below details the effect on earnings before tax of a 10% strengthening or weakening of the USD exchange rate at the balance sheet date for balance sheet items denominated in CDN, EUR and GBP:
10% Strengthening
(weakening) Currency $000’s CDN 701 EUR (52,673 ) GBP (1,262 )

61
The table below details the effect on equity of a 10% strengthening or weakening of the EUR:USD exchange rate on the cross currency interest rate swaps that hedge the USD First Lien Term Loan. 10% is the sensitivity rate used when reporting foreign currency risk internally to key management personnel and represents management’s assessment of the reasonably possible change in foreign exchange rates.
Equity $000's
Equity $000's
- 10% + 10% EUR:USD exchange rate (121,958 ) 110,871
Interest Rate Risk
The Corporation’s exposure to changes in interest rates (particularly, fluctuations in LIBOR) relates primarily to interest paid on the Corporation’s long-term indebtedness, as well as the interest earned on and market value of its cash and available-for-sale investments. The Corporation is also exposed to fair value interest rate risk with respect to its USD First Lien Term Loan, which it attempts to mitigate by hedging through the Swap Agreements that fix the interest rate on the same. The Corporation is also exposed to cash flow interest rate risk on the unhedged elements of the USD First Lien Term Loan, the EUR First Lien Term Loan and the USD Second Lien Term Loan which bear interest at variable rates.
The table below details the effect on earnings before tax of a 100 basis points strengthening or weakening of the LIBOR and EURIBOR interest rates on these loans. 100 basis points sensitivity is the sensitivity rate used when reporting interest rate risk internally to key management personnel and represents management’s assessment of the reasonably possible change in interest rates:
Net earnings (loss)
$000's - 100 bps + 100 bps LIBOR 1,751 (9,200 ) EURIBOR — (3,388 )
The USD First Lien Term Loan and the USD Second Lien Term Loan each have a floor of 1.00% for the LIBOR and as such, the interest rate cannot decrease below 4.50% and 8.00% respectively. The EUR First Lien Term Loan has a floor of 0% for the EURIBOR and as such, the interest rate cannot decrease below 3.75%. Management monitors movements in the interest rates by reviewing the EURIBOR and LIBOR on a quarterly basis.
The table below details the effect on equity of a 100 basis points strengthening or weakening of the LIBOR and EURIBOR interest rates on the valuations of the cross currency swaps that hedge the USD First Lien Term Loan. 100 basis points is the sensitivity rate used when reporting interest rate risk internally to key management personnel and represents management’s assessment of the reasonably possible change in interest rates:
Equity $000's
- 100 bps + 100 bps LIBOR 18,665 (18,256 ) EURIBOR (5,778 ) 3,480 Credit Risk
Credit risk refers to the risk that a counterparty will default on its contractual obligations resulting in financial loss to the Corporation. The Corporation has adopted a policy of only dealing with creditworthy counterparties and obtaining sufficient collateral where appropriate, as a means of mitigating the risk of financial loss from defaults. The Corporation’s policy is to transact wherever possible with investment grade counterparties. This information is supplied by independent rating agencies where available, and if not available, the Corporation uses other publicly available financial information and its own trading records to rate its major customers. The Corporation’s exposure and the credit ratings of its counterparties are continuously monitored and the aggregate value of transactions concluded is spread amongst approved counterparties. Credit exposure is managed by the Corporation’s treasury and finance groups in accordance with the Corporation’s treasury investment policy, which was approved by the Corporation’s Audit Committee.
Trade receivables consist of a large number of customers, spread across geographical areas. Ongoing credit evaluation is performed on the financial condition of accounts receivable.

62
The Stars Group does not have any significant credit risk exposure to any single counterparty or any group of counterparties having similar characteristics. The Stars Group defines counterparties as having similar characteristics if they are related entities.
The credit risk on banks, available-for-sale investments and derivative financial instruments is limited because the counterparties are banks with high credit-ratings assigned by international credit-rating agencies. The Corporation’s treasury investment policy and related strategy is focused on the preservation of capital and supporting its liquidity requirements, not on generating trading profits.
Trade receivables include amounts that are past due at the end of the reporting period for which the Corporation has not recognized an allowance for doubtful debts because there has not been a significant change in credit quality and the amounts are still considered recoverable.
Age of receivables that are past due but not impaired: As at December 31,
2017 2016 $000’s $000’s
Past due less than 181 days 1,707 217 Past due more than 181 days 879 163 Total 2,586 380
The allowance for doubtful accounts is $166,000 as at December 31, 2017 (December 31, 2016 – $309,000).
Age of impaired trade receivables: As at December 31,
2017 2016 $000’s $000’s
Past due less than 181 days — — Past due more than 181 days 166 309 Total past due 166 309
Liquidity Risk
Liquidity risk is the Corporation’s ability to meet its financial obligations when they come due. The Corporation is exposed to liquidity risk with respect to its contractual obligations and financial liabilities. The Corporation manages liquidity risk by continuously monitoring forecasted and actual cash flows and matching maturity profiles of financial assets and liabilities. The Corporation’s objective is to maintain a balance between continuity of funding and flexibility through borrowing facilities available through the Corporation’s banks and other lenders. The Corporation’s policy is to seek to ensure adequate funding is available from operations, established lending facilities and other sources, including the debt and equity capital markets, as required.
The Corporation’s principal sources of liquidity are its cash generated from operations and certain other currently available funds. Currently available funds consist primarily of cash on deposit with banks and available-for-sale investments, which are comprised primarily of certain highly liquid, short-term investments, including debt securities and funds. Generally, following the Stars Interactive Group Acquisition, the Corporation’s working capital needs are minimal over the year as the gaming business requires customers to deposit funds prior to playing or participating in its real-money product offerings. The Corporation believes that such deposits are typically converted to revenue efficiently and on a timely basis such that operating expenditures are sufficiently covered. Management is also of the opinion that investing is a key element necessary for the continued growth of the Corporation’s customer base and the future development of new and innovative products and services. Based on the Corporation’s currently available funds, funds available from the Credit Facility and its ability to access the debt and equity capital markets, if necessary, management believes that the Corporation will have the cash resources necessary to satisfy current obligations and working capital needs, and fund currently planned development activities and other capital expenditures for at least the next 12 months. Notwithstanding, as a result of, among other things, the state of capital markets and the Corporation’s ability to access them on favorable terms, if at all, micro and macro-economic downturns, and contractions of the Corporation’s operations may influence its ability to liquidate its available-for-sale investments or otherwise secure the capital resources required to satisfy current or future obligations (including, without limitation, those set forth below) and fund future projects, strategic initiatives and support growth.
Customer deposit liabilities relate to customer deposits which are held in multiple bank accounts and highly liquid investments which are segregated from those holding operational funds. These deposits are included in current assets in the consolidated statements of financial position under Cash and cash equivalents – customer deposits and Current investments – customer deposits (see note 25).

63
The following table provides information about the terms of the Corporation’s financial obligations and liabilities:
On Less than 1 2 to 5 Greater than demand year years 5 years $000’s $000’s $000’s $000’s
Accounts payable and accrued liabilities 101,169 48,496 1,808 — Other payables 42,498 216 — — Customer deposits 349,766 — — — Derivatives — — 111,762 — Provisions — 17,590 3,093 — Long-term debt* — 150,026 2,752,467 — Total 493,433 216,328 2,869,130 — * Includes principal and interest 32. RELATED PARTY TRANSACTIONS
Key management of the Corporation includes the members of the Board, the Chief Executive Officer, Chief Financial Officer, Chief Technology Officer, Executive Vice-President and Chief Legal Officer, and certain other key members, which include certain members of management of the Corporation’s subsidiaries.
The compensation of such key management for the years ended December 31, 2017 and 2016 included the following:
Year Ended December 31, 2017 2016 $000’s $000’s Salaries, bonuses and short-term employee benefits 4,514 5,559 Director retainers 729 1,316 Stock-based payments 3,799 2,245 9,042 9,120 The remuneration of the Chief Executive Officer, Chief Financial Officer, Chief Technology Officer, Chief Operating Officer, Chief Corporate Development Officer, Executive Vice-President and Chief Legal Officer consists primarily of a salary, cash bonuses and share-based awards. Director retainers include both retainers, committee fees and share-based awards. 33. SUBSEQUENT EVENTS As previously disclosed on February 27, 2018, to further diversify the Corporation’s business geographically and expand its online sports betting product offerings, it acquired a 62% equity interest in CrownBet Holdings Pty Limited (“CrownBet”), an Australian-based online sportsbook, from Crown Resorts Limited for an aggregate amount of $117.7 million using cash on its consolidated statement of financial position. On March 6, 2018, the Corporation also entered into agreements to increase its equity interest in CrownBet from 62% to 80% and for CrownBet to acquire William Hill Australia Holdings Pty Ltd, (“William Hill Australia”), an Australian-based online sportsbook. The aggregate purchase price for both transactions will be approximately $315 million, of which $234 million will be payable in cash for William Hill Australia and the remainder will be payable in approximately 3.1 million newly-issued Common Shares. The management team of CrownBet will be entitled to an additional payment of up to $182 million in 2020 subject to certain performance conditions and payable in cash, additional Common Shares or a combination thereof, at the Corporation’s discretion. To finance the cash portion of the purchase price for the transactions, the Corporation obtained committed financing for a $325 million incremental USD First Lien Term Loan. The Corporation currently expects the transactions to close in April 2018. Under the transaction agreements, the Corporation is entitled to appoint a majority of the directors on the board of directors of CrownBet. Due to the proximity of the Corporation’s acquisition of a majority equity interest in CrownBet and its entering into agreements to increase its equity interest in CrownBet and for CrownBet to acquire William Hill Australia, to the approval of the Corporation’s consolidated financial statements for the year ended December 31, 2017, it is not possible for the Corporation to complete the initial accounting for such transactions, including disclosure details of goodwill, fair value of consideration (actual and contingent), assets and liabilities assumed, contingent liabilities recognized, transactions recognized separately, non-controlling interests and the impact on the amounts reported in the statement of comprehensive income.

64