Embed Size (px)
Citation preview
KARVY’s
August, 2016
INVESTOR JOURNAL
www.karvyvalue.com
What’s InsideMarket Review
Page 01
Karvy Investment InsightPage 03
Fund of The MonthPage 04
Readers CornerPage 05
Story of The MonthPage 06
SIP PerformancePage 07
Category Average ReturnsPage 08
Fixed Deposits SchemesPage 09
Equity Funds PerformancePage 10
Debt Funds PerformancePage 11
Global Markets at a GlancePage 12
Indices WatchPage 13
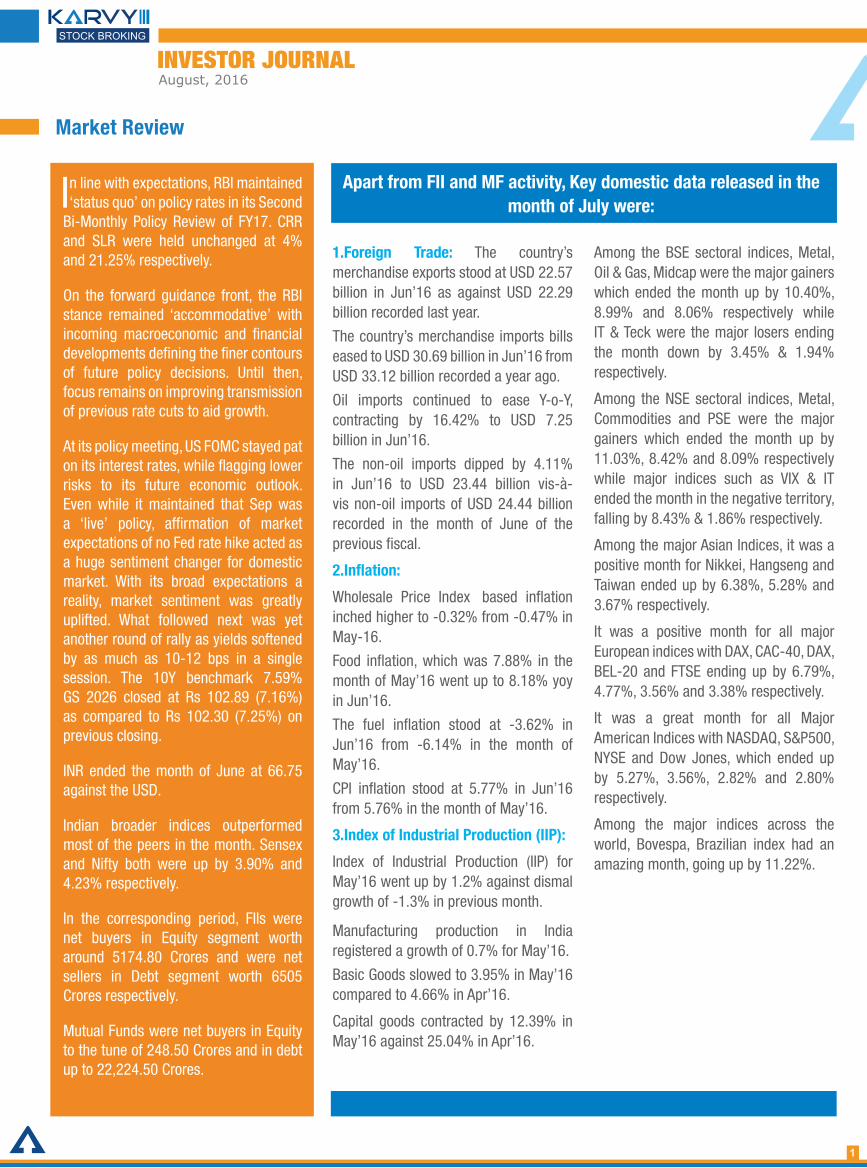
Highlights of the Month » Close on the heels of the 7th Pay Commission recommendations being
approved by the Union Cabinet, Government employees could soon have the option to invest up to 75 per cent of their contributions to the National Pension System (NPS) in equities. This would be a five-fold jump in the maximum equity exposure allowed for government NPS. Existing investment guidelines for government employees mandate investment in equity to a maximum of 15 per cent with the floor level set at 5 per cent. The rest has to be invested in fixed-income securities including government securities and corporate bonds.
» Equity mutual fund schemes, which attract higher commissions, had a record net inflow of nearly Rs 75,000 crore in 2015-16. Most of this money came through systematic investment plans, considered a long-term asset.
» Gold continued its dream run in 2016 getting boost from global uncertainties post-Brexit. The yellow metal surged to its highest point since March 2014 to touch $1,371.40 an ounce in global markets, thereby registering gains of nearly 30 per cent from the $1060 levels it traded in early January, 2016. This week gold prices in domestic markets touched Rs 31,050 per 10 grams touching its 28-month high.
» It was a month of IPOs with 3 of them getting listed on the D-Street. Quess Corp listed at a premium of 59%, L&T Infotech listed at 1.75% discount and Advanced Enzyme technologies listed at 35% premium.
» Month of July saw equity markets deliver about 4.9% return.. This month has been a rewarding one for Debt too with 10 Yr benchmark rallying by ~30 bps over the period. As guided early in the July, the aggressive duration stance did see some moderation but our funds largely remained in the top quartile of their respective peer groups.
» The International Monetary Fund (IMF) marginally trimmed its India growth forecast by 0.1 percentage point to 7.4% in FY17-FY18 on slack investment recovery, even as it modestly lowered global economic growth projections for 2016 and 2017 too, owing to downside risks from Brexit.
» Individual foreign investors can now hold up to 15 per cent stake in Indian stock exchanges, up from the earlier 5 per cent. A decision to this effect was taken by the Union Cabinet. Currently, foreign investors, in aggregate, can hold up to 49 per cent stake in any stock or commodity exchange.
KARVY’sINVESTOR JOURNAL
Fund of the MonthRELIANCE REG SAVINGS FUND-EQUITY PLAN(G)
The primary investment objective of this option
is to seek capital appreciation and or to generate...August, 2016
Page 04
INVESTOR JOURNALAugust, 2016
Market Review
In line with expectations, RBI maintained ‘status quo’ on policy rates in its Second
Bi-Monthly Policy Review of FY17. CRR and SLR were held unchanged at 4% and 21.25% respectively.
On the forward guidance front, the RBI stance remained ‘accommodative’ with incoming macroeconomic and financial developments defining the finer contours of future policy decisions. Until then, focus remains on improving transmission of previous rate cuts to aid growth.
At its policy meeting, US FOMC stayed pat on its interest rates, while flagging lower risks to its future economic outlook. Even while it maintained that Sep was a ‘live’ policy, affirmation of market expectations of no Fed rate hike acted as a huge sentiment changer for domestic market. With its broad expectations a reality, market sentiment was greatly uplifted. What followed next was yet another round of rally as yields softened by as much as 10-12 bps in a single session. The 10Y benchmark 7.59% GS 2026 closed at Rs 102.89 (7.16%) as compared to Rs 102.30 (7.25%) on previous closing.
INR ended the month of June at 66.75 against the USD.
Indian broader indices outperformed most of the peers in the month. Sensex and Nifty both were up by 3.90% and 4.23% respectively.
In the corresponding period, FIIs were net buyers in Equity segment worth around 5174.80 Crores and were net sellers in Debt segment worth 6505 Crores respectively.
Mutual Funds were net buyers in Equity to the tune of 248.50 Crores and in debt up to 22,224.50 Crores.
1.Foreign Trade: The country’s merchandise exports stood at USD 22.57 billion in Jun’16 as against USD 22.29 billion recorded last year.
The country’s merchandise imports bills eased to USD 30.69 billion in Jun’16 from USD 33.12 billion recorded a year ago.
Oil imports continued to ease Y-o-Y, contracting by 16.42% to USD 7.25 billion in Jun’16.
The non-oil imports dipped by 4.11% in Jun’16 to USD 23.44 billion vis-à-vis non-oil imports of USD 24.44 billion recorded in the month of June of the previous fiscal.
2.Inflation:
Wholesale Price Index‐ based inflation inched higher to -0.32% from -0.47% in May-16.
Food inflation, which was 7.88% in the month of May’16 went up to 8.18% yoy in Jun’16.
The fuel inflation stood at -3.62% in Jun’16 from -6.14% in the month of May’16.
CPI inflation stood at 5.77% in Jun’16 from 5.76% in the month of May’16.
3.Index of Industrial Production (IIP):
Index of Industrial Production (IIP) for May’16 went up by 1.2% against dismal growth of -1.3% in previous month.
Manufacturing production in India registered a growth of 0.7% for May’16.
Basic Goods slowed to 3.95% in May’16 compared to 4.66% in Apr’16.
Capital goods contracted by 12.39% in May’16 against 25.04% in Apr’16.
Among the BSE sectoral indices, Metal, Oil & Gas, Midcap were the major gainers which ended the month up by 10.40%, 8.99% and 8.06% respectively while IT & Teck were the major losers ending the month down by 3.45% & 1.94% respectively.
Among the NSE sectoral indices, Metal, Commodities and PSE were the major gainers which ended the month up by 11.03%, 8.42% and 8.09% respectively while major indices such as VIX & IT ended the month in the negative territory, falling by 8.43% & 1.86% respectively.
Among the major Asian Indices, it was a positive month for Nikkei, Hangseng and Taiwan ended up by 6.38%, 5.28% and 3.67% respectively.
It was a positive month for all major European indices with DAX, CAC-40, DAX, BEL-20 and FTSE ending up by 6.79%, 4.77%, 3.56% and 3.38% respectively.
It was a great month for all Major American Indices with NASDAQ, S&P500, NYSE and Dow Jones, which ended up by 5.27%, 3.56%, 2.82% and 2.80% respectively.
Among the major indices across the world, Bovespa, Brazilian index had an amazing month, going up by 11.22%.
Apart from FII and MF activity, Key domestic data released in the month of July were:
1
INVESTOR JOURNALAugust, 2016
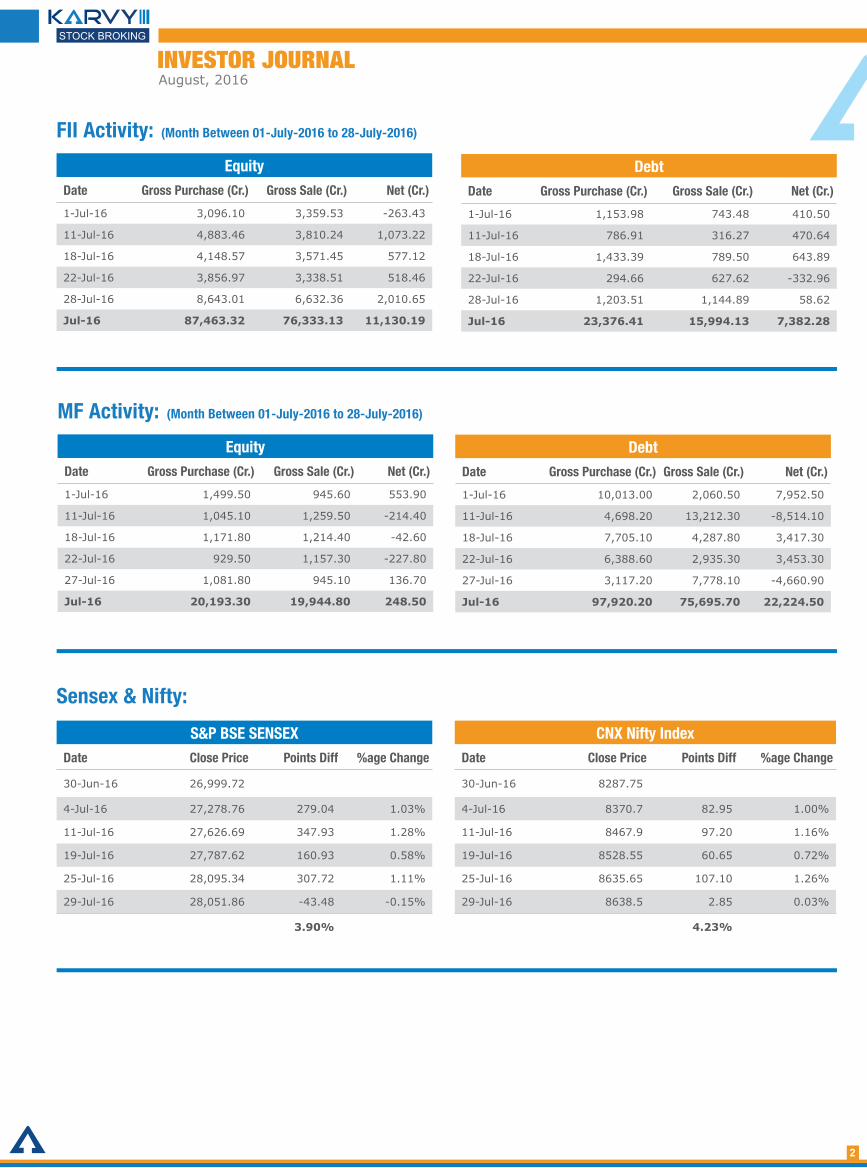
S&P BSE SENSEXDate Close Price Points Diff %age Change
30-Jun-16 26,999.72
4-Jul-16 27,278.76 279.04 1.03%
11-Jul-16 27,626.69 347.93 1.28%
19-Jul-16 27,787.62 160.93 0.58%
25-Jul-16 28,095.34 307.72 1.11%
29-Jul-16 28,051.86 -43.48 -0.15%
3.90%
CNX Nifty IndexDate Close Price Points Diff %age Change
30-Jun-16 8287.75
4-Jul-16 8370.7 82.95 1.00%
11-Jul-16 8467.9 97.20 1.16%
19-Jul-16 8528.55 60.65 0.72%
25-Jul-16 8635.65 107.10 1.26%
29-Jul-16 8638.5 2.85 0.03%
4.23%
Sensex & Nifty:
MF Activity: (Month Between 01-July-2016 to 28-July-2016)
EquityDate Gross Purchase (Cr.) Gross Sale (Cr.) Net (Cr.)
1-Jul-16 1,499.50 945.60 553.90
11-Jul-16 1,045.10 1,259.50 -214.40
18-Jul-16 1,171.80 1,214.40 -42.60
22-Jul-16 929.50 1,157.30 -227.80
27-Jul-16 1,081.80 945.10 136.70
Jul-16 20,193.30 19,944.80 248.50
DebtDate Gross Purchase (Cr.) Gross Sale (Cr.) Net (Cr.)
1-Jul-16 10,013.00 2,060.50 7,952.50
11-Jul-16 4,698.20 13,212.30 -8,514.10
18-Jul-16 7,705.10 4,287.80 3,417.30
22-Jul-16 6,388.60 2,935.30 3,453.30
27-Jul-16 3,117.20 7,778.10 -4,660.90
Jul-16 97,920.20 75,695.70 22,224.50
2
FII Activity: (Month Between 01-July-2016 to 28-July-2016)
EquityDate Gross Purchase (Cr.) Gross Sale (Cr.) Net (Cr.)
1-Jul-16 3,096.10 3,359.53 -263.43
11-Jul-16 4,883.46 3,810.24 1,073.22
18-Jul-16 4,148.57 3,571.45 577.12
22-Jul-16 3,856.97 3,338.51 518.46
28-Jul-16 8,643.01 6,632.36 2,010.65
Jul-16 87,463.32 76,333.13 11,130.19
DebtDate Gross Purchase (Cr.) Gross Sale (Cr.) Net (Cr.)
1-Jul-16 1,153.98 743.48 410.50
11-Jul-16 786.91 316.27 470.64
18-Jul-16 1,433.39 789.50 643.89
22-Jul-16 294.66 627.62 -332.96
28-Jul-16 1,203.51 1,144.89 58.62
Jul-16 23,376.41 15,994.13 7,382.28
INVESTOR JOURNALAugust, 2016
3
Karvy Investment Insight
Peace of mind and Wealth Creation ideas for long term
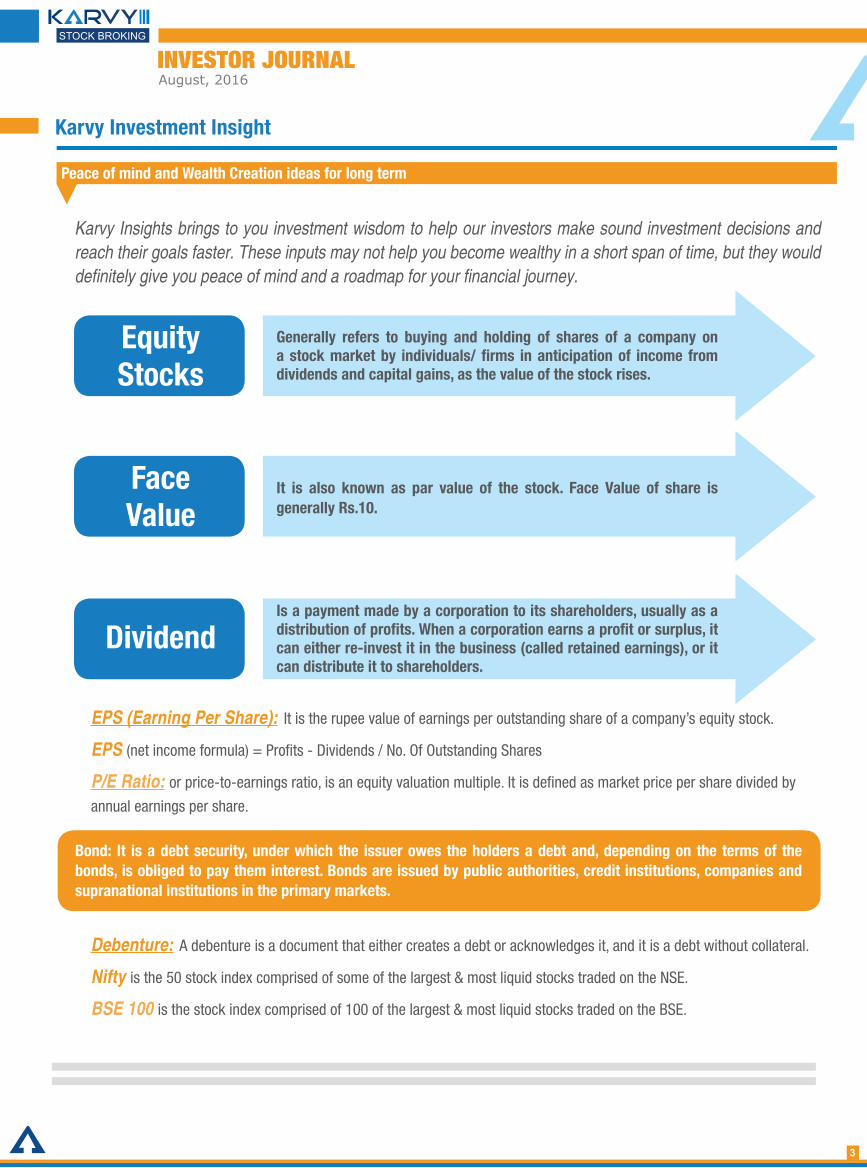
Karvy Insights brings to you investment wisdom to help our investors make sound investment decisions and reach their goals faster. These inputs may not help you become wealthy in a short span of time, but they would definitely give you peace of mind and a roadmap for your financial journey.
Bond: It is a debt security, under which the issuer owes the holders a debt and, depending on the terms of the bonds, is obliged to pay them interest. Bonds are issued by public authorities, credit institutions, companies and supranational institutions in the primary markets.
EPS (Earning Per Share): It is the rupee value of earnings per outstanding share of a company’s equity stock.
EPS (net income formula) = Profits - Dividends / No. Of Outstanding Shares
P/E Ratio: or price-to-earnings ratio, is an equity valuation multiple. It is defined as market price per share divided by
annual earnings per share.
Equity Stocks
Generally refers to buying and holding of shares of a company on a stock market by individuals/ firms in anticipation of income from dividends and capital gains, as the value of the stock rises.
Face Value
It is also known as par value of the stock. Face Value of share is generally Rs.10.
DividendIs a payment made by a corporation to its shareholders, usually as a distribution of profits. When a corporation earns a profit or surplus, it can either re-invest it in the business (called retained earnings), or it can distribute it to shareholders.
Debenture: A debenture is a document that either creates a debt or acknowledges it, and it is a debt without collateral.
Nifty is the 50 stock index comprised of some of the largest & most liquid stocks traded on the NSE.
BSE 100 is the stock index comprised of 100 of the largest & most liquid stocks traded on the BSE.
INVESTOR JOURNALAugust, 2016
4
India in sweet spot?Good monsoon, Brexit Blues behind, low oil. Things to watch US interest rates, GST, Fcnr redemption. Achhe din for real?
- Uday Kotak @udaykotak
Luck has a peculiar habit of favoring those who don’t depend on it. ~Author Unknown
- sandip sabharwal@sandipsabharwal
Govt continues to b active on oil sector ;have allowed kerosene prices
to go up by 25 paise every month till 2017 end .. fiscal + Ve
- A Balasubramanian @MFBALA
‘Tweets’ of the Month
Fund of The Month
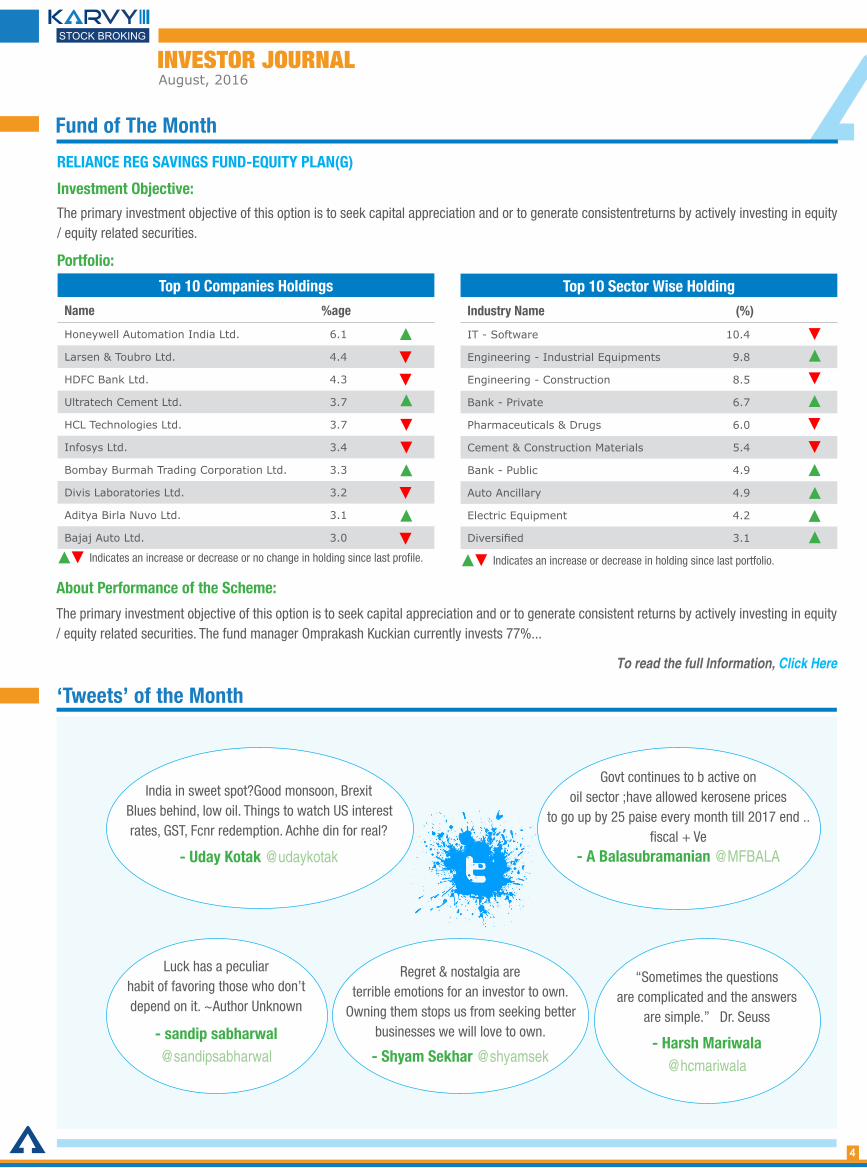
RELIANCE REG SAVINGS FUND-EQUITY PLAN(G)
Investment Objective:
The primary investment objective of this option is to seek capital appreciation and or to generate consistentreturns by actively investing in equity / equity related securities.
Portfolio:
Top 10 Companies Holdings
Name %age
Honeywell Automation India Ltd. 6.1
Larsen & Toubro Ltd. 4.4
HDFC Bank Ltd. 4.3
Ultratech Cement Ltd. 3.7
HCL Technologies Ltd. 3.7
Infosys Ltd. 3.4
Bombay Burmah Trading Corporation Ltd. 3.3
Divis Laboratories Ltd. 3.2
Aditya Birla Nuvo Ltd. 3.1
Bajaj Auto Ltd. 3.0
Top 10 Sector Wise Holding
Industry Name (%)
IT - Software 10.4
Engineering - Industrial Equipments 9.8
Engineering - Construction 8.5
Bank - Private 6.7
Pharmaceuticals & Drugs 6.0
Cement & Construction Materials 5.4
Bank - Public 4.9
Auto Ancillary 4.9
Electric Equipment 4.2
Diversified 3.1
To read the full Information, Click Here
About Performance of the Scheme:
The primary investment objective of this option is to seek capital appreciation and or to generate consistent returns by actively investing in equity / equity related securities. The fund manager Omprakash Kuckian currently invests 77%...
Indicates an increase or decrease or no change in holding since last profile. Indicates an increase or decrease in holding since last portfolio.
Regret & nostalgia are terrible emotions for an investor to own.
Owning them stops us from seeking better businesses we will love to own.
- Shyam Sekhar @shyamsek
“Sometimes the questions are complicated and the answers
are simple.” ‐ Dr. Seuss
- Harsh Mariwala@hcmariwala
INVESTOR JOURNALAugust, 2016
Readers Corner
MUTUAL FUNDS VS STOCKS – WHO WINS THE RACE?
Mutual Funds vs. Direct Equity – Who wins the Race?
Is a direct foray into the stock markets preferable over investing in mutual funds? The answer probably lies in the investor’s capabilities. For instance, when we talk about wealth-creating stocks, blue-chip names, such as TCS, Reliance, Infosys, Wipro, etc come to mind. While they have managed to garner great returns in the past 20 odd years, how many investors would have spotted these winners right at the beginning? Not too many, we suppose...
1) Behavioral Science
A critical element in successful investing is “how you react to feelings of both discomfort during the market’s fear cycle and invincibility when markets are booming,” writes Marty Leclerc in an article in the Forbes magazine...
2) Investing in top companies
Anyone would love to invest in top companies such as MRF Ltd, Eicher Motors or Bosch...
3) Investing regularly in small amounts
It is not quite easy investing small amounts in the same stock every month, quarter or year...
4) Professional Management
We had discussed on how tough it would have been for the common investor to identify an Infosys, Wipro or TCS at the beginning?...
To read the full Article, Click Here
5

INVESTOR JOURNALAugust, 2016
Story of The Month
Little Lucy was preparing fresh lime water for the first time. While preparing it, she ended up adding five times the lemon juice amount than what was required.
The result was a disaster. It was so sour that no one could even take one sip of it. She went to her mother and said, “Mom, I think I added extra lemon juice. Could you please suggest how I could remove it so that my fresh lime water can taste good.”
The mother smiled and told her “There is no way that anyone can remove the extra lemon juice from the water.”
Lucy felt very disappointed.
FRESH LIME WATER
Sometimes we do things which cannot be undone. When we cannot undo things, we should not waste more time over it. It would be like trying to remove lemon juice from lime water. We should get busy in adding so many right things in our life; positive thoughts, actions, people.
We all made mistakes in our life and have bitter memories but we can get busy making and adding happy memories now. We should try to do a lot of good things and concentrate on making life more positive today.
The mother saw this and told her, “Lucy, you do not have to feel bad. You can rectify the fresh lime water by adding four more glasses of water to the already made lime water. This will dilute the lemon juice to make five glasses of fresh lime water.”
MORAL OF THE STORY:
Courtesy : Karvy Learning Center
Direct Dil Se…
6
INVESTOR JOURNALAugust, 2016
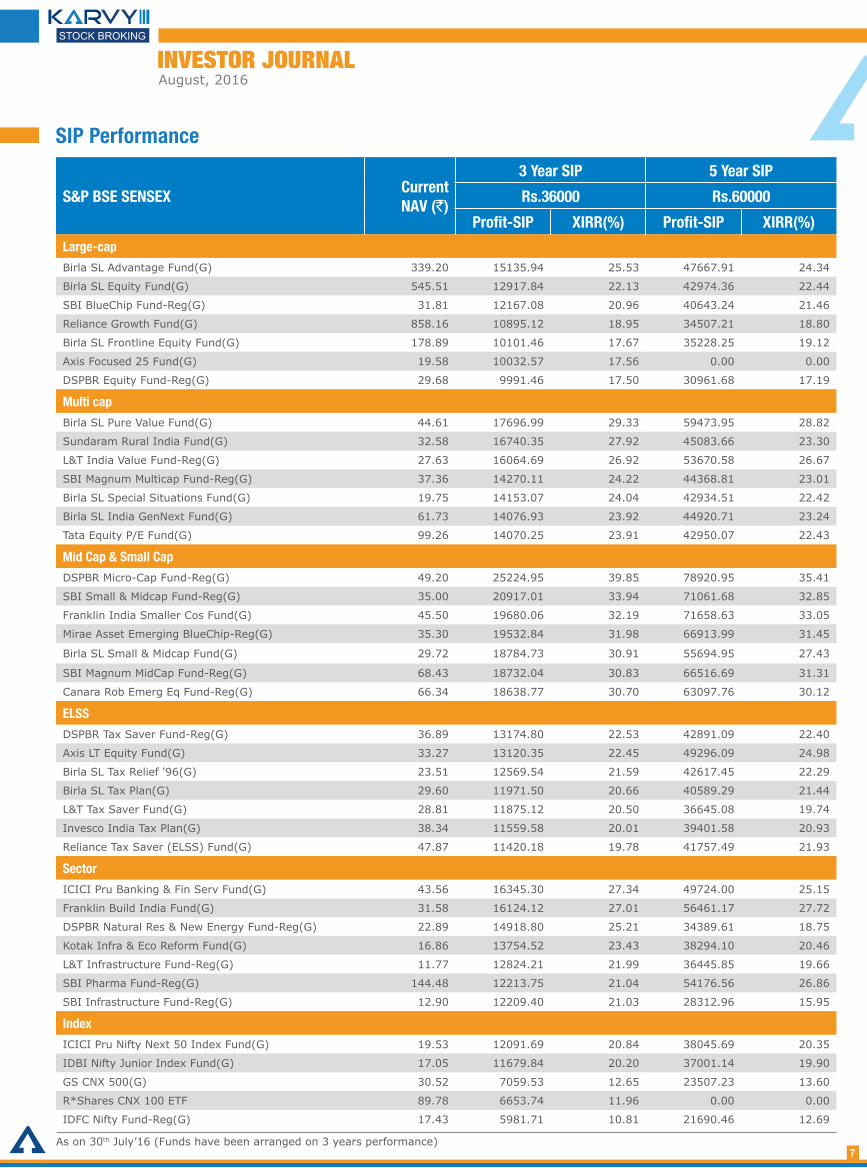
SIP Performance
S&P BSE SENSEXCurrent NAV (`)
3 Year SIP 5 Year SIP
Rs.36000 Rs.60000
Profit-SIP XIRR(%) Profit-SIP XIRR(%)Large-cap
Birla SL Advantage Fund(G) 339.20 15135.94 25.53 47667.91 24.34
Birla SL Equity Fund(G) 545.51 12917.84 22.13 42974.36 22.44
SBI BlueChip Fund-Reg(G) 31.81 12167.08 20.96 40643.24 21.46
Reliance Growth Fund(G) 858.16 10895.12 18.95 34507.21 18.80
Birla SL Frontline Equity Fund(G) 178.89 10101.46 17.67 35228.25 19.12
Axis Focused 25 Fund(G) 19.58 10032.57 17.56 0.00 0.00
DSPBR Equity Fund-Reg(G) 29.68 9991.46 17.50 30961.68 17.19
Multi cap
Birla SL Pure Value Fund(G) 44.61 17696.99 29.33 59473.95 28.82
Sundaram Rural India Fund(G) 32.58 16740.35 27.92 45083.66 23.30
L&T India Value Fund-Reg(G) 27.63 16064.69 26.92 53670.58 26.67
SBI Magnum Multicap Fund-Reg(G) 37.36 14270.11 24.22 44368.81 23.01
Birla SL Special Situations Fund(G) 19.75 14153.07 24.04 42934.51 22.42
Birla SL India GenNext Fund(G) 61.73 14076.93 23.92 44920.71 23.24
Tata Equity P/E Fund(G) 99.26 14070.25 23.91 42950.07 22.43
Mid Cap & Small Cap
DSPBR Micro-Cap Fund-Reg(G) 49.20 25224.95 39.85 78920.95 35.41
SBI Small & Midcap Fund-Reg(G) 35.00 20917.01 33.94 71061.68 32.85
Franklin India Smaller Cos Fund(G) 45.50 19680.06 32.19 71658.63 33.05
Mirae Asset Emerging BlueChip-Reg(G) 35.30 19532.84 31.98 66913.99 31.45
Birla SL Small & Midcap Fund(G) 29.72 18784.73 30.91 55694.95 27.43
SBI Magnum MidCap Fund-Reg(G) 68.43 18732.04 30.83 66516.69 31.31
Canara Rob Emerg Eq Fund-Reg(G) 66.34 18638.77 30.70 63097.76 30.12
ELSS
DSPBR Tax Saver Fund-Reg(G) 36.89 13174.80 22.53 42891.09 22.40
Axis LT Equity Fund(G) 33.27 13120.35 22.45 49296.09 24.98
Birla SL Tax Relief '96(G) 23.51 12569.54 21.59 42617.45 22.29
Birla SL Tax Plan(G) 29.60 11971.50 20.66 40589.29 21.44
L&T Tax Saver Fund(G) 28.81 11875.12 20.50 36645.08 19.74
Invesco India Tax Plan(G) 38.34 11559.58 20.01 39401.58 20.93
Reliance Tax Saver (ELSS) Fund(G) 47.87 11420.18 19.78 41757.49 21.93
Sector
ICICI Pru Banking & Fin Serv Fund(G) 43.56 16345.30 27.34 49724.00 25.15
Franklin Build India Fund(G) 31.58 16124.12 27.01 56461.17 27.72
DSPBR Natural Res & New Energy Fund-Reg(G) 22.89 14918.80 25.21 34389.61 18.75
Kotak Infra & Eco Reform Fund(G) 16.86 13754.52 23.43 38294.10 20.46
L&T Infrastructure Fund-Reg(G) 11.77 12824.21 21.99 36445.85 19.66
SBI Pharma Fund-Reg(G) 144.48 12213.75 21.04 54176.56 26.86
SBI Infrastructure Fund-Reg(G) 12.90 12209.40 21.03 28312.96 15.95
Index
ICICI Pru Nifty Next 50 Index Fund(G) 19.53 12091.69 20.84 38045.69 20.35
IDBI Nifty Junior Index Fund(G) 17.05 11679.84 20.20 37001.14 19.90
GS CNX 500(G) 30.52 7059.53 12.65 23507.23 13.60
R*Shares CNX 100 ETF 89.78 6653.74 11.96 0.00 0.00
IDFC Nifty Fund-Reg(G) 17.43 5981.71 10.81 21690.46 12.69
As on 30th July’16 (Funds have been arranged on 3 years performance)7
INVESTOR JOURNALAugust, 2016
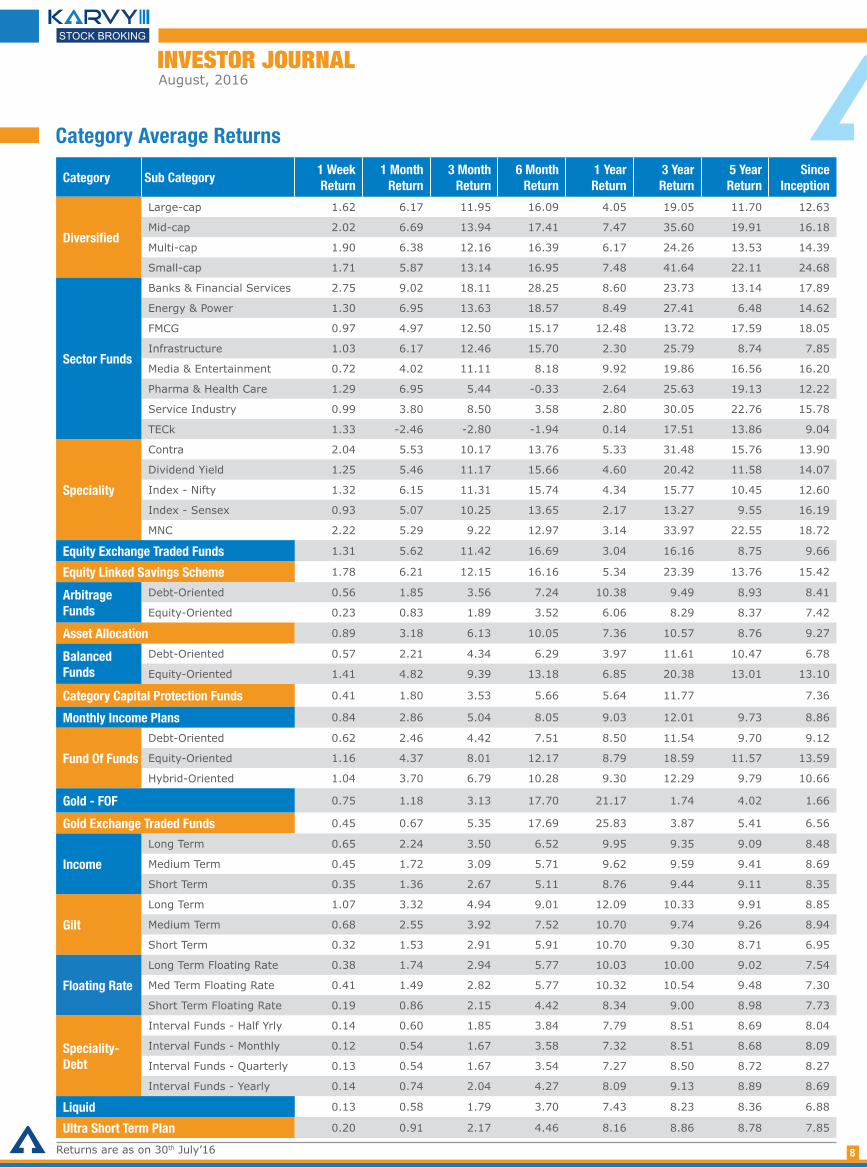
Category Average Returns
Category Sub Category1 Week Return
1 Month Return
3 Month Return
6 Month Return
1 Year Return
3 Year Return
5 Year Return
Since Inception
Diversified
Large-cap 1.62 6.17 11.95 16.09 4.05 19.05 11.70 12.63
Mid-cap 2.02 6.69 13.94 17.41 7.47 35.60 19.91 16.18
Multi-cap 1.90 6.38 12.16 16.39 6.17 24.26 13.53 14.39
Small-cap 1.71 5.87 13.14 16.95 7.48 41.64 22.11 24.68
Sector Funds
Banks & Financial Services 2.75 9.02 18.11 28.25 8.60 23.73 13.14 17.89
Energy & Power 1.30 6.95 13.63 18.57 8.49 27.41 6.48 14.62
FMCG 0.97 4.97 12.50 15.17 12.48 13.72 17.59 18.05
Infrastructure 1.03 6.17 12.46 15.70 2.30 25.79 8.74 7.85
Media & Entertainment 0.72 4.02 11.11 8.18 9.92 19.86 16.56 16.20
Pharma & Health Care 1.29 6.95 5.44 -0.33 2.64 25.63 19.13 12.22
Service Industry 0.99 3.80 8.50 3.58 2.80 30.05 22.76 15.78
TECk 1.33 -2.46 -2.80 -1.94 0.14 17.51 13.86 9.04
Speciality
Contra 2.04 5.53 10.17 13.76 5.33 31.48 15.76 13.90
Dividend Yield 1.25 5.46 11.17 15.66 4.60 20.42 11.58 14.07
Index - Nifty 1.32 6.15 11.31 15.74 4.34 15.77 10.45 12.60
Index - Sensex 0.93 5.07 10.25 13.65 2.17 13.27 9.55 16.19
MNC 2.22 5.29 9.22 12.97 3.14 33.97 22.55 18.72
Equity Exchange Traded Funds 1.31 5.62 11.42 16.69 3.04 16.16 8.75 9.66
Equity Linked Savings Scheme 1.78 6.21 12.15 16.16 5.34 23.39 13.76 15.42
Arbitrage Funds
Debt-Oriented 0.56 1.85 3.56 7.24 10.38 9.49 8.93 8.41
Equity-Oriented 0.23 0.83 1.89 3.52 6.06 8.29 8.37 7.42
Asset Allocation 0.89 3.18 6.13 10.05 7.36 10.57 8.76 9.27
Balanced Funds
Debt-Oriented 0.57 2.21 4.34 6.29 3.97 11.61 10.47 6.78
Equity-Oriented 1.41 4.82 9.39 13.18 6.85 20.38 13.01 13.10
Category Capital Protection Funds 0.41 1.80 3.53 5.66 5.64 11.77 7.36
Monthly Income Plans 0.84 2.86 5.04 8.05 9.03 12.01 9.73 8.86
Fund Of Funds
Debt-Oriented 0.62 2.46 4.42 7.51 8.50 11.54 9.70 9.12
Equity-Oriented 1.16 4.37 8.01 12.17 8.79 18.59 11.57 13.59
Hybrid-Oriented 1.04 3.70 6.79 10.28 9.30 12.29 9.79 10.66
Gold - FOF 0.75 1.18 3.13 17.70 21.17 1.74 4.02 1.66
Gold Exchange Traded Funds 0.45 0.67 5.35 17.69 25.83 3.87 5.41 6.56
Income
Long Term 0.65 2.24 3.50 6.52 9.95 9.35 9.09 8.48
Medium Term 0.45 1.72 3.09 5.71 9.62 9.59 9.41 8.69
Short Term 0.35 1.36 2.67 5.11 8.76 9.44 9.11 8.35
Gilt
Long Term 1.07 3.32 4.94 9.01 12.09 10.33 9.91 8.85
Medium Term 0.68 2.55 3.92 7.52 10.70 9.74 9.26 8.94
Short Term 0.32 1.53 2.91 5.91 10.70 9.30 8.71 6.95
Floating Rate
Long Term Floating Rate 0.38 1.74 2.94 5.77 10.03 10.00 9.02 7.54
Med Term Floating Rate 0.41 1.49 2.82 5.77 10.32 10.54 9.48 7.30
Short Term Floating Rate 0.19 0.86 2.15 4.42 8.34 9.00 8.98 7.73
Speciality-Debt
Interval Funds - Half Yrly 0.14 0.60 1.85 3.84 7.79 8.51 8.69 8.04
Interval Funds - Monthly 0.12 0.54 1.67 3.58 7.32 8.51 8.68 8.09
Interval Funds - Quarterly 0.13 0.54 1.67 3.54 7.27 8.50 8.72 8.27
Interval Funds - Yearly 0.14 0.74 2.04 4.27 8.09 9.13 8.89 8.69
Liquid 0.13 0.58 1.79 3.70 7.43 8.23 8.36 6.88
Ultra Short Term Plan 0.20 0.91 2.17 4.46 8.16 8.86 8.78 7.85
Returns are as on 30th July’16 8
INVESTOR JOURNALAugust, 2016
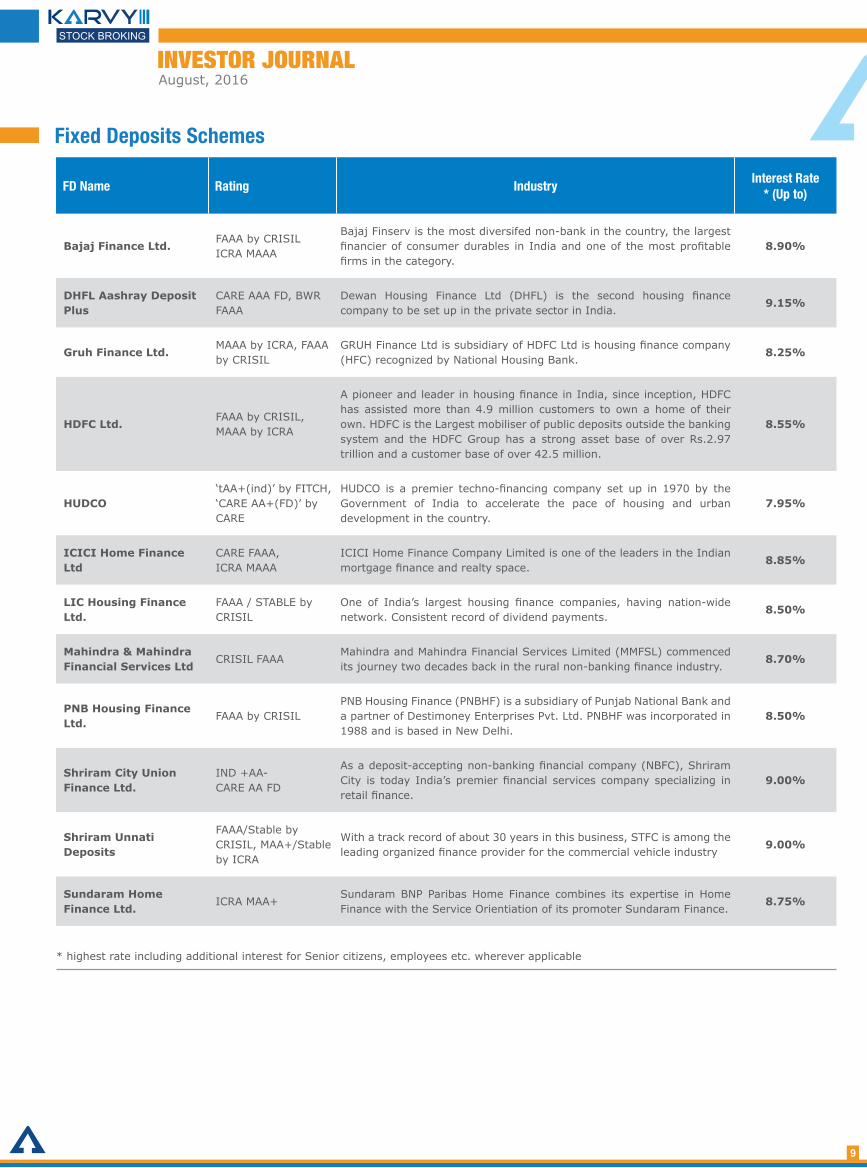
Fixed Deposits Schemes
FD Name Rating IndustryInterest Rate
* (Up to)
Bajaj Finance Ltd.FAAA by CRISILICRA MAAA
Bajaj Finserv is the most diversifed non-bank in the country, the largest financier of consumer durables in India and one of the most profitable firms in the category.
8.90%
DHFL Aashray DepositPlus
CARE AAA FD, BWR FAAA
Dewan Housing Finance Ltd (DHFL) is the second housing finance company to be set up in the private sector in India.
9.15%
Gruh Finance Ltd.MAAA by ICRA, FAAAby CRISIL
GRUH Finance Ltd is subsidiary of HDFC Ltd is housing finance company (HFC) recognized by National Housing Bank.
8.25%
HDFC Ltd.FAAA by CRISIL, MAAA by ICRA
A pioneer and leader in housing finance in India, since inception, HDFC has assisted more than 4.9 million customers to own a home of their own. HDFC is the Largest mobiliser of public deposits outside the banking system and the HDFC Group has a strong asset base of over Rs.2.97 trillion and a customer base of over 42.5 million.
8.55%
HUDCO‘tAA+(ind)’ by FITCH, ‘CARE AA+(FD)’ by CARE
HUDCO is a premier techno-financing company set up in 1970 by the Government of India to accelerate the pace of housing and urban development in the country.
7.95%
ICICI Home Finance Ltd
CARE FAAA, ICRA MAAA
ICICI Home Finance Company Limited is one of the leaders in the Indian mortgage finance and realty space.
8.85%
LIC Housing Finance Ltd.
FAAA / STABLE by CRISIL
One of India’s largest housing finance companies, having nation-wide network. Consistent record of dividend payments.
8.50%
Mahindra & Mahindra Financial Services Ltd
CRISIL FAAAMahindra and Mahindra Financial Services Limited (MMFSL) commenced its journey two decades back in the rural non-banking finance industry.
8.70%
PNB Housing Finance Ltd.
FAAA by CRISILPNB Housing Finance (PNBHF) is a subsidiary of Punjab National Bank and a partner of Destimoney Enterprises Pvt. Ltd. PNBHF was incorporated in 1988 and is based in New Delhi.
8.50%
Shriram City Union Finance Ltd.
IND +AA- CARE AA FD
As a deposit-accepting non-banking financial company (NBFC), Shriram City is today India’s premier financial services company specializing in retail finance.
9.00%
Shriram Unnati Deposits
FAAA/Stable by CRISIL, MAA+/Stable by ICRA
With a track record of about 30 years in this business, STFC is among the leading organized finance provider for the commercial vehicle industry
9.00%
Sundaram Home Finance Ltd.
ICRA MAA+Sundaram BNP Paribas Home Finance combines its expertise in Home Finance with the Service Orientiation of its promoter Sundaram Finance.
8.75%
* highest rate including additional interest for Senior citizens, employees etc. wherever applicable
9
INVESTOR JOURNALAugust, 2016
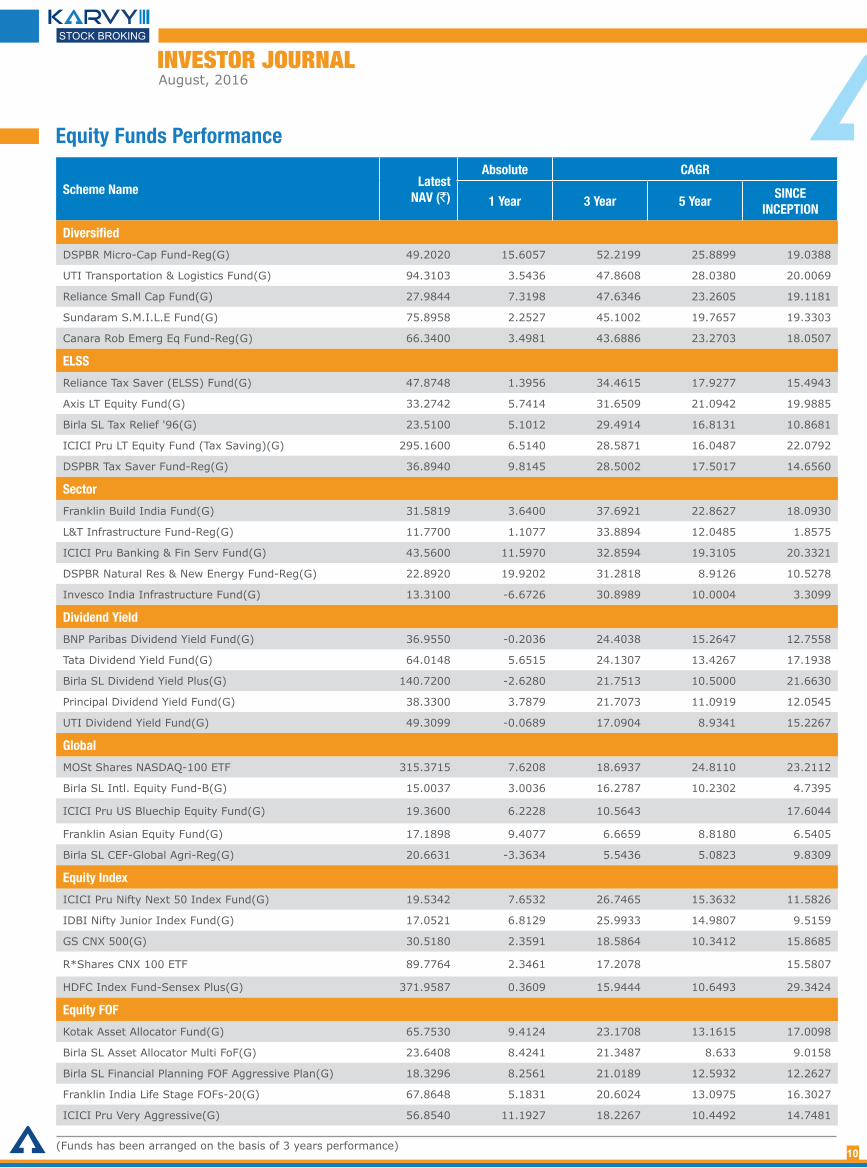
Equity Funds Performance
Scheme NameLatest
NAV (`)
Absolute CAGR
1 Year 3 Year 5 YearSINCE
INCEPTION
Diversified
DSPBR Micro-Cap Fund-Reg(G) 49.2020 15.6057 52.2199 25.8899 19.0388
UTI Transportation & Logistics Fund(G) 94.3103 3.5436 47.8608 28.0380 20.0069
Reliance Small Cap Fund(G) 27.9844 7.3198 47.6346 23.2605 19.1181
Sundaram S.M.I.L.E Fund(G) 75.8958 2.2527 45.1002 19.7657 19.3303
Canara Rob Emerg Eq Fund-Reg(G) 66.3400 3.4981 43.6886 23.2703 18.0507
ELSS
Reliance Tax Saver (ELSS) Fund(G) 47.8748 1.3956 34.4615 17.9277 15.4943
Axis LT Equity Fund(G) 33.2742 5.7414 31.6509 21.0942 19.9885
Birla SL Tax Relief '96(G) 23.5100 5.1012 29.4914 16.8131 10.8681
ICICI Pru LT Equity Fund (Tax Saving)(G) 295.1600 6.5140 28.5871 16.0487 22.0792
DSPBR Tax Saver Fund-Reg(G) 36.8940 9.8145 28.5002 17.5017 14.6560
Sector
Franklin Build India Fund(G) 31.5819 3.6400 37.6921 22.8627 18.0930
L&T Infrastructure Fund-Reg(G) 11.7700 1.1077 33.8894 12.0485 1.8575
ICICI Pru Banking & Fin Serv Fund(G) 43.5600 11.5970 32.8594 19.3105 20.3321
DSPBR Natural Res & New Energy Fund-Reg(G) 22.8920 19.9202 31.2818 8.9126 10.5278
Invesco India Infrastructure Fund(G) 13.3100 -6.6726 30.8989 10.0004 3.3099
Dividend Yield
BNP Paribas Dividend Yield Fund(G) 36.9550 -0.2036 24.4038 15.2647 12.7558
Tata Dividend Yield Fund(G) 64.0148 5.6515 24.1307 13.4267 17.1938
Birla SL Dividend Yield Plus(G) 140.7200 -2.6280 21.7513 10.5000 21.6630
Principal Dividend Yield Fund(G) 38.3300 3.7879 21.7073 11.0919 12.0545
UTI Dividend Yield Fund(G) 49.3099 -0.0689 17.0904 8.9341 15.2267
Global
MOSt Shares NASDAQ-100 ETF 315.3715 7.6208 18.6937 24.8110 23.2112
Birla SL Intl. Equity Fund-B(G) 15.0037 3.0036 16.2787 10.2302 4.7395
ICICI Pru US Bluechip Equity Fund(G) 19.3600 6.2228 10.5643 17.6044
Franklin Asian Equity Fund(G) 17.1898 9.4077 6.6659 8.8180 6.5405
Birla SL CEF-Global Agri-Reg(G) 20.6631 -3.3634 5.5436 5.0823 9.8309
Equity Index
ICICI Pru Nifty Next 50 Index Fund(G) 19.5342 7.6532 26.7465 15.3632 11.5826
IDBI Nifty Junior Index Fund(G) 17.0521 6.8129 25.9933 14.9807 9.5159
GS CNX 500(G) 30.5180 2.3591 18.5864 10.3412 15.8685
R*Shares CNX 100 ETF 89.7764 2.3461 17.2078 15.5807
HDFC Index Fund-Sensex Plus(G) 371.9587 0.3609 15.9444 10.6493 29.3424
Equity FOF
Kotak Asset Allocator Fund(G) 65.7530 9.4124 23.1708 13.1615 17.0098
Birla SL Asset Allocator Multi FoF(G) 23.6408 8.4241 21.3487 8.633 9.0158
Birla SL Financial Planning FOF Aggressive Plan(G) 18.3296 8.2561 21.0189 12.5932 12.2627
Franklin India Life Stage FOFs-20(G) 67.8648 5.1831 20.6024 13.0975 16.3027
ICICI Pru Very Aggressive(G) 56.8540 11.1927 18.2267 10.4492 14.7481
(Funds has been arranged on the basis of 3 years performance)10
INVESTOR JOURNALAugust, 2016
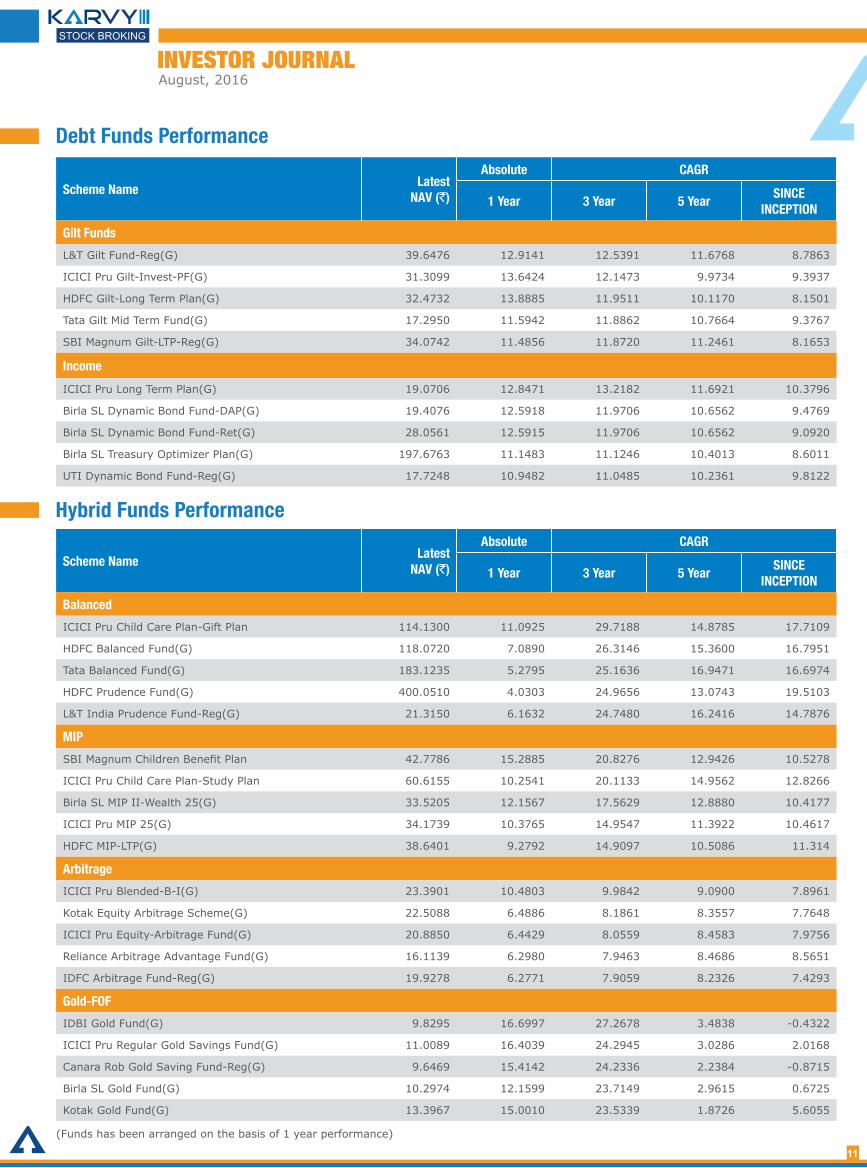
Debt Funds Performance
Scheme NameLatest
NAV (`)
Absolute CAGR
1 Year 3 Year 5 YearSINCE
INCEPTION
Gilt Funds
L&T Gilt Fund-Reg(G) 39.6476 12.9141 12.5391 11.6768 8.7863
ICICI Pru Gilt-Invest-PF(G) 31.3099 13.6424 12.1473 9.9734 9.3937
HDFC Gilt-Long Term Plan(G) 32.4732 13.8885 11.9511 10.1170 8.1501
Tata Gilt Mid Term Fund(G) 17.2950 11.5942 11.8862 10.7664 9.3767
SBI Magnum Gilt-LTP-Reg(G) 34.0742 11.4856 11.8720 11.2461 8.1653
Income
ICICI Pru Long Term Plan(G) 19.0706 12.8471 13.2182 11.6921 10.3796
Birla SL Dynamic Bond Fund-DAP(G) 19.4076 12.5918 11.9706 10.6562 9.4769
Birla SL Dynamic Bond Fund-Ret(G) 28.0561 12.5915 11.9706 10.6562 9.0920
Birla SL Treasury Optimizer Plan(G) 197.6763 11.1483 11.1246 10.4013 8.6011
UTI Dynamic Bond Fund-Reg(G) 17.7248 10.9482 11.0485 10.2361 9.8122
Scheme NameLatest
NAV (`)
Absolute CAGR
1 Year 3 Year 5 YearSINCE
INCEPTION
Balanced
ICICI Pru Child Care Plan-Gift Plan 114.1300 11.0925 29.7188 14.8785 17.7109
HDFC Balanced Fund(G) 118.0720 7.0890 26.3146 15.3600 16.7951
Tata Balanced Fund(G) 183.1235 5.2795 25.1636 16.9471 16.6974
HDFC Prudence Fund(G) 400.0510 4.0303 24.9656 13.0743 19.5103
L&T India Prudence Fund-Reg(G) 21.3150 6.1632 24.7480 16.2416 14.7876
MIP
SBI Magnum Children Benefit Plan 42.7786 15.2885 20.8276 12.9426 10.5278
ICICI Pru Child Care Plan-Study Plan 60.6155 10.2541 20.1133 14.9562 12.8266
Birla SL MIP II-Wealth 25(G) 33.5205 12.1567 17.5629 12.8880 10.4177
ICICI Pru MIP 25(G) 34.1739 10.3765 14.9547 11.3922 10.4617
HDFC MIP-LTP(G) 38.6401 9.2792 14.9097 10.5086 11.314
Arbitrage
ICICI Pru Blended-B-I(G) 23.3901 10.4803 9.9842 9.0900 7.8961
Kotak Equity Arbitrage Scheme(G) 22.5088 6.4886 8.1861 8.3557 7.7648
ICICI Pru Equity-Arbitrage Fund(G) 20.8850 6.4429 8.0559 8.4583 7.9756
Reliance Arbitrage Advantage Fund(G) 16.1139 6.2980 7.9463 8.4686 8.5651
IDFC Arbitrage Fund-Reg(G) 19.9278 6.2771 7.9059 8.2326 7.4293
Gold-FOF
IDBI Gold Fund(G) 9.8295 16.6997 27.2678 3.4838 -0.4322
ICICI Pru Regular Gold Savings Fund(G) 11.0089 16.4039 24.2945 3.0286 2.0168
Canara Rob Gold Saving Fund-Reg(G) 9.6469 15.4142 24.2336 2.2384 -0.8715
Birla SL Gold Fund(G) 10.2974 12.1599 23.7149 2.9615 0.6725
Kotak Gold Fund(G) 13.3967 15.0010 23.5339 1.8726 5.6055
(Funds has been arranged on the basis of 1 year performance)
Hybrid Funds Performance
11
INVESTOR JOURNALAugust, 2016
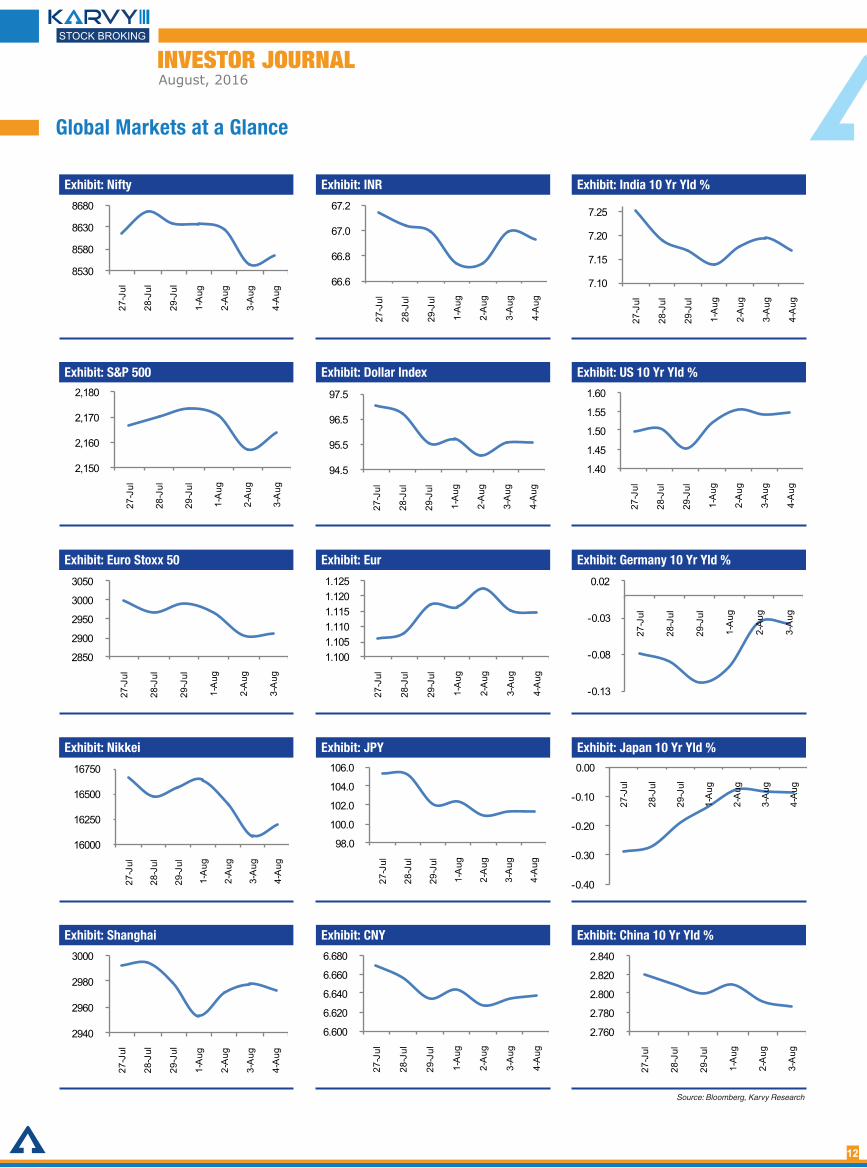
Global Markets at a Glance
12
Exhibit: Nifty
Exhibit: S&P 500
Exhibit: Euro Stoxx 50
Exhibit: Nikkei
Exhibit: Shanghai
Exhibit: INR
Exhibit: Dollar Index
Exhibit: Eur
Exhibit: JPY
Exhibit: CNY
Exhibit: India 10 Yr Yld %
Exhibit: US 10 Yr Yld %
Exhibit: Germany 10 Yr Yld %
Exhibit: Japan 10 Yr Yld %
Exhibit: China 10 Yr Yld %
66.6
66.8
67.0
67.2
27-J
ul
28-J
ul
29-J
ul
1-A
ug
2-A
ug
3-A
ug
4-A
ug
8530
8580
8630
8680
27-J
ul
28-J
ul
29-J
ul
1-A
ug
2-A
ug
3-A
ug
4-A
ug7.10
7.15
7.20
7.25
27-J
ul
28-J
ul
29-J
ul
1-A
ug
2-A
ug
3-A
ug
4-A
ug
2,150
2,160
2,170
2,180
27-J
ul
28-J
ul
29-J
ul
1-A
ug
2-A
ug
3-A
ug
94.5
95.5
96.5
97.5
27-J
ul
28-J
ul
29-J
ul
1-A
ug
2-A
ug
3-A
ug
4-A
ug
1.40
1.45
1.50
1.55
1.60
27-J
ul
28-J
ul
29-J
ul
1-A
ug
2-A
ug
3-A
ug
4-A
ug
2850
2900
2950
3000
3050
27-J
ul
28-J
ul
29-J
ul
1-A
ug
2-A
ug
3-A
ug
1.1001.1051.1101.1151.1201.125
27-J
ul
28-J
ul
29-J
ul
1-A
ug
2-A
ug
3-A
ug
4-A
ug
-0.13
-0.08
-0.03
0.02
27-J
ul
28-J
ul
29-J
ul
1-A
ug
2-A
ug
3-A
ug
16000
16250
16500
16750
27-J
ul
28-J
ul
29-J
ul
1-A
ug
2-A
ug
3-A
ug
4-A
ug
98.0
100.0
102.0
104.0
106.0
27-J
ul
28-J
ul
29-J
ul
1-A
ug
2-A
ug
3-A
ug
4-A
ug
-0.40
-0.30
-0.20
-0.10
0.00
27-J
ul
28-J
ul
29-J
ul
1-A
ug
2-A
ug
3-A
ug
4-A
ug
2940
2960
2980
3000
27-J
ul
28-J
ul
29-J
ul
1-A
ug
2-A
ug
3-A
ug
4-A
ug
6.600
6.620
6.640
6.660
6.680
27-J
ul
28-J
ul
29-J
ul
1-A
ug
2-A
ug
3-A
ug
4-A
ug
2.760
2.780
2.800
2.820
2.840
27-J
ul
28-J
ul
29-J
ul
1-A
ug
2-A
ug
3-A
ug
Source: Bloomberg, Karvy Research
INVESTOR JOURNALAugust, 2016
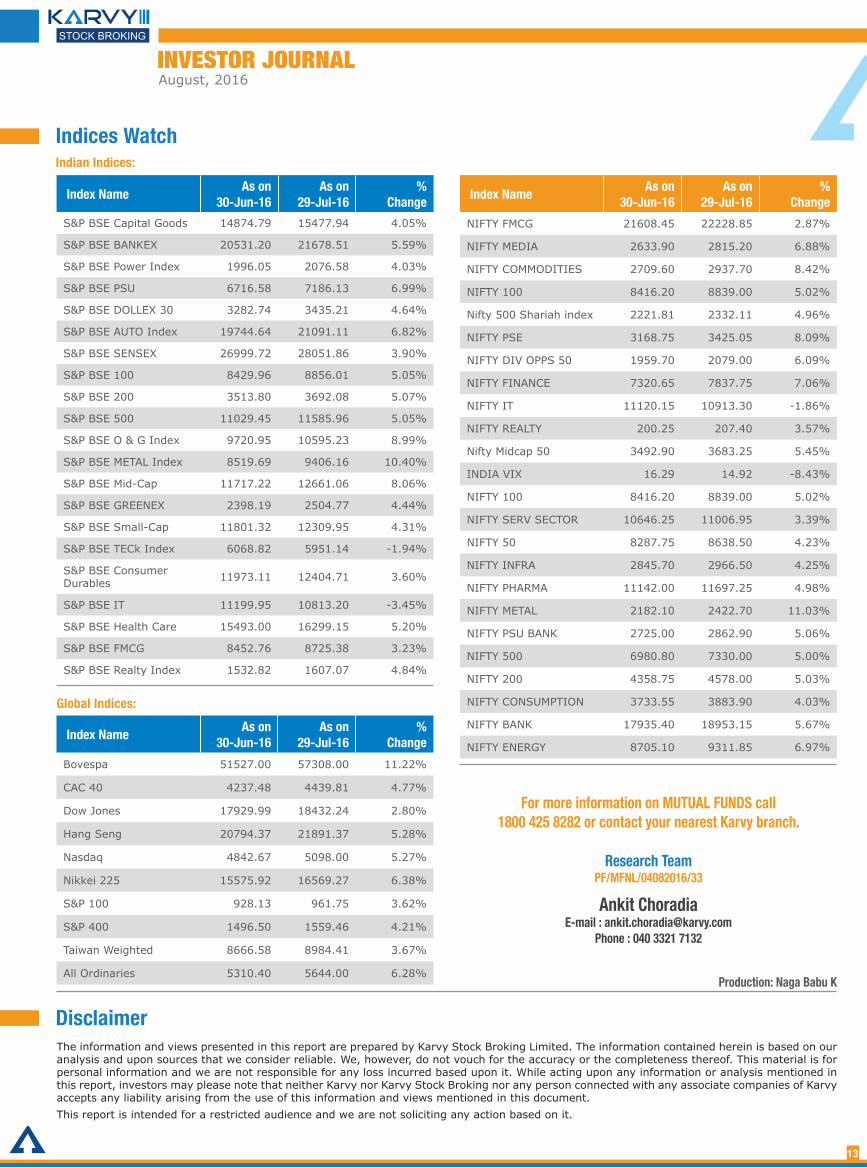
Indices Watch
Index NameAs on
30-Jun-16As on
29-Jul-16%
Change
S&P BSE Capital Goods 14874.79 15477.94 4.05%
S&P BSE BANKEX 20531.20 21678.51 5.59%
S&P BSE Power Index 1996.05 2076.58 4.03%
S&P BSE PSU 6716.58 7186.13 6.99%
S&P BSE DOLLEX 30 3282.74 3435.21 4.64%
S&P BSE AUTO Index 19744.64 21091.11 6.82%
S&P BSE SENSEX 26999.72 28051.86 3.90%
S&P BSE 100 8429.96 8856.01 5.05%
S&P BSE 200 3513.80 3692.08 5.07%
S&P BSE 500 11029.45 11585.96 5.05%
S&P BSE O & G Index 9720.95 10595.23 8.99%
S&P BSE METAL Index 8519.69 9406.16 10.40%
S&P BSE Mid-Cap 11717.22 12661.06 8.06%
S&P BSE GREENEX 2398.19 2504.77 4.44%
S&P BSE Small-Cap 11801.32 12309.95 4.31%
S&P BSE TECk Index 6068.82 5951.14 -1.94%
S&P BSE Consumer Durables 11973.11 12404.71 3.60%
S&P BSE IT 11199.95 10813.20 -3.45%
S&P BSE Health Care 15493.00 16299.15 5.20%
S&P BSE FMCG 8452.76 8725.38 3.23%
S&P BSE Realty Index 1532.82 1607.07 4.84%
Indian Indices:
Index NameAs on
30-Jun-16As on
29-Jul-16%
Change
NIFTY FMCG 21608.45 22228.85 2.87%
NIFTY MEDIA 2633.90 2815.20 6.88%
NIFTY COMMODITIES 2709.60 2937.70 8.42%
NIFTY 100 8416.20 8839.00 5.02%
Nifty 500 Shariah index 2221.81 2332.11 4.96%
NIFTY PSE 3168.75 3425.05 8.09%
NIFTY DIV OPPS 50 1959.70 2079.00 6.09%
NIFTY FINANCE 7320.65 7837.75 7.06%
NIFTY IT 11120.15 10913.30 -1.86%
NIFTY REALTY 200.25 207.40 3.57%
Nifty Midcap 50 3492.90 3683.25 5.45%
INDIA VIX 16.29 14.92 -8.43%
NIFTY 100 8416.20 8839.00 5.02%
NIFTY SERV SECTOR 10646.25 11006.95 3.39%
NIFTY 50 8287.75 8638.50 4.23%
NIFTY INFRA 2845.70 2966.50 4.25%
NIFTY PHARMA 11142.00 11697.25 4.98%
NIFTY METAL 2182.10 2422.70 11.03%
NIFTY PSU BANK 2725.00 2862.90 5.06%
NIFTY 500 6980.80 7330.00 5.00%
NIFTY 200 4358.75 4578.00 5.03%
NIFTY CONSUMPTION 3733.55 3883.90 4.03%
NIFTY BANK 17935.40 18953.15 5.67%
NIFTY ENERGY 8705.10 9311.85 6.97%
Global Indices:
Index NameAs on
30-Jun-16As on
29-Jul-16%
Change
Bovespa 51527.00 57308.00 11.22%
CAC 40 4237.48 4439.81 4.77%
Dow Jones 17929.99 18432.24 2.80%
Hang Seng 20794.37 21891.37 5.28%
Nasdaq 4842.67 5098.00 5.27%
Nikkei 225 15575.92 16569.27 6.38%
S&P 100 928.13 961.75 3.62%
S&P 400 1496.50 1559.46 4.21%
Taiwan Weighted 8666.58 8984.41 3.67%
All Ordinaries 5310.40 5644.00 6.28%
DisclaimerThe information and views presented in this report are prepared by Karvy Stock Broking Limited. The information contained herein is based on our analysis and upon sources that we consider reliable. We, however, do not vouch for the accuracy or the completeness thereof. This material is for personal information and we are not responsible for any loss incurred based upon it. While acting upon any information or analysis mentioned in this report, investors may please note that neither Karvy nor Karvy Stock Broking nor any person connected with any associate companies of Karvy accepts any liability arising from the use of this information and views mentioned in this document.
This report is intended for a restricted audience and we are not soliciting any action based on it.
For more information on MUTUAL FUNDS call1800 425 8282 or contact your nearest Karvy branch.
Research TeamPF/MFNL/04082016/33
Ankit ChoradiaE-mail : [email protected]
Phone : 040 3321 7132
Production: Naga Babu K
13
![Recommendations Resolutions - Login Book.pdf[1.75]2% [1.50]1.75% All other employment under Federation -negotiated Electronic Media Agreements [1.50]1.75% [1.25]1.50% 37 BE IT FURTHER](https://img.pdfslide.net/doc/110x75/5f0fd3e07e708231d44614a9/recommendations-resolutions-login-bookpdf-1752-150175-all-other-employment.jpg)