Embed Size (px)
Citation preview

2
Aurora Energy Annual Report 2013-14


3
Contents
Page
1. About this Report 32. Highlights and challenges at a glance 43. Strategic Performance Statement 2013-14 54. Chairman’s Review 65. CEO’s Report 86. Statement of Corporate Intent 2014-15 117. Corporate Governance Report 138. Financial Statements 259. Supplementaryinformation:glossary,howtocontactus 85

4
2. Highlights and challenges at a glance
During 2013-14, Aurora Energy was a State-owned company with two Shareholders, the Minister for Energy and the Treasurer. Aurora Energy retailed and distributed electricity to more than 250,000 customers throughout Tasmania.
In2013-14,AuroraEnergydirectlyemployed8731people,controlledassetsworth$1.885billionandsold$1.135billionofelectricity.Italso:
• achievedanunderlyingprofitbeforetaxof$83.1million,comparedto$75.7millioninthepreviousyear,withaheadlineprofitbeforetaxof$65.1million,downfrom$73.6million in 2012-13;
• deliveredarecord$70.7millionin returns to its Shareholders up from$37.9millionin2012-13;
• achieved seven months without alost-timesafetyincident,forthefirsttimeinits16yearhistory,andrecordedanoveralllosttimeinjuryfrequencyrateof 2.4;
• experiencedthreesignificantpublicsafetyincidents,although none resulted in personalinjury;
• continuedtoprovidequalityservicetoitstelecommunicationscustomers,openinganew$8milliondatacentre in the Hobart area in February 2014;
• showed a marked improvement inCallCentreperformance,with a Grade of Service performance of 76 per cent surpassing its target rate by 6 per cent;
• failed to meet its network reliabilitytargets,duetoanincrease in outages caused by badweather,vegetationcominginto contact with overhead powerlines and asset failures;
• deliveredseveralmajorconstructionprojectsthatwillboost energy security and reliability into the future;
• preparedtheDistributionBusiness for the merger with TransendNetworksPtyLtd,forming a new State-owned company,TasmanianNetworksPtyLtd(TasNetworks),from1July 2014;
• readied the business for its newroleasacompetitive,stand-alone energy retailer on mainland Tasmania in a fully contestable market environment from 1 July 2014; and
• undertooksignificantrestructuringactivitiesasaresultofthereforms,includingtransferring 697 Aurora Energy personnel to TasNetworks while89positionsweremaderedundant.
From 1 July 2014, Aurora Energy continues as an energy retailer only, operating in Tasmania with all the company’s electricity distribution and telecommunications activities having been transferred to a new State-owned company, TasNetworks.
1 Thisnumberincludesallemployees(includingdirectorsandnineapprentices)directlyemployedbyAuroraEnergyon30June2014.Itexcludescontractors.Thefull-time-equivalentnumberis853.4
1. About this report
This is the 16th Annual Report for Aurora Energy and encompasses the 2013-14 financial year.
ItincludestheactivitiesoftheAuroraEnergyGroup,whichupuntil1July2014comprisedparentcompanyAuroraEnergyPtyLtdandtwooperatingsubsidiarycompanies,EziKeyGroupPtyLtd,tradingasWireAlert,andAuroracomPtyLtd,theholderofAuroraEnergy’stelecommunicationslicence.
This report and past reports can be accessed from www.auroraenergy.com.au.

5
3. Strategic Performance Statement for 2013-14
Key result area Strategic objective Key Performance Measures
Target Result Achieved?
Financial Performance
Deliver sustainable customer price outcomes and appropriate returns to shareholders
AuroraEnergyGroup:
-ProfitBeforeTax-Operatingcashflow-Returnonequity- FFO interest cover - Debt to total capital
$47.8m$58.8m
5.8%3.5x
55.8%
$65.1m$32.1m12.5%4.1x
56.8%
YesNoYesYesYes
Customer To maximise the value of the Energy Business in preparationforsaleand/orownership transfer
Deliver a safe and reliable network while ensuring no increase to customer prices asaresultofourefforts
Call centre Grade of Service (% of calls answered within 30 seconds for the month)
Service Target Performance IncentiveScheme(networkreliability)
70%
>$0
76%
<$0
Yes
No2
Environment and Safety
ZeroHarm:
No harm to our peopleMinimise impact on the environment
- LTIFR (12 month rolling average)-Leadersafetyinteractionscomplete-Significantincidents(publicsafety and environment)
2.9
100%
0
2.4
175%
3
Yes
Yes
No
People Ensurewehavetheculture,capability and capacity to achieve business strategy
Employee-initiatedturnover(12 month rolling average)
5% 6.9% No
2AuroraEnergydidnotmeetitsnetworkreliabilitytargetsthisyearhowever,theresultingpenaltywillbeoffsetbytheincentivethatAuroraEnergyearned last year when reliability targets were exceeded.
6
On behalf of the Board of Aurora Energy it is my pleasure to present the 2013-2014 Annual Report.
Underlyingprofitbeforetaxamountedto$83.1million,animprovementonlastyear’s$75.7million,whichhasenabledarecordreturntoGovernmentof$70.7million.
It is pleasing to report that this record levelofprofitabilitywasachievedduringa period when the company was both preparing itself for a new future and continuingtoperformstronglyinits‘businessasusual’roleofdistributingand retailing electricity to Tasmanian customers.
AuroraEnergy’simprovedprofitabilityalsohadapositiveimpactonthecompany’snetdebtposition,withnetdebt (borrowings less cash and cash equivalents)reducedto$717millionbyyear end.
Anincreaseincostsrelatingtoreformandrestructuringwasamajorfactorbehindthelowerheadlineprofitbeforetaxresultof$65.1million.However,theincreasedefficiencyandproductivitythat was achieved as a result of the reforms,combinedwiththedivestmentoftheTamarValleyPowerStationinthepreviousyear,contributedtoapleasingreductioninoperatingcosts.
Electricity demand in Tasmania fell for thethirdconsecutiveyearwiththeStateexperiencingmildweatherconditions,modest economic growth and the continuingstrongtake-upofsolargeneration.AuroraEnergyrespondedtofalling customer demand by containing costs and lowering capital expenditure. Itisestimatedthatonein20householdsinTasmanianowhasasolarconnection
4. Chairman’s review
re-structure and re-engineering a wide rangeofbusinesspractices,policiesand processes to ensure it will compete effectivelyanddelivervalueforitscustomers.
A change of this magnitude does not comewithoutcostsordisruption.AuroraEnergy’sfinancialstatementsshowreformoperatingcostsof$25.3million,andcapitalexpenditureincurredduring the year to prepare for FRC was$28.5million.Asaresult,theindustrystructureismorespecialised,moreefficientandwillproceedwitha lower cost structure. Aurora Energy played a central role in this reform and establishedastrongerplatformfortheelectricitysectortocontinuetounderpinand support economic development in Tasmania. To this extent we are very pleased to have played our part.
Thank you
The challenges of the past year brought to the fore a very strong endorsement of Aurora Energy’s values. Senior managementandstaffappliedthemselves with professionalism to thebroadrangeofactivitiescreatedbythe parallel workstreams of reform and ‘businessasusual’,oftenwhentheirownfutures were uncertain. A well deserved “congratulations”isinorder.
I would also like to acknowledge thecontributionofmyfellowBoardmembersfortheirexceptionalcontributionduringtheyear.Thankyouto Directors Mervyn Davies and Peter Lowe,wholefttheBoardon30June2014 and thank you to the remaining Directorswhowillprovidecontinuityfor,andstewardshipof,AuroraEnergy.
OnbehalfoftheBoard,Iwouldliketo acknowledge CEO and Managing Director Peter Davis for his 10 years at
andwearecontinuingtoreceivenewapplications.AuroraEnergyeffectivelymanaged the ‘grandfathering’ of the Government’s amended feed-in-tariffschemeandourengineersaredevelopingnetworksolutionstoaccommodateamoresophisticatedelectricity grid.
Transformation completed
Earlyin2014,AuroraEnergy’sDistributionBusinessachievedamajormilestone by becoming accredited to support Full Retail Contestability (FRC) inTasmania,includingsystemsthatfacilitate customer churn and the billing ofmultipleretailers.From1July2014allTasmaniancustomers,includingsmallbusinessesandhouseholds,areparticipantsinafullycompetitivemarket.
Throughouttheyear,theDistributionBusinessworkedveryeffectivelywiththe newly formed TasNetworks to bring about the merger with Transend for the ongoingbenefitofTasmaniancustomers.
EarlyinthefinancialyearAuroraEnergy’s Retail Business was systematicallyorganisedandpreparedforsaleintwotranches.However,inSeptember 2013 this sale process was suspended.
Fromthenonthebusinessquicklyanddecisivelytransformedandre-positioneditself into a small scale stand-alone retailer fully prepared to operate in the FRC environment from 1 July 2014. Thistransformationinvolvedabusiness
“The business quickly and decisively transformed and
repositioned itself into a small scale stand-alone retailer.”

7
themostseniorexecutivelevel.
The company prospered under his directionandcontrol.
Thank you to all those employees who retiredorleftAuroraEnergyon30June2014.Yourcontributiontothebusinessover your career is in no way diminished bythesemajorchangesbringinganendto your service and we extend our best wishes to you in your future endeavours. Thank you also to those who have continuedateitherTasNetworksorAuroraEnergy,where,wehavenodoubt,youwillhavetheopportunitytoadapt and develop your careers.
Moving forward
AuroraEnergyenteredthenewfinancialyearasastand-alone,small-scaleretailer. It has a new strategic vision and a reinvigorated focus on serving its Shareholdersanditscustomerbase,theTasmanian community.
Wehavelaidasolidfoundationforourparticipationinacompetitiveretailmarket under the leadership of Rebecca KardosasCEO-designateandwewelcome Rebecca’s appointment as the new CEO of Aurora Energy from 1 July 2014.
Whilethereareimportantchallengesahead,aselectricitydemandcontinuesto fall and we face the prospect of newentrantretailers,AuroraEnergy
employees have demonstrated that they havetheknowledge,theskillsandthecommitment needed for the business to thriveinthenewmarketplace,forthebenefitofallTasmanians.
Welookforwardtothejourney.
Geoff Willis
Chairman
“Thank you to all those employees who retired or left Aurora
Energy on 30 June 2014. Your contribution to the business is no way diminished by these major
changes.”

8
The year in review, Aurora Energy’s last as an integrated distribution and retail company, saw some significant activities and achievements in ‘business as usual’ areas, and in response to the Government’s reform program.
Throughoutthisperiod,AuroraEnergy’sworkforce faced change and uncertainty with professionalism and resilience. The underlying business performance went from strength to strength over the past year,witharecordlevelofdividendandprofit,andasubstantialreductionindebt.
‘Business as usual’ performance snapshot
Safety performance during 2013-14 was anoutstandinghighlight,whenforthefirsttimeinAuroraEnergy’s16-yearhistory,thecompanyrecordedafullsevenmonthswithoutalost-timeinjury.Fourlost-timeinjurieswererecordedfortheyearasawhole,comparedto11in2012-13. Aurora Energy uses the Lost TimeInjuryFrequencyRate(LTIFR)asits headline measure. The LTIFR of 2.4 betteredthetargetof2.9andcomparedvery favourably to the previous year’s result of 5.1.
ThissignificantturnaroundisinnosmallpartduetotheeffectivenessoftheZero Harm approach to employee and communitysafety.Initiativesdevelopedin previous years under the Zero Harm banner,includingworkshopsandprograms covering health and wellbeing topics,theLifeSafesafetyobservationprogram,andtheJobRiskAnalysismodel,certainlycontributedtothisresult.Aftermorethan800‘leadership
5. CEO’s report
safetyinteractions’recorded,morethan 550 individual safety audits of employeesandcontractors,andmorethan 500 random tests of employees for alcohol and other drugs under our FitforWorkpolicy,therewerezerosignificantfindingsandzeropositivetests,respectively.
Unfortunately,werecordedthreesignificantpublicsafetyincidentsduringtheyear.InDecember2013,a steel fence near a public walkway wasenergisedforabrieftime(duetoequipmentfailure)untilautomaticprotectionsystemsisolatedsupplytothearea.InFebruary2014aninstallationassociatedwithanNBNtowerwasleftinapotentiallydangeroussituationbyanincompletesupplyconnection,andinJune2014, theroofingandwindowsof a residence were energised when a wrap-onterminationpulledthroughtheinsulationontheserviceconductorsduetoapoleleaningandtighteningtheservice conductor.
Whilenoonewasinjured,theseincidentswereinvestigatedandprocesses were put in place to minimise the chances of theses types of incidences occurring again.
Therewerenosignificantenvironmentalincidents recorded during the year.
Aurora Energy’s Call Centre performance was another area that showed a marked improvement over the previous year. Using the industry-standard Grade of Servicemeasure,AuroraEnergyaimedto answer 70 per cent of calls within 30 seconds. This year it achieved this 76 percentofthetime,outperformingitstarget and improving on the previous year’s result of 50.3 per cent that was reported to the Australian Energy
Regulator (AER). This improvement is attributedtoproactiverecruitmentandincreased resourcing levels.
Considerable energy was directed towards responding to various regulatoryrequirementsthisyear.TheDistributionBusinessteampreparedthree comprehensive Regulatory InformationNoticeresponsesfortheAER.TheAERusesthisinformationtobenchmark companies on performance andefficiencyandalsofeedsthisdata into the process that determines network prices for customers.
AuroraEnergyalsosubmittedthreepricingproposalstotherespectiveregulators(twototheOfficeoftheTasmanian Economic Regulator covering retailactivitiesandonetotheAERcoveringdistribution).Consistentwiththestrategicfocusofmeetingcustomerneedsatthelowestsustainablecost,wewelcomed the Tasmanian Regulator’s decisiontoreduceretailtariffsforcustomers by 5.22 per cent on 1 January 2014 and a further 7.8 per cent reductionfrom1July2014.
Theopeningofan$8millionDataCentre,intheouterHobartsuburbofDerwentParkinFebruary2014,highlighted the technical skills and commercial acumen of Aurora Energy’s TelecommunicationsTeam.Builttoservice both Aurora Energy’s data needs and to host space for external content providers and carriers on a
“Aurora Energy’s Call Centre performance was another
area that showed a marked improvement over the previous
year.”

9
commercialbasis,theCentreistheonlypurpose-built data centre facility of its type in Tasmania. It plays an important complementary role to the ongoing roll-outoftheNationalBroadbandNetworkand improved broadband access for all Tasmanians.
Aurora Energy’s main measure of reliability performance is the AER’s ServiceTargetPerformanceIncentiveScheme (STIPS). This Scheme gives electricitydistributorsfinancialincentivesintheformofpotentialrevenueforgoodperformance,andpenalises them for poor performance. Aurora Energy did not meet its network reliabilitytargetsthisyear,andasaconsequencearevenuepenaltywillbeapplied.However,thispenaltyislargelyoffsetbytheincentivethatAuroraEnergy earned last year when reliability targets were exceeded.
Thedeteriorationinreliabilityperformance was largely due to an increase in outages caused by bad weather,vegetationcomingintocontactwith overhead powerlines and asset failures.Althoughmajorstormeventsareexcludedfromthedata,therewasa 75 per cent increase in the impact of weather-related outages when comparedtothefiveyearaverage,alongside a 45 per cent increase in asset-related outages and 24 per cent increaseineventscausedbyvegetationcontact.Overall,theseincreasesweremostnoticeableinurban,highdensityrural and low density rural reliability categories.
Notably,AuroraEnergydeliveredseveralmajorconstructionprojectsthatwillboost energy security and reliability for customers into the future. These included the commissioning of a new
substationatKingston,theconstructionofasecondfeederlinefeaturingfire-retardant concrete poles into the Tasman Peninsula following the January 2013bushfires,andnewstandbygenerators at Strahan.
Preparing for workforce change
The Aurora Energy workforce was managed with a view to minimise employeestressinatestingenvironment.
The in-house development of an optionalprogramknownasGetSet played a vital role in preparing employees for change. This program offeredemployeesbothgroupand one-on-one sessions on topics thatincludedpersonalresilience,resumewriting,interviewskillsandfinancialmanagement.Itwasusefulfor employees intending to seek opportunitiesoutsidetheindustryandalso for those planning to move forward with either TasNetworks or Aurora Energy.
Whileworkforcemovementsweresignificanton30June2014,therewere minimal movements in the lead-up to this milestone date. ThisreflectedAuroraEnergy’scommitmenttoretainingemployees,in order to maintain ‘business as usual’ commitments while also delivering extensive government reforms. The annualisedemployee-initiatedturnoverrateof6.9percentwasjustabovethetarget of 5 per cent.
I would like to thank all Aurora Energy employees for the way in which they approached ‘business as usual’ work for customers while concurrently managingalargeadditionalworkload
associatedwithreform–particularlygiven the uncertainty surrounding their own employment outcomes. I sincerely wish everyone well in their future endeavours.
Finally,IwouldliketothanktheDirectors for providing the company withtheirdiligenceandexpertiseandaffordingmethebenefitoftheirwisdomand guidance.
Peter Davis
Chief Executive Officer

10
Looking ahead: the next chapter
Aurora Energy is committed to delivering a cost-effective, efficient, customer-focused business that is ready to compete with potential new market entrants, and providing value to its Shareholders and the Tasmanian community.
Our challenge from 1 July 2014 will be to retain market share as Tasmania opens uptofullretailcontestabilityforthefirsttime.
Thevisionforthenewbusiness,outlined in the Statement of Corporate Intent that is published on page 11 ofthisReport,embracesthethemesofcustomerexcellence,buildingrelationshipsandtrustwithintheTasmaniancommunity,thecontinuousimprovement of systems and processes andensuringemployeesareflexible,multi-skilledandvalued.
AuroraEnergywillcontinuetoengagewith the broader Tasmanian community throughitsinteractionwitharangeofcommunity and volunteer groups and othernot-for-profitorganisations.ThiswillincludecontinuingsponsorshipactivitieswithinTasmaniatargetedatalocal,grassrootslevel.
Aurora Energy is looking forward to working with these groups to assist them in their community pursuits across Tasmania.
Iamconfidentthatbydeliveringaframework and workforce dedicated to customer excellence we will be able tobringbenefittocustomersandtothe broader community. I have been veryimpressedbythecommitment,passion and enthusiasm of the team and have no doubt that we will meet the expectationsofourShareholdersandthe Tasmanian community as a whole.
Rebecca Kardos
Chief Executive Officer (Designate)
“Our challenge from 1 July 2014 will be to retain market share as Tasmania opens up to full retail contestability for the first time.”

11
6. Statement of Corporate Intent
Company Overview
Aurora Energy is a State-owned Company established in 1998 under the Electricity Companies Act 1997. Aurora Energy’s two Shareholders are the Minister for Energy and the Treasurer.
From1July2014,AuroraEnergybecamea stand-alone retailer in Tasmania competinginafullycontestableelectricity market. The change in scale ofoperationsandbusinessactivitiesresultingfromthepreparationsforfullretailcompetitionanddisaggregationofAuroraEnergy’sdistributionactivitiestoTasmaniaNetworksPtyLtd(TasNetworks)hasresultedinsignificantstructural changes and associated challenges to the business for 2014-15.
Aurora Energy’s primary focus during 2014-15 will be the retailing of electricity to Tasmanian customers.
Theprincipalobjectivesofthecompany as outlined in the Electricity Companies Act 1997 and the Company’s MemorandumofAssociationare:
• tooperateitsactivitiesinaccordance with sound commercialpractice;and
• to maximise its sustainable return to its shareholders.
Aurora Energy pays dividends to the Shareholders which are used by the GovernmentforthebenefitoftheTasmanian community.
Shareholders’ Statement of Expectations
AuroraEnergy’sstrategicdirectionfor the 2014-15 year and beyond was developed on the basis of a set of underlyingbusinessimperatives.
Theseare:
a) focus the business on the delivery of core electricity retail services on mainland Tasmania;
b) positiontheongoingbusinessforfullretailcompetitionand ensure that it is market compliant;
c) maintainmaximumflexibilityfor a future divestment of the business in the medium term;
d) operate the business in accordance with sound commercialpractice;
e) optimisebusinessefficiencyby purchasing support services from TasNetworks or other providers as appropriate;
f) manage the wholesale and otherrisksofoperatinginanopenandcompetitiveretailmarket in Tasmania; and
g) maintain a customer-centric focusandefficientlydelivertheState’s electricity concessions on behalf of the Government.
Aurora Energy’s Activities and Operating Environment
Following the commencement of TasNetworkson1July2014,AuroraEnergynowfunctionsasastand-aloneretailerincompetitionwithotherauthorisedretailersinTasmania.Thetransformationof the retail arm of Aurora Energy into afullyfunctioning,standalone,State-Owned Company providing electricity retail servicesformorethan250,000customerspresents a challenging new environment for Aurora Energy.
Since1July2014,allcustomershavebeen able to choose their electricity retailer,andanewwholesalecontractregulatory framework is in place. A key unknown for Aurora Energy is the levelofcompetitionthatwillentertheTasmanian market and compete for Aurora Energy’s current market share.
To meet this challenge Aurora Energy hasundertakensignificantworkincluding:
• implementinganewoperatingmodeltopromoteacompetitiveandsustainablebusiness;
• developing products and services to provide customers withchoiceintariffs,contractsand payment methods as well as the manner in which customers choose to engage with Aurora Energy; and
• establishing a co-ordinated transformationprogramtodelivermajorchangetoAuroraEnergy’ssystems,processesandpeople.
Strategic Direction
ThetransformationofAuroraEnergyintoacompetitiveenergyretailbusinessfrom 1 July 2014 necessitated a new strategicvisiontoreflectthesechanges.AuroraEnergy’snewVision,‘Aurora Energy is valued by its customers and provides sustainable returns to the Tasmanian community’,capturesthecriticalcharacteristicsandelementsofsuccessforAuroraEnergy,andprovidesaprincipalobjectivefortheorganisation.
Thestatementimplicitlyreflectsatargeted state whereby Aurora Energy isefficient,customerorientated,cost-effective,andrecognisesthevalue Aurora Energy can provide as a Tasmanianentitytoitsshareholdersandcustomers. The statement will guide the businessthroughitstransformationandfuture decision making.
Underpinning the Vision Statement are four strategic themes that will enable AuroraEnergytodeliveritsVision:
• provideconsistent,proactive,strong customer service linked to customer value;
• givedueconsiderationtomeetingstakeholderandTasmanian community expectations;
• applicationofefficientsystems,processesandpractices;and
• deliveredbycommitted,capable,valuedandpassionatepeople who care about what they do and the important role they play in the community.

12
Key performance measures
Strategic Theme Key Performance Indicator
Performance Measure 2014-15 Target
Provide consistent, proactive, strong customer service linked to customer value
Grade of Service Percentage of calls answered within 30 seconds
70%
ComplaintFrequencyRate Number of complaints per 100residentialcustomercomplaints
0.5 - 1.0
Customerretention Total number of customers >238,000
Give due consideration to meeting stakeholder and Tasmanian community expectations
Annualprofitability ProfitBeforeTax $11.1M
Returns to Government Returns to Government (cash) $23.3M
Application of efficient systems, processes and practices
Improvement in non compliance events related to NECF
% of reduced type 1 NECF compared to prior year result
50%
Regulated Cost to Serve (CTS) per customer
Cost to Serve within the regulated Cost to Serve allowance
WithintheCTSallowance
RetailTransformationProgramDelivery (RTP)
Initiativesunderpinningthecorebusinesscapabilitiesaredeliveredontimeandonbudget
95%
Delivered by committed, capable, valued and passionate people who care about what they do and the important role they play in the community
Rolling 12 month Medical Treated InjuryFrequencyRate(MTIFR)
Number of medical treated injuriesper1,000,000hoursworked
<2.8
Employeeinitiatedturnover Employeeinitiatedturnover(FTE) as a percentage of total FTE
5%
Tomonitorprogressagainstthestrategicfocusandobjectivesoutlinedabove,AuroraEnergyhasdevelopedanewsetofkeyfinancialandnon-financialperformancemeasuresandassociatedtargetsfor2014-15.

13
7. Corporate Governance
Aurora Energy is owned by the Minister for Energy for the State of Tasmania and the Treasurer for the State of Tasmania, who hold their shares in trust for the State Crown. It has a robust corporate governance framework in place.
Thiscorporategovernancereportiswrittentoreflecttheperiodto30June2014.
Board responsibilities
The Board is responsible for the overall corporate governance of the company.Itisresponsibleforsettingthecompany’sstrategicdirectionandfor monitoring the achievement of its objectives.
The Board approves and monitors the businessplanandoperatingbudgetssubmittedbymanagement.Itisresponsible for the approval and review ofmajorexpenditureitemsandreviewsoperatingperformanceonamonthlybasis. The Board operates in accordance withitsCharterandtheDelegationsManual,whichsetsoutitsrolesandresponsibilities.
The Board receives and monitors reportsfrommanagementonfinancialandbusinessperformance,mattersofstrategicsignificance,workplacehealthandsafety,environmentalperformance,risk,regulatoryandpolicycomplianceand human resource management.
Board composition
ThecompanyConstitutionprovidesthatthe number of Directors is to be not less than three and no more than eight unless otherwise resolved. In February 2006 the Shareholders resolved to increase the maximum to nine. As at 30 June 2014 the Board consisted of six Directors.
The Chair is appointed each year by the Shareholders. Directors are appointed for terms of three years by the Shareholders and are eligible for re-appointment. Dr Peter Davis held officeasaDirectorduringhispositionasChiefExecutiveOfficer.Followingarethe names of the Directors and Company Secretarywhohaveheldofficeduringthe year along with details of their qualifications,experienceandspecialresponsibilities:
Mr Geoffrey Willis (Chairman) was appointed a Director on 29 November 2007 and has been Chairman since 24 November 2011. He was formerly CEO of Hydro Tasmania from March 1999 untilhisretirementin2006.Priortohis
appointment to Hydro he was Managing Director of the Amcor Paper Group.
Formerly,GeoffwasaDirectorofAuroraEnergy subsidiary Aurora Energy (Tamar Valley)PtyLtdduringtheconstructionoftheTamarValleyPowerStationanduntilthat company was transferred to Hydro Tasmania.
DuringthepastyearGeoffwasamemberoftheNetworkIntegrationTransitionBoardand,subsequently,a Director of TasNetworks from its incorporationuntil30June2014.Inthiscapacity he provided oversight of the mergerofAuroraEnergy’sDistributionBusiness with Transend Networks as part of the State Government’s reform of the Tasmanian energy sector.
GeoffispresentlytheChairmanofColorpak Ltd and a trustee of the Tasmanian Museum and Art Gallery. He previously chaired Tasmania’s water andseweragecorporationsandtheTasmanian Symphony Orchestra.
He holds a Bachelor of Commerce degree and a Master of Business Administration.
Mr Mervyn Davies was appointed a Director on 25 November 2010. He has been principal and Managing Director of Girna Engineering Management Servicessince2003,specialisinginthe engineering and economics of the electricitydistributionindustry,andhas held senior management roles with Energy Australia.
Mervyn is also a Board member of ElectricityNetworksCorporation(WesternPower),NewWorldEnergyLtdandEnergex.Previously,hewasaDirectorofPowerandWaterCorporationandhasrecentlyresumedthis role.
Mervyn holds Honours and Masters Degrees in engineering and a Bachelor of Commerce (economics).
Aurora Energy’s corporate governance structure:

14
During the past year Mervyn was a memberoftheNetworkIntegrationTransitionBoardand,subsequently,a Director of TasNetworks from its incorporation.Inthiscapacityheprovided oversight of the merger of AuroraEnergy’sDistributionBusinesswith Transend Networks as part of the State Government’s reform of the Tasmanian energy sector. Mervyn retiredfromtheBoardofAuroraEnergyeffectivemidnighton1July2014tocontinuehisrolewithTasNetworks.
Ms Caryle Demarte PSM was appointed a Director on 1 April 2006 and is the Chair of Aurora Energy’s BoardAppointments&RemunerationCommittee.Carylehasastrongbackgroundintheenergysector,having held roles as General Manager of Victorian Government-owned gas retailerKinetikEnergyandGeneralManagerCorporateRelations,PublicandGovernmentAffairsandRetailwithTXU.
Caryle is presently the Chair of the Infrastructure Assistance Fund for the Victorian Government and Director of Power RetailCorporationintheNorthernTerritory.
Formerly,CarylewasaDirectorofYarraValleyWater,Synergy,AustraliaCustomerServicesPtyLtd,VictorianEnergyandWaterIndustryOmbudsmanand VENCorp. She was the inaugural Deputy Chair and a Director of the EnergyRetailersAssociationofAustralia.She has also been a Director of a number ofnot-for-profitfinancialsectorBoards.
CarylehasaBachelorofBusinessand,in2002,wasawardedaPublicServiceMedal for services to the Victorian community. She is a Fellow of the AustralianInstituteofCompanyDirectors.
Mr Peter Lowe was appointed a Director on 13 February 2006 and is Chair of AuroraEnergy’sBoardAudit,Risk&ComplianceCommittee.Heiscurrentlyon the Boards of Citywide Services Pty Ltd,UnitedEnergyDistributionHoldingsPtyLtd,MultinetGroupHoldingsandSnowy Hydro Limited.
Formerly,PeterheldBoardroleswithSouthernHydroPtyLtd,GasNetLimited,MeridianEnergyAustraliaPtyLtd,NorfolkGroupLimitedandCleverCommunicationsAustraliaLimited.
Peter has a Bachelor of Commerce and aMasterofBusinessAdministrationfrom the University of Melbourne. He is amemberoftheAustralianInstituteofCompany Directors and a Fellow of CPA Australia.
PeterretiredfromtheBoardofAuroraEnergyeffectivemidnighton1July2014.
Dr Michael Vertigan AC was appointed a Director on 25 November 2010.
MichaelchairstheAustralianMaritimeCollege and is Chair of the Expert Panel undertakingacost-benefitanalysisandreviewofregulationoftheNationalBroadband Network. He is also a Board member of the Commonwealth SuperannuationCorporationandtheAustralian Treasury Advisory Council.
Previously he has been a Director of Eraring Energy and Chair of both the Australian Government Solar Flagship Council and the Australian Government Energy Security Council.
Michael holds an honours degree in economics from the University of Tasmania and a PhD from the University of California (Berkeley). He was awarded an Honorary Doctorate of Laws by the University of Tasmania.
He is a Fellow of the Australian InstituteofCompanyDirectorsandoftheInstituteofPublicAdministration(Australia).
Mr Martin Wallace was appointed a Director on 19 November 2013. He was formerly Secretary of the Tasmanian Department of Treasury and Finance fromOctober2010untilhisretirementinJuly2013.Martinhaspreviouslyheldanumberofseniorexecutiverolesinthe Tasmanian public sector. He was a General Manager and member of Aurora Energy’sExecutiveTeamfrom2004until2010.PriortothishewasDeputySecretary of the Tasmanian Department of Health and Human Services.
MartinhasbeenaDirectoroftheTasmanianPublicFinanceCorporationand a member of the State Grants Commission,amonganumberofBoardappointments held during his working career.Martinholdsanhonoursdegreein economics and is a member of the AustralianInstituteofCompanyDirectors.
Dr Peter Davis became a Director following his appointment as CEO on 19 March2004.PeteristheChairofEziKeyGroup Pty Ltd and a Director of the EnergySupplyAssociationofAustralia.He is a member of the Council of the UniversityofTasmania,andchairsitsBuiltEnvironmentCommittee.Hewaspreviously a Director of Aurora Energy (Tamar Valley) Pty Ltd.
Peter holds a PhD in energy engineering from the University of Queensland and a MasterofBusinessAdministrationfromDeakin University. He is a Fellow of the InstitutionofEngineers,AustraliaandoftheAustralianInstituteofCompanyDirectors.
PeterwasrequiredtoresignfromtheBoards of Aurora Energy Group and EzikeyGroupeffectivemidnighton1July2014.PeterleftAuroraEnergyon30June 2014.
Company Secretary Ms Janelle O’Reilly was appointed on 19 February 2010. Janelle’s role is to assist and facilitate the Board,adviseoncorporategovernance,oversee systems to ensure compliance with statutory and regulatory requirementsandprovidelegaladvice.Janelle holds an honours degree in economics and law from the University ofTasmania,isagraduatememberoftheAustralianInstituteofCompanyDirectors,aFellowoftheGovernanceInstituteofAustralia/CharteredSecretaries Australia and has previously actedinsimilarrolesforASX-listedcompanies in the building products and agribusiness sectors. She was a Director and Company Secretary of Auroracom PtyLtduntil30June2014andisDeputyChairandpublicofficerofAustralianScriptCentre.JanelleleftAuroraEnergy on 30 June 2014 and upon her departure,CarolynPillanswasappointedCompany Secretary of Aurora Energy.
Key governance documents
There are a number of key governance documents that provide the backbone for corporate governance at Aurora Energy.Thesearethe:
• Constitution–whichsetsoutthepurposeandobjectivesofthecompany,whatdecisionsare made by the Shareholders and Directors,andhowtheyaremade,amongotherthings;
• Treasurer’sInstructions/directions– which direct Aurora Energy inrelationtocertainactsoromissionsfromtimetotime; and
• Shareholders’ Statement of Expectations–whichonanannual basis gives Aurora Energy a guideline for the contents of its Corporate Plan.
The key governance documents are supplemented by Board-approved documentsasfollows:
• BoardCharter–specifiestheBoard’spurposeandrole,powers,guidelinesforindependence,howBoardCommitteesmaybeused,theresponsibilitiesoftheChairman,eachDirector,theCEOand the Company Secretary;
• Board Procedures Manual – specifieshowtheBoardprocesswill be administered;

15
• ShareholderCommunicationsPolicy – sets out the various obligationsthecompanyhas to communicate with its Shareholders and how these obligationswillpracticallybemet by the company;
• Protocols for Subsidiary Governance and Subsidiary Charters – the company’s operatingsubsidiarieshavecharters that specify their purpose,objectives,operationsandfinancialtargets,reporting,dividendandcashflowexpectations.Subsidiariesarealso bound by protocols that specify the role of their Boards,theirreportingobligations,howparent company policies apply to them and how governance ismanagedfortheiraudit,risk,remunerationandcompliancedecisions; and
• DelegationsManual–specifieslimits of delegated authority to management and reserved functionsfortheBoard.
Board Committees
The Board has two permanent committees,theAppointmentsandRemunerationCommitteeandtheBoardAudit,RiskandComplianceCommittee.ThesecommitteesenableDirectorstospendmoretimeconsideringthedetailofmattersthanBoardmeetingsallow.Eachcommitteecomprises:
• non-executiveDirectors;
• amajorityofindependentDirectors;
• an independent Chairperson,who is not Chairperson of the Board; and
• at least three members.
Membershipofeachcommitteeisreviewed annually at the December Boardmeeting.ThetermsofappointmentareatthediscretionoftheBoard,butitisdesirabletoarrangethesetomaintaincontinuitywhilebringingafreshperspectivetotheworkofthecommittee.
Atits28November2013meeting,theBoardformedatemporarycommittee,theBoardRetailTransformationCommitteetooverseedeliveryofAuroraEnergy’sfullcompetitionreadiness.
Appointments and Remuneration Committee
TheAppointmentsandRemunerationCommittee(A&RC)assiststheBoardtofulfilitscorporategovernanceresponsibilitiesinrelationto:
• executiveandseniormanagementremunerationstrategiesandpoliciesforfixedandvariableremuneration;
• theadequacyandeffectivenessofremunerationstrategiesandpolicies and performance pay in general;
• succession planning for the AuroraEnergyExecutiveTeam;
• general human resources policiesandpractices;and
• the performance and remunerationoftheChiefExecutiveOfficer.
Inaddition,theCommitteehasaroleinpreparingDirectorselectioncriteria.
The A&RC is governed by a charter. It makesdecisionswithrespectto:
• fixedandvariableremuneration,keytermsofemploymentandremunerationstructure of direct reports totheCEO,theManagerofBusiness Risk & Internal Audit and the Company Secretary;
• thedevelopment,determinationandimplementationofpoliciesforexecutiveandseniormanagementremunerationandconditionsofservice;
• the budget for the annual reviewofexecutiveandseniormanagementremuneration;
• thestructure,designandimplementationof‘atrisk’remunerationandotherperformanceincentiveschemes; and
• the total annual payment for ‘at risk’remuneration.
TheA&RCapprovesmatterssuchaschangestoorganisationalstructure,remunerationpracticesgenerallyandthecompany’s performance management system.Fortheremainingmattersitconsiders,itreviewsandmakesrecommendationsforBoardapproval.
InNovember2011,MrIanCordiner,anon-Boardmember,becameamemberoftheCommittee.MrCordinerhasabackgroundinconsultingtotheconstruction,miningandbankingindustries. He is a former General ManagerofHenryJones(IXL)Group,Managing Director of Riverland Fruit Products in South Australia and General ManagerAdministrationofANL.Ianwasaco-founderoftheexecutivesearchfirmAmropCordinerKingwithaparticularfocus on Board governance and Director search. He is now a coach and mentor toseveralseniorexecutivesandisalsoaBoardmemberoftheNationalTrustinTasmania. Ian holds a civil engineering degree and was a Fellow of the InstitutionofEngineers,AustraliaandoftheAustralianInstituteofCompanyDirectors.
Board Audit, Risk and Compliance Committee
TheBoardAudit,RiskandComplianceCommittee’s(BARCC)primaryobjectiveis to assist the Board to discharge its responsibilitiestoexerciseduecare,diligenceandskillinrelationtotheintegrityofAuroraEnergy’s:
• internal control system;
• monitoring and controlling business risk;
• financialmanagement;
• regulatory compliance systems;
• improving the credibility and objectivityoftheaccountingprocess; and
• improvingtheeffectivenessandindependence of the internal andexternalauditfunctions,andthecommunicationstotheBoard.
AllmattersrequiringtheapprovaloftheBoard are forwarded to the Board as recommendationsfromBARCC.
The BARCC is governed by a charter thatsetsoutitskeyresponsibilitiesandobjectives.
ThefinancialreportsoftheGrouparereviewedbytheCommitteeandindependently audited. The Auditor-General of Tasmania audited the 2013-14 accounts and provided the Directors withanIndependenceDeclarationasrequiredundersection307CoftheCorporations Act 2001.

16
Internal audit is managed via a co-sourcedmodel.Companystaffundertake and supervise some audits and an external party is contracted to undertake other audits where their specialtyresourcesarebeneficialtotheaudit.KPMGhasactedundercontractasthe external party for the past six years. Thecontractwasputouttocompetitivetender in 2010 and this resulted in theappointmentofKPMGasinternalauditoruntil30June2014.Theinternalaudit plan is set by BARCC each year and focuses on applying checks and balances around the company’s key business risks.
The co-sourced arrangement is managed by the Manager Business Risk and Internal Audit in accordance with the internal audit protocols document. TheCommitteereviewsreportsoncompliance and risk management on aquarterlybasis.Itconsiderseachreported non-compliance and monitors how key business risks and their controls change and new risks emerge. Further detail on risk management processes of the company are provided later in this Report.
Board Retail Transformation Committee
The Board Retail Transformation Committee (BRTC) was responsible for overseeing delivery of Aurora Energy’s full competition readiness. The outcomes of the Committee informed the Tasmanian Electricity Supply Industry (TESI) Reform Program of the requirementsforretailsuccessasastand-alone retail business.
TheCommitteeprovidedduediligenceand oversight on behalf of the Aurora EnergyBoardby:
• monitoring progress against key deliverables and milestones asdefinedintheStatementofExpectations;
• providing oversight of the Aurora Energy Retail Strategic Plan and corporate planning process;
• providing oversight on a new policy approach including inrelationtoculture,coststructures and delegated authorities;
• reviewing the governance arrangements for Aurora Energy retail reform periodically and providing advice to the Aurora EnergyChiefExecutiveOfficerandChiefExecutiveOfficer(Designate)onanymattersthat need to be reconsidered as the TESI Reforms progress including:
o considering linkages and synergies with other aspects of the Board approved TESI reform program (including financialstructure);
o providing guidance to the AuroraEnergyExecutiveTeam and the Aurora Energy Retail Management Team on Group relevant material issues; and
o consideringimplicationsofthetransitionto the merged network for the Retail TransformationProgramastherelationshipwithTasNetworksisdefined.
TheCommitteewasalsoresponsiblefor approving any material scope and budget change presented by the CEODesignateorrequestedbytheGovernment. It concluded its work in June 2014.
InJune2013,AuroraEnergyappointeda Board Observer for 12 months. The BoardObserverrolewasofferedasatraining and development opportunity for a Tasmanian who was an aspiring future Director. The Board Observer is not a Director or member of management,butattendsBoardandCommitteemeetingswithaviewtoexperiencing 12 months of corporate governance at Aurora Energy. An advertisementwasplacedinconjunctionwiththeAustralianInstituteofCompanyDirectors and Ms Gina Butler was appointed to this role. Ms Butler was atthetimeNursingDirector–Safety&Quality in the Tasmanian Department of Health and Human Services. She servedinthisrolefromJuly2013untilMay2014whenshelefttotakeupanemployment opportunity overseas.

17
Board meetings
The Board meets monthly. The BARCC andA&RCeachmeetapproximatelyfivetimesayearandasotherwiserequired.The BRTC met approximately fortnightly over a six month period from January 2014.
The members of the BARCC for 2012-13 wereP.S.Lowe(Chair),M.J.VertiganAC,G.L.Willisandfrom19NovemberM.Wallace.ThemembersoftheA&RCfor2012-13wereC.DemartePSM(Chair),I.Cordiner(anonBoardCommitteemember),M.J.DaviesandG.L.Willis.The members of the BRTC were G.L.Willis(Chair),C.DemartePSMandM.Wallace.
Thenumberofmeetings(includingCommitteemeetings)attendedbyeachDirectorwhileinofficeduringthefinancialyearappearinthetablebelow.
Board meetings and permanent committees attended by Directors for the period 1 July 2013 to 30 June 2014
Name
Board meetings held while eligible to
attend
Attended
Audit, Risk & Compliance
meetings held while eligible
to attend
Attended
Appointments &
Remuneration Committee
meetings held while eligible
to attend
Attended
Retail Transformation
Committee meetings held while eligible
to attend
Attended
G.L. Willis 13 13 6 6 10 10 8 8
M.J. Davies 13 13 - 2 10 10 - -
C. Demarte PSM 13 11 - 2 10 10 8 5
P.S. Lowe 13 13 6 6 - - - -
M.J. Vertigan AC 13 12 6 6 - - - -
M.J. Wallace# 7 7 3 3 - - 8 8
P.L. Davis* 13 13 6 6 10 9 8 6
I. Cordiner+ (non-Board member)
- - - - 10 9 - -
* DirectorDavisisnotamemberofanyCommitteesbutattendsmeetingsbystandinginvitation
- ThisDirectorisnotamemberofthisCommittee
+ Non-BoardmemberIanCordinerisamemberoftheAppointmentsandRemunerationCommittee.
# DirectorWallacecommencedhisdirectorshipon19November2013.
NooverseastravelwasundertakenbytheDirectorsortheCEOduringthe2013-14financialyear,withoneoverseastripundertakenbyanemployee.Thetotalcostofthistripwas$11,062.

18
Aurora Executive Team
TheAuroraExecutiveTeamprovidesleadership to the Aurora Energy Group. Itwasresponsibleforimplementingthecorporateandoperationalobjectivesand business plans of the company and making key decisions about how Aurora Energyoperates.WiththeexceptionofCEO(Designate),eachoftheserolesbecame redundant on 30 June 2014 and theincumbentsleftthecompany.
Dr Peter Davis
Chief Executive Officer
AppointedinMarch2004,Peterhasmore than 30 years of experience in the energy industry and is also a member of Aurora Energy’s Board. Peter’s biography appears on page 14 as part of the Board composition.PeterleftAuroraEnergyon 30 June 2014.
Mrs Rebecca Kardos
CEO Aurora Energy Pty Ltd (Designate until 30 June)
RebeccajoinedAuroraEnergyinFebruary 2014 as CEO-Designate fromSynergy,whereshewasGeneral Manager Retail with overall responsibility for approximately one millionresidentialandnon-contestablesmall to medium business customers.
Priortothis,RebeccaheldseniorpositionswithintheutilitiessectorinAustraliaandNewZealand,includingGeneral Manager Retail with the Power andWaterCorporationintheNorthernTerritory.
Rebecca is responsible for ‘business as usual’activitiesintheEnergyBusiness,includingsales,billing,complaintshandlingandcallcentreservices,andleading Aurora Energy through the preparationforandintroductionoffullretail contestability from 1 July 2014.
Rebecca became CEO of Aurora Energy Pty Ltd on 1 July 2014.
Mr Darren Smith
Chief Financial Officer and Head of Commercial Services Division
AppointedinNovember2008,Darrenwas previously Company Secretary and ChiefFinancialOfficerintheenergy,mining and infrastructure-related industries. He has broad experience in a number of countries working within businessasusualandtransformationenvironments. He holds a Bachelor of Science(Accounting)andisagraduatememberoftheAustralianInstitute
ofCompanyDirectors,anaffiliatememberoftheAustralianInstituteofCharteredSecretariesandtheInstituteof Chartered Accountants in England and Wales.
Darren oversees a range of corporate servicesincludingaccounting,taxationandfinance,treasurymanagement,supplychainservices,fleetandfacilities,energyriskandinformationtechnology(operationsandprojects).HeisaformerDirector of Aurora Energy (Tamar Valley) Pty Ltd and was a Director of Auroracom PtyLtduntil30June2014.DarrenleftAurora Energy on 30 June 2014.
Mr André Botha
Former Chief Operations Officer– Distribution Business
AppointedasCOODistributionBusinesson1September2011,AndréhadbeenGeneralManagerNetworkDistributionBusiness since February 2010. Prior to joiningAuroraEnergy,hewasGeneralManagerNetworks&OperationsatUnisonNetworks,NetworkDevelopmentManager at Vector Ltd (New Zealand) and Chief Engineer with Eskom (South Africa). He holds a Bachelor of Electrical Engineering,MasterofElectronicEngineering and Postgraduate Diploma inBusiness.AndreleftAuroraEnergyinDecember 2013.
Mr Warren Batchelor
Chief Operations Officer – Distribution Business
WarrenwasappointedChiefOperationsOfficer-DistributionBusinessinDecember 2013. He previously held thepositionsofProgramManager-RetailReform,StreamLead-NetworkIntegrationandGeneralManagerAsset Investment and Performance withAuroraEnergy,afterjoiningthebusinessin2011.Priortothat,Warrenheld senior roles at Alto Packaging and Unison Networks in New Zealand. He holds both a Bachelor and Masters degree in electrical engineering.
Warrenhasresponsibilityforthemanagement,developmentandoperationofthedistributionsystem,regulatory,commercialandcustomerservices,andfieldservicesdelivery.Healsohostedthesafety,healthandenvironmentfunctionthatisprovidedtothewiderbusiness,andwastheCEOandDirectorofsubsidiaryEziKeyGroupPtyLtdfromDecember2013until30June2014.WarrenleftAuroraEnergyon30June 2014.
Mr Rick Inglis
General Manager Strategy and Corporate Affairs Division and General Manager Reform Transition
AppointedinOctober2010,Rickwaspreviously Group Manager Strategy & DevelopmentandManagerForecasting&AnalyticalServicesatAuroraEnergyandbeforethat,DirectorofProcurement & Property Branch and AssistantDirector,OfficeoftheSecretaryat the Department of Treasury & Finance in Tasmania. He holds a Bachelor of Economics with Honours and is a graduate member of the Australian InstituteofCompanyDirectors.
AsGeneralManagerReformTransitionto lead Aurora Energy’s role in reform of the Tasmanian electricity industry; Rick is responsible for leading Aurora Energy’sstrategicdirection.Hisdivisionalso has responsibility for managing AuroraEnergy’srelationshipwithitsshareholders,publicandstakeholderrelations,internalcommunications,market monitoring and policy coordinationandmajorstrategicprojects.RickleftAuroraEnergyon30June 2014.
Ms Janelle O’Reilly
General Manager Governance Division, Company Secretary and General Counsel
Janelle has been Aurora Energy’s Company Secretary and General Counsel since February 2010 and became General Manager of Governance on 1 January 2011. She is responsible for legalservices,compliance,informationmanagementandbusinessrisk,andshewas also the co-ordinator for crisis and emergency management planning for Aurora Energy. See page 14 for further detailsaspartoftheBoardcomposition.JanelleleftAuroraEnergyon30June2014.
Ms Janelle Whittle
General Manager People and Culture Division
Janelle was appointed to this role inDecember2012,afteractinginitsince July 2012. She previously held thepositionsofPeopleManagerinAuroraEnergy’sDistributionBusinessandEmployeeRelationsManagerforthe wider business. Prior to working atAuroraEnergy,JanellewasManagerPersonnel Services at Tassal Pty Ltd. She holds a Bachelor of Commerce degree.

19
Janelle is responsible for human resourcestrategy,cultureandchangemanagement,recruitment,employeerelations,remunerationandbenefitsandorganisationaldevelopmentacrossAuroraEnergy.JanelleleftAuroraEnergyon 30 June 2014.
Mr Rod Wilkes
Former Executive General Manager, Retail Transition
Rod was appointed to this role in March 2013. As a member of the former CountryEnergy/EssentialEnergyexecutiveteam,heplayedaleadrole in preparing the Country Energy retail business for sale as part of the
NSWGovernment’senergyreformprocess. He then led the successful implementationanddeliveryofretailcustomer services on behalf of Origin Energy,throughaTransitionServicesAgreement. Rod holds a Bachelor of Business degree. Rod had been preparing the retail customer book for sale and the business for delivery oftransitionalservicesarrangementsto new retailers when the sale was withdrawn. Having already commenced worked on transforming the Retail Business to prepare for full retail competition,heleftthispositionin February 2014 when the CEO (Designate) took on ‘business as usual’ andtransitionalresponsibilities.
Aurora Energy organisational chart 2013-2014
COO Distribution business
Executive General Manager Retail
Transition
General Manager Governance
Chief Executive Officer
General Manager Strategy and
Corporate Affairs
Chief Financial Officer
General Manager People and
Culture

20
Legislative compliance
AuroraEnergyissubjecttoalargeamountoflegislationatastateandfederallevel.Keypiecesincludesafety,environmental,electricalindustry,corporationsandconsumerlegislation.Italso needs to ensure compliance with its internal Group and Divisional policies.
The company manages compliance via an integrated compliance framework. Thethreecomponentsofthemodelare:
• a policy for managing compliance – the Board and CEO have approved Group policies outlining the company’s modelcorporatecitizenobjectiveanditsapproachto compliance and non-compliance
• a framework for managing compliance – compliance is managed by complementary components of the CEO and theAuroraEnergyExecutiveTeam,theManagementComplianceCommittee,theGroupcomplianceprogram,compliance plans and complaint management,withregularreportingprovidedtotheBoardAudit,RiskandComplianceCommittee
• activitiesformanagingcompliance – due to the diversityofthebusiness,activitiesformanagingcomplianceoccuratdivisional/functional/subsidiaryandGroup levels.
Independent oversight
Aspartoftheexistinglegislativeframeworkforenergy,Tasmaniahastwoindependentofficeswithanoversightrole:
• TheOfficeoftheTasmanianEconomicRegulator,whichactsasanindependenteconomic,technical and safety regulator
• TheOfficeoftheEnergyOmbudsman,whichactsasan independent mediator in disputes between the electricity and gas industries and their customers.
The Australian Energy Regulator overseesthebusinessinrelationtothe Regulatory Price Submissions from2012onwards.TheOfficeoftheOmbudsmanmoregenerallyinvestigatestheadministrativeactionsofpublic
authoritiestoensurethattheiractionsarelawful,reasonableandfair,andreviews Aurora Energy’s decisions under the Right to Information Act 2009, Public Interest Disclosures Act 2002 and Personal Information Protection Act 2004.EachoftheseActsandmattersraised during the year are discussed further below.
The Integrity Commission and the LegislativeCouncilhavegeneraloversightpowersinrelationtoentitiesincludingstate-ownedcorporations.These bodies have not raised any issuesinrelationtoAuroraEnergyduring2013-14,however,duringthe year the Integrity Commission undertook an Agency Integrity Mapping Projectwhereby27keyagencieswereinterviewedaboutpublicsectorintegrity,gapsthatexist,goodpracticesandareaswhere the Commission can assist an agency. The Commission was pleased to advise that Aurora Energy appeared to exhibitbestpracticeinmanyareas.TheCommission went on to say that a key feature of public sector accountability is that agencies report how they meet importantobligationssuchaseducatingon ethics under s 32 of the Integrity Commission Act 2009. Please refer belowforthisinformation.
Public Interest Disclosures Act
AuroraEnergyissubjecttothePublic Interest Disclosures Act 2002. This Act is intended to encourage and facilitate the disclosure of improper conduct by publicofficersandpublicbodies.TheActprovidesprotectiontopersonswhomake disclosures in accordance with the Act and establishes a system for the mattersdisclosedtobeinvestigatedandforrectifyingactionstobetaken.
Aurora Energy has developed a policy and procedures establishing a system forreportingdisclosuresofimproperconductordetrimentalactionbyAuroraEnergy,itsemployeesorofficers.Theprocedures are available for viewing at auroraenergy.com.auorbycontactingtheProtectedDisclosureOfficer,AuroraEnergyPtyLtd,GPOBox191,HobartTasmania 7001.
No reports were made in 2013-2014 period under this regime.
Right to Information Act
AuroraEnergyiscommittedtocomplying with the Right to Information Act 2009 andactsinafairandobjectivemanner with a view to ensuring that the spirit of the Act is upheld. Details about theActandthecompany’sobligationsunder it are available for viewing at
auroraenergy.com.au/about/about-aurora/policies/right-to-information
Duringthe2013-2014year,widespreadtraining was held across the company to ensure individuals understood Aurora Energy’sresponsibilitiesundertheActandhowtheytieintogoodinformationmanagementpractices.
Duringthe2013-2014financialyear,atotalofthreeformalapplicationsforAssessed Disclosure were received. Inoneofthedeterminations,theinformationappliedforwasprovidedinfull,inthesecondcasetheinformationappliedforwasprovidedinpart,andinthethirdtheinformationsoughtwasnotinexistenceatthetimethattheapplicationwasmade.AuroraEnergyalsoprovidedinformationtoanothergovernmentauthorityinrelationtoaRighttoInformationApplicationthatithad received.
Itisthecompany’sintentiontopromotetheobjectivesoftheActbyimplementingapolicyofroutinelypublishinginformationthatitconsiderstobeofinteresttothepublic,whichissignificant,appropriate,accurateand not otherwise exempt. To that end,AuroraEnergyhasdevelopedaPublicationsRegisterthatallowsthepublictoaccesssuchinformation.Theregister provides access to records by listinginsummaryinformationaboutamatter/incident/releaseandincludesthetitleoftherecord,dateofitsreleaseandadescription.Asearchfacilityisprovided in order to access other items contained in the register that may not bevisibleonscreen.ThePublicationsRegister can be accessed at http://publications.auroraenergy.com.au/.
Personal Information Protection Act
AuroraEnergyissubjecttothePersonal Information Protection Act 2004 (“the PIPAct”)whichprescribesPersonalInformationProtectionPrinciplesforTasmania. Aurora Energy also has privacy obligationsunderotherlegislation(suchas the Electricity Supply Industry (Tariff Customers) Regulations 2008) in various jurisdictionsinwhichitoperatesandhasadoptedtheNationalPrivacyPrinciplesunder the Privacy Act 1988 (Cwth).
Duringthe2013-2014financialyear Aurora Energy received several applicationsandgeneralenquirespursuanttothePersonalInformationProtectionAct.Allhavebeendetermined or resolved.

21
Governance framework guide for Tasmanian Government Businesses
TheTasmanianGovernment,throughtheDepartmentofTreasuryandFinance,has issued a Governance Framework Guide for Tasmanian Government Businesses.
The guide references the eight core principles underpinning good corporate governance as recommended by the ASXCorporateGovernanceCouncilforlisted companies (as they were at the timetheguidewasissued).Whilenotingthattheprincipleswerenotmandated,the Shareholder ministers expressed anexpectationthatthecoreprinciples,whererelevant,wouldbeadoptedbygovernment business Boards.
AuroraEnergyhasadopted,whereapplicable,practicesincompliancewiththose core principles as described below.
Principle 1 - Lay solid foundations for management and oversight by the Board:
The Board and its delegations
TheBoardholdsmonthlymeetingsand an annual strategy day at which itsetsthestrategicdirectionsandobjectivesforthecompany.Inaddition,it approves and monitors the Corporate Planincludingoperatingbudgetsandreceivesandreviewsoperating,financial,energytradingrisk,safetyand environmental performance on a monthly basis. A Board charter sets out theresponsibilitiesoftheBoard,theCEOandtheBoardChair.ItalsospecifiestheroleofeachoftheBoardcommitteesas discussed earlier in this report.
ADelegationsManualdetailslimitsofdelegated authority to management andreservedfunctionsfortheBoard.Management’sresponsibilitiesarealsowelldefinedincompanypoliciesandpositiondescriptions.
The Board has put in place governance protocols and charters for the oversight of its subsidiary companies. TheseprovideprotocolsinrelationtotheapplicationofGrouppolicies,delegationsandreportingtotheparent company and are reviewed as andwhenrequired.TheBoardChair,ChiefExecutiveOfficerandseniormanagementattendandrespondtoquestionsattheannualGovernmentBusinessesParliamentaryScrutinyCommittee.
Directors’ induction
Newly appointed Directors are provided withanintroductoryletterfromtheChairsettingoutthekeytermsandconditionsoftheirappointment.ThecompanyhasaDirectorinductionprogram in place that involves the provision of a Directors’ handbook containing key corporate documents and facilitationofsitevisitsandmeetingswiththeCEO,seniorexecutivesandotherkeypersonnel.Theinductionaims to enable the new Director to gain an understanding of the company’s financial,strategic,operationalandriskmanagementposition,theirrights,dutiesandresponsibilities,theroleoftheBoardandcommitteesandmeetingtimetablesandprocesses.AuroraEnergy’s Board Observer undertook a similarinductionprocess.
Senior management committees
Senior management has established akeycommitteestructuretoprovideassurance across diverse areas of thebusiness.CommitteeschairedbymembersoftheAuroraEnergyExecutiveTeam include Energy Risk Assurance; Treasury;Safety,Health,Sustainabilityand Environment; Management Compliance and Regulatory Environment. Senior management also participateinanumberofissueorproject-specificsteeringormanagementcommitteesandattendBoardandBoardcommitteemeetingsasrequired.
During the year management steering committeeshavebeenusedtooverseethe many aspects of industry reform being implemented by the company includingFullRetailContestability,RetailReformandNetworkIntegration.AReformSteeringCommitteethatcomprisestheAuroraExecutiveTeamalso oversees all aspects of reform.
Senior management performance management
In 2011-12 the company incorporated competency assessment into its performance management process for alllevelsofstaffandmanagement.
The core competencies for all employees areAccountable,CustomerCentric,ImprovementFocus,DecisionMaking,Teamwork,Communicative,Safety,Health and Environment. This process also involves the assessment of performance against the delivery of keyperformanceindicators,setusing‘SMART’methodology,aswellasthedemonstrationofcompetency.Seniormanagers are also set targets for whole ofcompany,divisional,personaland
safety performance. The company makesuseofLifestyleInventorytools,whichincludeperformanceinrelationtocompany values and behaviours.
The Board Chair assesses the performanceoftheChiefExecutiveOfficerwithinputfromtheotherBoardmembers,andtheBoardoverseesthe assessments of the Aurora Energy ExecutiveTeamundertakenbytheChiefExecutiveOfficer.
Principle 2 - Structure the Board to add value:
Independence and appointments
TheBoardofDirectors,includingtheChair,comprisesofindependentnon-executiveDirectors(withtheexceptionof the CEO when he was a Director prior to 1 July). Independence criteria are set out in the Board Charter. The compositionofandappointmentstotheBoard are prescribed by the company’s ConstitutionandtheGuidelinesforTasmanian Government Businesses. Appointments are made directly by the two Shareholders. Their appointment is for a term of up to three years. Non-executiveDirectors,exceptinspecialcircumstances,wouldnotnormallyservemore than three such terms.
DetailsofDirectors’skills,qualificationsand experience are set out earlier in this CorporateGovernancereport,asaretheirattendancesatmeetings.
The Board has adopted the processes recommended in the Tasmanian Government Business Guidelines for theselectionandappointmentofnewDirectors to the Board and for the reappointment of Directors whose terms expire. This process involves a Director selectionpanelandapast-performanceevaluationforthoseDirectorsseekingre-appointment and was used to appoint the company’s current Chairman. Given the TESI reforms this process was not used in 2013 when the Shareholders determined that they would maintain thecurrentBoard,andaugmentitwiththeexperienceofDirectorWallace,untilthe TESI reforms were complete.
Directors have a responsibility to avoid conflictsofinterestwherepossible.Directors disclose their personal interests including other directorships uponjoiningtheBoardanddeclareany changes at the beginning of each Boardmeeting.WhereaDirectorhasamaterialpersonalinterestinamatterbeingconsideredbytheBoard,theDirectormustdeclarethatinterest,andmustnotbepresentwhilethematterisbeingconsidered,orvoteonthe

22
matterunlesspermittedtodosobytheCorporationsAct.TheChiefExecutiveOfficeroftheGroup,DrDavis,wasappointedtothepositionofDirectorinaccordancewiththerequirementsoftheGuidelines for Tasmanian Government Businessesontherecommendationofthe Board. The CEO resigned from the officeofdirectorconsequentlyafterhispositionbecameredundanton30June2014. The CEO from 1 July 2014 has not been appointed a Director of the company.
Board assessment processes
The Board Chair facilitates a performancereviewfortheBoard,thecommitteesandDirectors.TheBoardhas established a formal performance assessmentprocessfortheevaluationofindividual Directors and the performance oftheBoardasawhole,whichittypically uses every third year. These assessmentsarebasedonpeerreview,input from senior management and externalevaluation.Inotheryearsithasused informal processes to assess skills andBoardandcommitteeperformance.In 2013 and 2014 it was determined that a formal performance assessment wasnotwarrantedgiventhetimeframefor the current Board was limited by theTESIreforms;however,informalprocesses were used in both years to assess current skills and performance.
Access to education, training and independent advice
PursuanttotheBoardCharter,Directorsmay seek independent professional advice on any aspect of Aurora Energy’s business at the company’s expense to assistthemtocarryouttheirdutiesasDirectors.Inaddition,theCompanySecretary is accessible to all Directors for advice and assistance. All Directors are encouragedtoparticipateincontinuingeducationandtrainingandotherprofessionaldevelopmentactivities.Thecompany may contribute to payment forattendanceatsuchdevelopmentactivities.
Principle 3 - Promote ethical, responsible decision-making:
Group policies
Aurora Energy has a number of Group policies applicable to all its people that promote ethical and responsible decision-making including the Code of Conduct,DelegationsManual,GroupCompliancePolicy,ProbityPolicy,PublicInterestDisclosures(Whistleblower)Policy,FraudandCorruptionPolicy,andRisk Management Policy. These Policies are being progressively reviewed to
befitforpurposefortherestructuredcompany from 1 July.
The Group Compliance Policy provides that in both its commercial and non-commercialactivities,AuroraEnergyshall endeavour to act as a model corporatecitizenbyactinginanethicalmanner and in accordance with the spirit,aswellastheletter,ofthelaw.
ThesepoliciesapplytotheBoard,allstaffandcontractorsandconsultantsto the extent relevant when carrying out Aurora Energy’s work. Breaches of allpoliciesarerequiredtobereportedas non-compliances and these non-compliances form reports that are preparedfortheAuroraExecutiveTeam,with those that are most serious also being reported to the BARCC. The BARCC also receives an annual report on the company’s compliance performance. Specialnon-compliancereportingarrangements exist for key governance policies to provide those wishing to makereportswithconfidentiality,supportand,ifnecessary,anonymity.
Code of Conduct and Ethics Training
The Code of Conduct sets the standard of behaviour for working at Aurora Energy.ItreflectsAuroraEnergy’scommitment to the highest standards ofhonestyandintegrityinmeetingthe needs of external and internal customers,stakeholdersandthewidercommunity.
During2013-14,trainingonethics,includingtheCodeofConduct,continuedtobecarriedoutacrossthecompanyfornewstarters.Inaddition,mandatory refresher training was carried out in June and July 2014 by Team Leaders with their groups to remind everyone of the nine Code principles and to discuss any lessons orreflectionsfromthepastyear.TheCEO emphasised its importance in his internalcommunicationsandreflectedon the refresher training the Board had received.
Refreshed copies of the Code of Conduct and an ethics checklist were distributed toalltrainingattendees,whosignedoffthattheyhadread,understoodand would comply with the Code. Attendanceattherefreshertrainingeach year is a compulsory licence for the continuingemploymentofallAuroraEnergystaff.Anewemployeestarterpack contains a copy of the Code of Conductandtheinductiontrainingincorporates an online session on the Code.TheChairofBARCC,DirectorLowe made himself available to receive reports on Code of Conduct breaches.
This provides an independent avenue ofreportingforstaffwhomayfeelthey cannot make a report to someone internal at Aurora Energy.
Aurora Energy considers that this ongoingworkdemonstratesfulfilmentofitsobligationtoeducateitsstaffonethicsasrequiredbys32ofthe Integrity Commission Act 2009.
Directors’ responsibilities
Directorsarerequired,pursuanttotheBoardCharter,togetherandindividually,to be aware of and comply with their legal,statutoryandequitabledutiesandobligationswhendischargingtheirdutiesas Directors. The Board Charter expressly requirescompliancewithAuroraEnergy’s policies including the Code of Conduct.
The Board Charter further reinforces the dutiesofDirectorsindecision-makingandconduct,specifyingtheexpectationsthey must meet when making decisions aspartoftheBoardprocess,includingmeetingtheirDirectors’dutiesandavoidingconflictsofinterest.
Oversight
AuroraEnergyissubjecttomanyoversight and checking regimes in relationtothedecisionsitmakes,including the Public Interest Disclosures Act 2002,theRight to Information Act 2009,theIntegrityCommission,ParliamentaryscrutinyhearingsandtheLegislativeCouncilasdiscussedearlierinthis Report.
Performance management
Decision-making is a core competency thatisassessedforeverystaffmemberduring their performance review process.
Principle 4 - Safeguard integrity in financial reporting:
Board Audit Risk and Compliance Committee (BARCC)
The BARCC comprises independent Directorswithdutiesandresponsibilitiestooverseemattersoffinancialintegrity.A full report on the BARCC’s role and its members is given earlier in this report. TheroleoftheChairoftheCommitteeisnot held by the Chair of the Board.
Audit
TheInternalAuditfunctionisprovidedthroughaco-sourcedfunctionmodelutilisingexternalaswellasinternalresources. The Internal Audit Plan is prepared based on Aurora Energy’s risk
23
profileandisapprovedbytheBARCC.The external auditor is the Auditor-GeneralforTasmania,however,Ernst&Young was contracted to undertake the external audit in 2013-14. The Auditor-GeneralorhisrepresentativeregularlyattendsmeetingsoftheBARCC.Inaddition,during2013-14representativesofErnst&Youngattendedmeetingsofthe BARCC that were relevant to the financialreportsandtheirauditforthatyear. Both the Manager of Business Risk and Internal Audit and the outsourced internalauditproviderattendallmeetingsoftheBARCC.
Financial statements
TheChiefExecutiveOfficerandtheGroup Manager Finance give detailed writtenundertakingstotheBoardproviding assurances that the Group’s financialreportspresentatrueandfairview and are in accordance with relevant accountingstandards.
Consistent with S295A of the CorporationsAct,whichappliestoListedCompanies,theAuroraEnergyCEOandGroup Manager Finance have provided a writtenstatementtotheBoardthat:
• their view on the company’s financialreportisfoundedon a sound system of risk management and internal complianceandcontrol,whichimplementsthefinancialpolicies adopted by the Board; and
• the company’s risk management and internal compliance and control system isoperatingeffectivelyinallmaterial respects.
InrelationtowrittenstatementsoftheCEOandGroupManager,theBoardagreeswithASXonthismatterandnotesthatduetoitsnature,internalcontrolassurance can only be reasonable rather than absolute. This is due to such facts astheneedforjudgement,theuseoftestingonasamplebasis,theinherentlimitationsininternalcontrolandbecause much of the evidence available is persuasive rather than conclusive and therefore is not and cannot be designed to detect all weaknesses in control procedures.
Inresponsetothis,acomplianceandinternalcontrolquestionnairemustbe completed by key management personnel and certain senior managers of Aurora Energy’s business units,includingseniorfinancialpersonnel,insupportofthesewrittenrepresentations.Withrespectto
thecurrentyear,theoutgoingKeyManagement Personnel of the Group providedrepresentationsasat30June2014totheincomingChiefExecutiveOfficeron1July2014andthepersonresponsible for the Chief Financial Officerfunction,theGroupManagerFinance.
FinancialreportingandcomparisontoBudgets and latest forecasts is part of themonthlymanagementreportingtothe Board.
Principle 5 - Make timely and balanced disclosure:
Aurora Energy is not a listed company andthereforedoesnothavereportingobligationstoanystockexchange.However,itreportstoitsShareholdersinaccordancewithstatutoryobligations,shareholderdirectionsandobligationsprovidedintheCompany’sConstitution,includingviaitsCorporatePlan,ahalf-yearlyreport,post-Boardbriefingsandan annual report.
TheAuroraEnergyConstitutionplacesanobligationonDirectorstonotifyShareholderswheremattersarisethatmaypreventorsignificantlyaffecttheachievementofstrategicorfinancialobjectivesortargets.TheBoardassesses as necessary whether any such notificationisrequiredandShareholdersaregivenregular,lessformalbriefingsonkey issues and developments.
The Board-approved Shareholder CommunicationsPolicysummarisesthecompany’sdisclosureobligationstoShareholdersandstipulateshowtheywill be met by the company on a day-to-day basis.
Principle 6 - Respect the rights of Shareholders: disclosure
ThecompanyhasformalreportingobligationsunderitsConstitutionandapplicablelegislationandasnotedabove,hasaBoard-approvedShareholderCommunicationsPolicy.TherelationshipwiththeShareholdersandthe wider community is recognised in the company’s stated purpose – to see the Tasmanian community prosper from ourefforts.
The Shareholders are briefed on the company’s strategic plans and the company Chair and CEO regularly participateinlessformalbriefingswiththeportfolioShareholdersfollowingmeetingsoftheBoard.Atthecompany’sAGM,theCEOprovidesthe Shareholders with an update on performance.
Dividend
AfterfinalisingtheCompany’saccountseachyear,theBoardmakesadividendrecommendationtotheshareholding ministers in accordance withthedividendrequirementsoftheCorporationsActandtheGovernment’sdividendpolicy.The$40milliondividenddeclared by Aurora Energy for the year ended 30 June 2014 was not paid prior to 30 June 2014. This dividend will be paid by TasNetworks in December 2014 asprescribedinthegazettedTransferNoticedated25June2014.
Principle 7 - Recognise and manage risk:
AuroraEnergyhastraditionallybeenexposed to risks such as supply interruptionsasaresultoftechnicalfailuresorwatershortages,damagefrombushfiresorinjuriestothepublicoremployeesresultingfromnegligence.Aurora Energy needs to manage the opportunitiesandchallengesarisingfromoperatinginacompetitivemarketas well as responding to changes to the external environment as the industry shifts.Thisincludesmanagingtherisksassociated with changes from economic andotherjurisdictionalpressuresaswellas industry and government reforms.
The business manages these risks in accordance with the Aurora Energy Group Risk Management Policy. This policy is supported by a complementary integrated risk management model that outlines how risk management is to be applied across Aurora Energy to ensure consistencyandefficiency.
AuroraEnergyiscommittedtotheeffectivemanagementofitsbusinessriskstoachievetheorganisation’sstatedvision,purposeandstrategicobjectives:
• Our purpose – to see the Tasmanian community prosper fromourefforts;
• Strategic focus – to meet customer needs at the lowest sustainable cost.
Toachievethis,AuroraEnergy:
• prepares and delivers a risk managementplan,includingstrategies for managing key business risks;
• integrateseffectiveriskmanagement,inaccordancewith the company’s integrated risk management model and ‘riskmastery’culture,intoallbusiness and management activitiesandappropriatepolicies;

24
• makes the necessary resources available to assist those accountable and responsible for managing risk;
• mitigatesriskexposurestoalevel that is in accordance with AuroraEnergy’sriskappetite;
• manages risks in a manner that is commensurate with expectationsofitsShareholdersanditslegalobligations;
• undertakesregularreportingofthecorporateriskprofiletotheBARCCwiththerespectiveBoard reviewing the associated risk management strategies; and
• undertakesreportingofkeybusiness risks and strategies for managing these risks to key stakeholders.
AuroraEnergy’sfundamental,underlyingrisk principles are consistent with AS/NZSISO31000:2009.AuroraEnergy’s internal audit group performs regularauditsofmitigatingactionsoninternalcontrolsidentified.Thegroupis independent of management and reportsfunctionallytotheBARCC.
Principle 8 - Remunerate fairly and responsibly:
Appointments and Remuneration Committee
The Board has established an AppointmentsandRemunerationCommitteethatisaccountablefor ensuring that Aurora Energy’s remunerationpoliciesandpracticesareresponsibleandeffective.
Underitscharter,theCommitteeisresponsible and accountable to the Board for a range of human resource
relatedmattersincludingexecutiveandseniormanagementremunerationstrategies and policies in accordance withShareholderexpectations,endorsingexecutivemanagementappointments,terminationsandsuccessionplanning,thecompany’srecruitment,retention,andterminationproceduresforSeniorExecutives,significantchangestoorganisationalstructures,theenterpriseagreementstrategy including the wages budget andbargainingarena.TheCommitteerecommends to the Board any annual adjustmentstoCEOremunerationbasedon market movement and industry practice,andperformanceisassessedby the Board Chair with input from the remainder of the Board.
TheCommitteeisresponsibleforthe Board appointments process as established by the Guidelines for Tasmanian Government Businesses – Board Appointments.
Remuneration policy
Aurora Energy has an Enterprise AgreementapprovedbytheFairWorkAustralia Commission. The Enterprise Agreement determines the terms and conditionsofemploymentforthemajorityoftheworkforce.ThecompanyalsohasanExecutiveManagementRemunerationPolicyapprovedbytheBoard,whichdeterminesthesalaryandfinancialbenefitsappliedtothecompany’sexecutiveandseniormanagement.
TheAppointmentsandRemunerationCommitteeisresponsibleforendorsingdevelopment and succession plans for executivemanagementpositions.
ADirectorandExecutiveRemunerationGuideline has also been issued and a directionprovidedbytheShareholders
whichrequirescomplianceafteraperiodoftransition.
Directors are remunerated in accordance with a salary structure advised by the Treasurer,accordingtoabandstructurebased on the net assets and complexity of each business. There is no scheme for retirement benefits other than superannuation.
Assessing performance
Asdiscussedabove,allAuroraEnergyemployeesparticipateinperformancemanagement reviews twice each year. This process includes the assessment of performance against the delivery ofkeyperformanceindicators,setusing‘SMART’methodology,aswellasthedemonstrationofcompetencyinselectedcore,technical,professionaland leadership categories selected for theirparticularroles.
InadditiontotheCorporateGovernancePrinciples,aGovernanceFrameworkGuideandspecificguidelineshavebeenissued by the Tasmanian Government inrelationto:BoardAppointments;AppointingtheCEOasaMemberoftheBoard;CapitalInvestment,CorporatePlanning,DebtMaturityStructure,DirectorInduction,EducationandTraining; Assessing Board Performance; Subsidiary Companies and Joint Ventures; Government Business Borrowings; Dividends; Overseas Travel; ReportingGuidelines;DebtMaturityStructure and Guarantee Fee Policy.
AuroraEnergyhas,whereappropriateforitsparticularcircumstances,adoptedpracticesandproceduresincompliancewith those guidelines.
The Tasmanian Government’s Principles for Strengthening the Oversight and Governance of Government Businesses also apply to Aurora Energy.
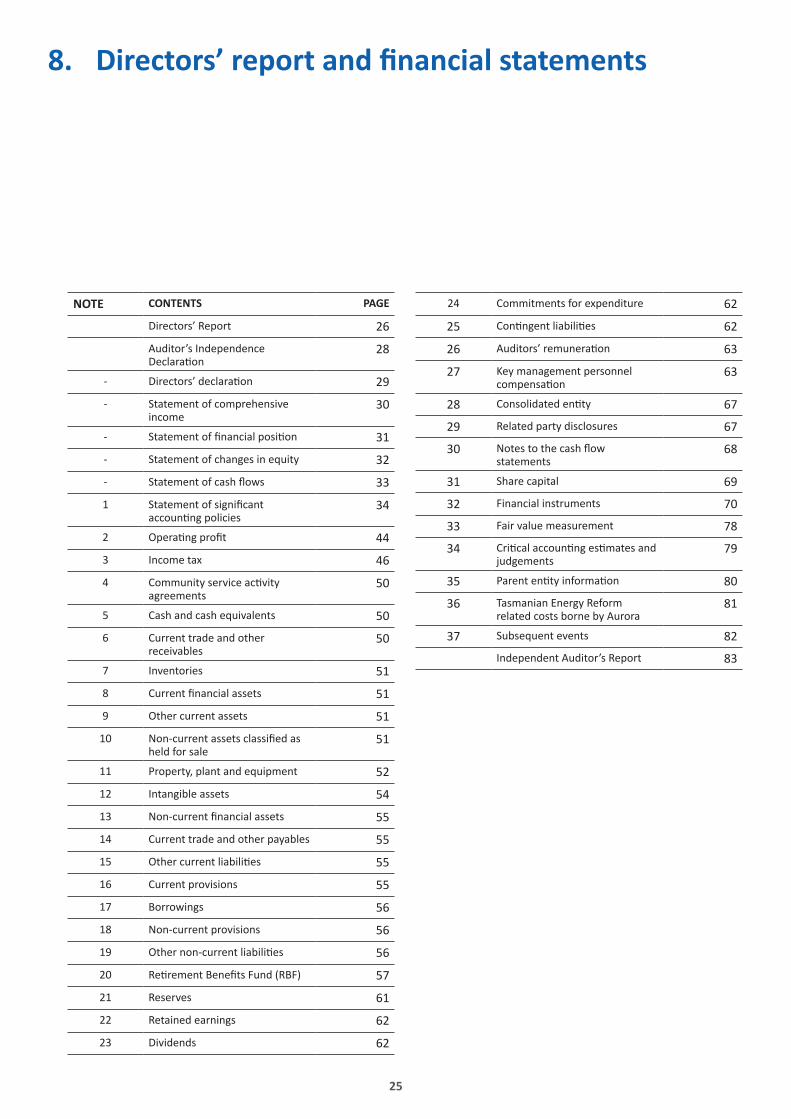
25
8. Directors’ report and financial statements
NOTE CONTENTS PAGE
Directors’ Report 26
Auditor’s Independence Declaration
D328
- Directors’declaration 29
- Statement of comprehensive income
30
- Statementoffinancialposition 31
- Statementofchangesinequity 32
- Statementofcashflows 33
1 Statementofsignificantaccountingpolicies
34
2 Operatingprofit 44
3 Income tax 46
4 Communityserviceactivityagreements
50
5 Cashandcashequivalents 50
6 Current trade and other receivables
50
7 Inventories 51
8 Currentfinancialassets 51
9 Other current assets 51
10 Non-currentassetsclassifiedasheld for sale
51
11 Property,plantandequipment 52
12 Intangible assets 54
13 Non-currentfinancialassets 55
14 Current trade and other payables 55
15 Othercurrentliabilities 55
16 Current provisions 55
17 Borrowings 56
18 Non-current provisions 56
19 Othernon-currentliabilities 56
20 RetirementBenefitsFund(RBF) 57
21 Reserves 61
22 Retained earnings 62
23 Dividends 62
24 Commitments for expenditure 62
25 Contingentliabilities 62
26 Auditors’remuneration 63
27 Keymanagementpersonnelcompensation
63
28 Consolidatedentity 67
29 Related party disclosures 67
30 Notestothecashflowstatements
68
31 Share capital 69
32 Financial instruments 70
33 Fair value measurement 78
34 Criticalaccountingestimatesandjudgements
79
35 Parententityinformation 80
36 Tasmanian Energy Reform related costs borne by Aurora
81
37 Subsequentevents 82
Independent Auditor’s Report 83
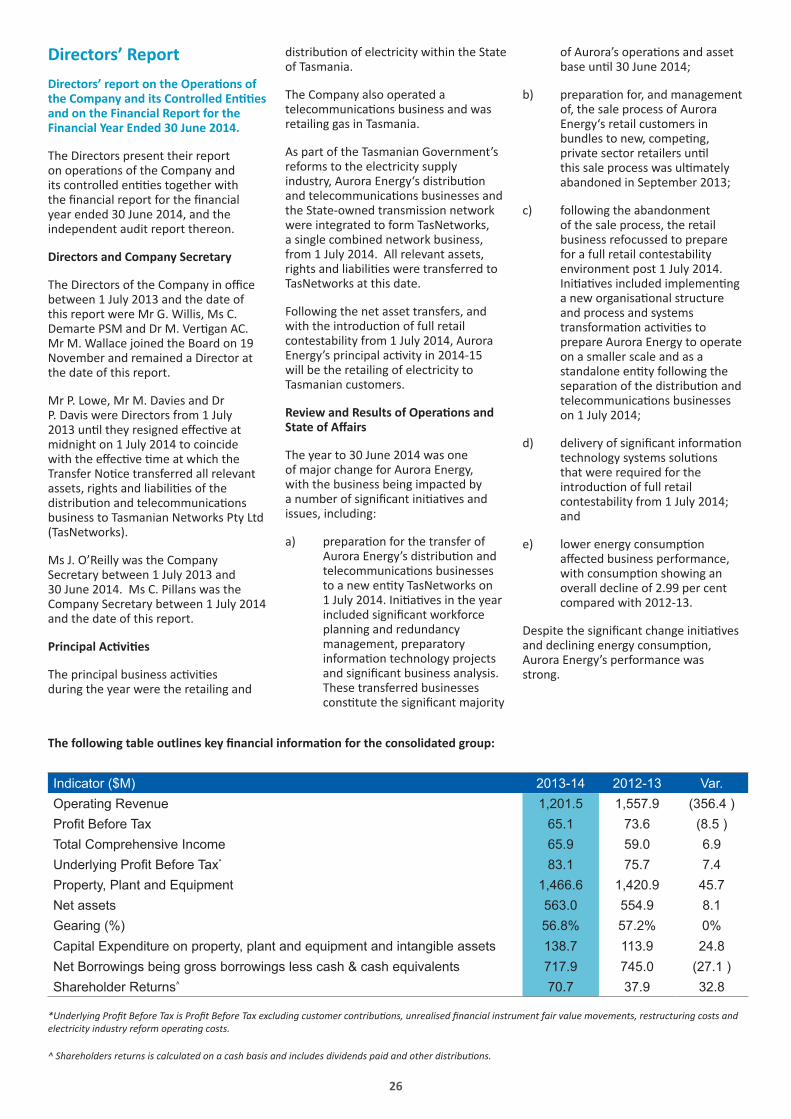
26
Directors’ Report Directors’ report on the Operations of the Company and its Controlled Entities and on the Financial Report for the Financial Year Ended 30 June 2014.
The Directors present their report onoperationsoftheCompanyanditscontrolledentitiestogetherwiththefinancialreportforthefinancialyearended30June2014,andtheindependent audit report thereon.
Directors and Company Secretary
TheDirectorsoftheCompanyinofficebetween 1 July 2013 and the date of thisreportwereMrG.Willis,MsC.DemartePSMandDrM.VertiganAC.MrM.WallacejoinedtheBoardon19November and remained a Director at the date of this report.
MrP.Lowe,MrM.DaviesandDrP. Davis were Directors from 1 July 2013untiltheyresignedeffectiveatmidnight on 1 July 2014 to coincide withtheeffectivetimeatwhichtheTransferNoticetransferredallrelevantassets,rightsandliabilitiesofthedistributionandtelecommunicationsbusiness to Tasmanian Networks Pty Ltd (TasNetworks).
Ms J. O’Reilly was the Company Secretary between 1 July 2013 and 30 June 2014. Ms C. Pillans was the Company Secretary between 1 July 2014 and the date of this report.
Principal Activities
Theprincipalbusinessactivitiesduring the year were the retailing and
distributionofelectricitywithintheStateof Tasmania.
The Company also operated a telecommunicationsbusinessandwasretailing gas in Tasmania.
As part of the Tasmanian Government’s reforms to the electricity supply industry,AuroraEnergy‘sdistributionandtelecommunicationsbusinessesandthe State-owned transmission network wereintegratedtoformTasNetworks,asinglecombinednetworkbusiness,from1July2014.Allrelevantassets,rightsandliabilitiesweretransferredtoTasNetworks at this date.
Followingthenetassettransfers,andwiththeintroductionoffullretailcontestabilityfrom1July2014,AuroraEnergy’sprincipalactivityin2014-15will be the retailing of electricity to Tasmanian customers.
Review and Results of Operations and State of Affairs
The year to 30 June 2014 was one ofmajorchangeforAuroraEnergy,with the business being impacted by anumberofsignificantinitiativesandissues,including:
a) preparationforthetransferofAuroraEnergy’sdistributionandtelecommunicationsbusinessestoanewentityTasNetworkson1July2014.Initiativesintheyearincludedsignificantworkforceplanning and redundancy management,preparatoryinformationtechnologyprojectsandsignificantbusinessanalysis.These transferred businesses constitutethesignificantmajority
ofAurora’soperationsandassetbaseuntil30June2014;
b) preparationfor,andmanagementof,thesaleprocessofAuroraEnergy‘s retail customers in bundlestonew,competing,privatesectorretailersuntilthissaleprocesswasultimatelyabandoned in September 2013;
c) following the abandonment ofthesaleprocess,theretailbusiness refocussed to prepare for a full retail contestability environment post 1 July 2014. Initiativesincludedimplementinganeworganisationalstructureand process and systems transformationactivitiestoprepare Aurora Energy to operate on a smaller scale and as a standaloneentityfollowingtheseparationofthedistributionandtelecommunicationsbusinesseson 1 July 2014;
d) deliveryofsignificantinformationtechnologysystemssolutionsthatwererequiredfortheintroductionoffullretailcontestability from 1 July 2014; and
e) lowerenergyconsumptionaffectedbusinessperformance,withconsumptionshowinganoverall decline of 2.99 per cent compared with 2012-13.
Despitethesignificantchangeinitiativesanddecliningenergyconsumption,Aurora Energy’s performance was strong.
The following table outlines key financial information for the consolidated group:
Indicator ($M) 2013-14 2012-13 Var.Operating Revenue 1,201.5 1,557.9 (356.4 )Profit Before Tax 65.1 73.6 (8.5 )Total Comprehensive Income 65.9 59.0 6.9Underlying Profit Before Tax* 83.1 75.7 7.4Property, Plant and Equipment 1,466.6 1,420.9 45.7Net assets 563.0 554.9 8.1Gearing (%) 56.8% 57.2% 0%Capital Expenditure on property, plant and equipment and intangible assets 138.7 113.9 24.8Net Borrowings being gross borrowings less cash & cash equivalents 717.9 745.0 (27.1 )Shareholder Returns^ 70.7 37.9 32.8
*Underlying Profit Before Tax is Profit Before Tax excluding customer contributions, unrealised financial instrument fair value movements, restructuring costs and electricity industry reform operating costs.
^ Shareholders returns is calculated on a cash basis and includes dividends paid and other distributions.

27
Operatingrevenuedecreasedyearonyear due to the divestment of the Tamar ValleyPowerStation,thetransitionoutofretailingactivitiesonmainlandAustraliaandaregulatedpricereductionof 5.22 per cent on 1 January 2014. Aurora Energy also experienced lower consumptionandexternalcontractingactivities,drivenbyarangeofexternalfactors.
Profitbeforetaxfortheyeardecreasedby$8.5millionto$65.1millionreflectingthe impact of electricity reform and restructuringcosts,partiallyoffsetbybenefitsrealisedfromprioryearrestructuringandtransformationactivities.
The Directors consider that the concept of UnderlyingProfitBeforeTax,asdefinedonpage26,usefultounderstandperformancewhich is not impacted by electricity industry reform,restructuringcostsandtheimpactofthevaluationofelectricityderivativeswhichcanvarysignificantlyyearonyear,orwheretheresultisinfluencedbythelevelofcapitalcontributionsreceivedtowards customer works. The items have been treated consistently in the 2013-14 and2012-13yearsabove.Onthisbasis,underlyingProfitBeforeTaxrosefrom$75.7millionin2012-13to$83.1millionin2013-14.Thisinformationhasnotbeenauditedor reviewed.
Cashflowfortheyearwasstrongand capital expenditure remained constrained on the back of weak customerdemand.Distributionassetvalues increased in line with CPI and intangible assets increased as a result of expenditure incurred on systems to prepare for full retail contestability. Improvedoperationalperformanceduring the year was able to more than covercapitalexpenditure,leadingtoanet debt (borrowings less cash and cash equivalents)reductionof$27millionduring the year.
Aurora Energy has been able to deliver strong sustainable returns for the Tasmaniancommunity,whileatthesametimeensuringalesseningofupward pressure on electricity prices. Shareholder returns increased during the2013-14yearwitha$25milliondividendpaidcomparedwith$16million paid in respect of the 2012-13 year.Otherdistributionspaidduringthe2013-14 year were also higher compared withthe2012-13yearduetothetimingofincometaxequivalentpayments.
Significant Changes in the State of Affairs during the Year
As a result of the developments set out above,effective1July2014,Aurora’s
distributionandtelecommunicationactivities,assets,rightsandliabilitieswere transferred to TasNetworks via a gazettedTransferNoticedated25June2014.
Followingthetransfer,andwiththeintroductionoffullretailcontestability,Aurora Energy now operates as a standalonecompetitiveretailbusinessinTasmania.
Environmental Regulation
TheoperationsoftheCompanyaresubjecttoStateandCommonwealthenvironmentallegislationincludingtheTasmanian Environmental Management and Pollution Control Act 1994 and the Commonwealth Environment Protection and Biodiversity Conservation Act 1999. Noenvironmentalprotectionnoticeswereserved,prosecutionslaunchedorfinesissuedagainstAuroraunderenvironmentallegislationduringtheyear under review.
Environmental Incidents
All environmental incidents that caused or could have caused material or serious environmental harm were reported to theDepartmentofPrimaryIndustries,Parks,WaterandtheEnvironment.Reportswerealsomadeinrelationtooilspills,incorrectdisposalofwaste,licence exceedances and any impact on threatened wildlife species caused by contactwiththeelectricaldistributionsystem.
Indemnification and Insurance
The Tasmanian State Crown provided indemnitiesinfavouroftheinitialdirectors,MrJ.HaskerAM,MrG.LoughranandDrD.Norton,againstliabilitiesarisingoutoftheCompanyenteringintoanumberofspecifiedcontracts at commencement of operationsinJuly1998andinrelationtoany sale or lease of the assets or shares of the company pursuant to an Act of Parliament.
TheCompanyhasindemnifieddirectorsandotherofficersasdefinedbytheCorporations Act 2001 against any liability incurred in their role and in relationtoreasonablelegalcostsindefendingactionsforsuchliability.Thecompanyhasinsureditsdirectors,officersandemployeesandthedirectorsandofficersofcontrolledentities,againstliabilitiesaspermittedbytheCorporationsAct,includingbytakingoutrunoffinsurance.
The Electricity Reform Act 2012 indemnifiesthedirectors,officers,employees and agents of Aurora Energy
and other State owned electricity entitiesforanyactionsorinactionstaken in good faith in compliance with a directionissuedundersection8oftheAct.Italsoindemnifiessuchpersonsfromanyliabilityincurredinrelationtoactionsorinactionstakeningoodfaithincompliancewitharequestforinformation,adviceorassistancefromthe Electricity Reform Co-ordinator and otherwise protects the disclosure or use ofinformationandotheractionscarriedout for the purposes of electricity reform.
Auditor’s independence declaration
A copy of the auditor’s independence declarationasrequiredundersection307CoftheCorporationsAct2001issetout on page 83 of the Financial Report.
Rounding of Amounts
Amounts in the Directors’ Report have beenroundedoffinaccordancewiththatClassOrder98/100tothenearestthousand dollars.
Signed in accordance with
resolution of the Directors:
G. WillisChairman12 August 2014
M. VertiganDirector12 August 2014

28
V
12 August 2014 The Board of Directors Aurora Energy Pty Ltd Level 2 21 Kirksway Place Hobart TAS 7000 Dear Board Members Auditor’s Independence Declaration In accordance with section 307C of the Corporations Act 2001, I provide the following declaration of independence. As the auditor of the financial report of Aurora Energy Pty Ltd for the financial year ended 30 June 2014, I declare that to the best of my knowledge and belief, there have been no contraventions of:
a) the auditor independence requirements of the Corporations Act 2001 in relation to the audit; and
b) any applicable code of professional conduct in relation to the audit. Pursuant to section 298(1)(c) of the Corporations Act 2001 a copy of this declaration must be included in the Directors’ report. Yours sincerely
E R De Santi Deputy Auditor-General Delegate of the Auditor-General

29
Directors’ Declaration
In accordance with a resolution of the directors of Aurora Energy Pty Ltd, we state that:
In the opinion of the directors:
(a) the financial statements and notes of the consolidated entity are in accordance with the Corporations Act 2001, including(i) giving a true and fair view of the consolidated entity’s financial position as at 30 June 2014 and of its
performance for the year ended on that date; (ii) complying with Australian Accounting Standards (including Australian Accounting Interpretations) and
the Corporations Regulations 2001;(b) there are reasonable grounds to believe that the consolidated entity will be able to pay its debts as and
when they become due and payable.
On behalf of the Board

30
Statement of comprehensive income for the financial year ended 30 June 2014
Consolidated
2014 2013
Note $’000 $’000
Restated*
Revenue 2A 1,201,470 1,557,873Othergains/(losses) 2A 1,501 (5,694)Energy and transmission purchases 2A (681,424) (1,063,223)Electricityderivativefairvaluemovements 2A (79,958) 7,597Functionalexpenses 2A (180,060) (186,039)Finance costs 2G (54,533) (71,782)Depreciationandamortisationexpense 2H (102,344) (119,692)Otherexpensesfromoperatingactivities (39,571) (45,443) Profit before income tax equivalent expense 65,081 73,597Incometaxequivalentexpense 3 (1,090) (22,111)
Profit for the year 63,991 51,486 Other comprehensive income Itemsthatwillnotbereclassifiedsubsequentlytoprofitorloss Gain/(loss)onrevaluationofassets 11,21(b) 26,688 (3,360)Actuarialsuperannuationre-measurementgains/(losses) (7,364) 10,899Incometaxequivalentrelatingtoitemsthatwillnotbereclassifiedsubsequently 3(b),21 (5,797) (2,262) 13,527 5,277 Itemsthatmaybereclassifiedsubsequentlytoprofitorloss Cashflowhedges:
(Loss)/gaintakentoequity 21(b) (13,083) 7,601Transferredtoprofitfortheyear 21(b) (3,520) (4,432)
Incometaxequivalentrelatingtoitemthatmaybereclassifiedsubsequently 3(b),21(b) 4,981 (951) (11,622) 2,218Othercomprehensiveincomefortheyearnetofincometaxequivalent 1,905 7,495
Total comprehensive income for the period
65,896 58,981
*Certainamountsshownheredonotcorrespondtothe2013financialstatementsandreflectadjustmentsmade,refernote1,page 35.
Notes to and forming part of the accounts are included on pages 34-82

31
Statement financial position as at 30 June 2014 Consolidated
2014 2013
ASSETS Note $’000 $’000
Current assets Cashandcashequivalents 5 44,679 4,813Trade and other receivables 6 176,550 231,687Inventories 7 20,732 27,219Financial assets 8 6,514 18,741Other current assets 9 6,126 3,767 254,601 286,227Non-currentassetsclassifiedasheldforsale 10 - 1,144Total current assets 254,601 287,371 Non-current assets Property,plantandequipment 11 1,466,593 1,420,910Deferred tax assets 3(d) 59,484 46,053Intangible assets 12 69,670 52,938Financial assets 13 34,597 8,924Total non-current assets 1,630,344 1,528,825
Total assets 1,884,945 1,816,196 LIABILITIES Current liabilities Trade and other payables 14 123,208 148,282Borrowings 17 103,290 75,545Current tax payable 3(c) 22,294 19,957Provisions 16 61,052 21,514Othercurrentliabilities 15 67,465 53,217Total current liabilities 377,309 318,515 Non-current liabilities Borrowings 17 659,280 674,268Deferredtaxliabilities 3(d) 143,062 159,942
Provisions 18 104,139 94,200Othernon-currentliabilities 19 38,139 14,353Total non-current liabilities 944,620 942,763
Total liabilities 1,321,929 1,261,278
Net assets 563,016 554,918 EQUITY Issued capital 31 232,319 225,116Reserves 21 184,434 177,375Retained earnings 22 146,263 152,427
Total Equity 563,016 554,918
Notes to and forming part of the accounts are included on pages 34-82

32
Statement of changes in equity for the financial year ended 30 June 2014
Consolidated
Share
Capital
Asset revaluation
reserve
Cash flow hedge
reserveRetained earnings Total equity
Note $’000 $’000 $’000 $’000 $’000 Balance 1 July 2012 314,255 185,178 (7,575) 109,218 601,076Profitfortheperiod(restated*) - - - 51,486 51,486Disposal of assets - revalued amount - (94) - 94 -Other comprehensive income (restated*) - (2,352) 2,218 7,629 7,495Total comprehensive income for the period - (2,446) 2,218 59,209 58,981Transactions with owners in their capacity as owners:
Capital return (Transfer of AETV) 1 (89,139) - - - (89,139)Dividends paid 23 - - - (16,000) (16,000)Balance 30 June 2013 (restated *) 225,116 182,732 (5,357) 152,427 554,918Profitfortheperiod - - - 63,991 63,991Disposal of assets - revalued amount - - - - -Other comprehensive income - 18,681 (11,622) (5,155) 1,904Total comprehensive income for the period - 18,681 (11,622) 58,836 65,895Transactions with owners in their capacity as owners:
Contributed capital 31 7,203 - - - 7,203Dividendspaid/provided 23 - - - (65,000) (65,000)Balance 30 June 2014 232,319 201,413 (16,979) 146,263 563,016
*Certainamountsshownheredonotcorrespondtothe2013financialstatementsandreflectadjustmentsmade,refernote1,page 35.
Notes to and forming part of the accounts are included on pages 34-82

33
Statement of cash flows for the financial year ended 30 June 2014
Consolidated
2014 2013
Note $’000 $’000
Cash flows from operating activities
Receipts from customers 1,334,960 1,634,420Interest received 965 1,832Payments to suppliers and employees (1,088,150) (1,389,543)
SettlementofAETVintercompanyaccountontransfer 1 - (17,296)
Interestandotherfinancecostspaid (40,653) (54,300)
Government guarantee fees (9,679) (12,188)
Incometaxequivalentspaid (29,881) (3,386)
Net cash provided by operating activities 30(c) 167,562 159,539
Cash flows from investing activities
Proceedsfromsaleofproperty,plantandequipment 3,256 4,972Paymentforproperty,plantandequipment (107,038) (99,017)Payment for intangible assets (31,644) (14,840)Net cash used in investing activities (135,426) (108,885)
Cash flows from financing activities
Proceedsfromcontributionofequity 7,203 -Proceeds from borrowings 582,483 801,056Repayment of borrowings (569,726) (920,825)Dividend paid (25,000) (16,000)Net cash provided by financing activities (5,040) (135,769)
Net increase in cash and cash equivalents
27,096 (85,115)
Cash and cash equivalents at the beginning of financial year
4,813 89,928
Cash and cash equivalents at the end of financial year 30(a) 31,909 4,813
1AuroraEnergy(TamarValley)PtyLtdtransferredtoHydroTasmaniaon1June2013.ThistransactionwastreatedasadistributiontoAurora’sshareholdersequivalenttothenetassetsofAuroraEnergy(TamarValley)PtyLtdat31May2013($89.139M).Thetransferwasfornilcashconsideration.Ofthetotalamountofnetassetstransferred,$17.296MrepresentedtheAETVintercompanyaccountwhichwassettledposttransfer.
Notes to and forming part of the accounts are included on pages 34-82

34
1. Statement of Significant Accounting Policies
AuroraEnergyPtyLtdisaprivatecompany,incorporatedinAustraliaandoperatinginAustralia.
Aurora’sregisteredofficeanditsprincipalplaceofbusinessareasfollows:
Registeredoffice:Level121KirkswayPlaceHOBARTTAS7000
Principalplaceofbusiness:21KirkswayPlaceHOBARTTAS7000
Upuntil30June2014theentity’sprincipalactivitieswerethedistributionandretailingofelectricityand,until31May2013,generationwasalsoaprincipalactivityofthecompany.Witheffectfrom1July2014,theprincipalactivityofthecompanyistheretailingofelectricityinafullycompetitiveenvironment.
Thefinancialstatementswereauthorisedforissuebythedirectors on 12 August 2014.
Basis of preparation
ThefinancialreportisageneralpurposefinancialreportwhichhasbeenpreparedinaccordancewiththeCorporationsAct2001asamendedandAustralianAccountingStandards(AASBs),andcomplieswithotherrequirementsofthelaw.
ThefinancialreportispresentedinAustraliandollarsandallvaluesareroundedtothenearestthousanddollars($’000)unless otherwise stated.
Thefinancialstatementsarepreparedonanaccrualbasisunderthehistoricalcostconventionwiththeexceptionofcertainproperty,plantandequipmentandcorrespondingdepreciation,investmentsandderivativefinancialinstrumentswhich are carried at fair value.
On15May2012(andinsubsequentupdates)theMinisterforEnergy announced a comprehensive and integrated reform package for the Tasmanian electricity industry which has significantlyaffectedAurora’sprincipalactivities:
• AuroraEnergy(TamarValley)PtyLtd(AETV),asdefinedintheTransferNoticegazettedonthe29May2013,transferred to Hydro Tasmania as part of the electricity reformson1June2013.ThistransactionwastreatedasadistributiontoAurora’sshareholdersequivalenttothe net assets (at book value) of AETV at 31 May 2013 ($89.139M).Thetransferwasfornilcashconsideration;
• FollowingtheAETVtransferandfinalreconciliation,anadjustmentwasmadetotheaboveamountwhichledtoanequitycontributionof$7.296Mfromtheshareholdersin the 2013-14 year.
• On1July2014,themergerofAurora’sdistributionandtelecommunicationsbusinesseswithTransendPtyLtdconcluded,withthenewbusinessTasmanianNetworks
PtyLtd(TasNetworks)commencingoperationson1July2014.RelevantassetsandliabilitiesweretransferredfromAuroratoTasNetworksviaagazettedTransferNoticedated25June2014.ThistransactionwastreatedasadistributiontoAurora’sshareholdersequivalenttothenetassets (at book value) of the non-Retail related net assets transferredtoTasNetworks(approximately$523M).Thistransferwasfornilcashconsideration;and
• FullretailcompetitionwasintroducedinTasmaniaon1July2014.AurorawillcontinueasanenergyretailerinTasmania from 1 July 2014.
Inresolvingthatthe2013-14financialstatementsbepreparedon a going concern basis the Directors have relied on the projectedfinancialperformance,cashneedsrequirements,borrowing and facility limits approved and in place and the balancesheetprojectedinthe2014CorporatePlan.
IntheapplicationoftheGroup’saccountingpolicies,Auroraisrequiredtomakejudgments,estimatesandassumptionsaboutcarryingvaluesofassetsandliabilitiesthatarenotreadilyapparentfromothersources.Theestimatesandassociatedassumptionsarebasedonhistoricalexperienceand various other factors that are believed to be reasonable underthecircumstances,theresultsofwhichformthebasisofmakingthejudgments.Thesemattershavebeenconsideredinthesefinancialstatements.Actualresultsmaydifferfromtheseestimates.Theestimatesandunderlyingassumptionsarereviewedonanongoingbasis.Revisionstoaccountingestimatesarerecognisedintheperiodinwhichtheestimateisrevisediftherevisionaffectsonlythatperiodorintheperiodoftherevisionandfutureperiodsiftherevisionaffectsbothcurrent and future periods.
JudgementsmadebyAuroraintheapplicationofaccountingstandardsthathavesignificanteffectsonthefinancialstatementsandestimateswithasignificantriskofmaterialadjustmentsinthenextyeararedisclosed,whereapplicable,intherelevantnotestothefinancialstatements.Theareasinvolvingahigherdegreeofjudgementorcomplexity,orareaswhereassumptionsandestimatesaresignificanttothefinancialstatementsaredisclosedinnote34.
Accountingpoliciesareselectedandappliedinamannerwhichensuresthattheresultingfinancialinformationsatisfiesthe concepts of relevance and reliability thereby ensuring that thesubstanceoftheunderlyingtransactionsorothereventsisreported.
Inthecurrentyear,theGrouphasadoptedallofthenewandrevisedStandardsandInterpretationsissuedbytheAustralianAccountingStandardsBoardthatarerelevanttoitsoperationsandeffectiveforthecurrentannualreportingperiod.TheGroup has reviewed and where relevant adopted the following standards:
• AASB 10 Consolidated Financial Statements (August 2011) forannualreportingperiodsbeginningonorafter1January 2013.
AuroraEnergyPtyLtdnotestoandformingpartofthestatementsforthefinancialyearended30June2014

35
• AASB 11 Joint Arrangements forannualreportingperiodsbeginningonorafter1January2013.
• AASB 12 Disclosure of Interest in Other Entities for annual reportingperiodsbeginningonorafter1January2013.
• AASB 13 Fair Value Measurementforannualreportingperiodsbeginningonorafter1January2013.
• AASB 119 Employee Benefits forannualreportingperiodsbeginningonorafter1January2013.
• AASB 1053 Application of Tiers of Australian Accounting Standardsforannualreportingperiodsbeginningonorafter1July2013.
• AASB 2012-2 Amendments to Australian Accounting Standards – Disclosures – Offsetting Financial assets and Financial Liabilitiesforannualreportingperiodsbeginningonorafter1January2013.
• AASB 2012-5 Amendments to Australian Accounting Standards arising from Annual Improvements 2009-2011 Cycleforannualreportingperiodsbeginningonorafter1January 2013.
TheadoptionofthesestandardshasnomaterialfinancialimpactonthefinancialstatementsoftheGroupexceptforAASB 119 Employee Benefits (Revised 2011).
TheGroupappliedAASB119(Revised2011)retrospectivelyinthecurrentperiodinaccordancewiththetransitionalprovisionssetoutintherevisedstandard.Thecomparativefigureshavebeenaccordinglyrestated.ThekeychangesthatimpactedtheGrouparetheaccountingforRBFdefinedbenefitobligationsandplanassets.Thesechangesincludethefollowing:
• Therequirementthatallactuarialgainsandlossesberecognised immediately through other comprehensive income,ratherthanimmediatelythroughprofitorlossaswastheGroup’sprioraccountingpolicy.Theprofitafterincome tax for the year ended 30 June 2013 is reduced by$8.149Mandtheothercomprehensiveincomeafterincometaxforthesaidyearisincreasedby$8.149M.
• The interest cost and expected return on plan assets used in the previous version of AASB 119 are replaced with a net-interest amount which is calculated by applying the discountratetothenetdefinedbenefitliabilityorassetatthestartofeachannualreportingperiod.Theprofitafterincome tax for the year ended 30 June 2013 is increased by$0.520Mandtheothercomprehensiveincomeafterincometaxforthesaidyearisdecreasedby$0.520M.
AuroraEnergyPtyLtdnotestoandformingpartofthestatementsforthefinancialyearended30June2014

36
Impact on profit and other comprehensive income:
AASB 119 comparative year adjustment 2014 2013 $'000 $'000Profitorloss
Labour costs (1,666) (1,546)Finance costs 904 743Actuarialsuperannuationgains/(losses) 8,126 (10,096)Profitbeforeincometaxequivalentexpense 7,364 (10,899)Incometaxequivalentexpense (2,209) 3,270Profitforyear 5,155 (7,629)
Other comprehensive income
Actuarialsuperannuationre-measurementgains/(losses) (7,364) 10,899Incometaxequivalentexpense 2,209 (3,270)
Other comprehensive income for the year net of incometaxequivalent (5,155) 7,629
Total comprehensive income for the period 0 0
AASB 119 (Revised 2011) has been applied retrospectively, with the following permitted exceptions:
• The carrying amounts of other assets have not been adjustedforchangesinemployeebenefitcoststhatwereincluded before 1 July 2012.
• SensitivitydisclosuresfortheRBFdefinedbenefitobligationforcomparativeperiod(Yearended30June2013) have not been provided.
The following standards and amendments were available for earlyadoptionbuthavenotbeenappliedbytheGroupinthesefinancialstatements:
• AASB 9 Financial Instruments (September 2012) revised standard.AASB9isapplicableforannualreportingperiodsbeginningonorafter1January2018.
• AASB 2012-3 Amendments to Australian Accounting Standards – Offsetting Financial assets and Financial Liabilitiesisapplicableforannualreportingperiodsbeginningonorafter1January2014.
• AASB 2013-3 Amendments to AASB 136 – Recoverable Amount Disclosures for Non-Financial Assets is applicable forannualreportingperiodsbeginning1January2014.
• AASB 2013-4 Amendments to Australian Accounting Standards – Novation of Derivatives and Continuation of Hedge Accountingisapplicableforannualreportingperiods beginning 1 January 2014.
• AASB 2013-5 Amendments to Australian Accounting Standards – Investment Entities is applicable for annual reportingperiodsbeginning1January2014.
ThedirectorsanticipatethattheadoptionoftheseStandardsandInterpretationsinfutureperiodswillhavenomaterialfinancialimpactonthefinancialstatementsoftheGroup.
TheseStandardsandInterpretationswillbefirstappliedinthefinancialreportoftheGroupthatrelatestotheannualreportingperiodbeginningaftertheeffectivedateofeachpronouncement.
AuroraEnergyPtyLtdnotestoandformingpartofthestatementsforthefinancialyearended30June2014
37
Thefollowingsignificantaccountingpolicieshavebeenadoptedinthepreparationandpresentationofthefinancialreport: (a) Principles of consolidation
TheconsolidatedfinancialstatementsarepreparedbycombiningthefinancialstatementsofallentitiesthatcomprisetheGroup,beingthecompany(theparententity)anditscontrolledentities.Controlledentitiesareallthoseentitiesoverwhichtheparententityhasthepowertogovernthefinancialandoperatingpoliciessoastoobtainbenefitsfromtheiractivities.Consistentaccountingpoliciesareemployedinthepreparationandpresentationoftheconsolidatedfinancialstatements. Theconsolidatedfinancialstatementsincludetheinformationandresultsofeachcontrolledentityfromthedateonwhichthecompanyobtainscontrolanduntilsuchtimeasthecompanyceasestocontrolsuchentity.
Inpreparingtheconsolidatedfinancialstatements,allintercompanybalancesandtransactions,andunrealisedprofitsarisingwithintheGroup,areeliminatedinfull. (b) Revenue recognition and unbilled electricity sales
Revenue is recognised and measured at the fair value of theconsiderationreceivedorreceivabletotheextentitisprobablethattheeconomicbenefitswillflowtotheentityandthe revenue can be reliably measured.
Revenue from the sale of electricity to retail customers is recognisedatthetimeoftheprovisionoftheelectricitytothe customer. Income from the sale of retail electricity is the value of electricity units supplied to customers during the year. Included in this income is unbilled electricity. Unbilled electricitysalesisanestimateofthevalueofelectricityunitssupplied to customers between the date of the last meter readingandtheyearend,andisincludedinelectricitysales(refer notes 6 and 34).
Revenues are not accrued or deferred for amounts that are allowed to be recovered from customers (or credited to them) through regulatory pricing mechanisms in future years. These include amounts that are recoverable or will result in credits to customers as a direct result of under or over recoveries in the current and prior periods. (c) Inventories
Inventories including stores’ items and renewable energy certificatesarecarriedatthelowerofcostandnetrealisablevalue.
Stores items are valued at purchase cost on an average purchased cost basis. The cost of purchase comprises the purchaseprice,importdutiesandothertaxes(otherthanthosesubsequentlyrecoverablefromthetaxingauthorities),
transport,handlingandothercostsdirectlyattributabletotheacquisitionofthestores(note7). (d) Property, plant and equipment
(i)Valuation
At30June2012generationassetswerestatedathistoriccostlessaccumulateddepreciationandanyaccumulatedimpairmentlosses.TheGrouphadnogenerationassetsat30 June 2013 or 30 June 2014. Distributionassetshavebeenrevaluedat30June2014to the regulated asset base which Aurora believes approximates its fair value. ThevaluationmethodologyfordistributionassetsreflectstheNationalElectricityRuleswhichregulatetherevenuefrom these assets. Aurora values the grid assets based ontherevenuegenerationcapacityoftheassets,asdeterminedbytheAustralianEnergyRegulator.Valuationsare conducted annually. The fair value of land and buildings is assessed as either a market value where known or the Valuer-General's most recentvaluation. Thevalueofcertainnon-gridassets,e.g.motorvehiclesandminorassetssuchascomputers,isassessedasthoseassets'historicalwrittendownvaluebecauseoftheirlowvalue,shortlivesandhighturnover.Leaseholdimprovements are recorded at depreciated cost. All classes ofassetsareadjustedforanyaccumulatedimpairmentlosses.
Depreciationiscalculatedontheaboveassetclassesoverthe remaining useful lives of the assets on a straight-line basis (note 11). Revaluationincrementsarecreditedtotheassetrevaluationreserveinequity,excepttotheextentthatitreversesarevaluationdecrementforthesameassetpreviouslyrecognisedinprofitorloss,inwhichcasetheincrementisrecognisedinprofitorloss. Anyrevaluationdecrementisrecognisedinprofitorloss,excepttotheextentthatitoffsetsapreviousrevaluationincrementforthesameasset,inwhichcasethedecrementisdebiteddirectlytotheassetrevaluationreservetotheextentofthecreditbalanceexistingintherevaluationreserve for that asset. Whenanitemofproperty,plantandequipmentisrevalued,anyaccumulateddepreciationatthedateoftherevaluationisrestatedproportionatelywiththechangein the gross carrying amount of the asset so that the net carryingamountoftheassetafterrevaluationequalsitsrevalued amount.
AuroraEnergyPtyLtdnotestoandformingpartofthestatementsforthefinancialyearended30June2014

38
(d) Property, plant and equipment (continued)
(ii)Depreciation
Depreciationonproperty,plantandequipmentisbasedonthestraight-linemethodsoastowriteoffthenetcostor other revalued amount of each asset over its expected useful life. Leasehold improvements are depreciated overtheperiodoftheleaseorestimatedusefullife,whicheveristheshorter,usingthestraightlinemethod.Theestimatedusefullives,residualvaluesanddepreciationmethodarereviewedattheendofeachannualreportingperiod. InaccordancewithAustralianAccountingStandardAASB 116 Property, Plant and Equipment balances ofaccumulateddepreciationaretransferredtotheappropriate asset accounts when assets are revalued each year.
Thedepreciationratesusedforeachclassofassetsare:
Class of non-current asset Depreciation RateBuildings 2.0%Underground high voltage lines 1.7%Zonesubstations 2.5%Overhead lines 2.9%Distributionsubstations 2.5%Meters 3.3%Gas turbines 3.3%Serviceconnections 2.9%Opticalfibre 5.0%Tools 10.0%Motor vehicles 16.0%Computerequipment 33.3%
(e) Non-current assets held for sale
Non-currentassetsareclassifiedasheldforsaleandmeasuredat the lower of their carrying amount and fair value less costs to sell if their carrying amount will be recovered principally throughasaletransactioninsteadofuse.Theyarenotdepreciatedoramortised.Foranassettobeclassifiedasheldforsale,itmustbeavailableforimmediatesaleinitspresentconditionanditssalemustbehighlyprobable.
Animpairmentlossisrecognisedforanyinitialorsubsequentwrite-down of the asset to fair value less costs to sell. A gain isrecognisedforanysubsequentincreasesinfairvaluelesscoststosellofanasset,butnotinexcessofanycumulativeimpairment loss previously recognised. A gain or loss not previously recognised by the date of the sale of the non-currentassetisrecognisedatthedateofderecognition.
(f) Intangible assets
Computersoftwareisrecordedatcostlessaccumulatedamortisationandimpairment.Amortisationisgenerally
chargedonastraight-linebasisovertheestimatedusefullifeoffiveyears.Theestimatedusefullifeandamortisationmethodisreviewedattheendofeachannualreportingperiod.
The customer care and billing system is recorded at cost less accumulatedamortisationandimpairment.Amortisationischargedonastraight-linebasisovertheestimatedusefullife.Theoriginalestimatedusefullifewas12years.Effective1July 2012 the useful remaining life was amended to 3 years being the period Aurora expected to provide retail services to purchasers of the Retail Book as a result of electricity industry reforms.WiththeGovernmentdecisionnottoselltheRetailBook,theremainingusefullifeisestimatedtobe7yearsasat30 June 2014.
Changes in the expected useful life of an asset are accounted forprospectivelybychangingtheamortisationperiodormethod,asappropriate,whichcanresultinachangeinanaccountingestimate. (g) Employee benefits
(i)Superannuation
TheRetirementBenefitsFund(RBF)isadefinedbenefitssuperannuationschemeforTasmanianGovernmentemployees. The RBF liability carried represents the presentvalueofthedefinedbenefitobligationadjustedfor unrecognised service cost net of the fair value of the planassets.Thenetassets,operatingcostsandinvestmentreturns of the RBF are allocated to Aurora based on the percentageoffundedpastserviceliabilitiesforAuroracomparedtothefundedpastserviceliabilitiesforthewhole of government. The RBF scheme was closed to new members from 15 May 1999.
The RBF is funded by employee and employer contributions.EmployeecontributionstothefundsaretransferredtoRBF.Aninternalnetinterestcharge,calculatedbytheapplicationofmarket-relatedinterestratesandafteradvicefromtheGroup’sactuary,isaddedtothis provision each year. Actuarial gains or losses are recognised in the statement of other comprehensive income and are recorded as a movement in retained earnings.
(ii)Otheremployeeentitlementprovisions Contributionstotheseprovisionsarechargeddirectlyto cost centres as part of employment costs. The Group adopts the present value basis of measurement methodology where the liability recognised is the present value of expected non-current future payments to be made in respect of services provided by employees up to reportingdate.Considerationisgiventoexpectedfuturewageandsalarylevels,experienceofemployeedepartures,and periods of service.
AuroraEnergyPtyLtdnotestoandformingpartofthestatementsforthefinancialyearended30June2014

39
(g) Employee benefits (continued)
Expected future payments are discounted using market yieldsatthereportingdateongovernmentbondswithtermstomaturitythatmatch,ascloselyaspossible,theestimatedfuturecashoutflows.Annualleaveandlongserviceleaveprovisionsareclassifiedascurrentwherethecompanydoesnothaveanunconditionalrighttodefersettlementoftheliabilityforatleasttwelvemonthsafterthereportingdate.Thisdoesnotimplythatthereisanexpectationthatthecurrentprovisionwillbepaidoutwithin the next twelve months.
(h) Taxation The Electricity Companies Act 1997 section14requirestheGroup to comply with part 10 of the Government Business Enterprises Act 1995.TheGroupisrequiredtocalculateataxequivalentasifitwereacompanysubjecttoCommonwealthincome tax laws.
(i) Current tax is calculated by reference to the amount of income taxes payable or recoverable in respect of the taxableprofitortaxlossfortheperiod.Itiscalculatedusing tax rates and tax laws that have been enacted or substantivelyenactedbyreportingdate.Currenttaxforcurrent and prior periods is recognised as a liability (or asset) to the extent that it is unpaid (or refundable).
(ii) Deferred tax is accounted for using the comprehensive balance sheet liability method in respect of temporary differencesarisingfromdifferencesbetweenthecarryingamountofassetsandliabilitiesinthefinancialstatementsand the corresponding tax base of those items.
Inprinciple,deferredtaxliabilitiesarerecognisedforalltaxabletemporarydifferences.Deferredtaxassetsarerecognisedtotheextentthatitisprobablethatsufficienttaxableamountswillbeavailableagainstwhichdeductibletemporarydifferencesorunusedtaxlossesandtaxoffsetscanbeutilised.However,deferredtaxassetsandliabilitiesarenotrecognisedifthetemporarydifferencesgivingrisetothemarisefromtheinitialrecognitionofassetsandliabilities(otherthanasaresultofabusinesscombination)whichaffectsneithertaxableincomenoraccountingprofit. Furthermore,adeferredtaxliabilityisnotrecognisedinrelationtotaxabletemporarydifferencesarisingfromgoodwill. Deferredtaxliabilitiesarerecognisedfortaxabletemporarydifferencesarisingoninvestmentsinsubsidiariesandjointventures except where the Group is able to control the reversalofthetemporarydifferencesanditisprobablethatthetemporarydifferenceswillnotreverseintheforeseeable future.
Deferredtaxassetsarisingfromdeductibletemporarydifferencesassociatedwiththeseinvestmentsandinterestsare only recognised to the extent that it is probable that therewillbesufficienttaxableprofitsagainstwhichto
utilisethebenefitsofthetemporarydifferencesandtheyare expected to reverse in the foreseeable future.
Deferredtaxassetsandliabilitiesaremeasuredatthetaxrates that are expected to apply to the period(s) when the assetandliabilitygivingrisetothemarerealisedorsettled,based on tax rates (and tax laws) that have been enacted or substantivelyenactedbyreportingdate.ThemeasurementofdeferredtaxliabilitiesandassetsreflectsthetaxconsequencesthatwouldfollowfromthemannerinwhichtheGroupexpects,atthereportingdate,torecoverorsettlethecarryingamountofitsassetsandliabilities. Current and deferred tax for the period
Current and deferred tax is recognised as an expense or incomeinthestatementofcomprehensiveincome,exceptwhen it relates to items credited or debited directly to equity,inwhichcasethedeferredtaxisalsorecogniseddirectlyinequity,orwhereitarisesfromtheinitialaccountingforabusinesscombination,inwhichcaseitistakenintoaccountinthedeterminationofgoodwillorexcess.
(iii)Taxconsolidation The company and all its wholly-owned Australian resident entitiesarepartofatax-consolidatedgroupunderAustraliantaxationlaw.AuroraEnergyPtyLtdistheheadentityinthetax-consolidatedgroup.Taxexpense/income,deferredtaxliabilitiesanddeferredtaxassetsarisingfromtemporarydifferencesofthemembersofthe tax-consolidated group are recognised in the separate accountingrecordsofthemembersofthetax-consolidatedgroup using the ‘separate taxpayer within group’ approach. Currenttaxliabilitiesandassetsanddeferredtaxassetsarising from unused tax losses and tax credits of the members of the tax-consolidated group are recognised by thecompany(asheadentityinthetax-consolidatedgroup).Due to the existence of a tax funding arrangement between theentitiesinthetax-consolidatedgroup,amountsarerecognised as payable to or receivable by the company andeachmemberofthegroupinrelationtothetaxcontributionamountspaidorpayablebetweentheparententityandtheothermembersofthetax-consolidatedgroupinaccordancewiththearrangement.Wherethetaxcontributionamountrecognisedbyeachmemberofthetax-consolidatedgroupforaparticularperiodisdifferentfrom the aggregate of the current tax liability or asset and any deferred tax asset arising from unused tax losses andtaxcreditsinrespectofthatperiod,thedifferenceisrecognisedasacontributionfrom(ordistributionto)equityparticipants.
(i) Receivables Trade receivables and other receivables are recorded at amounts due less any allowance for impairment. The balance of the allowance for impairment is reviewed monthly. An allowance for impairment is recognised when there is objectiveevidencethatthereceivablemaynotbeableto
AuroraEnergyPtyLtdnotestoandformingpartofthestatementsforthefinancialyearended30June2014

40
(i) Receivables (continued)
becollected.Financialdifficultiesofthedebtoranddefaultpaymentsareconsideredobjectiveevidenceofimpairment.There is an algorithm applied to debtor balances that determinesgrossdoubtfuldebts,basedontheageofthosedebtsandpastcollectionhistory.Thisisthenadjustedforproportionaterecoveries.Anyotherknowncontingenciesaretakenintoconsideration. Constructionworkinprogressreceivableisstatedatcostplusprofitrecognisedtodatelessaprovisionforforeseeablelossesand less progress billings. (j) Construction Contracts Assoonastheoutcomeofconstructioncontractswithexternalpartiescanbeestimatedreliably,contractrevenueand expenses are recognised in the income statement in proportiontothestageofcompletionofthecontract.Thestageofcompletionisassessedbyreferencetosurveysofwork performed. An expected loss on contract is recognised immediately in the statement of comprehensive income.
(k) Payables Trade payables and other accounts payable are recognised when the Group becomes obliged to make future payments resultingfromthepurchaseofgoodsandservices.Duetotheir short-term nature they are not discounted. The carbon liability payments the Group is obliged to make under the CleanEnergyAct,duringthefixedpriceperiod,isrecognisedas a Trade and other payable. Due to their short-term nature they are not discounted. (l) Goods and services tax Revenues,expensesandassetsarerecognisednetoftheamountofgoodsandservicestax(GST),except:
(i) where the amount of GST incurred is not recoverablefromthetaxationauthority,it isrecognisedaspartofthecostofacquisitionofanassetor as part of an item of expense; or
(ii) for receivables and payables which are recognised inclusiveofGST,thenetamountofGSTrecoverablefrom,orpayableto,thetaxationauthorityisincludedaspartofreceivables or payables.
Cashflowsareincludedinthestatementofcashflowsonagross basis.
(m) Goodwill Anygoodwillacquiredinabusinesscombinationisinitiallymeasuredatitscost,beingtheexcessofthecostofthebusinesscombinationovertheentity’sinterestinthenetfairvalueoftheidentifiableassets,liabilitiesandcontingentliabilitiesrecognisedatthedateoftheacquisition.Anygoodwillissubsequentlymeasuredatitscostlessany
accumulated impairment losses.
Forthepurposesofimpairmenttesting,anygoodwillisallocatedtoeachoftheentity’scash-generatingunits,orgroupsofcash-generatingunits,expectedtobenefitfromthesynergiesofthebusinesscombination.Cash-generatingunitsorgroupsofcash-generatingunitstowhichgoodwillhasbeenallocatedaretestedforimpairmentannually,ormorefrequentlyifeventsorchangesincircumstancesindicatethatgoodwill might be impaired.
Iftherecoverableamountofthecash-generatingunit(orgroupofcash-generatingunits)islessthanthecarryingamountofthecash-generatingunit(orgroupofcash-generatingunits),theimpairmentlossisallocatedfirsttoreduce the carrying amount of any goodwill allocated to thecash-generatingunit(orgroupofcash-generatingunits)andthentotheotherassetsofthecash-generatingunitspro-rata on the basis of the carrying amount of each asset inthecash-generatingunit(orgroupofcash-generatingunits). An impairment loss recognised for goodwill is recognisedimmediatelyinprofitorlossandisnotreversedinasubsequentperiod.Ondisposalofanoperationwithinacash-generatingunit,theattributableamountofgoodwillisincludedinthedeterminationoftheprofitorlossondisposaloftheoperation. At30June2014,theGrouphasnotrecognisedanygoodwillinassets. (n) Impairment of assets excluding goodwill Ateachreportingdate,theGroupreviewsthecarryingamounts of its tangible and intangible assets to determine whetherthereisanyindicationthatthoseassetshavesufferedanimpairmentloss.Ifanysuchindicationexists,therecoverableamountoftheassetisestimatedinordertodeterminetheextent,ifany,oftheimpairmentloss.
Wheretheassetdoesnotgeneratecashflowsthatareindependentfromotherassets,theGroupestimatestherecoverableamountofthecash-generatingunittowhichtheasset belongs. The recoverable amount is the higher of fair value less costs to sell and value-in-use. In assessing value-in-use,theestimatedfuturecashflowsarediscountedtotheirpresentvalueusingapre-taxdiscountratethatreflectscurrentmarketratesandtherisksspecifictotheasset(orcash-generatingunit)forwhichtheestimatesoffuturecashflowshavenotbeenadjusted.Iftherecoverableamountofanasset(orcash-generatingunit)isestimatedtobelessthanitscarryingamount,thecarryingamountisreducedtoits recoverable amount. An impairment loss is recognised in profitorlossimmediately,unlesstherelevantassetiscarriedatfairvalue,inwhichcasetheimpairmentlossistreatedasarevaluationdecrease.
Whereanimpairmentlosssubsequentlyreverses,thecarryingamountoftheasset(orcash-generatingunit)isincreasedtotherevisedestimateofitsrecoverableamount,butonlytotheextent that the increased carrying amount does not exceed the carrying amount that would have been determined had
AuroraEnergyPtyLtdnotestoandformingpartofthestatementsforthefinancialyearended30June2014

41
(n) Impairment of assets excluding goodwill (continued)
no impairment loss been recognised for the asset (or cash-generatingunit)inprioryears.Areversalofanimpairmentlossisrecognisedinprofitorlossimmediately,unlesstherelevantassetiscarriedatfairvalue,inwhichcasethereversaloftheimpairmentlossistreatedasarevaluationincrease. (o) Customer contributions applied towards capital works
CustomercontributionsappliedtowardscapitalworksaretreatedasrevenueunderaccountingInterpretation18TransferofAssetsfromCustomers.Wherecapitalworksareincomplete,customercontributionsinexcessoftheworkscompleted are included as a liability in the statement of financialposition. (p) Cash and cash equivalents
Cashandcashequivalentsinthestatementoffinancialpositioncomprisecashatbankandinhandandshort-termdeposits with an original maturity of three months or less that arereadilyconvertibletoknownamountsofcashandwhicharesubjecttoaninsignificantriskofchangesinvalue.Forthepurposesofthestatementofcashflows,cashandcashequivalentsconsistofcashandcashequivalentsasdefinedabove,netofoutstandingbankoverdrafts.Anybankoverdraftsare included within trade and other payables on the statement offinancialposition. (q) Investments
Investmentsincontrolledentitiesarerecordedatcost.Ifthereisanindicationofanimpairmentloss,therecoverableamountoftheinvestmentisestimatedandthecarryingvalueoftheinvestment is correspondingly reduced. Any investments in associatesareaccountedforundertheequitymethod(AASB128)intheconsolidatedfinancialstatements.
At 30 June 2014 the company held no investments in associates. (r) Contributed Equity
Ordinarysharesareclassifiedasequity. (s) Derivative Financial Instruments TheGroupentersintovariousfinancialinstrumentsincludinginterestrateandelectricityswaps,forwardstartborrowingagreements,futures,options,forwardrateagreements(FRAs) and foreign exchange contracts in order to manage financialexposuresfacedbytheGroupfromitsoperations.InaccordancewithitsTreasuryandEnergyRiskPolicies,theGroupdoesnotholdorissuederivativefinancialinstrumentsfortradingpurposes.Furtherdetailsofderivativeinstrumentsare disclosed in note 32.
Derivativesareinitiallyrecognisedatfairvalueonthedateaderivativecontractisenteredintoandaresubsequentlyremeasuredtotheirfairvalueateachreportingdate.The
resultinggainorlossisrecognisedinprofitorlossonthestatement of comprehensive income immediately unless the derivativeisdesignatedandeffectiveasahedginginstrument,inwhicheventthetimingoftherecognitioninprofitorlosson the statement of comprehensive income depends on the natureofthehedgerelationship.Onthedatethecontractisentered,eachcontractisrecordedinAurora’shedgeaccountingsystemwheretherelevanteffectivenesstestsanddocumentationiscreatedatinceptionandallfurtherdesignationandvaluationdataisrecorded.Thefairvalueof a hedging instrument is presented as current or non-currentbasedonthetimingofthecontractualcashflows,withcashflowsexpectedtoberealisedorsettledafter12monthsclassifiedasnon-currentandcashflowsexpectedtoberealisedorsettledwithin12monthsclassifiedascurrent.Otherderivativesarepresentedascurrentassetsorcurrentliabilities. Derivativesembeddedinotherfinancialinstrumentsorotherhostcontractsaretreatedasseparatederivativeswhentheirriskandcharacteristicsarenotcloselyrelatedtothosehostcontracts and the host contracts are not measured at fair value withchangesinfairvaluerecognisedinprofitorlossonthestatement of comprehensive income. (t) Hedging TheGroupdesignatescertainderivativesaseitherhedgesofthefairvalueofrecognisedassetsorliabilitiesoffirmcommitments (fair value hedges) or hedges of highly probable forecasttransactions(cashflowhedges). Fair value hedges Changesinthefairvalueofderivativesthataredesignatedandqualifyasfairvaluehedgesarerecordedinprofitorlossonthestatementofcomprehensiveincomeimmediately,together with any changes in the fair value of the hedged assetorliabilitythatisattributabletothehedgedrisk.Hedgeaccountingisdiscontinuedwhenthehedgeinstrumentexpiresorissold,terminated,exercised,ornolongerqualifiesforhedgeaccounting.Theadjustmenttothecarryingamountofthehedgeditemarisingfromthehedgedriskisamortisedtoprofitorlossonthestatementofcomprehensiveincomefromthat date.
Cashflowhedges
Theeffectiveportionofchangesinthefairvalueofderivativesthataredesignatedandqualifyascashflowhedgesaredeferredinequity.Thegainorlossesrelatingtoineffectiveportionsarerecognisedimmediatelyinprofitorlossonthestatement of comprehensive income. Amounts deferred inequityarerecycledinprofitorlossonthestatementofcomprehensive income in the periods when the hedged item is recognisedinprofitorlossinthestatementofcomprehensiveincome.However,whentheforecasttransactionthatishedgedresultsintherecognitionofanon-financialassetornon-financialliability,thegainsandlossespreviouslydeferredinequityaretransferredfromequityandincludedintheinitialmeasurement of the cost of the asset or liability.
AuroraEnergyPtyLtdnotestoandformingpartofthestatementsforthefinancialyearended30June2014

42
(t) Hedging (continued)
Hedgeaccountingisdiscontinuedwhenthehedginginstrumentexpiresorissold,terminated,orexercised,ornolongerqualifiesforhedgeaccounting.Atthattime,anycumulativegainorlossdeferredinequityatthattimeremainsinequityandisrecognisedwhentheforecasttransactionisultimatelyrecognisedinprofitorlossonthestatementofcomprehensiveincome.Whentheforecasttransactionisnolongerexpectedtooccur,thecumulativegainorlossthatwasdeferredinequityisrecognisedimmediatelyinprofitorlosson the statement of comprehensive income.
(u) Foreign currency Realised and unrealised gains and losses on foreign currency exposures are brought to account in the year towhichtheyapply.TransactionsinforeigncurrenciesareinitiallyrecordedinAustraliandollarsbyapplyingtheexchangeratesrulingatthedateofthetransaction.Monetaryassetsandliabilitiesdenominatedinforeigncurrencies at balance date are translated to Australian dollarsatexchangeratesineffectatthatdate.Thegainsandlossesfromhedgingequipmentexposuresaretransferredtotheequipmentaccountstobecomepartoftheacquisitioncostoftheassets.Allexchangegainsandlossesrelatingtootherhedgetransactionsarebrought to account in the statement of comprehensive incomeinthesameperiodastheexchangedifferencesontheitemscoveredbythehedgetransactions.Asapolicyobjectivethecompanyeliminatesitsexposuretoforeigncurrencies,exceptforexposureslessthanAUD100,000arisingthroughthenormalcourseofbusiness.
(v) Borrowings Borrowingsarerecordedinitiallyatfairvalue,netoftransactioncosts.Subsequenttoinitialrecognition,borrowingsaremeasuredatamortisedcostwithanydifferencebetweencostandredemptionvaluebeingrecognisedinthestatementof comprehensive income over the period of the borrowings onaneffectiveinterestbasis. Current borrowings are those borrowings that mature within 1yearofthereportingdate,exceptwheretheGrouphasanunconditionalrighttodefersettlementoftheliabilityforatleast12monthsafterthereportingdateortheunconditionalrighttorefinancetheborrowingsforatleast12monthsafterthereportingdate.Allborrowingsthatarenotcurrentborrowings are non-current borrowings. (w) Renewable energy certificate forward contracts
Renewable Energy Target measures are contained in the Federalrenewableenergylegislationthatcommencedon1 April 2001. The aims of the measures are to increase the proportionofenergyfromrenewablegenerators.Renewableenergy generators are able to issue RECs (Renewable Energy Certificates),where1RECis1MWhofelectricitybasedontheamountofrenewableenergygeneratedfromadefined
renewablesource.From1January2011,theschemewassplitintotwoparts,theLarge-scaleRenewableEnergyTarget(LRET) and the Small-scale Renewable Energy Scheme (SRES). Retailersarerequiredtopurchasesufficientlarge-scalegenerationcertificates(LGCs)andsmall-scaletechnologycertificates(STCs)(basedonapercentageoftheretailers'energyacquisitions)tomeettheirobligationsundertheActforeachcalendaryear.STCsaresubmittedtotheRegulatoronaquarterlybasisandLGCsinFebruaryofeachyear.ThepriceofRECs(LGCsandSTCs)varies,sothecompanyhasimplementedapurchasingtargettomitigatemarketrisk.
AuroraacquiresitsRECsbyforwardRECpurchasecontractsinaccordancewiththebenchmark,withpurchasesonthespot market and from the STC Clearing House. This allows AuroratolockinapriceforthefuturedeliveryandsettlementofRECs.TheliabilityfortheacquittalofRECsisrecognisedinthestatementoffinancialposition,tradeandotherpayables,onacontinuousbasisaselectricityispurchased.Theexpensefor RECs is recognised on the statement of comprehensive income,withinenergyandtransmissionpurchases,onacontinuousbasisaselectricityispurchased. AnyRECspurchasedbutnotyetremittedtotheRegulatorareincluded in inventory. (x) Leases Leasesareclassifiedasfinanceleaseswhenthetermsoftheleasesubstantiallytransferalltherisksandrewardsincidentaltoownership of the leased asset to the lessee. All other leases are classifiedasoperatingleases.
Operatingleasepaymentsarerecognisedasanexpenseinthestatement of comprehensive income on a straight line basis overtheleaseterm.Leaseincentivesarerecognisedinthestatement of comprehensive income as an integral part of the total lease expense. (y) Provisions
ProvisionsarerecognisedwhentheGrouphasapresentobligation(legalorconstructive)asaresultofapastevent,itisprobablethattheGroupwillberequiredtosettletheobligation,andareliableestimatecanbemadeoftheamountoftheobligation. Theamountrecognisedasaprovisionisthebestestimateoftheconsiderationrequiredtosettlethepresentobligationatreportingdate,takingintoaccounttherisksanduncertaintiessurroundingtheobligation.Whereaprovisionismeasuredusingthecashflowsestimatedtosettlethepresentobligation,itscarryingamountisthepresentvalueofthosecashflows. Provisions are measured at the present value of Aurora’s bestestimateoftheexpenditurerequiredtosettlethepresentobligationatthereportingdate.Thediscountrateusedtodeterminethepresentvaluereflectscurrentmarketassessmentsofthetimevalueofmoneyandtherisksspecifictotheliability.Theincreaseintheprovisionresultingfromthepassageoftime(unwindingofdiscount)isrecognisedinfinancecostsonthestatementofcomprehensiveincome.
AuroraEnergyPtyLtdnotestoandformingpartofthestatementsforthefinancialyearended30June2014

43
(y) Provisions (continued) A provision for decommissioning is recognised when there isapresentobligationasaresultofproductionactivitiesundertaken,itisprobablethatanoutflowofeconomicbenefitswillberequiredtosettletheobligation,andtheamount of the provision can be measured reliably. The estimatedfutureobligationsincludethecostsofremovingthefacilitiesandrestoringtheaffectedareas. A restructuring provision is only recognised when general recognitioncriteriaprovisionsarefulfilled.TheGroupneedsto follow a detailed formal plan about the part of the business concerned,thelocationandnumberofemployeesaffected,adetailedestimateoftheassociatedcosts,andanappropriatetimeline,andthepeopleaffectedhaveavalidexpectationthattherestructuringisbeingcarriedoutortheimplementationhasbeeninitiatedalready. (z) Comparisons with previous year Wherenecessary,comparativefiguresareadjustedtoconformwithchangesinpresentationinthecurrentyear.
AuroraEnergyPtyLtdnotestoandformingpartofthestatementsforthefinancialyearended30June2014

44
Consolidated
2014 2013
$’000 $’000
2 Operating ProfitA. Detailed income statement
Revenue
Total sales revenue 1,134,514 1,483,343
Interest received (note 2B) 983 1,821 Community service agreements (note 4) 36,730 35,438 External work sales (note 2C) 17,432 18,524 Customercontributions(note1(o)) 8,432 7,471
Rental and lease revenue 795 670
Other 2,584 10,606 Total revenue 1,201,470 1,557,873
Other gains/(losses)
Lossondisposalofproperty,plantandequipment(note2D) 91 (798) (Impairment)/reversalofimpairmentofnon-currentassets(notes1(n),11) 1,410 (4,896) Totalgain/(loss) 1,501 (5,694)
Energy and transmission purchases
Energy and transmission purchases (626,602) (997,377) Renewableenergycertificates(note1(w)) (54,822) (65,846) Total energy and transmission purchases (681,424) (1,063,223)
Functional expenses
Labour (104,026) (99,729) Operatingleaserentalexpense(notes1(x),2E) (2,527) (2,750) Services (34,038) (47,099) ITandcommunicationscharges (16,530) (16,166) Licence fees (3,077) (2,817) Customer service level payments (3,740) (2,999) Insurance (1,680) (2,655) Other (14,442) (11,824) Totalfunctionalexpenses (180,060) (186,039)
Other major expense items
Finance costs (note 2G) (50,710) (66,947) NetinterestcostregardingRBFprovision(note2G,20) (3,823) (3,456)
Unwindingdiscountondecommissioningcosts(note2F,2G) - (1,379)
Depreciationandamortisation(note2H) (102,344) (119,692) Impairment losses on trade receivables (note 6) (2,849) (10,005) Lossonderivativesinafairvaluehedgeaccountingrelationship (16,106) (18,761) Gainonadjustmenttohedgediteminafairvaluehedgeaccountingrelationship 16,055 18,724 UnrealisedlossonelectricityderivativesatfairvaluethroughP&L (1,093) 7,634
AuroraEnergyPtyLtdnotestoandformingpartofthestatementsforthefinancialyearended30June2014

45
Consolidated
2014 2013
$’000 $’000
2 Operating Profit (continued) RealisedlossonderivativesatfairvaluethroughtheP&L1 (note 32(c)) (78,814) - Community service agreements - discounts allowed (note 4) (36,722) (35,438) Total expenses (1,137,890) (1,478,582)
Profit before income tax equivalent expense 65,081 73,597
Incometaxequivalentexpense(note3) (1,090) (22,111)
Profit for the year 63,991 51,4861 Electricityderivativesenteredintobetween1July2012and26September2013werenotdesignatedinahedgeaccountingrelationshipduetotheannouncedsaleoftheRetailBusinesswhichwassubsequentlyabandonedon26September2013.Intheprioryearderivativesofthisnatureweredesignatedinhedgeaccountingrelationshipsandthereforedisclosedinenergyandtransmissionpurchases.
B. Interest revenue Money market investments 98 45 Bank investments 57 168 Trade receivables 828 1,608 983 1,821
C. Details of gross margin on external work sales Income from external work sales (note 2A) 17,432 18,524 Less cost of external work sales (11,377) (10,578) Gross margin on external work sales 6,055 7,946
D. Details of loss on disposal of property, plant and equipment Incomefromsaleofproperty,plantandequipment 3,673 5,252 Lesscostofsale/scrappingofproperty,plantandequipment (3,583) (6,050) Lossonsale/scrappingofproperty,plantandequipment(notes1(d),2A) 90 (798)
E. Details of operating lease rental expenses Minimum lease payments (2,527) (2,750)
F. Net transfer (to)/from provisions for: Employeeentitlements(notes16,18) (9,263) 10,796 Workerscompensation 111 (117) Payroll tax 94 24 Provision for restructuring (419) (1,747) Provision for decommissioning costs - 24,565 (9,477) 33,521
Provision for restructuring Opening balance 1,781 34 Additionalprovision 13,670 1,781 Utilised (13,251) (34) Closing balance 2,200 1,781
AuroraEnergyPtyLtdnotestoandformingpartofthestatementsforthefinancialyearended30June2014
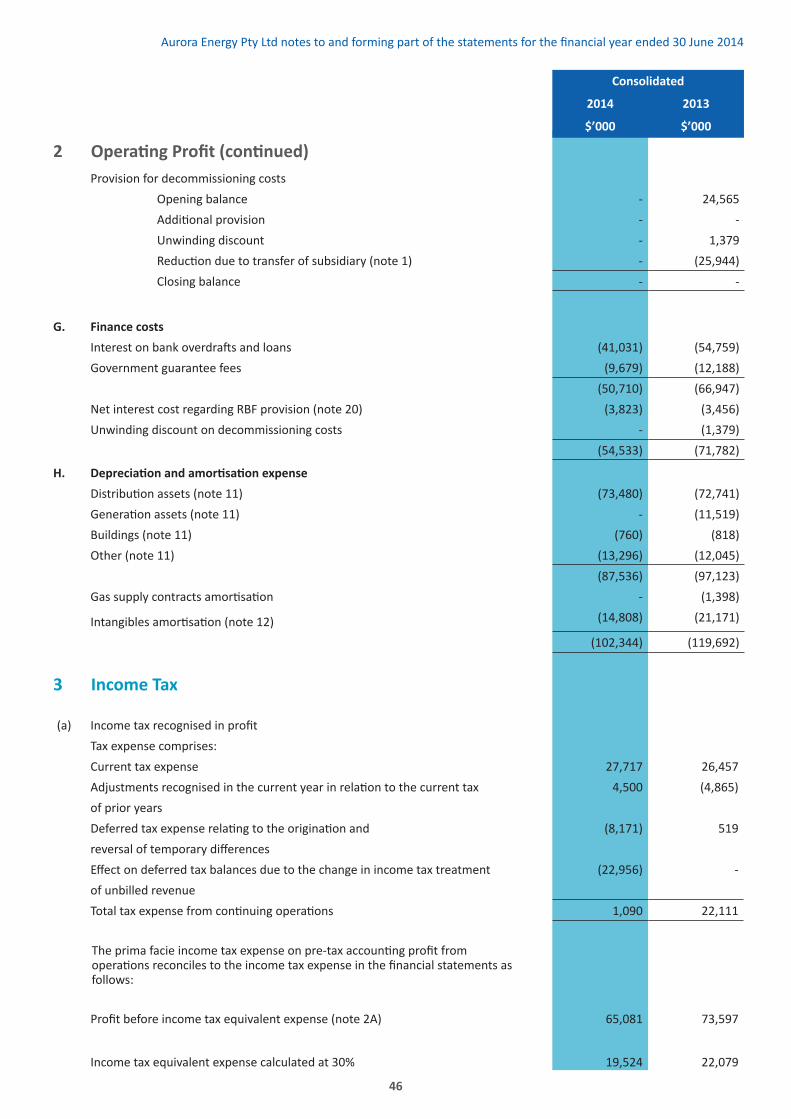
46
Consolidated
2014 2013
$’000 $’000
2 Operating Profit (continued) Provision for decommissioning costs Opening balance - 24,565 Additionalprovision - - Unwinding discount - 1,379 Reductionduetotransferofsubsidiary(note1) - (25,944) Closing balance - -
G. Finance costs Interestonbankoverdraftsandloans (41,031) (54,759) Government guarantee fees (9,679) (12,188) (50,710) (66,947) Net interest cost regarding RBF provision (note 20) (3,823) (3,456) Unwinding discount on decommissioning costs - (1,379) (54,533) (71,782)
H. Depreciation and amortisation expense Distributionassets(note11) (73,480) (72,741) Generationassets(note11) - (11,519) Buildings (note 11) (760) (818) Other (note 11) (13,296) (12,045) (87,536) (97,123) Gassupplycontractsamortisation - (1,398)
Intangiblesamortisation(note12) (14,808) (21,171)
(102,344) (119,692)
3 Income Tax
(a) Incometaxrecognisedinprofit Taxexpensecomprises: Current tax expense 27,717 26,457 Adjustmentsrecognisedinthecurrentyearinrelationtothecurrenttax 4,500 (4,865) of prior years Deferredtaxexpenserelatingtotheoriginationand (8,171) 519 reversaloftemporarydifferences Effectondeferredtaxbalancesduetothechangeinincometaxtreatment (22,956) - of unbilled revenue
Totaltaxexpensefromcontinuingoperations 1,090 22,111
Theprimafacieincometaxexpenseonpre-taxaccountingprofitfromoperationsreconcilestotheincometaxexpenseinthefinancialstatementsasfollows:
Profitbeforeincometaxequivalentexpense(note2A) 65,081 73,597
Incometaxequivalentexpensecalculatedat30% 19,524 22,079
AuroraEnergyPtyLtdnotestoandformingpartofthestatementsforthefinancialyearended30June2014

47
Non-deductibleexpenses 22 32 19,546 22,111 Under/(over)provisionofincometaxinprioryears 4,500 -
Effectondeferredtaxbalancesduetothechangeinincometaxtreatmentofunbilled revenue (22,956) -
Incometaxequivalentexpense 1,090 22,111
Thetaxrateusedintheabovereconciliationisthecorporatetaxrateof30%payablebyAustraliancorporateentitiesontaxableprofitsunderAustraliantaxlaw. There has been no change in the corporate tax rate when compared with thepreviousreportingperiod.
(b) Incometaxrecogniseddirectlyinequity
The following current and deferred amounts were charged directly to
equityduringtheperiod:
Deferredtax:
Property,plantandequipmentrevaluations (8,006) 1,008 Cashflowhedges 4,981 (951) Provisions 2,209 (3,270) (816) (3,213)
(c) Currenttaxassetsandliabilities Incometaxpayableattributableto: Headentity 22,294 19,957 (d) Deferred tax balances Deferredtaxassetscomprise: Tax losses – revenue - - Temporarydifferences 59,484 46,053 Deferredtaxliabilitiescomprise: Temporarydifferences (143,062) (159,942) Net deferred liability (83,578) (113,889)
Consolidated
2014 2013
$’000 $’000
3 Income Tax (continued)
AuroraEnergyPtyLtdnotestoandformingpartofthestatementsforthefinancialyearended30June2014

48
Taxableanddeductibletemporarydifferencesarisefromthefollowing:
Consolidated
2014Opening balance
Charged to income
Charged to equity
Acquisition/ disposals
Exchange differences
Changes in tax rate
Closing Balance
$’000 $’000 $’000 $’000 $’000 $’000 $’000Gross deferred tax liabilities:
Property,plantandequipment 127,374 (4,646) 8,006 - - - 130,734Receivables 24,268 (24,268) - - - - -Financial instruments & other
8,300 10,903 (6,875) - - - 12,328
159,942 (18,011) 1,131 - - - 143,062
Grossdeferredtaxassets: Provisions 38,190 (891) 2,209 - - - 39,508Financial instruments & other
7,863 14,007 (1,894) - - - 19,976
46,053 13,116 315 - - - 59,484 (113,889) 31,127 (816) - - - (83,578) Consolidated2013
Opening balance
Charged to income
Charged to equity
Acquisition/ disposals
Exchange differences
Changes in tax rate
Closing Balance
$’000 $’000 $’000 $’000 $’000 $’000 $’000Gross deferred tax liabilities:
Property,plantandequipment 150,111 (4,576) (1,008) (17,153) - - 127,374Receivables 22,691 1,577 - - - - 24,268Financial instruments & other
3,113 4,236 951 - - - 8,300
175,915 1,237 (57) (17,153) - - 159,942 Grossdeferredtaxassets: Provisions 39,371 2,564 (3,270) (475) - - 38,190Financial instruments & other
15,166 (1,846) - (5,457) - - 7,863
54,537 718 (3,270) (5,932) - - 46,053 (121,378) (519) (3,213) 11,221 - - (113,889)
3 Income Tax (continued)
AuroraEnergyPtyLtdnotestoandformingpartofthestatementsforthefinancialyearended30June2014

49
Consolidated
2014 2013
3 Income Tax (continued) $’000 $’000
Unrecognised deferred tax balances
Thefollowingdeferredtaxassetshavenotbeenbroughttoaccountasassets:
Tax losses - capital loss on sale of subsidiary 633 633
Tax consolidation
RelevanceoftaxconsolidationtotheGroup.Thecompanyanditswholly-ownedAustralianresidententitiesformedatax-consolidatedgroupwitheffectfrom1July2003andaretaxedasasingleentityfromthatdate.Theheadentitywithinthetax-consolidatedgroupisAuroraEnergyPtyLtd.Themembersofthetax-consolidatedgroupareidentifiedatnote28.Natureoftax-fundingarrangementsandtax-sharingagreements:Entitieswithinthetax-consolidatedgrouphaveenteredintoatax-fundingarrangementandatax-sharingagreementwiththeheadentity.Underthetermsofthetax-fundingarrangement,AuroraEnergyPtyLtdandeachoftheentitiesinthetax-consolidatedgrouphasagreedtopayataxequivalentpaymenttoorfromtheheadentity,basedonthecurrenttaxliabilityorcurrenttaxassetoftheentity.Suchamountsarereflectedinamountsreceivablefromorpayabletootherentitiesinthetax-consolidated group.Thetax-sharingagreemententeredintobetweenmembersofthetax-consolidatedgroupprovidesforthedeterminationoftheallocationofincometaxliabilitiesbetweentheentitiesshouldtheheadentitydefaultonitstaxpaymentobligations.Noamountshavebeenrecognisedinthefinancialstatementsinrespectofthisagreementasthepossibilityofpaymentofanyamounts under the tax-sharing agreement is considered remote.
Unbilled revenue
Auroraaccountsforunbilledrevenueforcustomersbilledquarterlyusinganestimateofenergyconsumeduntilreportingdatebutnotyetbilled.Fortaxationpurposes,Aurorahaspreviouslytreatedquarterlyaccountunbilledrevenueasderivedforincome tax purposes only when an invoice was issued to customers. This gave rise to a deferred tax liability.
AuroraandtheAustralianTaxationOffice(NationalTaxationEquivalentRegimeadministrator)haveagreedarevisedapproachwherebyAurora’staxtreatmentwilltransitiontotheapproachconsistentwiththeaccrualmethodusedforaccounting.Thisagreementwillresultinachangeoveradjustmentforthe2010,2011,2012,and2013yearsonly,tobetakenupinthe2014years tax return.
TheagreementwiththeAustralianTaxationOfficeresultsinanincometaxbenefitof$22.956M,arisingfromareversalofthedeferred tax liability.
AuroraEnergyPtyLtdnotestoandformingpartofthestatementsforthefinancialyearended30June2014

50
Consolidated
2014 2013
$’000 $’000
4 Community Service activity agreements
Pensioner discounts
The company has an agreement with the Crown in right of the State of Tasmania to provide community services and for Aurora to be reimbursed for the community servicescostsandadministrationcosts.
Discounts allowed to customers and included in the accounts of the company 36,722 35,438 Amount billed to the Crown and included in the accounts of the company 36,730 35,438
5 Cash and cash equivalents
Bank balances 669 4,793 Money market investments 44,010 20 44,679 4,813
6 Current trade and other receivables
Trade receivables (note 1(i)) 71,704 101,926 Accrued income 35,276 60,239 Unbilled energy sales (note 1(b)) 75,860 80,895 Provision for impairment (6,290) (11,373) 176,550 231,687
Ofthetotal$71.704M(2013:$101.926M)oftradereceivables,$52.059M(2013:$60.365M)arecurrentwithanaverageof20.42days.Itisconsideredthattherearenoindicationsasofthereportingdatethatthedebtorswillnotmeettheirpaymentobligations,unlessotherwiseprovided.
(a)Movementintheallowanceforimpairmentofdebts:
Balance at the beginning of the year 11,373 6,352 Impairment losses recognised on receivables 2,849 10,005 Amountswrittenoffasuncollectable (8,780) (5,410) Amounts recovered during the year 848 426 Balance at the end of the year 6,290 11,373
(b) Included in the allowance for impairment of debts are individually impaired tradereceivablesforwhich$0.212M(2013:$1.722M)hasbeenprovidedwherethedebtisindisputeandsubjecttonegotiation.TheGroupdoesnot hold any collateral over these balances. The ageing of these receivables is greater than an average of 143 days overdue.
(c) Ageing of trade receivables that were past due but not impaired
Less than 30 days overdue 7,798 11,562 Between 31 and 60 days overdue 1,682 10,179 Between 61 and 180 days overdue 2,766 5,385 Greater than 180 days overdue 1,109 3,062 13,355 30,188
AuroraEnergyPtyLtdnotestoandformingpartofthestatementsforthefinancialyearended30June2014

51
Onthebasisofhistoricalexperiencenoadditionalprovisionisrequiredonthese residual balances. The Group holds no collateral over these balances.
(d)Ofthetotalreceivables,$3.622M(2013:$7.176M)arerenegotiatedreceivables and Aurora has assessed on the basis of historical experience that notallwillberecoverableandanimpairmentof$1.081M(2013:$1.273M)hasbeen recorded.
(e)Anamountof$6.290M(2013:$11.373M)isconsideredimpairedandhasbeenprovidedfor.Anallowanceaccounthasbeenmadeforestimatedirrecoverabletradereceivableamountsarisingfromthepastrenderingofservices,determined by reference to past default experience.
7 InventoriesStores
Stores (valued at cost) 12,198 10,697 Allowance for loss on stores (note 1(c)) (152) (152) 12,046 10,545 Renewableenergycertificates(valuedatcost)(note1(w)) 8,686 16,674
20,732 27,219
Storesandrenewableenergycertificatesrecognisedasanexpense(orcapitalised as part of a constructed asset) for the year ended 30 June 2014 totalled$77.773M(2013:$84.990M).
8 Current financial assets
Interest accrued 18 1 Derivativecontracts(atfairvalue)(note1(s)) 8 8,941
Fairvalueadjustmenttohedgeditemdesignatedinafairvaluehedgeaccountingrelationship 6,488 9,799
Totalcurrentfinancialassets 6,514 18,741
9 Other current Assets
Prepayments 2,519 3,187 Customerservicesobligationrecoveries 2,857 - Payroll prepaid 737 240 Other 13 340 6,126 3,767
10 Non-current assets classified as held for sale
Property,plantandequipment - 1,144
Consolidated
2014 2013
$’000 $’000
6 Current trade and other receivables (continued)
AuroraEnergyPtyLtdnotestoandformingpartofthestatementsforthefinancialyearended30June2014

52
Consolidated
11 Property, plant and equipment Distribution at fair value
Land & buildings at
fair value
Generation at cost
Other at cost
Total
$’000 $’000 $’000 $’000 $’000
Gross carrying amountBalance as at 30 June 2012 2,690,593 42,730 361,884 119,321 3,214,528
Reclassify assets (9,377) - - 9,377 -
Additions 85,269 680 1,237 13,989 101,175
Disposals (2,613) - (8) (9,712) (12,333)
Transfer of AETV (iv) - (1,104) (363,113) (995) (365,212)
Netrevaluationincrements (35,867) 1,606 - - (34,261)
Transfer to assets held for sale - - - 159 159
Balance as at 30 June 2013 2,728,005 43,912 - 132,139 2,904,056
Reclassify assets - (1,181) - 1,181 -
Additions 89,446 671 - 20,398 110,515
Disposals (1,130) - - (7,050) (8,180)
Netrevaluation(decrement)increments 27,721 (225) - - 27,496
Transfer to assets held for sale - - - - -
Balance as at 30 June 2014 2,844,042 43,177 - 146,668 3,033,887
Accumulated depreciation and impairment losses
Balance as at 30 June 2012 (1,388,689) (478) (36,529) (62,744) (1,488,440)
Reclassify assets 3,634 - - (3,634) -
Disposals 1,514 - 4 7,691 9,209
Transfer of AETV (iv) - 108 48,044 576 48,728
Netadj.revaluationincrements(decrements) 32,524 (1,624) - - 30,900
Impairmentlosseschargedtoprofit(i) (2,283) (2,877) - - (5,160)
Reversal of impairment losses chargedtoprofit(ii) - 264 - - 264
Transfer to assets held for sale - 651 - (141) 510
Depreciationexpense(iii) (72,741) (818) (11,519) (12,045) (97,123)
Balance as at 30 June 2013 (1,426,041) (4,774) - (70,297) (1,501,112)
Reclassify assets - - - - -
Disposals 516 - - 5,689 6,205
Netadj.revaluationincrements(decrements) (1,509) 701 - - (808)
Impairmentlosseschargedtoprofit(i) - (100) - - (100)
Reversal of impairment losseschargedtoprofit(ii) 1,186 325 - - 1,511
Transfer to assets held for sale - 59 - - 59
Depreciationexpense(iii) (73,480) (760) - (13,296) (87,536)
Balance as at 30 June 2014 (1,499,328) (4,549) - (77,904) (1,581,781)
Net book value – at recoverable amount
As at 30 June 2012 1,301,904 42,252 325,355 56,577 1,726,088
As at 30 June 2013 1,301,964 39,138 - 61,842 1,402,944
As at 30 June 2014 1,344,714 38,628 - 68,764 1,452,106
AuroraEnergyPtyLtdnotestoandformingpartofthestatementsforthefinancialyearended30June2014

53
Capital works in progress – at cost As at 30 June 2012 18,747 140 1,605 559 21,051As at 30 June 2013 14,827 24 - 3,115 17,966
As at 30 June 2014 12,696 - - 1,791 14,487
Total property, plant and equipment As at 30 June 2012 1,320,651 42,392 326,960 57,136 1,747,139As at 30 June 2013 1,316,791 39,162 - 64,957 1,420,910
As at 30 June 2014 1,357,410 38,628 - 70,555 1,466,593
(i) Theimpairmentlossesfordistributionassetsin2013relatestotheresettingofvaluesbytheAustralianEnergyRegulatorasat1July2012aspartof2012-2017determination.Theimpairmentlossesforland&buildingsrec-ognisedinbothyearsrelatetotheValuer-General’svaluationofsomebuildings.Impairmentlossesareincludedinthelineitem‘other(losses)/gains’inthestatementofcomprehensiveincome.
(ii) Reversalofimpairmentlossesareincludedinthelineitem‘other(losses)/gains’inthestatementofcompre-hensive income. The reversal of impairment losses for land and buildings in both years relates to the increases intheValuer-General’smostrecentvaluationofsomelandandbuildings.Thereversalofimpairmentlossesfordistributionassetsin2014relatestherevaluationofassetspreviouslyimpairedin2013aspartofthe2012-2017determinationbytheAustralianEnergyRegulator.
(iii) Aggregatedepreciationallocatedduringtheyearisrecognisedasanexpenseinthelineitem‘depreciationandamortisationexpense’inthestatementofcomprehensiveincome.
(iv) Aurora Energy (Tamar Valley) Pty Ltd transferred to Hydro Tasmania on 1 June 2013.
DistributionRevaluation
Theentityrevalueddistributionassetsasat30June2014totheirvalueinuse,basedontheregulatedrevenuethattheassetsareallowedtoearnundertheNationalElectricityRules,basedonthewritten-downoptimisedreplacementvalueoftheassetsandadjustmentstothesevaluesasdeterminedbytheAustralianEnergyRegulator.Thefairvaluemeasurement is categorised as Level 3. Theresultofapplyingthismethodologywasthattheassessedrecoverableamountwasusedforthefinalvaluationofthecompany’sdistributionassetsintheseaccounts,withaconsequentincreaseinthecarryingamountofthecompany’sproperty,plantandequipmentat30June2014of$27.398Mandtheresultfortotalassetsof$28.099M.TheAustralianEnergyRegulatorhasmadeadeterminationofassetvaluesandtheapplicableweightedaveragecostofcapital(WACC),8.28%post-taxnominal,tobeusedfordeterminingtherevenueallowedtobeearnedinthefuturefromthedistributionassets.Therecoverableamountofthecompany’sdistributionassetshasbeentakenasthevalueplacedonthedistributionassetsbytheAustralianEnergyRegulatorandequateswithfairvalue(refernote1(d)(i)).ThisimplicitlymeansthatthecompanyrecognisesthattheWACCratedeterminedbytheRegulatoristheappropriateratetoapplytodiscountcashflowsandtomakeinvestmentdecisionsfortheregulatedcomponentofitsbusiness.
Theunregulatedportionofdistributionassetsof$7.654Mhasbeenvaluedatthewritten-downoptimisedreplacementvalueandequateswithfairvalue.Thecarryingamountsthatwouldhavebeenrecognisedhadtherevaluedassets(otherthanthoseclassifiedasheldforsale)beencarriedunderthecostmodelare:
DistributionAssets 1,186,263 1,178,072 Land & Buildings 31,380 33,462
Consolidated2014 2013$’000 $’000
Consolidated
11 Property, plant and equipment(continued)
Distribution at fair value
Land & buildings at
fair value
Generation at cost
Other at cost
Total
$’000 $’000 $’000 $’000 $’000
AuroraEnergyPtyLtdnotestoandformingpartofthestatementsforthefinancialyearended30June2014

54
Consolidated
12 Intangible assets Patents Computer software Total
$’000 $’000 $’000
Gross carrying amountBalance as at 30 June 2012 193 130,902 131,095Additions 79 6,048 6,127Disposals - (1) (1)Transfer of AETV (ii) - (619) (619)Balance as at 30 June 2013 272 136,330 136,602Additions(iii) 48 41,107 41,155Disposals - (815) (815)Balance as at 30 June 2014 320 176,622 176,942
Accumulated amortisation and impairment losses
Balance as at 30 June 2012 - (73,145) (73,145)Disposals - 1 1Transfer of AETV (ii) - 557 557Amortisationexpense(i) - (21,171) (21,171)Balance as at 30 June 2013 - (93,758) (93,758)Disposals - 711 711Amortisationexpense(i) - (14,808) (14,808)Balance as at 30 June 2014 - (107,855) (107,855)
Net book valueAs at 30 June 2012 193 57,757 57,950As at 30 June 2013 272 42,572 42,844As at 30 June 2014 320 68,767 69,087
Software works in progress – at cost As at 30 June 2012 - 1,381 1,381As at 30 June 2013 - 10,094 10,094As at 30 June 2014 - 583 583
Total intangible assets As at 30 June 2012 193 59,138 59,331As at 30 June 2013 272 52,666 52,938As at 30 June 2014 320 69,350 69,670
(i) Amortisationexpenseisincludedinthelineitem‘depreciationandamortisationexpense’inthestatementofcomprehensive income. Amortisationof$2.542M(2013:$8.670M)relatedtotheentity’samortisationofitscustomercareandbillingsystems.ThedecreasedamortisationchargeisasaresultofareassessmentoftheusefullifeofthesystemasaresultofGovernment’s decision not to sell Aurora’s retail book as part of industry reform (described in note1).
(ii) Aurora Energy (Tamar Valley) Pty Ltd transferred to Hydro Tasmania on 1 June 2013. (iii) Computersoftwareadditionsinclude$36.451MofdistributionandretailcoststoprepareforFullRetailContestability
from 1 July 2014.
AuroraEnergyPtyLtdnotestoandformingpartofthestatementsforthefinancialyearended30June2014

55
Consolidated
2014 2013
$’000 $’000
13 Non-current financial assets Derivativecontracts(atfairvalue)(note1(s)) 6,306 8,924
Fairvalueadjustmenttohedgeditemdesignatedinafairvaluehedgeaccountingrelationship
28,291 -
34,597 8,924
14 Current trade and other payables Trade payables 81,028 117,134 Bankoverdraft 12,770 - Accrued expenses 2,210 3,457 Accrued REC expenses (note 1(w)) 11,451 12,719 Goods and services tax payable 3,708 3,213 Accrued interest 12,041 11,759
123,208 148,282
All trade payables and accrued expenses are unsecured
15 Other current liabilities Income received in advance 24,913 26,859 Derivativecontracts(atfairvalue) 28,033 11,669 Customer security deposits 14,500 14,500 Other 19 189 67,465 53,217
16 Current provisionsEmployeeentitlements:Annual leave 6,567 7,536Long service leave 7,471 7,459Superannuation 1,263 1,328RetirementsBenefitsFund(note20) 2,399 1,961Time bank 189 306 17,889 18,590
Othercurrentprovisions:Workerscompensation 18 129Payroll tax 945 1,014Provision for restructuring 2,200 1,781Provision for dividend 40,000 - 43,163 2,924
Total current provisions 61,052 21,514
The provisions for restructuring related to the restructuring of Aurora arising from Tasmanian Energy Reforms.
AuroraEnergyPtyLtdnotestoandformingpartofthestatementsforthefinancialyearended30June2014

56
Consolidated2014 2013$’000 $’000
17 BorrowingsAll semi-government loans have been transacted through the Tasmanian Public FinanceCorporation(Tascorp).Allborrowingsaresecuredbyafloatingchargeonallpresent and future trade & other receivables.
(a) Current borrowings 103,290 75,545 Non-current borrowings 659,280 674,268 Total borrowings 762,570 749,813
Tascorp loans have been valued using the market yield to maturity at the end of the financialyear(adjustedforaccruedinterest)andareincludedforinformationonly.Thematuritypatternofborrowingshasbeendetailedinnote32(f). 804,940 792,917
Duringthecurrentyearandprioryears,therewerenodefaultsorbreacheson any of the loans.
(b) Forward start borrowing commitments
As at 30 June 2014 the Group had no forward start borrowings(2013:1for$36.0Mbookvalue)Thematuritypatternofforwardstartborrowingcommitmentshasbeendetailed in note 32(f).
18. Non-current provisions Employeeentitlements: Long service leave 3,962 4,373 Superannuation 348 338 RetirementsBenefitsFund(note20) 99,566 89,202 103,876 93,913
Othernon-currentprovisions:
Payroll tax 263 287
Total non-current provisions 104,139 94,200
19. Other non-current liabilitiesDerivativescontracts(atfairvalue) 38,139 14,353
AuroraEnergyPtyLtdnotestoandformingpartofthestatementsforthefinancialyearended30June2014

57
20 Retirement Benefits Fund (RBF)
TheRBFisadefinedbenefitfundwhichpayslumpsumandpensionbenefitstomembersuponretirement(mostofwhicharecalculatedasamultipleofthemember’sfinalaveragesalary).TheRBFhasContributorymembers,CompulsoryPreservedmembers and pensioners.
The RBF operates under the Retirement Benefits Act 1993 and the Retirement Benefits Regulations 2005. Although the RBF is notformallysubjecttotheSuperannuationIndustry(Supervision)(SIS)legislation,theTasmanianGovernmenthasundertakentooperatethefundinaccordancewiththespiritoftheSISlegislation.
Asanexemptpublicsectorsuperannuationscheme(asdefinedintheSISlegislation),thefundisnotsubjecttoanyminimumfundingrequirements.
TheRBFBoard(theBoard)isresponsibleforthegovernanceoftheRBF.AsTrustee,theBoardhasalegalobligationtoactsolelyinthebestinterestsofRBFbeneficiaries.TheBoardhasthefollowingroles:
• AdministrationoftheRBFandpaymenttothebeneficiarieswhenrequiredinaccordancewiththeRBFrules;
• Management and investment of the RBF assets; and
• CompliancewiththespiritoftheSISlegislationasreferredtoabove
ThisactuarialassessmenthasbeenprovidedbytheStateActuary,DrDavidKnox,FellowoftheInstituteofActuariesofAustralia,inareportdated11July2014.
Statement of financial position results 30 June 2014 30 June 2013Net liability $’000 $’000
TotalDefinedBenefitObligations 124,672 112,735RBF Contributory scheme assets (22,707) (21,572)
Deficit 101,965 91,163Adjustmentforeffectofassetceiling - -Net liability 101,965 91,163Current net liability (note 16) 2,399 1,961Non-current liability (note 18) 99,566 89,202
Key assumptions
Keyassumptionsasatbalancedateandforthefollowingyearexpense
Discountrate: 4.10% 4.25%Salaryincreaserate: 3.00% 3.00%Compulsory preserved increase rate 4.50% 3.75%Inflation(pensions): 2.50% 2.50%
Decrementrates: As per the most recent actuarial investigationandreportdated
13 January 2014
AuroraEnergyPtyLtdnotestoandformingpartofthestatementsforthefinancialyearended30June2014

58
20 Retirement Benefits Fund (RBF) (continued)
Profit and loss results for year 30 June 2014 30 June 2013
Expense $’000 $’000
Employer service cost (1) 2,417 2,955
Net interest cost (note 2A) (2) 3,823 3,456
Recognised past service cost (1) - -
Curtailment/settlement(gain)/loss (1) - -
Expense recognised 6,240 6,411Note 1. Recognised in labour cost
Note 2. Recognised in net interest cost regarding RBF provision
Other comprehensive income results for year
Expense
Actuarial(gains)/losses 9,030 (7,016)
Actual return on plan assets less interest income (1,666) (3,883)
Adjustmentforeffectofassetceiling - -
Expense recognised 7,364 (10,899)
Movements in the fair value of Plan assets
Fair value of Plan assets
Fair value Plan assets at end of prior year 21,572 20,076
Employercontributions 2,802 5,895
Interest income 904 684
Actual return on plan assets less interest income 1,666 3,883
Actualparticipantcontributions 661 764
Taxes,premiums&expensespaid (190) (200)
Actualbenefitpayments (4,708) (9,530)
Foreign currency exchange rate assets - -
Businesscombinationassets - -
Curtailments/settlementassets - -
Fair value Plan assets at end of year(1)(2)(3) 22,707 21,572
Note1.AssetsarenotheldseparatelyforeachauthoritybutareheldfortheFundasawhole.ThefairvalueofFundassetswasestimatedbyallocatingthetotalassetstoeachauthorityinproportiontothevalueofeachauthority’sfundedliabilities,calculatedusingtheas-sumptionsoutlinedinthisnote.
Note2.ThefairvalueoftheFundassetsincludesnoamountsrelatingtoanyoftheentity’sownfinancialinstruments.
Note3.ThetotalvalueofRBFassetsincludes$19millionrelatingtothevalueof21KirkswayPlace,Hobartvaluedasat31March2014.This property is partly occupied by Aurora Energy.
AuroraEnergyPtyLtdnotestoandformingpartofthestatementsforthefinancialyearended30June2014

59
20 Retirement Benefits Fund (RBF) (continued)
Fair value of Plan assets as at 30 June 20141
Total Quoted prices in active markets
Level 1
Significant observable inputs
Level 2
Unobservable inputs Level 3
Asset category $’000 $’000 $’000 $’000
Cashandcashequivalents 3,158 3,158 - -Equityinstruments 16,038 8,113 7,278 647Debt instruments 3,165 916 1,315 934Derivatives (118) - (118) -Real Estate 464 - 464 -Investment funds - - - -Asset-backedsecurities - - - -Structured debt - - - -Total 22,707 12,187 8,939 1,581
Note1.EstimatedbasedonassetsallocatedtoAuroraasat30June2014andassetallocationoftheRBFasat30June2013
Movements in the present value of Defined Benefit Obligations 30 June 2014 30 June 2013
TotalDefinedBenefitObligations(netdiscountrate) $’000 $’000
TotalDefinedBenefitObligationsatendofprioryear 112,735 121,562
Employerservicecostplusoperatingcosts 2,417 2,955
Interest cost 4,727 4,199
Actualparticipantcontributions 661 764
Actuarial(gains)/lossesarisingfromchangesindemographicassumptions 3,782 -
Actuarial(gains)/lossesarisingfromchangesinfinancialassumptions 3,504 (18,157)
Actuarial(gains)/lossesarisingfromliabilityexperience 1,744 11,142
Taxes,premiums&expensespaid (190) (200)
Actualbenefitpayments (4,708) (9,530)
Foreigncurrencyexchangerateliabilities - -
Businesscombinationliabilities - -
Curtailments/settlementliabilities - -
New past service costs - -
TotalDefinedBenefitObligationsatendofyear 124,672 112,735
AuroraEnergyPtyLtdnotestoandformingpartofthestatementsforthefinancialyearended30June2014

60
A quantitative sensitivity analysis for significant assumptions as at 30 June 2014
Base Case Scenario A Scenario B Scenario C Scenario D
-0.5%
Discount rate
+0.5%
Discount rate
-0.5% pa
Pension increase rate
+0.5% pa
Pension decrease rate
Discount rate 4.10% pa 3.60% pa 4.60% pa 4.10% pa 4.10% paPension increase rate 2.50% pa 2.50% pa 2.50% pa 2.00% pa 3.00% paDefinedbenefitobligation($’000) 124,647 135,000 115,466 118,022 131,991
ScenarioAandBrelatetodiscountsensitivity.ScenarioCandDrelatetoexpectedpensionincreaseratesensitivity.Thedefinedbenefitobligationhasbeenrecalculatedbychangingtheassumptionsasoutlinedabove,whilstretainingallotherassumptions.
20 Retirement Benefits Fund (RBF) (continued)
Risks to RBF
ThereareanumberofriskstowhichtheFundexposesAurora.Themoresignificantrisksrelatingtothedefinedbenefitsare:
• Investment risk – The risk that investment returns will be lower than assumed and employers will need to increase contributionstooffsetthisshortfall.
• Salarygrowthrisk–Theriskthatwagesorsalaries(onwhichfuturebenefitamountswillbebased)willrisemorerapidlythanassumed,increasingdefinedbenefitamountsandtheassociatedemployercontributions.
• Inflationrisk–Theriskthatinflationishigherthananticipated,increasingpensionpaymentsandtheassociatedemployercontributions.
• Benefitoptionsrisk–Theriskisthatagreaterproportionofmemberswhojoinedpriorto1July1994willelectthepensionoption,whichisgenerallymorecostlythanthealternativelumpsumoption.
• Pensionermortalityrisk–Theriskisthatpensionermortalitywillbelighterthanexpected,resultinginpensionsbeingpaidfor a longer period.
• Legislativerisk–Theriskisthatlegislativechangescouldbemadewhichincreasethecostofprovidingthedefinedbenefits.
Estimate of expense for 2015 30 June 2015$’000
Current service cost 2,240Net interest cost 4,121Past service cost -Movementinlimitationonnetassets ^Effectofcurtailments/settlements ^Estimatedsuperannuationexpense 6,361
^notknownuntilendof2015
Aurora is not aware of any asset and liability matching strategies adopted by the Fund.TheweightedaveragedurationofthedefinedbenefitobligationforAurorais16.3Years.Theexpectedemployercontributionfor2015is$2,399,000.Funding and contribution informationTheemployermeetsthecostofbenefitsastheyemergebypayingapercentageofthebenefitasitfallsdue,asdefinedintheRetirement Benefits Regulations 2005.
AuroraEnergyPtyLtdnotestoandformingpartofthestatementsforthefinancialyearended30June2014

61
Consolidated
2014 2013
$’000 $’000
21 Reserves (a) Reserves comprise
Assetrevaluationreserve 201,413 182,732 Cashflowhedgereserve (16,979) (5,357) 184,434 177,375
(b) Movements in reserves
Assetrevaluationreserve Balance at beginning of year 182,732 185,178 Revaluationofassetsintheyear 28,099 (8,256) Deferredtaxliabilityarisingonrevaluation (8,007) 1,008 Transferred to retained earnings - (94) Impairmentlosses/(reversals) (1,411) 4,896 Balance at end of year 201,413 182,732
Theassetrevaluationreservearisesontherevaluationofdistributionassetsandlandandbuildings.Wherearevaluedassetisdisposedof,thatportionoftheassetrevaluationreservewhichrelatestothatasset,andiseffectivelyrealised,istransferreddirectlytoretainedearnings.
Cashflowhedgereserve Balance at beginning of year (5,357) (7,575)
Gain/(loss)recognised Interest rate swaps 1,168 9,455 Electricity price swaps (14,251) (5,772) Forward exchange contracts - 3,918 (13,083) 7,601
Transferredtoprofitorloss Interest rate swaps (2,639) (3,793) Electricity price swaps (881) 3,380
Forward exchange contracts - (4,019) (3,520) (4,432) Deferred tax arising on hedges 4,981 (951) Balance at end of year (16,979) (5,357)
The hedging reserve represents hedging gains and losses recognised on the effectiveportionofcashflowhedges.Thecumulativedeferredgainorlossonthehedgeisrecognisedinprofitorlosswhenthehedgedtransactionimpactstheprofitorloss.
AuroraEnergyPtyLtdnotestoandformingpartofthestatementsforthefinancialyearended30June2014

62
22 Retained Earnings Balance at beginning of year 152,427 109,218 Netprofitattributabletomembersoftheparententity 63,991 51,486 Dividendprovided/paid (65,000) (16,000) Actuarialgain/(loss)onRBFdefinedbenefitplannetoftax (5,155) 7,629 Transferfromassetrevaluationreserve - 94 Balance at end of year 146,263 152,427
23 DividendsRecognised amountsDeclared,dividendsonordinaryshares 40,000 -Declaredandpaid,dividendsonordinaryshares 25,000 16,000
Unrecognised amounts - 25,000
Thedividendfortheyearended30June2014wasdeclared,butnotpaidpriorto30 June 2014.ThedividendhasbeencalculatedinlinewiththeShareholdersletterofexpectationsdated16June2011,basedontheMarch2014forecastfinancialresults.
24 Commitments for expenditure(a)Property,plantandequipmentcommitments
Property,plantandequipmentNot longer than 1 year 1,732 4,674Longer than 1 year and up to 5 years 1,732 -Longer than 5 years - -
3,464 4,674(b)Operatingleases(note1(x))
Non-cancellableoperatingleasepaymentsNot longer than 1 year 2,479 2,710Longer than 1 year and up to 5 years 8,201 8,155Longer than 5 years 1,828 4,454
12,508 15,319
Note24(b)relatestoleasesforofficemachineryandpropertyleases.TheGroupleasespropertyunderoperatingleasesexpiringoverperiodsfrom2to6years.Themajorpropertyleaseprovidesforarightofrenewalforafurther10yearsatwhichtimealltermsarerenegotiated.Leasepaymentscompriseabaseamountplusanincrementalcontingentrental.Contingentrentalsarebasedonmovementsin the Consumer Price Index.
All commitments are listed net of GST.
25 Contingent liabilitiesClaimsrelatedtopropertyloss,personalinjury(excludingclaimsbyemployeesforpersonalinjuries),contractualandothermatters,andwithanestimatedpotentialcosttotheGroupof$0.320Mwereoutstandingatthedateofpublicationoftheseaccounts.Thecompanyisactivelydefendingtheseclaimsandthedirectorsareoftheopinion,basedonlegaladvice,thatnoprovisionisrequired
320 524
Consolidated2014 2013$’000 $’000
AuroraEnergyPtyLtdnotestoandformingpartofthestatementsforthefinancialyearended30June2014

63
Consolidated2014 2013
$ $
26 Auditors’ remunerationAmountsreceived,dueandreceivable,bytheAuditor-GeneralfromtheGroupfor:
AuditingtheaccountsoftheGroup 197,017 302,439AuditingFinancialServicesLicenceandregulatoryaccounts 220,487 46,007
417,504 348,446
ErnstandYoung,whoprovideexternalauditservicesonbehalfoftheTasmanianAuditOffice,provided$305,585(2013:$104,345)ofadditionalauditservicestotheentityintheyear.Thisrelatedto2013regulatoryinformationnotices,includingamounts paid to Ernst and Young’s subcontractors.
27 Key management personnel compensation
ThekeymanagementpersonneloftheGroupduringtheyearwere:G.Willis(Chairman,non-executivedirector)P.Lowe(non-executivedirector)(retiredeffectivemidnighton01/07/14)C.DemartePSM(non-executivedirector)M.VertiganAC(non-executivedirector)M.Davies(non-executivedirector)(retiredeffectivemidnighton01/07/14)M.Wallace(non-executivedirector)(appointed19/11/2013)P.Davis(ChiefExecutiveOfficer/ManagingDirector)
1
2
D.Smith(ChiefFinancialOfficer)2
A.Botha(ChiefOperationsOfficerDistribution)(resigned7/12/2013)W.Batchelor(ChiefOperationsOfficerDistribution)(commencedaskeymanagementpersonnel8/12/2013) 2
R.Inglis(GeneralManagerStrategyandCorporateAffairsandGeneralManagerReformTransition) 2
J.O’Reilly(GeneralManagerGovernance,GeneralCounselandCompanySecretary) 2
J.Whittle(GeneralManagerPeopleandCulture)2
R.Wilkes(ExecutiveGeneralManagerRetailTransition)(ceasedaskeymanagementpersonnelon28/2/2014)R.Kardos(ChiefExecutiveOfficerDesignate)(commencedaskeymanagementpersonnel1/3/2014)
3
1Required to resign as Managing Director effective midnight on 1 July 2014.4 2Ceased as key management personnel as at 30 June 2014. 3Appointed as the head of Aurora’s Retail operations and became the Aurora Energy Pty Ltd CEO on 1 July 2014.
AuroraEnergyPtyLtdnotestoandformingpartofthestatementsforthefinancialyearended30June2014

64
Director remuneration principles
Non-executivedirectorsareappointedbytheTreasurerandPortfolioMinisterinaccordancewiththecompany’sconstitutionfollowingaprocessandontermsandconditionsprescribedbytheBoardAppointmentsGuidelineissuedbytheDepartmentofTreasury and Finance.
AmatrixofmaximumBoardfeestobepaidtonon-executivedirectors isperiodicallysetforallStateOwnedentitiesbytheDepartmentofPremierandCabinetwiththeappropriatelevelofremunerationforaparticularentitydeterminedbyitslevelofassetsandcomplexity.TheactuallevelofremunerationpaidwithinthisframeworkrequirestheapprovaloftheTreasurer.Committeefeesaresettoensuretheydonotexceed15%oftotalBoardfees.Superannuationispaidattheappropriaterateasprescribedbysuperannuationguaranteelegislation.Nootherleave,terminationorretirementbenefitsareaccruedorpaidtodirectors.DirectorsareentitledtoreimbursementofreasonableexpensesincurredwhileattendingtoBoardbusiness.
Director remuneration
Thefollowingtablesdisclosetheremunerationdetailsinbandsforeachpersonthatactedasanon-executivedirectorduringthecurrentandpreviousfinancialyears:
2014Band (Total Payments)
Number of Directors
Directors’ Fees
Committee Fees
Super-annuation
Other Total2014
Total2013
>$50,000 5 $313,021 $38,750 $28,954 $15,250 $395,975 $442,220<=$50,000 1 $32,331 $4,747 $2,991 $0 $40,069 $0
Total 6 $345,352 $43,497 $31,945 $15,250 $436,044 $442,220
2013Band (Total Payments)
Number of Directors
Directors’ Fees
Committee Fees
Super-annuation
Other Total2014
Total2012 4
>$50,000 6 $352,026 $53,567 $27,377 $9,250 $442,220 $503,762<=$50,000 0 $0 $0 $0 $0 $0 $7,662
Total 6 $352,026 $53,567 $27,377 $9,250 $442,220 $511,424
4 In 2012 there were 7 directors in the >$50,000 band and 3 directors in the <=$50,000 band.
AuroraEnergyPtyLtdnotestoandformingpartofthestatementsforthefinancialyearended30June2014
27 Key management personnel compensation (continued)
TheaggregatecompensationofthekeymanagementpersonneloftheGroupissetoutbelow:
Short-termemployeebenefits 3,024,264 2,907,672Post-employmentbenefits 264,959 230,332Otherlong-termbenefits - -Terminationbenefits 2,844,278 208,345
6,133,501 3,346,349Theshort-termemployeebenefitsincludeshort-termincentivepayments.Withregardto2013,theseshorttermincentivepaymentsincludedthosethatweredueandpayableforthe year but were not paid at balance date.
Consolidated2014 2013
$ $

65
27 Key management personnel compensation (continued)
Executive remuneration
The followingtablesdisclose theremunerationdetails inbands foreachpersonwhoactedasaseniorexecutiveduring thecurrentandtwopreviousfinancialyears.
2014
Band Number of Employees
Base Salaries
Short Term Performance
Payments
Super-annuation
Termination benefits
Total
2014
Total
2013
>$1,050,000 1 $506,815 $101,114 $60,343 $1,344,928 $2,013,200 -
$900,001-$1,050,000 1 $382,852 $64,856 $25,000 $520,517 $993,225 -
$600,001-$750,000 - - - - - - $653,920
$450,001-$600,000 3 $731,075 $136,604 $79,183 $753,099 $1,699,961 -
$300,001-$450,000 2 $366,905 $72,029 $38,321 $225,734 $702,989 $1,587,607
$150,001-$300,000 1 $151,411 - $20,314 - $171,725 $587,807
<=$150,000 1 $106,504 - $9,852 - $116,357 $74,795
Total 9 $2,245,562 $374,603 $233,014 $2,844,278 $5,697,457 $2,904,129
2013
Band Number of Employees
Base Salaries
Short Term Performance
Payments
Super-annuation
Termination benefits
Total
2013
Total
20125
>$600,000 1 $492,001 $109,623 $52,296 - $653,920 -
$450,001-$600,000 - - - - - - $1,106,320
$300,001-$450,000 4 $1,083,873 $195,388 $100,001 $208,345 $1,587,607 $1,217,914
$150,001-$300,000 2 $462,845 $80,497 $44,465 - $587,807 $539,713
<=$150,000 1 $68,602 - $6,193 - $74,795 $64,873
Total 8 $2,107,321 $385,508 $202,955 $208,345 $2,904,129 $2,928,820
5 In 2012 there were 2 employees in the $450,001-$600,000 band; 3 employees in the $300,001-$450,000 band; 2 employees in the $150,000-
$300,000 band; and 2 employees in the <=$150,000 band.
Note:VehiclesareincludedintheBaseSalariesastheyareoptionalandformpartoftheTotalEmploymentPackage.
AsaresultoftheTasmanianGovernment’selectricityreforms,terminationbenefitsin2013/14includedretentionarrangementsforsomekeymanagementpersonnelthatweremaderedundant.InMay2012theBoardapprovedretentionarrangementstomitigatethesignificantriskoflossofkeyemployeescriticaltothetransformationactivitiesrequiredtosupporttheelectricityreformsandtooverseetheoperationsofAuroraEnergyuntilthestructuralchangesofthereformshadbeenimplemented.TheretentionarrangementswereonlyavailabletothoseemployeesthatremainedwithAuroraEnergyuntilthecompletionofthetransformationactivities,andmaderedundantasaresultofthereforms.Theterminationpayments also include redundancy payments that were paid to key management personnel whose employment was terminatedwithAuroraEnergyduringthefinancialyear.Thesizeoftheredundancypaymentsiscommensuratewiththeyearsof services of those employees.
AuroraEnergyPtyLtdnotestoandformingpartofthestatementsforthefinancialyearended30June2014
27 Key management personnel compensation (continued)

66
27 Key management personnel compensation (continued)
Executive remuneration principlesAurora’sapproachtoexecutiveremunerationisdesignedtoattract,retainandmotivatecompetentandexperiencedexecutivemanagement personnel.
AurorausestheMercerCEDJobEvaluationmethodologytodeterminetheclassificationbandforallpositionsorganisation-wide.Indeterminingtheclassificationofeachroleandtheappropriatesalaryband,anumberoffactorsareconsidered.Theseare:
• Knowledgeandexpertiserequiredtocompetentlyperformtherole;• Thelevelandtypeofjudgementrequired;and• Thetypeandlevelofaccountability.
Marketconsiderations,competenceandperformancearefactorsindeterminingsalarypositioningwithintheband.ExecutiveremunerationisgovernedbyapolicyapprovedbytheBoardAppointmentsandRemunerationCommittee(theCom-mittee).UntilFebruary2014thetargetpolicypositionforseniorexecutivepositionswasthemedianoftheMercerAustralianGeneralMarket.InFebruary2014theCommitteeapprovedarevisedExecutiveManagementRemunerationPolicyforthefuture,changingthepolicypositiontothemedianoftheMercerTasmanianGeneralMarket.ThishasbeenappliedtotheAuroraCEO(Designate)anddirectreportswhobecameseniorexecutivesfrom1July20146followingtransferofthemajorityofassetsandoperationstothenewlyformedTasNetworksandtheentitybecomingsolelyfocussedonelectricityretailingonthecom-mencement of full retail contestability in Tasmania.
AuroraEnergyiscompliantwiththeStateGovernment’sDirectorandExecutiveRemunerationGuidelinesasatthedateofthisreport.
Theemploymenttermsandconditionsofseniorexecutivesarecontainedinindividualemploymentcontractsandprescribetotalremuneration,superannuation,annualandlongserviceleaveandsalarysacrificeprovisions.TheoperationofandparticipationinanyshorttermincentiveschemeisreviewedeachyearbytheCommittee.Executivesinvitedtoparticipateinashorttermincentiveschemeeachyearwereofferedan‘atrisk’componentofremuneration.Theactualremunerationwascalculatedwithregardtoachievementofkeyperformanceindicatorsonanannualbasis,withmeasurementsbeingmadeagainstoperationaltargets(includingfinancialandsafety)andachievementofstrategiccompanyordivisionalobjectives.For2014-15,AuroraEn-ergydoesnothaveany“atrisk”componenttosalary.
Theperformanceofeachseniorexecutiveandproposedremunerationarrangementsforthesubsequentyear,includingtheCEO,isreviewedannuallybytheBoardAppointmentsandRemunerationCommittee.Atthedateofthisreport,noticeperiodsofkeymanagementpersonnelrangefrom1monthto6months.Inaddition,oneexecutiveisentitledtocompensationshouldtheiremploymentbeterminatedpriortoFebruary2015sothattheiroverallremunerationisaminimumof18months’salary.
6On 30 June 2014, other than R. Kardos, the remaining Aurora Group Executive Team left the business and on 1 July 2014 the senior executives
became the Aurora Leadership Team from that date.
AuroraEnergyPtyLtdnotestoandformingpartofthestatementsforthefinancialyearended30June2014

67
Name of entity Country of incorporation
Ownership Interest2014
%
2013
%Parent entity
Aurora Energy Pty Ltd Australia
Subsidiaries
EziKeyGroupPtyLtd Australia 100 100Auroracom Pty Ltd Australia 100 100
29 Related party disclosures
(a)EquityinterestsinrelatedpartiesEquityinterestsinsubsidiariesDetailsofthepercentageofordinarysharesheldinsubsidiariesaredisclosedinnote28tothefinancialstatements.
(b)KeymanagementpersonnelcompensationDetailsofkeymanagementpersonnelcompensationaredisclosedinnote27tothefinancialstatements.
(c)TransactionswithkeymanagementpersonnelAlltransactionswithkeymanagementpersonnel,includingthesupplyofelectricityfordomesticpurposesandtokeymanagementpersonnelrelatedentities,wereconductedonanarm’slengthbasisinthenormalcourseofbusinessandoncommercialtermsandconditions.
(d)ControllingentityTheCrown(Tasmaniangovernment)istheultimateparententityofAuroraEnergyPtyLtd.
TheGroupretailselectricityandundertakescertainothertransactionswithgovernmententitiesonanarm’slengthbasisinthenormalcourseofbusinessandoncommercialtermsandconditions.
TheGrouppurchasedelectricitytransmissionservicesandtelecommunicationsfromTransendNetworks(andfrom1July2014purchasestheseservicesfromTasNetworks).TheGrouppurchaseselectricityderivativesandconsultingservices from Hydro Tasmania.
TheGroupsuppliedelectricalservicestoTasNetworksandHydroTasmania,andsuppliedtheseservicestoTransendNetworksuntil30June2014.
Aspartoftheelectricityindustryreformprocess,certaincostsinrelationtopreparationforthemergerofTransendNetworksandAurora’sDistributionandTelecommunicationsBusinesson1July2014wereincurredinthe2013-14yearbyeitherTransendNetworksorbyAuroraEnergy.OverallcostsincurredbyAurorainrelationtoreformareincluded in note 36.
AlltransactionswithTransendNetworks,TasNetworksandHydroTasmaniaareonanarm’slengthbasisinthenormalcourseofbusinessandoncommercialtermsandconditions.
27 Key management personnel compensation (continued) 28 Consolidated entity
AuroraEnergyPtyLtdnotestoandformingpartofthestatementsforthefinancialyearended30June2014

68
Consolidated2014 2013$’000 $’000
30 Notes to the cashflow statement
(a) Reconciliationofcashandcashequivalents(note1(p))Forthepurposesofthecashflowstatement,cashincludescashonhand,inbanks,11amcashandshort-termsecuritydepositsnetofanyoutstandingbankoverdrafts.Cashattheendofthereportingperiodasshowninthestatementofcashflowsisreconciledtotherelateditemsinthestatementoffinancialpositionasfollows:
Cash 669 4,793 Bankoverdraft* (12,770) - 11 am cash 44,000 - Security Deposits 10 20 31,909 4,813
* Relates to payments made from the operating bank account on 30 June 2014. On 1 July 2014 funds were transferred from the 11 am cash investment account prior to processing of these payments by the bank.
(b) Financingfacilities
TheGrouphasaccesstofinancefacilitiesat30Juneasindicatedbelow.
Master Loan Facility Agreement
Facility Limit (including guarantees) 1,162,000 1,162,000 Lessused/committed (799,322) (782,579) Balance 362,678 379,421
CommittedIntraDayCreditAccommodationFacility Facility Limit 30,000 30,000
Bankoverdraft Facility Limit 1,000 1,000 Lessused/committed - -
Balance 1,000 1,000
Bank guarantee
Facility Limit 65,000 65,000
Lessused/committed (52,257) (46,700)
Balance 12,743 18,300
Corporate Mastercard Facility Limit 4,000 4,000 Lessused/committed (174) (224) Balance 3,826 3,776
Eligible Undertaking Facility
Facility Limit 140,000 140,000 Lessused/committed (140,000) (140,000) Balance - -
AuroraEnergyPtyLtdnotestoandformingpartofthestatementsforthefinancialyearended30June2014
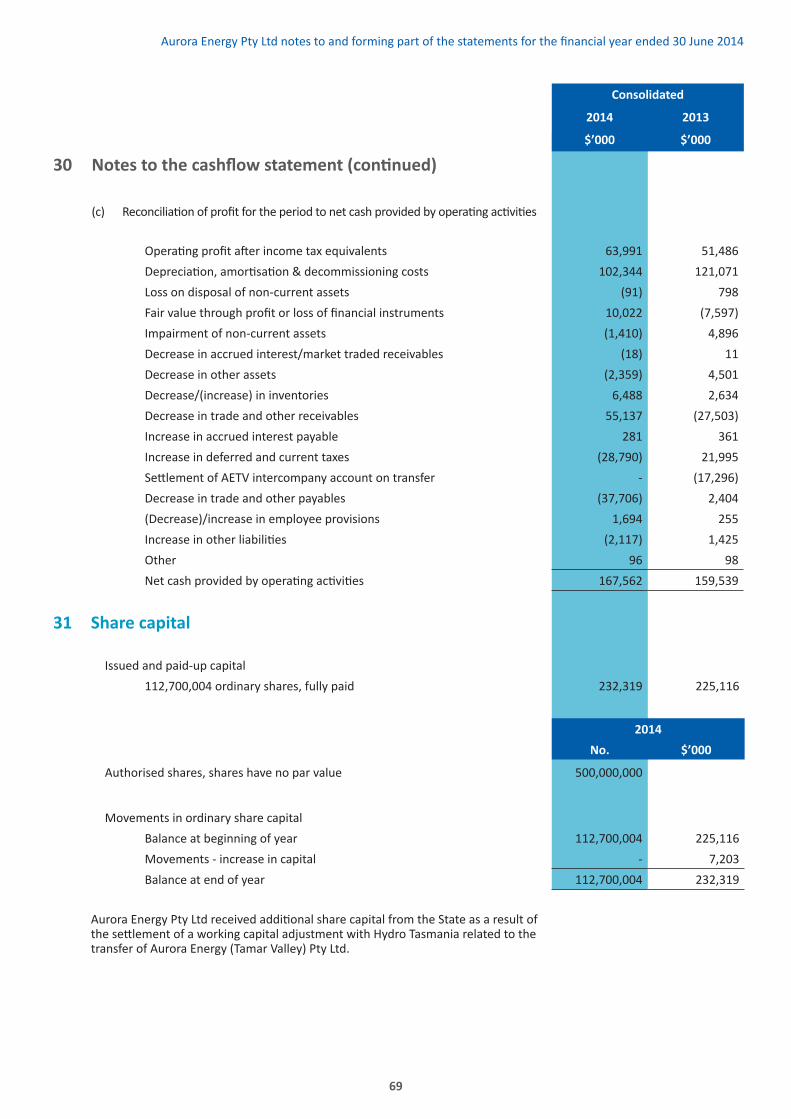
69
Consolidated
2014 2013
$’000 $’000
30 Notes to the cashflow statement (continued)
(c) Reconciliationofprofitfortheperiodtonetcashprovidedbyoperatingactivities
Operatingprofitafterincometaxequivalents 63,991 51,486 Depreciation,amortisation&decommissioningcosts 102,344 121,071 Loss on disposal of non-current assets (91) 798 Fairvaluethroughprofitorlossoffinancialinstruments 10,022 (7,597) Impairment of non-current assets (1,410) 4,896 Decreaseinaccruedinterest/markettradedreceivables (18) 11 Decrease in other assets (2,359) 4,501 Decrease/(increase)ininventories 6,488 2,634 Decrease in trade and other receivables 55,137 (27,503) Increase in accrued interest payable 281 361 Increase in deferred and current taxes (28,790) 21,995 SettlementofAETVintercompanyaccountontransfer - (17,296) Decrease in trade and other payables (37,706) 2,404 (Decrease)/increaseinemployeeprovisions 1,694 255 Increaseinotherliabilities (2,117) 1,425 Other 96 98 Netcashprovidedbyoperatingactivities 167,562 159,539
31 Share capital
Issued and paid-up capital 112,700,004ordinaryshares,fullypaid 232,319 225,116
2014 No. $’000
Authorisedshares,shareshavenoparvalue 500,000,000
Movements in ordinary share capital Balance at beginning of year 112,700,004 225,116 Movements - increase in capital - 7,203 Balance at end of year 112,700,004 232,319
AuroraEnergyPtyLtdreceivedadditionalsharecapitalfromtheStateasaresultofthesettlementofaworkingcapitaladjustmentwithHydroTasmaniarelatedtothetransfer of Aurora Energy (Tamar Valley) Pty Ltd.
AuroraEnergyPtyLtdnotestoandformingpartofthestatementsforthefinancialyearended30June2014

70
Consolidated
2014 2013
$’000 $’000
32 Financial instruments(a) Capital risk management
TheGroup’sobjectiveistohaveanappropriatecapitalstructurethatensuresfinancialflexibilityandfiscaldisciplineandthereforeongoingviabilitytocontinuetoprovidereturnsforshareholders.To30June2014,thecapitalstructurewasmaintainedthroughthemonitoringofkeyfinancialratiosthatsupportthecontinuedmanagementoftheobjectiveto maintain a target capital structure of 60 per cent debt and 40 per cent equity.On1July2014alldebtwastransferredtoTasNetworksassetoutinnote 37.
Thedebttototalcapitalratioswereasfollows:
Debt (i) 762,570 749,813 Year-endEquity(ii) 564,148 554,918 Totaldebttototalcapitalratio(iii) 57% 57%
(i)Debtisdefinedaslongandshorttermborrowings
(ii)Equityincludesallcapitalandreserves
(iii)Totalcapitalisdefinedasdebtplusequity
(b) CategoriesoffinancialinstrumentsCarrying amount
Carrying amount
Financial assets
Loans and receivables -Cashandcashequivalents 44,679 4,813 - Trade and other receivables 71,704 101,926 - Market traded receivables - -
Financial liabilities
Amortisedcost -Tradeandotherpayablesandbankoverdraft 80,491 117,134 - Customer security deposits 14,500 14,500 - Borrowings 762,570 749,813
Derivative instruments -Electricityswaps,futuresandoptions–note32(g)(i) (51,029) (9,819) - Interest rate swaps – note 32(g)(ii) (8,830) (7,261) - Forward exchange contracts – note 32(g)(iii) - -
AuroraEnergyPtyLtdnotestoandformingpartofthestatementsforthefinancialyearended30June2014

71
32 Financial instruments (continued)(c) Financial risk management
TheGroup’sCorporateTreasuryfunctionprovidesservicestotheGroup,coordinatesaccesstofinancialmarkets,andmanagestheinterestrate,foreignexchangeandcommodity(excludingenergy)risksrelatingtotheoperationsof the Group. Risk management in respect of energy commodity exposures is managed under board approved en-ergy risk management (ERM) principles. Treasury and ERM operate under policies approved by the Board.TheGroup’sactivitiesexposeditprimarilytothefinancialrisksofchangesinenergyprice,foreigncurrencyex-changeratesandinterestrates.TheGroupentersintoavarietyofderivativefinancialinstrumentstomanageitsexposuretotheserisks,including:• electricityswaps,futuresandcapstohedgetheenergypriceriskarisingonpurchasesandsalesofelectricity
to customers;
• forward foreign exchange contracts to hedge the exchange rate risk arising on forecast foreign currency payments;
• forward commodity exchange contracts to hedge the risk arising from forecast commodity prices; and
• interestrateswapstomitigatetheriskofrisinginterestrates
(d) SignificantaccountingpoliciesDetailsofthesignificantaccountingpoliciesandmethodsadopted,includingthecriteriaforrecognition,thebasisofmeasurementandthebasisonwhichincomeandexpensesarerecognised,inrespectofeachclassoffinancialasset,financialliabilityandequityinstrumentaredisclosedinnotes1(s),1(t),1(v)tothefinancialstatements.
(e) Credit risk managementCreditriskrepresentsthelossthatwouldberecognisedatthereportingdateifcounterpartiesfailedtomeettheircontractualobligations.TheGroupmeasurescreditriskasthepositiverevaluationoffinancialinstrumentsplusthepotentialcreditexposureandanamountforsettlementrisk.
Credit risk associated with receivables is described in note 6.ABoardapprovedCreditRiskFrameworkestablishescreditlimitsforpartiesdependingontheircreditrating.TheGroupalsousesISDAagreementswithderivativecounterpartiesinordertolimitexposuretocreditriskthroughthenettingofamountsreceivablefromandamountspayabletoindividualcounterparties.TheCreditRiskFrameworkwasoverseenbytheGroup’sTreasuryCommitteeandcustomercreditapprovalsresidedwithinBusinessUnitsandwereapprovedwithdelegationsoverseenbytheChiefFinancialOfficer.TheGroup’soverallstrategy towards credit risk remained unchanged from 2010 however a revised credit policy and associated documentationwasputinplacefor1July2014followingthetransferoftheDistributionandTelecommunicationsbusiness to TasNetworks.ThemajorityoftheGroup’screditriskistoAustralianbasedbanks,financialinstitutionsandelectricitygenerators.Atbalancedate,theonlysignificantconcentrationofcreditriskwithanycounterpartyistoHydroTasmaniaasthedominantgeneratorinTasmaniaandtheWestpacBankandTascorpforbankdeposits.Thereisnomaterialconcentrationriskinretailcustomers.Thecarryingamountoffinancialassetsrecordedinthefinancialstatements,netofanyallowancesforlosses,representstheGroup’smaximumexposuretocreditriskatreportingdate.Inrespecttothosefinancialassetsandthecreditriskembeddedwithinthem,theGroupholdsnosignificantcollateralassecurityandtherearenoothersignificantcreditenhancementsinrespectoftheseassets.TheGroupacceptsguaranteesfromAustralianfinancialinstitutionsonbehalfofmajorcustomerandsupplycontractsascollateralinrespectofthefinancialassets/receivables.
(f) LiquidityriskmanagementPrudentliquiditymanagementinvolvesmaintainingsufficientcashandmarketablesecurities,theavailabilityoffundingthroughanadequateamountofcommittedcreditfacilitiesandtheabilitytocloseoutmarketpositions.Tohelpcounterthisrisk,theGrouphasadequatestand-byfacilitiesandotherfundingarrangementsinplaceasdisclosedinnote30(b)andonlyusesfinancialinstrumentsthatarehighlytradable.TheGroupalsocontinuouslymonitorsforecastandactualcashflowsandmatchesthematurityprofilesoffinancialassetsandliabilities.
AuroraEnergyPtyLtdnotestoandformingpartofthestatementsforthefinancialyearended30June2014

72
32 Financial instruments (continued)
ThefollowingtablesdetailtheGroup’sremainingcontractualmaturityforitsfinancialassetsandliabilitiesandexpectedmaturityofderivativeinstruments.ThetableshavebeendrawnupbasedontheundiscountedcashflowsbasedontheearliestdateonwhichtheGroupcanberequiredtopayitsfinancialliabilitiesandreceiveitsfinancialassetsandisexpectedtosettleitsderivativeinstruments.Thetablesincludebothprincipalandinterestcashflows.
2014 Weighted average effective
interest rate
1 year or less 1 to 2 years 2 to 5 years Over 5
years
% $’000 $’000 $’000 $’000
Financial assets Cashandcashequivalents 2.63 44,679 - - - Trade and other receivables - 71,704 - - - Interest rate swaps - - - - - Electricityderivatives - 7 6,494 76 - 116,390 6,494 76 - Financial liabilities - Trade and other payables - 80,491 - - - Customer security deposits - 14,500 - - - Borrowings–fixedrate 5.90 77,902 59,973 522,046 - Borrowings–floatingrate 3.33 107,188 42,804 51,970 - Forward start borrowing commitments 0.00 - - - - Interest rate swaps 4.49 2,727 3,547 3,873 - Electricityderivatives - 26,631 13,259 20,312 - Forward exchange contracts - note 32(g)(iii) - - - - -
309,439 119,583 598,201 -
AuroraEnergyPtyLtdnotestoandformingpartofthestatementsforthefinancialyearended30June2014

73
2013 Weighted average effective
interest rate
1 year or less 1 to 2 years 2 to 5 years Over 5
years
% $’000 $’000 $’000 $’000 Financial assets Cashandcashequivalents 2.65 4,813 - - - Trade and other receivables - 101,926 - - - Interest rate swaps - - - - - Electricityderivatives - 8,968 - - - 115,707 - - - Financial liabilities Trade and other payables 117,134 - - - Customer security deposits 14,500 - - - Borrowings–fixedrate 5.93 59,848 76,116 529,622 - Borrowings–floatingrate 3.68 100,434 47,779 63,186 - Forward start borrowing commitments 5.45 - 1,962 39,924 - Interest rate swaps 4.62 2,639 2,607 3,062 37 Electricityderivatives - 9,849 2,557 7,360 -
Forward exchange contracts - note 32(g)(iii) - - - - -
304,404 131,021 643,154 37
TheliquidityriskoftheparentisnotmateriallydifferentfromthatoftheGroupasdisclosedintheabovetable.
(g) Market risk management
(i) Price risk managementTheGroupisexposedtocommoditypriceriskfromelectricityassociatedwiththepurchaseand/orsaleofelectricity.Tomanageitscommoditypricerisksinrespecttoelectricity,theGroupentersintoelectricityderivatives,includingcapsandswaps.
ThekeyelementsoftheGroup’sstrategyinclude:
• EnergytradingrisksbeingactivelymanagedandmonitoredagainstBoardapprovedlimits.Theselimitscoverrelativeandabsolutetradinglimits;
• Incorporatingsufficientmarginwithincontestableretailcustomercontractpricingtoadequatelycovercostsandgeneratetherequiredreturnforrisk;and
• Ensuring alignment between key terms of customer sales and associated hedge contracts.TheGroup’soverallstrategyremainsunchanged.AmajorityofAurora’sloadiscoveredbywholeofmeterswaps,withasmallamountsinceOctober2013beinghedgedasaportfoliowithstandardflatandpeakswaps.Thefollowingtablesdetailtheremainingtermsofenergyderivativescontractsoutstandingasatreportingdateand their fair values.
32 Financial instruments (continued)
AuroraEnergyPtyLtdnotestoandformingpartofthestatementsforthefinancialyearended30June2014

74
32 Financial instruments (continued)
2014 1 year
or less1 to 2 years
2 to 5 years
Over 5 years Total
Assets
$’000 $’000 $’000 $’000 $’000
Derivativesdesignatedhedgeinacashflowrelationship 8 6,305 - - 6,313
Derivativesdesignatedinafairvaluehedgerelationship - - - - -
Derivativesnotindesignatedhedgerelationship - - 72 - 72
Liabilities8 6,305 72 - 6,385
Derivativesdesignatedhedgeinacashflowrelationship (17,152) (3,239) (1,029) - (21,420)
Derivativesdesignatedinafairvaluehedgerelationship (8,128) (9,142) (17,596) - (34,866)
Derivativesnotindesignatedhedgerelationship (863) (262) (1) - (1,126) (26,143) (12,643) (18,626) - (57,412) Totalasset/(liability) (26,135) (6,338) (18,554) - (51,027)
2013 1 year
or less1 to 2 years
2 to 5 years
Over 5 years Total
Assets
$’000 $’000 $’000 $’000 $’000
Derivativesdesignatedhedgeinacashflowrelationship - - - - -
Derivativesdesignatedinafairvaluehedgerelationship - - - - -
Derivativesnotindesignatedhedgerelationship 8,941 - - - 8,941
Liabilities8,941 - - - 8,941
Derivativesdesignatedhedgeinacashflowrelationship - - - - -
Derivativesdesignatedinafairvaluehedgerelationship (9,747) (2,450) (6,564) - (18,761)
Derivativesnotindesignatedhedgerelationship - - - - - (9,747) (2,450) (6,564) - (18,761) Totalasset/(liability) (806) (2,450) (6,564) - (9,820)
PricesensitivityThefollowingtablesummarisestheimpactofincreases/decreasesoftherelevantforwardpricesforelectricityontheGroup’sposttaxprofitfortheyearandonothercomponentsofequity.Thesensitivityanalysisiscalculatedbasedonacalculationoftheregion’svolatilityofpriceasobservedoverthepastyear,toprovideanindicatoroflikelypotentialvariationtoprofitandequityoftheGroup.Notethatthesesensitivitiesassumevariationsbasedonhistoricalinformation.Actualresultsmaydifferdependantonfuturemarketconditions.Allvariablesotherthantherelevantprimaryriskvariableidentifiedareheldconstantintheanalysis.
AuroraEnergyPtyLtdnotestoandformingpartofthestatementsforthefinancialyearended30June2014

75
Impact on post tax profit of the Group Post tax impact on equity of the Group
+/(-) ($‘000) +/(-) ($‘000)
2014 Electricity forward price 1,408/(588) 32,843/(13,161)2013 Electricity forward price 25,332/(12,719) -/-
Profitfortheyearwouldincrease/decreaseasaresultofelectricityderivativeswhichdonotqualifyforcashflowhedgeaccountingunderAASB139.Equitywouldincrease/decreaseasaresultofelectricityderivativeswhichdoqualifyforcashflowhedgeaccountingunderAASB139.
(ii) Interest rate risk managementTheGroupisexposedtointerestrateriskasitborrowsfundsatbothfixedandfloatinginterestrates.Theriskismanagedbymaintaininganappropriatemixbetweenfixedandfloatingrateborrowings,byenteringintoforwardstart borrowing agreements and by the use of interest rate swap contracts. The Group’s overall strategy remains unchanged.TheGroup’sexposurestointerestratesonfinancialassetsandfinancialliabilitiesaredetailedintheliquidityriskmanagementsectiontothisnote.Forward start borrowings
The Group is able to enter into forward start borrowing agreements with the Tasmanian Public Finance Corporationtomanageliquidityriskand/orinterestraterisk.Forwardstartborrowingscanbeeitherfixedorfloating,dependingontheriskbeingmanaged.As at 30 June 2014 the Group had no forward start borrowings.
Interest rate swaps
TheGroupisabletoenterintointerestrateswapcontractstomanagetheinterestrateriskofthedebtportfolio.InterestrateswaptransactionsallowtheGrouptoswapfloatingrateexposuretofixedrateexposureandviceversa.Asat30June2014theGrouphad12payfixed/receivefloatinginterestswapswithanaggregatefacevalueof$285.0M.Themajorityoftheswapswereenteredintoduring2011/12.
Thefollowingtabledetailsthenotionalprincipalamounts,remainingtermsofinterestrateswapcontractsoutstandingasatreportingdateandthefairvalues.
Average contracted fixed interest rate
Notional principal amount
Fair value
Outstanding floating for fixed contracts 2014
%
2013
%
2014
$’000
2013
$’000
2014
$’000
2013
$’000Less than 1 year 3.8141 4.2404 55,000 47,500 (12) (630)
1 to 2 years 4.6038 5.1150 40,000 25,000 (1,043) (615)
2 to 5 years 4.6543 4.4740 190,000 155,000 (7,775) (4,448)
5 years + - 5.0000 - 75,000 - (1,568)
285,000 302,500 (8,830) (7,261)
32 Financial instruments (continued)
AuroraEnergyPtyLtdnotestoandformingpartofthestatementsforthefinancialyearended30June2014

76
32 Financial instruments (continued)Interestratesensitivity
Thefollowingtablesummarisestheimpactofincreases/decreasesoftherelevantinterestratesontheGroup’spost-taxprofitfortheyearandonothercomponentsofequity.A100basispointincreaseor50basispointdecrease(2013:100basispointincreaseor50basispointdecrease)representsAurora’sassessmentofthepossible change in interest rates.
Impact on post tax profit of the Group
Post tax impact on equity of the Group
+100bp/(-50bp) +100bp/(-50bp)
($‘000) ($‘000)
2014 Interest rates 204/(408) 3,899/(2,014)2013 Interest rates 166/(333) 4,598/(2,395)
TheinterestpriceriskofthecompanyisnotmateriallydifferenttothatoftheGroupasdisclosedintheabovetables.Post-taxprofitfortheyearwouldincrease/decreasemainlyattributabletotheGroup’sexposuretointerestratesonitsvariablerateborrowings.However,allvariablerateborrowings(excludingvariableshorttermborrowings)havebeeneffectivelyhedged,tochangetheexposuretoafixedrate.Othercomponentsofequitywouldincrease/decreaseasaresultoftheinterestrateswapcontractswhichqualifyforcashflowhedgeaccountingunderAASB139.
(iii) Foreign exchange risk managementTheGroupisexposedtoforeigncurrencyriskoncertaintransactionsthataredenominatedinacurrencyotherthantherespectiveentity’sfunctionalcurrencyandexposurestoexchangeratefluctuationsarise.Foreigncurrencyriskarisesprimarilyfromthepurchaseofcapitalitems,paymentofmaintenancefeesandmanagementfees,andthepurchaseofspareparts.TheGroupusesforwardexchangecontractstohedgeitscurrencyexposureonaminimumrolling12monthbasiswhenaforeigncurrencyfirmcommitmentexists.
Therewerenoforwardforeignexchangecontractsoutstandingasatreportingdate:
(h) FairvalueoffinancialinstrumentsThecarryingamountoffinancialassetsandfinancialliabilitiesrecordedinthefinancialstatements,exceptfortheborrowingsfromTascorpasdiscussedbelow,approximatetheirfairvalues.Tascorploanshaveanaggregatecarryingamountof$762.6Mandanestimatednetfairvalueof$804.9M.TheGrouphasnotwrittentheseliabilitiesupasitexpectstorepaythecarryingamountfullybyholdingthemtomaturity.Fixedrateloans,floatingratenotesandovernightborrowingsarevaluedatcurrentriskadjustedmarketrates.
Thefairvalueofderivativeinstrumentsarecalculatedusingquotedpricesorwheresuchpricesarenotavailableuseismadeofdiscountedcashflowanalysisusingtheapplicableyieldcurveforthedurationoftheinstrumentsfornon-optionalderivatives,andoptionpricingmodelsforoptionalderivatives.Derivativetransactionsareonlyusedforthepurposeofmanagingfinancialexposuresthatarisefromunderlyingbusinesspositions.Thereforefairvaluesshouldnotbeassessedinisolation.Theoverallimpactshouldtakeaccount of the underlying exposures being hedged.
TasmanianElectricityDerivativeContracts
The Group has in place hedge arrangements for its Tasmanian market contracts with all contestable customers. Hedgestaketheformofloadfollowingorfixedvolumeelectricityswapagreements.Theeconomiceffectofthesearrangementsistotransfertothecounterpartiessomeofthevariablepriceriskandtofixthecostofelectricitytothe Group in line with the revenue streams that are contracted for with customers.
AuroraEnergyPtyLtdnotestoandformingpartofthestatementsforthefinancialyearended30June2014

77
Thefollowingtableprovidesananalysisoffinancialinstrumentsthataremeasuredsubsequenttoinitialrecognitionatfairvalue,groupedintolevels1to3basedonthedegreetowhichthefairvalueisobservable.
• Level1fairvaluemeasurementsarethosederivedfromquotedprices(unadjusted)inactivemarketsforidenticalassetsorliabilities.
• Level2fairvaluemeasurementsarethosederivedfrominputsotherthanquotedpricesincludedwithinLevel1thatareobservablefortheassetorliability,eitherdirectly(i.e.asprices)orindirectly(i.e.derivedfrom prices).
• Level3fairvaluemeasurementsarethosederivedfromvaluationtechniquesthatincludeinputsfortheasset or liability that are not based on observable market date (unobservable inputs).
30 June 2014 Level 1 Level 2 Level 3 Total $’000 $’000 $’000 $’000 Derivative instruments -Electricityswap,futuresandoptions–note32(g)(i) - (51,029) - (51,029) - Interest rate swaps – note 32(g)(ii) - (8,830) - (8,830) - Forward exchange contracts – note 32(g)(iii) - - - - Total - (59,859) - (59,859)
TherewerenotransfersbetweenLevel1,2and3intheperiod.
30 June 2013 Level 1 Level 2 Level 3 Total $’000 $’000 $’000 $’000 Derivative instruments -Electricityswap,futuresandoptions–note32(g)(i) - (9,819) - (9,819) - Interest rate swaps – note 32(g)(ii) - (7,261) - (7,261) - Forward exchange contracts – note 32(g)(iii) - - - - Total - (17,080) - (17,080)
TherewerenotransfersbetweenLevel1,2and3intheperiod.
Significantassumptionsusedindeterminingfairvalueoffinancialassetsandliabilities.
Thefinancialstatementsincludeelectricityswapsandcustomercontractswhicharemeasuredatfairvalue.Theirfairvaluesaredeterminedusingvaluationtechniquesbasedonthecalculationofthepresentvalueofexpectedfuturecashflows.Inputstothesevaluationtechniquesincludesomeassumptionsrelatingtotheelectricityforward prices in Tasmania that are supportable by regulated market prices and forecast of future load demand.
32 Financial instruments (continued)
AuroraEnergyPtyLtdnotestoandformingpartofthestatementsforthefinancialyearended30June2014

78
33 Fair value measurement
ThefollowingtableprovidesthefairvaluemeasurementhierarchyoftheGroup’sassetsandliabilitiesQuantitativedisclosuresfairvaluemeasurementhierarchyforassetsandliabilitiesasat30June2014.
Date of valuation Total
Quoted prices in active markets
(Level 1)
Significant observable
Inputs
(Level 2)
Significant unobservable
Inputs
(Level 3)
Assets measured at fair value $’000 $’000 $’000 $’000Derivativefinancialassets
Interest rate swaps 30 June 14 - - - -Electricityderivatives 30 June 14 6,313 - 6,613 -
Revaluedproperty,plantandequipmentDistributiongrid 30 June 14 1,344,714 - - 1,344,714Land and buildings 30 June 14 38,628 - 38,628 -
There have been no transfers betweenLevel1,2and3intheperiod
Liabilities measured at fair valueDerivativefinancialliabilities
Interest rate swaps 30 June 14 8,830 - 8,830 -Electricityderivatives 30 June 14 57,342 - 57,342 -
Liabilities for which fair values are disclosedInterest bearing borrowingsBorrowings–fixedrates 30 June 14 607,802 - 607,802 -Borrowings – variable rates 30 June 14 197,138 - 197,138 -
There have been no transfers betweenLevel1,2and3intheperiod
AuroraEnergyPtyLtdnotestoandformingpartofthestatementsforthefinancialyearended30June2014

79
34 Critical accounting estimates and judgementsEstimatesandjudgementsarecontinuallyevaluatedandarebasedonhistoricalexperienceandotherfactors,includingexpectationsoffutureeventsthatmayhaveafinancialimpactontheentityandthatarebelievedtobereasonableunderthe circumstances.TheGroupmakesestimatesandassumptionsconcerningthefuture.Theresultingaccountingestimateswill,bydefinition,seldomequaltherelatedactualresults.Theestimatesandassumptionsthathaveasignificantriskofcausingamaterialadjustmenttothecarryingamountsofassetsandliabilitieswithinthenextfinancialyeararediscussedbelow:(i) Assessment of impairment of non regulated assets
TheGroupconsidersannuallywhethersuchassetshavesufferedanyimpairment,inaccordancewiththeaccountingpolicystatedinnote1(n).Therecoverableamountsofcash-generatingunitshavebeendeterminedbasedonvalue-in-usecalculations.Thesecalculationsrequiretheuseofthefollowingkeyassumptions:
• forecast electricity pool outcomes and regulated costs and revenues;
• thelevelofcustomerchurntocompetitorswiththeintroductionoffullretailcontestabilityfrom1July2014;and
• discount rates.(ii) Energy Business asset impairment assessment
Whereanindicatorofimpairmentexists,Auroramakesaformalestimateoftherecoverableamountoftheasset.AfiveyearCorporatePlanfortheEnergyBusinesshasbeenapprovedbytheBoard.Theplanreflectsup-to-dateinformationandtheprojectionsrepresentmanagement’sbestestimateoffuturefinancialperformance.BasedonthefutureprojectionsoftheEnergyBusiness,theBoardhasdeterminedthatnoindicatorsofimpairmentexistand,accordingly,noformalestimateoftherecoverableamounthasbeenperformed.
(iii) FairvalueoffinancialinstrumentsThefairvalueoffinancialinstrumentsthatarenottradedinanactivemarket(forexample,certaintypesofelectricityderivatives)isdeterminedbyusingvaluationtechniques.TheGroupusesitsjudgementtoselectavarietyofmethodsandmakesassumptionsthataremainlybasedonmarketconditionsexistingateachbalancesheet date.
(iv) RBF liabilityTheRetirementBenefitsFunddefinedbenefitsprovisiondetailedinnote20hasbeenassessedbytheStateActuaryandvariousactuarialassumptionshavebeenappliedtoarriveatthecarryingvaluereported.
(v) Unbilled revenueUnbilledelectricitysalesareanestimateofthevalueofelectricityunitssuppliedbetweenthedateofthelastmeterreadingandtheyear-end.Theestimateoftheunitssuppliedisbasedonthecustomerhistoricusageprofileadjustedtoreflecttheactualwholesaleelectricitypurchasesandtheunitpriceusedreflectstherelevanttariffprices.
(vi) Recovery of deferred tax assetDeferredtaxassetsarerecognisedfordeductibletemporarydifferencesasAuroraconsidersthatitisprobablethatfuturetaxableprofitswillbeavailabletoutilisethosetemporarydifferences.
(vii) Customer care and billing systemAcustomercareandbillingsystemwascommissionedinFebruary2011toreplaceanexistingsystemwhichwasnolongersupportedbythevendorandwasunabletoeffectivelysupportNationalElectricityMarketrequirements.Aurorareceivesanallowancepercustomerthroughtheindependentretailpriceregulationprocess.Thebookvalueofthecustomercareandbillingsystemat30June2013was$17.226M.Itwasbeingdepreciatedoverausefulremaininglifeof3yearsto30June2015,thedatereasonablyexpectedastheendtoAurora’sretailservicesfunctionsproposedunderreformprocesswiththesaleofAurora’sretailbook.Followingthe September 2013 announcement of the abandonment of a process to sell Aurora’s retail customer base and thecontinuingonofAuroraasaRetailer,theestimatedusefullifewasreassessedto8yearsfrom1July2013.Aurorawillcontinuetoassesstheeffectiveusefullifeinaccordancewithnote1(f).
AuroraEnergyPtyLtdnotestoandformingpartofthestatementsforthefinancialyearended30June2014

80
35 Parent entity information Current assets 255,280 287,843 Total assets 1,886,229 1,817,273 Currentliabilities 329,804 315,800 Totalliabilities 1,319,424 1,258,563 Issued capital 232,319 225,116 Retained earnings 150,052 156,219 Assetrevaluationreserve 201,414 182,732 Cashflowhedgereserve (16,979) (5,357) Totalshareholders’equity 566,805 558,710
Totalrevenueincludingtaxbenefitoftheparententity 1,193,079 1,624,020 Totalexpensesincludingtaxexpenseoftheparententity 1,129,092 1,567,530 Profitaftertaxoftheparententity 63,987 56,490 Totalcomprehensiveprofitoftheparententity 65,892 56,356
Contingentliabilities:Contingentliabilitiesoftheparententityaresetoutinnote25,andarethesameasfortheconsolidatedentity.
Property,plantandequipmentcommitments: Property,plantandequipment Not longer than 1 year 1,732 4,674 Longer than 1 year and up to 5 years 1,732 0
Longer than 5 years 0 0 3,464 4,674
2014 2013$’000 $’000
AuroraEnergyPtyLtdnotestoandformingpartofthestatementsforthefinancialyearended30June2014

81
36 Tasmanian Energy Reform related costs borne by Aurora
On18June2013TasmanianDepartmentofTreasuryandFinanceissuedaProtocolforreportingelectricityreformimplementationcosts.ThefollowingoperatingcostswereincurredbytheGroup:
2014 2013 $’000 $’000Operating Expenditure Aurora’sshareofcostsoffundingtheBusinessTransitionGroup 837 792
CostsofconsultantsengagedonElectricityReformProject 724 259
Operatingcostsofemployeeswhospendgreaterthan80%oftheirtimeonreformactivities,includingtheestablishmentofTasNetworks,andcontractedlabourandcontracted services 7,521 3,339
Redundancy costs paid and payable 13,724 880
Other costs of reform 2,523 415Total reform costs borne by Aurora 25,329 5,685
MakereadycoststodeliverTransitionalServicesforpurchasersoftheRetailBookareincludedinthetableabovein2013-14.IntheprioryearsuchcostswereexcludedandrecordedasareceivablefromtheCrown,reimbursablefromsales proceeds. The sale was abandoned on 26 September 2013.During2014andfollowingthediscontinuationoftheretailsaleprocess,theBusinessTransitionGroupwasrealignedtosupportNetworkintegrationandtheestablishmentofTasNetworks.
TheProtocolrequiresthedisclosureofthedirectcostsofemployeeswhospendgreaterthan80%oftheirtimeonreformrelatedactivities.Theamountinthetableaboveisamanagementestimateofthereformcostthatwouldhave been included based on the 80% basis as set out in the Protocol. The actual costs for all employees that were allocatedtoreformactivitiesfromthebeginningoftheyearundertheentity’snormalcostingpracticesis$9.141M(2013:$4.493M).
CapitalexpenditureincurredduringtheyeartoprepareforFullRetailContestabilitywas$28.458M,comprisingof$26.735Mforsoftware(referNote12),($9.681Min2013)and$1.723MforITnetworkinfrastructure.AuroraEnergyhasappliedtotheAustralianEnergyRegulatortohaveasubstantialpartofthiscapitalexpenditureincludedintheRegulated Asset Base.
ThetableaboveexcludesaccelerateddepreciationontheCustomerCareandBillingSystemfor2012/13(referNote12).
AuroraEnergyPtyLtdnotestoandformingpartofthestatementsforthefinancialyearended30June2014

82
37 Subsequent events
On 15May 2012 (and in subsequent updates) theMinister for Energy announced a comprehensive and integratedreform package for the Tasmanian electricity industry which has significantly affected Aurora’s principal activities.ManychangestoAuroraEnergy’soperationsoccurredinthe2012-13and2013-14years.On1July2014themergerofAurora’sdistributionandtelecommunicationsbusinesseswithTransendconcluded,withthenewbusinessTasNetworkscommencingoperationson1July2014.
On1July2014,relevantassetsandliabilitiesweretransferredfromAuroraEnergytoTasNetworksviaagazettedTransferNoticedated25June2014.Atthesametime,AuroraEnergy’sfacilitylimitsunderitsMasterLoanFacilityAgreementwereamendedasfollows:(i)$902MofthefacilitylimitwastransferredtoTasNetworksand(ii)anamountof$80Mwasaddedtothefacilitylimit.ThetransferwillbeaccountedforasanAdministrativeArrangementunderAASB5,asadistributiontoAurora’sshareholdersequivalenttothenetassets(atbookvalue)ofapproximately$523M,fornilcashconsideration.The$40MdividenddeclaredbyAuroraEnergyfortheyearended30June2014istobepaidbyTasNetworksinDecember2014,asprescribedintheTransferNotice.AreconciliationandauditofthenetassettransfertoTasNetworksisbeingundertakenandwillbefinalisedinquarter1,2014-15.
Followingthesenetassettransfers,andwiththeintroductionoffullretailcompetitionfrom1July2014,AuroraEnergyoperatesacompetitiveretailbusinessinTasmania.FollowingtheimplementationoftheTransferNotice,thenetassetpositionofAuroraEnergyon1July2014wasapproximately$40M;thecompanyhadnodebtandhadsufficientfinancefacilitiestooperateintheNationalElectricityMarket.
AuroraEnergyPtyLtdnotestoandformingpartofthestatementsforthefinancialyearended30June2014
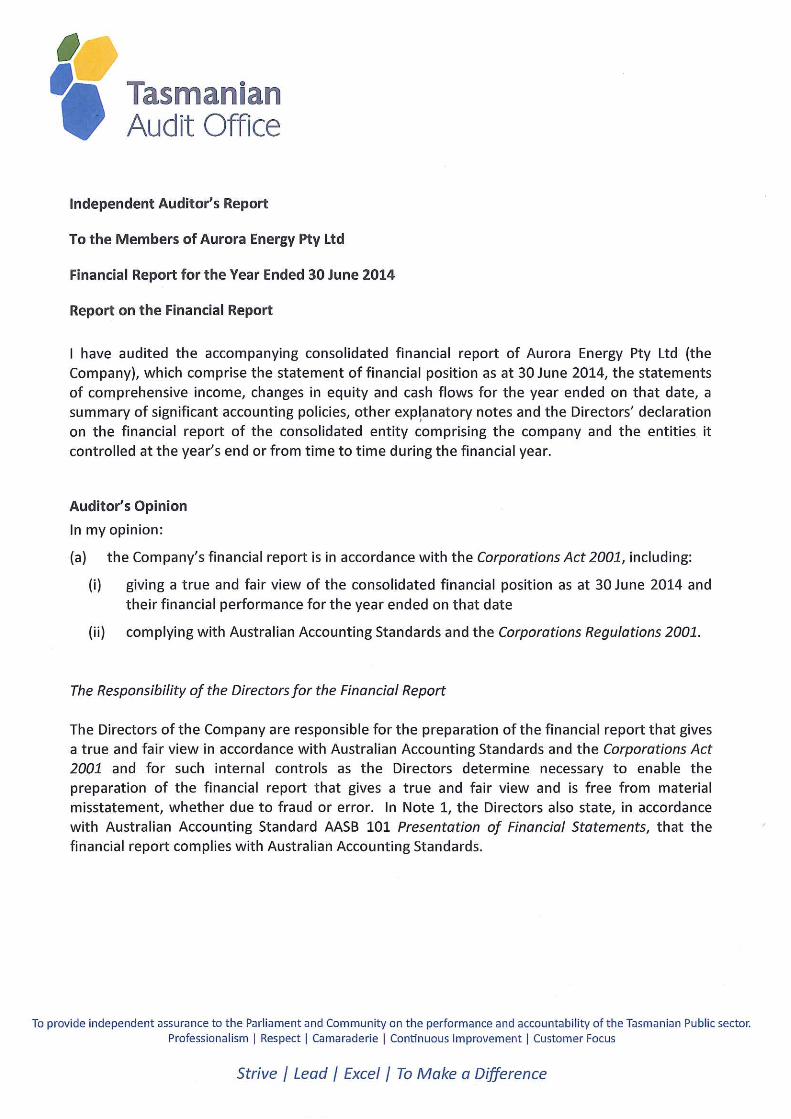
83

84

85
9. Glossary
AEMO Australian Energy Market Operator
AER Australian Energy Regulator
AET AuroraExecutiveTeam
AETV Power Aurora subsidiary responsible for constructionandoperationof the Tamar Valley Power Station
A&RC Board’s Appointments and RemunerationCommittee
ASHEC AuroraSafety,Healthand EnvironmentCommittee
ASX Australian Stock Exchange
Aurora Group AuroraEnergyPtyLtd, including subsidiary companies
BARCC BoardAudit,Risk& ComplianceCommittee
bn Billion
CablePI Tasmanians brand name fortheWireAlert safety sensor
CCGT Combined-cycle gas turbine
CEO ChiefExecutiveOfficer
CIMS Carbon Inventory Management Scheme
Demand-side management Encouraging end-users to bethriftywithelectricitymanagement
DPIPWE Department of Primary IndustriesParks,Water& Environment
EEO EqualEmployment Opportunity
EHV Extra High Voltage
EMF Electricandmagneticfields
EHEC ExecutiveSafety,Health and Environment Committee
FiT Feed-in-tariff
FRC Fullretailcompetition
FTE Full-timeequivalent
GRI GlobalReportingInitiative–internationalorganisationthatprovidesareportingframework for measuring andreportingeconomic,social and environmental performance
GSL Guaranteed Service Level scheme
GWh Gigawatthour(oneGWhisequaltoonemillionkilowatthours)
HV High Voltage
ICS Incident Control System
IRT Incident Review Team
km Kilometre
kV Kilovolt(1000volts)
kW Kilowatt(1000watts)
kWh Kilowatthour(standardunitofenergy,equivalenttoproductionofconsumptionattherateofonekilowattforonehour)
LifeSafe Aurora program that identifiesrisky safety behaviours
LTIFR LostTimeInjuryFrequency Rate
LV Low voltage (up to 1000 watts)
Mark-to-market adjustmentofderivativeto their current market value
MTIFR medicaltreatmentinjury frequencyrate
MW megawatt(oneMWisequalto1000kilowattsor1,000,000watts)
NBN NationalBroadbandNetwork

86
NECF NationalEnergyCustomerFramework
NEM NationalElectricityMarket
NGERS NationalGreenhouseEmissionsReportingScheme
NILS No Interest Loans Scheme
NMBS Net Metering Buyback Scheme
NOx oxidesofnitrogen,produced during the combustionprocess
OCGT open-cycle gas turbine
Peak Shaving Reducing the instantaneouselectivityusage during peak periods,whenusagewould ordinarily be high. Methods may include the useofgenerators,energysavingdevicesorincentivestoencourageshiftingusagetooffpeakperiods
PCBs polychlorinated biphenyls
REC renewable energy certificates
SAIDI System Average InterruptionDurationIndex
SAIFI System Average InterruptionFrequencyIndex
SMART goals Specific,measurable,achievable,relevantandtime-bound
STIPS Service Target Performance IncentiveScheme
TasCOSS Tasmanian Council of Social Services
Tranche Customer segment
Transmission Line Extra high voltage power supply,usuallyonsteeltowers
TSA TransitionalServicesAgreement
TSP TransitionalServicesProvider
TVPS TamarValleyPowerStation
Volt unitofpotentialorelectrical pressure
Watt rate of which electrical energy is produced or used
WireAlert trading name of Aurora subsidiaryEziKeyGroupPtyLtdandnationalbrandname for Aurora’s safety sensor
Zero Harm Aurora’ssafety,healthand environmental improvement strategy


Contact us Accounts/connections/general
Residential 1300 13 2003
Business 1300 13 2045
Customer feedback 1800 800 753
Switchboard 1300 13 2007
Internet www.auroraenergy.com.au
TasNetworks 1300 13 7008