Embed Size (px)
Citation preview
1
Australia and New Zealand Banking Group Limited
Peter Marriott, Chief Financial Officer
Ross Glasscock, Executive Treasurer, Group Wholesale Funding
Rick Moscati, Executive Treasurer, Balance Sheet Management
Shaun Coughlan, Executive Treasurer Global Money Markets
January 2003

2
Outline
1. Group Overview
2. Strategy and Business Overview
3. Financial/Operating Performance Overview
4. Term Debt Funding Strategy
5. Summary
6. Supplementary Information

3
ANZ Group Overview
• One of the four major Australian banks
• Established in 1835
• Full range financial service provider
• Distinctive specialist business strategy – 17 separate businesses
• Assets (as at FYE 2002) A$183.1bn.(US$102.8bn.)
• Market Cap. (as at 31/12/02) A$26.1bn.(US$14.7bn.)
• Tier 1 Capital Ratio 7.9%
• Credit Ratings AA-/Aa3 (Stable)

4
Highlights
• Performing well - record profit of $2,168m *
– EPS Growth 17%– ROE 21.6%– Cost Income ratio 46.0%
• Strong capital position, well provisioned
• Record staff satisfaction – up 16% to 78%
• Exciting Restoring Customer Faith pilot
• Specialised business strategy operating well
• Stretch target for 2003 of 10% EPS growth
* Before gains from “significant transactions”
5
Outline
1. Group Overview
2. Strategy and Business Overview
3. Financial/Operating Performance Overview
4. Term Debt Funding Strategy
5. Summary
6. Supplementary Information

6
Building a credible track record
1024 1106
14801747 1870
2168
400
900
1400
1900
2400
1997
1998
1999
2000
2001
2002
$m NPAT21.6
20.219.3
17.215.9
17.6
1012141618202224
1997
1998
1999
2000
2001
2002
% ROE
40
45
50
55
60
65
1997
1998
1999
2000
2001
2002
012345678
Income/Expenses
101171
198100
84
137
0
50
100
150
200
250
1997
1998
1999
2000
2001
2002
Total Shareholder Return$b%
Cost - Income Ratio

7
Leading reputation for disclosure and transparency
• Profit and Loss statements for all 17 Business Units
• Enhanced disclosure on :– Critical accounting policies– Special purpose and off balance sheet vehicles– Deferred acquisition costs, software assets, and deferred income– Accounting for derivates and hedging
• Excellent disclosure on credit quality
• External recognition, including awards for:– Best communication of shareholder value– Best management of continuous disclosure– Best results/analyst briefings

8
Our growth philosophy unchanged – but primary focus on organic out-performance
Organic out-performance
Portfolioreshaping
Transformationalmoves
• Extend specialisation• Restoring Customer Faith• Increase share of wallet• Drive productivity • Revenue growth
materially higher than expense growth
• Take business units to sustainable leadership positions
• Build a range of strategic options
Our targets
• Invest in high growth areas• Build specialist capabilities• Exit weak positions• Risk reduction
• Step changes in positioning• Creating new growth options• Proactively shaping industry

9
Opportunities for growth
Personal Banking• Full rollout Restoring Customer Faith• Expand network in growth locations
• Autonomous customer organisation• Rollout Restoring Customer Faith
Wealth Management • Maintain high investment spending• Lower profit volatility from ING ANZ JV
Institutional & ANZIB • Leverage leading relationship position• Leverage business integration synergies
Corporate & SME• Investment spending budgeted• Leverage business integration synergies
Opportunity Approach
New Zealand
10
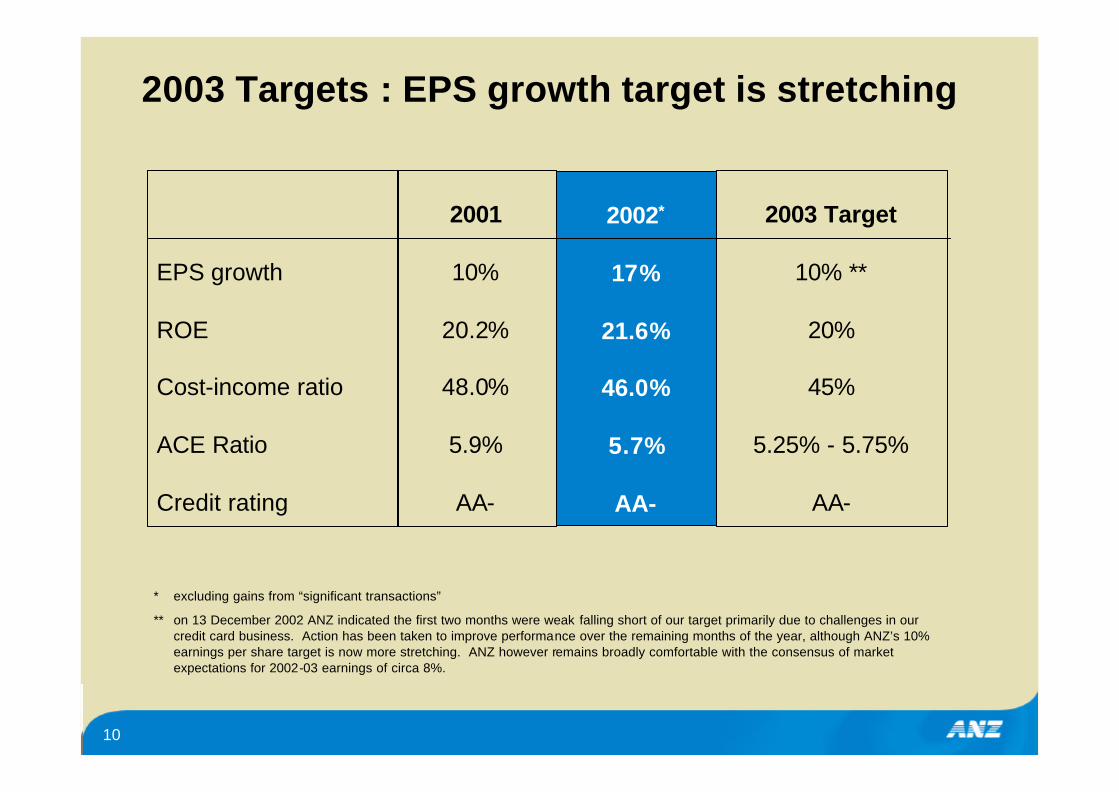
2003 Targets : EPS growth target is stretching
EPS growth
ROE
Cost-income ratio
ACE Ratio
Credit rating
2003 Target
10% **
20%
45%
5.25% - 5.75%
AA-
2001
10%
20.2%
48.0%
5.9%
AA-
2002*
17%
21.6%
46.0%
5.7%
AA-
* excluding gains from “significant transactions”
** on 13 December 2002 ANZ indicated the first two months were weak falling short of our target primarily due to challenges in our credit card business. Action has been taken to improve performance over the remaining months of the year, although ANZ’s 10% earnings per share target is now more stretching. ANZ however remains broadly comfortable with the consensus of market expectations for 2002-03 earnings of circa 8%.
11
Outline
1. Group Overview
2. Strategy and Business Overview
3. Financial/Operating Performance Overview
4. Term Debt Funding Strategy
5. Summary
6. Supplementary Information

12
A solid result, driven primarily by revenue growth
1,500
1,600
1,700
1,800
1,900
2,000
2,100
2,200
2,300
2,400
1870
2001
Interest Income
185 Provisioning (79)
Non Interest Income
223
Expenses(61)
Tax & OEI30 2168
$m
2002
Before one-offs
Significant transactions
154 2322
2002
Tax rate change $79
Tax on higher profit $(49)
13
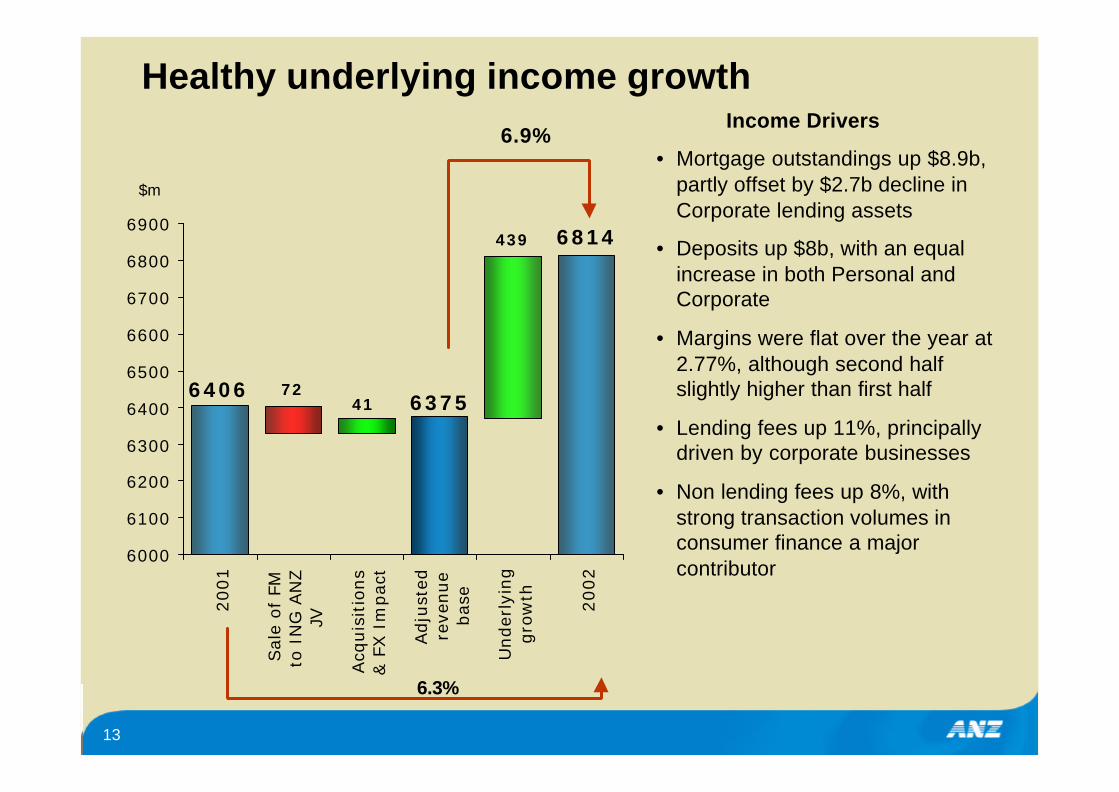
Healthy underlying income growth
64066375
6814
4172
439
6000
6100
6200
6300
6400
6500
6600
6700
6800
69002001
Sale
of
FMto
IN
G A
NZ
JV
Acq
uis
itio
ns
& F
X I
mpact
Adju
sted
reve
nue
bas
e
Under
lyin
ggro
wth
2002
$m
• Mortgage outstandings up $8.9b, partly offset by $2.7b decline in Corporate lending assets
• Deposits up $8b, with an equal increase in both Personal and Corporate
• Margins were flat over the year at 2.77%, although second half slightly higher than first half
• Lending fees up 11%, principally driven by corporate businesses
• Non lending fees up 8%, with strong transaction volumes in consumer finance a major contributor
Income Drivers6.9%
6.3%

14
0 100 200 300
A diversified portfolio performing well
2002 NPAT $m
NPAT increase
NPAT decrease
Prior period NPAT
2nd half NPAT $m
0 100 200 300
Personal Banking AustraliaMortgagesInstitutional BankingTransaction ServicesSmall Med BusinessCorporate BankingPersonal Banking NZConsumer FinanceAsset FinanceForeign ExchangeStructured FinanceGroup TreasuryWealth ManagementCorp Finance & AdvisoryAsia/Pac Personal BankingCapital MarketsING JV/ANZ FM

15
309
241246258 252 256
301290
434242
36 35
4245
40
0
50
100
150
200
250
300
350
Mar-99
Sep-99
Mar-00
Sep-00
Mar-01
Sep-01
Mar02
Sep-02
0
10
20
30
40
50
60
70
80ELP adjustmentELP $ELP BP's
Provisioning charge reflects conservative management
ELP Charge$m bp’s • ELP portfolio level
adjustment continued
• reflecting ongoing global economic uncertainty
• calculated as one notch downgrade across GSF portfolio
• Domestic ELP rate declining
• ELP adjustment likely to continue until international defaults stabilise
16
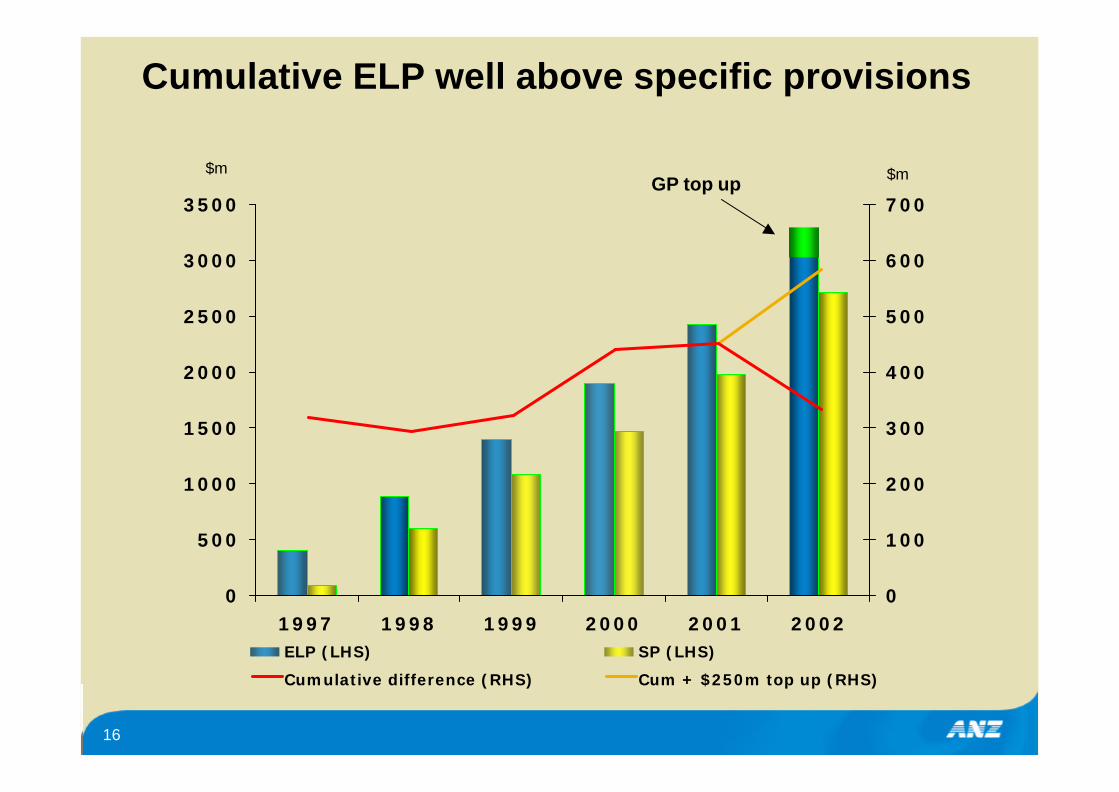
Cumulative ELP well above specific provisions
0
500
1000
1500
2000
2500
3000
3500
1997 1998 1999 2000 2001 20020
100
200
300
400
500
600
700
ELP (LHS) SP (LHS)
Cumulative difference (RHS) Cum + $250m top up (RHS)
GP top up$m $m
17
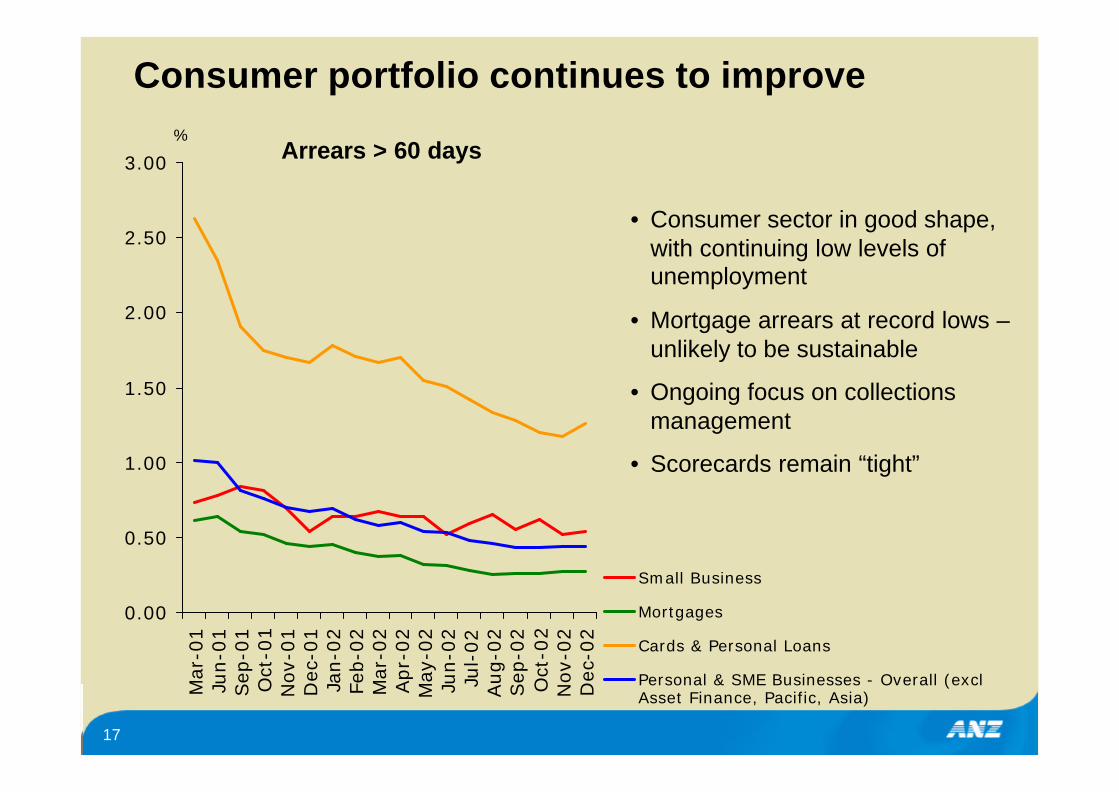
Consumer portfolio continues to improve
Arrears > 60 days%
0.00
0.50
1.00
1.50
2.00
2.50
3.00
Mar
-01
Jun-0
1Sep
-01
Oct
-01
Nov-
01
Dec
-01
Jan-0
2Fe
b-0
2M
ar-0
2Apr-
02
May
-02
Jun-0
2Ju
l-02
Aug-0
2Sep
-02
Oct
-02
Nov-
02
Dec
-02
Small Business
Mortgages
Cards & Personal Loans
Personal & SME Businesses - Overall (exclAsset Finance, Pacific, Asia)
• Consumer sector in good shape, with continuing low levels of unemployment
• Mortgage arrears at record lows –unlikely to be sustainable
• Ongoing focus on collections management
• Scorecards remain “tight”

18
Mortgage outlook – slight deterioration
0.000.100.200.300.400.500.600.700.80
Jan-01
May-01
Sep-01
Jan-02
May-02
Sep-02
Jan-03
Home LoanRes Inv Loan
60 day arrears improving%
• ANZ has not allowed FHOG to be the source of minimum equity requirement
• Behavioural scores remain stable
• Scorecards tightened in 2001, resulting in higher quality borrowers
• Unemployment, a key driver of default, continues to trend downwards
• Scenario analysis at 95% confidence suggests loss not exceeding 4-6 bp over next 12 months, compared with ELP of 5 bp
• Based on uncommitted monthly income at time of application, 100% of customers could meet a 1% rise in interest rates, and 97.2% could meet a 2% increase without rearranging affairs
-20
-10
0
10
20
30
40
50
60
1967
1969
1971
1973
1975
1977
1979
1981
1983
1985
1987
1989
1991
1993
1995
1997
1999
2001
Sydney
Melbourne
% change House prices well below previous peaks
19
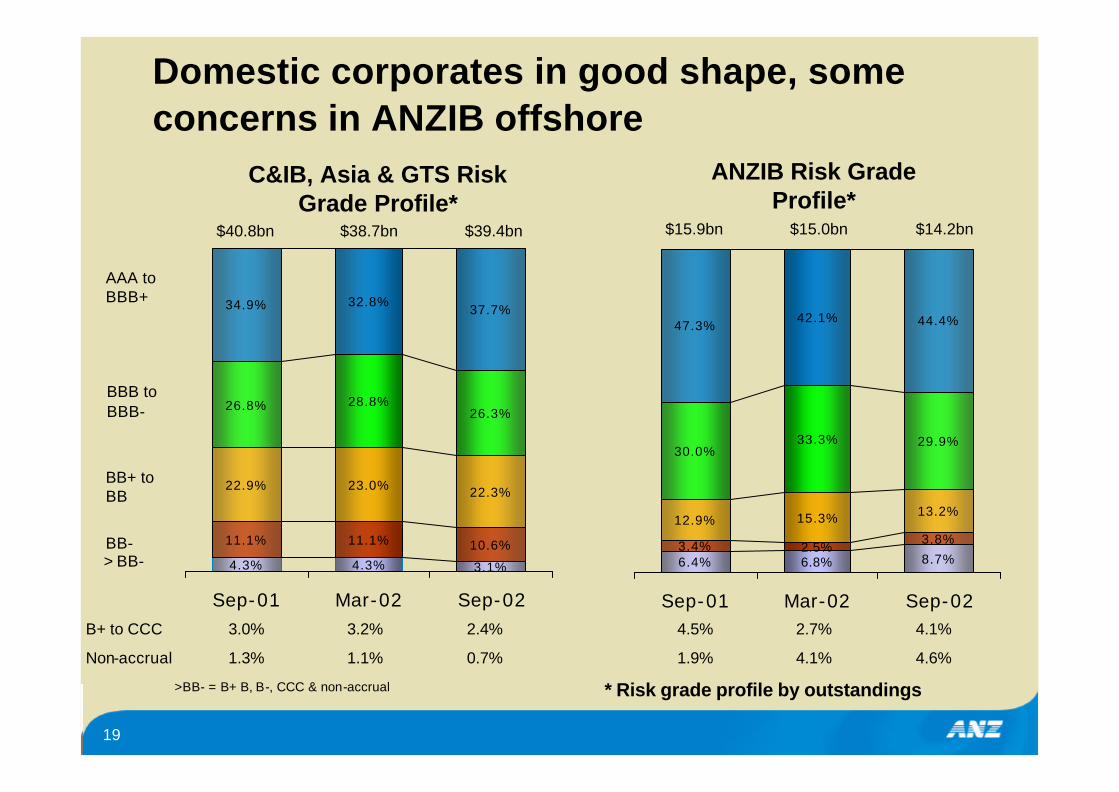
4.3% 4.3% 3.1%
11.1% 11.1% 10.6%
22.9% 23.0% 22.3%
26.8% 28.8%26.3%
37.7%32.8%34.9%
Sep-01 Mar-02 Sep-02
Domestic corporates in good shape, some concerns in ANZIB offshore
>BB- = B+ B, B-, CCC & non-accrual
AAA to BBB+
BBB to BBB-
BB+ to BB
BB-> BB-
$40.8bn $38.7bn
C&IB, Asia & GTS Risk Grade Profile*
B+ to CCC 3.0% 3.2% 2.4% 4.5% 2.7% 4.1%
Non-accrual 1.3% 1.1% 0.7% 1.9% 4.1% 4.6%
$39.4bn
* Risk grade profile by outstandings
6.4% 6.8% 8.7%3.4% 2.5%
3.8%12.9% 15.3% 13.2%
30.0%33.3% 29.9%
44.4%42.1%47.3%
Sep-01 Mar-02 Sep-02
$15.9bn $15.0bn $14.2bn
ANZIB Risk Grade Profile*

20
Specific provisions again impacted by large corporate collapses
0
50
100
150
200
250
300
350
400
Mar-98
Sep-98
Mar-99
Sep-99
Mar-00
Sep-00
Mar-01
Sep-01
Mar-02
Sep-02
0%
10%
20%
30%
40%
50%
60%
70%
80%
90%
100%
Net specific provisions - $m (LHS)% International SPs (RHS)ELP charge - $m (LHS)
Provisions$m Single
customers2nd half Specific
Provisions by size
• Only 4 customers with specific provisions greater than $10m
< $5m
$5m - $10m
$10m - $20m
$20m - $50m
1customer
1customer
>$100m2
customers
21
869
5950
623651 681
388
80
792
523
37
643
0
200
400
600
800
1000
1999
2000
2001
2002
1543
1391
12601203
1662
628
770699
657
900
0
300
600
900
1200
1500
1800
1998 1999 2000 2001 20020.0%
0.5%
1.0%
1.5%
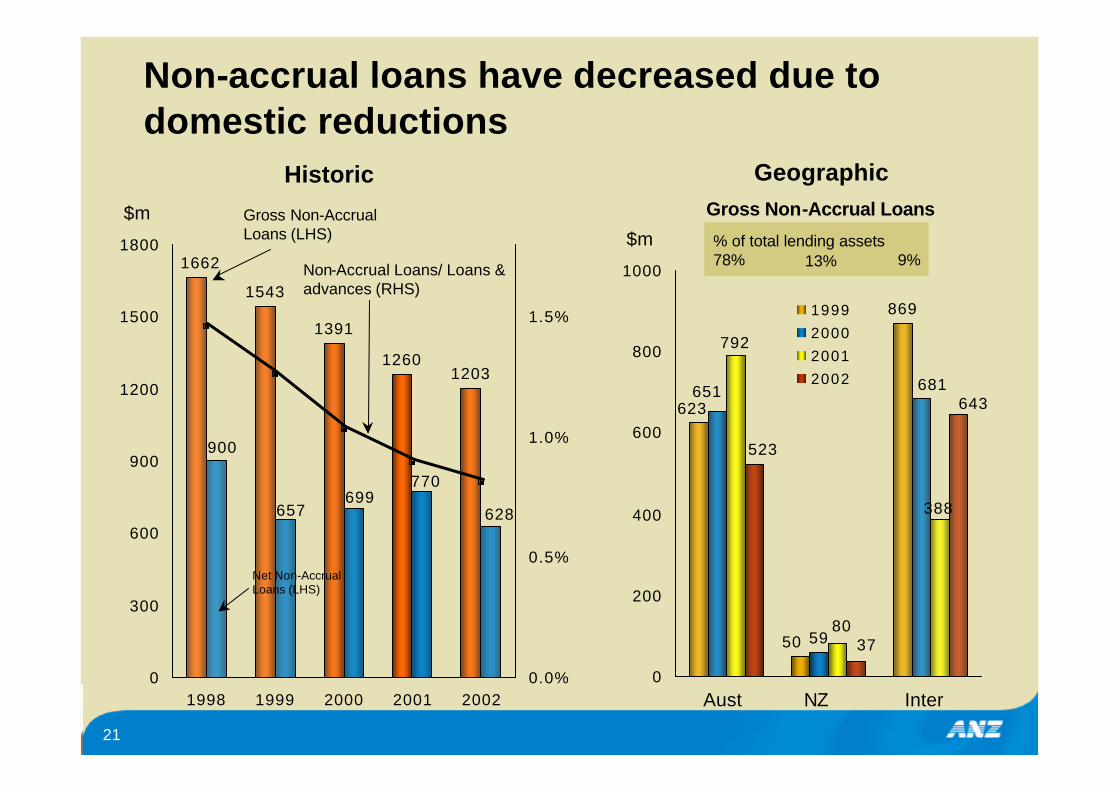
Non-accrual loans have decreased due to domestic reductions
Gross Non-Accrual Loans (LHS)
Net Non-Accrual Loans (LHS)
$m
Non-Accrual Loans/ Loans & advances (RHS)
Historic
Aust InterNZ
GeographicGross Non-Accrual Loans
$m9%78%
% of total lending assets13%

22
Offshore SCCLs now in place
60%
100%
Australia/New Zealand OffShore Corporates
Comparative SCCL Customer Limits
25%
75%
100%
80%
> 100%Security
< 100%Security
Lending type SCCL % for offshore Corporates (excl. GSF)
indicative based on BBB- grading
Direct Exposure(Including on and Off Balance sheet)
Indirect or Contingent Exposure
Market Related
Exposures
Capped at AUD 300m
Capped at AUD 100m
GSF Direct Exposures capped at AUD 450m for > 100% Security and AUD 200m for < 100% Security

23
Overall - provisioning levels strong
0.96
0.82
0.90
1.06
0.70
0.75
0.80
0.85
0.90
0.95
1.00
1.05
1.10
1.15
1.20
ANZSep 02
CBAJun 02
NABSep 02
WBCSep 02
GP/RWA’s%
0
20
40
60
80
100
120
140
160
180
200
ANZ
Austra
liaCan
ada
Germany Fra
nce UK
%Provisions/Non Accrual
Loans
Source: CSFB
24
3.25%
3.75%
4.25%
4.75%
5.25%
5.75%
6.25%
ANZ NAB CBA WBC*
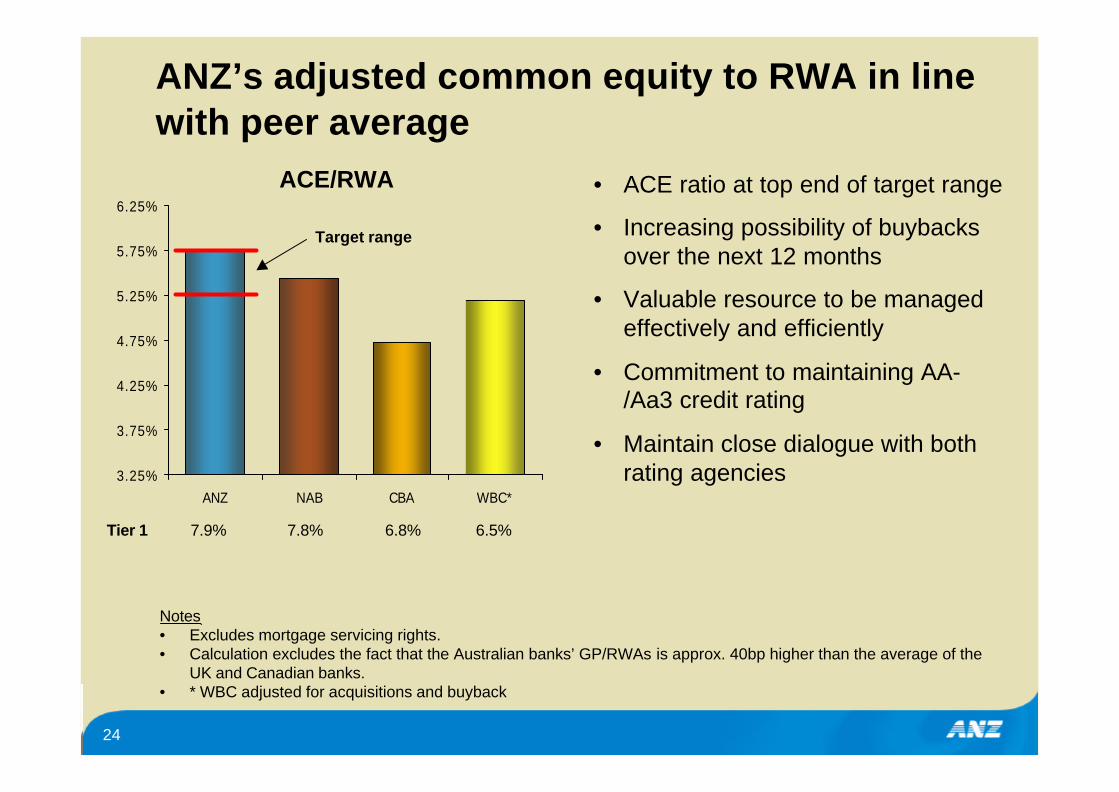
ANZ’s adjusted common equity to RWA in line with peer average
Notes• Excludes mortgage servicing rights.• Calculation excludes the fact that the Australian banks’ GP/RWAs is approx. 40bp higher than the average of the
UK and Canadian banks.• * WBC adjusted for acquisitions and buyback
Target range
• ACE ratio at top end of target range
• Increasing possibility of buybacks over the next 12 months
• Valuable resource to be managed effectively and efficiently
• Commitment to maintaining AA-/Aa3 credit rating
• Maintain close dialogue with both rating agencies
ACE/RWA
Tier 1 7.9% 7.8% 6.8% 6.5%
25
Outline
1. Group Overview
2. Strategy and Business Overview
3. Financial/Operating Performance Overview
4. Term Debt Funding Strategy
5. Summary
6. Supplementary Information

26
Determining the term debt funding requirement
• Importance of stable funding base
• Analysed domestic and offshore peer group
• Businesses required to meet a self funding ratio – CFI (customer to total funding)
• Wholesale funding ratio – TFI (term wholesale funding to term lending)
• Securitisation as a balance sheet tool
Customer Funding Indicator
50%
55%
60%
65%
Sep-2000 Sep-2001 Mar-2002 Jun-2002 Sep-2002
CFI Minimum
Term Funding Indicator
0%
5%
10%
15%
20%
Sep-1996
Sep-1997
Sep-1998
Sep-1999
Sep-2000
Sep-2001
Sep-2002
TFI Minimum
27
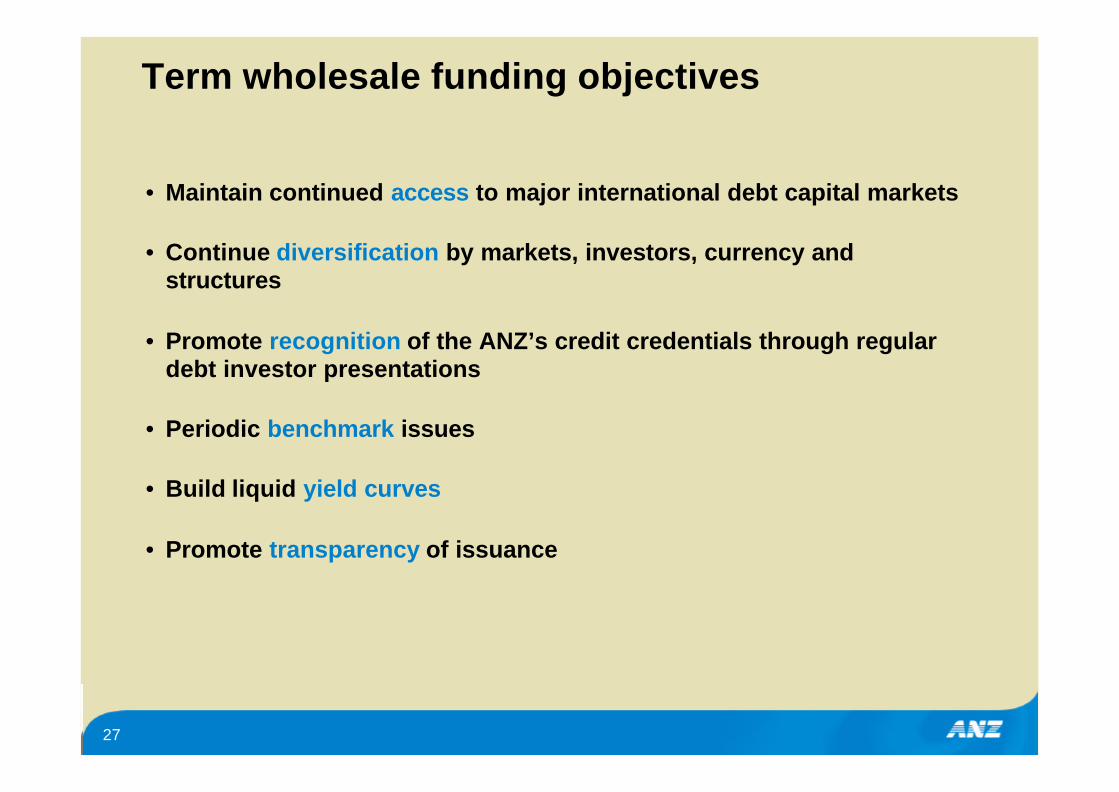
Term wholesale funding objectives
• Maintain continued access to major international debt capital markets
• Continue diversification by markets, investors, currency and structures
• Promote recognition of the ANZ’s credit credentials through regular debt investor presentations
• Periodic benchmark issues
• Build liquid yield curves
• Promote transparency of issuance
28
The strategy to date has worked
• Highest penetration of € investors of any of our domestic peers
• Diverse investor base
• Strong correlation between successfully executed public issuance and reverse enquiries received
• Most proactive of Australian major banks to regularly update domestic and offshore debt investors
• Access during difficult market conditions
• Credit line availability
• Rating agencies focus on liability management
29
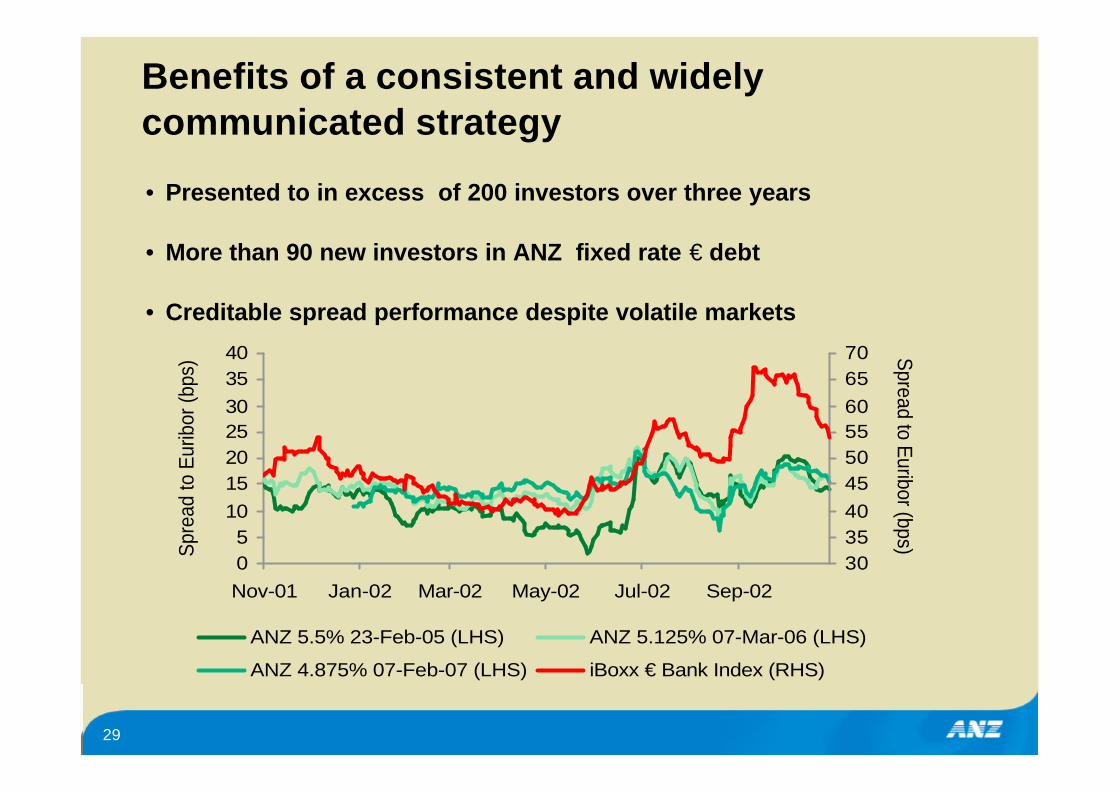
Benefits of a consistent and widely communicated strategy
• Presented to in excess of 200 investors over three years
• More than 90 new investors in ANZ fixed rate € debt
• Creditable spread performance despite volatile markets
05
10152025303540
Nov-01 Jan-02 Mar-02 May-02 Jul-02 Sep-02
Spre
ad to
Eur
ibor
(bps
)
303540455055606570 Spread to Euribor (bps)
ANZ 5.5% 23-Feb-05 (LHS) ANZ 5.125% 07-Mar-06 (LHS)
ANZ 4.875% 07-Feb-07 (LHS) iBoxx € Bank Index (RHS)
30
ANZ’s term funding requirement and strategy for 2003
• A$7 billion term debt funding requirement- subject to global economic activity- predominantly senior debt- will consider subordinated debt- securitisation dependent on maintenance of CFI targets
• A$2 billion raised since 1st October 2002
• Maintain a prudent approach to management of the liability portfolio- avoiding maturity concentration and roll over risk
• Issuance preference for senior debt- one to five year maturities- aim to achieve a weighted average maturity of four years
• Focus on reverse enquiry MTNs- 50/50 mix between private placement and public issuance- willingness to meet investor needs- timely response

31
Achievable, based on previous experienceFinancial Year 2001
0%
10%
20%
30%
40%
50%
60%
70%
80%
90%
100%
AUD USD HKDGBP JPY EUR
Financial Year 2002
0%
10%
20%
30%
40%
50%
60%
70%
80%
90%
100%
AUD USD HKD GBPEUR NOK SGD NZDCAD
Pub
licP
rivat
e
Pub
licP
rivat
e
32
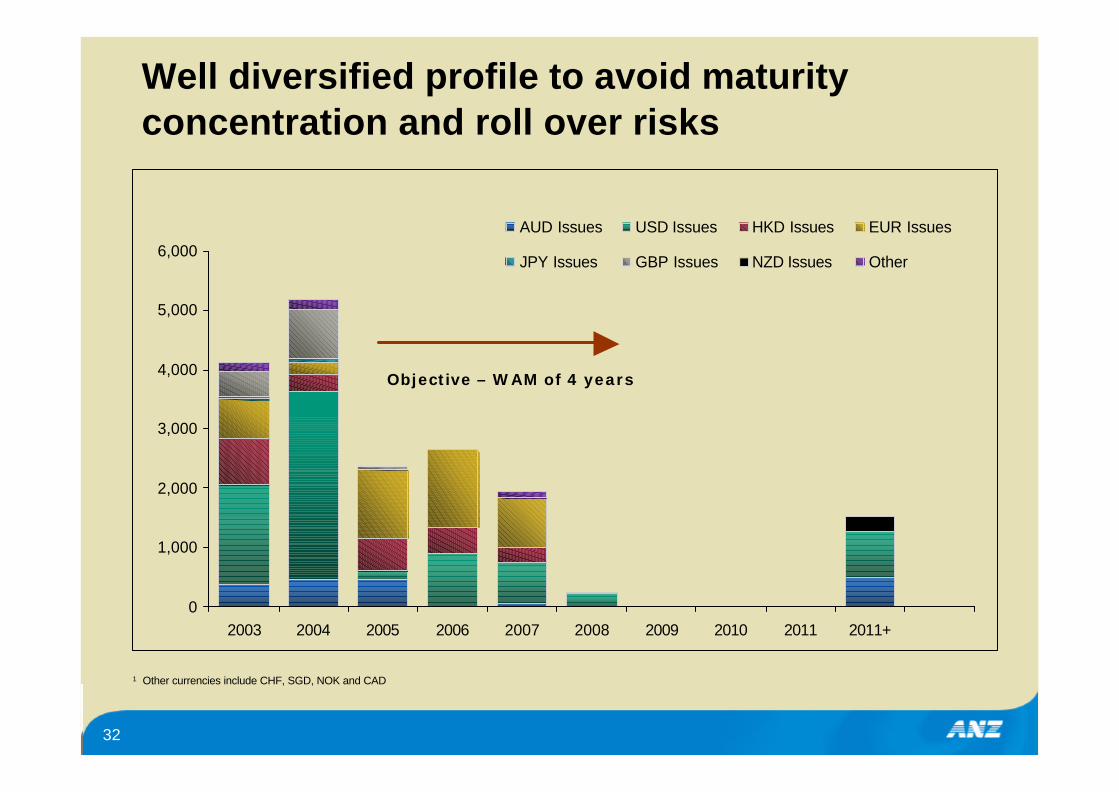
Well diversified profile to avoid maturity concentration and roll over risks
0
1,000
2,000
3,000
4,000
5,000
6,000
2003 2004 2005 2006 2007 2008 2009 2010 2011 2011+
AUD Issues USD Issues HKD Issues EUR Issues
JPY Issues GBP Issues NZD Issues Other
1 Other currencies include CHF, SGD, NOK and CAD
Objective – WAM of 4 years

33
Potential to issue Lower Tier II
• Opportunity to restructure capital composition
• Underweight Lower Tier II relative to domestic peer group
• Amortisation of subordinated debt portfolio under APRA guidelines
• Last issued Lower Tier II in Europe in 1997
Capital ratios
0%
5%
10%
Tier 2 2.78% 4.58% 3.76% 3.72%
Hybrid 0.97% 0.49% 1.08% 0.36%
ACE 5.74% 4.73% 5.37% 4.80%
ANZ CBA NAB WBC
Adjusted Common Equity
3%
4%
5%
6%
ANZ CBA NAB WBC SGB
Average (excl. ANZ)

34
Outline
1. Group Overview
2. Strategy and Business Overview
3. Financial/Operating Performance Overview
4. Term Debt Funding Strategy
5. Summary
6. Supplementary Information
35
Summary
• Solid result in more challenging times, driven by healthy incomegrowth and leading efficiency levels
• Credit quality strong in Australia, but some offshore issues we are dealing with
• Remain well provisioned
• Responsible capital management philosophy
• Leadership in disclosure and transparency
• Commitment to regular and disciplined wholesale term debt issuance
36
The material in this presentation is general background information about the Bank’s activities current at the date of the presentation. It is information given in summary form and does not purport to be complete. It is not intended to be relied upon as advice to investors or potential investors and does not take into account the investment objectives, financial situation or needs of any particular
investor. These should be considered, with or without professional advice when deciding if an investment is appropriate.
For further information visit
www.anz.comor contact
Philip GentryHead of Investor Relations
ph: (613) 9273 4185 fax: (613) 9273 4091 e-mail: [email protected]

37
Outline
1. Group Overview
2. Strategy and Business Overview
3. Financial/Operating Performance Overview
4. Term Debt Funding Strategy
5. Summary
6. Supplementary Information

38
Additional information on strategy
39
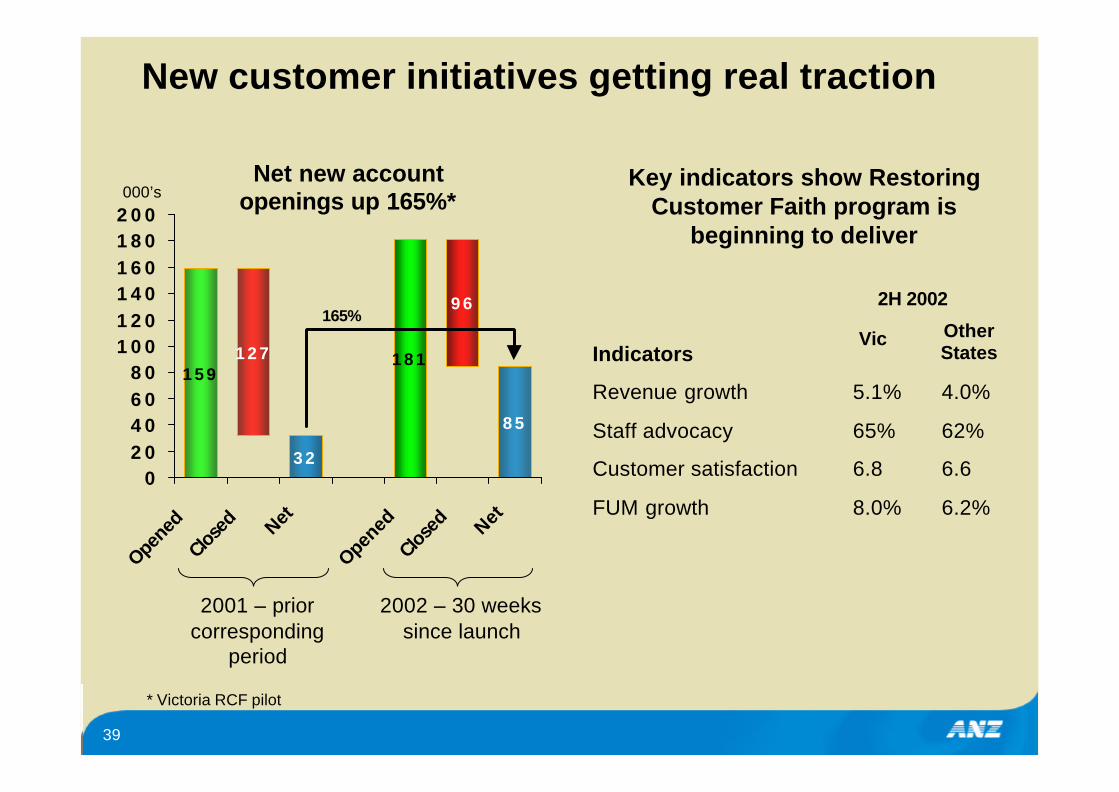
New customer initiatives getting real traction
32
85
127
96
159181
020406080
100120140160180200
Opene
d
Close
d Net
Opene
d
Close
d Net
2001 – prior corresponding
period
2002 – 30 weeks since launch
Net new account openings up 165%*000’s
Indicators
Revenue growth 5.1% 4.0%
Staff advocacy 65% 62%
Customer satisfaction 6.8 6.6
FUM growth 8.0% 6.2%
Vic Other States
2H 2002
Key indicators show Restoring Customer Faith program is
beginning to deliver
165%
* Victoria RCF pilot
40
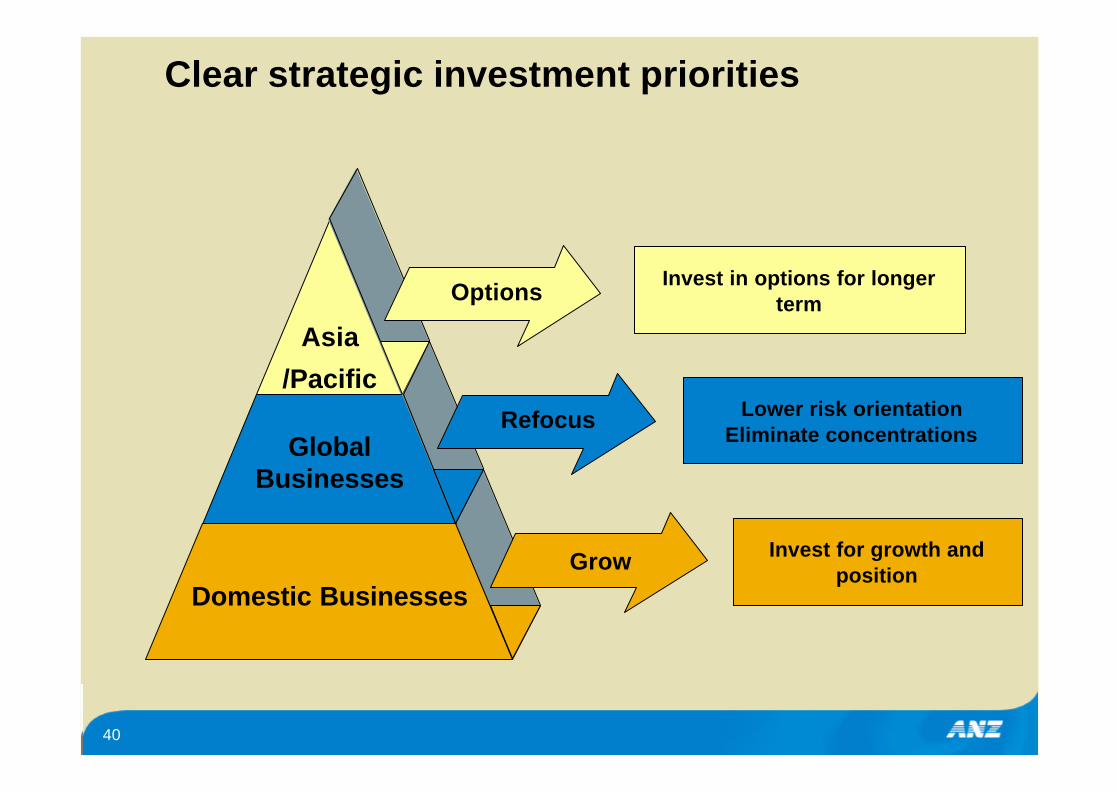
Clear strategic investment priorities
Asia
/Pacific
Global Businesses
Domestic Businesses
Options
Refocus
Invest in options for longer term
Lower risk orientation Eliminate concentrations
Invest for growth and position
Grow

41
0
10
20
30
40
50
ANZ CBA NAB WBC
Consumer portfolio – significant opportunity for ANZ in domestic markets
Share of Customers*
Wallet Share*
Priorities
• Deliver on promise of Restoring Customer Faith
• Improve community perceptions
• Deliver on ING ANZ JV
• Continue product innovation
• Utilise CRM capabilities
• Target market share growth of 1% pa in key markets
0
10
20
30
40
50
60
ANZ CBA NAB WBC
%
%
* source: Roy Morgan Research
42
-10
-5
0
5
10
15
1990
1992
1994
1996
1998
2000
2002
2004
2006
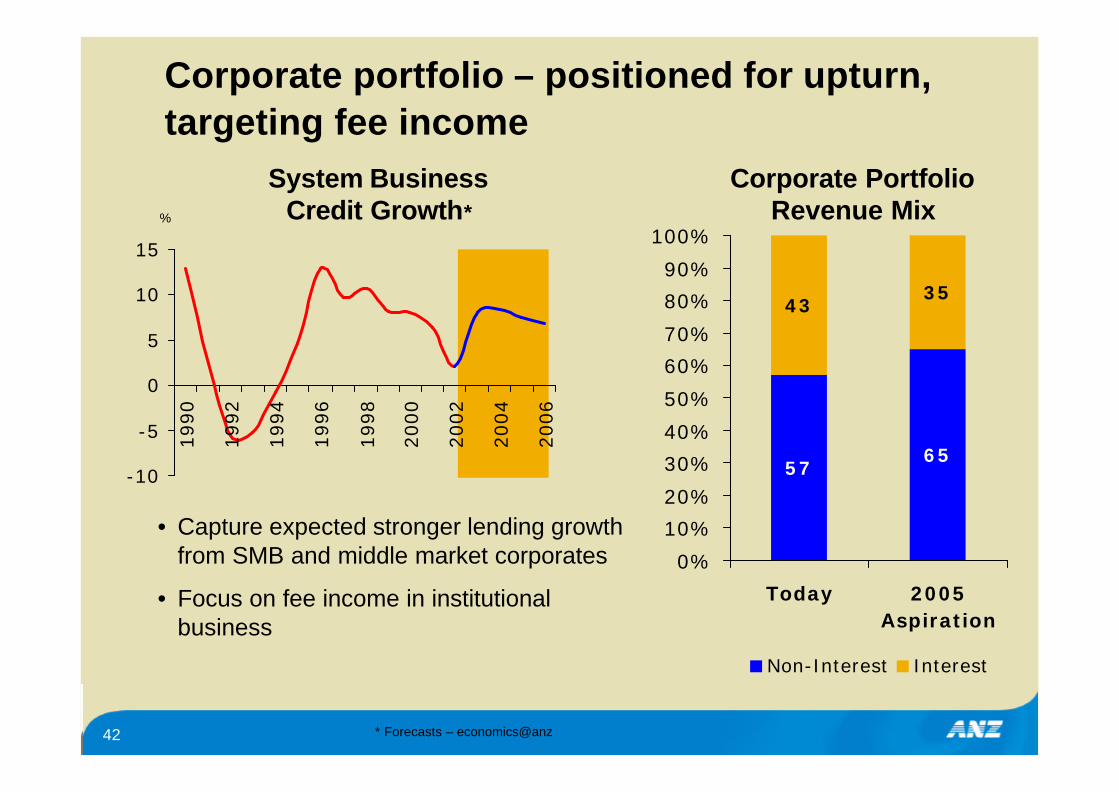
Corporate portfolio – positioned for upturn, targeting fee income
System Business Credit Growth*
5765
4335
0%
10%
20%
30%
40%
50%
60%
70%
80%
90%
100%
Today 2005Aspiration
Non-Interest Interest
Corporate Portfolio Revenue Mix
• Capture expected stronger lending growth from SMB and middle market corporates
• Focus on fee income in institutional business
%
* Forecasts – economics@anz
43
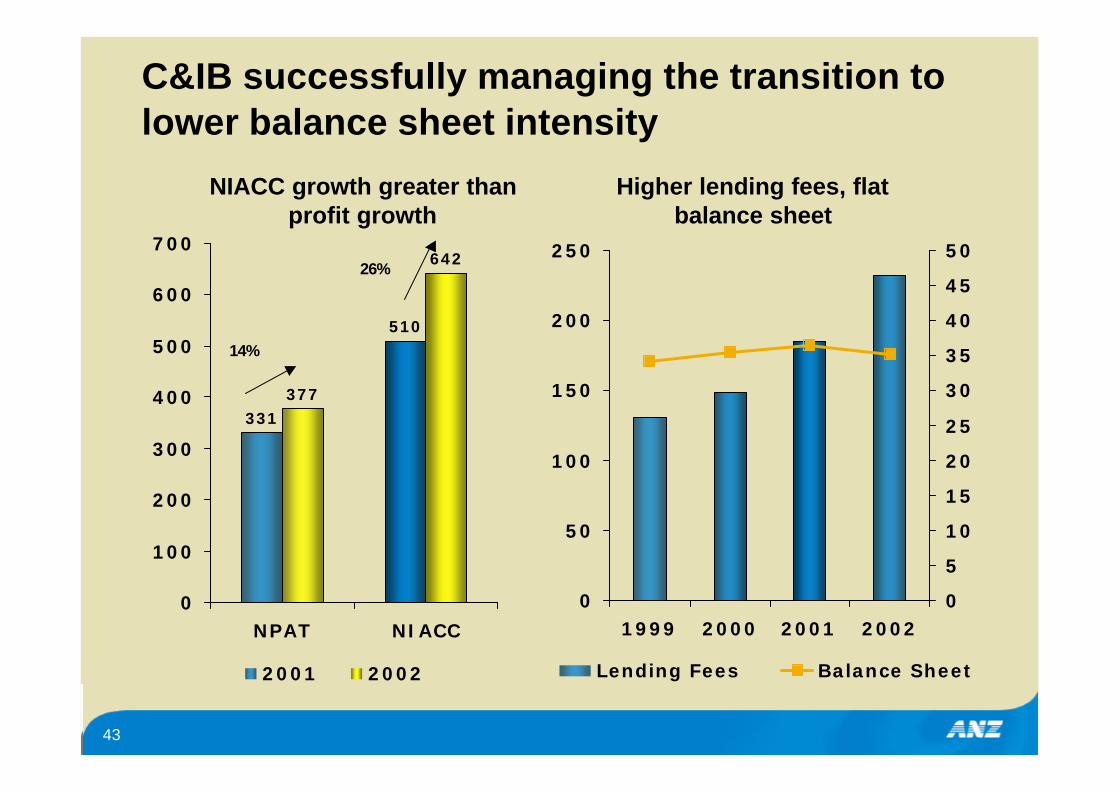
C&IB successfully managing the transition to lower balance sheet intensity
331
510
377
642
0
100
200
300
400
500
600
700
NPAT NIACC
2001 2002
14%
26%
0
50
100
150
200
250
1999 2000 2001 20020
5
10
15
20
25
30
35
40
45
50
Lending Fees Balance Sheet
Higher lending fees, flat balance sheet
NIACC growth greater than profit growth
44
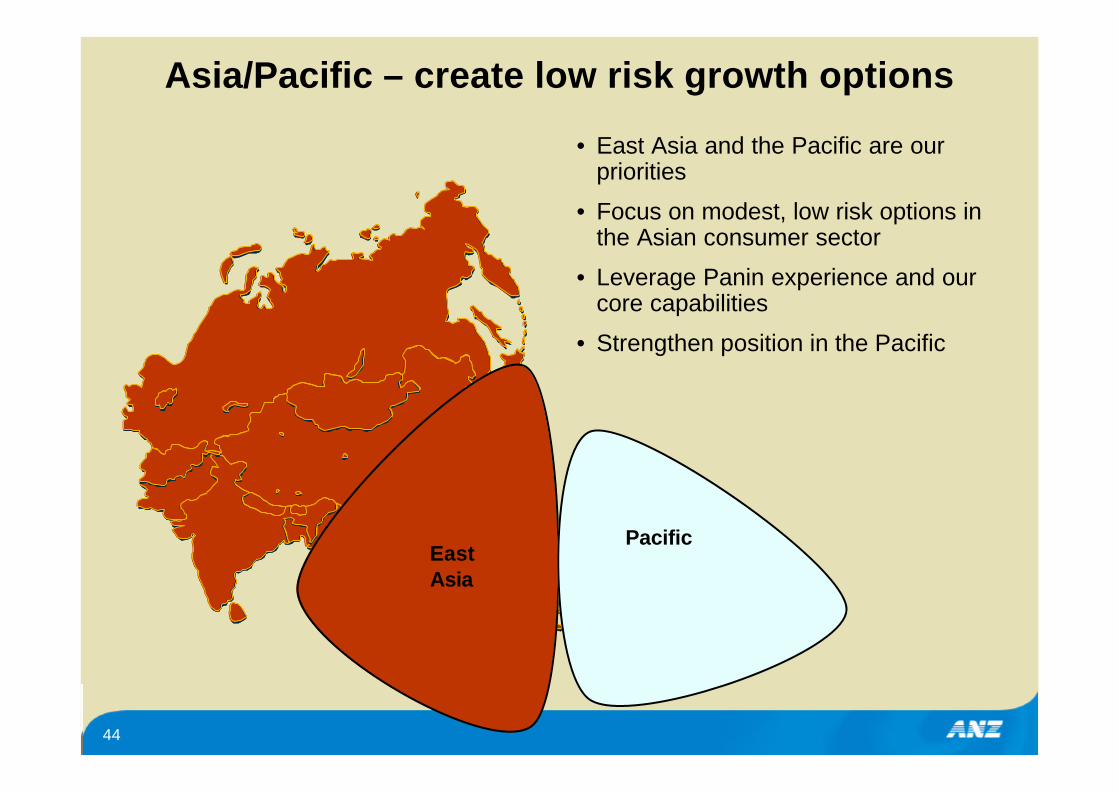
Asia/Pacific – create low risk growth options
• East Asia and the Pacific are our priorities
• Focus on modest, low risk options in the Asian consumer sector
• Leverage Panin experience and our core capabilities
• Strengthen position in the Pacific
PacificEast Asia
45
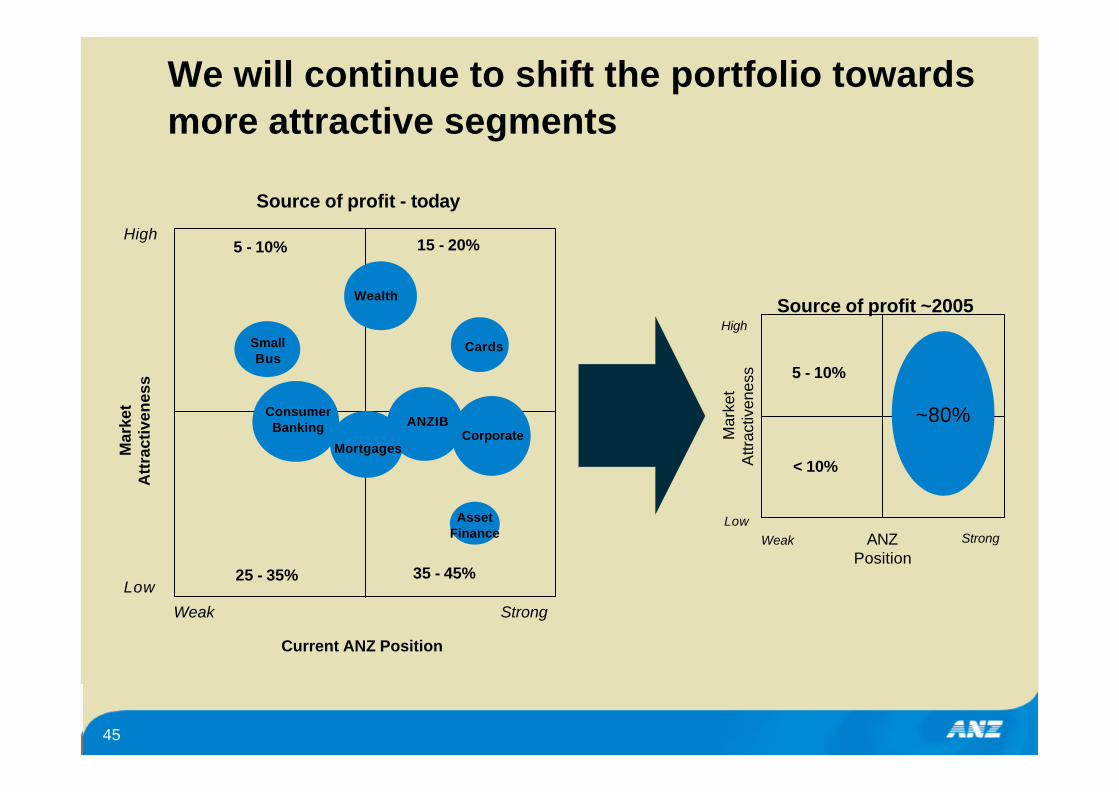
We will continue to shift the portfolio towards more attractive segments
Weak Strong
Low
High
Mar
ket
Att
ract
iven
ess
Current ANZ Position
Wealth
Cards
ConsumerBanking
SmallBus
ANZIBCorporate
AssetFinance
Mortgages
15 - 20%
35 - 45%25 - 35%
5 - 10%
Source of profit - today
< 10%
5 - 10%
Source of profit ~2005
~80%
ANZPosition
High
LowWeak Strong
Mar
ket
Attr
activ
enes
s
46
Additional information on results
47
0 200 400 600 800
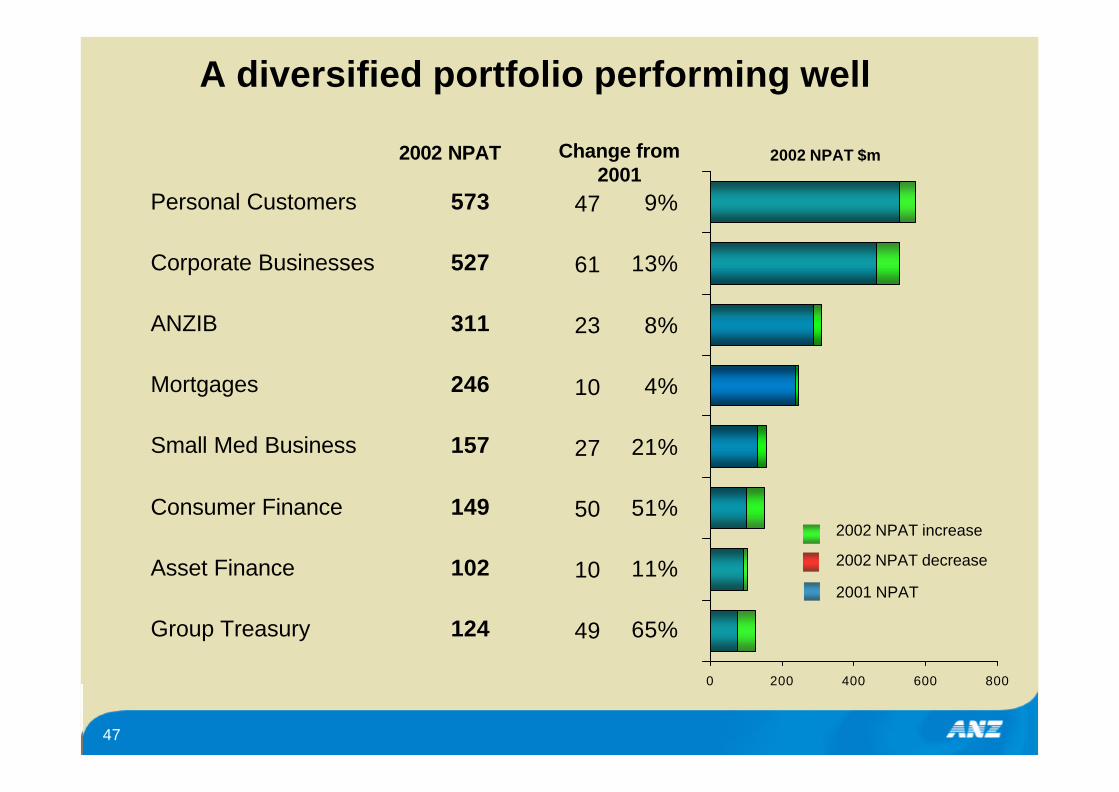
A diversified portfolio performing well
Personal Customers
Corporate Businesses
ANZIB
Mortgages
Small Med Business
Consumer Finance
Asset Finance
Group Treasury
47
61
23
10
27
50
10
49
573
527
311
246
157
149
102
124
9%
13%
8%
4%
21%
51%
11%
65%
2002 NPAT Change from 2001
2002 NPAT $m
2002 NPAT increase
2002 NPAT decrease
2001 NPAT
48
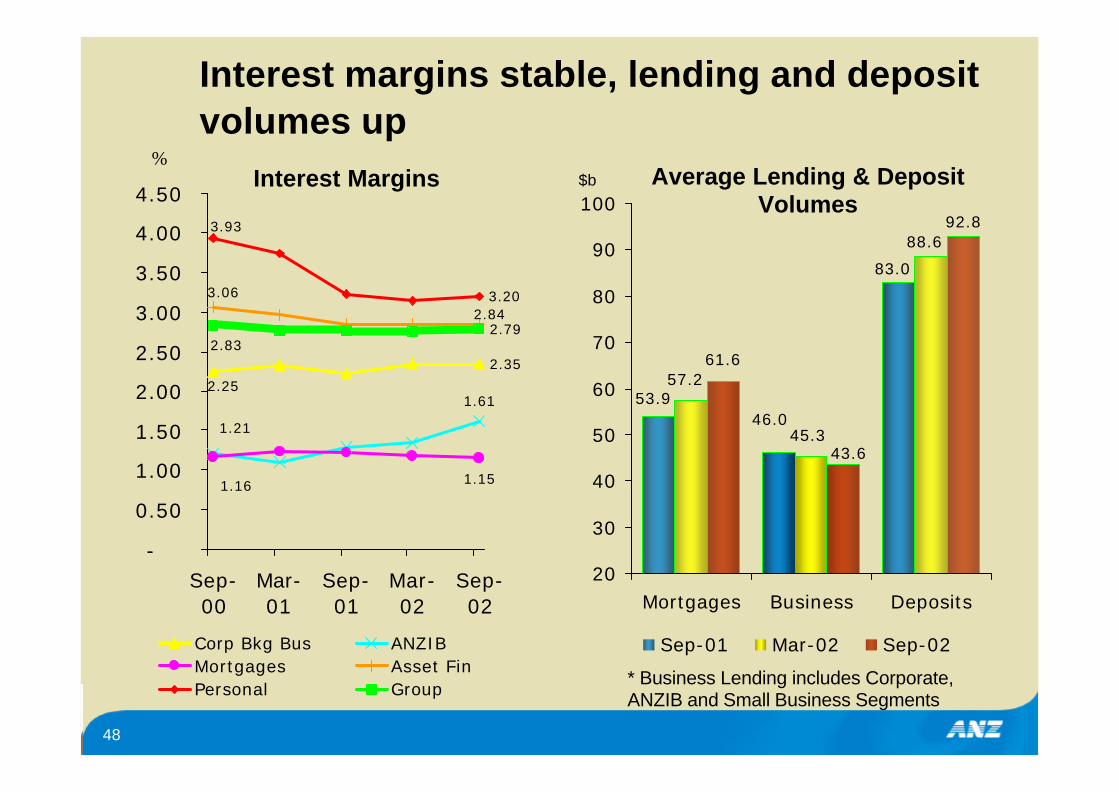
2.35
1.61
1.15
3.20
2.79
2.25
1.21
1.16
2.84
3.06
3.93
2.83
-
0.50
1.00
1.50
2.00
2.50
3.00
3.50
4.00
4.50
Sep-00
Mar-01
Sep-01
Mar-02
Sep-02
Corp Bkg Bus ANZIBMortgages Asset FinPersonal Group
Interest margins stable, lending and deposit volumes up
%Interest Margins
92.8
53.9
83.0
46.0
57.2
88.6
45.3
61.6
43.6
20
30
40
50
60
70
80
90
100
Mortgages Business Deposits
Sep-01 Mar-02 Sep-02
Average Lending & Deposit Volumes
$b
* Business Lending includes Corporate, ANZIB and Small Business Segments

49
1000
1200
1400
1600
1800
2000
2200Sep
-97
Mar
-98
Sep
-98
Mar
-99
Sep
-99
Mar
-00
Sep
-00
Mar
-01
Sep
-01
Mar
-02
Sep
-02
40
45
50
55
60
65
70
ExpensesCost Income RatioPeer Average CTI*
Cost income ratio on track to meet target of 45
$m CTI (%)
45.5
• Peer average impacted by funds management acquisitions
• $31m expense reduction from sold businesses
• Effective half on half cost growth of 1.8%
• We will invest more in growth areas, particularly personal businesses
• 2000 $361m restructuring provision fully utilised, ongoing $60m+ charge likely
* Source: CSFB

50
0.00%
0.20%
0.40%
0.60%
0.80%
1.00%
1.20%
1.40%
1.60%
1.80%
1H 01 2H 01 1H 02 2H 02
We will continue to carefully manage cost growth relative to revenue growth
Underlying cost growth trending upward • Balancing earnings
outcomes with investment in growth
• “Surplus” earnings targeted for investment
• Cost-income ratio to trend downward
+
• Higher amortisation and depreciation
• Increasing growth investment

51
Underlying expense growth of 2.3%
3153
3081
3092
20
72
31
3000
3020
3040
3060
3080
3100
3120
3140
31602001
ING
AN
Z J
V
Acq
uis
itio
ns
& F
X I
mpact
Adju
sted
Under
lyin
gG
row
th
2002 A
dj
2.3%
$m
• Computer expenses increased by 16%, reflecting:
• depreciation and amortisation charges up 30%
• software purchases up 28%
2%
52
0
20
40
60
80
100
120
1H00 2H00 1H01 2H01 1H02 2H02 1H03 (F) 2H03 (F) 1H04 (F) 2H04 (F)0
100
200
300
400
500
Amortisation (LHS) Capitalisation (LHS) Balance (RHS)
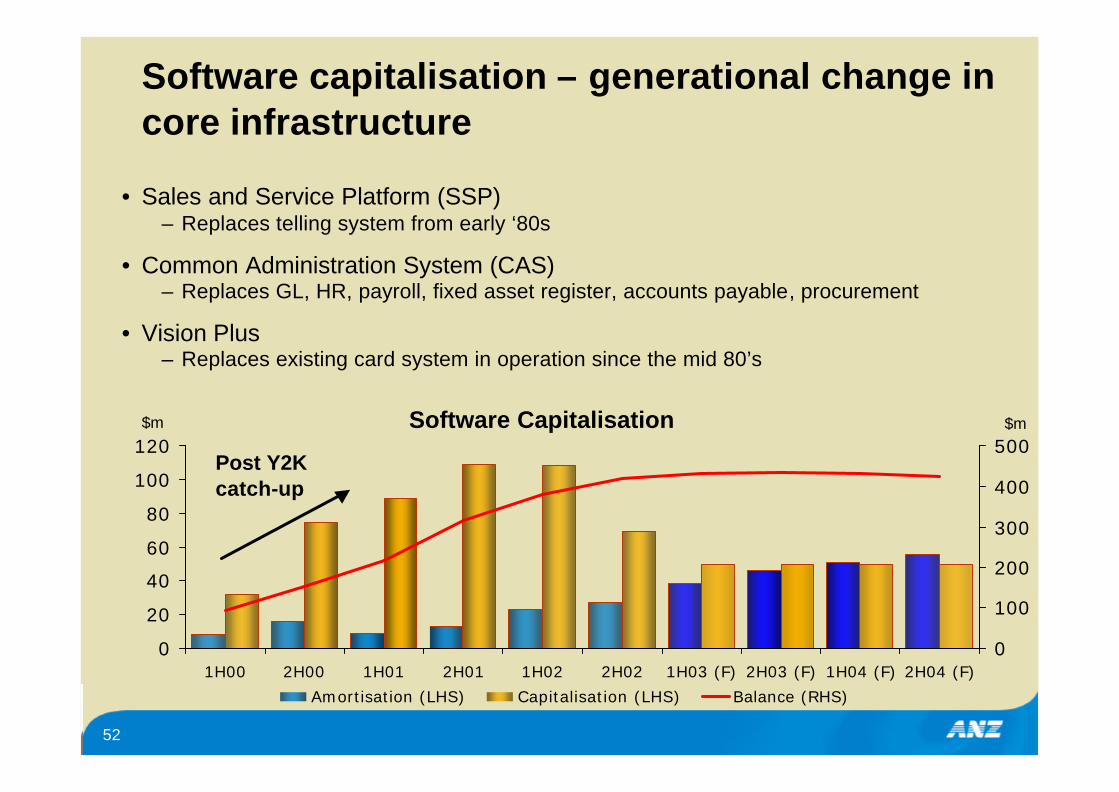
Software capitalisation – generational change in core infrastructure
• Sales and Service Platform (SSP)– Replaces telling system from early ‘80s
• Common Administration System (CAS)– Replaces GL, HR, payroll, fixed asset register, accounts payable, procurement
• Vision Plus – Replaces existing card system in operation since the mid 80’s
$m $mSoftware Capitalisation
Post Y2K catch-up
53
Additional credit quality information
54
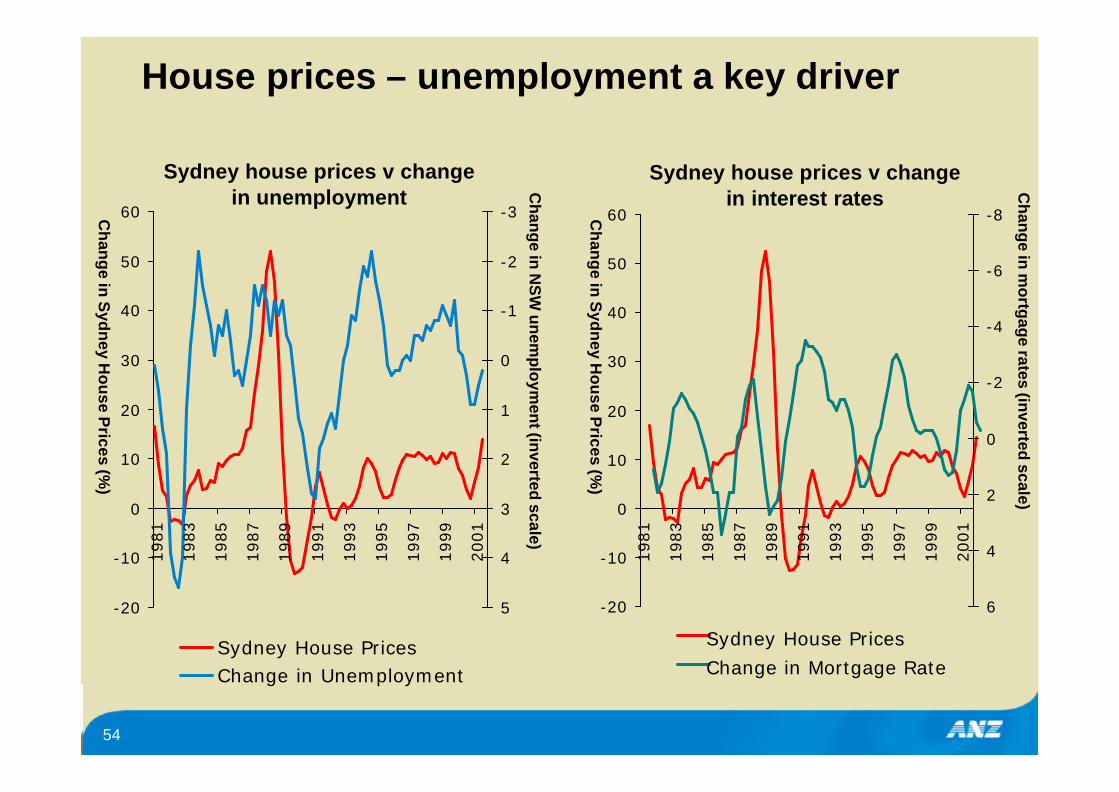
House prices – unemployment a key driver
-20
-10
0
10
20
30
40
50
60
1981
1983
1985
1987
1989
1991
1993
1995
1997
1999
2001
-3
-2
-1
0
1
2
3
4
5
Sydney House PricesChange in Unemployment
-20
-10
0
10
20
30
40
50
60
1981
1983
1985
1987
1989
1991
1993
1995
1997
1999
2001
-8
-6
-4
-2
0
2
4
6
Sydney House Prices
Change in Mortgage Rate
Sydney house prices v change in unemployment
Sydney house prices v change in interest rates
Ch
ang
e in S
ydn
ey Ho
use P
rices (%)
Ch
ang
e in S
ydn
ey Ho
use P
rices (%)
Ch
ang
e in N
SW
un
emp
loym
ent (in
verted scale)
Ch
ang
e in m
ortg
age rates (in
verted scale)
55
4
6
8
10
12
14
16
18
90 92 94 96 98 00 02 044
5
6
7
8
9
10
11
12
90 92 94 96 98 00 02 04
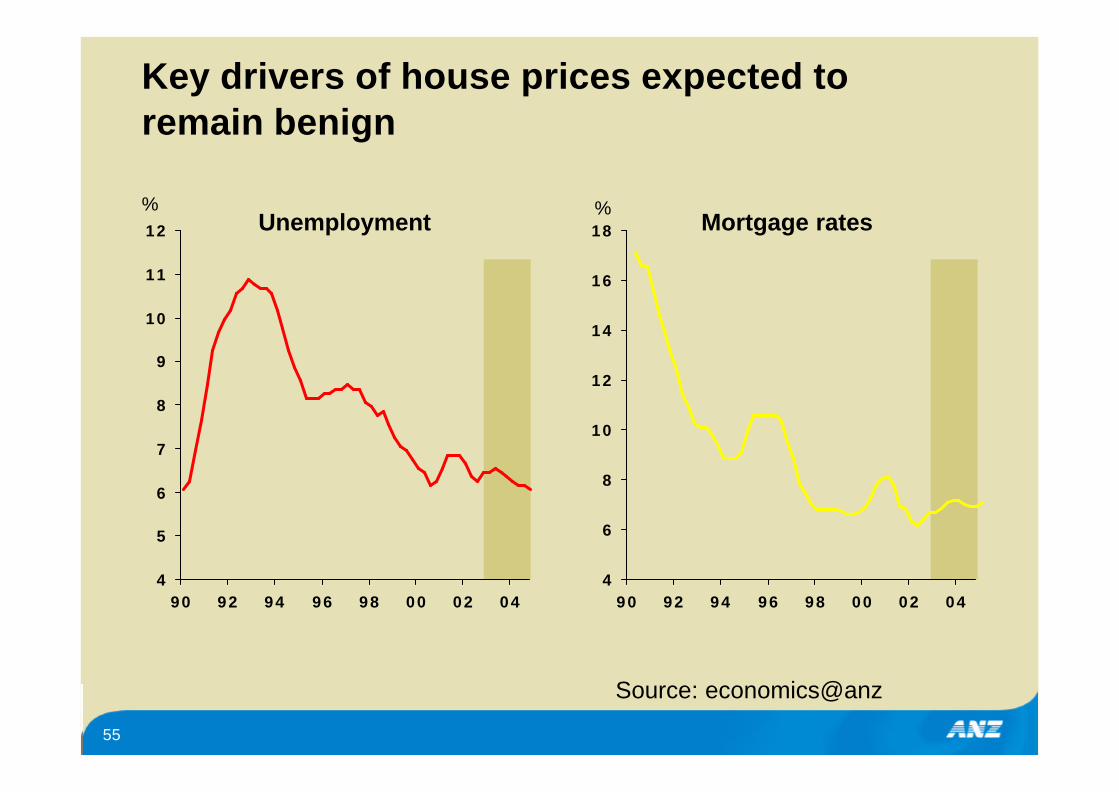
Key drivers of house prices expected to remain benign
Unemployment Mortgage rates% %
Source: economics@anz
56
0 50 100 150
ConsumerFinance
CBB
Asset Finance
GSF
Personal
Mortgages
SME
CF&A
GFX
0
50
100
150
200
250
300
350
400
GFX
CF&A SM
E
Mortg
ages
Perso
nal B
ankin
g GSF
Asset F
inance CB
B CF
SPELP
0
20
40
60
80
100
120
140
160
180
GFX
CF&A SM
E
Mortg
ages
Perso
nal B
ankin
g GSF
Asset Fina
nce CB
B CF
SP
ELP
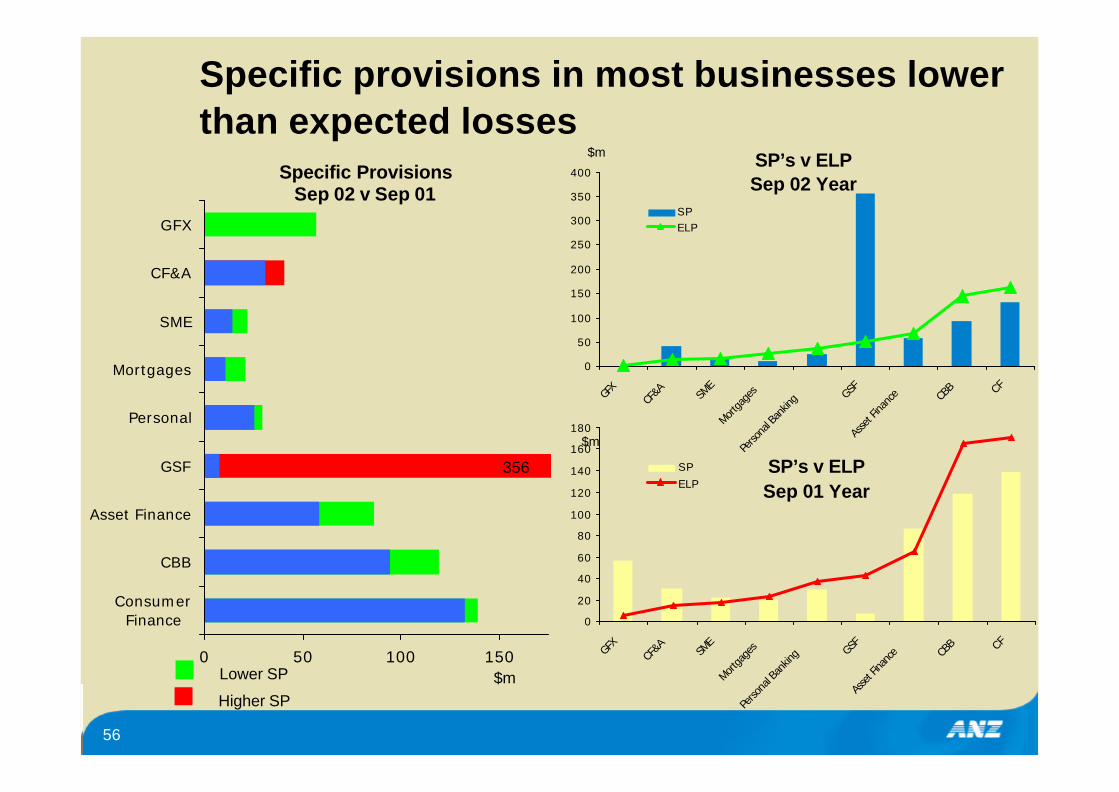
Specific provisions in most businesses lower than expected losses
SP’s v ELPSep 02 Year
SP’s v ELPSep 01 Year
$m
$m
Specific Provisions Sep 02 v Sep 01
$mLower SP
Higher SP
356
57
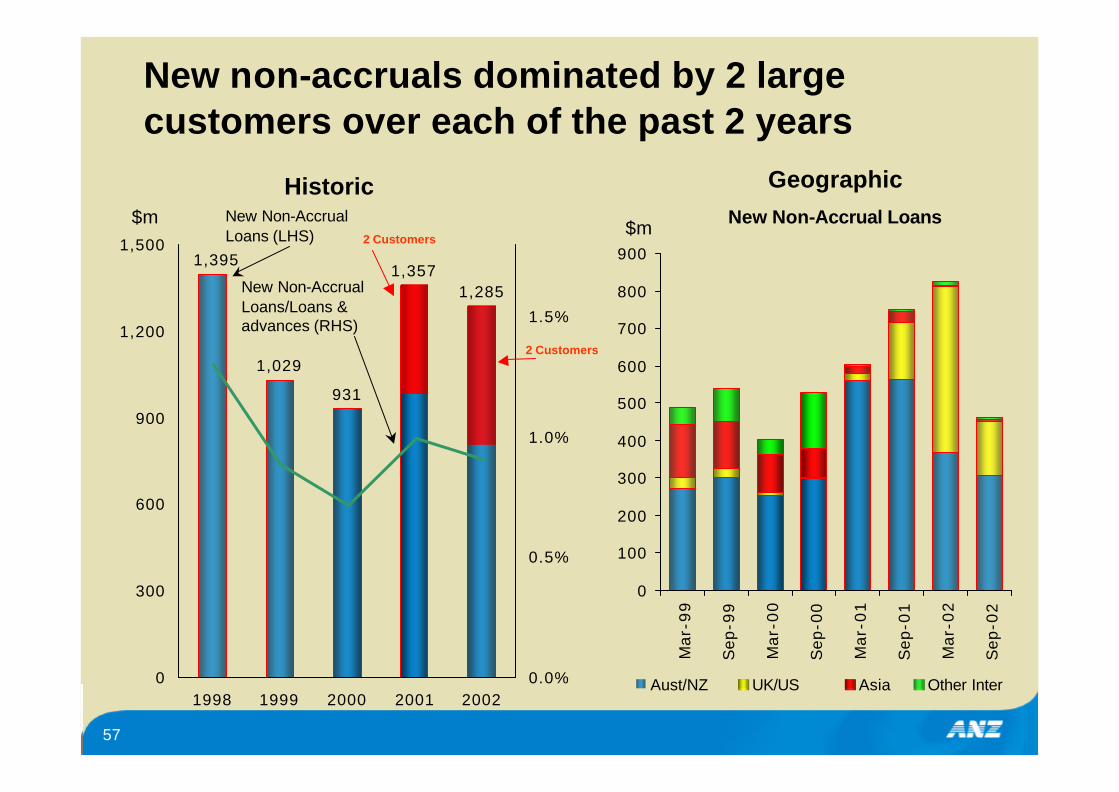
New non-accruals dominated by 2 large customers over each of the past 2 years
GeographicNew Non-Accrual Loans$m
1,029
931
1,3571,285
1,395
0
300
600
900
1,200
1,500
1998 1999 2000 2001 20020.0%
0.5%
1.0%
1.5%
HistoricNew Non-Accrual Loans (LHS)
New Non-Accrual Loans/Loans & advances (RHS)
2 Customers
2 Customers
0
100
200
300
400
500
600
700
800
900
Mar
-99
Sep
-99
Mar
-00
Sep
-00
Mar
-01
Sep
-01
Mar
-02
Sep
-02
Aust/NZ UK/US Asia Other Inter
$m

58
Fallen Angels phenomenon continues
March 2001 ratings for Full Year 2002 new non accrual loans
• Speed of collapse difficult to model
• We continue to diversify the portfolio
• SCCL’s further reduced and refined
B4%
BB1%
CCC9%
BBB + to BBB-86%

59
6.7%0.8%
8.7%
21.2%
62.6%
Sep-02
Global telecommunications portfolio in reasonable shape
50%
12%
35%
3%
Aust/NZ (97.6% Investment Grade)
Americas (69.3% Investment Grade)
UK/Europe (71.1% Investment Grade)
Asia (34.5% Investment Grade)
Exposure by geography
83.8% investment grade
Telco Risk Grade Profile*
4.8% $0.3bNon Accrual
1.9% $0.1bB+ to CCC
$5.5bTotal Limits (AUD)
AAA to BBB+
BBB to BBB-
BB+ to BBBB->BB-
>BB- = B+ B, B-, CCC & non-accrual*Risk grade profile by limits
$3.4b
$1.2b
$0.5b
$0.4b
49
4
3
# of customers

60
8%1%
24%
21%
46%
Sep-02
Global energy portfolio – some issues, but containable
Global Energy Portfolio*
AAA to BBB+
BBB to BBB-
BB+ to BB
BB-
>BB-16%
36%
16%
32%
Sep-02
US Energy Portfolio
>BB- = B+ B, B-, CCC & non-accrual
(AUDm)Total Limits $9.6bn $2.2bnB+ to CCC 4.8% $0.46b 12.2% $0.27bNon Accrual 3.2% $0.3b 4.0% $0.09b
Exposure by geography
53%
25%
9%
9%4%
Aust/NZ (77.5% Inv Grade)
Americas (43.5% Inv Grade)
UK/Europe (64.6% Inv Grade)
Asia (61.0% Inv Grade)
Middle East (98.0% Inv Grade)
$4.5b
$2.0b
$2.3b
$0.8b
*Risk grade profile by limits
$0.7b
$0.36b
$0.8b
$0.36b
7812
5
# of customers
265
2
# of customers
61
40%
50%
60%
70%
80%
90%
100%
110%
120%
130%
140%
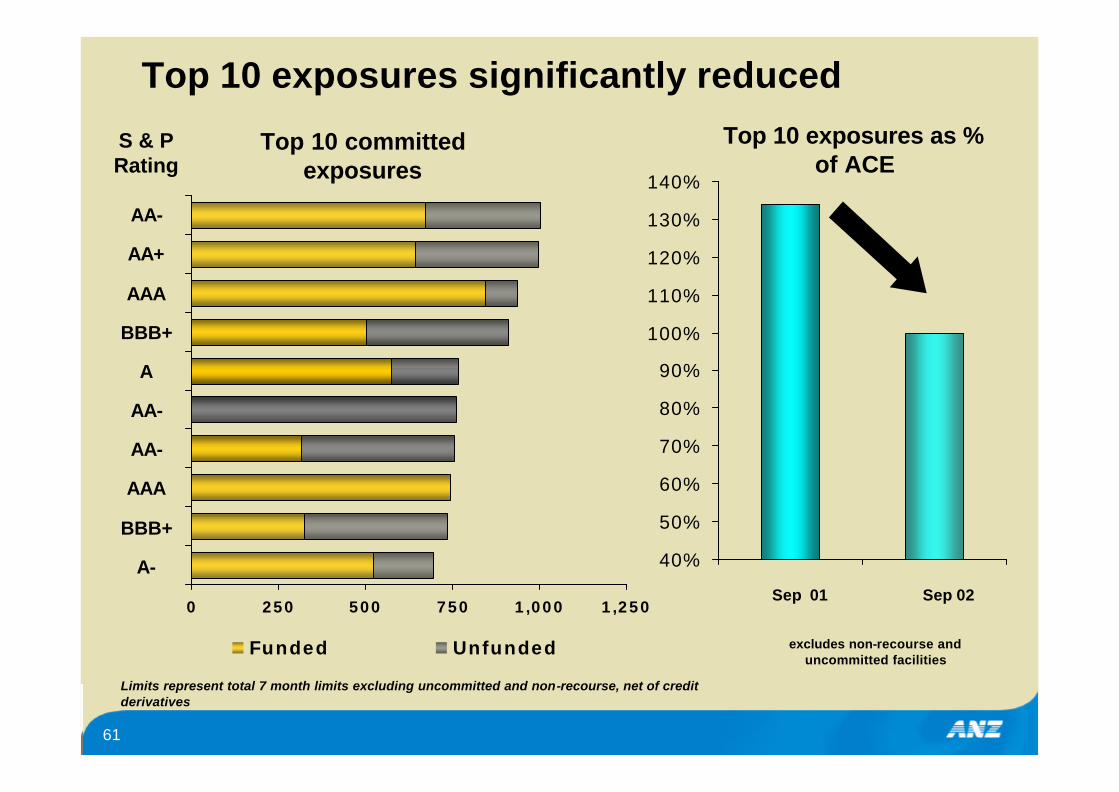
Top 10 exposures significantly reduced
Top 10 committed exposures
Top 10 exposures as % of ACE
Sep 01 Sep 02
Limits represent total 7 month limits excluding uncommitted and non-recourse, net of credit derivatives
excludes non-recourse and uncommitted facilities
0 250 500 750 1,000 1,250
Funded Unfunded
S & P Rating
AA-
AA+
AAA
BBB+
A
AA-
AA-
AAA
BBB+
A-
62
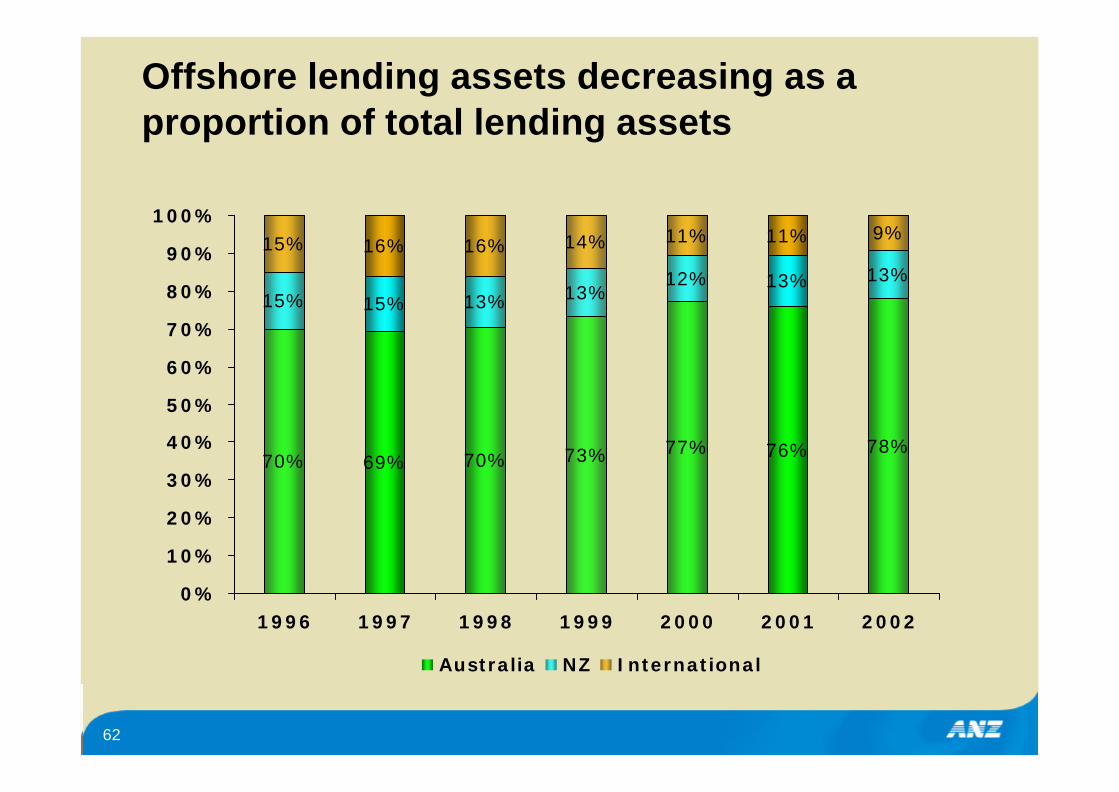
Offshore lending assets decreasing as a proportion of total lending assets
70% 69% 70% 73% 77% 76% 78%
15% 15% 13% 13%12% 13% 13%
15% 16% 16% 14% 11% 11% 9%
0%
10%
20%
30%
40%
50%
60%
70%
80%
90%
100%
1996 1997 1998 1999 2000 2001 2002
Australia NZ International

63
Increased industry diversification
0.0%
2.0%
4.0%
6.0%
8.0%
10.0%
12.0%
14.0%
16.0%
18.0%
Co
mm
erc
ial
Pro
pert
y
Man
ufa
ctu
rin
g
Reta
il T
rad
e
Fin
an
ce -
Ban
ks
Wh
ole
sale
Tra
de
Ag
ricu
ltu
re
Bu
sin
ess
Serv
ices
Fin
an
ce -
Oth
er
Cu
ltu
ral
& R
ec
serv
ices
Acc
om
m,
Pu
bs,
Clu
bs
Tra
nsp
ort
&S
tora
ge
Oth
er
1993 2002
% of Group Lending Assets(Aust/NZ)
Policy Cap

64
Industry exposures – Australia & NZ
0.0bn
0.5bn
1.0bn
1.5bn
2.0bn
Sep-99 Sep-00 Sep-01 Sep-020.0%
0.5%
1.0%
1.5%
2.0%
2.5%
3.0%
3.5%
4.0%
0.0bn
0.5bn
1.0bn
1.5bn
2.0bn
Sep-99 Sep-00 Sep-01 Sep-020.0%
2.0%
4.0%
6.0%
8.0%
10.0%
12.0%
14.0%
0.0bn
0.2bn
0.4bn
0.6bn
0.8bn
1.0bn
Sep-99 Sep-00 Sep-01 Sep-020.0%
0.5%
1.0%
1.5%
2.0%
2.5%
3.0%
3.5%
4.0%
0.0bn
0.2bn
0.4bn
0.6bn
0.8bn
1.0bn
Sep-99 Sep-00 Sep-01 Sep-020.0%
1.0%
2.0%
3.0%
4.0%
5.0%
6.0%
0.0bn
0.5bn
1.0bn
1.5bn
2.0bn
2.5bn
3.0bn
Sep-99 Sep-00 Sep-01 Sep-020.0%
5.0%
10.0%
15.0%
Health & Community Services
Mining
Cultural & Recreational Services
Personal & Other Services
Forestry & Fishing
Communication Services
0.0bn
0.2bn
0.4bn
0.6bn
0.8bn
1.0bn
Sep-99 Sep-00 Sep-01 Sep-020.0%1.0%2.0%3.0%4.0%5.0%6.0%7.0%8.0%9.0%10.0%
Lending Assets (AUDm)% of Portfolio (RHS scale)% in CCR 7D-8G (RHS scale)% in CCR 9-10 (RHS scale)x
65
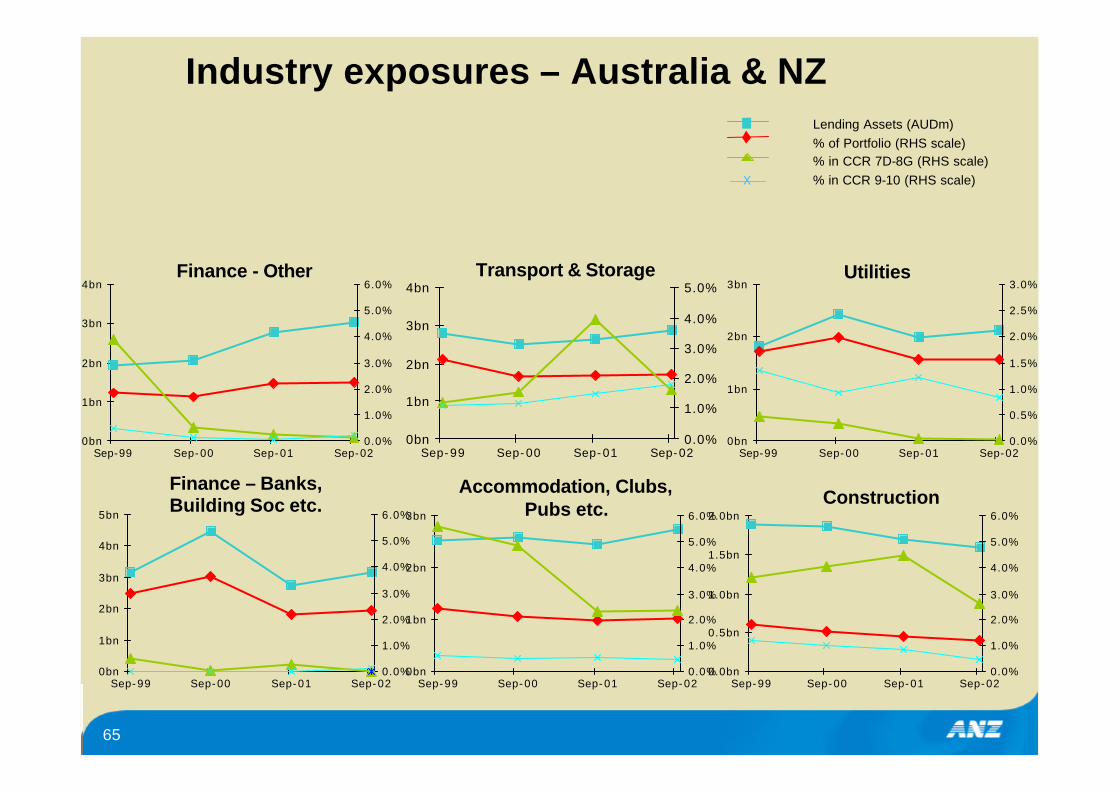
Industry exposures – Australia & NZ
0bn
1bn
2bn
3bn
4bn
Sep-99 Sep-00 Sep-01 Sep-020.0%
1.0%
2.0%
3.0%
4.0%
5.0%
6.0%
0bn
1bn
2bn
3bn
4bn
5bn
Sep-99 Sep-00 Sep-01 Sep-020.0%
1.0%
2.0%
3.0%
4.0%
5.0%
6.0%
Finance - Other
Finance – Banks, Building Soc etc.
0bn
1bn
2bn
3bn
4bn
Sep-99 Sep-00 Sep-01 Sep-020.0%
1.0%
2.0%
3.0%
4.0%
5.0%
0bn
1bn
2bn
3bn
Sep-99 Sep-00 Sep-01 Sep-020.0%
1.0%
2.0%
3.0%
4.0%
5.0%
6.0%
Transport & Storage
Accommodation, Clubs, Pubs etc.
0bn
1bn
2bn
3bn
Sep-99 Sep-00 Sep-01 Sep-020.0%
0.5%
1.0%
1.5%
2.0%
2.5%
3.0%
0.0bn
0.5bn
1.0bn
1.5bn
2.0bn
Sep-99 Sep-00 Sep-01 Sep-020.0%
1.0%
2.0%
3.0%
4.0%
5.0%
6.0%
Utilities
Construction
Lending Assets (AUDm)% of Portfolio (RHS scale)% in CCR 7D-8G (RHS scale)% in CCR 9-10 (RHS scale)x

66
Industry exposures – Australia & NZ
0bn
2bn
4bn
6bn
8bn
10bn
12bn
Sep-99 Sep-00 Sep-01 Sep-020.0%
2.0%
4.0%
6.0%
8.0%
10.0%
12.0%
0bn
2bn
4bn
6bn
8bn
10bn
Sep-99 Sep-00 Sep-01 Sep-020.0%
2.0%
4.0%
6.0%
8.0%
10.0%
12.0%
Real Estate Operators & Dev.
Manufacturing
0bn
2bn
4bn
6bn
Sep-99 Sep-00 Sep-01 Sep-020.0%
1.0%
2.0%
3.0%
4.0%
5.0%
6.0%
0bn
2bn
4bn
6bn
Sep-99 Sep-00 Sep-01 Sep-020.0%
1.0%
2.0%
3.0%
4.0%
5.0%
6.0%
Retail Trade
Wholesale Trade
0bn
1bn
2bn
3bn
4bn
Sep-99 Sep-00 Sep-01 Sep-020.0%
1.0%
2.0%
3.0%
4.0%
5.0%
6.0%
0bn
1bn
2bn
3bn
4bn
Sep-99 Sep-00 Sep-01 Sep-020.0%
1.0%
2.0%
3.0%
4.0%
5.0%
6.0%
Agriculture
Business Services
Lending Assets (AUDm)% of Portfolio (RHS scale)% in CCR 7D-8G (RHS scale)% in CCR 9-10 (RHS scale)x