Embed Size (px)
Citation preview
2000 Interim Results
Australia and New Zealand Banking Group Limited
1 May 2000

Double-digit earnings growth 14%. EPS 10%
Increase ROE towards 20% 17.8% (17.3%)
53% cost income ratio 51.4% Costs flat
Reduce risk Matches peers ex Grindlays
Achieve an optimal capital structure $500m buyback completed $1bn buyback announced
ANZ Delivers on Financial Commitments

Financial Performance
60
80
100
120
1997 1998 1999 Mar-00
0
2
4
6
8
10
1997 1998 1999 Mar-00
EPS Tier 1 Ratio
5
10
15
20
1997 1998 1999 Mar-00
ROE
0
5
10
15
20
25
30
35
40
1998 1999 Mar-00 ProForma
Lending Mix
50
55
60
65
70
1997 1998 1999 Mar-00
Cost Income Ratio%
WBC
CBAANZNAB
%
Emerging Markets
Mortgages
¢
%
%

17.2 17.8
1999 1h00
0.98 1.02
99 1h00
2.41 2.34
99 1h00
1.57 1.69
99 1h00
2.17 2.07
99 1h00
0.34 0.32
99 1h00
3.05 2.93
99 1h00
99 1h00
0.43 0.40
99 1h00
NII/Interest Earning Assets
Net InterestAssets
Other IncomeAssets
CostAssets
ProvisionsAssets
Business Mix
Cost/Income
Provisions/NLA
ROA
ROE
“Leverage”
Risk
Drivers of Performance
17.6 17.5
99 1h00
X X
51.4/ 52.4*
/ 1.61*
*/ 52.4 excludes abnormal income
54.5

Business Unit Performance
0
50
100
150
200
250
300
350
400
Personal Corporate International Other
1H99 2H99 1H00
A$ Personal 45%
Corporate 38%
International 9%Group 8%
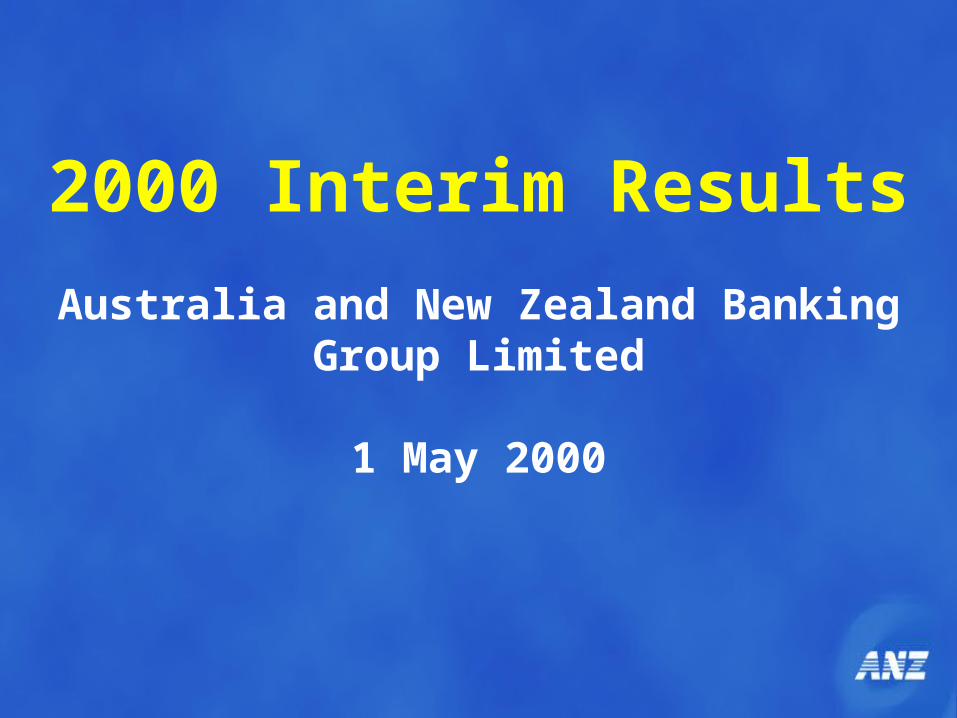
Change in Profit
600
700
750
800
850
$m
650
Second Half1999
First Half2000
Net InterestIncome
34
Lending Fee20
Other Fee Growth
30
Other Income
17
Doubtful Debts
(4)Costs
(9)Tax(34)
PropertyRevaluation
30
Sale ofStrategic
Investments33
Restatement ofDeferred Tax
Balance(64)
764
817
Significant one off items(1)

Improving Asset Quality
Provisioning: ELP v SP
0
20
40
60
80
100
120
140Personal Financial Services
Corporate Financial Services
International$m
Non Accrual Loans
ELP SP
Mar-99 Mar-00 Mar-99 Mar-00 Mar-99 Mar-00
Specific ProvisionsNet Non Accrual Loans
1997 1998 1999 1H00
428
444
900
762
657
886
554
871
$m

Percentage of Grindlays Exposure toCountries Rated below ‘Single A’
Transformation from the Sale of Grindlays
Proforma ROE March 00 Post Grindlays
BuybackSale
-1.9%
-1.4%
15.9%
17.8%17.3%
1.1
0.4
Grindlays Group
%ELP
48
82%
Excludes warranties and indemnities
Comparable ROE and leverage yet much lower risk
Scope for further capital management Proforma includes re-investment of sales
price excluding “free funds” effect of sales provisions
Of GroupExposure <A
Of Total Grindlays Exposure
NetLendingAssets

Transformation from the Sale of Grindlays
EPS - Proforma March 2000 (Annualised)BuybackSale
5-6¢
Other Influences Significantly lower risk Higher quality income streams More consistent business
BuybackSale
0.8
0.3
2-3¢
Tier 1 Ratios
0.5RWA
Profit
Other Influences Lower risk implies move to
lower end of 6.0 - 6.5% range NZ Tracking Stock
0.4% Tier 1 60/40 2000 & 2001
Buyback

0
2
4
6
8
10
12
1997 1998 1999 1H00 Target
Capital Management Philosophy: Capital scarce resource to be
managed effectively and efficiently Maintain capital consistent with
ANZ’s AA status and peer group ratings Tier 1 (6.5 - 7.0%) Inner Tier 1 (6.0% - 6.5%)
aligned to Economic Capital $500 million buyback completed
$1B buyback announced
Buyback to Reduce Capital Surplus
Capital Adequacy
Hybrid Tier 1Inner Tier 1 Net Tier 2
%

Outcomes
Mortgage & cards share upPersonal 45% of group profit FM challenging, new team
Leadership position enhancedROA 0.9% (0.7%) Non accruals 0.4% (0.9%)
Grindlays sale Latin America Offices closed Asia-Pacific e-Commerce focus
Approaching leadership B2C Strong portfolio B2B Web enabled internal processes Numerous venture investments
Business Strategy
Accelerate growth in Personal
Build on strength in Corporate
Simplify and focus International
Build leadership in e-Commerce
Good Progress on Business Strategies

Delivering via the Web
B2B
B2C
Employee PCsEmployee PCs
operations.com
Sales & Sales & Service Service
PlatformPlatform
Directors on lineDirectors on line
ERPERPTransformation
IdentrusFX On-line(ANZ On-Line)
FX On-line(ANZ On-Line)
E-ProcurementE-Procurement
eisaeisa
Enterprise Resource Planning

Clear Strategic Direction
Improve sustainability of core franchise
Radically transform the business
Accelerate growth program
Develop strategic international positions
Imperatives

Imperative
Improve sustainability of core franchise
Radically transform the business
Accelerate growth program
Develop strategic international positions
Response
Accelerate growth of up-scale segments in PersonalAddress retail funds management strategic positionSeek value enhancing infill acquisitions in PersonalContinue to build leadership in Corporate
Revolutionise cost base with web-based technologyRapidly enable ANZ customers on anz.comBecome a more customer-centric companyBuild culture and talent to compete in the new economy
Accelerate pace of investment in growth segmentsBuild substantial portfolio of e-products and businessesAccelerate medium-term search for transforming acquisitionsImprove our capacity longer term to participate in industry
consolidation on our terms
Build semi-global niche positions in trade, FX, structured finance, cards and e-Commerce
Rapidly roll-out e-Commerce investments in Asia
Clear Strategic Direction

Financial Goals Going forward
EPS growth that outperforms the average of our peer banks
Increasing Return on Equity: Target 20%
A cost income ratio comfortably below 50%
An Inner Tier 1 ratio approaching 6%
Maintenance of credit rating in AA category


14.3
11 10.3 10.2
4.9
ANZ WBC St George NAB CBA
Share of Credit Card Spend
10
11
12
13
14
Jun-94 May-96 Apr-98
Share of Housing Lending% %
15
20
25
30
Jun-94 May-96 Apr-98 Feb-00Feb-00
Personal Momentum
Internet Banking Users as % of Main Relationships
Source Ord Minnett and Roy Morgan Research