Embed Size (px)
Citation preview
Australia’s International Business Survey: 2015 Report
Survey partners
Australia’s International Business Survey: 2015 Report
2 | Export Council of Australia
Australia’s International Business Survey 2015 is the follow-up to the inaugural survey of Australia’s international businesses published in 2014.
The findings of this report are distinctive and significant because they provide key insights into the nature, needs, concerns and future plans of the overall Australian international business community from the company perspective.
The report is based on a survey conducted in late 2014 which resulted in the collection of fully completed and validated responses from 1,237 companies involved in international business.
AIBS 2015 was commissioned by the Export Council of Australia (ECA), with the support of our partners, Austrade and EFIC (Export Finance and Insurance Corporation), and was conducted by the University of Sydney (USYD).Australia’s International Business Survey 2015.
For more information on the survey methodology, see Appendix D.
AIBS 2016The 2016 AIBS survey will be launched in October. Please register your interest in participating by subscribing to the ECA database at www.export.org.au
ACKNOWLEDGEMENTSThe Export Council of Australia and survey partners would like to thank the many export companies who took part in the survey and made it a success.
DISCLAIMERThe information presented in this report is based on information received from a survey which was conducted in late 2014.
© Export Council of Australia/University of Sydney 2015
ISBN: 978-0-9942686-4-8
ABOUT THIS REPORT
3
The University of Sydney
CONTENTSABOUT THIS REPORT 2
EXECUTIVE SUMMARY 10
INTRODUCTION 12
1. AUSTRALIA’S INTERNATIONALLY ACTIVE BUSINESSES 131.1 The diversity of international business activities 131.2 Firms involved in exporting 151.3 Firms involved in importing 161.4 Firms involved in any other international activities 171.5 Analysis of revenue from goods, services and intellectual property 18
2. CURRENT OVERSEAS MARKETS 192.1 International revenue sources 192.2 Top international markets 202.3 Main mode of servicing markets 262.4 Ease of doing business 27
3. Barriers to International Operations 283.1 Most significant barriers 283.2 Top 5 most difficult countries 293.3 Overall Analysis of Significant Barriers 323.4 Barriers to investment in a foreign sales branch, subsidiary or joint venture 38
4. Impact of Free Trade Agreements 394.1 Use and benefits of Free Trade Agreements 394.2 Demand for Free Trade Agreements 44
5. Market Development Activities 455.1 Nature of market development activities 455.2 Export Market Development Grant Scheme 47
6. Access to Finance 526.1 Sources of finance for overseas markets 526.2 Success in obtaining additional finance for international opportunities 546.3 Ease of sourcing additional finance for international opportunities 58
7. Future outlook and new international business opportunities 617.1 Prospects for international operations 617.2 Factors restricting taking advantage of international business opportunities 667.3 Plans for doing business in additional countries 687.4 Key factors in targeting new countries 70
4 | Export Council of Australia
Australia’s International Business Survey: 2015 Report
APPENDIX 71
APPENDIX A: Respondent Profile 71
APPENDIX B: Country Profile 82CHINA 82INDIA 86INDONESIA 90JAPAN 94NEW ZEALAND 98SOUTH KOREA 102UNITED KINGDOM 106UNITED STATES 111
APPENDIX C: Industry Profiles 115AGRICULTURAL, FORESTRY AND FISHING (N=129) 115EDUCATION AND TRAINING (N=93) 119ICT (N=73) 123MANUFACTURING (N=380) 127PROCESSED FOOD AND BEVERAGE (N=72) 131PROFESSIONAL, SCIENTIFIC AND TECHNICAL SERVICES (N=179) 135AGRICULTURAL EQUIPMENT, TECHNOLOGY AND SERVICES (AGRIETS) (N=99) 139MINING EQUIPMENT, TECHNOLOGY AND SERVICES (METS) (N=124) 142
APPENDIX D: Survey Methodology 145
Australia’s International Business Survey Partners 146
Authors 147
Contributors 148
Acknowledgements 148
LIST OF FIGURESFigure 1-1 The diversity of international business activities 13Figure 1-2 Involvement in exporting 15Figure 1-3 Importance of various exporting activities 15Figure 1-4 Involvement in importing 16Figure 1-5 Importance of various importing activities 16Figure 1-6 Involvement in other international activities 17Figure 1-7 Importance of various other international activities 17Figure 1-8 Composition of international revenue 18Figure 1-9 Composition of international revenue for service companies 18Figure 2-1 Number of overseas markets where revenues were earned 19Figure 2-2 Top overseas market – top country 1 20Figure 2-3 Top overseas markets – top country 2 21
5
The University of Sydney
Figure 2-4 Top overseas market by region 2015 – top country 1 23Figure 2-5 Top overseas market by region 2014 – top country 1 23Figure 2-6 Top overseas market by region 2015 – top country 2 24Figure 2-7 Top overseas market by region 2014 – top country 2 24Figure 2-8 Ease of doing business compared to Australia for top ten overseas market 27Figure 3-1 Barriers faced by Australian businesses 28Figure 3-2 Barriers faced by Australian businesses – China 29Figure 3-3 Barriers faced by Australian businesses – United States 30Figure 3-4 Barriers faced by Australian businesses – India 30Figure 3-5 Barriers faced by Australian businesses – Indonesia 31Figure 3-6 Barriers faced by Australian businesses – Japan 31Figure 3-7 Local language, culture and business practices – key factors 32Figure 3-8 Licenses or product standards requirements – key factors 33Figure 3-9 Understanding local regulations – key factors 34Figure 3-10 Payment issue – key factors 36Figure 3-11 Tariffs, quotas and import duties – key factors 37Figure 3-12 Barriers to investment in a foreign sales branch, subsidiary or joint venture 38Figure 4-1 Use of FTA 39Figure 4-2 Use of FTA – by individual FTAs 40Figure 4-3 Use of FTA – AU-NZ Closer Economic Relations 40Figure 4-4 Use of FTA – Singapore-AU FTA 41Figure 4-5 Use of FTA – Thailand-AU FTA 41Figure 4-6 Use of FTA – ASEAN-AU-NZ FTA (AANZFTA) 42Figure 4-7 Use of FTA – AU-US FTA 42Figure 4-8 Use of FTA – Malaysia-AU FTA 43Figure 4-9 Use of FTA – AU-Chile FTA 43Figure 5-1 Nature of market development activities 45Figure 5-2 Use of EMDG scheme 47Figure 5-3 Importance of EMDG scheme to marketing efforts 49Figure 5-4 Use of EMDG scheme – by industry 51Figure 5-5 Importance of EMDG scheme to marketing efforts – by industry 51Figure 6-1 Sources of finance for domestic operations 52Figure 6-2 Sources of finance for overseas operations 53Figure 6-3 Use of additional finance 54Figure 6-4 Use of additional finance – by total revenue 55Figure 6-5 Success rate of obtaining additional finance 55Figure 6-6 Success rate of obtaining additional finance – by total revenue 56Figure 6-7 Reasons for being unsuccessful in obtaining additional finance 56Figure 6-8 Reasons for firms declining to proceed with lender 56Figure 6-9 Reasons for lender declining application 57Figure 6-10 Unsuccessful in obtaining additional finance due to security issues 57
6 | Export Council of Australia
Australia’s International Business Survey: 2015 Report
Figure 6-11 Ease of sourcing additional finance 58Figure 6-12 Ease of sourcing additional finance – by total revenue 59Figure 7-1 Overall outlook for international operations 61Figure 7-2 Overall outlook for international operations – by industry 62Figure 7-3 Factors restricting firms from taking advantage of international business opportunities 66Figure 7-4 Plan for doing business in additional countries 68Figure 7-5 Number of countries in which companies plan to do business 68Figure 7-6 Most important new country 69Figure 7-7 Key factors in targeting new country 70Figure A-1 Number of international businesses per industry 71Figure A-2 Number of buyers per industry 72Figure A-3 Number of employees 73Figure A-4 Total revenue (financial year 2013-14) 73Figure A-5 Company age 74Figure A-6 Location of respondents’ headquarters 74Figure A-7 Time when company started earning international revenues 75Figure A-8 Total international revenue – by 9 categories 76Figure A-9 Total international revenue – by 3 categories 76Figure A-10 Percentage of revenues earned outside Australia 77Figure A-11 Ownership type 77Figure A-12 Family ties 78Figure A-13 Family ties – by country 78Figure A-14 Gender of the head of the company 79Figure A-15 Gender of the head of the company – by industry 80Figure A-16 Gender of the head of the company – by total revenue 81Figure B-1 Main business of the company – China 82Figure B-2 Main mode of servicing exports to China 83Figure B-3 Ease of doing business in China 83Figure B-4 Key factors in targeting new country – China 84Figure B-5 Barriers to doing business – China 84Figure B-6 Overall outlook – China 85Figure B-7 Main business of the company – India 86Figure B-8 Main mode of servicing exports to India 87Figure B-9 Ease of doing business in India 87Figure B-10 Key factors in targeting new country – India 88Figure B-11 Barriers to doing business – India 88Figure B-12 Overall outlook – India 89Figure B-13 Main business of the company – Indonesia 90Figure B-14 Main mode of servicing exports to Indonesia 91Figure B-15 Ease of doing business in Indonesia 91Figure B-16 Key factors in targeting new country – Indonesia 92
7
The University of Sydney
Figure B-17 Barriers to doing business – Indonesia 92Figure B-18 Overall outlook – Indonesia 93Figure B-19 Main business of the company – Japan 94Figure B-20 Main mode of servicing exports to Japan 95Figure B-21 Ease of doing business in Japan 95Figure B-22 Key factors in targeting new country – Japan 96Figure B-23 Barriers to doing business – Japan 96Figure B-24 Overall outlook – Japan 97Figure B-25 Main business of the company – New Zealand 98Figure B-26 Main mode of servicing exports to New Zealand 99Figure B-27 Ease of doing business in New Zealand 99Figure B-28 Key factors in targeting new country – New Zealand 100Figure B-29 Barriers to doing business – New Zealand 100Figure B-30 Overall outlook – New Zealand 101Figure B-31 Main business of the company – South Korea 102Figure B-32 Main mode of servicing exports to South Korea 103Figure B-33 Ease of doing business in South Korea 103Figure B-34 Key factors in targeting new country – South Korea 104Figure B-35 Barriers to doing business – South Korea 104Figure B–36 Overall outlook – South Korea 105Figure B-37 Main business of the company – United Kingdom 106Figure B-38 Main mode of servicing exports to United Kingdom 107Figure B-39 Ease of doing business in United Kingdom 107Figure B-40 Key factors in targeting new country – United Kingdom 108Figure B-41 Barriers to doing business – United Kingdom 109Figure B-42 Overall outlook – United Kingdom 110Figure B-43 Main business of the company – United States 111Figure B-44 Main mode of servicing exports to United States 112Figure B-45 Ease of doing business in United States 112Figure B-46 Key factors in targeting new country – United States 113Figure B-47 Barriers to doing business – United States 113Figure B-48 Overall outlook – United States 114Figure C-1 Main subsector – Agricultural, forestry and fishing 115Figure C-2 Factors restricting firms from taking advantage of international business opportunities – Agricultural, forestry and fishing 116Figure C-3 Plan for doing business in additional countries – Agricultural, forestry and fishing 117Figure C-4 Overall outlook – Agricultural, forestry and fishing 118Figure C-5 Main subsector – Education and training 119Figure C-6 Factors restricting firms from taking advantage of international business opportunities – Education and training 120Figure C-7 Plan for doing business in additional countries – Education and training 121
8 | Export Council of Australia
Australia’s International Business Survey: 2015 Report
Figure C-8 Overall outlook – Education and training 122Figure C-9 Main subsector – ICT 123Figure C-10 Factors restricting firms from taking advantage of international business opportunities – ICT 124Figure C-11 Plan for doing business in additional countries – ICT 125Figure C-12 Overall outlook – ICT 126Figure C-13 Main subsector – Manufacturing 127Figure C-14 Factors restricting firms from taking advantage of international business opportunities – Manufacturing 129Figure C-15 Plan for doing business in additional countries – Manufacturing 129Figure C-16 Overall outlook – Manufacturing 130Figure C-17 Main subsector – Processed food and beverage 131Figure C-18 Factors restricting firms from taking advantage of international business opportunities – Processed food and beverage 132Figure C-19 Plan for doing business in additional countries – Processed food and beverage 133Figure C-20 Overall outlook – Processed food and beverage 134Figure C-21 Main subsector – Professional, scientific and technical services 135Figure C-22 Factors restricting firms from taking advantage of international business opportunities – Professional, scientific and technical services 136Figure C-23 Plan for doing business in additional countries – Professional, scientific and technical services 137Figure C-24 Overall outlook – Professional, scientific and technical services 138Figure C-25 Factors restricting firms from taking advantage of international business opportunities – Agricultural equipment, technology and services 140Figure C-26 Plan for doing business in additional countries – Agricultural equipment, technology and services 140Figure C-27 Overall outlook – Agricultural equipment, technology and services 141Figure C-28 Factors restricting firms from taking advantage of international business opportunities – Mining equipment, technology and services 143Figure C-29 Plan for doing business in additional countries – Mining equipment, technology and services 143Figure C-30 Overall outlook – Mining equipment, technology and services 144
LIST OF TABLESTable 1-1 The diversity of international business activities 14Table 1-2 Companies importing, exporting and involved in other international activities (n = 265) 14Table 1-3 Companies exporting and involved in other international activities (n=482) 14Table 1-4 Companies importing and involved in other international activities (n=292) 14Table 2-1 Comparison between year 2015 and 2014 – top country 1 21Table 2-3 Most important markets by industry 22Table 2-2 Comparison between year 2015 and 2014 – top country 2 22Table 2-4 Five Top 2 countries, if top 1 country is United States 25Table 2-5 Five Top 2 countries, if top 1 country is China 25Table 2-6 Five Top 2 countries, if top 1 country is New Zealand 25Table 2-7 Five Top 2 countries, if top 1 country is United Kingdom 25Table 2-8 Five Top 2 countries, if top 1 country is Singapore 25Table 2-9 Mode of servicing for top ten overseas markets 26
9
The University of Sydney
Table 3-1 Regulations that favour local firms- key factors 35Table 4-1 Demand for FTA 44Table 5-1 Nature of market development activities – qualitative comments 46Table 5-2 Use of EMDG scheme – qualitative comments 48Table 5-3 Importance of EMDG scheme to marketing efforts – qualitative comments 50Table 6-1 Perceived difficulties in obtaining additional finance 59Table 6-2 Perceived difficulties in obtaining additional finance – qualitative comments 60Table 7-1 Firms reporting overall outlook is better 63Table 7-2 Firms reporting overall outlook is better – qualitative comments 63Table 7-3 Firms reporting overall outlook is the same 65Table 7-4 Firms reporting overall outlook is worse 65Table 7-5 Factors restricting taking advantage of international business opportunities – qualitative comments 67Table C-1 Main overseas markets – Agricultural, forestry and fishing 115Table C-2 Most difficult markets – Agricultural, forestry and fishing 116Table C-3 Most important new country – Agricultural, forestry and fishing 117Table C-4 Main overseas markets – Education and training 119Table C-5 Most difficult markets – Education and training 120Table C-6 Most important new country – Education and training 121Table C-7 Main overseas markets – ICT 123Table C-8 Most difficult markets – ICT 124Table C-9 Most important new country – ICT 125Table C-10 Main overseas markets – Manufacturing 128Table C-11 Most difficult markets– Manufacturing 128Table C-12 Most important new country – Manufacturing 130Table C-13 Main overseas markets – Processed food and beverage 131Table C-14 Most difficult markets– Processed food and beverage 132Table C-15 Most important new country – Processed food and beverage 133Table C-16 Main overseas markets – Professional, scientific and technical services 135Table C-17 Most difficult markets – Professional, scientific and technical services 136Table C-18 Most important new country – Professional, scientific and technical services 137Table C-19 Main overseas markets – Agricultural equipment, technology and services 139Table C-20 Most difficult markets– Agricultural equipment, technology and services 139Table C-21 Most important new country – Agricultural equipment, technology and services 141Table C-22 Main overseas markets – Mining equipment, technology and services 142Table C-23 Most difficult markets – Mining equipment, technology and services 142
10 | Export Council of Australia
Australia’s International Business Survey: 2015 Report
EXECUTIVE SUMMARYThis report provides the results of a major survey of Australia’s internationally active businesses, known as Australia’s International Business Survey (AIBS). This AIBS 2015 survey is a follow-up to the inaugural survey of Australia’s international businesses published in 2014. The findings of this report are distinctive and significant because they provide key insights into the nature, needs, concerns and future plans of the overall Australian international business community from the company perspective.
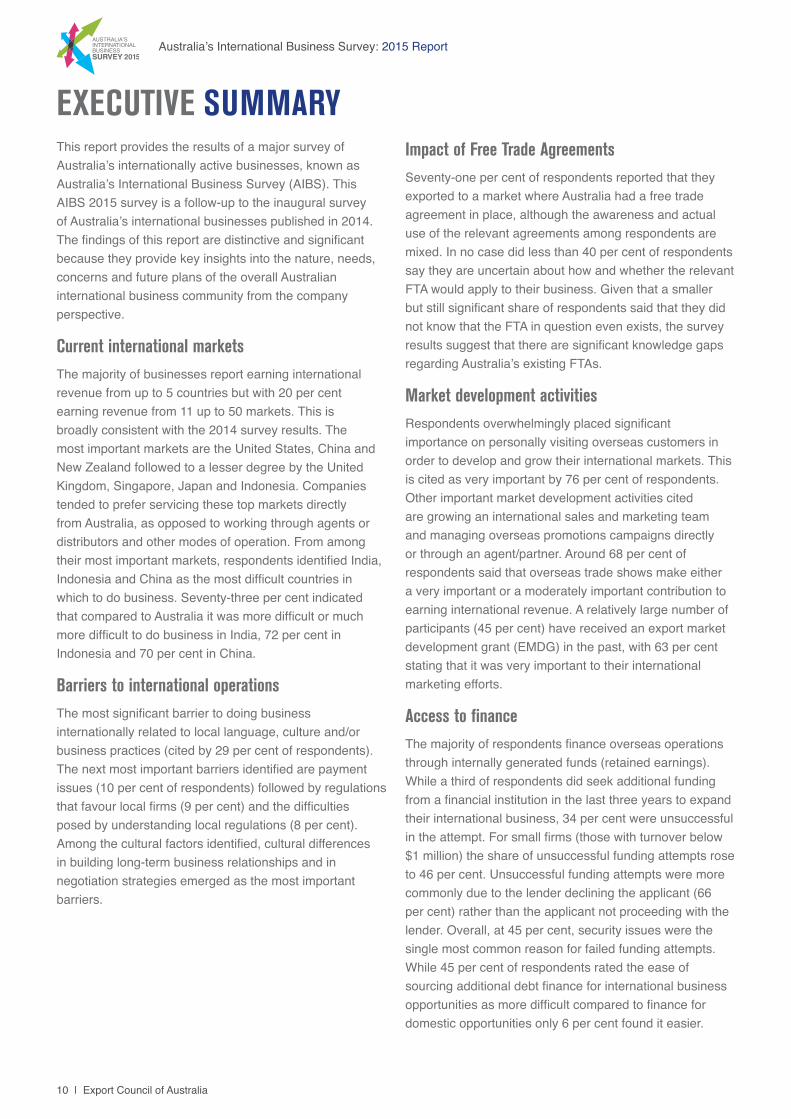
Current international marketsThe majority of businesses report earning international revenue from up to 5 countries but with 20 per cent earning revenue from 11 up to 50 markets. This is broadly consistent with the 2014 survey results. The most important markets are the United States, China and New Zealand followed to a lesser degree by the United Kingdom, Singapore, Japan and Indonesia. Companies tended to prefer servicing these top markets directly from Australia, as opposed to working through agents or distributors and other modes of operation. From among their most important markets, respondents identified India, Indonesia and China as the most difficult countries in which to do business. Seventy-three per cent indicated that compared to Australia it was more difficult or much more difficult to do business in India, 72 per cent in Indonesia and 70 per cent in China.
Barriers to international operationsThe most significant barrier to doing business internationally related to local language, culture and/or business practices (cited by 29 per cent of respondents). The next most important barriers identified are payment issues (10 per cent of respondents) followed by regulations that favour local firms (9 per cent) and the difficulties posed by understanding local regulations (8 per cent). Among the cultural factors identified, cultural differences in building long-term business relationships and in negotiation strategies emerged as the most important barriers.
Impact of Free Trade AgreementsSeventy-one per cent of respondents reported that they exported to a market where Australia had a free trade agreement in place, although the awareness and actual use of the relevant agreements among respondents are mixed. In no case did less than 40 per cent of respondents say they are uncertain about how and whether the relevant FTA would apply to their business. Given that a smaller but still significant share of respondents said that they did not know that the FTA in question even exists, the survey results suggest that there are significant knowledge gaps regarding Australia’s existing FTAs.
Market development activitiesRespondents overwhelmingly placed significant importance on personally visiting overseas customers in order to develop and grow their international markets. This is cited as very important by 76 per cent of respondents. Other important market development activities cited are growing an international sales and marketing team and managing overseas promotions campaigns directly or through an agent/partner. Around 68 per cent of respondents said that overseas trade shows make either a very important or a moderately important contribution to earning international revenue. A relatively large number of participants (45 per cent) have received an export market development grant (EMDG) in the past, with 63 per cent stating that it was very important to their international marketing efforts.
Access to financeThe majority of respondents finance overseas operations through internally generated funds (retained earnings). While a third of respondents did seek additional funding from a financial institution in the last three years to expand their international business, 34 per cent were unsuccessful in the attempt. For small firms (those with turnover below $1 million) the share of unsuccessful funding attempts rose to 46 per cent. Unsuccessful funding attempts were more commonly due to the lender declining the applicant (66 per cent) rather than the applicant not proceeding with the lender. Overall, at 45 per cent, security issues were the single most common reason for failed funding attempts. While 45 per cent of respondents rated the ease of sourcing additional debt finance for international business opportunities as more difficult compared to finance for domestic opportunities only 6 per cent found it easier.
11
The University of Sydney
Future outlook and new international business opportunitiesThe outlook for existing international operations is positive, with 69 per cent of respondents confident that their international operations will perform better in 2015 compared to last year. This outlook is consistent across industries, with the exception of the mining sector, where less than half of the respondents expect to do better in 2015. The prospects for further international expansion are also bullish, with 83 per cent of respondents planning to expand to new countries in the next 2 years. The top five target markets identified are the United States (cited by 14 per cent of respondents), China (13 per cent), Indonesia (6 per cent), the United Kingdom (5 per cent) and India (also 5 per cent). The most important factor identified by respondents as determining their choice of future markets is the presence of strong growth prospects in these economies, which is cited by 95 per cent of respondents as either moderately or very important. The most important factors that restrict companies from further taking advantage of new international business opportunities are the value of the Australian dollar, the high costs of production, and the level of labour productivity.
12 | Export Council of Australia
Australia’s International Business Survey: 2015 Report
INTRODUCTIONThis report provides the results of Australia’s International Business Survey 2015. This is a follow-up to the inaugural survey of Australia’s international businesses published in 2014. The findings of this report are distinctive and significant because they provide key insights into the nature, needs, concerns and future plans of the overall Australian international business community from the company perspective. Australia’s trade linkages have been traditionally measured and understood in value terms. Export statistics, for example, reflect and are highly determined by the export performance of the mining and energy sectors. As Australia shifts its focus from sectors related to the mining boom it becomes even more important to emphasise the development of the non-mining sectors in the wider context of Australia’s international business activities.
The report is based on a survey conducted in late 2014 which resulted in the collection of fully completed and validated responses from 1,237 companies involved in international business. The companies surveyed cover 19 industry sectors (and 93 sub-sectors), operating in a total of 114 markets in all regions of the world. Thirty-one per cent of companies were from the manufacturing sector, representing the single largest group of respondents. Around half of the companies were engaged in a wide variety of service-oriented businesses, with 14 per cent representing professional, scientific and technical services. The survey respondents are mainly SMEs with revenues up to $20 million. They were also highly experienced businesses. Forty-one per cent of respondents have been operating for more than 20 years, while only 7 per cent have been operating for less than 3 years. In addition to being highly experienced businesses, the companies that participated in the survey were also very experienced in managing activities designed to earn revenue from overseas. Forty-six per cent of respondents report having first earned international revenue more than 10 years ago.
The report consists of seven major sections:
1. The diversity of operations conducted by Australia’s internationally active businesses is detailed.
2. The main international markets of respondents are analysed.
3. The key barriers that companies face in doing international business are identified.
4. The impact of free trade agreements is explored.
5. An analysis of market development activities engaged in by respondents is provided.
6. Issues relating to access to finance are explored.
7. The views of respondents on their future business outlook and new international business opportunities are provided.
Further detailed information including country and industry profiles is provided in the Appendices as follows:
• Appendix A - the profile of company respondents is provided across a range of dimensions.
• Appendix B - country profiles are provided for eight major markets i.e. China, India, Indonesia, Japan, New Zealand, South Korea, United Kingdom, and United States.
• Appendix C - more detailed industry/sector analysis is provided in respect of selected industries i.e. agricultural, forestry and fishing; education and training; ICT; manufacturing; processed food and beverages; professional, scientific and technical services; together with agricultural equipment, and mining equipment, technology and services (based on customers).
• Appendix D - the survey methodology is provided.
13
The University of Sydney
1. AUSTRALIA’S INTERNATIONALLY ACTIVE BUSINESSESIn this section the focus is on the diversity of international operations conducted by respondents. Additional demographic information about the survey participants is provided in Appendix A which includes an analysis by type of main business (by ANZSIC code), by main buyer industry/sector, by number of employees, by total revenue, by age of company and year international revenues were first earned, by total international revenue, by percentage of international revenue, by ownership type, by family ties with an important market, and by gender diversity of CEO.
Section 1.1 provides an overview of international business activities, while Sections 1.2 – 1.4 provide a more detailed analysis of exporting, importing and other international activities respectively. Section 1.5 provides an analysis of revenues from goods, services and intellectual property, with a particular focus on services.
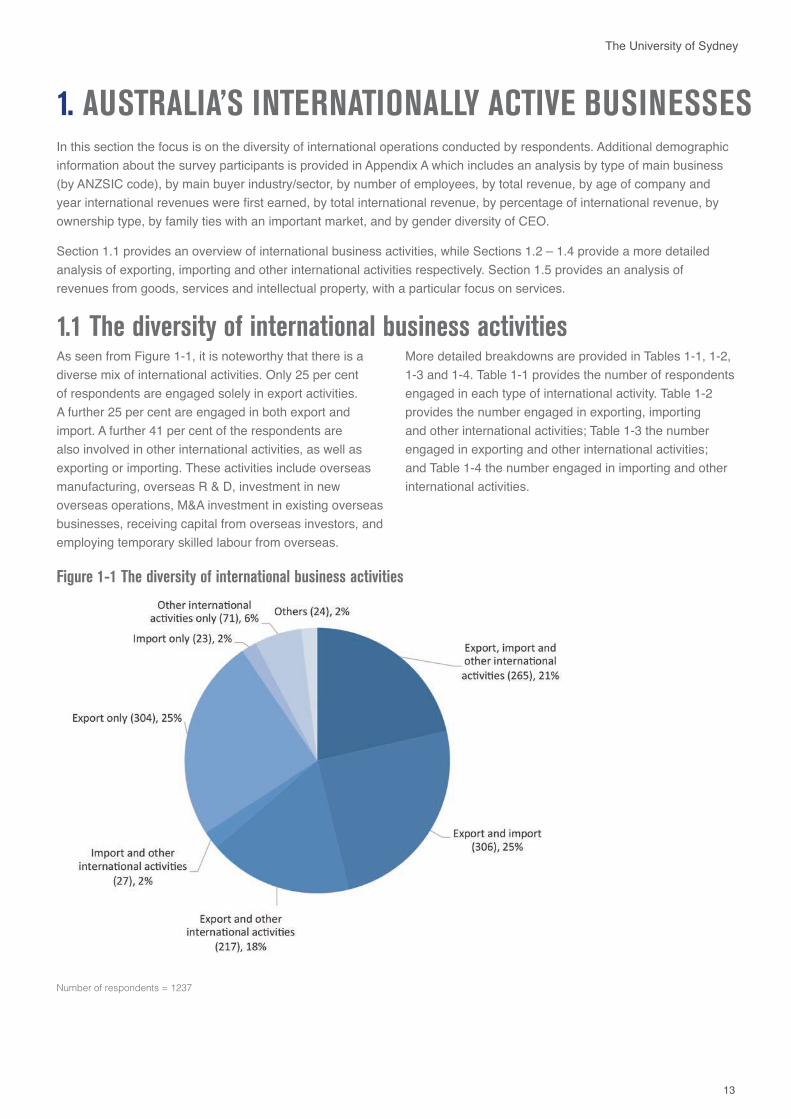
1.1 The diversity of international business activities As seen from Figure 1-1, it is noteworthy that there is a diverse mix of international activities. Only 25 per cent of respondents are engaged solely in export activities. A further 25 per cent are engaged in both export and import. A further 41 per cent of the respondents are also involved in other international activities, as well as exporting or importing. These activities include overseas manufacturing, overseas R & D, investment in new overseas operations, M&A investment in existing overseas businesses, receiving capital from overseas investors, and employing temporary skilled labour from overseas.
Figure 1-1 The diversity of international business activities
Number of respondents = 1237
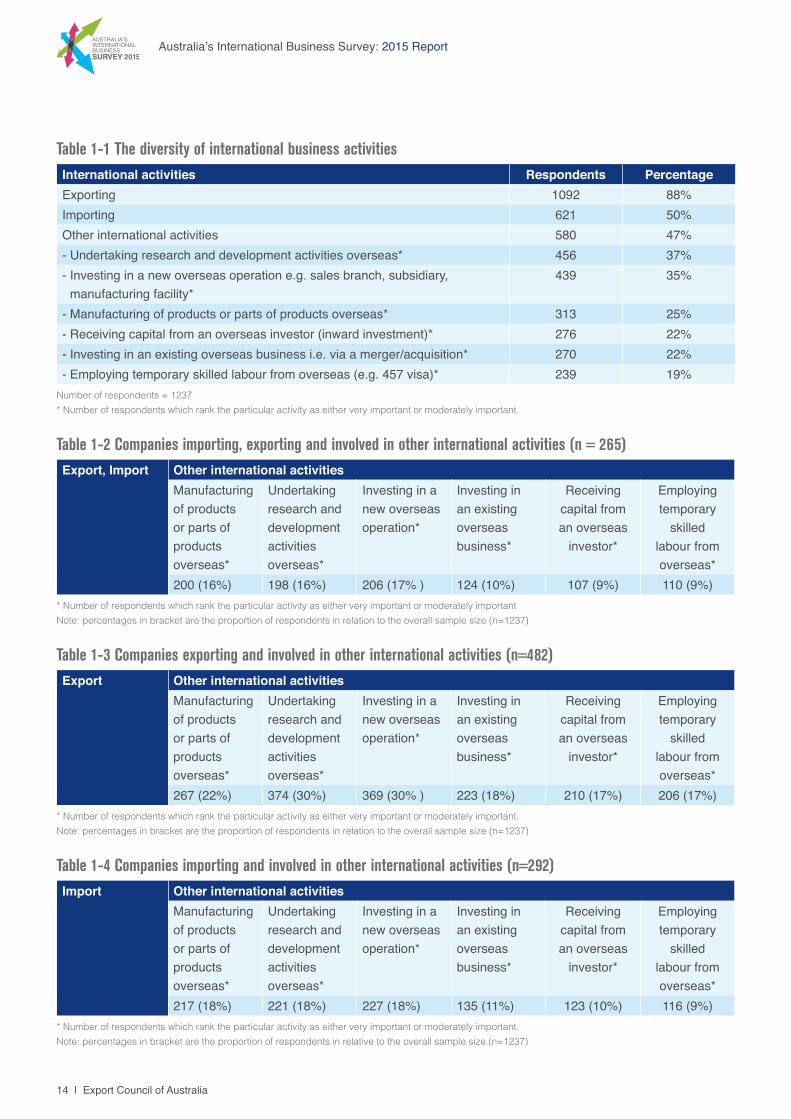
More detailed breakdowns are provided in Tables 1-1, 1-2, 1-3 and 1-4. Table 1-1 provides the number of respondents engaged in each type of international activity. Table 1-2 provides the number engaged in exporting, importing and other international activities; Table 1-3 the number engaged in exporting and other international activities; and Table 1-4 the number engaged in importing and other international activities.
14 | Export Council of Australia
Australia’s International Business Survey: 2015 Report
Table 1-1 The diversity of international business activities
Number of respondents = 1237* Number of respondents which rank the particular activity as either very important or moderately important.
International activities Respondents PercentageExporting 1092 88%Importing 621 50%Other international activities 580 47%- Undertaking research and development activities overseas* 456 37%- Investing in a new overseas operation e.g. sales branch, subsidiary,
manufacturing facility*439 35%
- Manufacturing of products or parts of products overseas* 313 25%- Receiving capital from an overseas investor (inward investment)* 276 22%- Investing in an existing overseas business i.e. via a merger/acquisition* 270 22%- Employing temporary skilled labour from overseas (e.g. 457 visa)* 239 19%
* Number of respondents which rank the particular activity as either very important or moderately importantNote: percentages in bracket are the proportion of respondents in relation to the overall sample size (n=1237)
Table 1-2 Companies importing, exporting and involved in other international activities (n = 265)Export, Import Other international activities
Manufacturing of products or parts of products overseas*
Undertaking research and development activities overseas*
Investing in a new overseas operation*
Investing in an existing overseas business*
Receiving capital from an overseas
investor*
Employing temporary
skilled labour from overseas*
200 (16%) 198 (16%) 206 (17% ) 124 (10%) 107 (9%) 110 (9%)
* Number of respondents which rank the particular activity as either very important or moderately important. Note: percentages in bracket are the proportion of respondents in relation to the overall sample size (n=1237)
Table 1-3 Companies exporting and involved in other international activities (n=482)Export Other international activities
Manufacturing of products or parts of products overseas*
Undertaking research and development activities overseas*
Investing in a new overseas operation*
Investing in an existing overseas business*
Receiving capital from an overseas
investor*
Employing temporary
skilled labour from overseas*
267 (22%) 374 (30%) 369 (30% ) 223 (18%) 210 (17%) 206 (17%)
* Number of respondents which rank the particular activity as either very important or moderately important. Note: percentages in bracket are the proportion of respondents in relative to the overall sample size (n=1237)
Table 1-4 Companies importing and involved in other international activities (n=292)Import Other international activities
Manufacturing of products or parts of products overseas*
Undertaking research and development activities overseas*
Investing in a new overseas operation*
Investing in an existing overseas business*
Receiving capital from an overseas
investor*
Employing temporary
skilled labour from overseas*
217 (18%) 221 (18%) 227 (18%) 135 (11%) 123 (10%) 116 (9%)
15
The University of Sydney
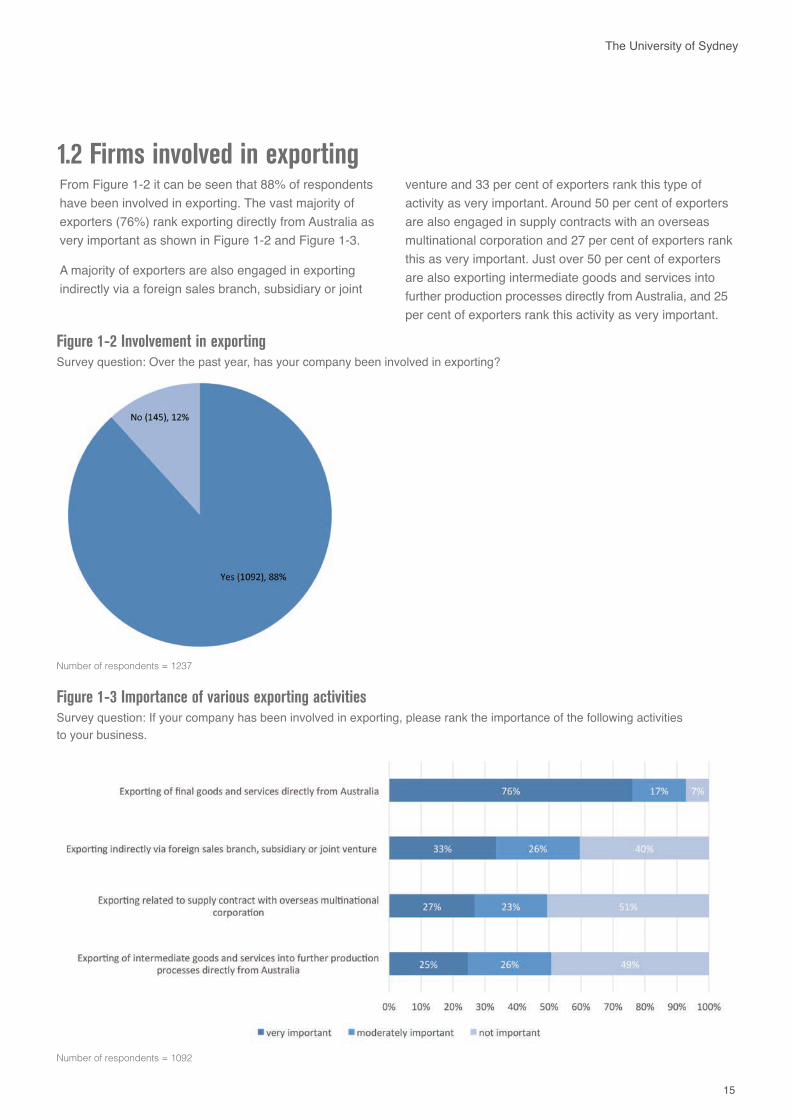
Figure 1-3 Importance of various exporting activities Survey question: If your company has been involved in exporting, please rank the importance of the following activities to your business.
Number of respondents = 1092
1.2 Firms involved in exportingFrom Figure 1-2 it can be seen that 88% of respondents have been involved in exporting. The vast majority of exporters (76%) rank exporting directly from Australia as very important as shown in Figure 1-2 and Figure 1-3.
A majority of exporters are also engaged in exporting indirectly via a foreign sales branch, subsidiary or joint
Figure 1-2 Involvement in exportingSurvey question: Over the past year, has your company been involved in exporting?
Number of respondents = 1237
venture and 33 per cent of exporters rank this type of activity as very important. Around 50 per cent of exporters are also engaged in supply contracts with an overseas multinational corporation and 27 per cent of exporters rank this as very important. Just over 50 per cent of exporters are also exporting intermediate goods and services into further production processes directly from Australia, and 25 per cent of exporters rank this activity as very important.
16 | Export Council of Australia
Australia’s International Business Survey: 2015 Report
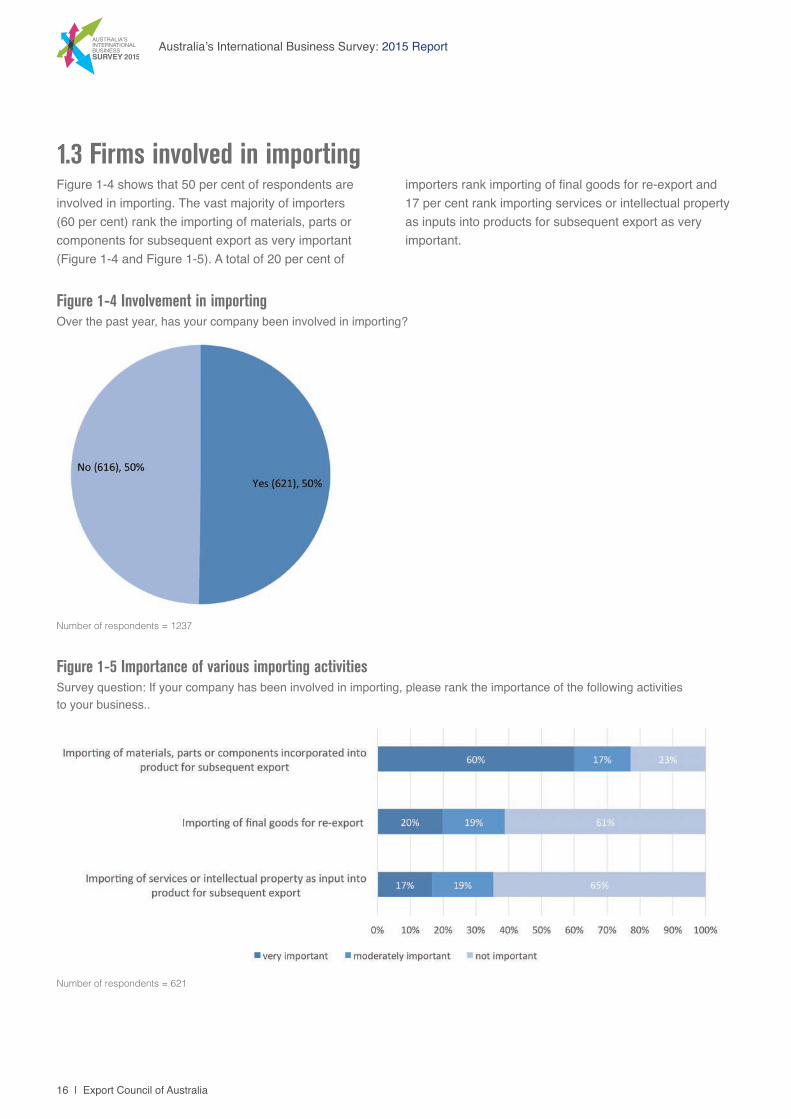
Figure 1-4 Involvement in importingOver the past year, has your company been involved in importing?
Number of respondents = 1237
Figure 1-5 Importance of various importing activities Survey question: If your company has been involved in importing, please rank the importance of the following activities to your business..
Number of respondents = 621
1.3 Firms involved in importing Figure 1-4 shows that 50 per cent of respondents are involved in importing. The vast majority of importers (60 per cent) rank the importing of materials, parts or components for subsequent export as very important (Figure 1-4 and Figure 1-5). A total of 20 per cent of
importers rank importing of final goods for re-export and 17 per cent rank importing services or intellectual property as inputs into products for subsequent export as very important.
17
The University of Sydney
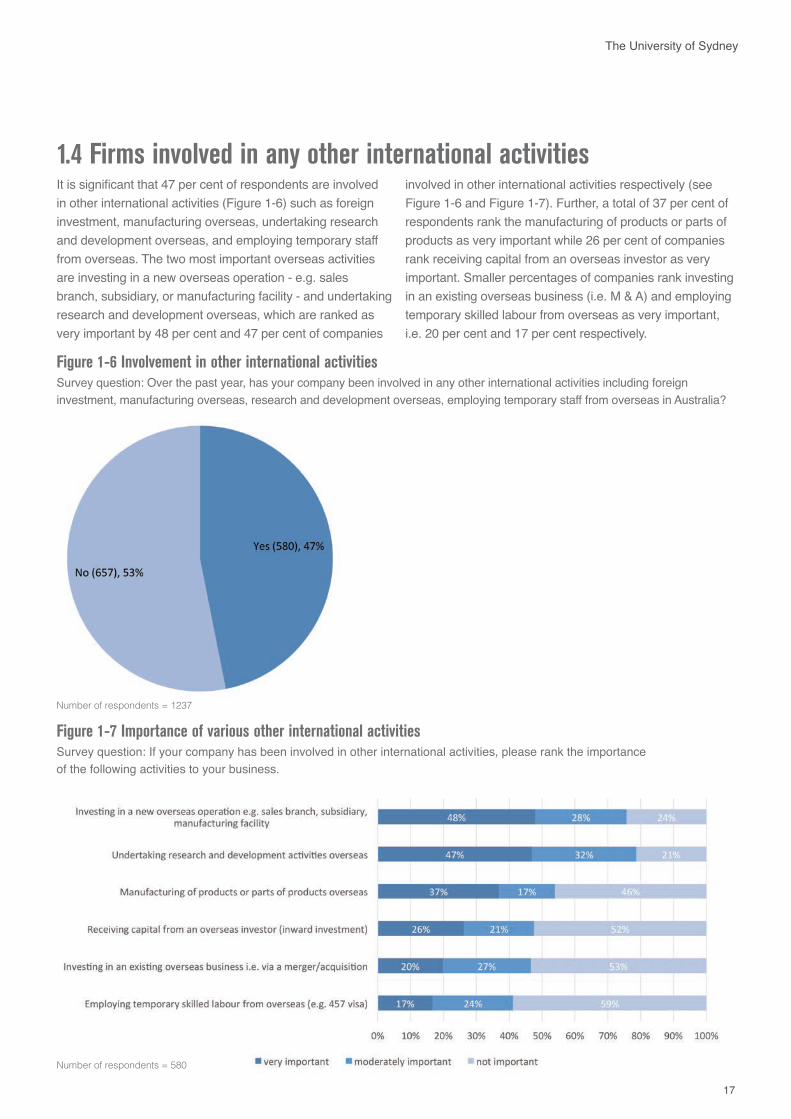
1.4 Firms involved in any other international activities It is significant that 47 per cent of respondents are involved in other international activities (Figure 1-6) such as foreign investment, manufacturing overseas, undertaking research and development overseas, and employing temporary staff from overseas. The two most important overseas activities are investing in a new overseas operation - e.g. sales branch, subsidiary, or manufacturing facility - and undertaking research and development overseas, which are ranked as very important by 48 per cent and 47 per cent of companies
involved in other international activities respectively (see Figure 1-6 and Figure 1-7). Further, a total of 37 per cent of respondents rank the manufacturing of products or parts of products as very important while 26 per cent of companies rank receiving capital from an overseas investor as very important. Smaller percentages of companies rank investing in an existing overseas business (i.e. M & A) and employing temporary skilled labour from overseas as very important, i.e. 20 per cent and 17 per cent respectively.
Figure 1-6 Involvement in other international activitiesSurvey question: Over the past year, has your company been involved in any other international activities including foreign investment, manufacturing overseas, research and development overseas, employing temporary staff from overseas in Australia?
Number of respondents = 1237
Figure 1-7 Importance of various other international activities Survey question: If your company has been involved in other international activities, please rank the importance of the following activities to your business.
Number of respondents = 580
18 | Export Council of Australia
Australia’s International Business Survey: 2015 Report
1.5 Analysis of revenue from goods, services and intellectual property
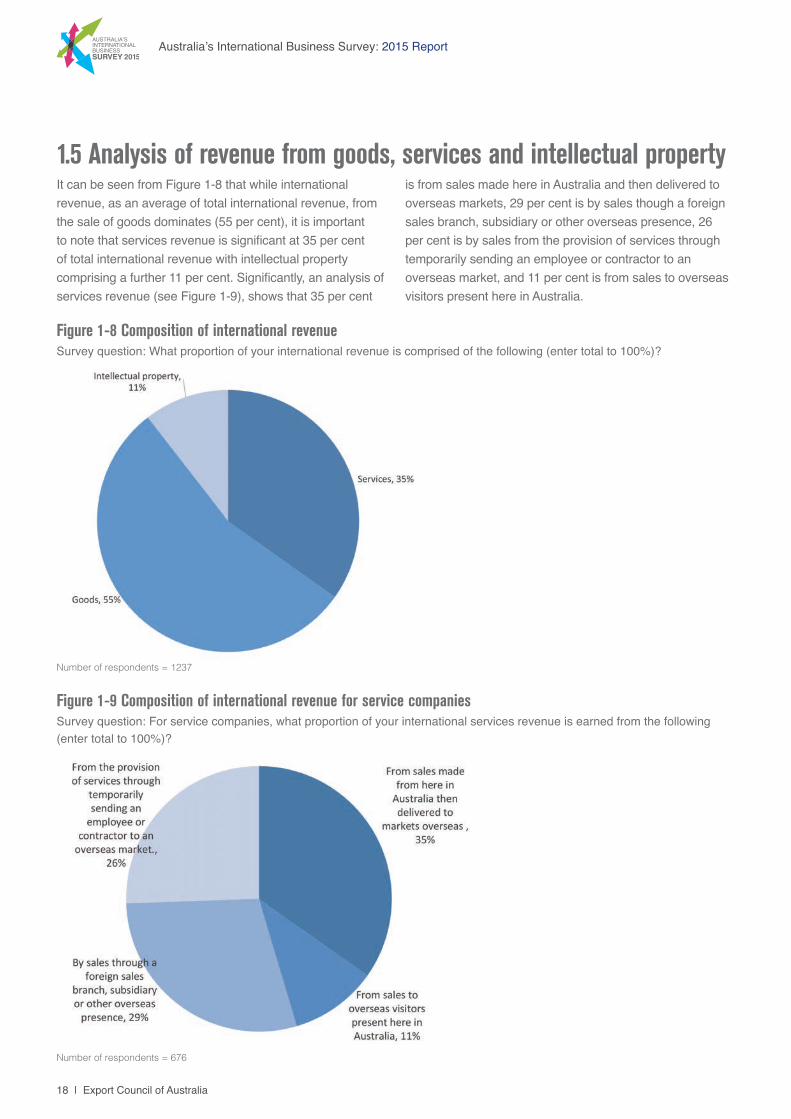
Figure 1-8 Composition of international revenueSurvey question: What proportion of your international revenue is comprised of the following (enter total to 100%)?
Number of respondents = 1237
Figure 1-9 Composition of international revenue for service companies Survey question: For service companies, what proportion of your international services revenue is earned from the following (enter total to 100%)?
Number of respondents = 676
It can be seen from Figure 1-8 that while international revenue, as an average of total international revenue, from the sale of goods dominates (55 per cent), it is important to note that services revenue is significant at 35 per cent of total international revenue with intellectual property comprising a further 11 per cent. Significantly, an analysis of services revenue (see Figure 1-9), shows that 35 per cent
is from sales made here in Australia and then delivered to overseas markets, 29 per cent is by sales though a foreign sales branch, subsidiary or other overseas presence, 26 per cent is by sales from the provision of services through temporarily sending an employee or contractor to an overseas market, and 11 per cent is from sales to overseas visitors present here in Australia.
19
The University of Sydney
2. CURRENT OVERSEAS MARKETSIn this section the location and nature of current international operations is the focus. Section 2.1 examines the number of country locations based on sources of international revenue. Section 2.2 identifies the top 2 international markets involved and includes a regional as well as a country analysis. Section 2.3 examines the main mode of servicing the markets involved while section 2.4 evaluates the ease of doing business in these markets.
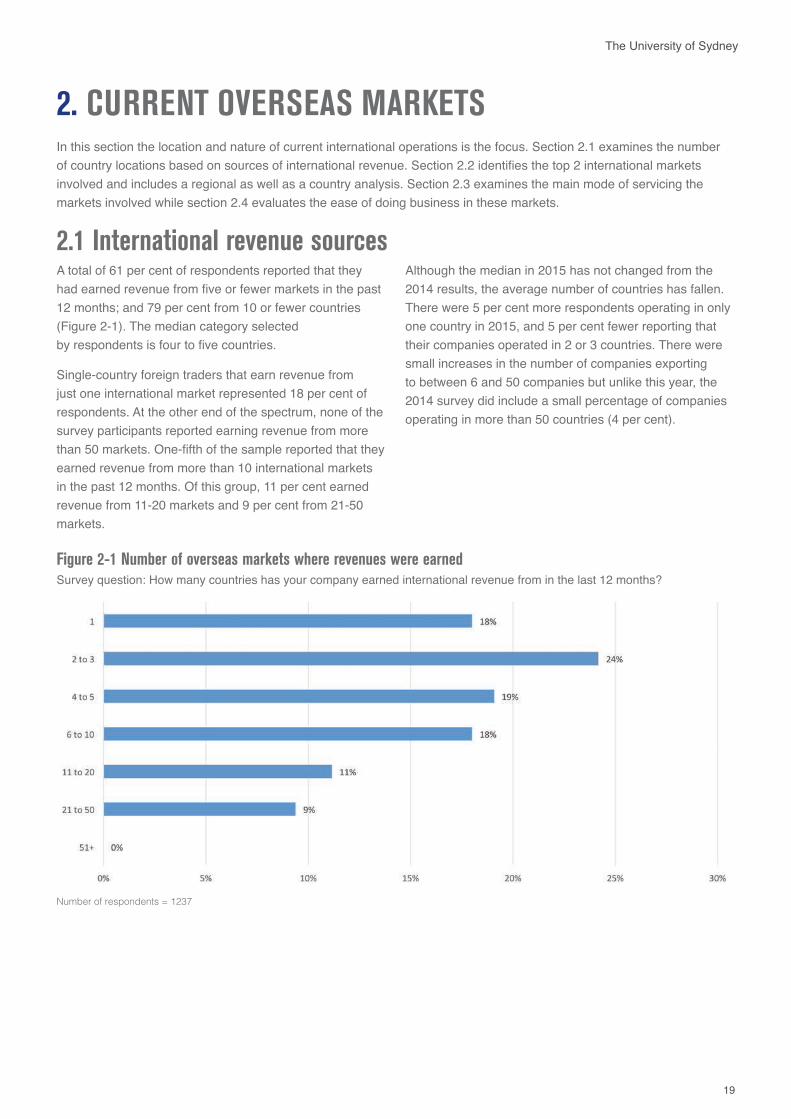
2.1 International revenue sourcesA total of 61 per cent of respondents reported that they had earned revenue from five or fewer markets in the past 12 months; and 79 per cent from 10 or fewer countries (Figure 2-1). The median category selected by respondents is four to five countries.
Single-country foreign traders that earn revenue from just one international market represented 18 per cent of respondents. At the other end of the spectrum, none of the survey participants reported earning revenue from more than 50 markets. One-fifth of the sample reported that they earned revenue from more than 10 international markets in the past 12 months. Of this group, 11 per cent earned revenue from 11-20 markets and 9 per cent from 21-50 markets.
Figure 2-1 Number of overseas markets where revenues were earnedSurvey question: How many countries has your company earned international revenue from in the last 12 months?
Number of respondents = 1237
Although the median in 2015 has not changed from the 2014 results, the average number of countries has fallen. There were 5 per cent more respondents operating in only one country in 2015, and 5 per cent fewer reporting that their companies operated in 2 or 3 countries. There were small increases in the number of companies exporting to between 6 and 50 companies but unlike this year, the 2014 survey did include a small percentage of companies operating in more than 50 countries (4 per cent).
20 | Export Council of Australia
Australia’s International Business Survey: 2015 Report
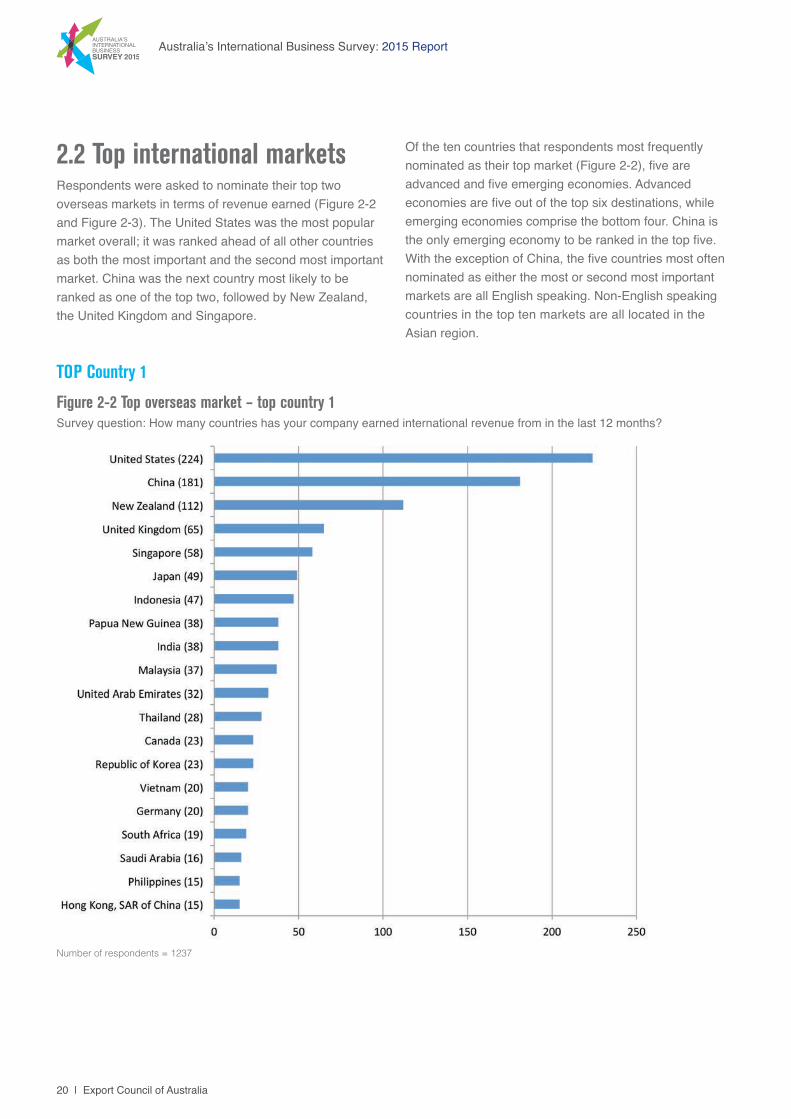
2.2 Top international marketsRespondents were asked to nominate their top two overseas markets in terms of revenue earned (Figure 2-2 and Figure 2-3). The United States was the most popular market overall; it was ranked ahead of all other countries as both the most important and the second most important market. China was the next country most likely to be ranked as one of the top two, followed by New Zealand, the United Kingdom and Singapore.
Of the ten countries that respondents most frequently nominated as their top market (Figure 2-2), five are advanced and five emerging economies. Advanced economies are five out of the top six destinations, while emerging economies comprise the bottom four. China is the only emerging economy to be ranked in the top five. With the exception of China, the five countries most often nominated as either the most or second most important markets are all English speaking. Non-English speaking countries in the top ten markets are all located in the Asian region.
Figure 2-2 Top overseas market – top country 1Survey question: How many countries has your company earned international revenue from in the last 12 months?
Number of respondents = 1237
TOP Country 1
21
The University of Sydney
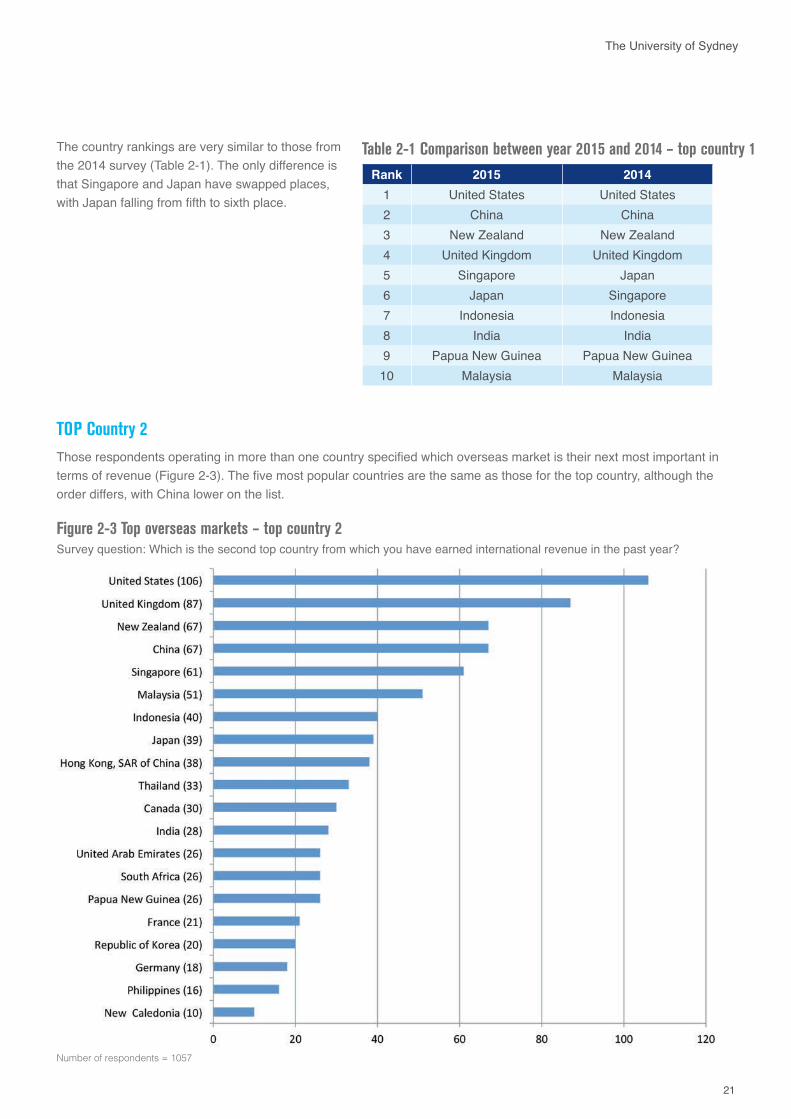
TOP Country 2Those respondents operating in more than one country specified which overseas market is their next most important in terms of revenue (Figure 2-3). The five most popular countries are the same as those for the top country, although the order differs, with China lower on the list.
The country rankings are very similar to those from the 2014 survey (Table 2-1). The only difference is that Singapore and Japan have swapped places, with Japan falling from fifth to sixth place.
Table 2-1 Comparison between year 2015 and 2014 – top country 1Rank 2015 2014
1 United States United States 2 China China 3 New Zealand New Zealand 4 United Kingdom United Kingdom 5 Singapore Japan 6 Japan Singapore 7 Indonesia Indonesia 8 India India 9 Papua New Guinea Papua New Guinea
10 Malaysia Malaysia
Figure 2-3 Top overseas markets – top country 2Survey question: Which is the second top country from which you have earned international revenue in the past year?
Number of respondents = 1057
22 | Export Council of Australia
Australia’s International Business Survey: 2015 Report
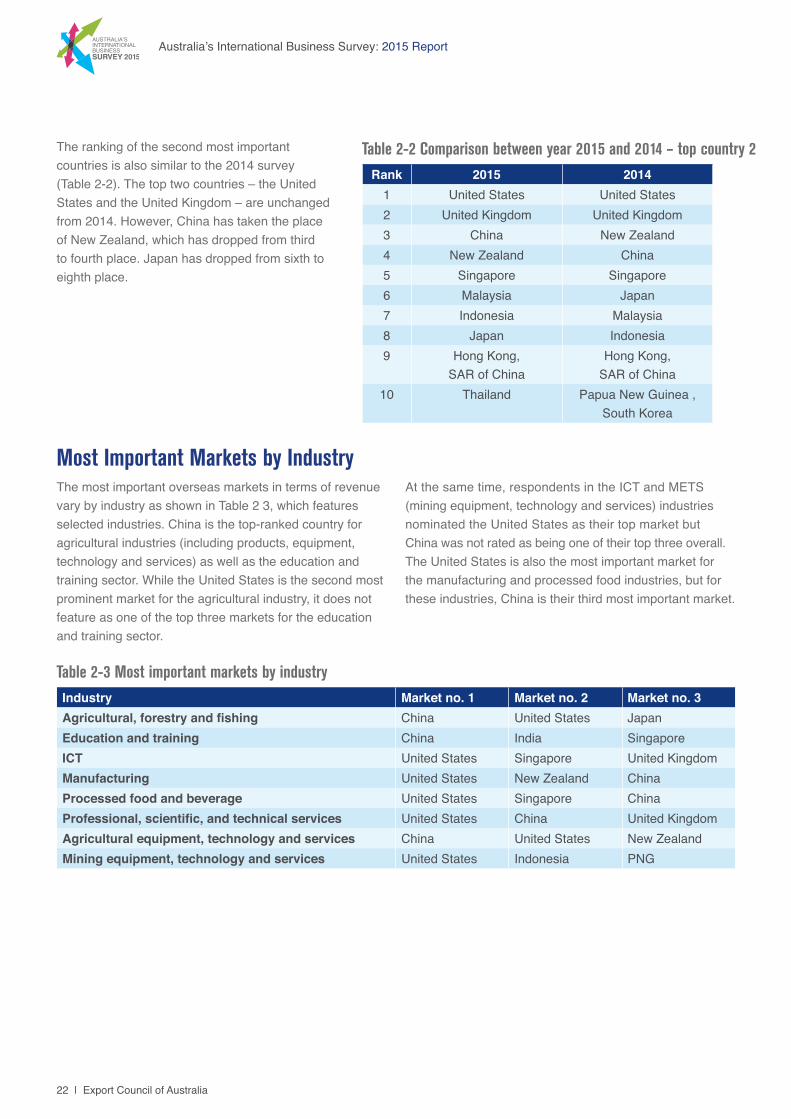
The ranking of the second most important countries is also similar to the 2014 survey (Table 2-2). The top two countries – the United States and the United Kingdom – are unchanged from 2014. However, China has taken the place of New Zealand, which has dropped from third to fourth place. Japan has dropped from sixth to eighth place.
Table 2-2 Comparison between year 2015 and 2014 – top country 2Rank 2015 2014
1 United States United States 2 United Kingdom United Kingdom 3 China New Zealand 4 New Zealand China 5 Singapore Singapore 6 Malaysia Japan 7 Indonesia Malaysia 8 Japan Indonesia 9 Hong Kong,
SAR of China Hong Kong,
SAR of China 10 Thailand Papua New Guinea ,
South Korea
Table 2-3 Most important markets by industryIndustry Market no. 1 Market no. 2 Market no. 3Agricultural, forestry and fishing China United States JapanEducation and training China India SingaporeICT United States Singapore United KingdomManufacturing United States New Zealand ChinaProcessed food and beverage United States Singapore ChinaProfessional, scientific, and technical services United States China United KingdomAgricultural equipment, technology and services China United States New ZealandMining equipment, technology and services United States Indonesia PNG
Most Important Markets by Industry The most important overseas markets in terms of revenue vary by industry as shown in Table 2 3, which features selected industries. China is the top-ranked country for agricultural industries (including products, equipment, technology and services) as well as the education and training sector. While the United States is the second most prominent market for the agricultural industry, it does not feature as one of the top three markets for the education and training sector.
At the same time, respondents in the ICT and METS (mining equipment, technology and services) industries nominated the United States as their top market but China was not rated as being one of their top three overall. The United States is also the most important market for the manufacturing and processed food industries, but for these industries, China is their third most important market.
23
The University of Sydney
Regional Analysis
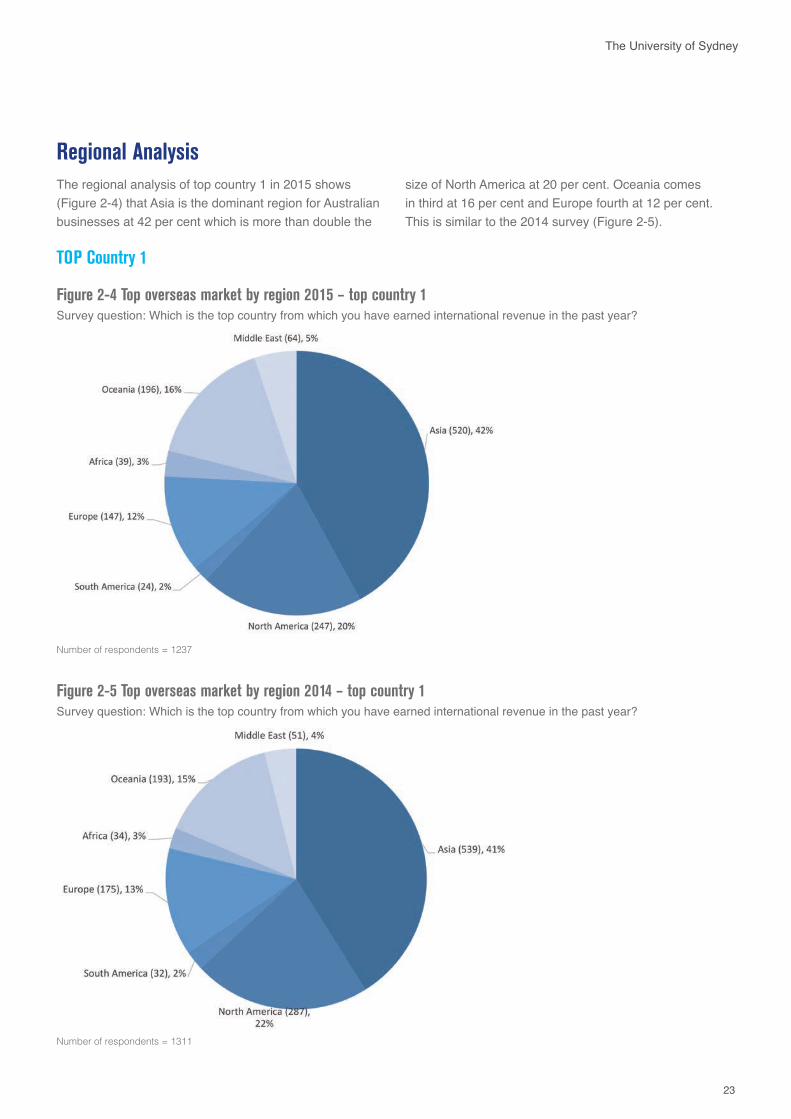
Figure 2-4 Top overseas market by region 2015 – top country 1 Survey question: Which is the top country from which you have earned international revenue in the past year?
Number of respondents = 1237
Figure 2-5 Top overseas market by region 2014 – top country 1 Survey question: Which is the top country from which you have earned international revenue in the past year?
Number of respondents = 1311
The regional analysis of top country 1 in 2015 shows (Figure 2-4) that Asia is the dominant region for Australian businesses at 42 per cent which is more than double the
size of North America at 20 per cent. Oceania comes in third at 16 per cent and Europe fourth at 12 per cent. This is similar to the 2014 survey (Figure 2-5).
TOP Country 1
24 | Export Council of Australia
Australia’s International Business Survey: 2015 Report
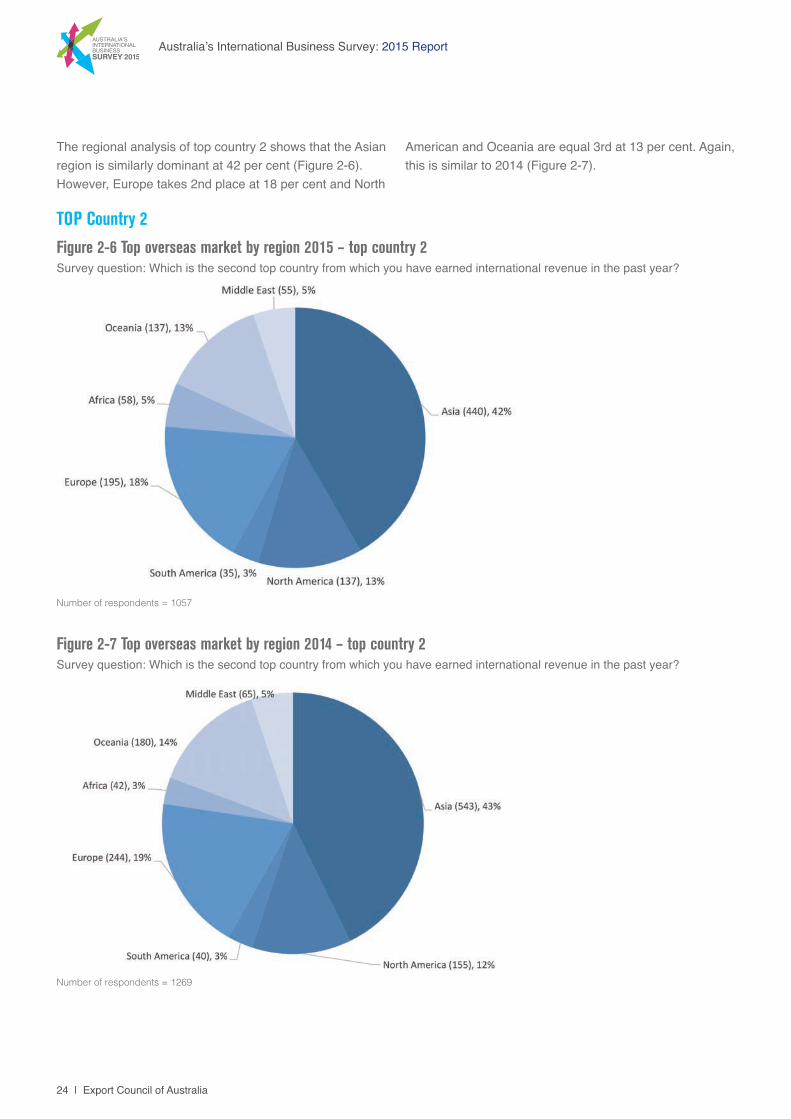
The regional analysis of top country 2 shows that the Asian region is similarly dominant at 42 per cent (Figure 2-6). However, Europe takes 2nd place at 18 per cent and North
Figure 2-6 Top overseas market by region 2015 – top country 2Survey question: Which is the second top country from which you have earned international revenue in the past year?
Number of respondents = 1057
Figure 2-7 Top overseas market by region 2014 – top country 2Survey question: Which is the second top country from which you have earned international revenue in the past year?
Number of respondents = 1269
American and Oceania are equal 3rd at 13 per cent. Again, this is similar to 2014 (Figure 2-7).
TOP Country 2
25
The University of Sydney
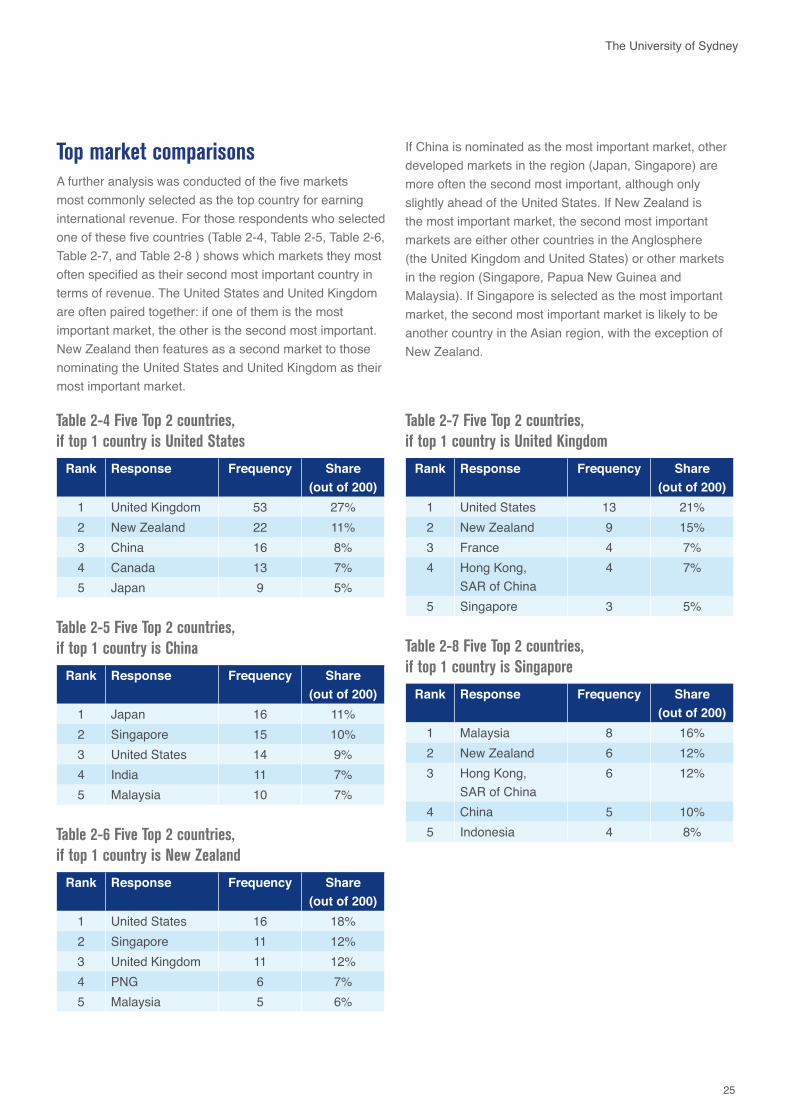
Top market comparisonsA further analysis was conducted of the five markets most commonly selected as the top country for earning international revenue. For those respondents who selected one of these five countries (Table 2-4, Table 2-5, Table 2-6, Table 2-7, and Table 2-8 ) shows which markets they most often specified as their second most important country in terms of revenue. The United States and United Kingdom are often paired together: if one of them is the most important market, the other is the second most important. New Zealand then features as a second market to those nominating the United States and United Kingdom as their most important market.
If China is nominated as the most important market, other developed markets in the region (Japan, Singapore) are more often the second most important, although only slightly ahead of the United States. If New Zealand is the most important market, the second most important markets are either other countries in the Anglosphere (the United Kingdom and United States) or other markets in the region (Singapore, Papua New Guinea and Malaysia). If Singapore is selected as the most important market, the second most important market is likely to be another country in the Asian region, with the exception of New Zealand.
Table 2-4 Five Top 2 countries, if top 1 country is United States
Rank Response Frequency Share (out of 200)
1 United Kingdom 53 27%2 New Zealand 22 11%3 China 16 8%4 Canada 13 7%5 Japan 9 5%
Table 2-7 Five Top 2 countries, if top 1 country is United Kingdom
Rank Response Frequency Share (out of 200)
1 United States 13 21%2 New Zealand 9 15%3 France 4 7%4 Hong Kong,
SAR of China4 7%
5 Singapore 3 5%Table 2-5 Five Top 2 countries, if top 1 country is China
Rank Response Frequency Share (out of 200)
1 Japan 16 11%2 Singapore 15 10%3 United States 14 9%4 India 11 7%5 Malaysia 10 7%
Table 2-8 Five Top 2 countries, if top 1 country is Singapore
Rank Response Frequency Share (out of 200)
1 Malaysia 8 16%2 New Zealand 6 12%3 Hong Kong,
SAR of China6 12%
4 China 5 10%5 Indonesia 4 8%Table 2-6 Five Top 2 countries,
if top 1 country is New Zealand
Rank Response Frequency Share (out of 200)
1 United States 16 18%2 Singapore 11 12%3 United Kingdom 11 12%4 PNG 6 7%5 Malaysia 5 6%
26 | Export Council of Australia
Australia’s International Business Survey: 2015 Report
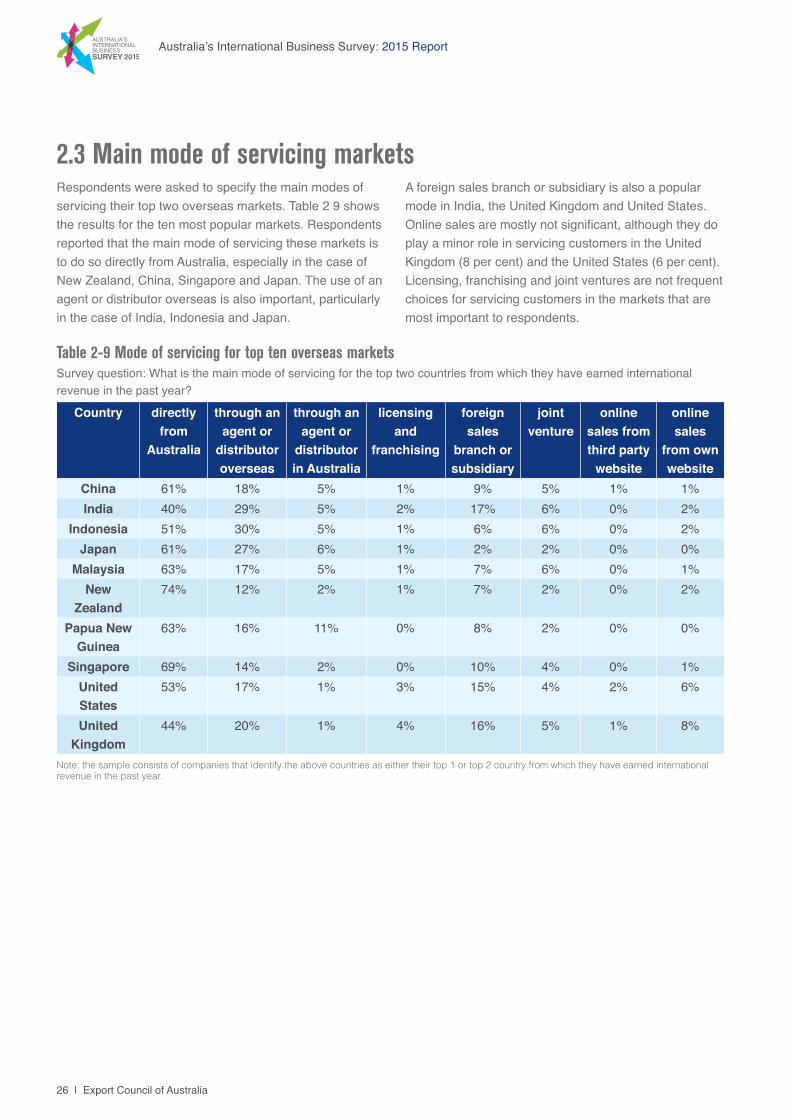
2.3 Main mode of servicing marketsRespondents were asked to specify the main modes of servicing their top two overseas markets. Table 2 9 shows the results for the ten most popular markets. Respondents reported that the main mode of servicing these markets is to do so directly from Australia, especially in the case of New Zealand, China, Singapore and Japan. The use of an agent or distributor overseas is also important, particularly in the case of India, Indonesia and Japan.
A foreign sales branch or subsidiary is also a popular mode in India, the United Kingdom and United States. Online sales are mostly not significant, although they do play a minor role in servicing customers in the United Kingdom (8 per cent) and the United States (6 per cent). Licensing, franchising and joint ventures are not frequent choices for servicing customers in the markets that are most important to respondents.
Table 2-9 Mode of servicing for top ten overseas marketsSurvey question: What is the main mode of servicing for the top two countries from which they have earned international revenue in the past year?
Country directly from
Australia
through an agent or
distributor overseas
through an agent or
distributor in Australia
licensing and
franchising
foreign sales
branch or subsidiary
joint venture
online sales from third party
website
online sales
from own website
China 61% 18% 5% 1% 9% 5% 1% 1%India 40% 29% 5% 2% 17% 6% 0% 2%
Indonesia 51% 30% 5% 1% 6% 6% 0% 2%Japan 61% 27% 6% 1% 2% 2% 0% 0%
Malaysia 63% 17% 5% 1% 7% 6% 0% 1%New
Zealand74% 12% 2% 1% 7% 2% 0% 2%
Papua New Guinea
63% 16% 11% 0% 8% 2% 0% 0%
Singapore 69% 14% 2% 0% 10% 4% 0% 1%United States
53% 17% 1% 3% 15% 4% 2% 6%
United Kingdom
44% 20% 1% 4% 16% 5% 1% 8%
Note: the sample consists of companies that identify the above countries as either their top 1 or top 2 country from which they have earned international revenue in the past year.
27
The University of Sydney
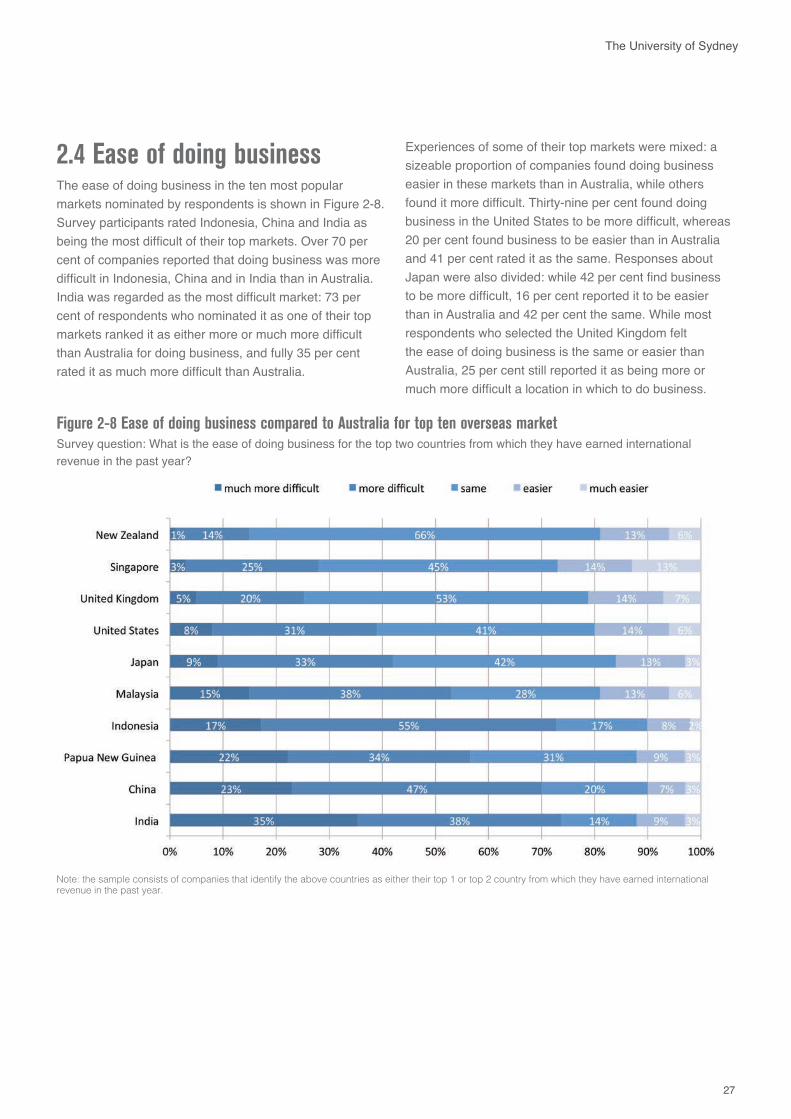
2.4 Ease of doing business The ease of doing business in the ten most popular markets nominated by respondents is shown in Figure 2-8. Survey participants rated Indonesia, China and India as being the most difficult of their top markets. Over 70 per cent of companies reported that doing business was more difficult in Indonesia, China and in India than in Australia. India was regarded as the most difficult market: 73 per cent of respondents who nominated it as one of their top markets ranked it as either more or much more difficult than Australia for doing business, and fully 35 per cent rated it as much more difficult than Australia.
Experiences of some of their top markets were mixed: a sizeable proportion of companies found doing business easier in these markets than in Australia, while others found it more difficult. Thirty-nine per cent found doing business in the United States to be more difficult, whereas 20 per cent found business to be easier than in Australia and 41 per cent rated it as the same. Responses about Japan were also divided: while 42 per cent find business to be more difficult, 16 per cent reported it to be easier than in Australia and 42 per cent the same. While most respondents who selected the United Kingdom felt the ease of doing business is the same or easier than Australia, 25 per cent still reported it as being more or much more difficult a location in which to do business.
Figure 2-8 Ease of doing business compared to Australia for top ten overseas marketSurvey question: What is the ease of doing business for the top two countries from which they have earned international revenue in the past year?
Note: the sample consists of companies that identify the above countries as either their top 1 or top 2 country from which they have earned international revenue in the past year.
28 | Export Council of Australia
Australia’s International Business Survey: 2015 Report
All of the companies that participated in the survey were asked to indicate which of their important markets is also the most difficult. The five countries most often selected as the most difficult are China (n=326), the United States (n=108), India (n=108), Indonesia (n=58) and Japan (n=36). In Section 3.1 those barriers most frequently cited as most significant are examined and then an analysis of the results by the five most difficult countries is conducted (Section 3.2). Following that a more detailed analysis of the components of the key factors involved is carried out (Section.3.3). Finally, the barriers faced by companies involved in establishing a foreign sales branch, subsidiary or joint venture are examined. (Section 3.4)
3.1 Most significant barriers
3. BARRIERS TO INTERNATIONAL OPERATIONS
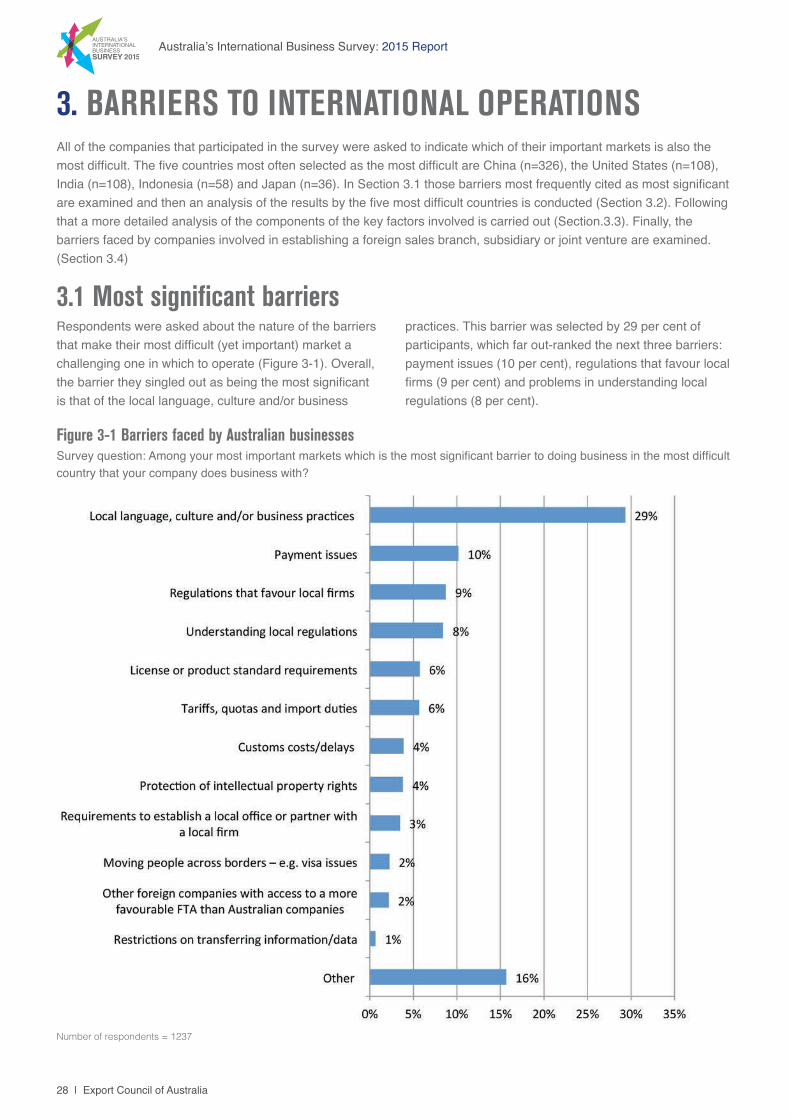
Respondents were asked about the nature of the barriers that make their most difficult (yet important) market a challenging one in which to operate (Figure 3-1). Overall, the barrier they singled out as being the most significant is that of the local language, culture and/or business
Figure 3-1 Barriers faced by Australian businessesSurvey question: Among your most important markets which is the most significant barrier to doing business in the most difficult country that your company does business with?
Number of respondents = 1237
practices. This barrier was selected by 29 per cent of participants, which far out-ranked the next three barriers: payment issues (10 per cent), regulations that favour local firms (9 per cent) and problems in understanding local regulations (8 per cent).
29
The University of Sydney
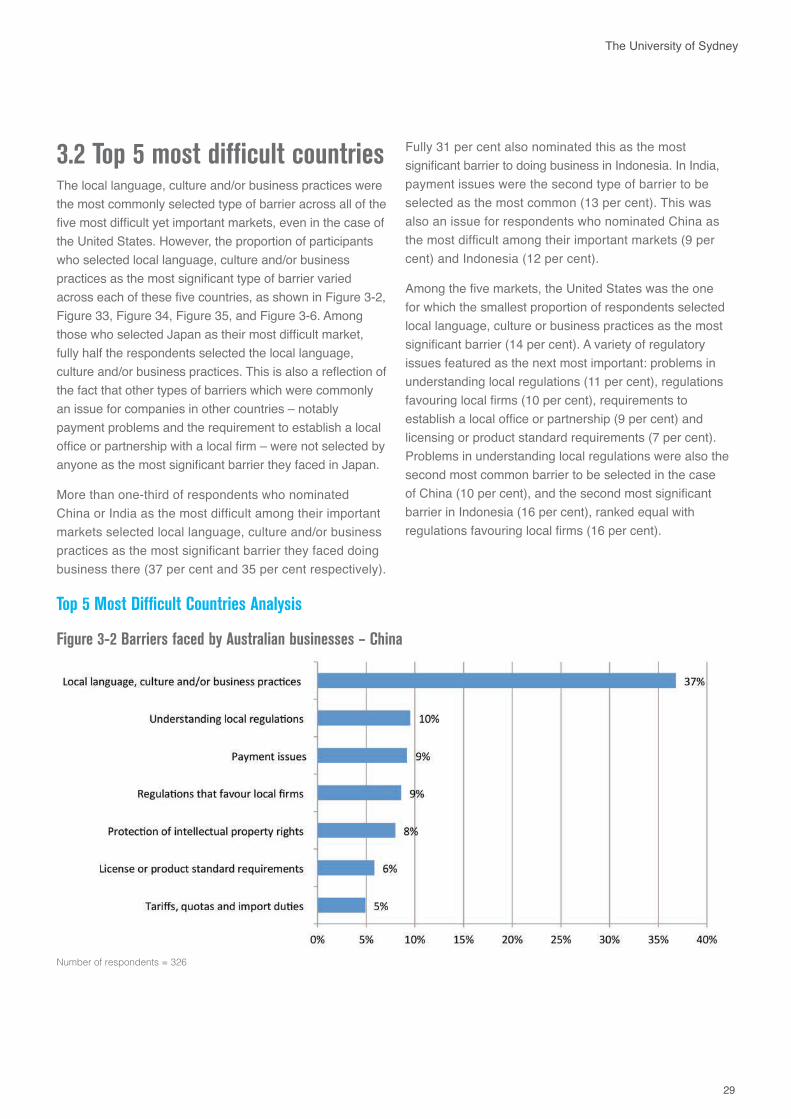
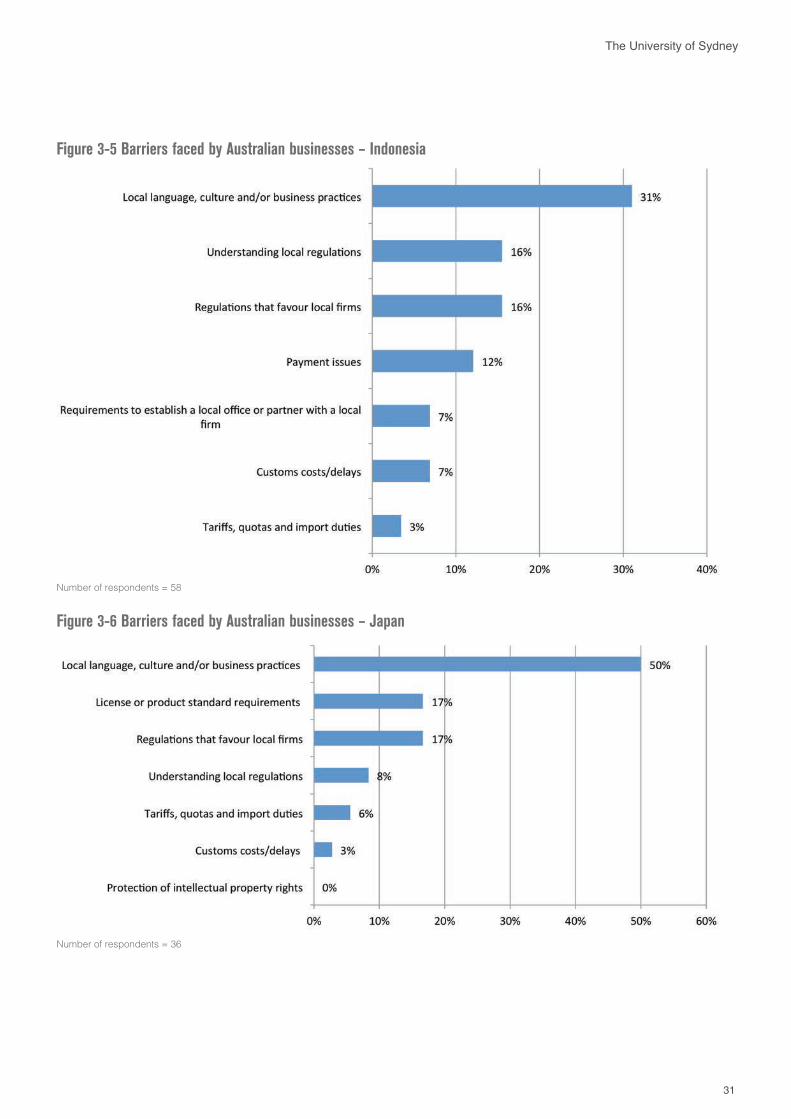
3.2 Top 5 most difficult countriesThe local language, culture and/or business practices were the most commonly selected type of barrier across all of the five most difficult yet important markets, even in the case of the United States. However, the proportion of participants who selected local language, culture and/or business practices as the most significant type of barrier varied across each of these five countries, as shown in Figure 3-2, Figure 33, Figure 34, Figure 35, and Figure 3-6. Among those who selected Japan as their most difficult market, fully half the respondents selected the local language, culture and/or business practices. This is also a reflection of the fact that other types of barriers which were commonly an issue for companies in other countries – notably payment problems and the requirement to establish a local office or partnership with a local firm – were not selected by anyone as the most significant barrier they faced in Japan.
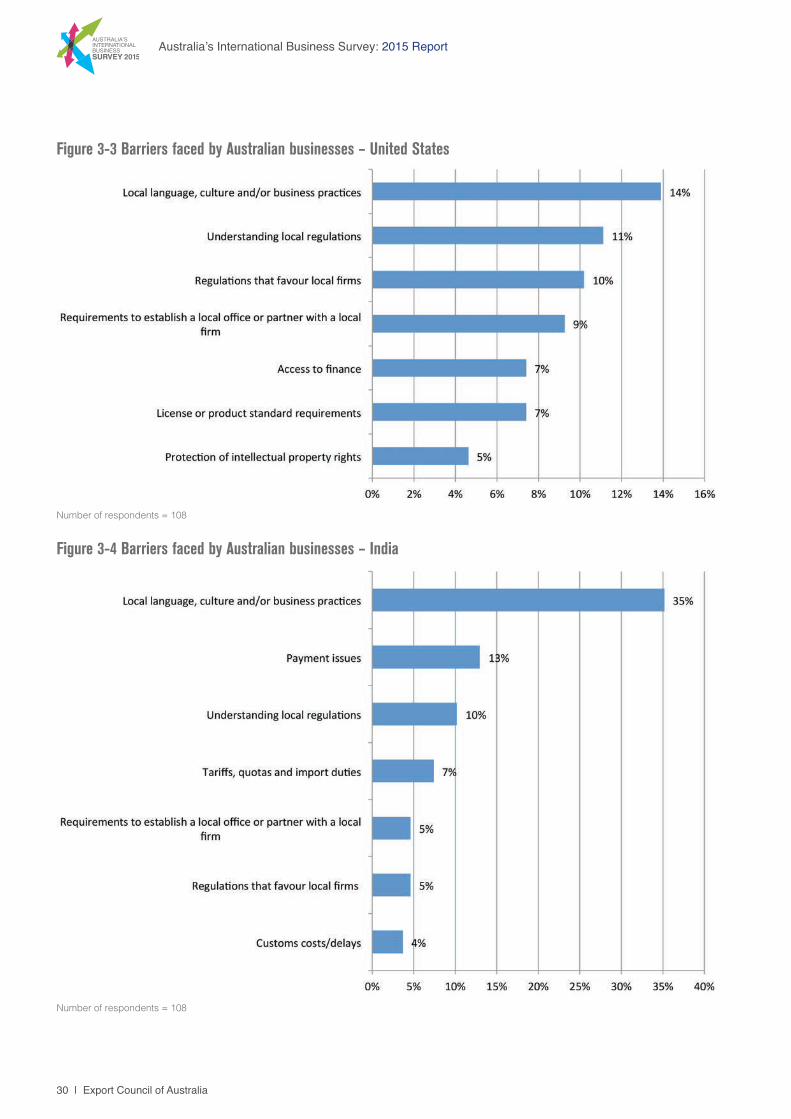
More than one-third of respondents who nominated China or India as the most difficult among their important markets selected local language, culture and/or business practices as the most significant barrier they faced doing business there (37 per cent and 35 per cent respectively).
Fully 31 per cent also nominated this as the most significant barrier to doing business in Indonesia. In India, payment issues were the second type of barrier to be selected as the most common (13 per cent). This was also an issue for respondents who nominated China as the most difficult among their important markets (9 per cent) and Indonesia (12 per cent).
Among the five markets, the United States was the one for which the smallest proportion of respondents selected local language, culture or business practices as the most significant barrier (14 per cent). A variety of regulatory issues featured as the next most important: problems in understanding local regulations (11 per cent), regulations favouring local firms (10 per cent), requirements to establish a local office or partnership (9 per cent) and licensing or product standard requirements (7 per cent). Problems in understanding local regulations were also the second most common barrier to be selected in the case of China (10 per cent), and the second most significant barrier in Indonesia (16 per cent), ranked equal with regulations favouring local firms (16 per cent).
Figure 3-2 Barriers faced by Australian businesses – China
Number of respondents = 326
Top 5 Most Difficult Countries Analysis
30 | Export Council of Australia
Australia’s International Business Survey: 2015 Report
Figure 3-3 Barriers faced by Australian businesses – United States
Number of respondents = 108
Figure 3-4 Barriers faced by Australian businesses – India
Number of respondents = 108
31
The University of Sydney
Figure 3-5 Barriers faced by Australian businesses – Indonesia
Number of respondents = 58
Figure 3-6 Barriers faced by Australian businesses – Japan
Number of respondents = 36
32 | Export Council of Australia
Australia’s International Business Survey: 2015 Report
3.3 Overall Analysis of Significant Barriers
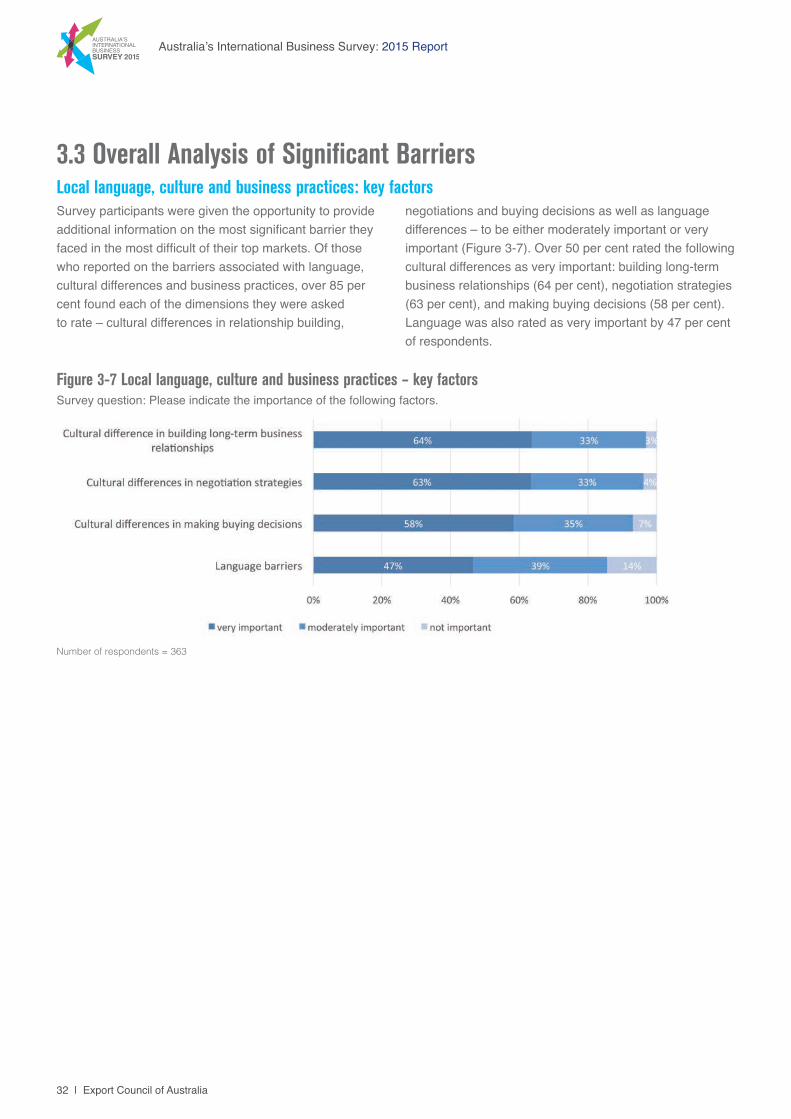
negotiations and buying decisions as well as language differences – to be either moderately important or very important (Figure 3-7). Over 50 per cent rated the following cultural differences as very important: building long-term business relationships (64 per cent), negotiation strategies (63 per cent), and making buying decisions (58 per cent). Language was also rated as very important by 47 per cent of respondents.
Survey participants were given the opportunity to provide additional information on the most significant barrier they faced in the most difficult of their top markets. Of those who reported on the barriers associated with language, cultural differences and business practices, over 85 per cent found each of the dimensions they were asked to rate – cultural differences in relationship building,
Figure 3-7 Local language, culture and business practices – key factorsSurvey question: Please indicate the importance of the following factors.
Number of respondents = 363
Local language, culture and business practices: key factors
33
The University of Sydney
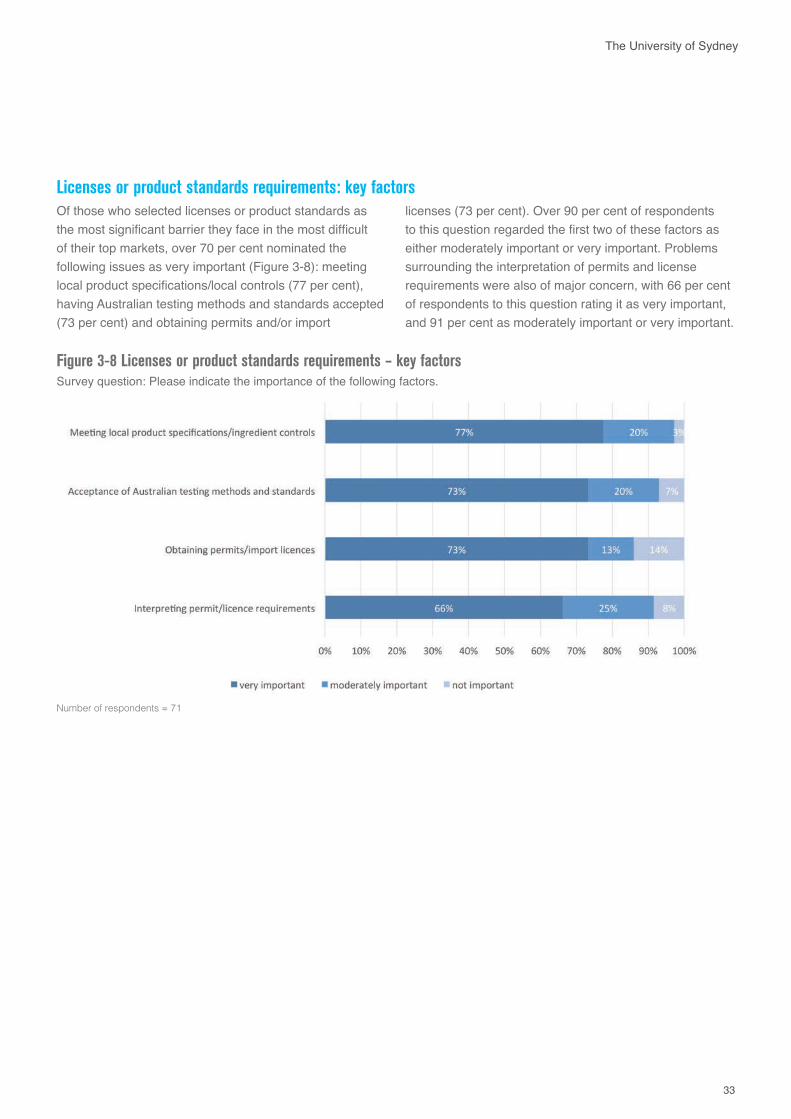
Licenses or product standards requirements: key factors
Figure 3-8 Licenses or product standards requirements – key factorsSurvey question: Please indicate the importance of the following factors.
Number of respondents = 71
Of those who selected licenses or product standards as the most significant barrier they face in the most difficult of their top markets, over 70 per cent nominated the following issues as very important (Figure 3-8): meeting local product specifications/local controls (77 per cent), having Australian testing methods and standards accepted (73 per cent) and obtaining permits and/or import
licenses (73 per cent). Over 90 per cent of respondents to this question regarded the first two of these factors as either moderately important or very important. Problems surrounding the interpretation of permits and license requirements were also of major concern, with 66 per cent of respondents to this question rating it as very important, and 91 per cent as moderately important or very important.
34 | Export Council of Australia
Australia’s International Business Survey: 2015 Report
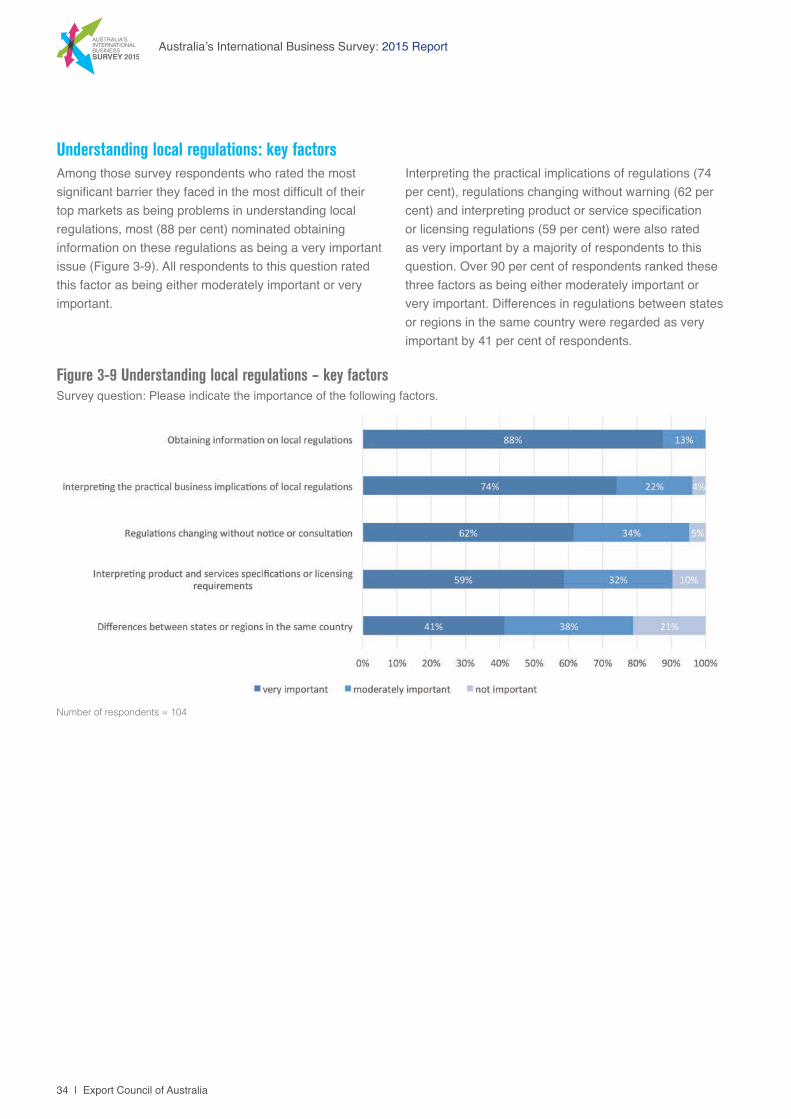
Understanding local regulations: key factorsInterpreting the practical implications of regulations (74 per cent), regulations changing without warning (62 per cent) and interpreting product or service specification or licensing regulations (59 per cent) were also rated as very important by a majority of respondents to this question. Over 90 per cent of respondents ranked these three factors as being either moderately important or very important. Differences in regulations between states or regions in the same country were regarded as very important by 41 per cent of respondents.
Among those survey respondents who rated the most significant barrier they faced in the most difficult of their top markets as being problems in understanding local regulations, most (88 per cent) nominated obtaining information on these regulations as being a very important issue (Figure 3-9). All respondents to this question rated this factor as being either moderately important or very important.
Figure 3-9 Understanding local regulations – key factorsSurvey question: Please indicate the importance of the following factors.
Number of respondents = 104
35
The University of Sydney
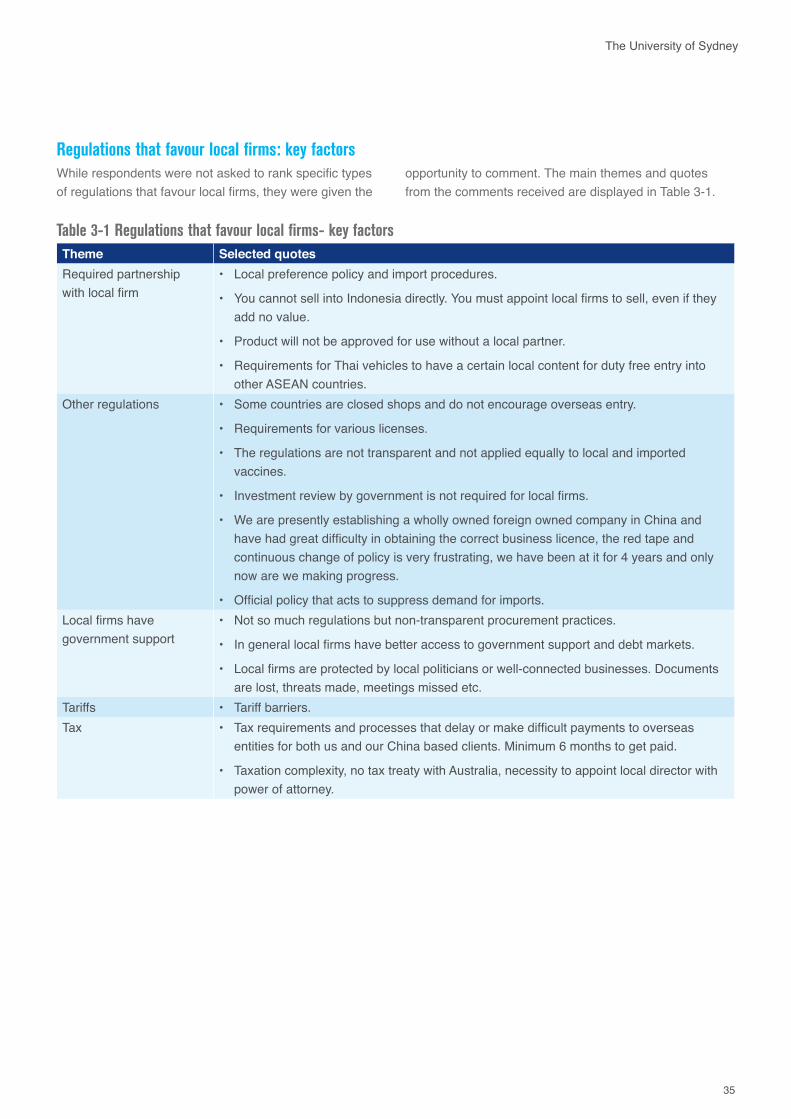
Regulations that favour local firms: key factors
Table 3-1 Regulations that favour local firms- key factorsTheme Selected quotes Required partnership with local firm
• Local preference policy and import procedures.
• You cannot sell into Indonesia directly. You must appoint local firms to sell, even if they add no value.
• Product will not be approved for use without a local partner.
• Requirements for Thai vehicles to have a certain local content for duty free entry into other ASEAN countries.
Other regulations • Some countries are closed shops and do not encourage overseas entry.
• Requirements for various licenses.
• The regulations are not transparent and not applied equally to local and imported vaccines.
• Investment review by government is not required for local firms.
• We are presently establishing a wholly owned foreign owned company in China and have had great difficulty in obtaining the correct business licence, the red tape and continuous change of policy is very frustrating, we have been at it for 4 years and only now are we making progress.
• Official policy that acts to suppress demand for imports.Local firms have government support
• Not so much regulations but non-transparent procurement practices.
• In general local firms have better access to government support and debt markets.
• Local firms are protected by local politicians or well-connected businesses. Documents are lost, threats made, meetings missed etc.
Tariffs • Tariff barriers.Tax • Tax requirements and processes that delay or make difficult payments to overseas
entities for both us and our China based clients. Minimum 6 months to get paid.
• Taxation complexity, no tax treaty with Australia, necessity to appoint local director with power of attorney.
While respondents were not asked to rank specific types of regulations that favour local firms, they were given the
opportunity to comment. The main themes and quotes from the comments received are displayed in Table 3-1.
36 | Export Council of Australia
Australia’s International Business Survey: 2015 Report
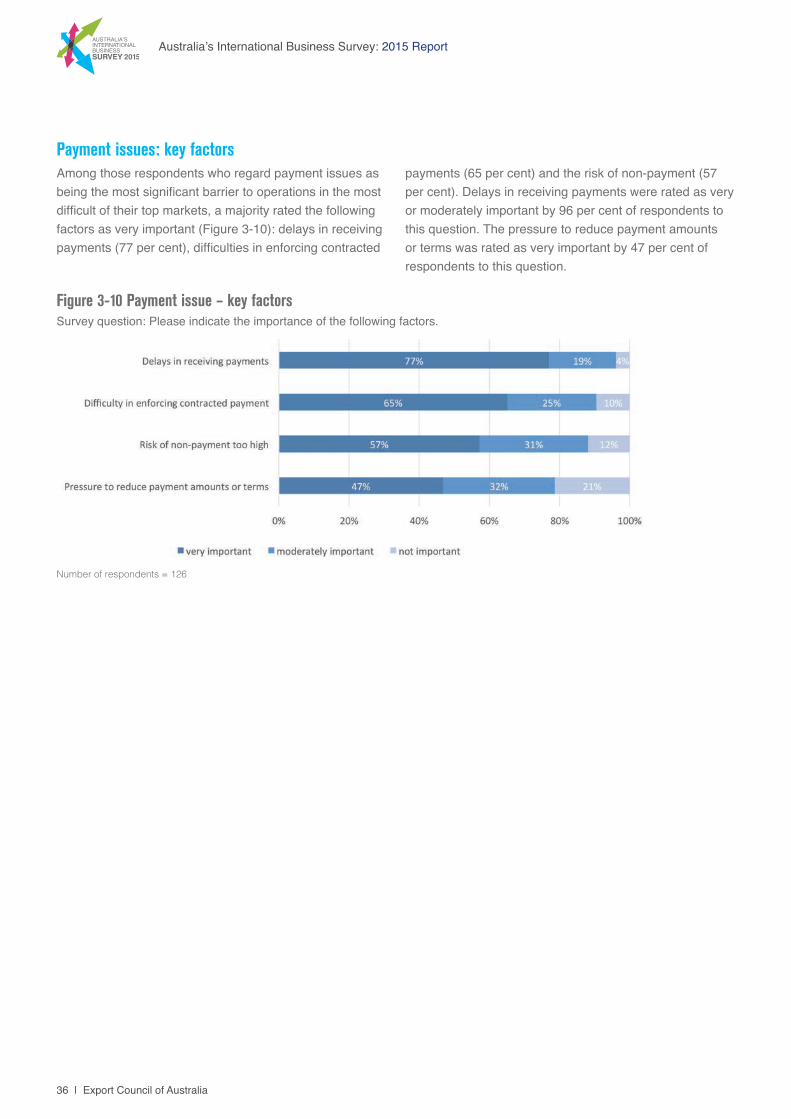
Payment issues: key factors
Figure 3-10 Payment issue – key factorsSurvey question: Please indicate the importance of the following factors.
Number of respondents = 126
Among those respondents who regard payment issues as being the most significant barrier to operations in the most difficult of their top markets, a majority rated the following factors as very important (Figure 3-10): delays in receiving payments (77 per cent), difficulties in enforcing contracted
payments (65 per cent) and the risk of non-payment (57 per cent). Delays in receiving payments were rated as very or moderately important by 96 per cent of respondents to this question. The pressure to reduce payment amounts or terms was rated as very important by 47 per cent of respondents to this question.
37
The University of Sydney
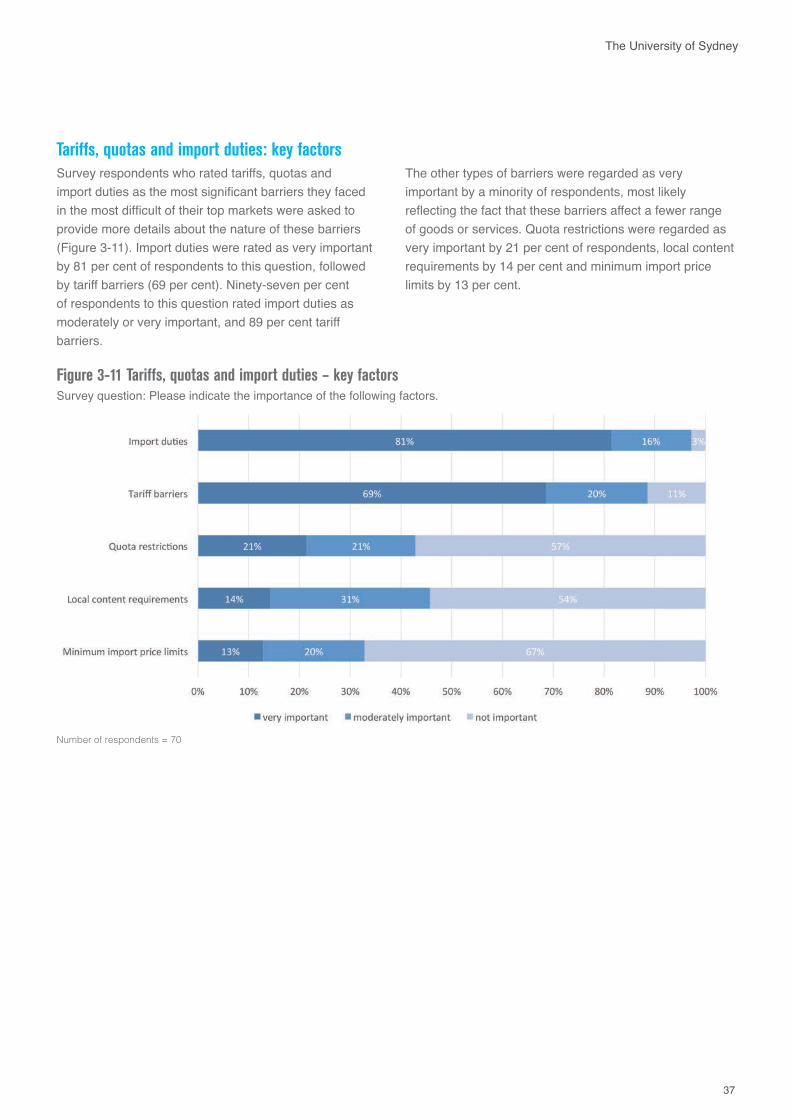
Tariffs, quotas and import duties: key factors
Figure 3-11 Tariffs, quotas and import duties – key factorsSurvey question: Please indicate the importance of the following factors.
Number of respondents = 70
Survey respondents who rated tariffs, quotas and import duties as the most significant barriers they faced in the most difficult of their top markets were asked to provide more details about the nature of these barriers (Figure 3-11). Import duties were rated as very important by 81 per cent of respondents to this question, followed by tariff barriers (69 per cent). Ninety-seven per cent of respondents to this question rated import duties as moderately or very important, and 89 per cent tariff barriers.
The other types of barriers were regarded as very important by a minority of respondents, most likely reflecting the fact that these barriers affect a fewer range of goods or services. Quota restrictions were regarded as very important by 21 per cent of respondents, local content requirements by 14 per cent and minimum import price limits by 13 per cent.
38 | Export Council of Australia
Australia’s International Business Survey: 2015 Report
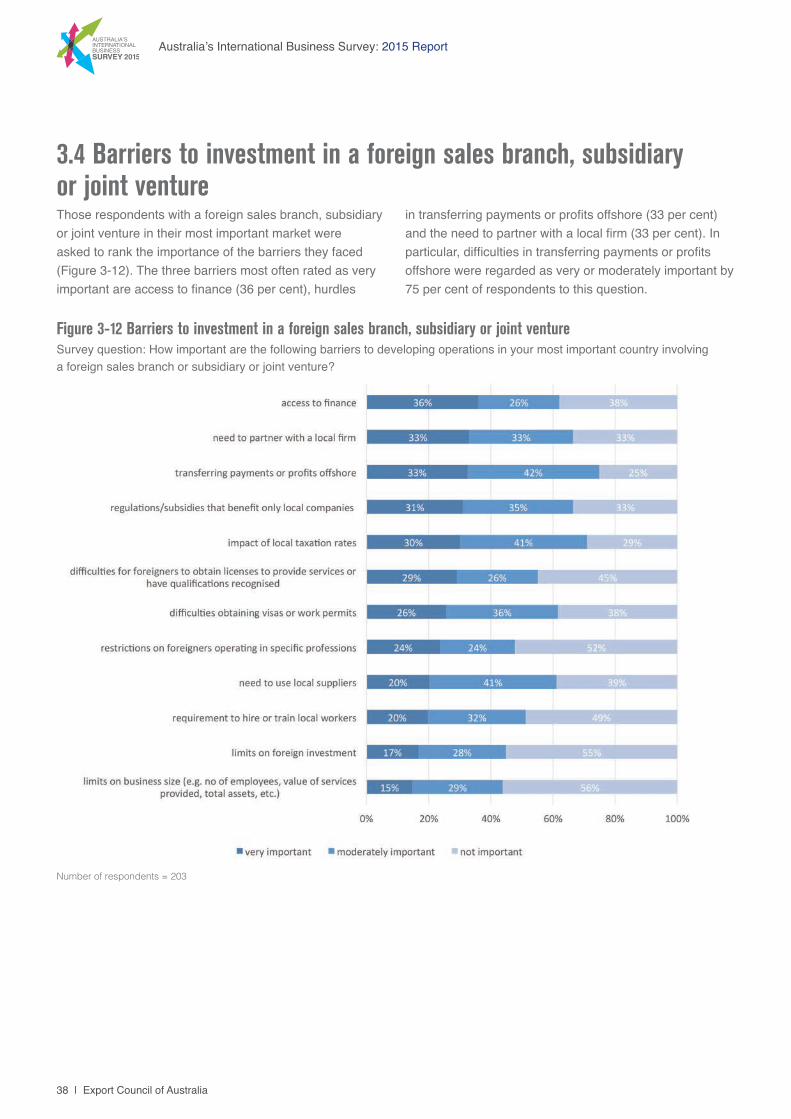
3.4 Barriers to investment in a foreign sales branch, subsidiary or joint ventureThose respondents with a foreign sales branch, subsidiary or joint venture in their most important market were asked to rank the importance of the barriers they faced (Figure 3-12). The three barriers most often rated as very important are access to finance (36 per cent), hurdles
in transferring payments or profits offshore (33 per cent) and the need to partner with a local firm (33 per cent). In particular, difficulties in transferring payments or profits offshore were regarded as very or moderately important by 75 per cent of respondents to this question.
Figure 3-12 Barriers to investment in a foreign sales branch, subsidiary or joint ventureSurvey question: How important are the following barriers to developing operations in your most important country involving a foreign sales branch or subsidiary or joint venture?
Number of respondents = 203
39
The University of Sydney
4. IMPACT OF FREE TRADE AGREEMENTSIn this section the responses to questions about the relevance of Free Trade Agreements and the extent to which they are made use of is examined (Section 4.1). A detailed industry analysis is also provided. Further, the demand for additional FTAs is reported on in Section 4.2.
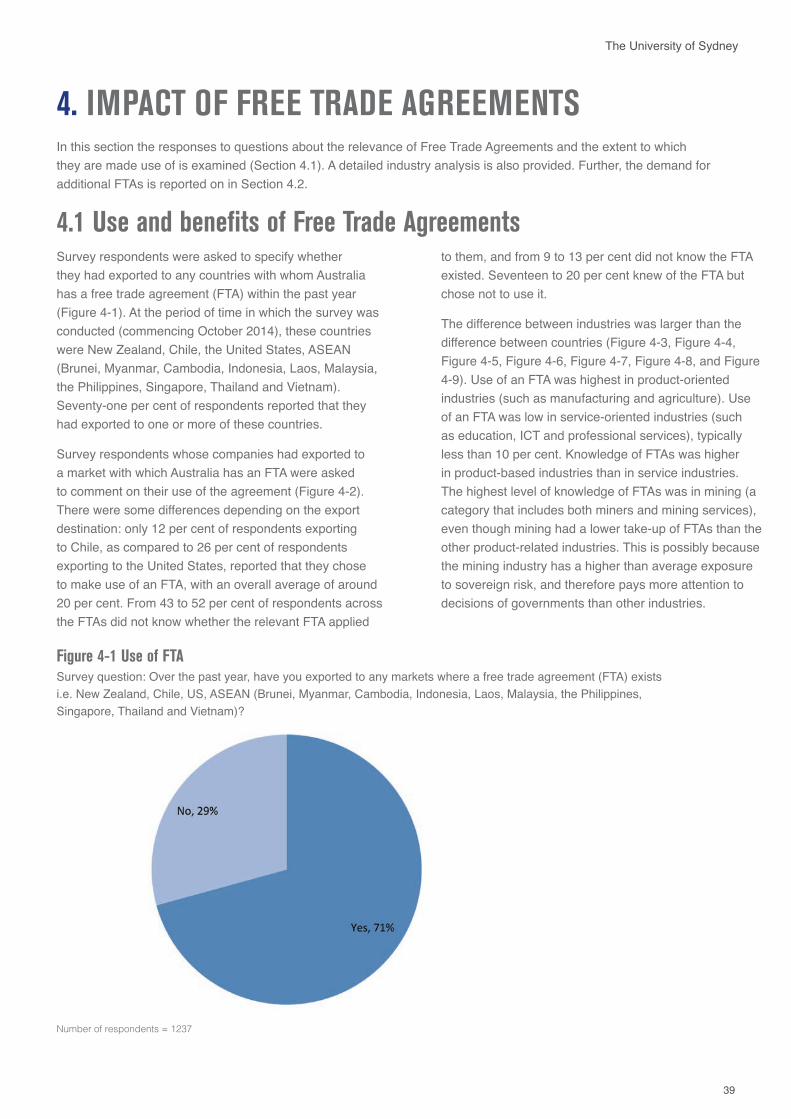
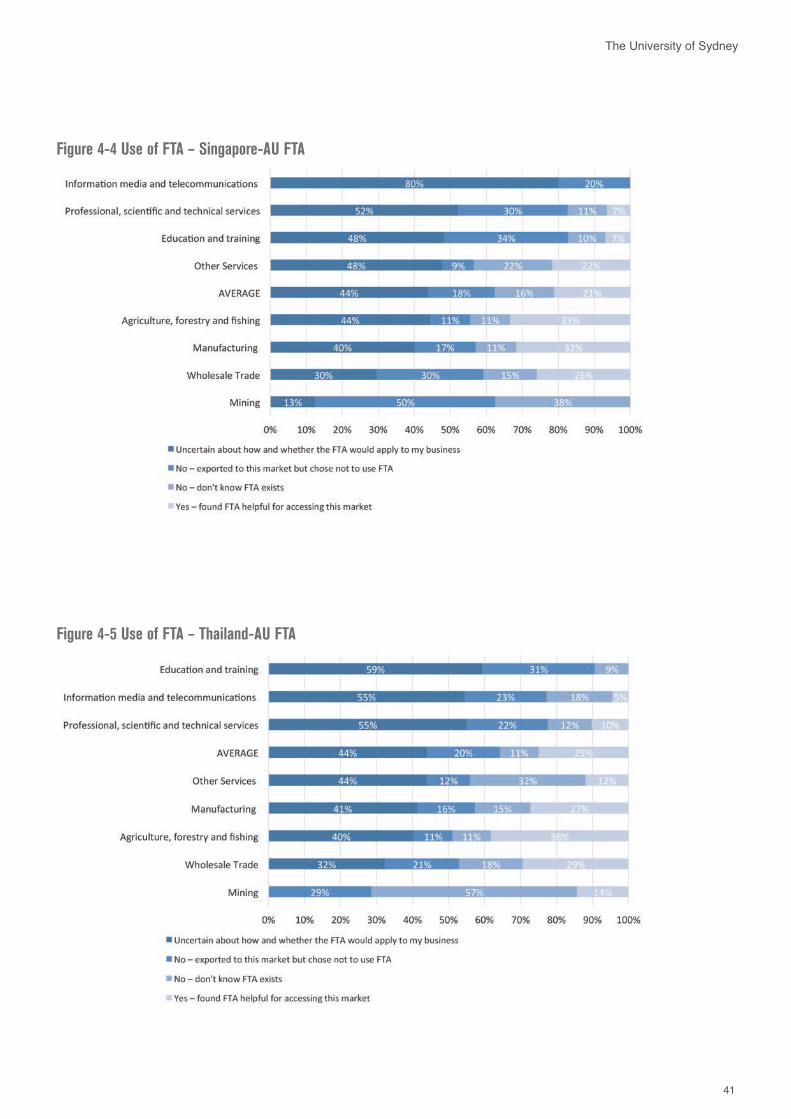
4.1 Use and benefits of Free Trade AgreementsSurvey respondents were asked to specify whether they had exported to any countries with whom Australia has a free trade agreement (FTA) within the past year (Figure 4-1). At the period of time in which the survey was conducted (commencing October 2014), these countries were New Zealand, Chile, the United States, ASEAN (Brunei, Myanmar, Cambodia, Indonesia, Laos, Malaysia, the Philippines, Singapore, Thailand and Vietnam). Seventy-one per cent of respondents reported that they had exported to one or more of these countries.
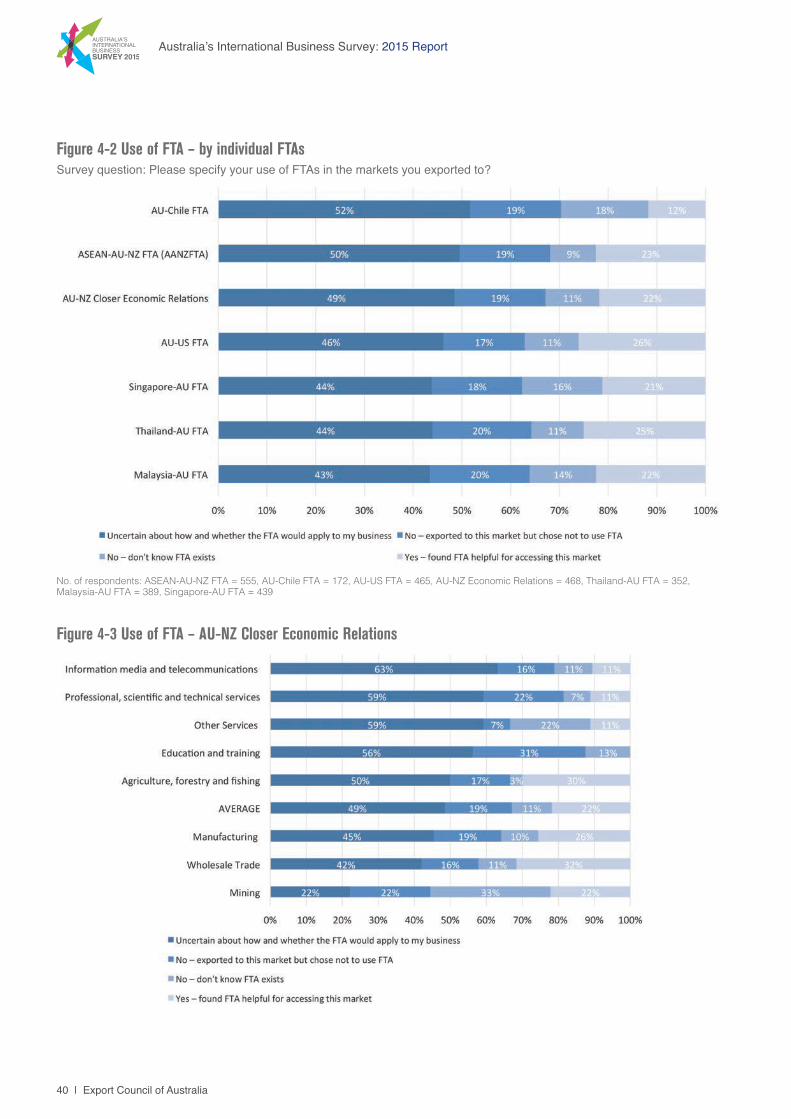
Survey respondents whose companies had exported to a market with which Australia has an FTA were asked to comment on their use of the agreement (Figure 4-2). There were some differences depending on the export destination: only 12 per cent of respondents exporting to Chile, as compared to 26 per cent of respondents exporting to the United States, reported that they chose to make use of an FTA, with an overall average of around 20 per cent. From 43 to 52 per cent of respondents across the FTAs did not know whether the relevant FTA applied
to them, and from 9 to 13 per cent did not know the FTA existed. Seventeen to 20 per cent knew of the FTA but chose not to use it.
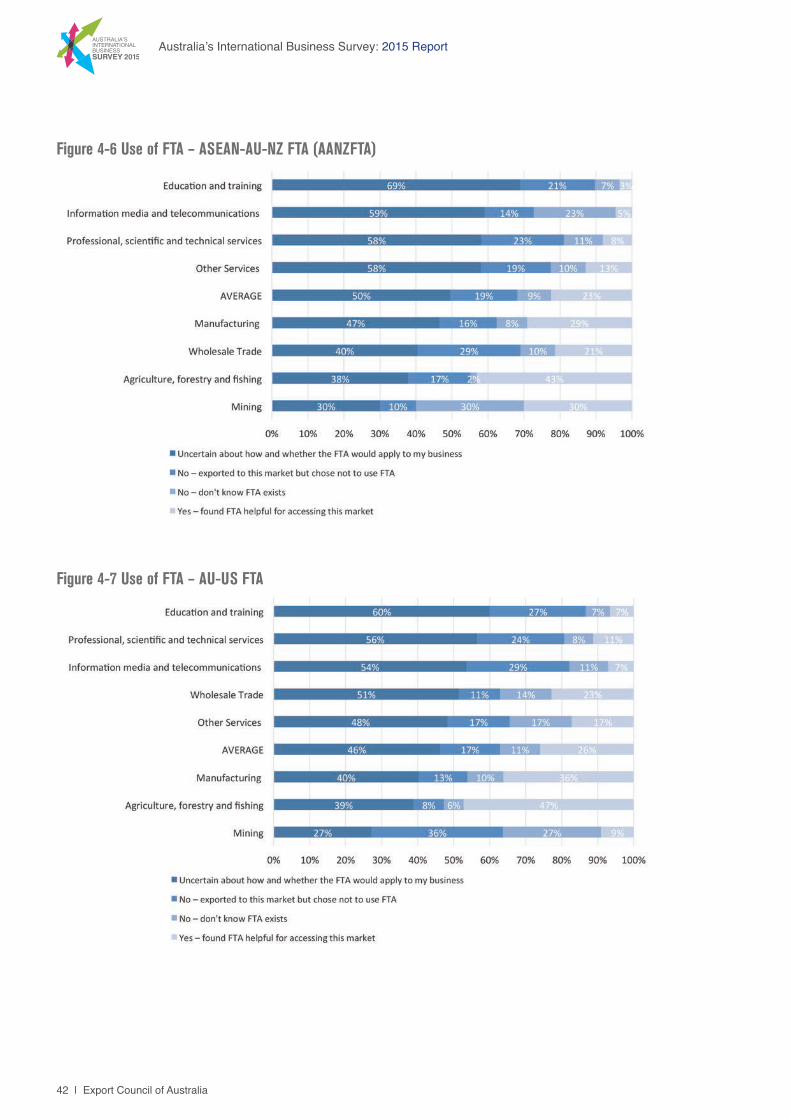
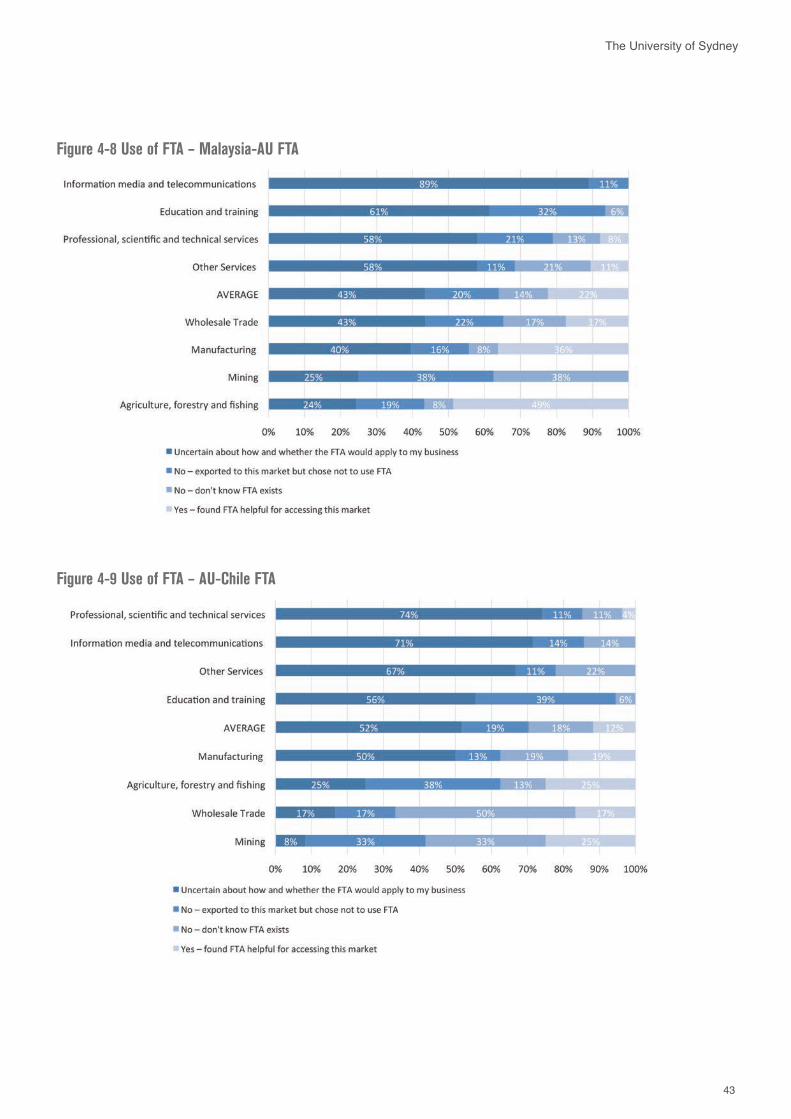
The difference between industries was larger than the difference between countries (Figure 4-3, Figure 4-4, Figure 4-5, Figure 4-6, Figure 4-7, Figure 4-8, and Figure 4-9). Use of an FTA was highest in product-oriented industries (such as manufacturing and agriculture). Use of an FTA was low in service-oriented industries (such as education, ICT and professional services), typically less than 10 per cent. Knowledge of FTAs was higher in product-based industries than in service industries. The highest level of knowledge of FTAs was in mining (a category that includes both miners and mining services), even though mining had a lower take-up of FTAs than the other product-related industries. This is possibly because the mining industry has a higher than average exposure to sovereign risk, and therefore pays more attention to decisions of governments than other industries.
Figure 4-1 Use of FTA Survey question: Over the past year, have you exported to any markets where a free trade agreement (FTA) exists i.e. New Zealand, Chile, US, ASEAN (Brunei, Myanmar, Cambodia, Indonesia, Laos, Malaysia, the Philippines, Singapore, Thailand and Vietnam)?
Number of respondents = 1237
40 | Export Council of Australia
Australia’s International Business Survey: 2015 Report
Figure 4-2 Use of FTA – by individual FTAsSurvey question: Please specify your use of FTAs in the markets you exported to?
No. of respondents: ASEAN-AU-NZ FTA = 555, AU-Chile FTA = 172, AU-US FTA = 465, AU-NZ Economic Relations = 468, Thailand-AU FTA = 352, Malaysia-AU FTA = 389, Singapore-AU FTA = 439
Figure 4-3 Use of FTA – AU-NZ Closer Economic Relations
41
The University of Sydney
Figure 4-4 Use of FTA – Singapore-AU FTA
Figure 4-5 Use of FTA – Thailand-AU FTA
42 | Export Council of Australia
Australia’s International Business Survey: 2015 Report
Figure 4-7 Use of FTA – AU-US FTA
Figure 4-6 Use of FTA – ASEAN-AU-NZ FTA (AANZFTA)
43
The University of Sydney
Figure 4-8 Use of FTA – Malaysia-AU FTA
Figure 4-9 Use of FTA – AU-Chile FTA
44 | Export Council of Australia
Australia’s International Business Survey: 2015 Report
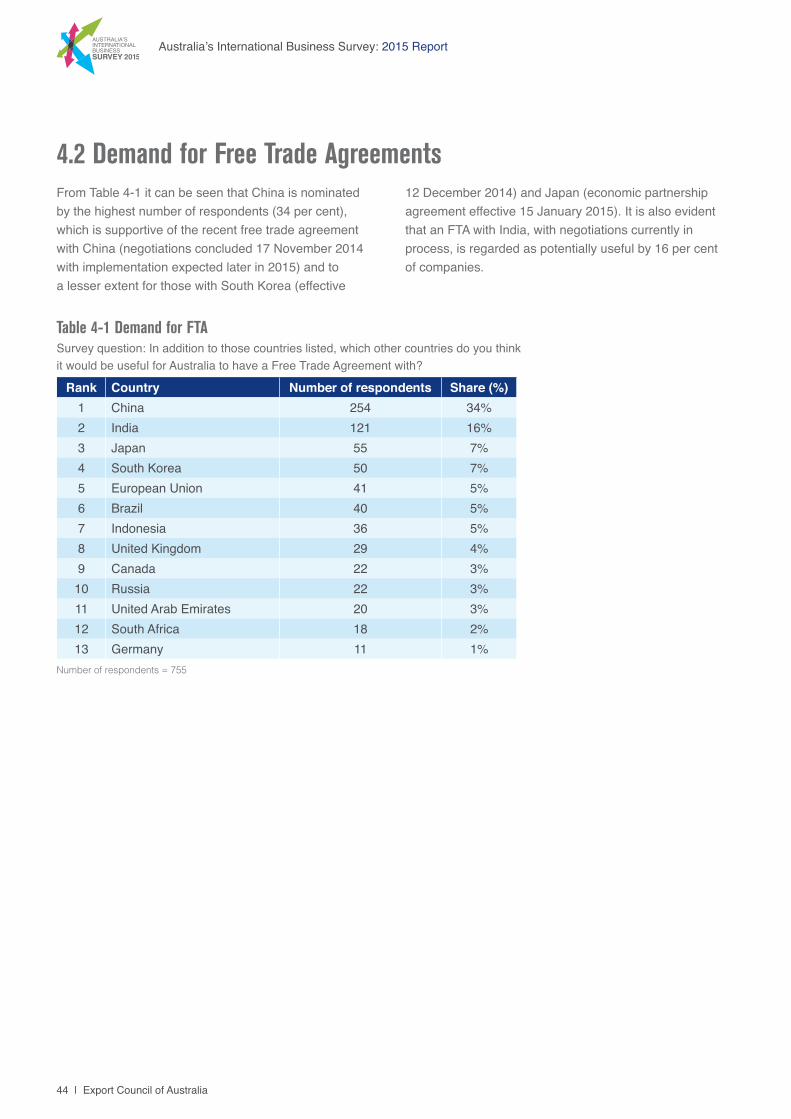
Table 4-1 Demand for FTASurvey question: In addition to those countries listed, which other countries do you think it would be useful for Australia to have a Free Trade Agreement with?
Rank Country Number of respondents Share (%)1 China 254 34%2 India 121 16%3 Japan 55 7%4 South Korea 50 7%5 European Union 41 5%6 Brazil 40 5%7 Indonesia 36 5%8 United Kingdom 29 4%9 Canada 22 3%10 Russia 22 3%11 United Arab Emirates 20 3%12 South Africa 18 2%13 Germany 11 1%
Number of respondents = 755
4.2 Demand for Free Trade Agreements From Table 4-1 it can be seen that China is nominated by the highest number of respondents (34 per cent), which is supportive of the recent free trade agreement with China (negotiations concluded 17 November 2014 with implementation expected later in 2015) and to a lesser extent for those with South Korea (effective
12 December 2014) and Japan (economic partnership agreement effective 15 January 2015). It is also evident that an FTA with India, with negotiations currently in process, is regarded as potentially useful by 16 per cent of companies.
45
The University of Sydney
5. MARKET DEVELOPMENT ACTIVITIESIn this section, the nature of market development activities undertaken by companies is examined (Section 5.1). The use and benefits of the Export Market Development Grant (EMDG) Scheme is also reported on in some detail, including an industry analysis (Section 5.2).
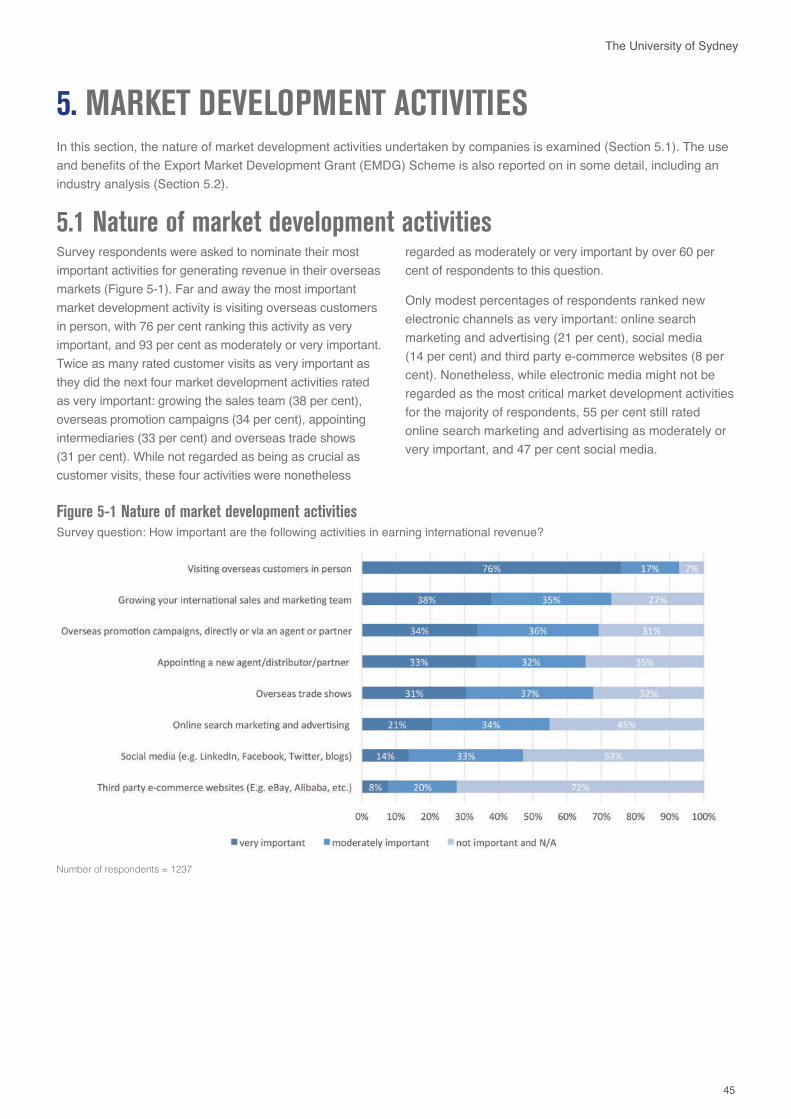
5.1 Nature of market development activitiesSurvey respondents were asked to nominate their most important activities for generating revenue in their overseas markets (Figure 5-1). Far and away the most important market development activity is visiting overseas customers in person, with 76 per cent ranking this activity as very important, and 93 per cent as moderately or very important. Twice as many rated customer visits as very important as they did the next four market development activities rated as very important: growing the sales team (38 per cent), overseas promotion campaigns (34 per cent), appointing intermediaries (33 per cent) and overseas trade shows (31 per cent). While not regarded as being as crucial as customer visits, these four activities were nonetheless
regarded as moderately or very important by over 60 per cent of respondents to this question.
Only modest percentages of respondents ranked new electronic channels as very important: online search marketing and advertising (21 per cent), social media (14 per cent) and third party e-commerce websites (8 per cent). Nonetheless, while electronic media might not be regarded as the most critical market development activities for the majority of respondents, 55 per cent still rated online search marketing and advertising as moderately or very important, and 47 per cent social media.
Figure 5-1 Nature of market development activities Survey question: How important are the following activities in earning international revenue?
Number of respondents = 1237
46 | Export Council of Australia
Australia’s International Business Survey: 2015 Report
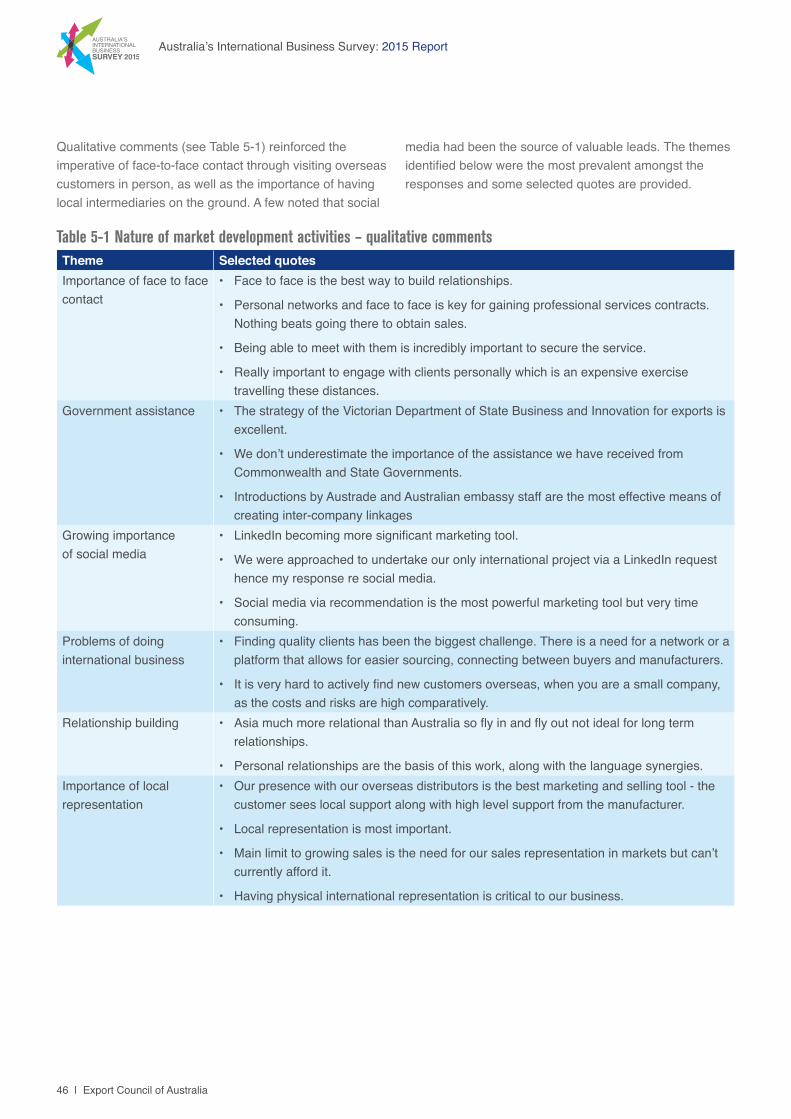
Qualitative comments (see Table 5-1) reinforced the imperative of face-to-face contact through visiting overseas customers in person, as well as the importance of having local intermediaries on the ground. A few noted that social
media had been the source of valuable leads. The themes identified below were the most prevalent amongst the responses and some selected quotes are provided.
Table 5-1 Nature of market development activities – qualitative comments Theme Selected quotesImportance of face to face contact
• Face to face is the best way to build relationships.
• Personal networks and face to face is key for gaining professional services contracts. Nothing beats going there to obtain sales.
• Being able to meet with them is incredibly important to secure the service.
• Really important to engage with clients personally which is an expensive exercise travelling these distances.
Government assistance • The strategy of the Victorian Department of State Business and Innovation for exports is excellent.
• We don’t underestimate the importance of the assistance we have received from Commonwealth and State Governments.
• Introductions by Austrade and Australian embassy staff are the most effective means of creating inter-company linkages
Growing importance of social media
• LinkedIn becoming more significant marketing tool.
• We were approached to undertake our only international project via a LinkedIn request hence my response re social media.
• Social media via recommendation is the most powerful marketing tool but very time consuming.
Problems of doing international business
• Finding quality clients has been the biggest challenge. There is a need for a network or a platform that allows for easier sourcing, connecting between buyers and manufacturers.
• It is very hard to actively find new customers overseas, when you are a small company, as the costs and risks are high comparatively.
Relationship building • Asia much more relational than Australia so fly in and fly out not ideal for long term relationships.
• Personal relationships are the basis of this work, along with the language synergies.Importance of local representation
• Our presence with our overseas distributors is the best marketing and selling tool - the customer sees local support along with high level support from the manufacturer.
• Local representation is most important.
• Main limit to growing sales is the need for our sales representation in markets but can’t currently afford it.
• Having physical international representation is critical to our business.
47
The University of Sydney
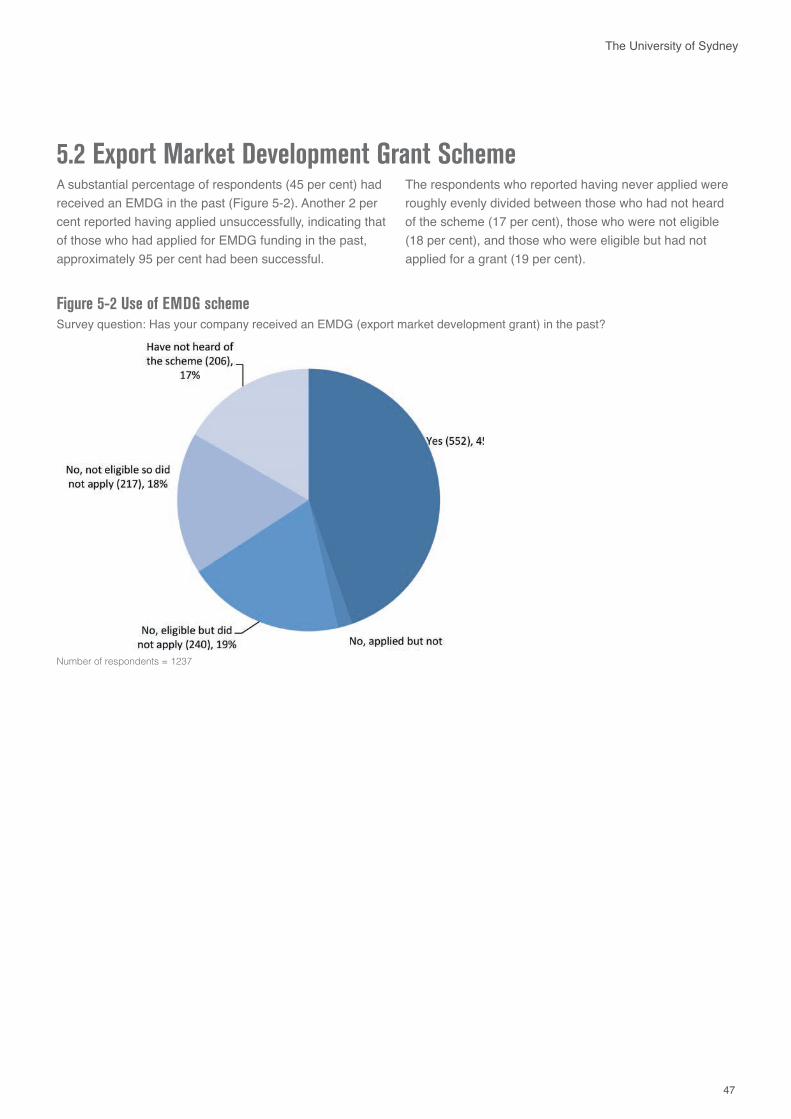
5.2 Export Market Development Grant SchemeA substantial percentage of respondents (45 per cent) had received an EMDG in the past (Figure 5-2). Another 2 per cent reported having applied unsuccessfully, indicating that of those who had applied for EMDG funding in the past, approximately 95 per cent had been successful.
The respondents who reported having never applied were roughly evenly divided between those who had not heard of the scheme (17 per cent), those who were not eligible (18 per cent), and those who were eligible but had not applied for a grant (19 per cent).
Figure 5-2 Use of EMDG scheme Survey question: Has your company received an EMDG (export market development grant) in the past?
Number of respondents = 1237
48 | Export Council of Australia
Australia’s International Business Survey: 2015 Report
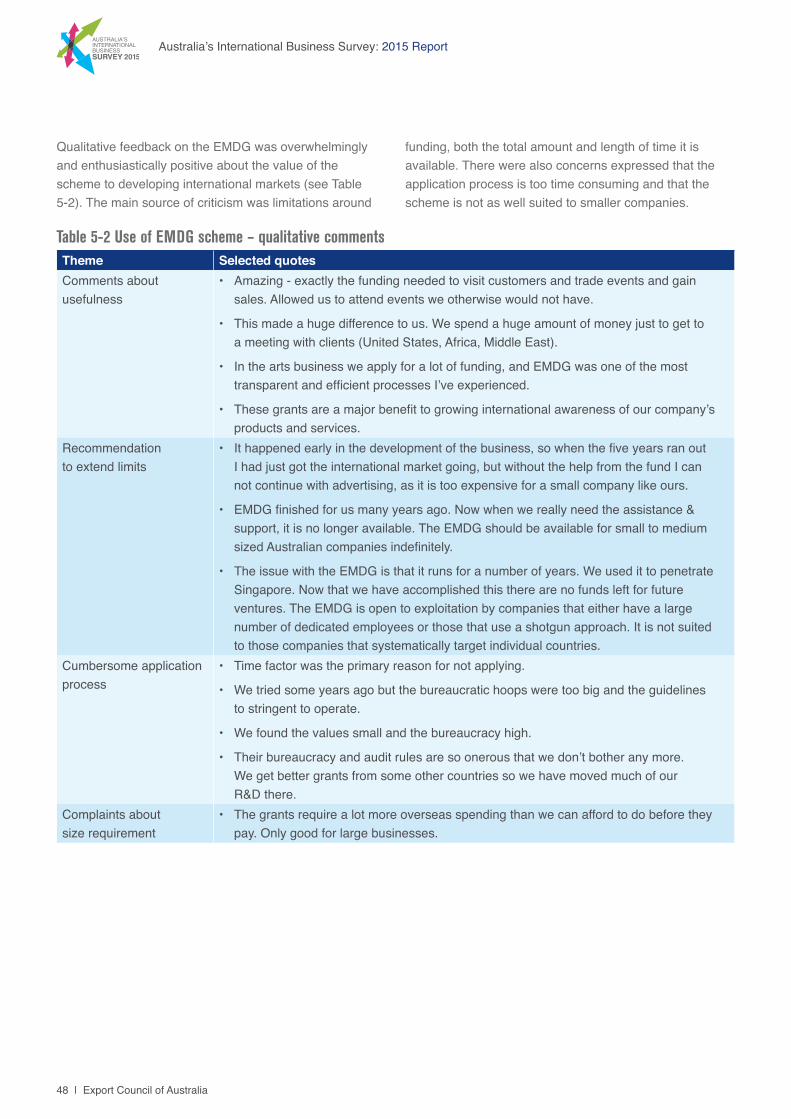
Qualitative feedback on the EMDG was overwhelmingly and enthusiastically positive about the value of the scheme to developing international markets (see Table 5-2). The main source of criticism was limitations around
funding, both the total amount and length of time it is available. There were also concerns expressed that the application process is too time consuming and that the scheme is not as well suited to smaller companies.
Table 5-2 Use of EMDG scheme – qualitative comments Theme Selected quotesComments about usefulness
• Amazing - exactly the funding needed to visit customers and trade events and gain sales. Allowed us to attend events we otherwise would not have.
• This made a huge difference to us. We spend a huge amount of money just to get to a meeting with clients (United States, Africa, Middle East).
• In the arts business we apply for a lot of funding, and EMDG was one of the most transparent and efficient processes I’ve experienced.
• These grants are a major benefit to growing international awareness of our company’s products and services.
Recommendation to extend limits
• It happened early in the development of the business, so when the five years ran out I had just got the international market going, but without the help from the fund I can not continue with advertising, as it is too expensive for a small company like ours.
• EMDG finished for us many years ago. Now when we really need the assistance & support, it is no longer available. The EMDG should be available for small to medium sized Australian companies indefinitely.
• The issue with the EMDG is that it runs for a number of years. We used it to penetrate Singapore. Now that we have accomplished this there are no funds left for future ventures. The EMDG is open to exploitation by companies that either have a large number of dedicated employees or those that use a shotgun approach. It is not suited to those companies that systematically target individual countries.
Cumbersome application process
• Time factor was the primary reason for not applying.
• We tried some years ago but the bureaucratic hoops were too big and the guidelines to stringent to operate.
• We found the values small and the bureaucracy high.
• Their bureaucracy and audit rules are so onerous that we don’t bother any more. We get better grants from some other countries so we have moved much of our R&D there.
Complaints about size requirement
• The grants require a lot more overseas spending than we can afford to do before they pay. Only good for large businesses.
49
The University of Sydney
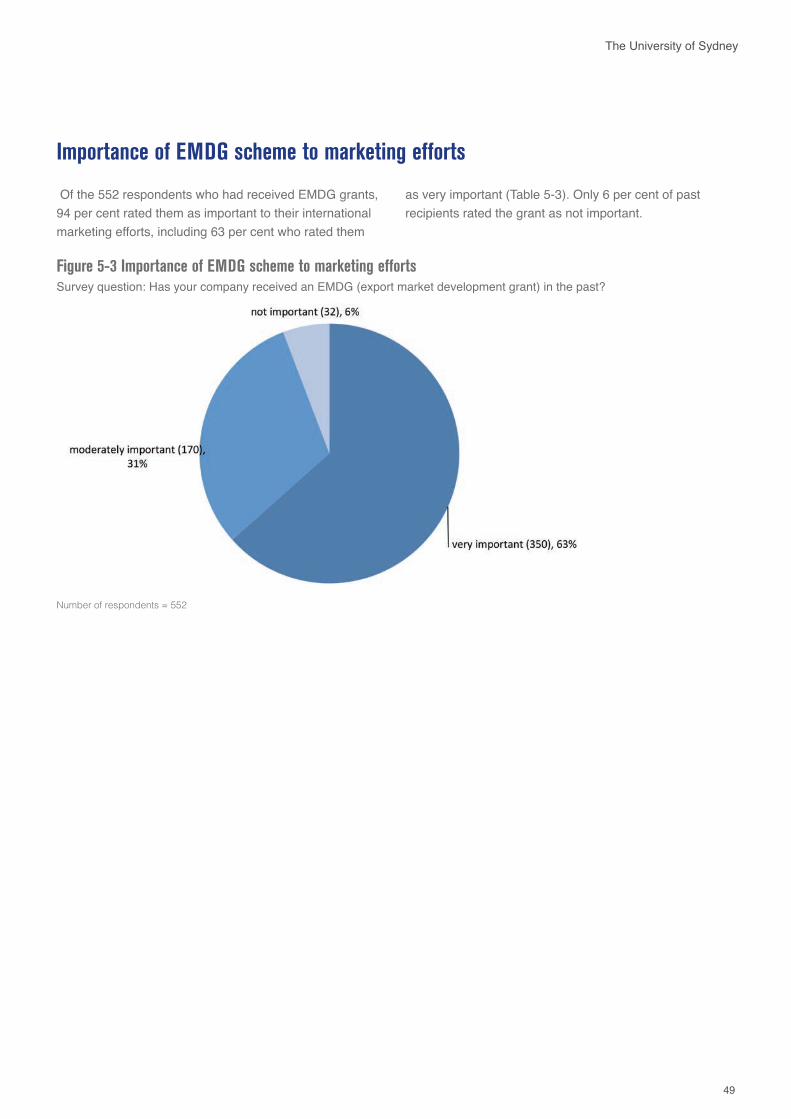
Importance of EMDG scheme to marketing efforts
Figure 5-3 Importance of EMDG scheme to marketing effortsSurvey question: Has your company received an EMDG (export market development grant) in the past?
Number of respondents = 552
Of the 552 respondents who had received EMDG grants, 94 per cent rated them as important to their international marketing efforts, including 63 per cent who rated them
as very important (Table 5-3). Only 6 per cent of past recipients rated the grant as not important.
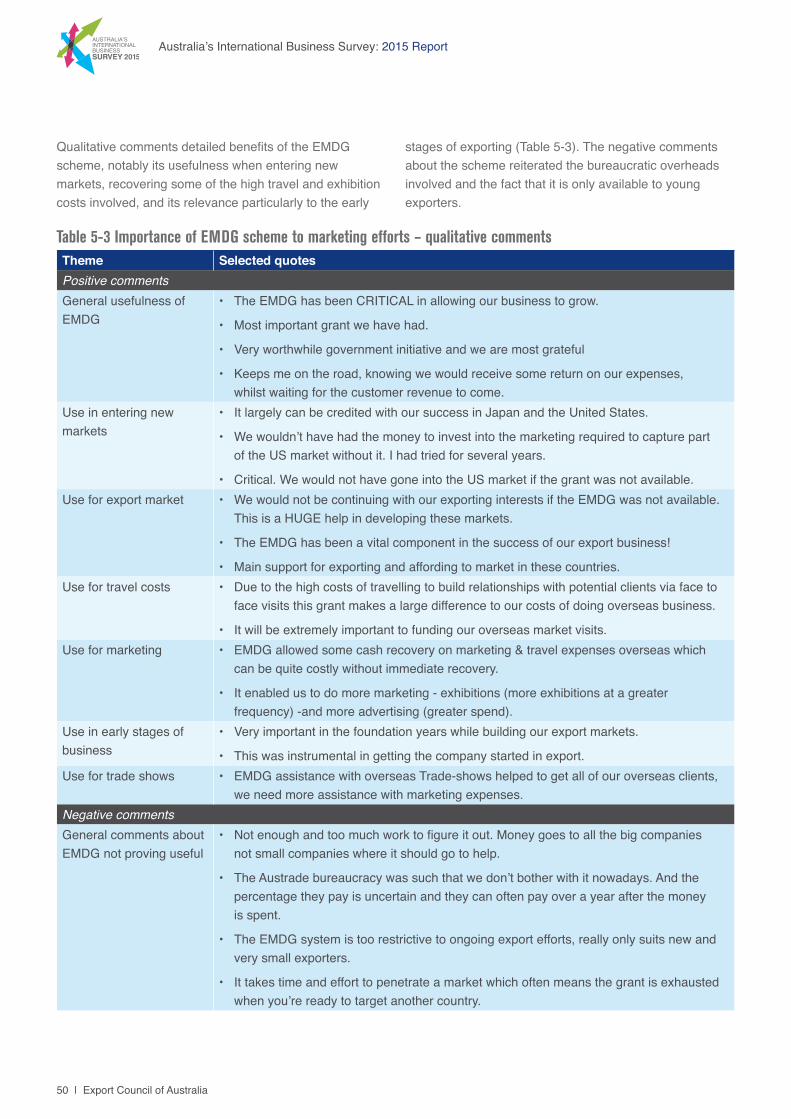
50 | Export Council of Australia
Australia’s International Business Survey: 2015 Report
Table 5-3 Importance of EMDG scheme to marketing efforts – qualitative comments Theme Selected quotesPositive commentsGeneral usefulness of EMDG
• The EMDG has been CRITICAL in allowing our business to grow.
• Most important grant we have had.
• Very worthwhile government initiative and we are most grateful
• Keeps me on the road, knowing we would receive some return on our expenses, whilst waiting for the customer revenue to come.
Use in entering new markets
• It largely can be credited with our success in Japan and the United States.
• We wouldn’t have had the money to invest into the marketing required to capture part of the US market without it. I had tried for several years.
• Critical. We would not have gone into the US market if the grant was not available.Use for export market • We would not be continuing with our exporting interests if the EMDG was not available.
This is a HUGE help in developing these markets.
• The EMDG has been a vital component in the success of our export business!
• Main support for exporting and affording to market in these countries.Use for travel costs • Due to the high costs of travelling to build relationships with potential clients via face to
face visits this grant makes a large difference to our costs of doing overseas business.
• It will be extremely important to funding our overseas market visits.Use for marketing • EMDG allowed some cash recovery on marketing & travel expenses overseas which
can be quite costly without immediate recovery.
• It enabled us to do more marketing - exhibitions (more exhibitions at a greater frequency) -and more advertising (greater spend).
Use in early stages of business
• Very important in the foundation years while building our export markets.
• This was instrumental in getting the company started in export.Use for trade shows • EMDG assistance with overseas Trade-shows helped to get all of our overseas clients,
we need more assistance with marketing expenses.Negative comments General comments about EMDG not proving useful
• Not enough and too much work to figure it out. Money goes to all the big companies not small companies where it should go to help.
• The Austrade bureaucracy was such that we don’t bother with it nowadays. And the percentage they pay is uncertain and they can often pay over a year after the money is spent.
• The EMDG system is too restrictive to ongoing export efforts, really only suits new and very small exporters.
• It takes time and effort to penetrate a market which often means the grant is exhausted when you’re ready to target another country.
Qualitative comments detailed benefits of the EMDG scheme, notably its usefulness when entering new markets, recovering some of the high travel and exhibition costs involved, and its relevance particularly to the early
stages of exporting (Table 5-3). The negative comments about the scheme reiterated the bureaucratic overheads involved and the fact that it is only available to young exporters.
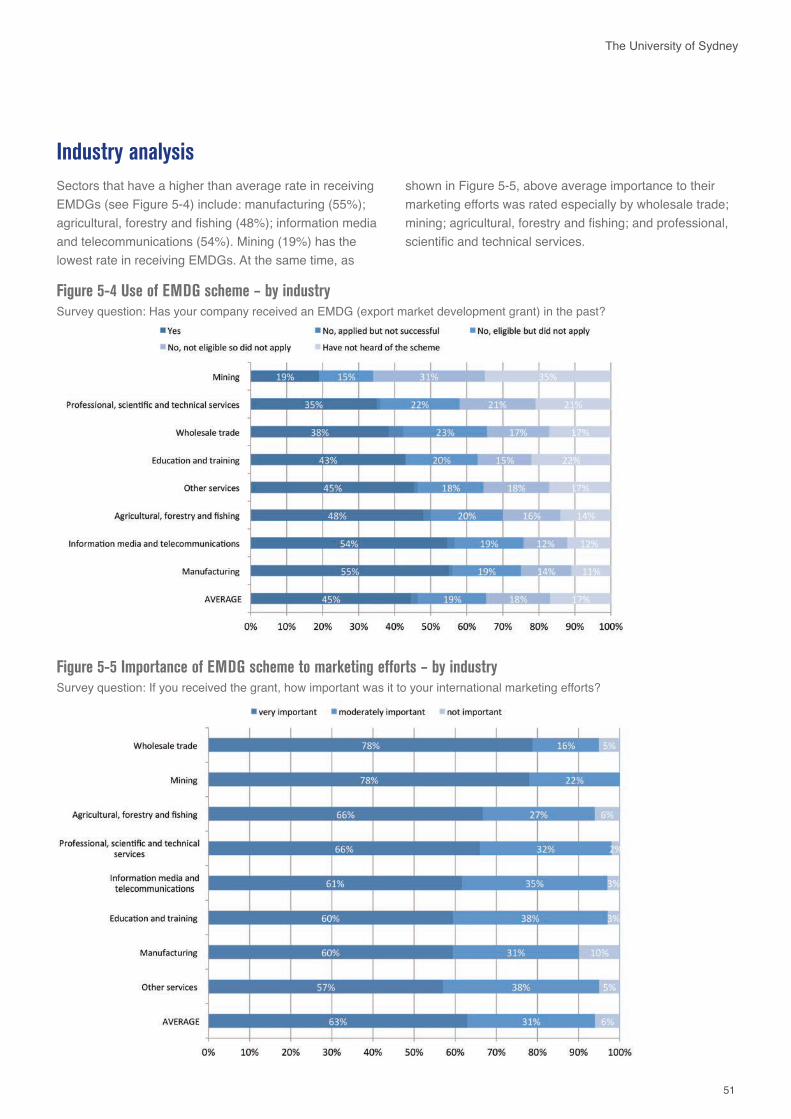
51
The University of Sydney
Industry analysisSectors that have a higher than average rate in receiving EMDGs (see Figure 5-4) include: manufacturing (55%); agricultural, forestry and fishing (48%); information media and telecommunications (54%). Mining (19%) has the lowest rate in receiving EMDGs. At the same time, as
shown in Figure 5-5, above average importance to their marketing efforts was rated especially by wholesale trade; mining; agricultural, forestry and fishing; and professional, scientific and technical services.
Figure 5-4 Use of EMDG scheme – by industrySurvey question: Has your company received an EMDG (export market development grant) in the past?
Figure 5-5 Importance of EMDG scheme to marketing efforts – by industry Survey question: If you received the grant, how important was it to your international marketing efforts?
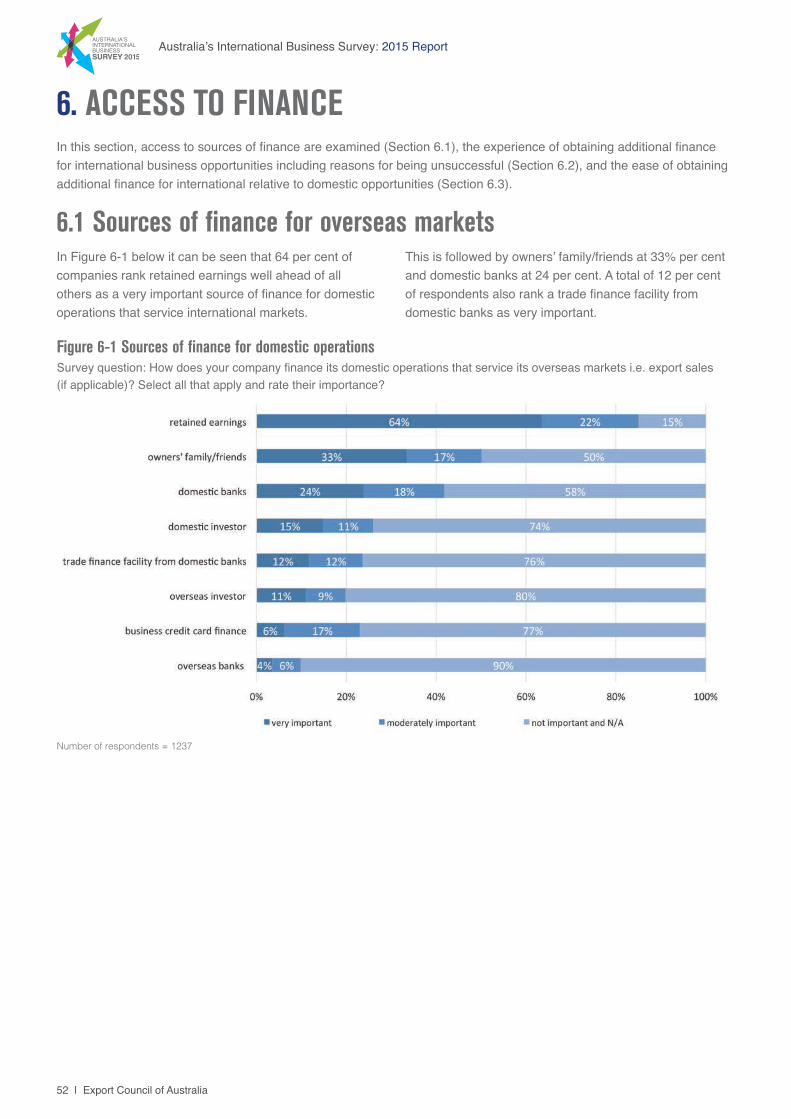
52 | Export Council of Australia
Australia’s International Business Survey: 2015 Report
6. ACCESS TO FINANCEIn this section, access to sources of finance are examined (Section 6.1), the experience of obtaining additional finance for international business opportunities including reasons for being unsuccessful (Section 6.2), and the ease of obtaining additional finance for international relative to domestic opportunities (Section 6.3).
6.1 Sources of finance for overseas marketsIn Figure 6-1 below it can be seen that 64 per cent of companies rank retained earnings well ahead of all others as a very important source of finance for domestic operations that service international markets.
This is followed by owners’ family/friends at 33% per cent and domestic banks at 24 per cent. A total of 12 per cent of respondents also rank a trade finance facility from domestic banks as very important.
Figure 6-1 Sources of finance for domestic operations Survey question: How does your company finance its domestic operations that service its overseas markets i.e. export sales (if applicable)? Select all that apply and rate their importance?
Number of respondents = 1237
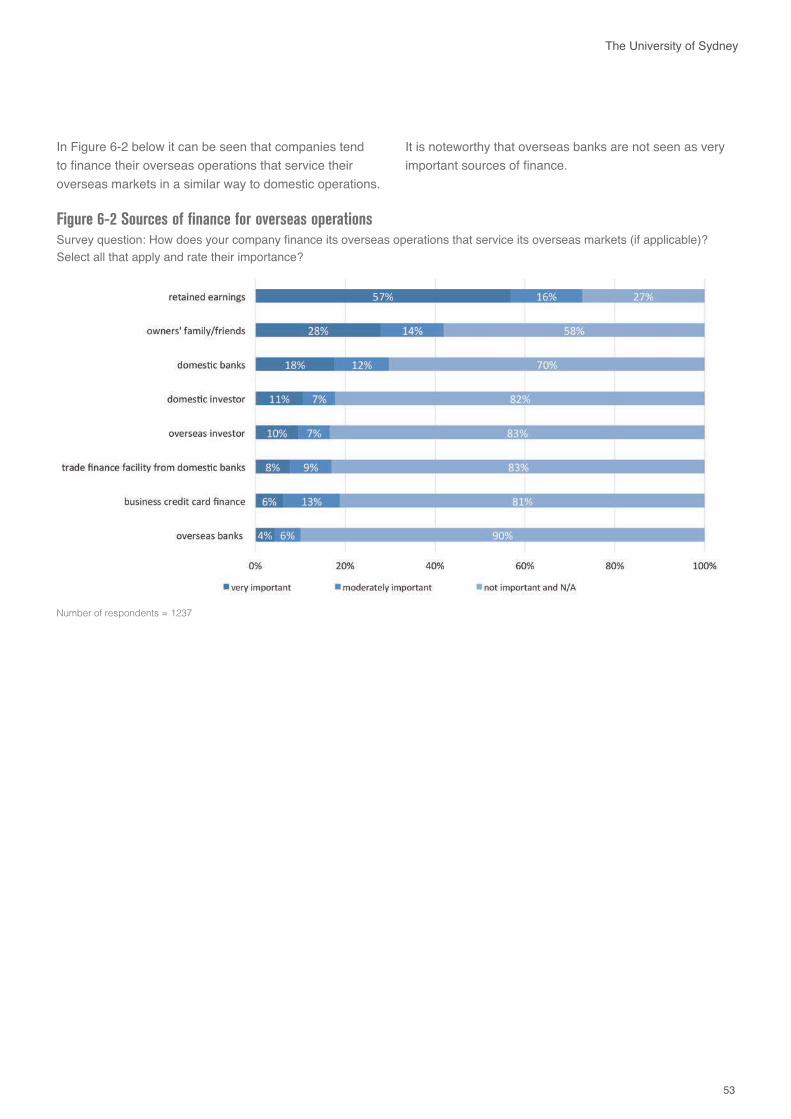
53
The University of Sydney
In Figure 6-2 below it can be seen that companies tend to finance their overseas operations that service their overseas markets in a similar way to domestic operations.
It is noteworthy that overseas banks are not seen as very important sources of finance.
Figure 6-2 Sources of finance for overseas operations Survey question: How does your company finance its overseas operations that service its overseas markets (if applicable)? Select all that apply and rate their importance?
Number of respondents = 1237
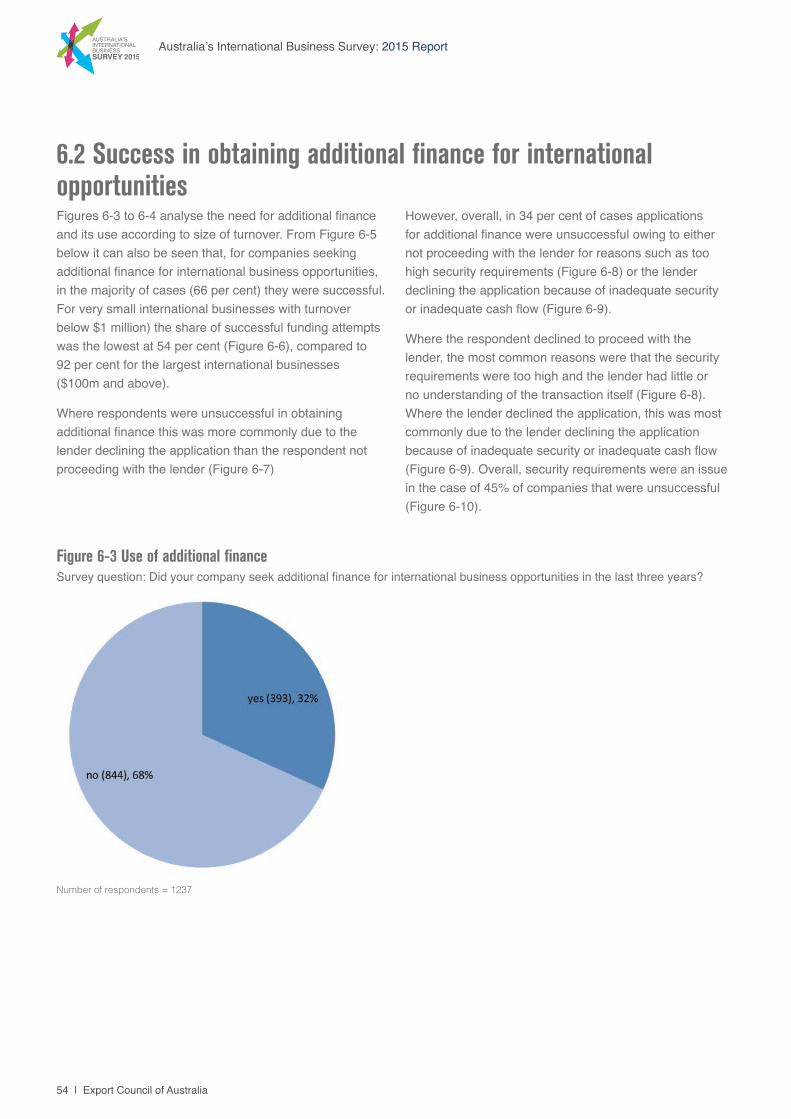
54 | Export Council of Australia
Australia’s International Business Survey: 2015 Report
6.2 Success in obtaining additional finance for international opportunitiesFigures 6-3 to 6-4 analyse the need for additional finance and its use according to size of turnover. From Figure 6-5 below it can also be seen that, for companies seeking additional finance for international business opportunities, in the majority of cases (66 per cent) they were successful. For very small international businesses with turnover below $1 million) the share of successful funding attempts was the lowest at 54 per cent (Figure 6-6), compared to 92 per cent for the largest international businesses ($100m and above).
Where respondents were unsuccessful in obtaining additional finance this was more commonly due to the lender declining the application than the respondent not proceeding with the lender (Figure 6-7)
However, overall, in 34 per cent of cases applications for additional finance were unsuccessful owing to either not proceeding with the lender for reasons such as too high security requirements (Figure 6-8) or the lender declining the application because of inadequate security or inadequate cash flow (Figure 6-9).
Where the respondent declined to proceed with the lender, the most common reasons were that the security requirements were too high and the lender had little or no understanding of the transaction itself (Figure 6-8). Where the lender declined the application, this was most commonly due to the lender declining the application because of inadequate security or inadequate cash flow (Figure 6-9). Overall, security requirements were an issue in the case of 45% of companies that were unsuccessful (Figure 6-10).
Figure 6-3 Use of additional finance Survey question: Did your company seek additional finance for international business opportunities in the last three years?
Number of respondents = 1237
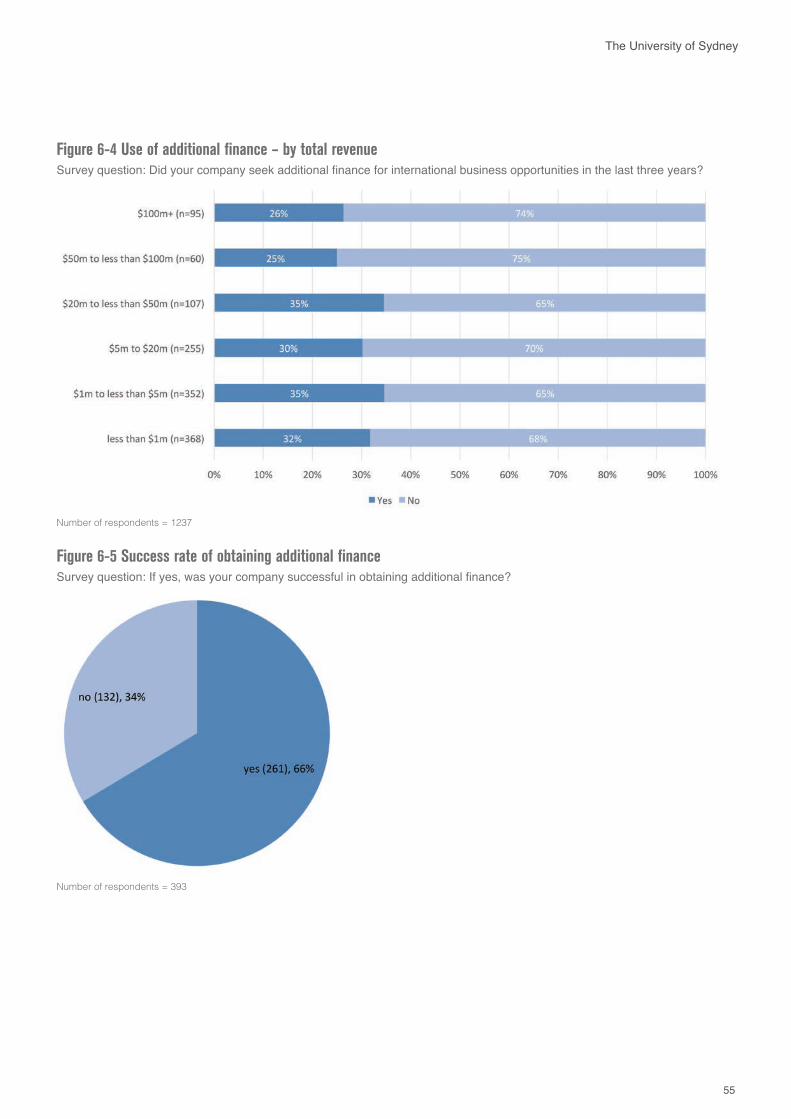
55
The University of Sydney
Figure 6-5 Success rate of obtaining additional finance Survey question: If yes, was your company successful in obtaining additional finance?
Number of respondents = 393
Figure 6-4 Use of additional finance – by total revenue Survey question: Did your company seek additional finance for international business opportunities in the last three years?
Number of respondents = 1237
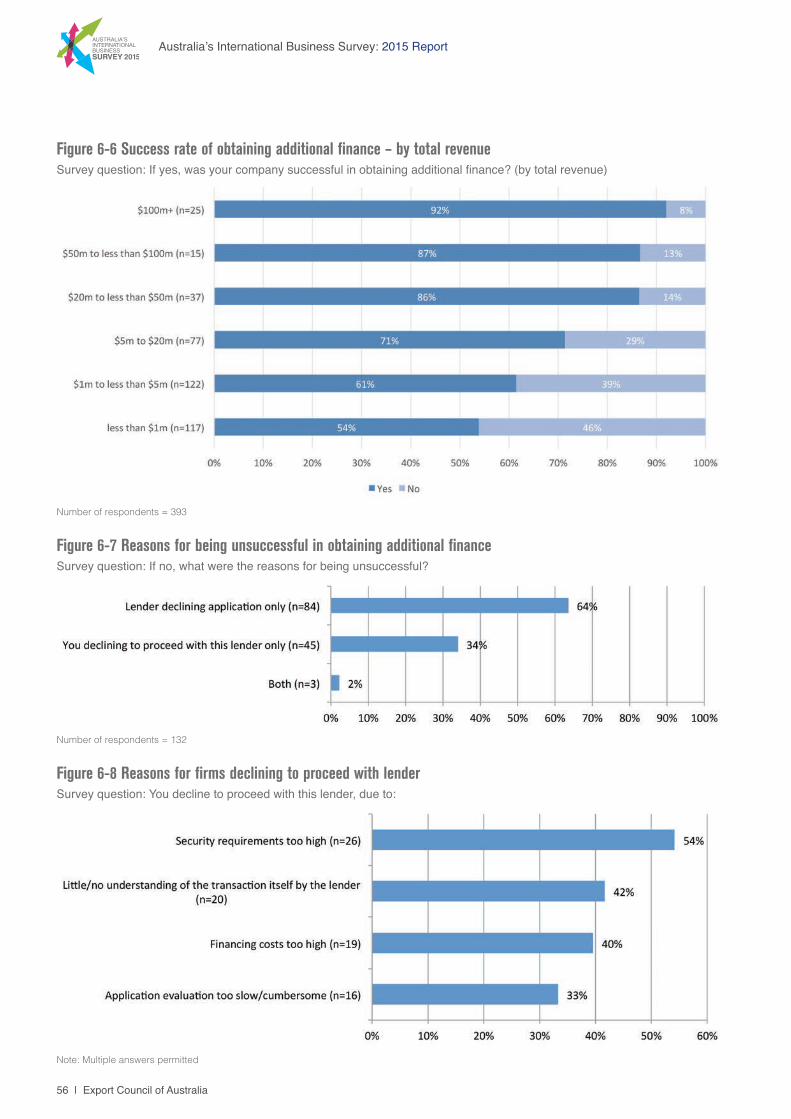
56 | Export Council of Australia
Australia’s International Business Survey: 2015 Report
Figure 6-6 Success rate of obtaining additional finance – by total revenue Survey question: If yes, was your company successful in obtaining additional finance? (by total revenue)
Number of respondents = 393
Figure 6-7 Reasons for being unsuccessful in obtaining additional finance Survey question: If no, what were the reasons for being unsuccessful?
Number of respondents = 132
Figure 6-8 Reasons for firms declining to proceed with lender Survey question: You decline to proceed with this lender, due to:
Note: Multiple answers permitted
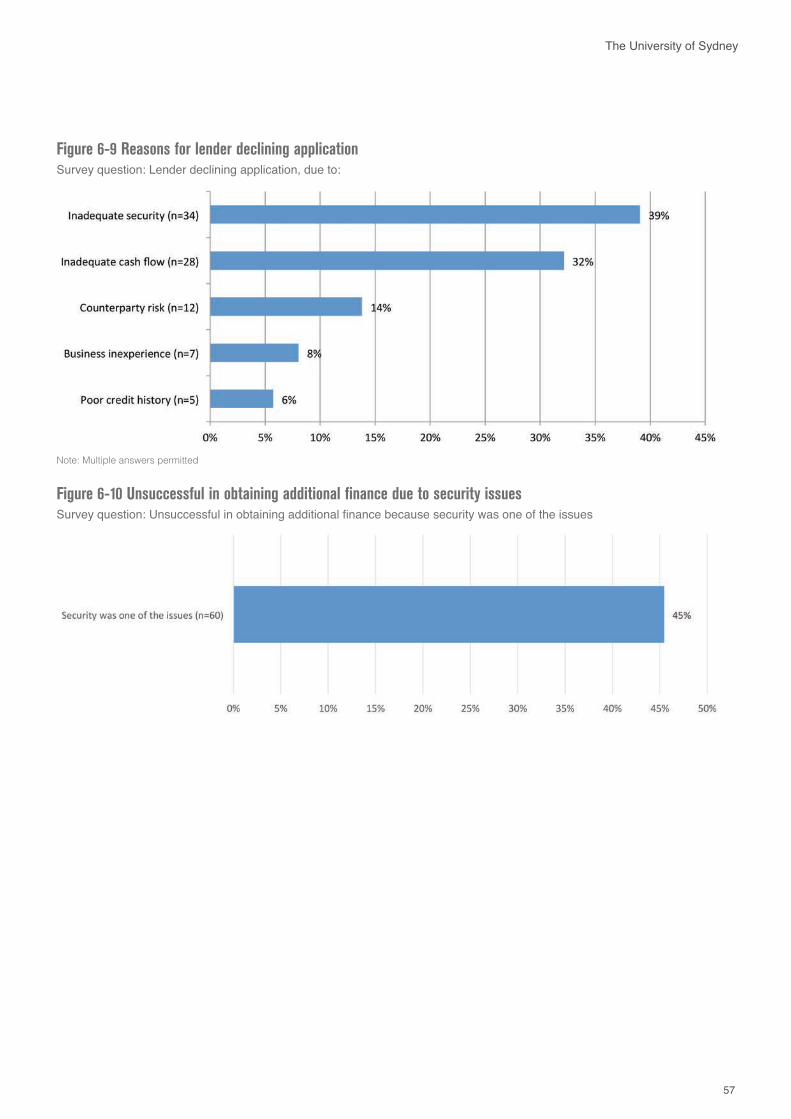
57
The University of Sydney
Figure 6-9 Reasons for lender declining application Survey question: Lender declining application, due to:
Note: Multiple answers permitted
Figure 6-10 Unsuccessful in obtaining additional finance due to security issues Survey question: Unsuccessful in obtaining additional finance because security was one of the issues
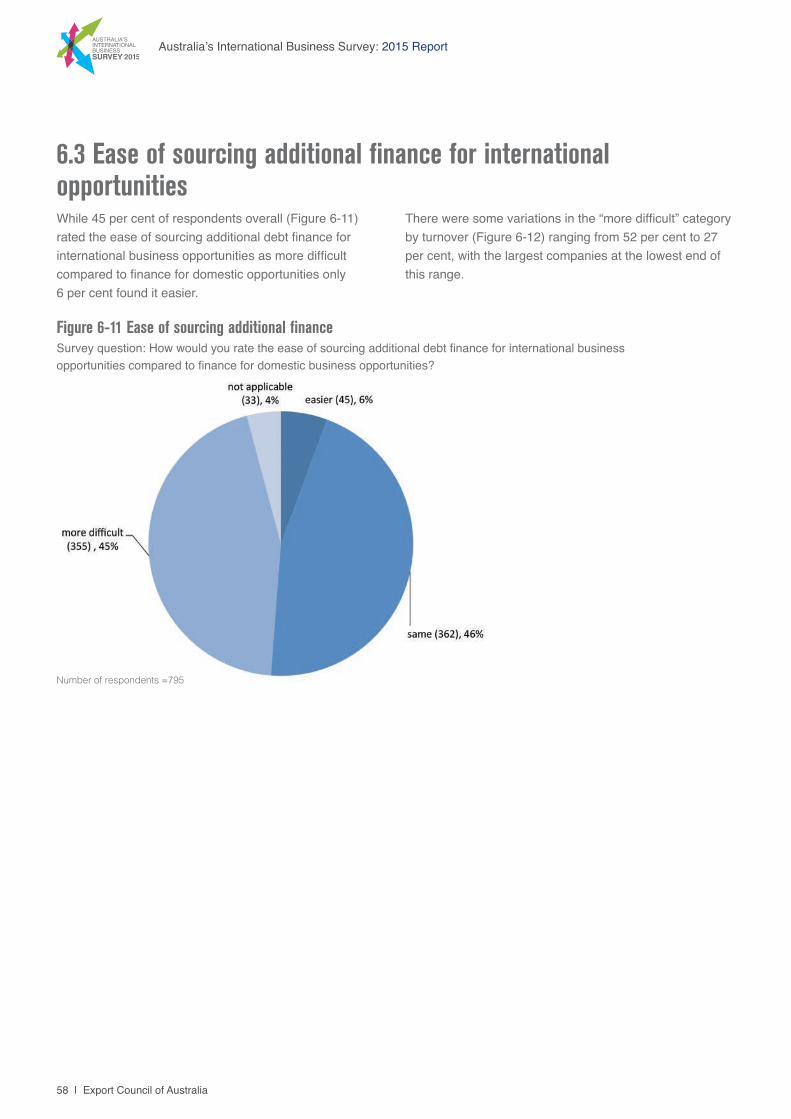
58 | Export Council of Australia
Australia’s International Business Survey: 2015 Report
6.3 Ease of sourcing additional finance for international opportunitiesWhile 45 per cent of respondents overall (Figure 6-11) rated the ease of sourcing additional debt finance for international business opportunities as more difficult compared to finance for domestic opportunities only 6 per cent found it easier.
There were some variations in the “more difficult” category by turnover (Figure 6-12) ranging from 52 per cent to 27 per cent, with the largest companies at the lowest end of this range.
Figure 6-11 Ease of sourcing additional finance Survey question: How would you rate the ease of sourcing additional debt finance for international business opportunities compared to finance for domestic business opportunities?
Number of respondents =795
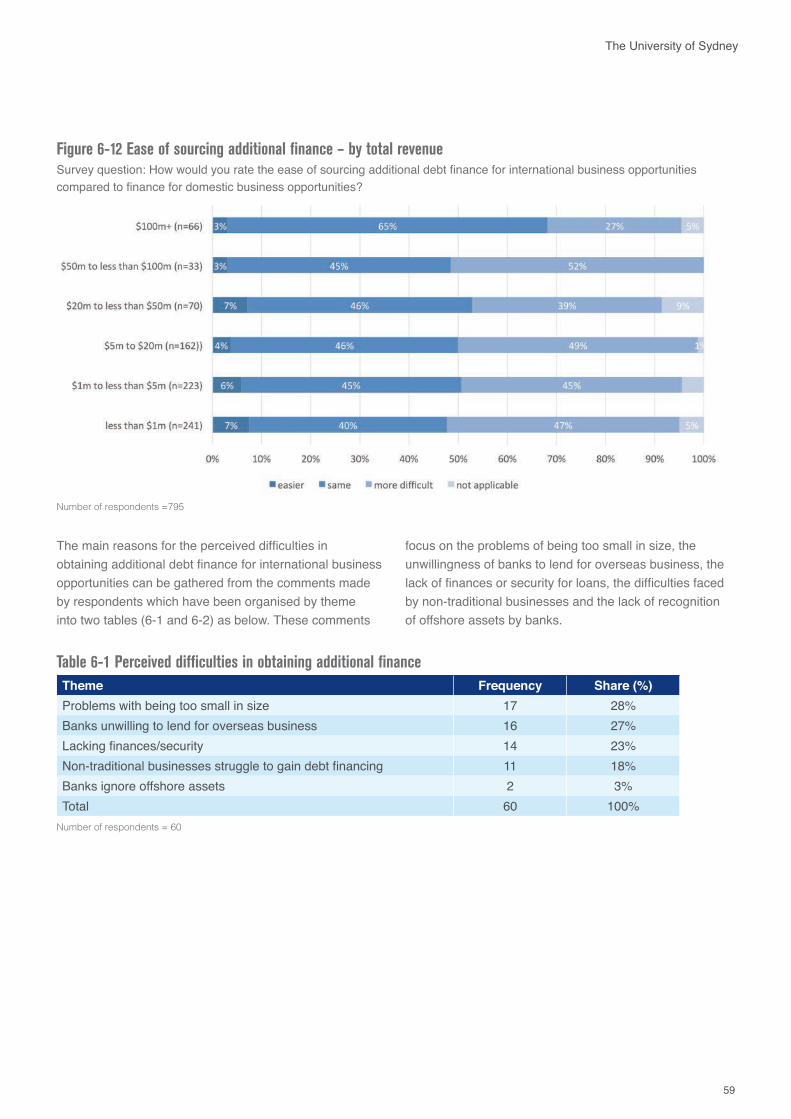
59
The University of Sydney
Figure 6-12 Ease of sourcing additional finance – by total revenue Survey question: How would you rate the ease of sourcing additional debt finance for international business opportunities compared to finance for domestic business opportunities?
Number of respondents =795
focus on the problems of being too small in size, the unwillingness of banks to lend for overseas business, the lack of finances or security for loans, the difficulties faced by non-traditional businesses and the lack of recognition of offshore assets by banks.
The main reasons for the perceived difficulties in obtaining additional debt finance for international business opportunities can be gathered from the comments made by respondents which have been organised by theme into two tables (6-1 and 6-2) as below. These comments
Table 6-1 Perceived difficulties in obtaining additional finance Theme Frequency Share (%)Problems with being too small in size 17 28%Banks unwilling to lend for overseas business 16 27%Lacking finances/security 14 23%Non-traditional businesses struggle to gain debt financing 11 18%Banks ignore offshore assets 2 3%Total 60 100%
Number of respondents = 60
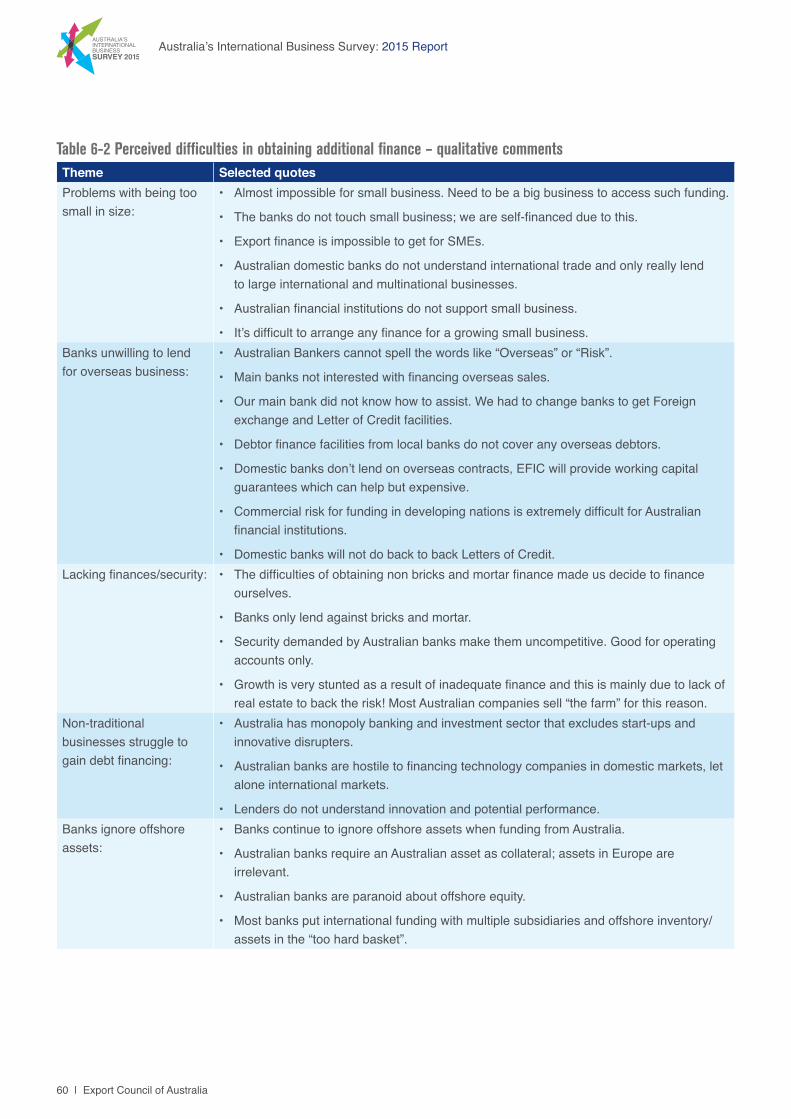
60 | Export Council of Australia
Australia’s International Business Survey: 2015 Report
Table 6-2 Perceived difficulties in obtaining additional finance – qualitative comments Theme Selected quotesProblems with being too small in size:
• Almost impossible for small business. Need to be a big business to access such funding.
• The banks do not touch small business; we are self-financed due to this.
• Export finance is impossible to get for SMEs.
• Australian domestic banks do not understand international trade and only really lend to large international and multinational businesses.
• Australian financial institutions do not support small business.
• It’s difficult to arrange any finance for a growing small business.Banks unwilling to lend for overseas business:
• Australian Bankers cannot spell the words like “Overseas” or “Risk”.
• Main banks not interested with financing overseas sales.
• Our main bank did not know how to assist. We had to change banks to get Foreign exchange and Letter of Credit facilities.
• Debtor finance facilities from local banks do not cover any overseas debtors.
• Domestic banks don’t lend on overseas contracts, EFIC will provide working capital guarantees which can help but expensive.
• Commercial risk for funding in developing nations is extremely difficult for Australian financial institutions.
• Domestic banks will not do back to back Letters of Credit.Lacking finances/security: • The difficulties of obtaining non bricks and mortar finance made us decide to finance
ourselves.
• Banks only lend against bricks and mortar.
• Security demanded by Australian banks make them uncompetitive. Good for operating accounts only.
• Growth is very stunted as a result of inadequate finance and this is mainly due to lack of real estate to back the risk! Most Australian companies sell “the farm” for this reason.
Non-traditional businesses struggle to gain debt financing:
• Australia has monopoly banking and investment sector that excludes start-ups and innovative disrupters.
• Australian banks are hostile to financing technology companies in domestic markets, let alone international markets.
• Lenders do not understand innovation and potential performance.Banks ignore offshore assets:
• Banks continue to ignore offshore assets when funding from Australia.
• Australian banks require an Australian asset as collateral; assets in Europe are irrelevant.
• Australian banks are paranoid about offshore equity.
• Most banks put international funding with multiple subsidiaries and offshore inventory/assets in the “too hard basket”.
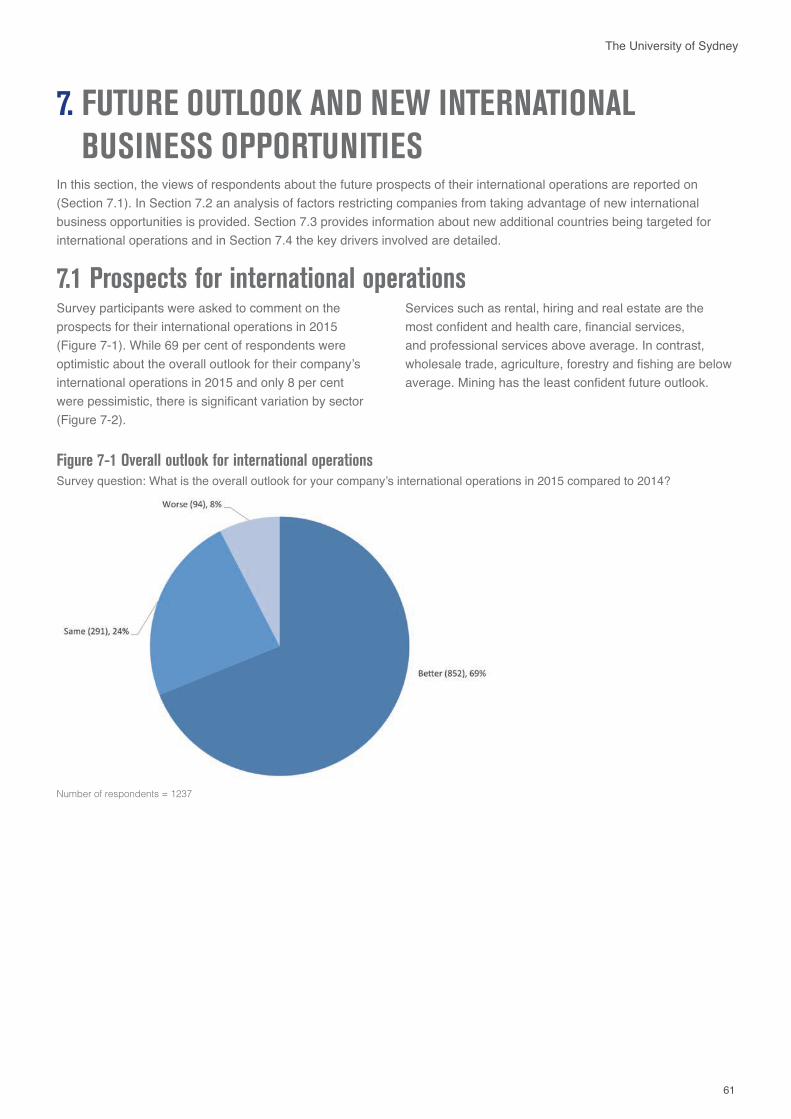
61
The University of Sydney
In this section, the views of respondents about the future prospects of their international operations are reported on (Section 7.1). In Section 7.2 an analysis of factors restricting companies from taking advantage of new international business opportunities is provided. Section 7.3 provides information about new additional countries being targeted for international operations and in Section 7.4 the key drivers involved are detailed.
7.1 Prospects for international operations
7. FUTURE OUTLOOK AND NEW INTERNATIONAL BUSINESS OPPORTUNITIES
Survey participants were asked to comment on the prospects for their international operations in 2015 (Figure 7-1). While 69 per cent of respondents were optimistic about the overall outlook for their company’s international operations in 2015 and only 8 per cent were pessimistic, there is significant variation by sector (Figure 7-2).
Services such as rental, hiring and real estate are the most confident and health care, financial services, and professional services above average. In contrast, wholesale trade, agriculture, forestry and fishing are below average. Mining has the least confident future outlook.
Figure 7-1 Overall outlook for international operations Survey question: What is the overall outlook for your company’s international operations in 2015 compared to 2014?
Number of respondents = 1237
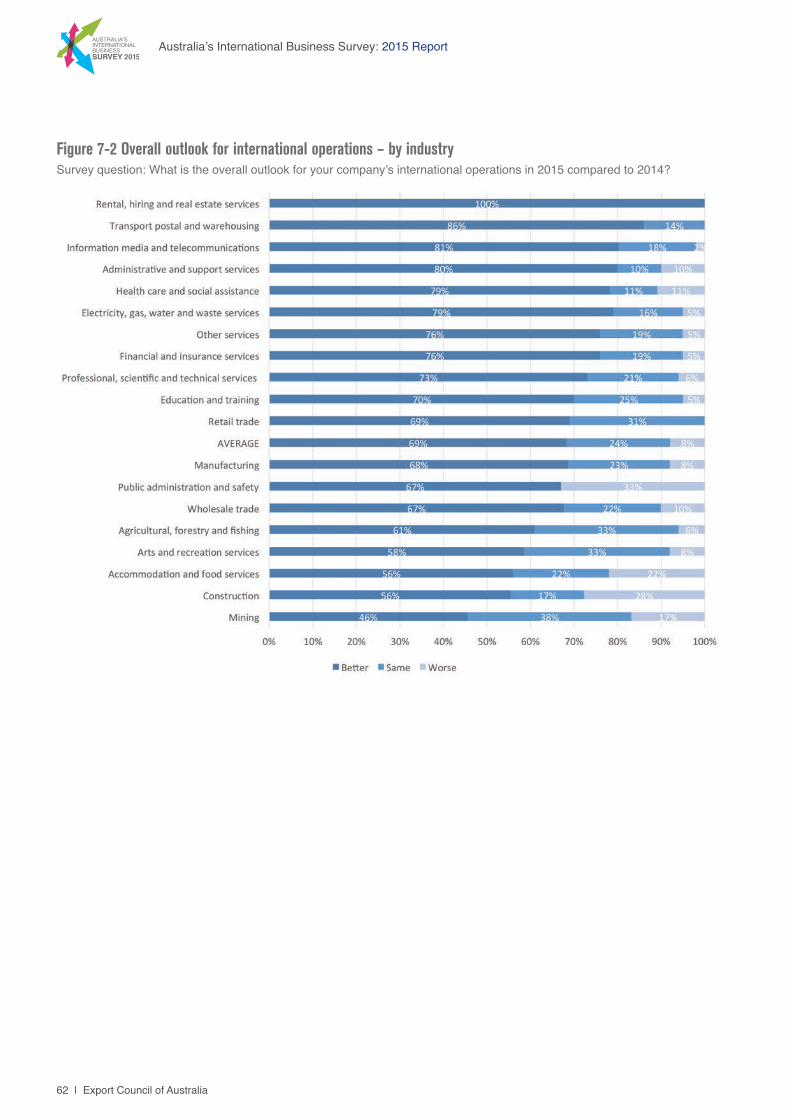
62 | Export Council of Australia
Australia’s International Business Survey: 2015 Report
Figure 7-2 Overall outlook for international operations – by industry Survey question: What is the overall outlook for your company’s international operations in 2015 compared to 2014?
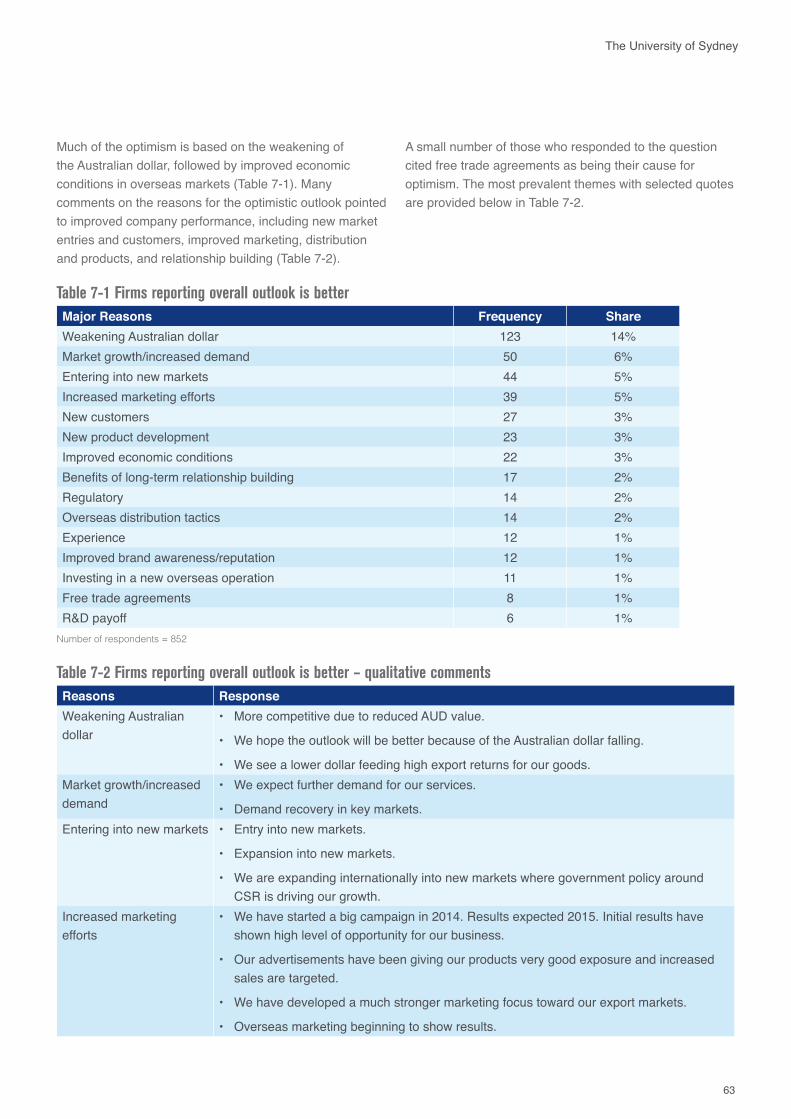
63
The University of Sydney
Much of the optimism is based on the weakening of the Australian dollar, followed by improved economic conditions in overseas markets (Table 7-1). Many comments on the reasons for the optimistic outlook pointed to improved company performance, including new market entries and customers, improved marketing, distribution and products, and relationship building (Table 7-2).
Table 7-1 Firms reporting overall outlook is betterMajor Reasons Frequency ShareWeakening Australian dollar 123 14%Market growth/increased demand 50 6%Entering into new markets 44 5%Increased marketing efforts 39 5%New customers 27 3%New product development 23 3%Improved economic conditions 22 3%Benefits of long-term relationship building 17 2%Regulatory 14 2%Overseas distribution tactics 14 2%Experience 12 1%Improved brand awareness/reputation 12 1%Investing in a new overseas operation 11 1%Free trade agreements 8 1%R&D payoff 6 1%
Number of respondents = 852
Table 7-2 Firms reporting overall outlook is better – qualitative comments Reasons ResponseWeakening Australian dollar
• More competitive due to reduced AUD value.
• We hope the outlook will be better because of the Australian dollar falling.
• We see a lower dollar feeding high export returns for our goods. Market growth/increased demand
• We expect further demand for our services.
• Demand recovery in key markets.Entering into new markets • Entry into new markets.
• Expansion into new markets.
• We are expanding internationally into new markets where government policy around CSR is driving our growth.
Increased marketing efforts
• We have started a big campaign in 2014. Results expected 2015. Initial results have shown high level of opportunity for our business.
• Our advertisements have been giving our products very good exposure and increased sales are targeted.
• We have developed a much stronger marketing focus toward our export markets.
• Overseas marketing beginning to show results.
A small number of those who responded to the question cited free trade agreements as being their cause for optimism. The most prevalent themes with selected quotes are provided below in Table 7-2.
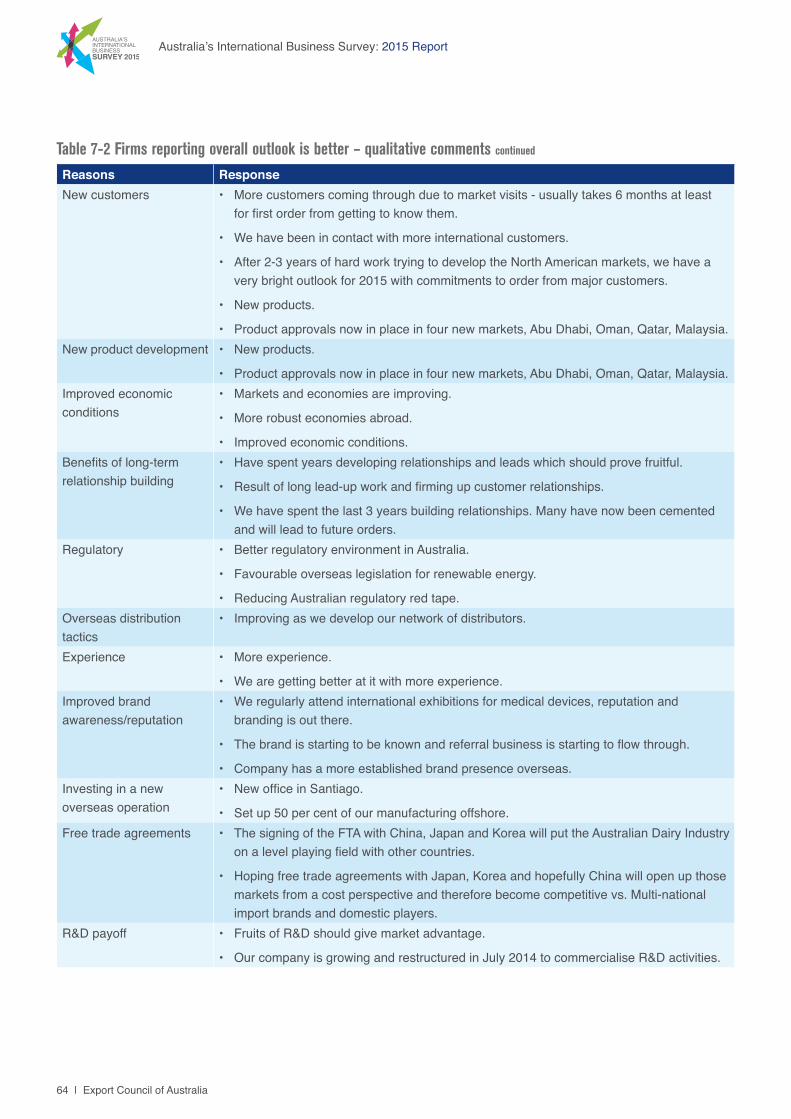
64 | Export Council of Australia
Australia’s International Business Survey: 2015 Report
Reasons ResponseNew customers • More customers coming through due to market visits - usually takes 6 months at least
for first order from getting to know them.
• We have been in contact with more international customers.
• After 2-3 years of hard work trying to develop the North American markets, we have a very bright outlook for 2015 with commitments to order from major customers.
• New products.
• Product approvals now in place in four new markets, Abu Dhabi, Oman, Qatar, Malaysia.New product development • New products.
• Product approvals now in place in four new markets, Abu Dhabi, Oman, Qatar, Malaysia.Improved economic conditions
• Markets and economies are improving.
• More robust economies abroad.
• Improved economic conditions.Benefits of long-term relationship building
• Have spent years developing relationships and leads which should prove fruitful.
• Result of long lead-up work and firming up customer relationships.
• We have spent the last 3 years building relationships. Many have now been cemented and will lead to future orders.
Regulatory • Better regulatory environment in Australia.
• Favourable overseas legislation for renewable energy.
• Reducing Australian regulatory red tape.Overseas distribution tactics
• Improving as we develop our network of distributors.
Experience • More experience.
• We are getting better at it with more experience.Improved brand awareness/reputation
• We regularly attend international exhibitions for medical devices, reputation and branding is out there.
• The brand is starting to be known and referral business is starting to flow through.
• Company has a more established brand presence overseas.Investing in a new overseas operation
• New office in Santiago.
• Set up 50 per cent of our manufacturing offshore.Free trade agreements • The signing of the FTA with China, Japan and Korea will put the Australian Dairy Industry
on a level playing field with other countries.
• Hoping free trade agreements with Japan, Korea and hopefully China will open up those markets from a cost perspective and therefore become competitive vs. Multi-national import brands and domestic players.
R&D payoff • Fruits of R&D should give market advantage.
• Our company is growing and restructured in July 2014 to commercialise R&D activities.
Table 7-2 Firms reporting overall outlook is better – qualitative comments continued
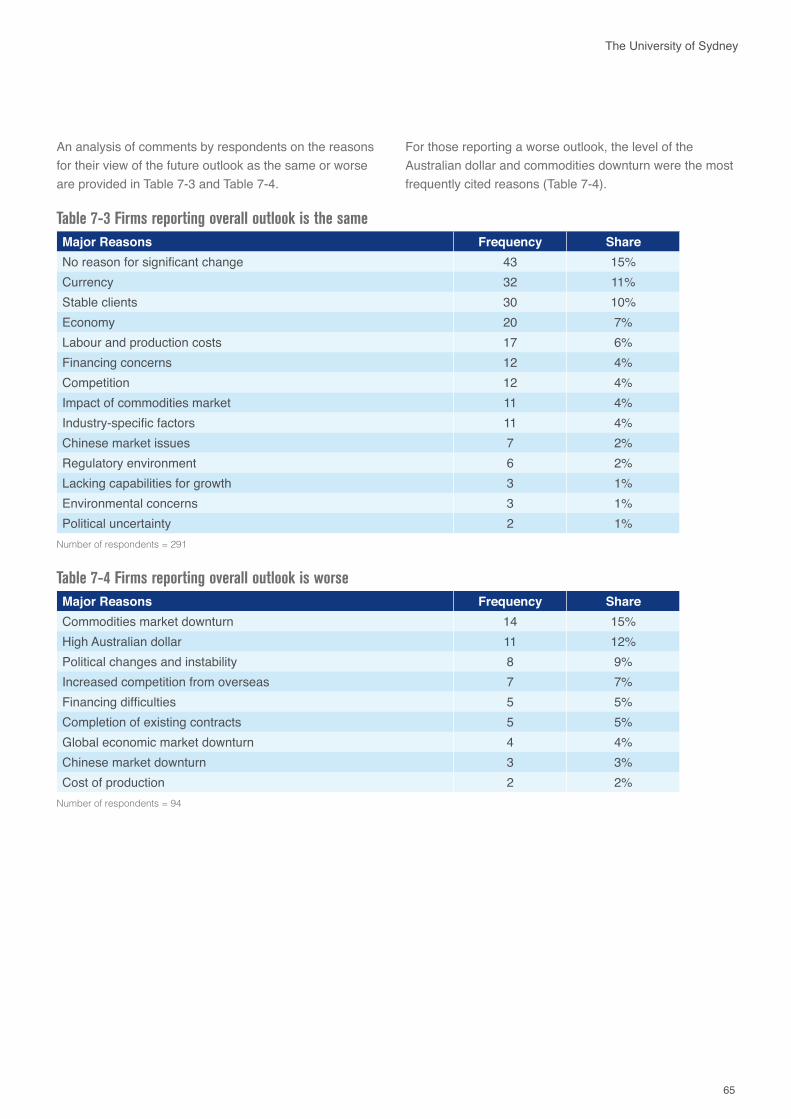
65
The University of Sydney
An analysis of comments by respondents on the reasons for their view of the future outlook as the same or worse are provided in Table 7-3 and Table 7-4.
For those reporting a worse outlook, the level of the Australian dollar and commodities downturn were the most frequently cited reasons (Table 7-4).
Table 7-3 Firms reporting overall outlook is the sameMajor Reasons Frequency ShareNo reason for significant change 43 15%Currency 32 11%Stable clients 30 10%Economy 20 7%Labour and production costs 17 6%Financing concerns 12 4%Competition 12 4%Impact of commodities market 11 4%Industry-specific factors 11 4%Chinese market issues 7 2%Regulatory environment 6 2%Lacking capabilities for growth 3 1%Environmental concerns 3 1%Political uncertainty 2 1%
Number of respondents = 291
Table 7-4 Firms reporting overall outlook is worse Major Reasons Frequency ShareCommodities market downturn 14 15%High Australian dollar 11 12%Political changes and instability 8 9%Increased competition from overseas 7 7%Financing difficulties 5 5%Completion of existing contracts 5 5%Global economic market downturn 4 4%Chinese market downturn 3 3%Cost of production 2 2%
Number of respondents = 94
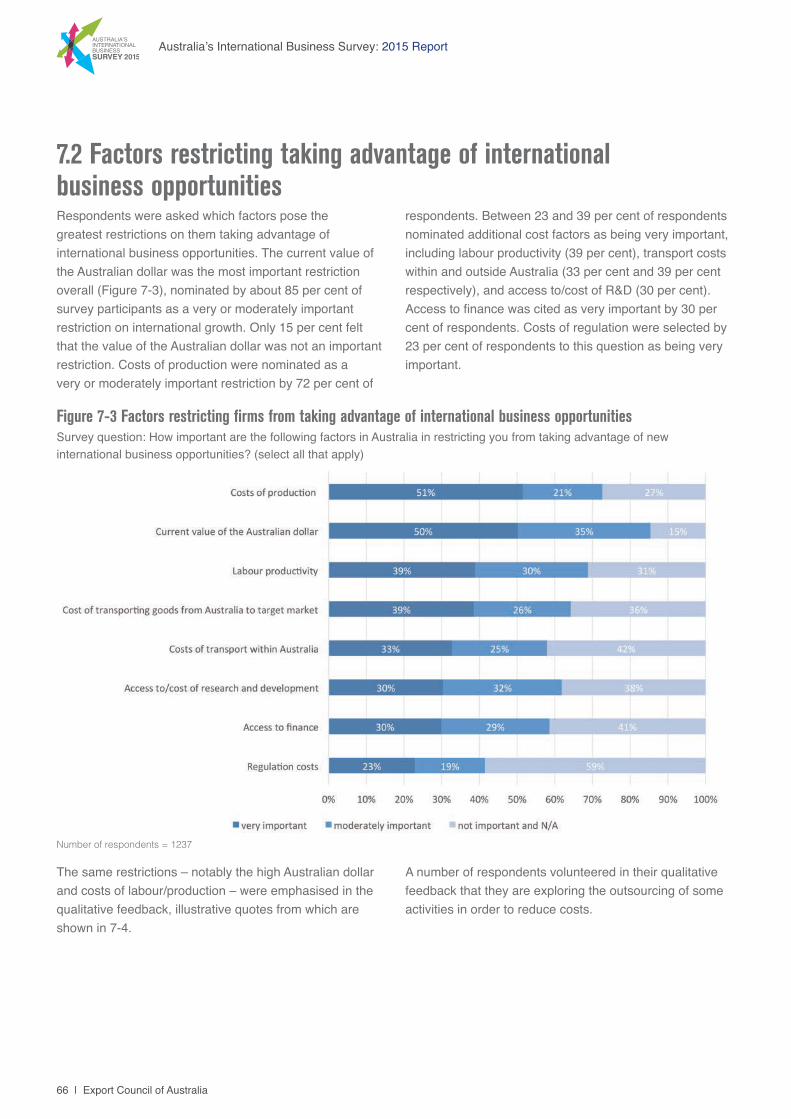
66 | Export Council of Australia
Australia’s International Business Survey: 2015 Report
7.2 Factors restricting taking advantage of international business opportunities
The same restrictions – notably the high Australian dollar and costs of labour/production – were emphasised in the qualitative feedback, illustrative quotes from which are shown in 7-4.
Respondents were asked which factors pose the greatest restrictions on them taking advantage of international business opportunities. The current value of the Australian dollar was the most important restriction overall (Figure 7-3), nominated by about 85 per cent of survey participants as a very or moderately important restriction on international growth. Only 15 per cent felt that the value of the Australian dollar was not an important restriction. Costs of production were nominated as a very or moderately important restriction by 72 per cent of
respondents. Between 23 and 39 per cent of respondents nominated additional cost factors as being very important, including labour productivity (39 per cent), transport costs within and outside Australia (33 per cent and 39 per cent respectively), and access to/cost of R&D (30 per cent). Access to finance was cited as very important by 30 per cent of respondents. Costs of regulation were selected by 23 per cent of respondents to this question as being very important.
Figure 7-3 Factors restricting firms from taking advantage of international business opportunities Survey question: How important are the following factors in Australia in restricting you from taking advantage of new international business opportunities? (select all that apply)
Number of respondents = 1237
A number of respondents volunteered in their qualitative feedback that they are exploring the outsourcing of some activities in order to reduce costs.
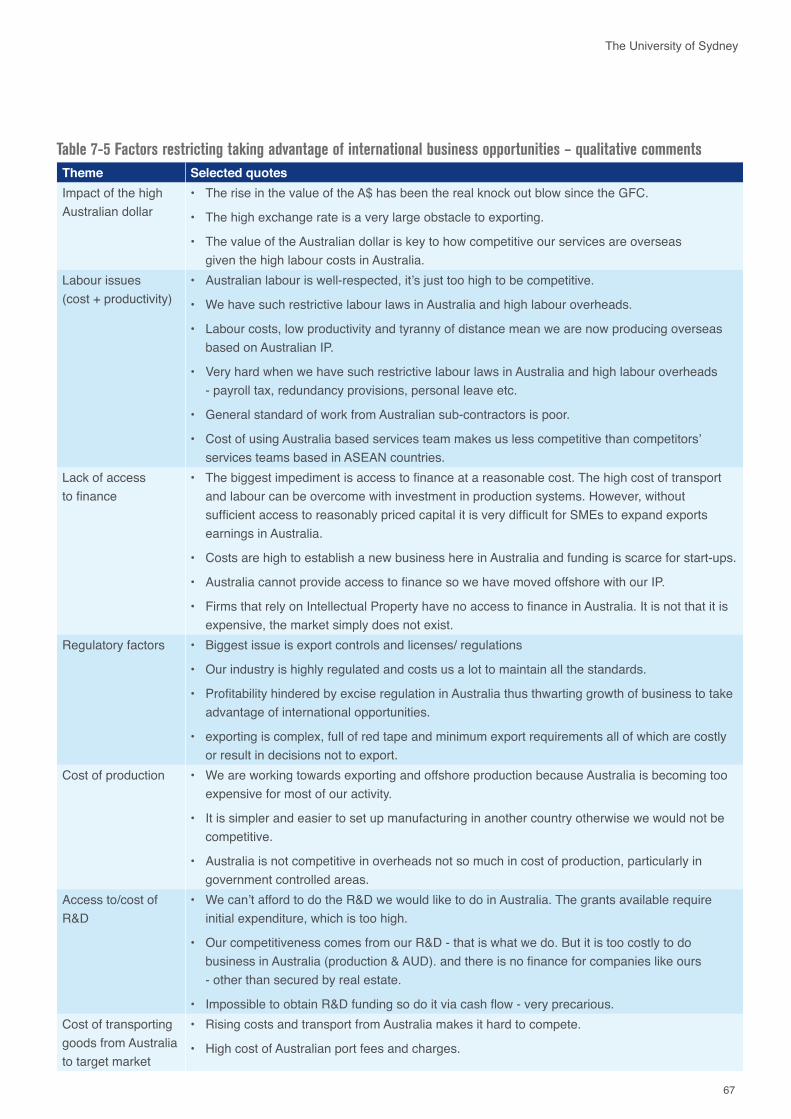
67
The University of Sydney
Table 7-5 Factors restricting taking advantage of international business opportunities – qualitative comments Theme Selected quotesImpact of the high Australian dollar
• The rise in the value of the A$ has been the real knock out blow since the GFC.
• The high exchange rate is a very large obstacle to exporting.
• The value of the Australian dollar is key to how competitive our services are overseas given the high labour costs in Australia.
Labour issues (cost + productivity)
• Australian labour is well-respected, it’s just too high to be competitive.
• We have such restrictive labour laws in Australia and high labour overheads.
• Labour costs, low productivity and tyranny of distance mean we are now producing overseas based on Australian IP.
• Very hard when we have such restrictive labour laws in Australia and high labour overheads - payroll tax, redundancy provisions, personal leave etc.
• General standard of work from Australian sub-contractors is poor.
• Cost of using Australia based services team makes us less competitive than competitors’ services teams based in ASEAN countries.
Lack of access to finance
• The biggest impediment is access to finance at a reasonable cost. The high cost of transport and labour can be overcome with investment in production systems. However, without sufficient access to reasonably priced capital it is very difficult for SMEs to expand exports earnings in Australia.
• Costs are high to establish a new business here in Australia and funding is scarce for start-ups.
• Australia cannot provide access to finance so we have moved offshore with our IP.
• Firms that rely on Intellectual Property have no access to finance in Australia. It is not that it is expensive, the market simply does not exist.
Regulatory factors • Biggest issue is export controls and licenses/ regulations
• Our industry is highly regulated and costs us a lot to maintain all the standards.
• Profitability hindered by excise regulation in Australia thus thwarting growth of business to take advantage of international opportunities.
• exporting is complex, full of red tape and minimum export requirements all of which are costly or result in decisions not to export.
Cost of production • We are working towards exporting and offshore production because Australia is becoming too expensive for most of our activity.
• It is simpler and easier to set up manufacturing in another country otherwise we would not be competitive.
• Australia is not competitive in overheads not so much in cost of production, particularly in government controlled areas.
Access to/cost of R&D
• We can’t afford to do the R&D we would like to do in Australia. The grants available require initial expenditure, which is too high.
• Our competitiveness comes from our R&D - that is what we do. But it is too costly to do business in Australia (production & AUD). and there is no finance for companies like ours - other than secured by real estate.
• Impossible to obtain R&D funding so do it via cash flow - very precarious.Cost of transporting goods from Australia to target market
• Rising costs and transport from Australia makes it hard to compete.
• High cost of Australian port fees and charges.
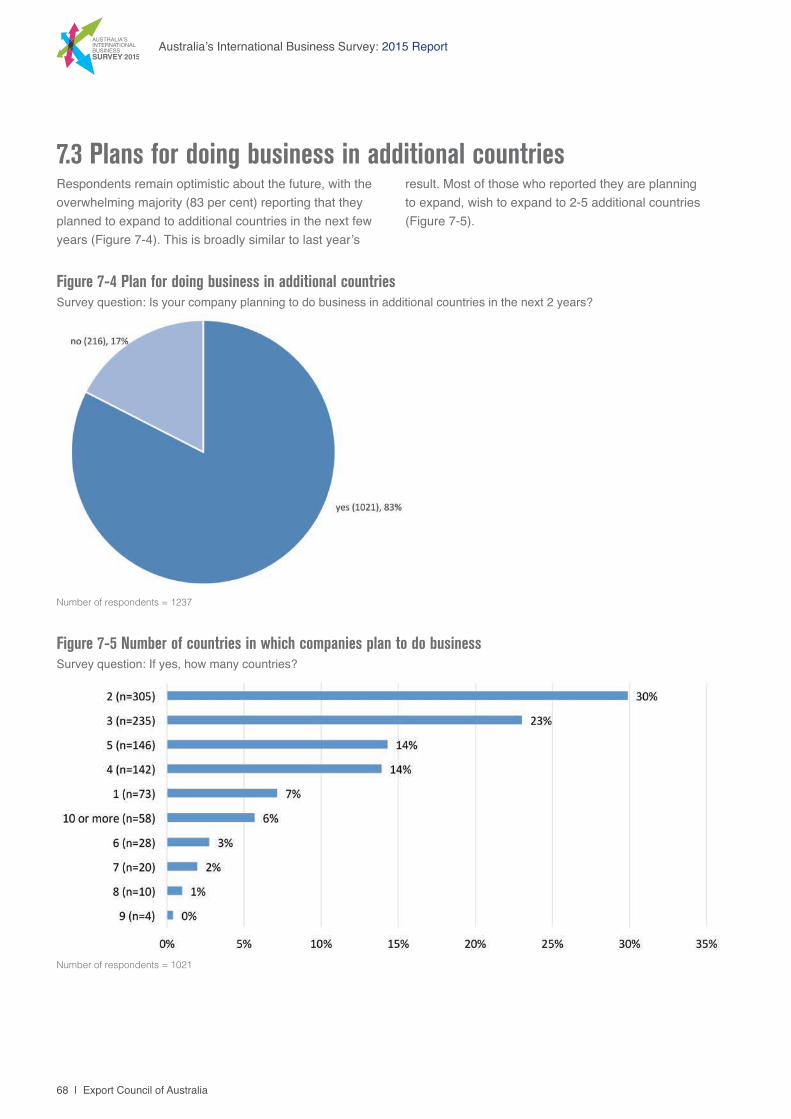
68 | Export Council of Australia
Australia’s International Business Survey: 2015 Report
7.3 Plans for doing business in additional countriesRespondents remain optimistic about the future, with the overwhelming majority (83 per cent) reporting that they planned to expand to additional countries in the next few years (Figure 7-4). This is broadly similar to last year’s
result. Most of those who reported they are planning to expand, wish to expand to 2-5 additional countries (Figure 7-5).
Figure 7-5 Number of countries in which companies plan to do business Survey question: If yes, how many countries?
Number of respondents = 1021
Figure 7-4 Plan for doing business in additional countries Survey question: Is your company planning to do business in additional countries in the next 2 years?
Number of respondents = 1237
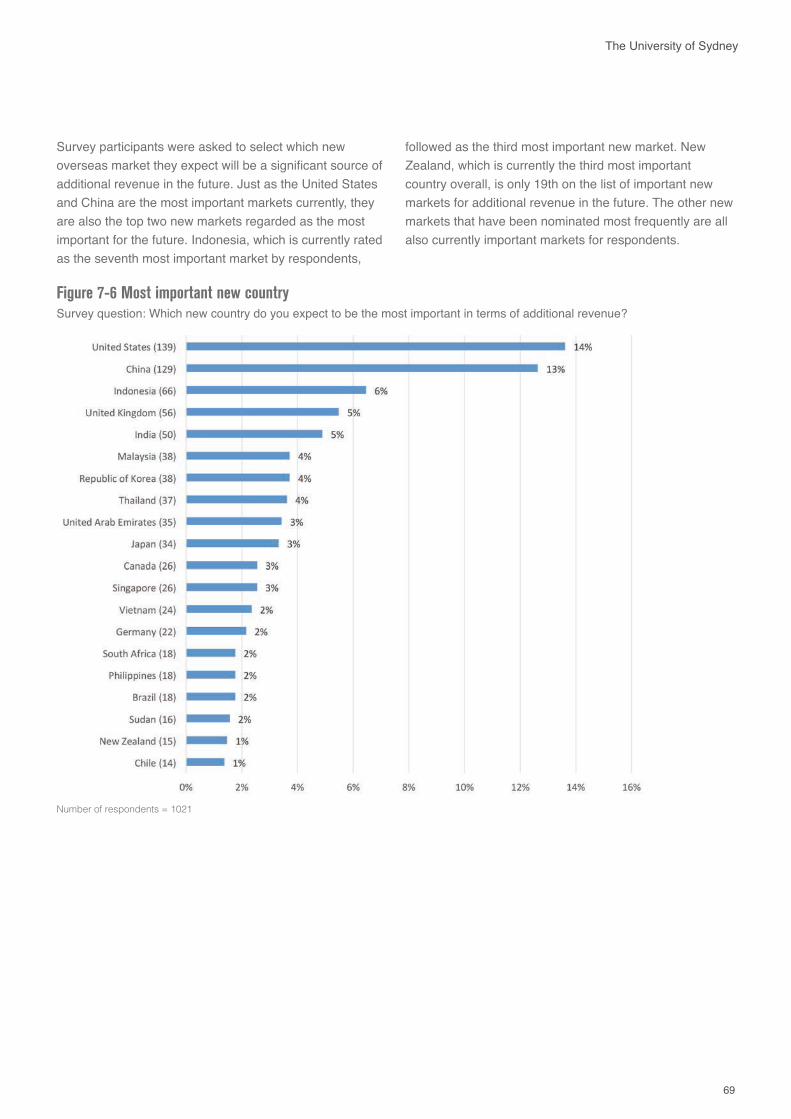
69
The University of Sydney
Survey participants were asked to select which new overseas market they expect will be a significant source of additional revenue in the future. Just as the United States and China are the most important markets currently, they are also the top two new markets regarded as the most important for the future. Indonesia, which is currently rated as the seventh most important market by respondents,
followed as the third most important new market. New Zealand, which is currently the third most important country overall, is only 19th on the list of important new markets for additional revenue in the future. The other new markets that have been nominated most frequently are all also currently important markets for respondents.
Figure 7-6 Most important new country Survey question: Which new country do you expect to be the most important in terms of additional revenue?
Number of respondents = 1021
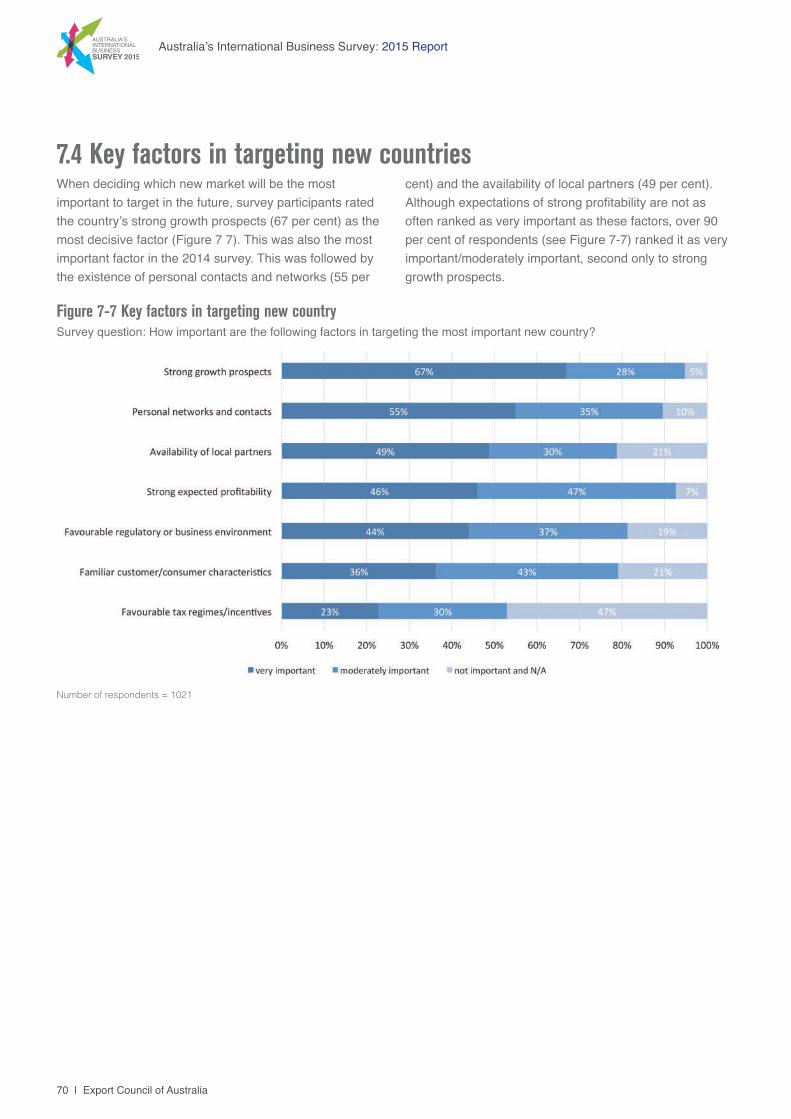
70 | Export Council of Australia
Australia’s International Business Survey: 2015 Report
7.4 Key factors in targeting new countries
Figure 7-7 Key factors in targeting new country Survey question: How important are the following factors in targeting the most important new country?
Number of respondents = 1021
When deciding which new market will be the most important to target in the future, survey participants rated the country’s strong growth prospects (67 per cent) as the most decisive factor (Figure 7 7). This was also the most important factor in the 2014 survey. This was followed by the existence of personal contacts and networks (55 per
cent) and the availability of local partners (49 per cent). Although expectations of strong profitability are not as often ranked as very important as these factors, over 90 per cent of respondents (see Figure 7-7) ranked it as very important/moderately important, second only to strong growth prospects.
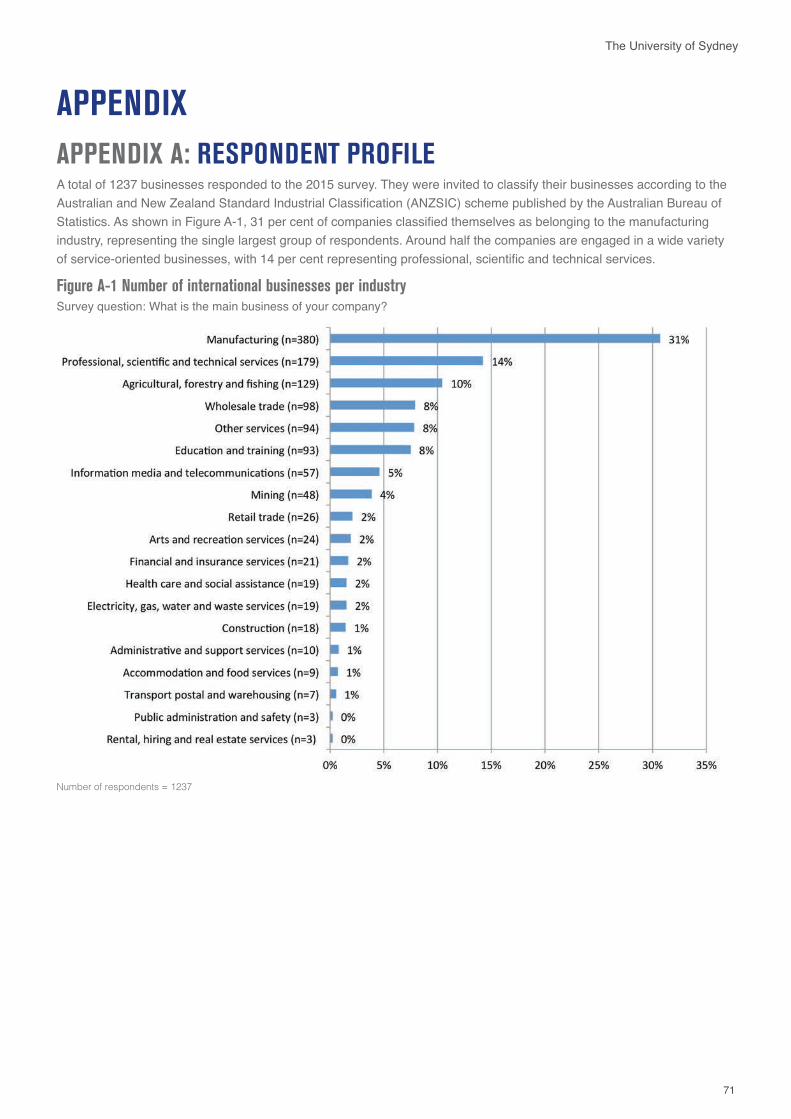
71
The University of Sydney
APPENDIX A: RESPONDENT PROFILEA total of 1237 businesses responded to the 2015 survey. They were invited to classify their businesses according to the Australian and New Zealand Standard Industrial Classification (ANZSIC) scheme published by the Australian Bureau of Statistics. As shown in Figure A-1, 31 per cent of companies classified themselves as belonging to the manufacturing industry, representing the single largest group of respondents. Around half the companies are engaged in a wide variety of service-oriented businesses, with 14 per cent representing professional, scientific and technical services.
Figure A-1 Number of international businesses per industrySurvey question: What is the main business of your company?
Number of respondents = 1237
APPENDIX
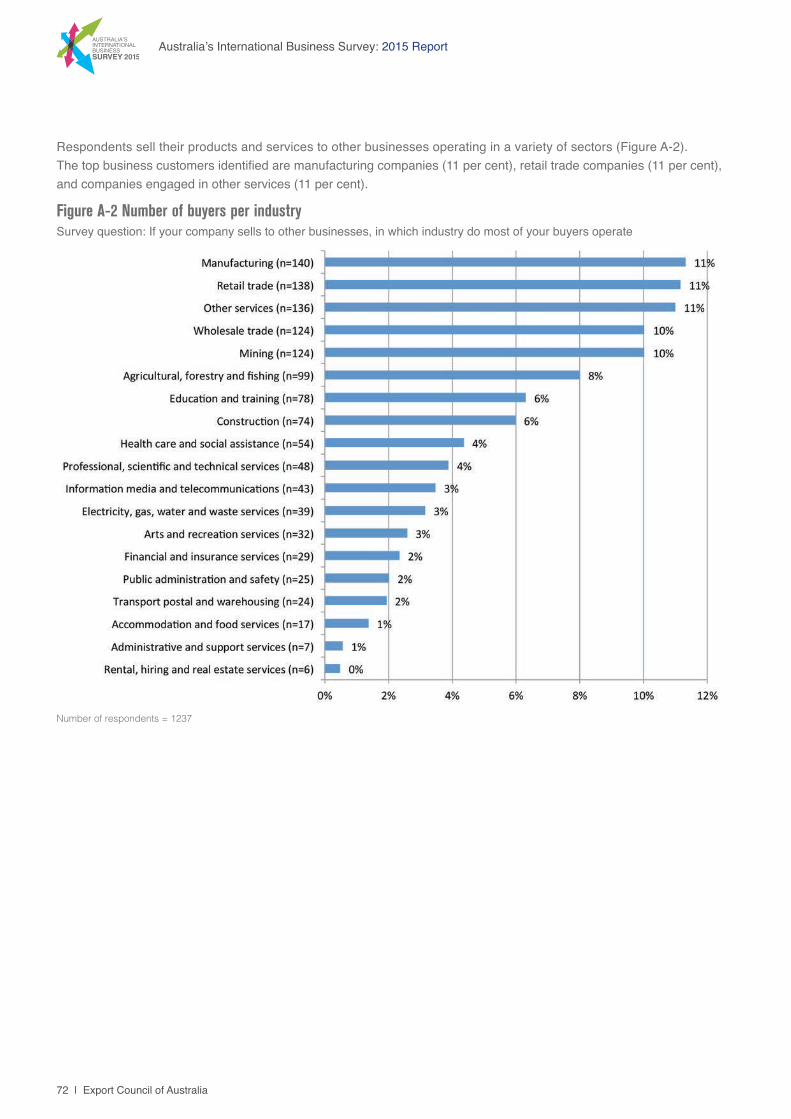
72 | Export Council of Australia
Australia’s International Business Survey: 2015 Report
Respondents sell their products and services to other businesses operating in a variety of sectors (Figure A-2). The top business customers identified are manufacturing companies (11 per cent), retail trade companies (11 per cent), and companies engaged in other services (11 per cent).
Figure A-2 Number of buyers per industry Survey question: If your company sells to other businesses, in which industry do most of your buyers operate
Number of respondents = 1237
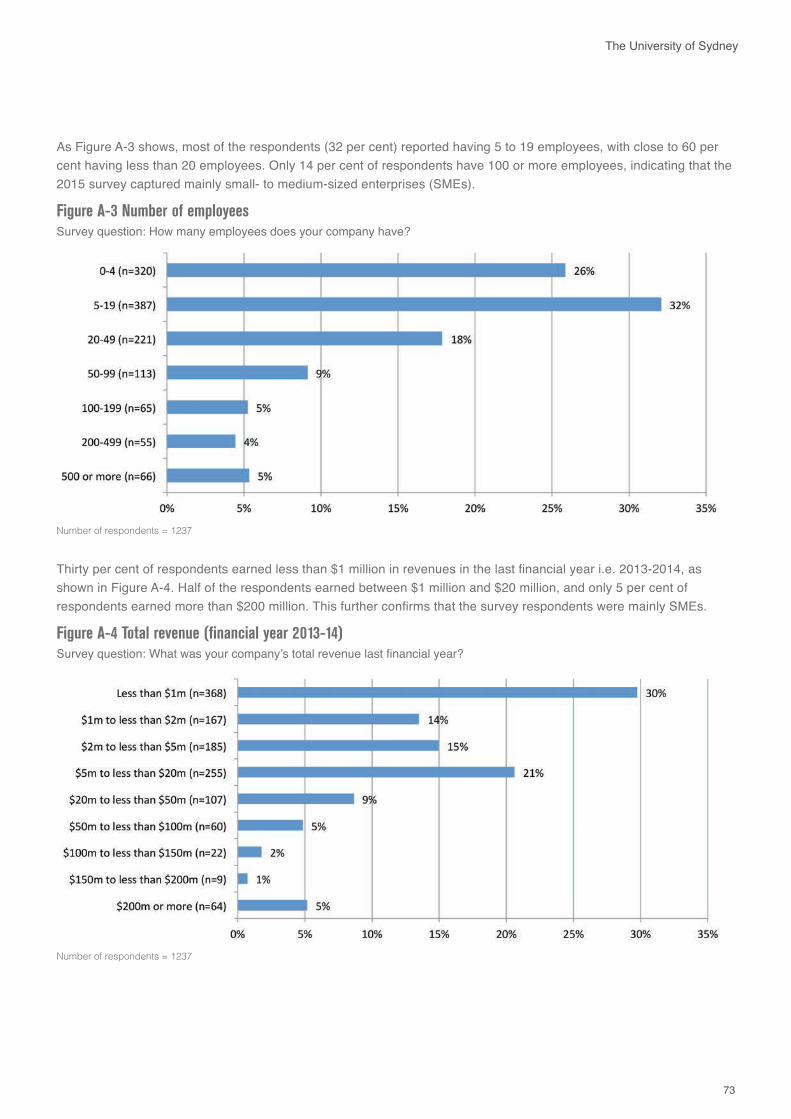
73
The University of Sydney
As Figure A-3 shows, most of the respondents (32 per cent) reported having 5 to 19 employees, with close to 60 per cent having less than 20 employees. Only 14 per cent of respondents have 100 or more employees, indicating that the 2015 survey captured mainly small- to medium-sized enterprises (SMEs).
Figure A-3 Number of employeesSurvey question: How many employees does your company have?
Number of respondents = 1237
Thirty per cent of respondents earned less than $1 million in revenues in the last financial year i.e. 2013-2014, as shown in Figure A-4. Half of the respondents earned between $1 million and $20 million, and only 5 per cent of respondents earned more than $200 million. This further confirms that the survey respondents were mainly SMEs.
Figure A-4 Total revenue (financial year 2013-14)Survey question: What was your company’s total revenue last financial year?
Number of respondents = 1237
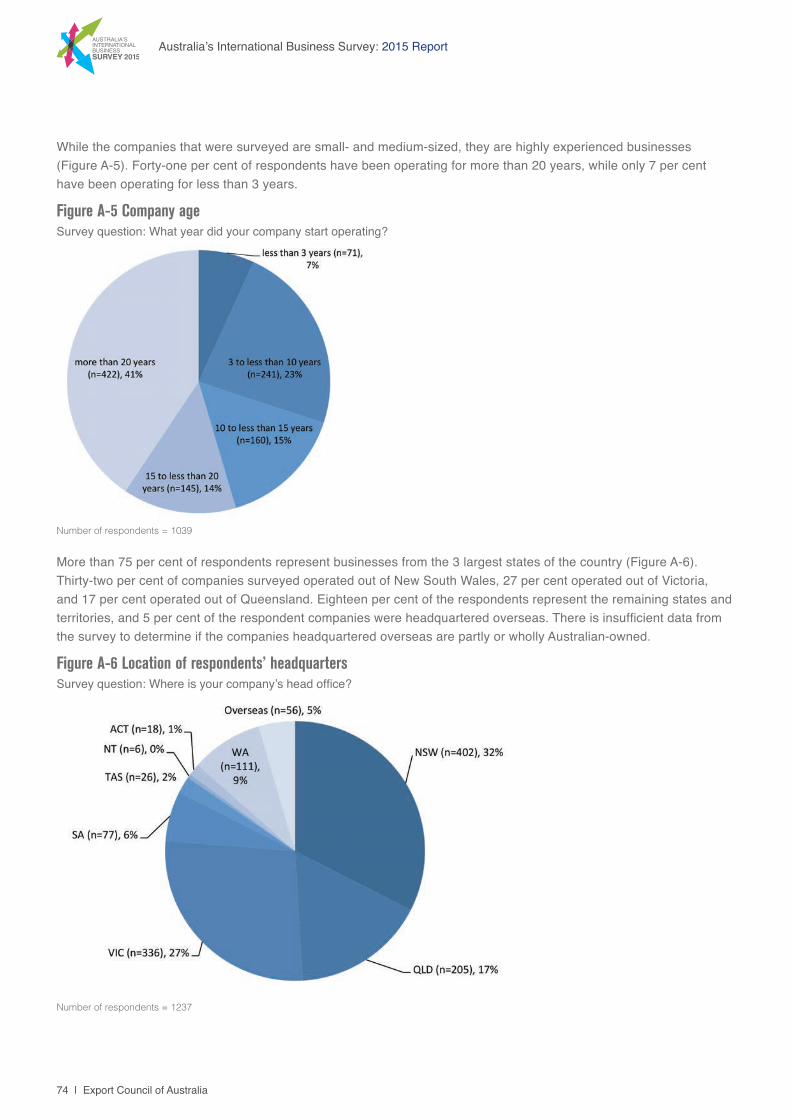
74 | Export Council of Australia
Australia’s International Business Survey: 2015 Report
More than 75 per cent of respondents represent businesses from the 3 largest states of the country (Figure A-6). Thirty-two per cent of companies surveyed operated out of New South Wales, 27 per cent operated out of Victoria, and 17 per cent operated out of Queensland. Eighteen per cent of the respondents represent the remaining states and territories, and 5 per cent of the respondent companies were headquartered overseas. There is insufficient data from the survey to determine if the companies headquartered overseas are partly or wholly Australian-owned.
While the companies that were surveyed are small- and medium-sized, they are highly experienced businesses (Figure A-5). Forty-one per cent of respondents have been operating for more than 20 years, while only 7 per cent have been operating for less than 3 years.
Figure A-5 Company age Survey question: What year did your company start operating?
Number of respondents = 1039
Figure A-6 Location of respondents’ headquartersSurvey question: Where is your company’s head office?
Number of respondents = 1237
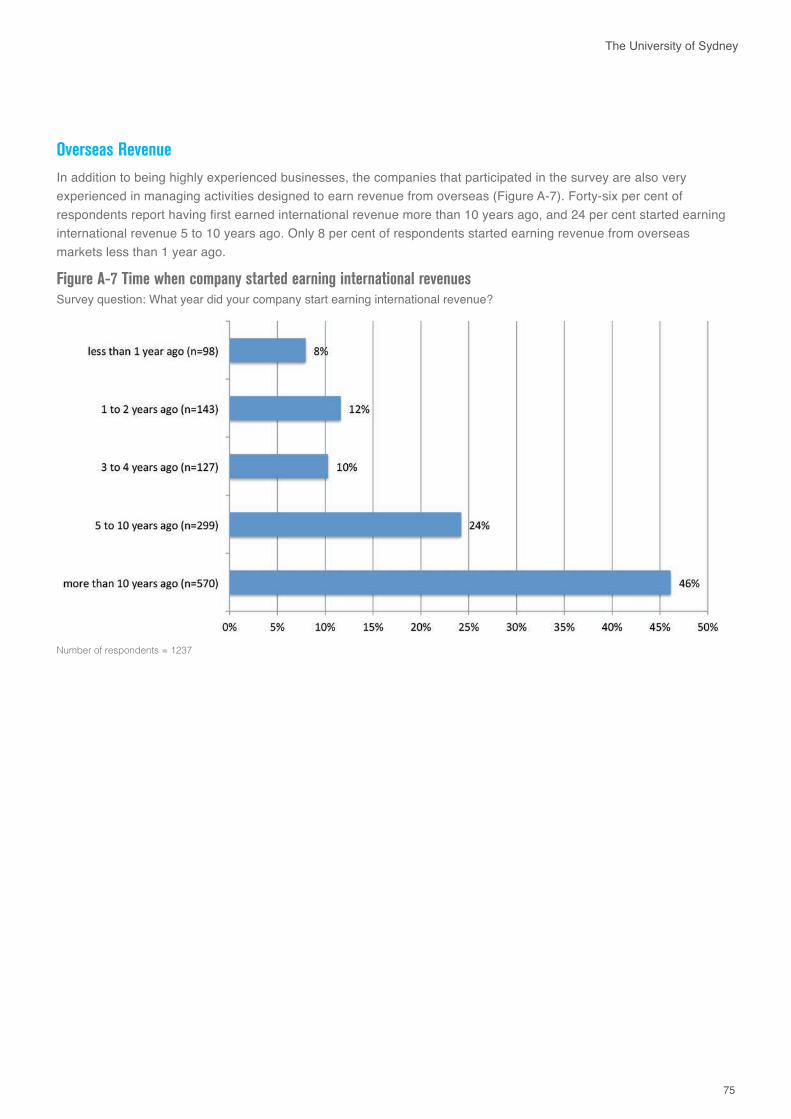
75
The University of Sydney
Overseas Revenue In addition to being highly experienced businesses, the companies that participated in the survey are also very experienced in managing activities designed to earn revenue from overseas (Figure A-7). Forty-six per cent of respondents report having first earned international revenue more than 10 years ago, and 24 per cent started earning international revenue 5 to 10 years ago. Only 8 per cent of respondents started earning revenue from overseas markets less than 1 year ago.
Figure A-7 Time when company started earning international revenuesSurvey question: What year did your company start earning international revenue?
Number of respondents = 1237
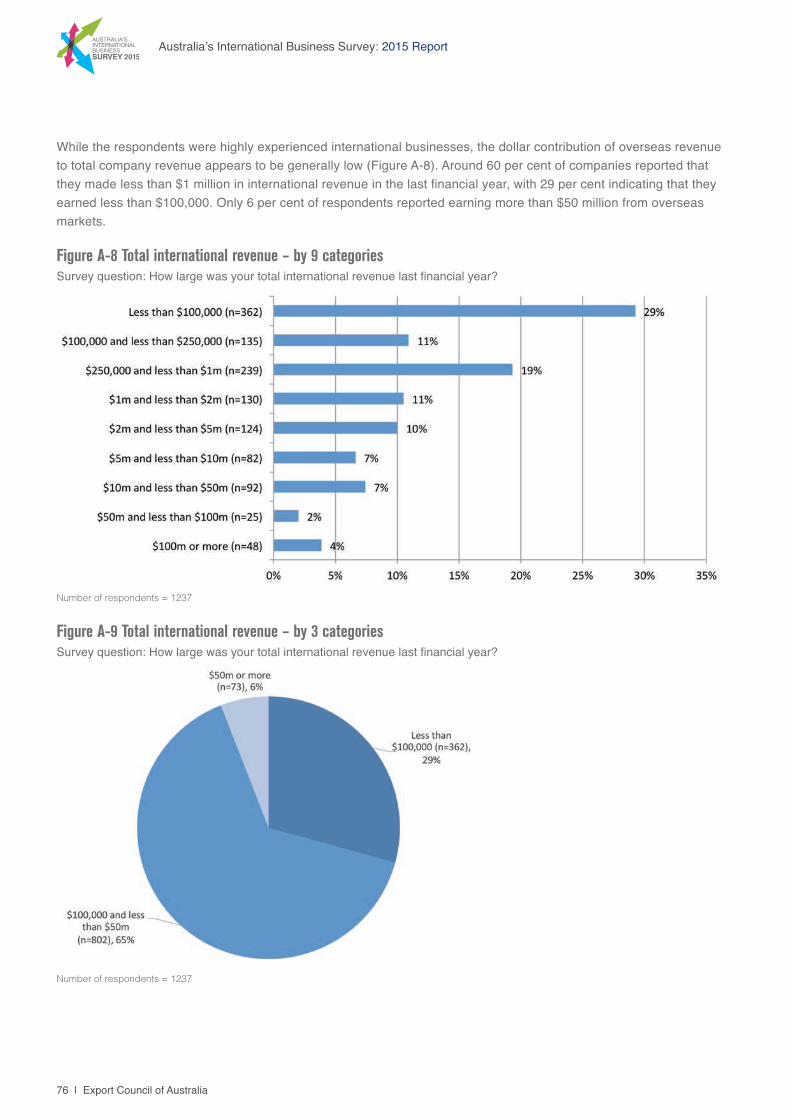
76 | Export Council of Australia
Australia’s International Business Survey: 2015 Report
While the respondents were highly experienced international businesses, the dollar contribution of overseas revenue to total company revenue appears to be generally low (Figure A-8). Around 60 per cent of companies reported that they made less than $1 million in international revenue in the last financial year, with 29 per cent indicating that they earned less than $100,000. Only 6 per cent of respondents reported earning more than $50 million from overseas markets.
Figure A-8 Total international revenue – by 9 categoriesSurvey question: How large was your total international revenue last financial year?
Number of respondents = 1237
Figure A-9 Total international revenue – by 3 categories Survey question: How large was your total international revenue last financial year?
Number of respondents = 1237
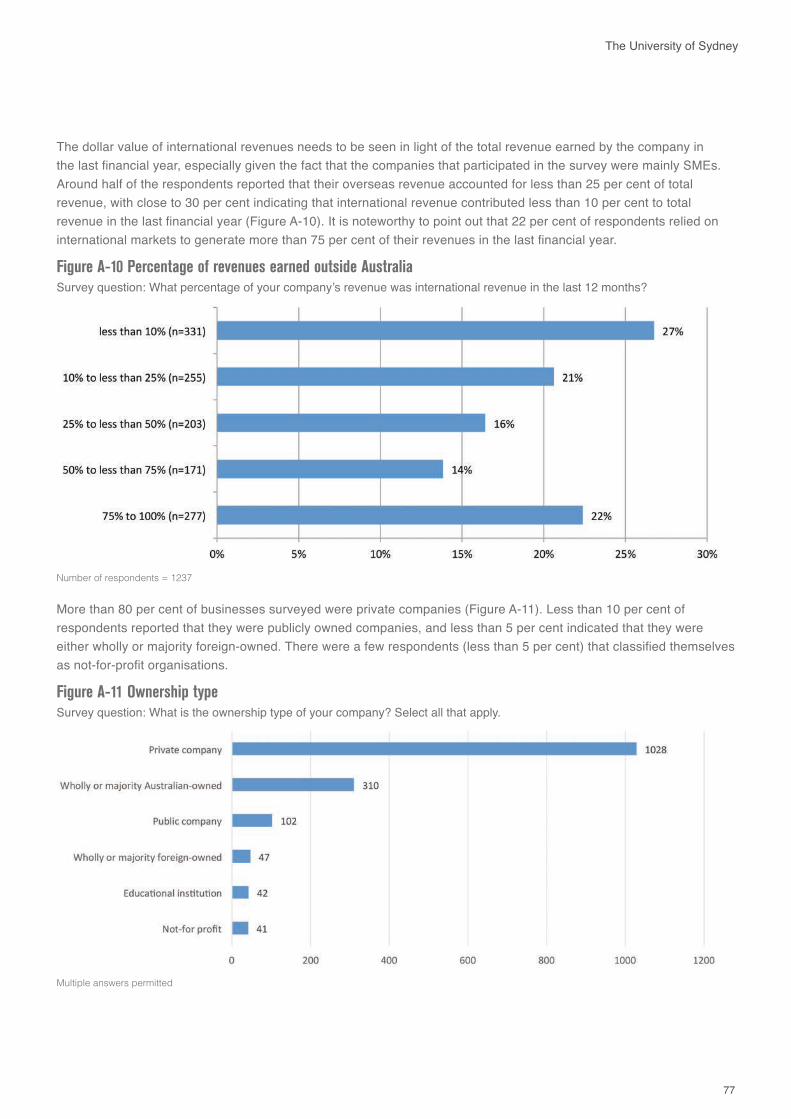
77
The University of Sydney
The dollar value of international revenues needs to be seen in light of the total revenue earned by the company in the last financial year, especially given the fact that the companies that participated in the survey were mainly SMEs. Around half of the respondents reported that their overseas revenue accounted for less than 25 per cent of total revenue, with close to 30 per cent indicating that international revenue contributed less than 10 per cent to total revenue in the last financial year (Figure A-10). It is noteworthy to point out that 22 per cent of respondents relied on international markets to generate more than 75 per cent of their revenues in the last financial year.
Figure A-10 Percentage of revenues earned outside AustraliaSurvey question: What percentage of your company’s revenue was international revenue in the last 12 months?
Number of respondents = 1237
More than 80 per cent of businesses surveyed were private companies (Figure A-11). Less than 10 per cent of respondents reported that they were publicly owned companies, and less than 5 per cent indicated that they were either wholly or majority foreign-owned. There were a few respondents (less than 5 per cent) that classified themselves as not-for-profit organisations.
Figure A-11 Ownership typeSurvey question: What is the ownership type of your company? Select all that apply.
Multiple answers permitted
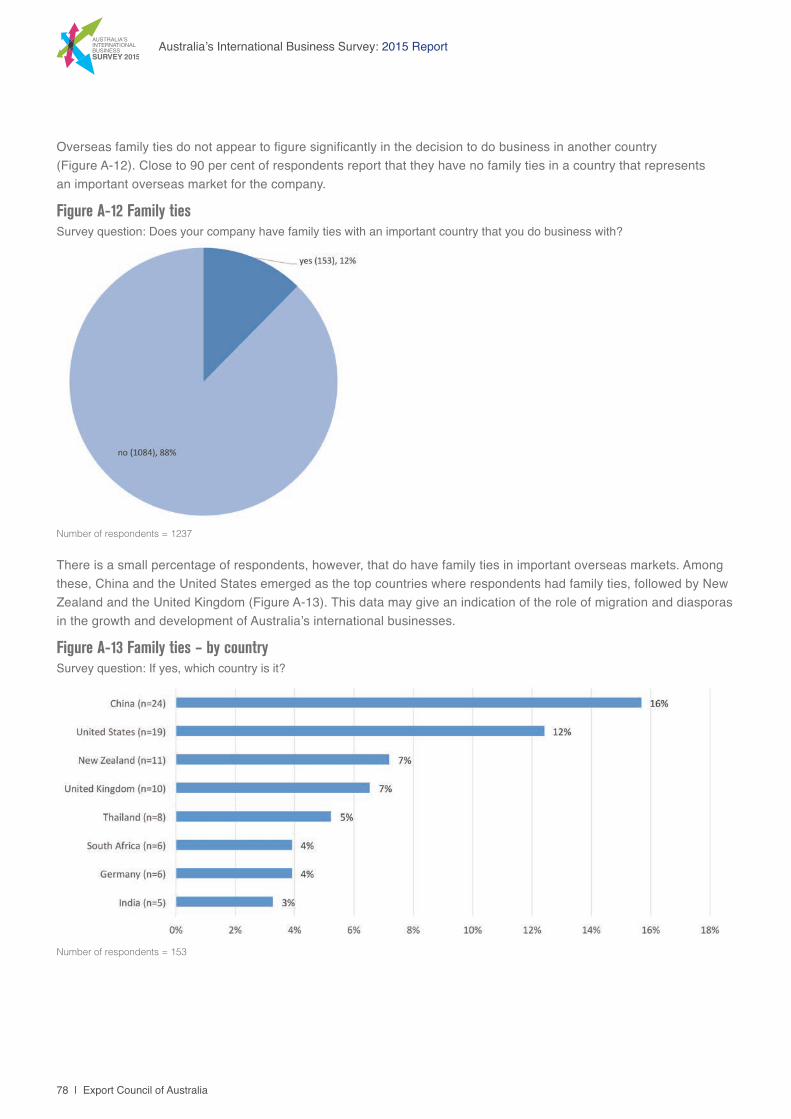
78 | Export Council of Australia
Australia’s International Business Survey: 2015 Report
Overseas family ties do not appear to figure significantly in the decision to do business in another country (Figure A-12). Close to 90 per cent of respondents report that they have no family ties in a country that represents an important overseas market for the company.
Figure A-12 Family ties Survey question: Does your company have family ties with an important country that you do business with?
Number of respondents = 1237
There is a small percentage of respondents, however, that do have family ties in important overseas markets. Among these, China and the United States emerged as the top countries where respondents had family ties, followed by New Zealand and the United Kingdom (Figure A-13). This data may give an indication of the role of migration and diasporas in the growth and development of Australia’s international businesses.
Figure A-13 Family ties – by countrySurvey question: If yes, which country is it?
Number of respondents = 153
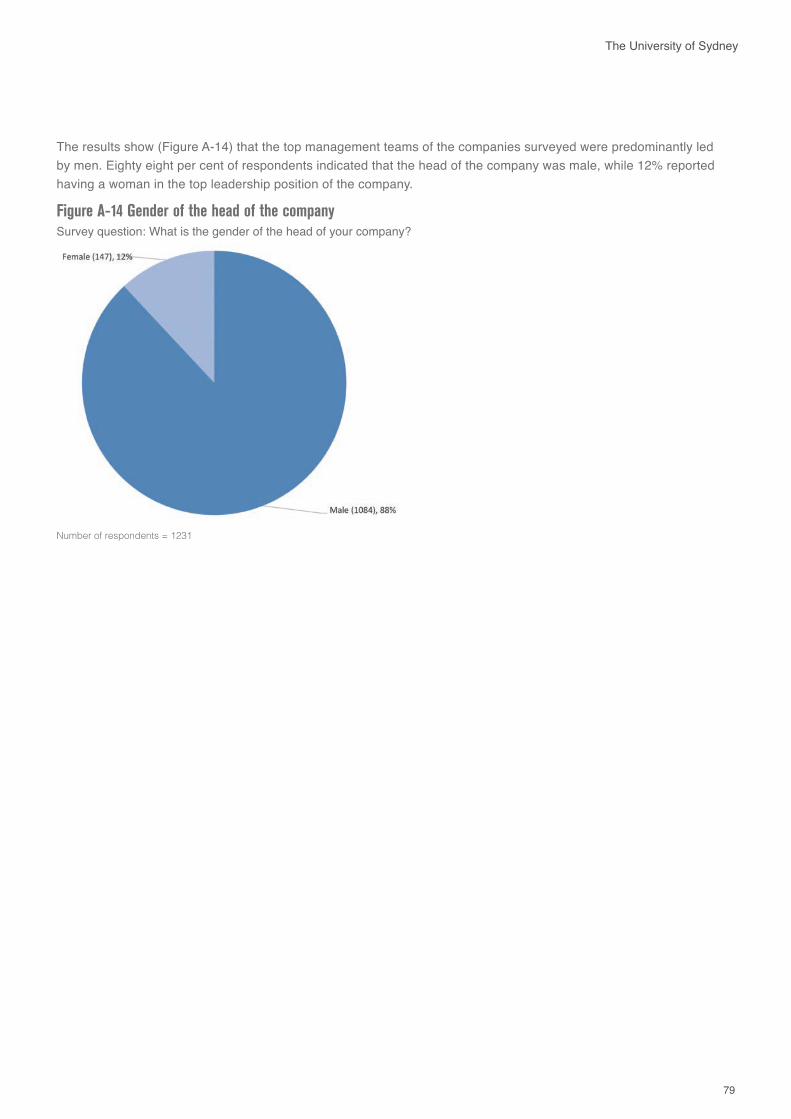
79
The University of Sydney
The results show (Figure A-14) that the top management teams of the companies surveyed were predominantly led by men. Eighty eight per cent of respondents indicated that the head of the company was male, while 12% reported having a woman in the top leadership position of the company.
Figure A-14 Gender of the head of the company Survey question: What is the gender of the head of your company?
Number of respondents = 1231
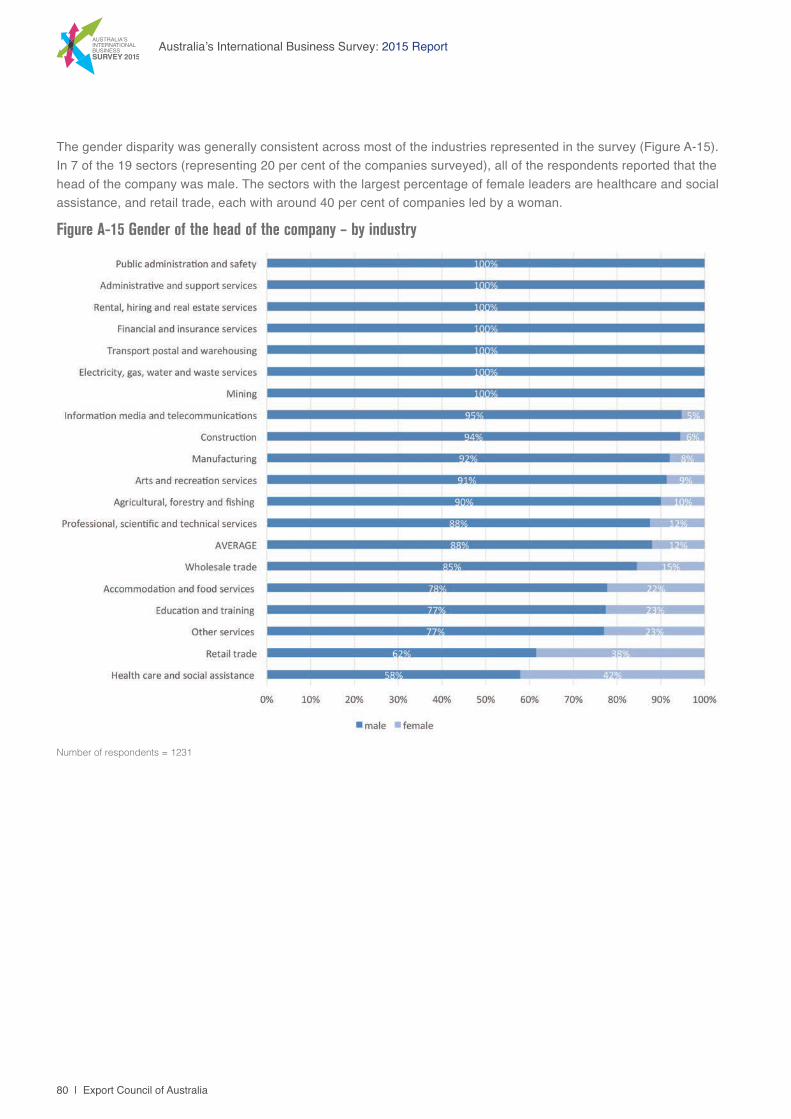
80 | Export Council of Australia
Australia’s International Business Survey: 2015 Report
The gender disparity was generally consistent across most of the industries represented in the survey (Figure A-15). In 7 of the 19 sectors (representing 20 per cent of the companies surveyed), all of the respondents reported that the head of the company was male. The sectors with the largest percentage of female leaders are healthcare and social assistance, and retail trade, each with around 40 per cent of companies led by a woman.
Figure A-15 Gender of the head of the company – by industry
Number of respondents = 1231
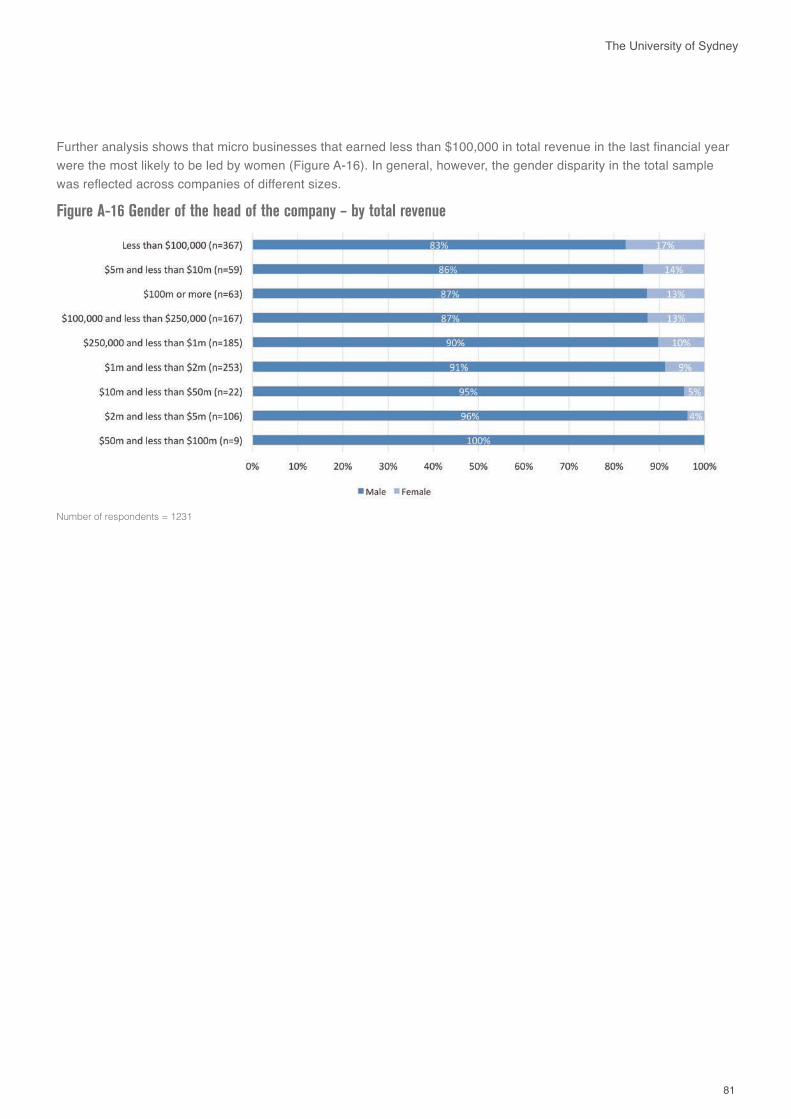
81
The University of Sydney
Further analysis shows that micro businesses that earned less than $100,000 in total revenue in the last financial year were the most likely to be led by women (Figure A-16). In general, however, the gender disparity in the total sample was reflected across companies of different sizes.
Figure A-16 Gender of the head of the company – by total revenue
Number of respondents = 1231
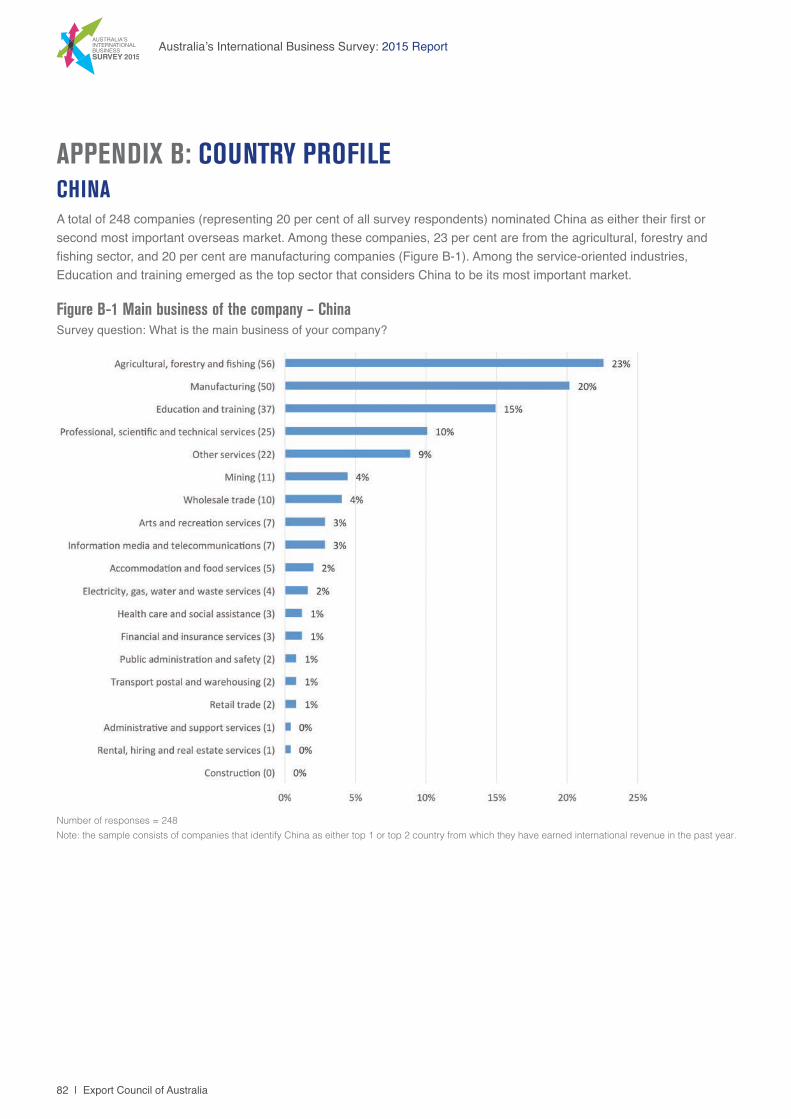
82 | Export Council of Australia
Australia’s International Business Survey: 2015 Report
Figure B-1 Main business of the company – China Survey question: What is the main business of your company?
Number of responses = 248 Note: the sample consists of companies that identify China as either top 1 or top 2 country from which they have earned international revenue in the past year.
APPENDIX B: COUNTRY PROFILECHINAA total of 248 companies (representing 20 per cent of all survey respondents) nominated China as either their first or second most important overseas market. Among these companies, 23 per cent are from the agricultural, forestry and fishing sector, and 20 per cent are manufacturing companies (Figure B-1). Among the service-oriented industries, Education and training emerged as the top sector that considers China to be its most important market.
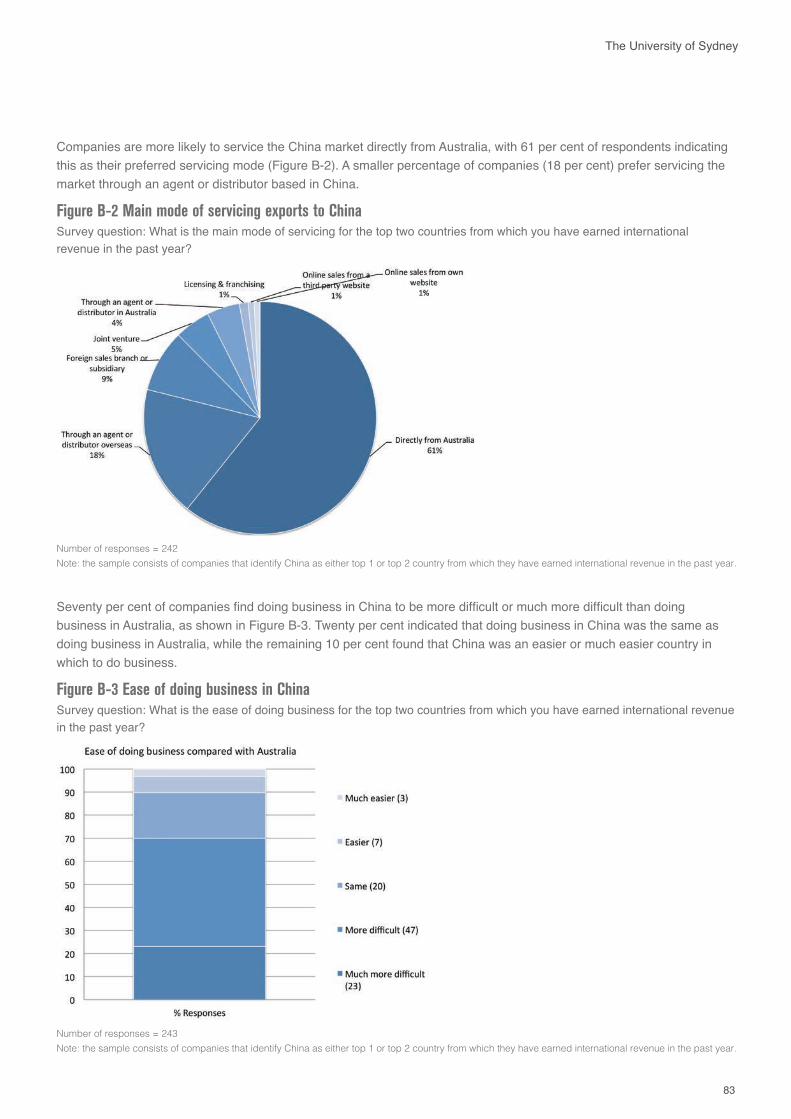
83
The University of Sydney
Figure B-2 Main mode of servicing exports to China Survey question: What is the main mode of servicing for the top two countries from which you have earned international revenue in the past year?
Number of responses = 242 Note: the sample consists of companies that identify China as either top 1 or top 2 country from which they have earned international revenue in the past year.
Figure B-3 Ease of doing business in China Survey question: What is the ease of doing business for the top two countries from which you have earned international revenue in the past year?
Number of responses = 243 Note: the sample consists of companies that identify China as either top 1 or top 2 country from which they have earned international revenue in the past year.
Companies are more likely to service the China market directly from Australia, with 61 per cent of respondents indicating this as their preferred servicing mode (Figure B-2). A smaller percentage of companies (18 per cent) prefer servicing the market through an agent or distributor based in China.
Seventy per cent of companies find doing business in China to be more difficult or much more difficult than doing business in Australia, as shown in Figure B-3. Twenty per cent indicated that doing business in China was the same as doing business in Australia, while the remaining 10 per cent found that China was an easier or much easier country in which to do business.
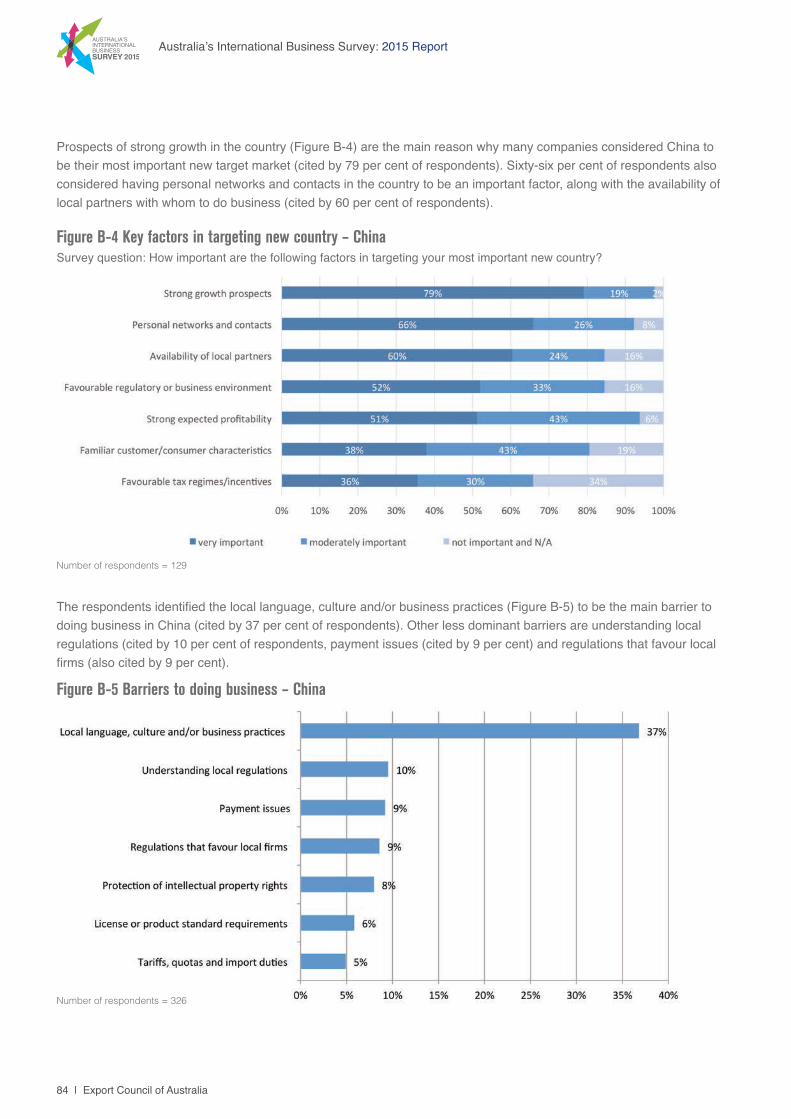
84 | Export Council of Australia
Australia’s International Business Survey: 2015 Report
Figure B-4 Key factors in targeting new country – ChinaSurvey question: How important are the following factors in targeting your most important new country?
Number of respondents = 129
Prospects of strong growth in the country (Figure B-4) are the main reason why many companies considered China to be their most important new target market (cited by 79 per cent of respondents). Sixty-six per cent of respondents also considered having personal networks and contacts in the country to be an important factor, along with the availability of local partners with whom to do business (cited by 60 per cent of respondents).
The respondents identified the local language, culture and/or business practices (Figure B-5) to be the main barrier to doing business in China (cited by 37 per cent of respondents). Other less dominant barriers are understanding local regulations (cited by 10 per cent of respondents, payment issues (cited by 9 per cent) and regulations that favour local firms (also cited by 9 per cent).
Figure B-5 Barriers to doing business – China
Number of respondents = 326
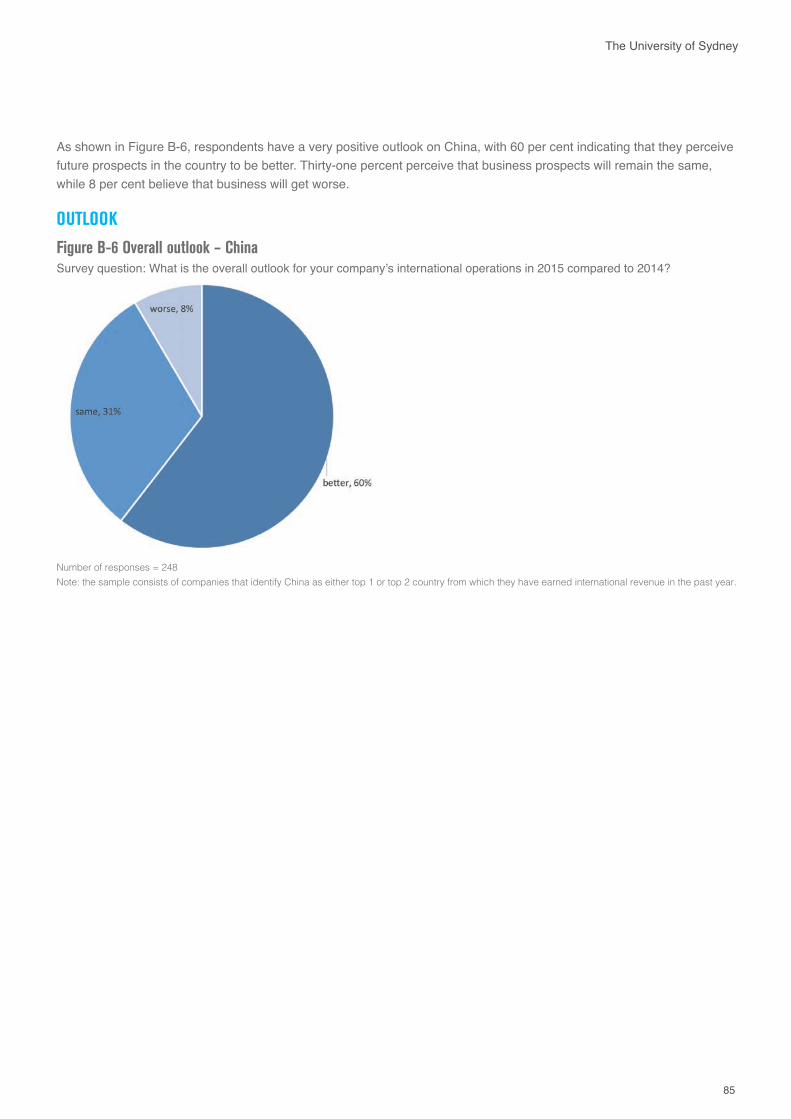
85
The University of Sydney
OUTLOOK
Figure B-6 Overall outlook – China Survey question: What is the overall outlook for your company’s international operations in 2015 compared to 2014?
Number of responses = 248 Note: the sample consists of companies that identify China as either top 1 or top 2 country from which they have earned international revenue in the past year.
As shown in Figure B-6, respondents have a very positive outlook on China, with 60 per cent indicating that they perceive future prospects in the country to be better. Thirty-one percent perceive that business prospects will remain the same, while 8 per cent believe that business will get worse.
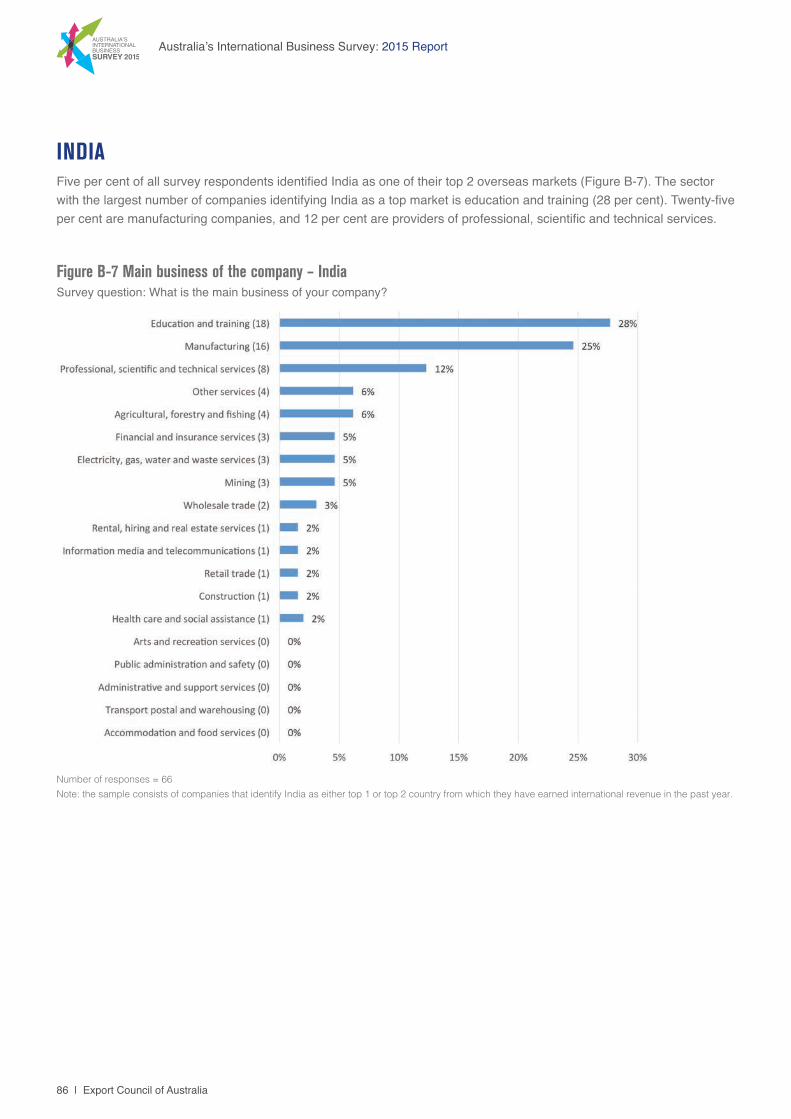
86 | Export Council of Australia
Australia’s International Business Survey: 2015 Report
Figure B-7 Main business of the company – India Survey question: What is the main business of your company?
Number of responses = 66 Note: the sample consists of companies that identify India as either top 1 or top 2 country from which they have earned international revenue in the past year.
INDIAFive per cent of all survey respondents identified India as one of their top 2 overseas markets (Figure B-7). The sector with the largest number of companies identifying India as a top market is education and training (28 per cent). Twenty-five per cent are manufacturing companies, and 12 per cent are providers of professional, scientific and technical services.
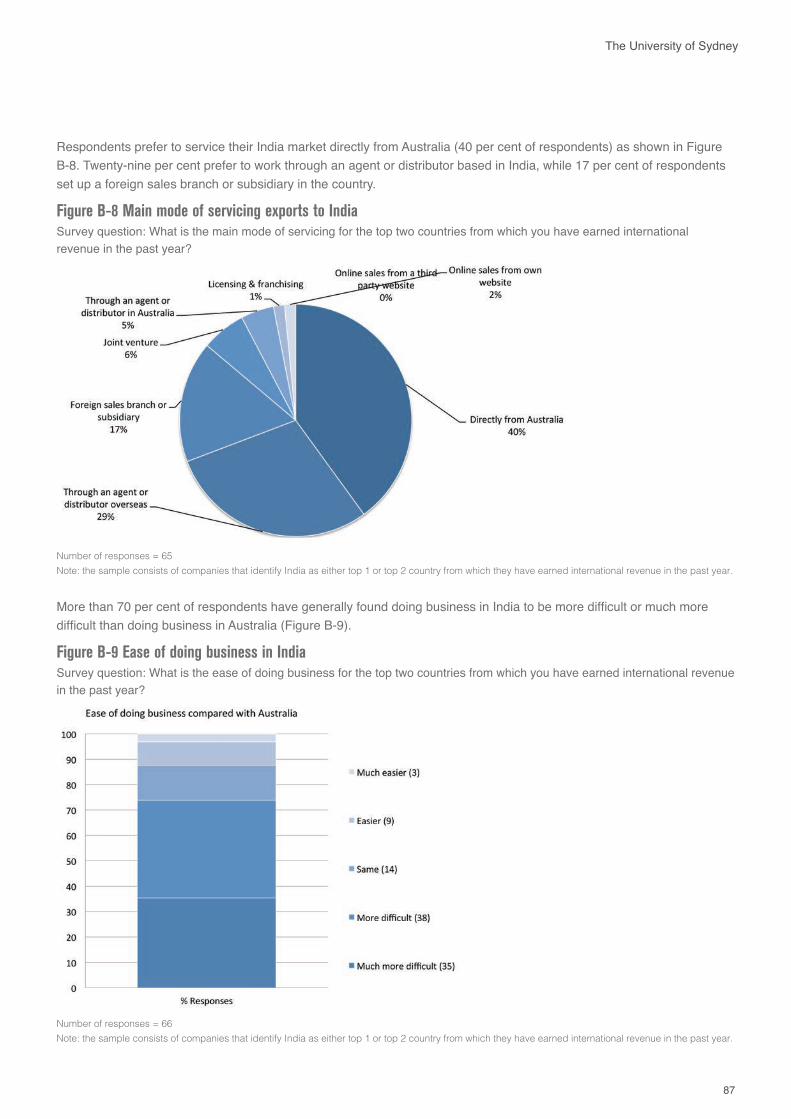
87
The University of Sydney
Figure B-8 Main mode of servicing exports to India Survey question: What is the main mode of servicing for the top two countries from which you have earned international revenue in the past year?
Number of responses = 65 Note: the sample consists of companies that identify India as either top 1 or top 2 country from which they have earned international revenue in the past year.
Figure B-9 Ease of doing business in India Survey question: What is the ease of doing business for the top two countries from which you have earned international revenue in the past year?
Number of responses = 66 Note: the sample consists of companies that identify India as either top 1 or top 2 country from which they have earned international revenue in the past year.
Respondents prefer to service their India market directly from Australia (40 per cent of respondents) as shown in Figure B-8. Twenty-nine per cent prefer to work through an agent or distributor based in India, while 17 per cent of respondents set up a foreign sales branch or subsidiary in the country.
More than 70 per cent of respondents have generally found doing business in India to be more difficult or much more difficult than doing business in Australia (Figure B-9).
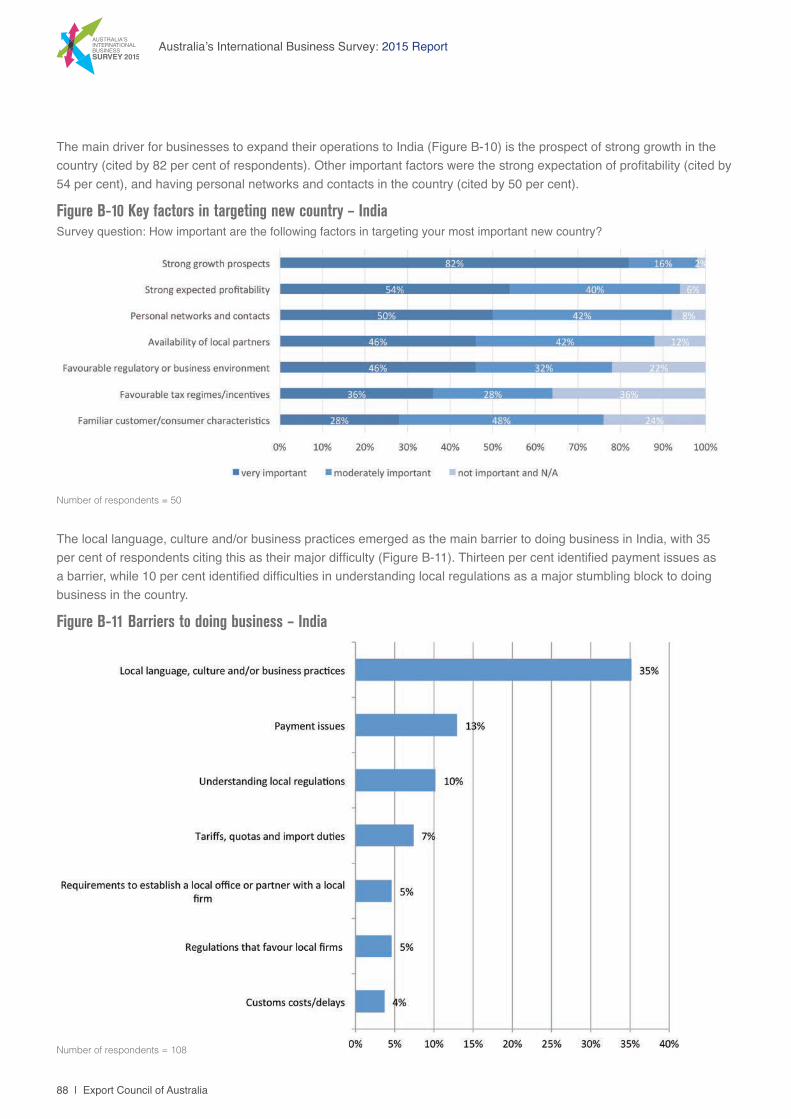
88 | Export Council of Australia
Australia’s International Business Survey: 2015 Report
Figure B-10 Key factors in targeting new country – IndiaSurvey question: How important are the following factors in targeting your most important new country?
Number of respondents = 50
Figure B-11 Barriers to doing business – India
Number of respondents = 108
The main driver for businesses to expand their operations to India (Figure B-10) is the prospect of strong growth in the country (cited by 82 per cent of respondents). Other important factors were the strong expectation of profitability (cited by 54 per cent), and having personal networks and contacts in the country (cited by 50 per cent).
The local language, culture and/or business practices emerged as the main barrier to doing business in India, with 35 per cent of respondents citing this as their major difficulty (Figure B-11). Thirteen per cent identified payment issues as a barrier, while 10 per cent identified difficulties in understanding local regulations as a major stumbling block to doing business in the country.
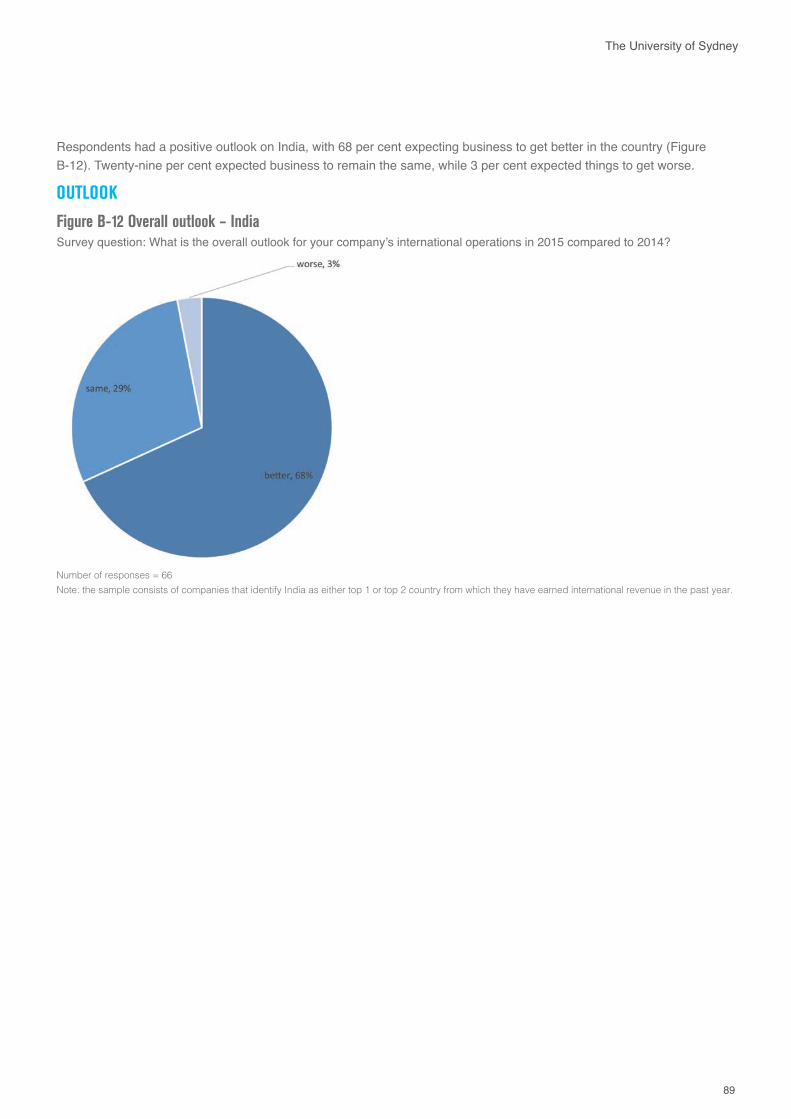
89
The University of Sydney
OUTLOOK
Figure B-12 Overall outlook – India Survey question: What is the overall outlook for your company’s international operations in 2015 compared to 2014?
Number of responses = 66 Note: the sample consists of companies that identify India as either top 1 or top 2 country from which they have earned international revenue in the past year.
Respondents had a positive outlook on India, with 68 per cent expecting business to get better in the country (Figure B-12). Twenty-nine per cent expected business to remain the same, while 3 per cent expected things to get worse.
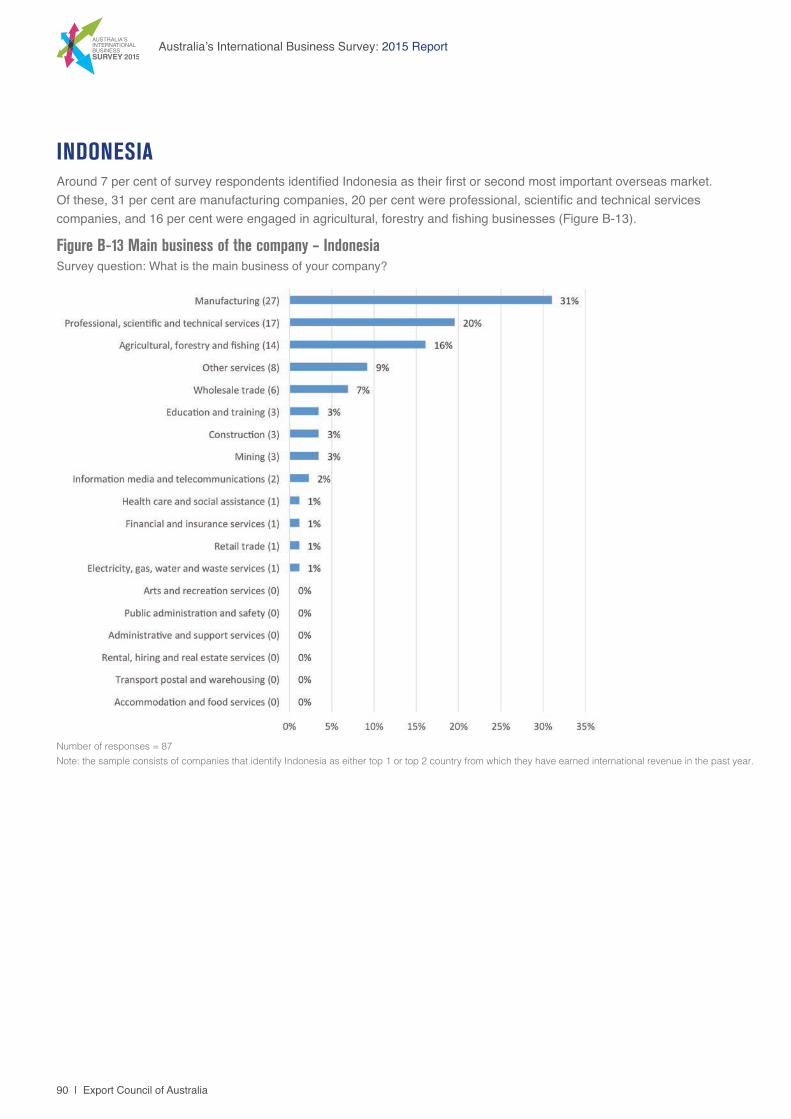
90 | Export Council of Australia
Australia’s International Business Survey: 2015 Report
Figure B-13 Main business of the company – Indonesia Survey question: What is the main business of your company?
Number of responses = 87 Note: the sample consists of companies that identify Indonesia as either top 1 or top 2 country from which they have earned international revenue in the past year.
INDONESIAAround 7 per cent of survey respondents identified Indonesia as their first or second most important overseas market. Of these, 31 per cent are manufacturing companies, 20 per cent were professional, scientific and technical services companies, and 16 per cent were engaged in agricultural, forestry and fishing businesses (Figure B-13).
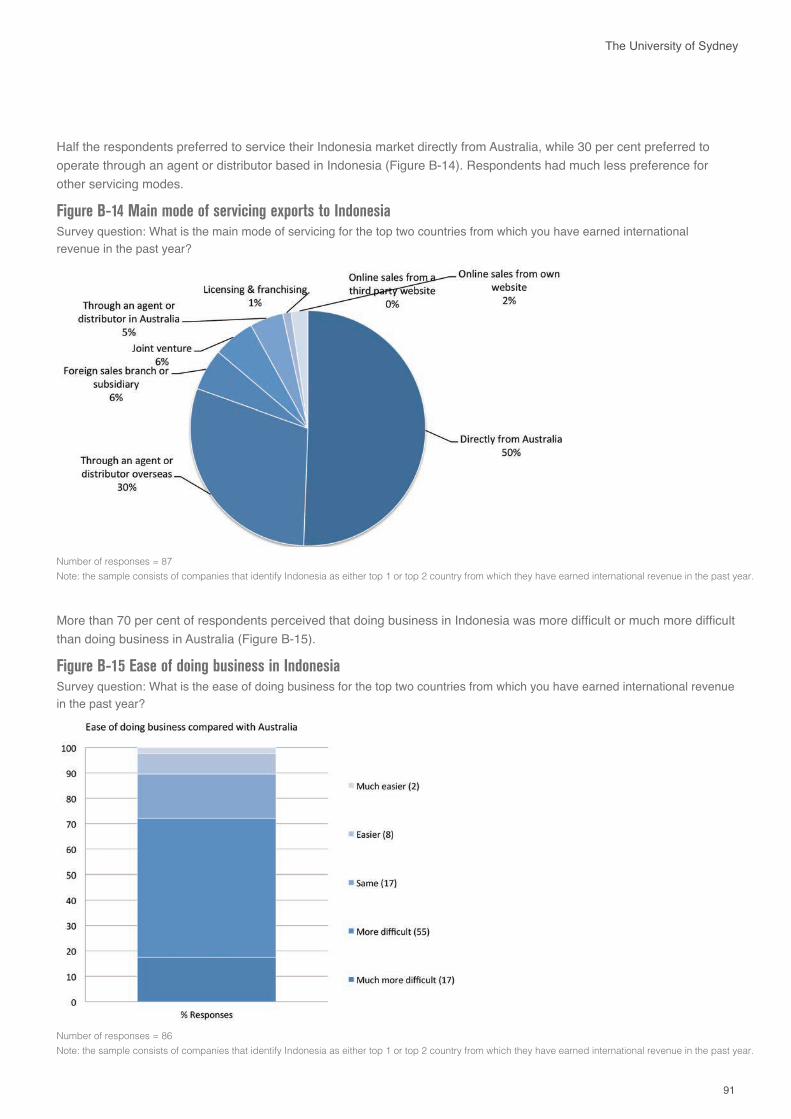
91
The University of Sydney
Figure B-14 Main mode of servicing exports to Indonesia Survey question: What is the main mode of servicing for the top two countries from which you have earned international revenue in the past year?
Number of responses = 87 Note: the sample consists of companies that identify Indonesia as either top 1 or top 2 country from which they have earned international revenue in the past year.
Figure B-15 Ease of doing business in Indonesia Survey question: What is the ease of doing business for the top two countries from which you have earned international revenue in the past year?
Number of responses = 86 Note: the sample consists of companies that identify Indonesia as either top 1 or top 2 country from which they have earned international revenue in the past year.
Half the respondents preferred to service their Indonesia market directly from Australia, while 30 per cent preferred to operate through an agent or distributor based in Indonesia (Figure B-14). Respondents had much less preference for other servicing modes.
More than 70 per cent of respondents perceived that doing business in Indonesia was more difficult or much more difficult than doing business in Australia (Figure B-15).
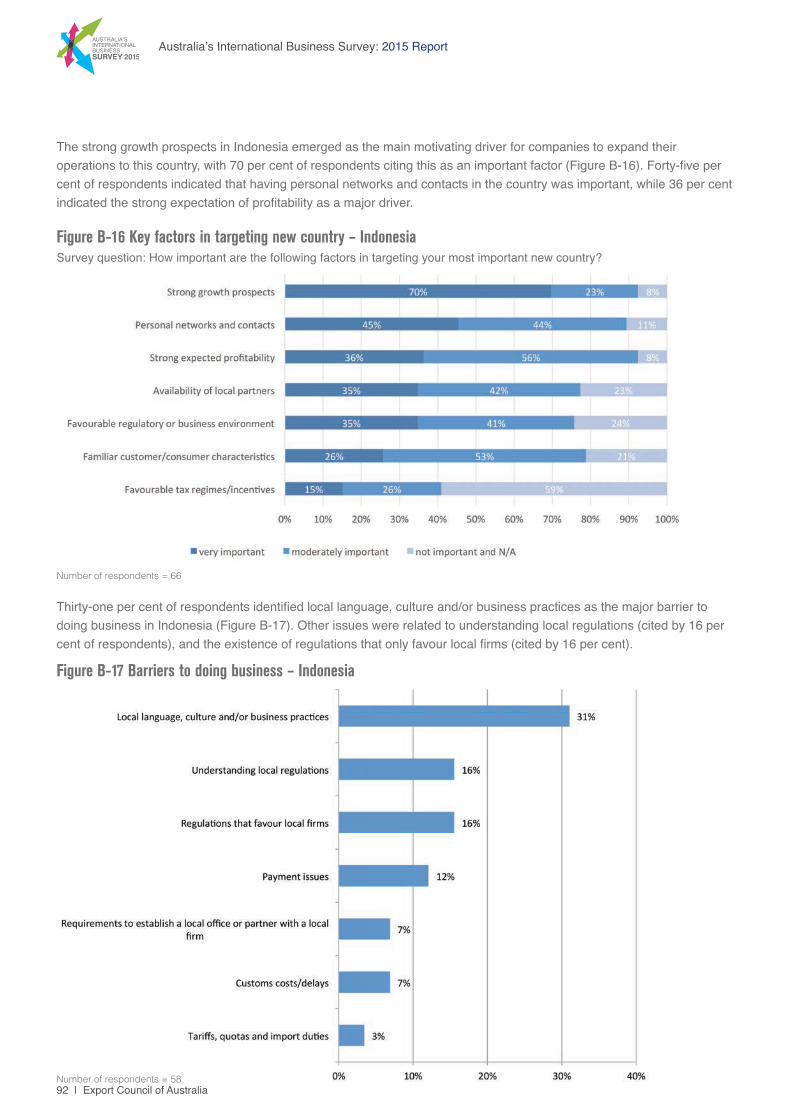
92 | Export Council of Australia
Australia’s International Business Survey: 2015 Report
Figure B-16 Key factors in targeting new country – Indonesia Survey question: How important are the following factors in targeting your most important new country?
Number of respondents = 66
Figure B-17 Barriers to doing business – Indonesia
Number of respondents = 58
The strong growth prospects in Indonesia emerged as the main motivating driver for companies to expand their operations to this country, with 70 per cent of respondents citing this as an important factor (Figure B-16). Forty-five per cent of respondents indicated that having personal networks and contacts in the country was important, while 36 per cent indicated the strong expectation of profitability as a major driver.
Thirty-one per cent of respondents identified local language, culture and/or business practices as the major barrier to doing business in Indonesia (Figure B-17). Other issues were related to understanding local regulations (cited by 16 per cent of respondents), and the existence of regulations that only favour local firms (cited by 16 per cent).
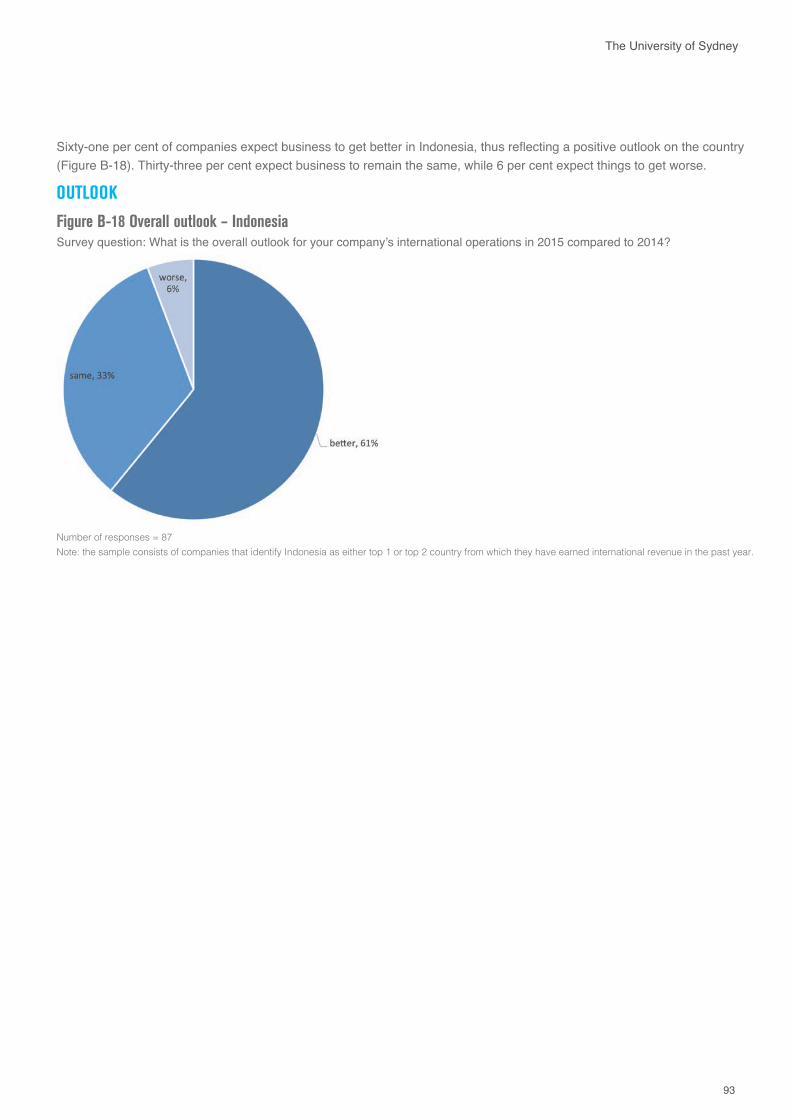
93
The University of Sydney
OUTLOOK
Figure B-18 Overall outlook – Indonesia Survey question: What is the overall outlook for your company’s international operations in 2015 compared to 2014?
Number of responses = 87Note: the sample consists of companies that identify Indonesia as either top 1 or top 2 country from which they have earned international revenue in the past year.
Sixty-one per cent of companies expect business to get better in Indonesia, thus reflecting a positive outlook on the country (Figure B-18). Thirty-three per cent expect business to remain the same, while 6 per cent expect things to get worse.
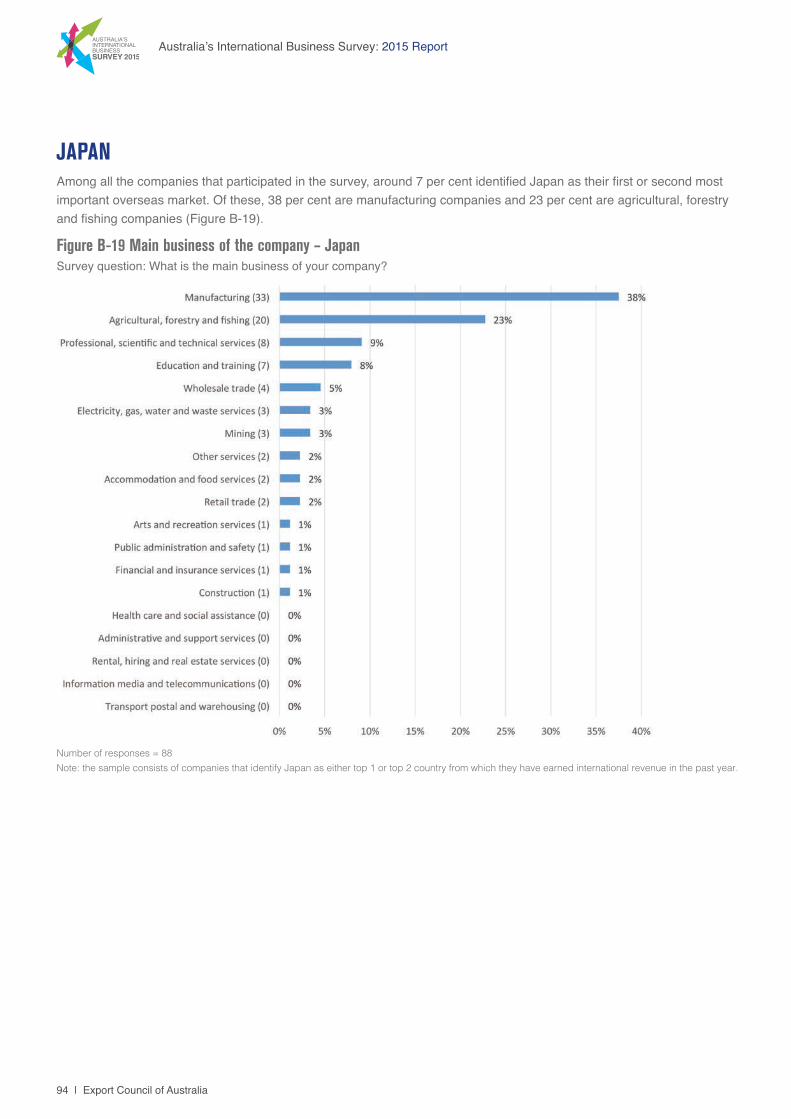
94 | Export Council of Australia
Australia’s International Business Survey: 2015 Report
Figure B-19 Main business of the company – Japan Survey question: What is the main business of your company?
Number of responses = 88 Note: the sample consists of companies that identify Japan as either top 1 or top 2 country from which they have earned international revenue in the past year.
JAPANAmong all the companies that participated in the survey, around 7 per cent identified Japan as their first or second most important overseas market. Of these, 38 per cent are manufacturing companies and 23 per cent are agricultural, forestry and fishing companies (Figure B-19).
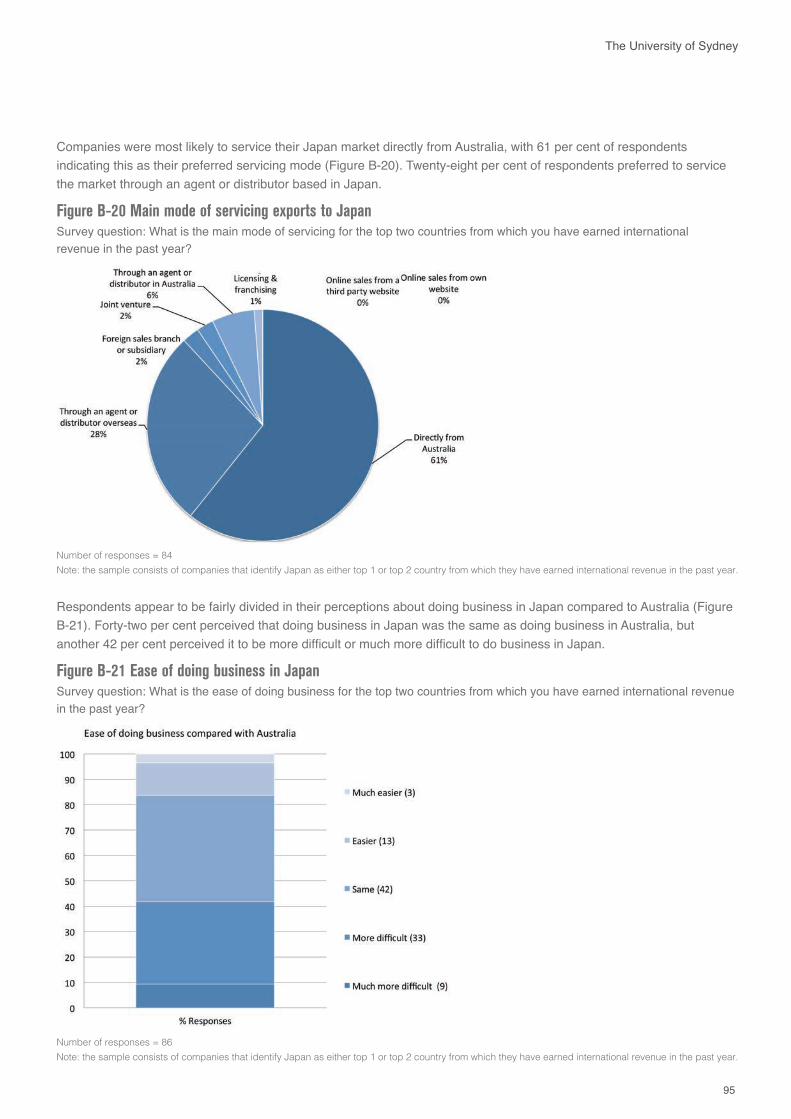
95
The University of Sydney
Number of responses = 88 Note: the sample consists of companies that identify Japan as either top 1 or top 2 country from which they have earned international revenue in the past year.
Figure B-20 Main mode of servicing exports to JapanSurvey question: What is the main mode of servicing for the top two countries from which you have earned international revenue in the past year?
Number of responses = 84 Note: the sample consists of companies that identify Japan as either top 1 or top 2 country from which they have earned international revenue in the past year.
Figure B-21 Ease of doing business in JapanSurvey question: What is the ease of doing business for the top two countries from which you have earned international revenue in the past year?
Number of responses = 86 Note: the sample consists of companies that identify Japan as either top 1 or top 2 country from which they have earned international revenue in the past year.
Companies were most likely to service their Japan market directly from Australia, with 61 per cent of respondents indicating this as their preferred servicing mode (Figure B-20). Twenty-eight per cent of respondents preferred to service the market through an agent or distributor based in Japan.
Respondents appear to be fairly divided in their perceptions about doing business in Japan compared to Australia (Figure B-21). Forty-two per cent perceived that doing business in Japan was the same as doing business in Australia, but another 42 per cent perceived it to be more difficult or much more difficult to do business in Japan.
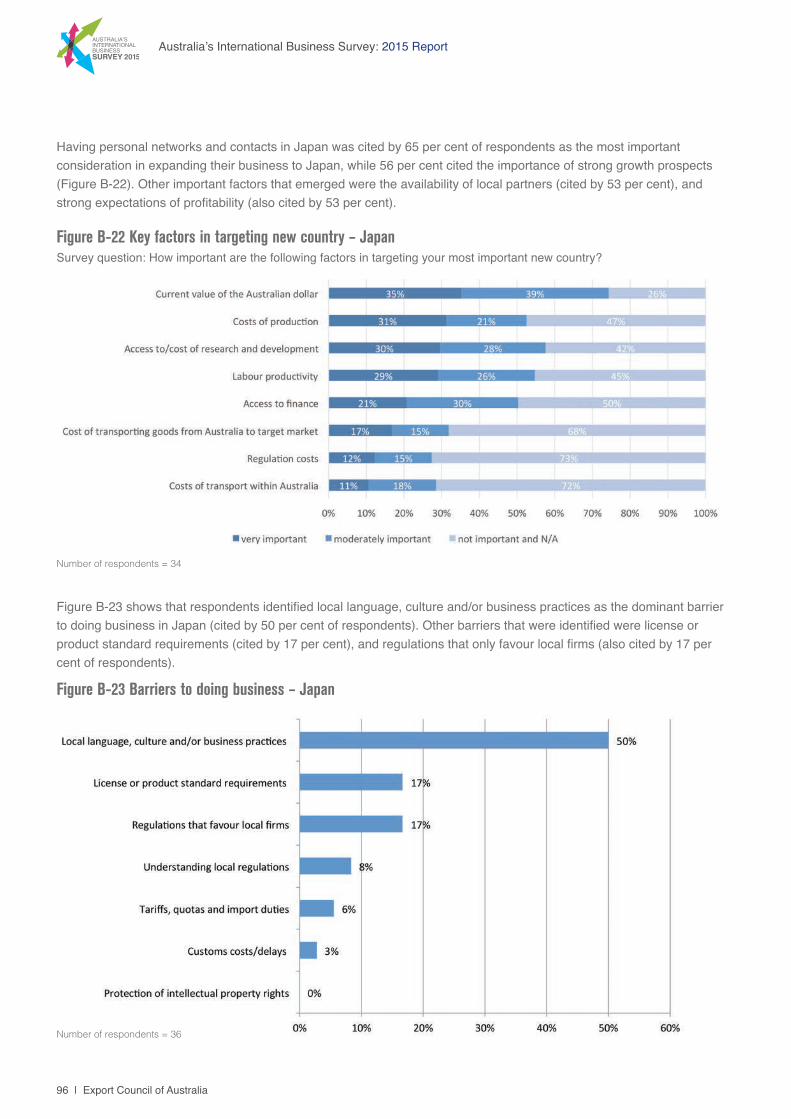
96 | Export Council of Australia
Australia’s International Business Survey: 2015 Report
Figure B-22 Key factors in targeting new country – JapanSurvey question: How important are the following factors in targeting your most important new country?
Number of respondents = 34
Figure B-23 Barriers to doing business – Japan
Number of respondents = 36
Having personal networks and contacts in Japan was cited by 65 per cent of respondents as the most important consideration in expanding their business to Japan, while 56 per cent cited the importance of strong growth prospects (Figure B-22). Other important factors that emerged were the availability of local partners (cited by 53 per cent), and strong expectations of profitability (also cited by 53 per cent).
Figure B-23 shows that respondents identified local language, culture and/or business practices as the dominant barrier to doing business in Japan (cited by 50 per cent of respondents). Other barriers that were identified were license or product standard requirements (cited by 17 per cent), and regulations that only favour local firms (also cited by 17 per cent of respondents).
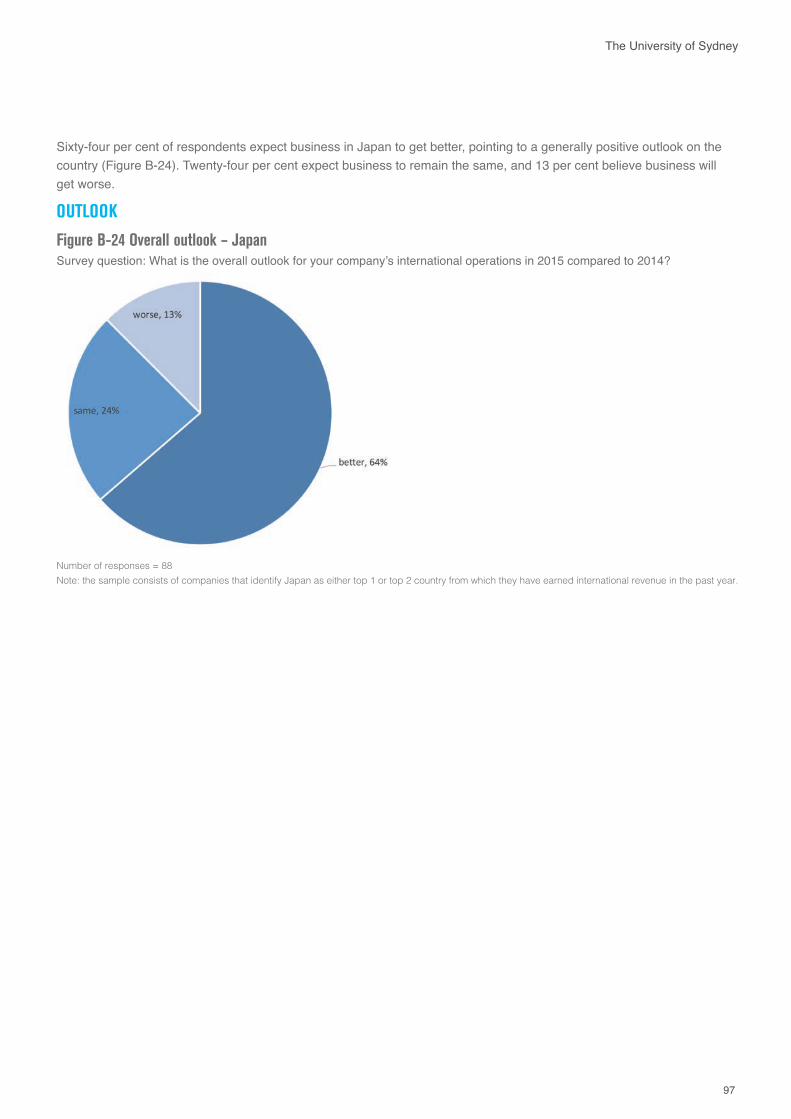
97
The University of Sydney
OUTLOOK
Figure B-24 Overall outlook – Japan Survey question: What is the overall outlook for your company’s international operations in 2015 compared to 2014?
Number of responses = 88 Note: the sample consists of companies that identify Japan as either top 1 or top 2 country from which they have earned international revenue in the past year.
Sixty-four per cent of respondents expect business in Japan to get better, pointing to a generally positive outlook on the country (Figure B-24). Twenty-four per cent expect business to remain the same, and 13 per cent believe business will get worse.
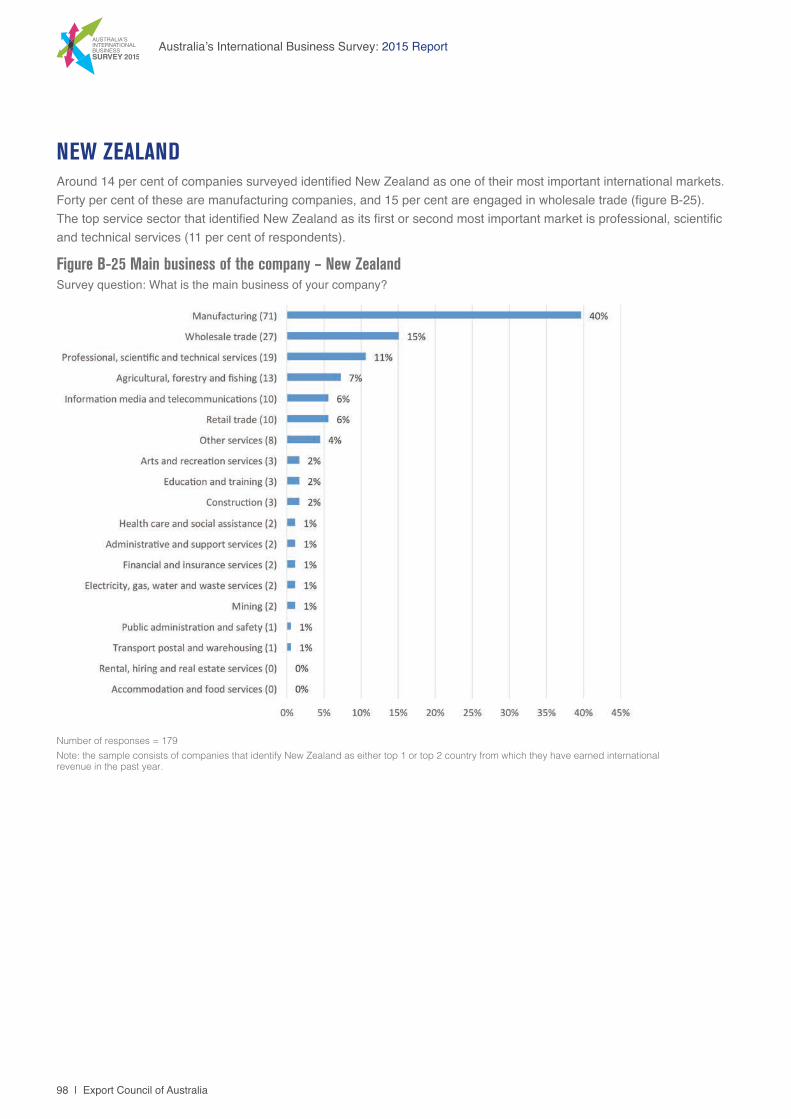
98 | Export Council of Australia
Australia’s International Business Survey: 2015 Report
Figure B-25 Main business of the company – New Zealand Survey question: What is the main business of your company?
Number of responses = 179 Note: the sample consists of companies that identify New Zealand as either top 1 or top 2 country from which they have earned international revenue in the past year.
NEW ZEALANDAround 14 per cent of companies surveyed identified New Zealand as one of their most important international markets. Forty per cent of these are manufacturing companies, and 15 per cent are engaged in wholesale trade (figure B-25). The top service sector that identified New Zealand as its first or second most important market is professional, scientific and technical services (11 per cent of respondents).
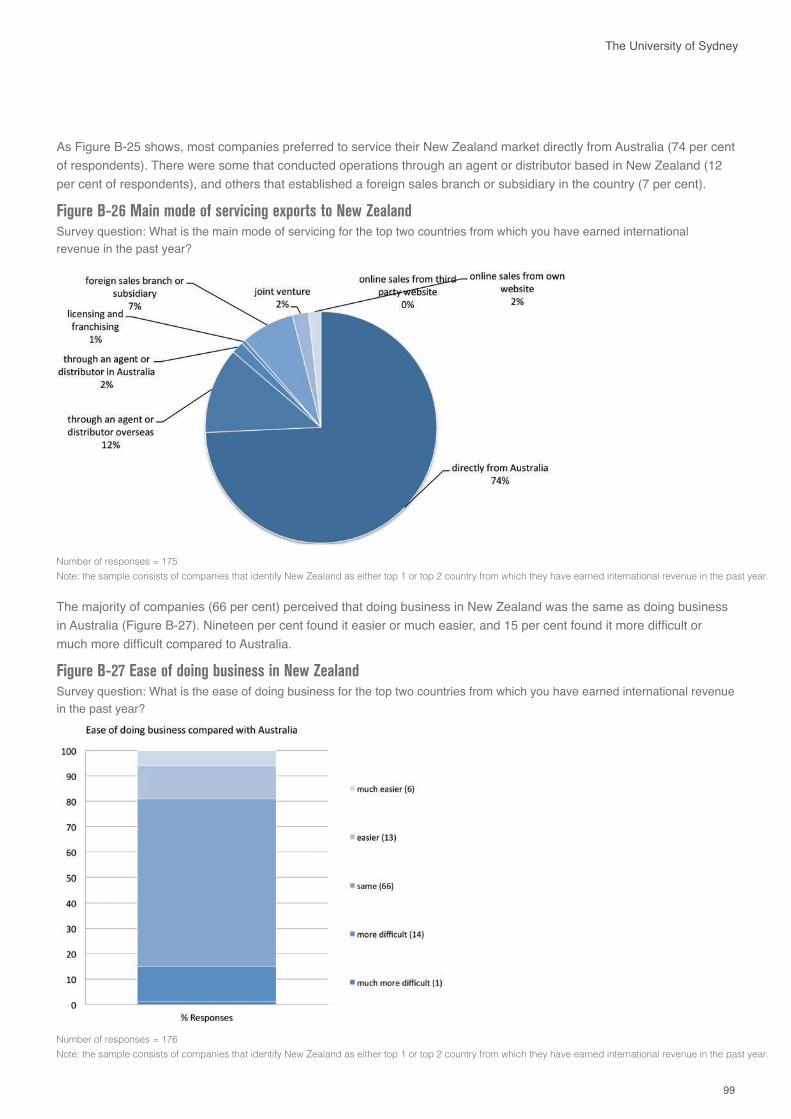
99
The University of Sydney
Figure B-26 Main mode of servicing exports to New ZealandSurvey question: What is the main mode of servicing for the top two countries from which you have earned international revenue in the past year?
Number of responses = 175 Note: the sample consists of companies that identify New Zealand as either top 1 or top 2 country from which they have earned international revenue in the past year.
Figure B-27 Ease of doing business in New Zealand Survey question: What is the ease of doing business for the top two countries from which you have earned international revenue in the past year?
Number of responses = 176 Note: the sample consists of companies that identify New Zealand as either top 1 or top 2 country from which they have earned international revenue in the past year.
As Figure B-25 shows, most companies preferred to service their New Zealand market directly from Australia (74 per cent of respondents). There were some that conducted operations through an agent or distributor based in New Zealand (12 per cent of respondents), and others that established a foreign sales branch or subsidiary in the country (7 per cent).
The majority of companies (66 per cent) perceived that doing business in New Zealand was the same as doing business in Australia (Figure B-27). Nineteen per cent found it easier or much easier, and 15 per cent found it more difficult or much more difficult compared to Australia.
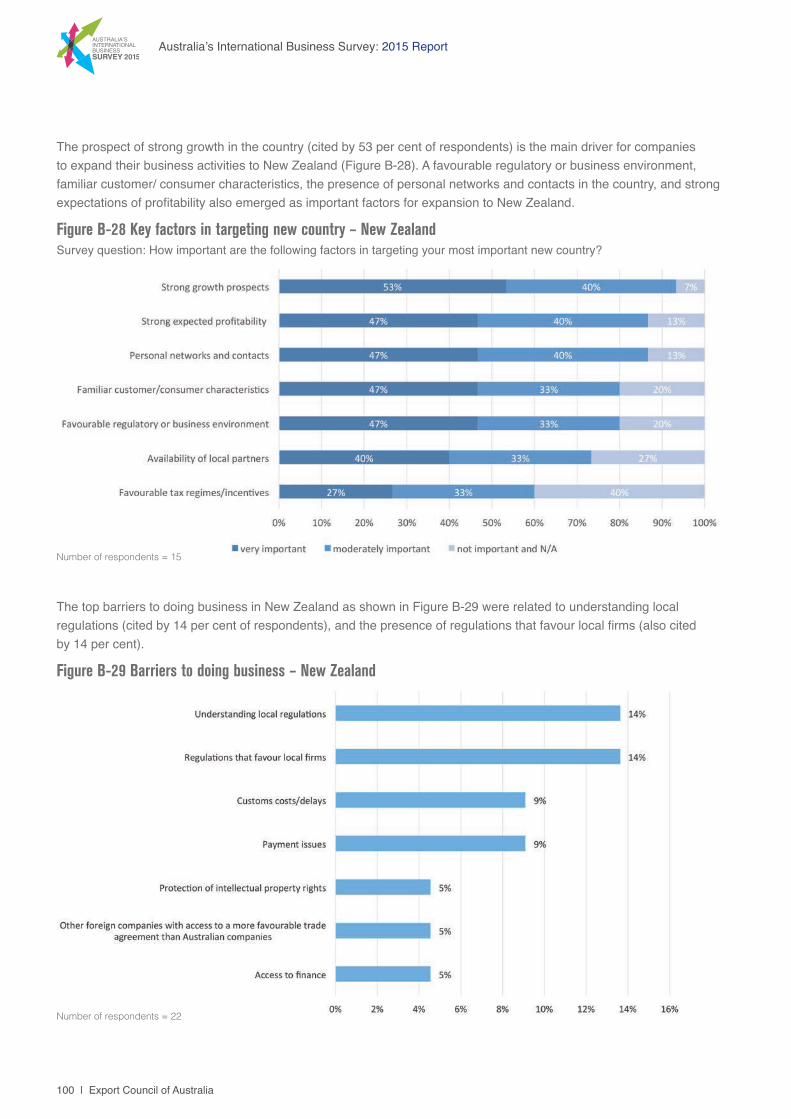
100 | Export Council of Australia
Australia’s International Business Survey: 2015 Report
Figure B-28 Key factors in targeting new country – New ZealandSurvey question: How important are the following factors in targeting your most important new country?
Number of respondents = 15
Figure B-29 Barriers to doing business – New Zealand
Number of respondents = 22
The prospect of strong growth in the country (cited by 53 per cent of respondents) is the main driver for companies to expand their business activities to New Zealand (Figure B-28). A favourable regulatory or business environment, familiar customer/ consumer characteristics, the presence of personal networks and contacts in the country, and strong expectations of profitability also emerged as important factors for expansion to New Zealand.
The top barriers to doing business in New Zealand as shown in Figure B-29 were related to understanding local regulations (cited by 14 per cent of respondents), and the presence of regulations that favour local firms (also cited by 14 per cent).
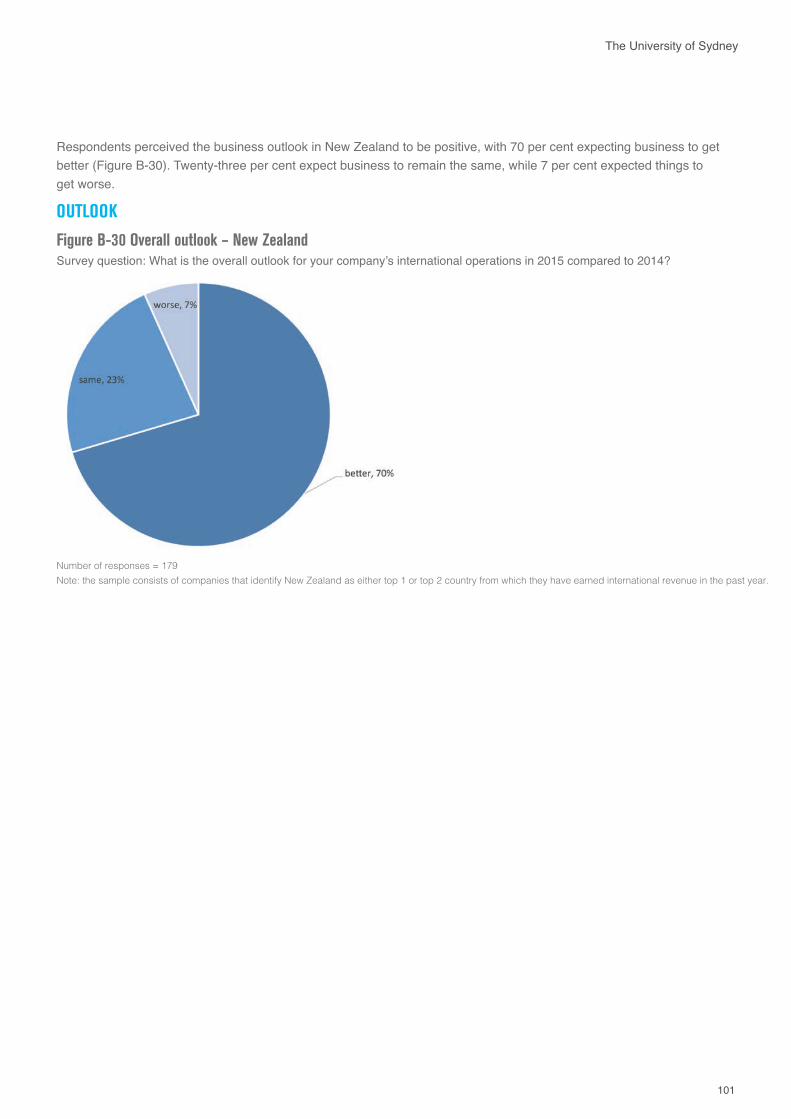
101
The University of Sydney
OUTLOOK
Figure B-30 Overall outlook – New Zealand Survey question: What is the overall outlook for your company’s international operations in 2015 compared to 2014?
Number of responses = 179 Note: the sample consists of companies that identify New Zealand as either top 1 or top 2 country from which they have earned international revenue in the past year.
Respondents perceived the business outlook in New Zealand to be positive, with 70 per cent expecting business to get better (Figure B-30). Twenty-three per cent expect business to remain the same, while 7 per cent expected things to get worse.
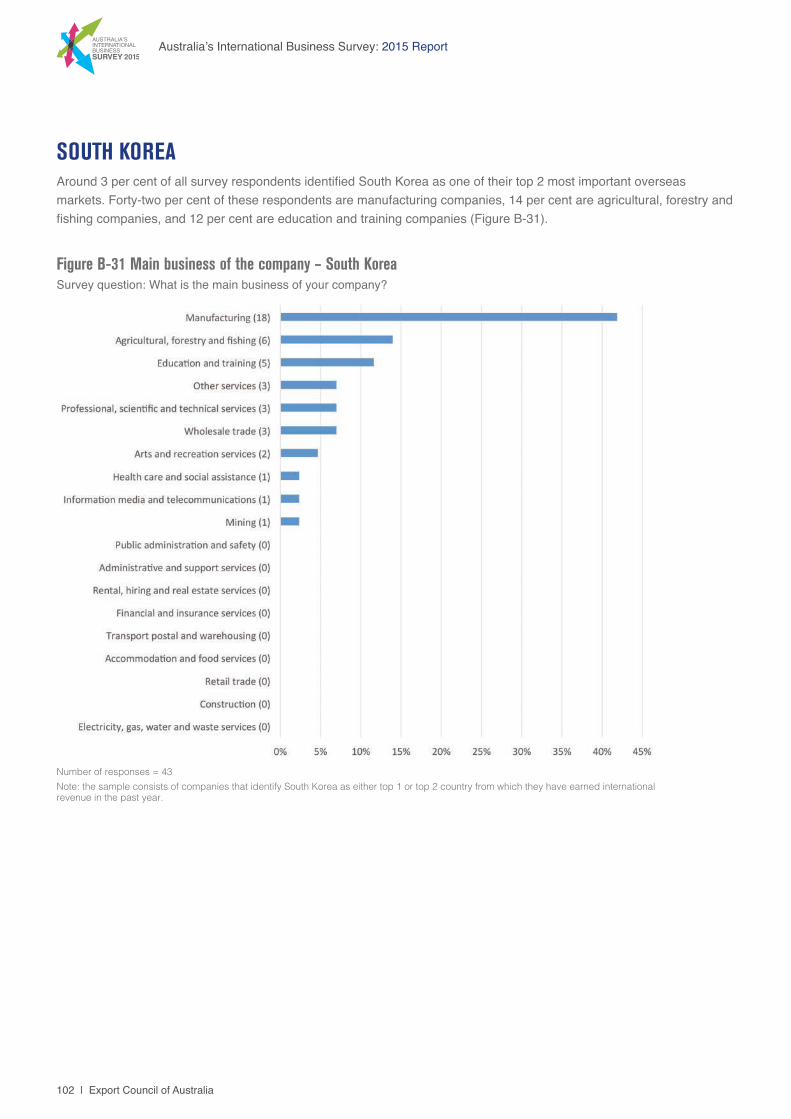
102 | Export Council of Australia
Australia’s International Business Survey: 2015 Report
Figure B-31 Main business of the company – South Korea Survey question: What is the main business of your company?
Number of responses = 43 Note: the sample consists of companies that identify South Korea as either top 1 or top 2 country from which they have earned international revenue in the past year.
SOUTH KOREAAround 3 per cent of all survey respondents identified South Korea as one of their top 2 most important overseas markets. Forty-two per cent of these respondents are manufacturing companies, 14 per cent are agricultural, forestry and fishing companies, and 12 per cent are education and training companies (Figure B-31).
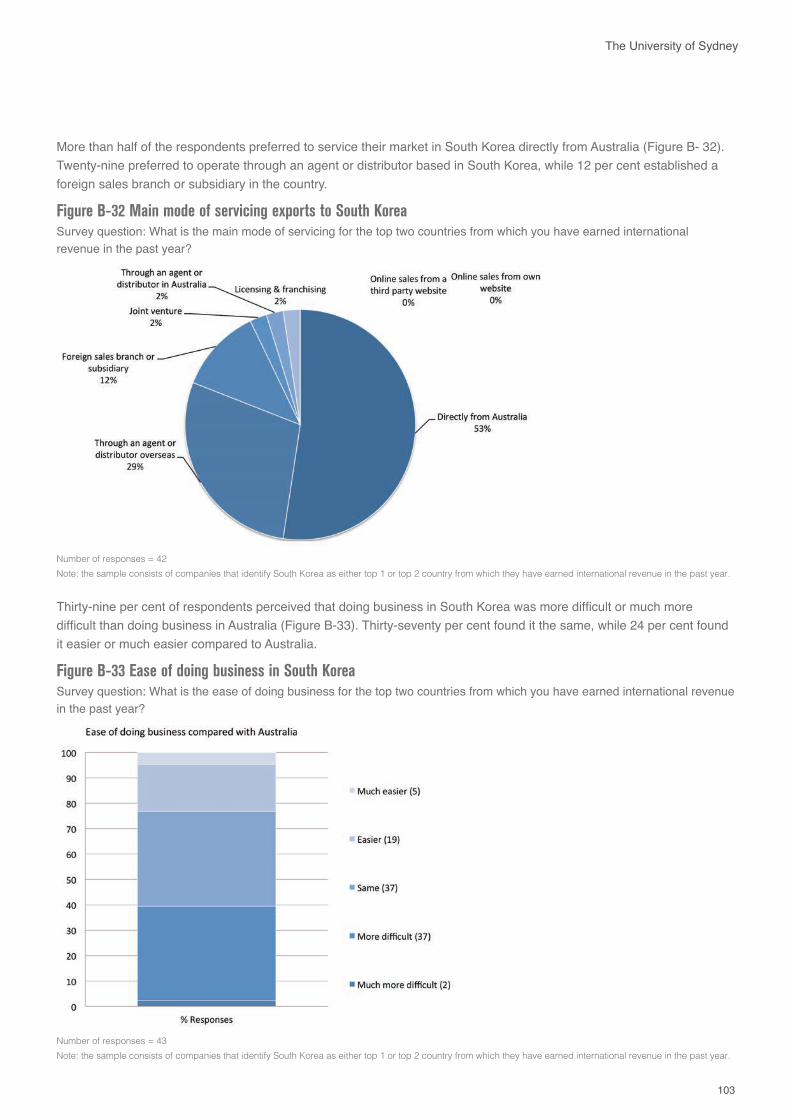
103
The University of Sydney
Figure B-32 Main mode of servicing exports to South KoreaSurvey question: What is the main mode of servicing for the top two countries from which you have earned international revenue in the past year?
Number of responses = 42 Note: the sample consists of companies that identify South Korea as either top 1 or top 2 country from which they have earned international revenue in the past year.
Figure B-33 Ease of doing business in South KoreaSurvey question: What is the ease of doing business for the top two countries from which you have earned international revenue in the past year?
Number of responses = 43 Note: the sample consists of companies that identify South Korea as either top 1 or top 2 country from which they have earned international revenue in the past year.
More than half of the respondents preferred to service their market in South Korea directly from Australia (Figure B- 32). Twenty-nine preferred to operate through an agent or distributor based in South Korea, while 12 per cent established a foreign sales branch or subsidiary in the country.
Thirty-nine per cent of respondents perceived that doing business in South Korea was more difficult or much more difficult than doing business in Australia (Figure B-33). Thirty-seventy per cent found it the same, while 24 per cent found it easier or much easier compared to Australia.
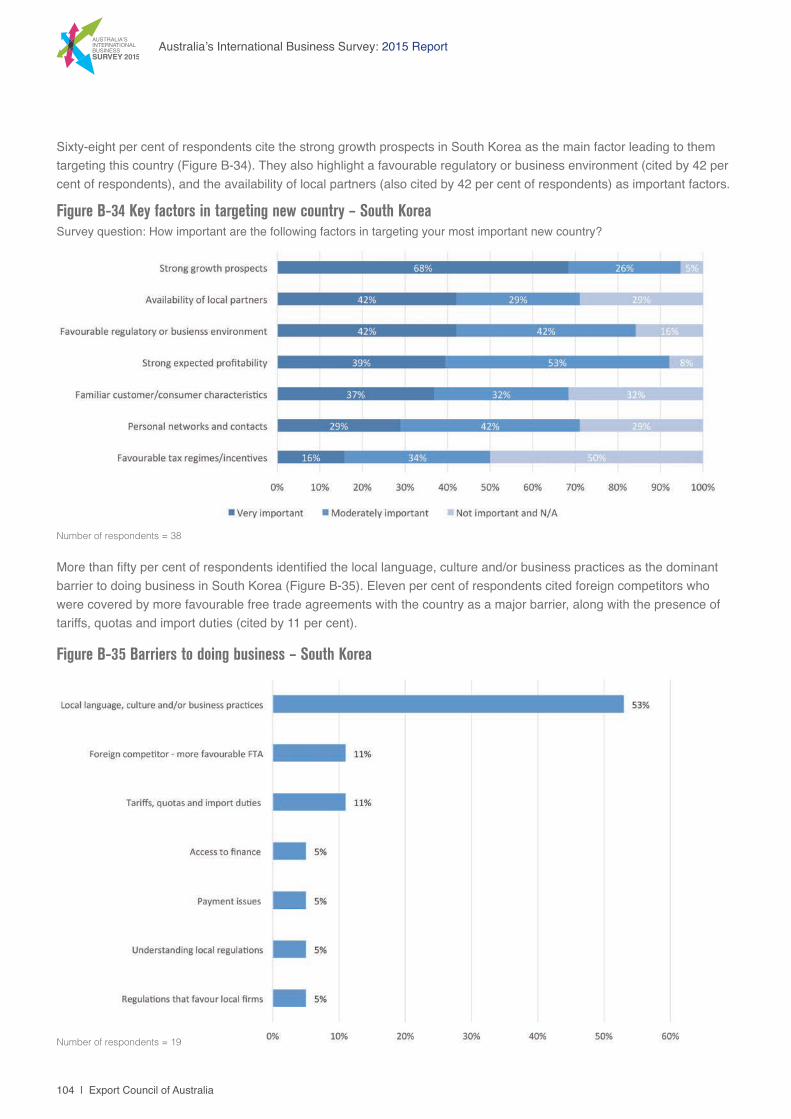
104 | Export Council of Australia
Australia’s International Business Survey: 2015 Report
Figure B-34 Key factors in targeting new country – South KoreaSurvey question: How important are the following factors in targeting your most important new country?
Number of respondents = 38
Sixty-eight per cent of respondents cite the strong growth prospects in South Korea as the main factor leading to them targeting this country (Figure B-34). They also highlight a favourable regulatory or business environment (cited by 42 per cent of respondents), and the availability of local partners (also cited by 42 per cent of respondents) as important factors.
Figure B-35 Barriers to doing business – South Korea
Number of respondents = 19
More than fifty per cent of respondents identified the local language, culture and/or business practices as the dominant barrier to doing business in South Korea (Figure B-35). Eleven per cent of respondents cited foreign competitors who were covered by more favourable free trade agreements with the country as a major barrier, along with the presence of tariffs, quotas and import duties (cited by 11 per cent).
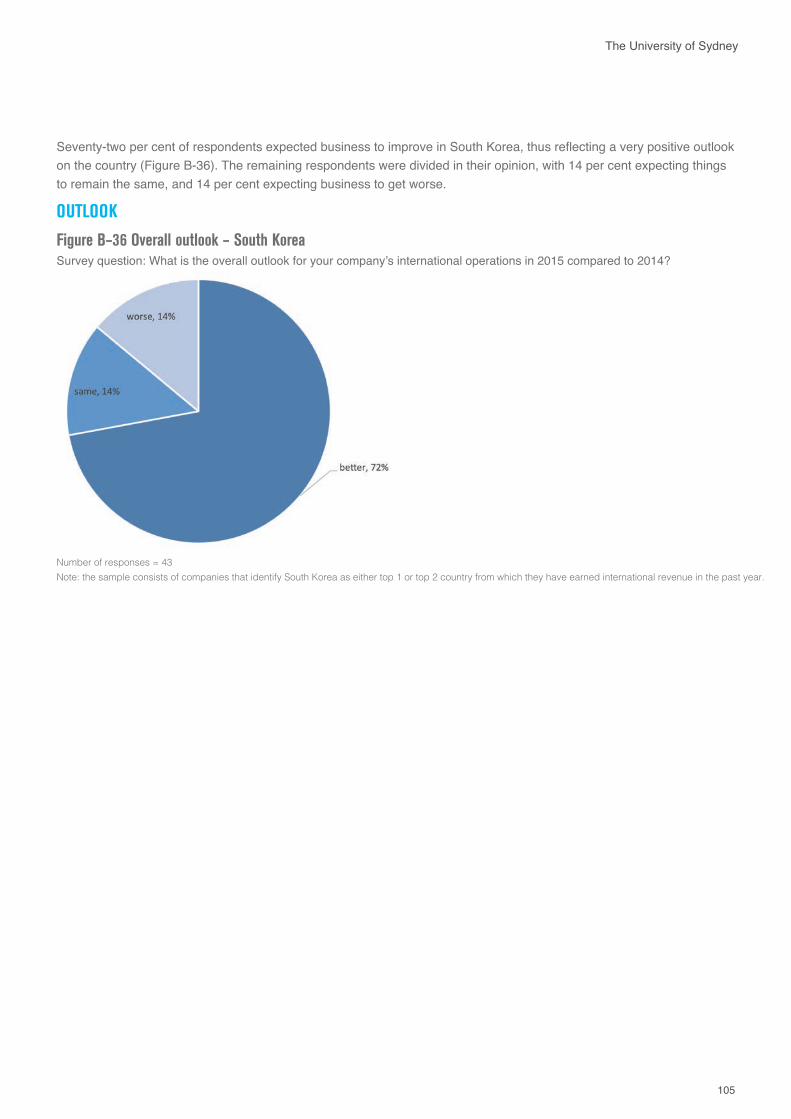
105
The University of Sydney
OUTLOOK
Figure B–36 Overall outlook – South KoreaSurvey question: What is the overall outlook for your company’s international operations in 2015 compared to 2014?
Number of responses = 43 Note: the sample consists of companies that identify South Korea as either top 1 or top 2 country from which they have earned international revenue in the past year.
Seventy-two per cent of respondents expected business to improve in South Korea, thus reflecting a very positive outlook on the country (Figure B-36). The remaining respondents were divided in their opinion, with 14 per cent expecting things to remain the same, and 14 per cent expecting business to get worse.
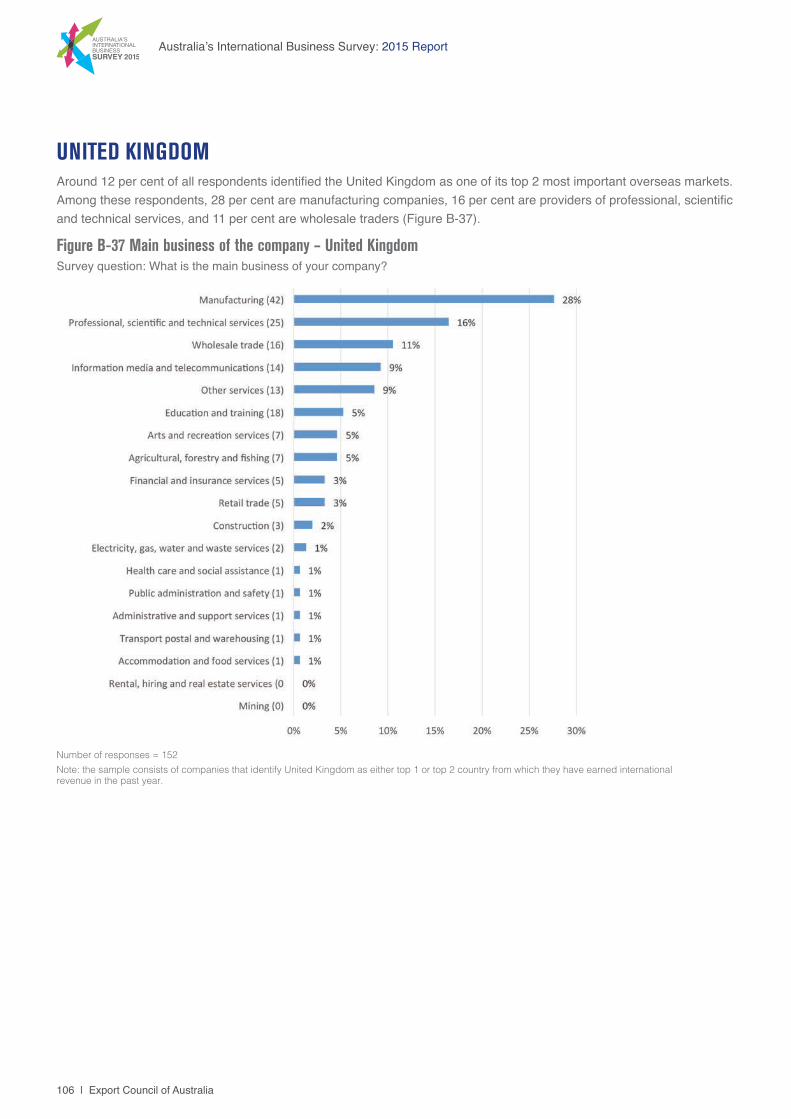
106 | Export Council of Australia
Australia’s International Business Survey: 2015 Report
Figure B-37 Main business of the company – United Kingdom Survey question: What is the main business of your company?
Number of responses = 152 Note: the sample consists of companies that identify United Kingdom as either top 1 or top 2 country from which they have earned international revenue in the past year.
UNITED KINGDOMAround 12 per cent of all respondents identified the United Kingdom as one of its top 2 most important overseas markets. Among these respondents, 28 per cent are manufacturing companies, 16 per cent are providers of professional, scientific and technical services, and 11 per cent are wholesale traders (Figure B-37).
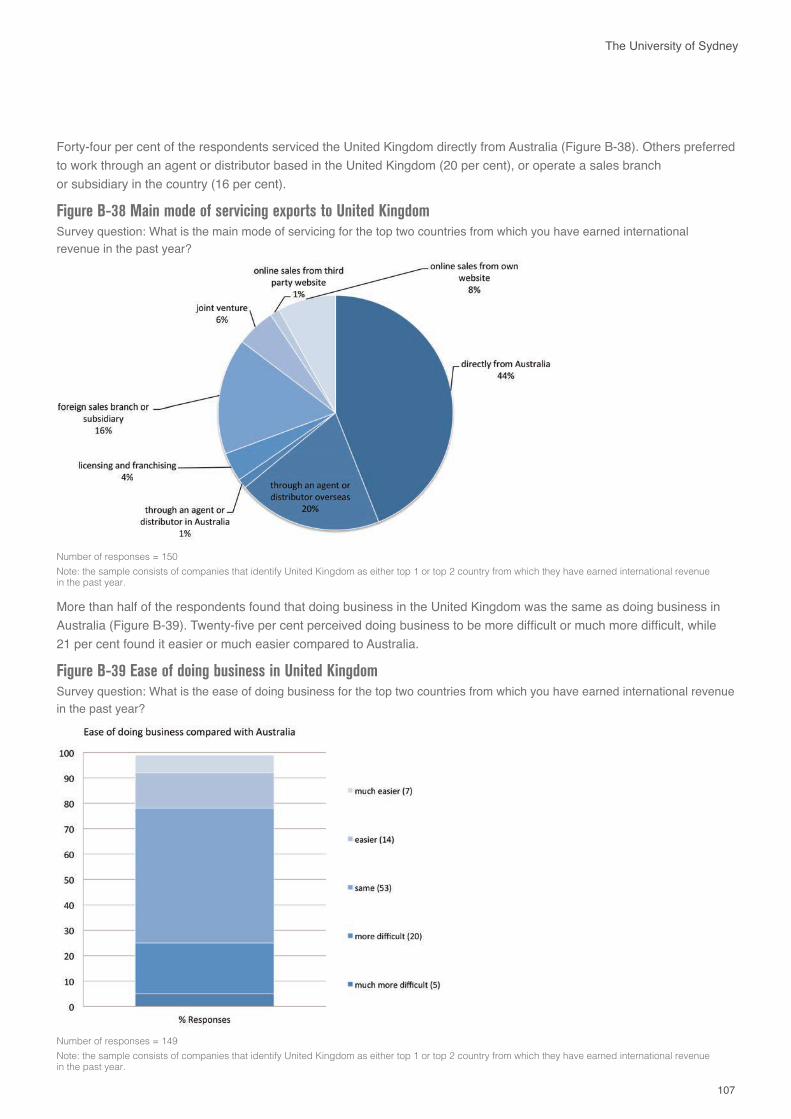
107
The University of Sydney
Figure B-38 Main mode of servicing exports to United Kingdom Survey question: What is the main mode of servicing for the top two countries from which you have earned international revenue in the past year?
Number of responses = 150 Note: the sample consists of companies that identify United Kingdom as either top 1 or top 2 country from which they have earned international revenue in the past year.
Figure B-39 Ease of doing business in United Kingdom Survey question: What is the ease of doing business for the top two countries from which you have earned international revenue in the past year?
Number of responses = 149 Note: the sample consists of companies that identify United Kingdom as either top 1 or top 2 country from which they have earned international revenue in the past year.
Forty-four per cent of the respondents serviced the United Kingdom directly from Australia (Figure B-38). Others preferred to work through an agent or distributor based in the United Kingdom (20 per cent), or operate a sales branch or subsidiary in the country (16 per cent).
More than half of the respondents found that doing business in the United Kingdom was the same as doing business in Australia (Figure B-39). Twenty-five per cent perceived doing business to be more difficult or much more difficult, while 21 per cent found it easier or much easier compared to Australia.
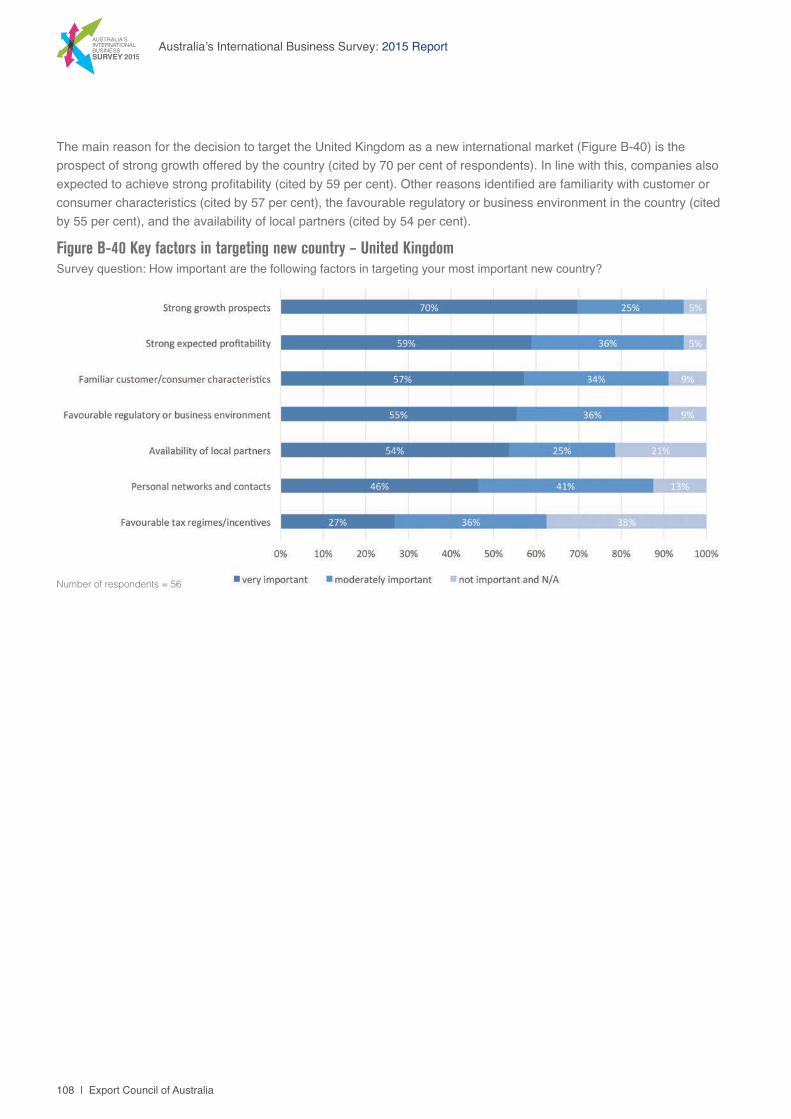
108 | Export Council of Australia
Australia’s International Business Survey: 2015 Report
Figure B-40 Key factors in targeting new country – United KingdomSurvey question: How important are the following factors in targeting your most important new country?
Number of respondents = 56
The main reason for the decision to target the United Kingdom as a new international market (Figure B-40) is the prospect of strong growth offered by the country (cited by 70 per cent of respondents). In line with this, companies also expected to achieve strong profitability (cited by 59 per cent). Other reasons identified are familiarity with customer or consumer characteristics (cited by 57 per cent), the favourable regulatory or business environment in the country (cited by 55 per cent), and the availability of local partners (cited by 54 per cent).
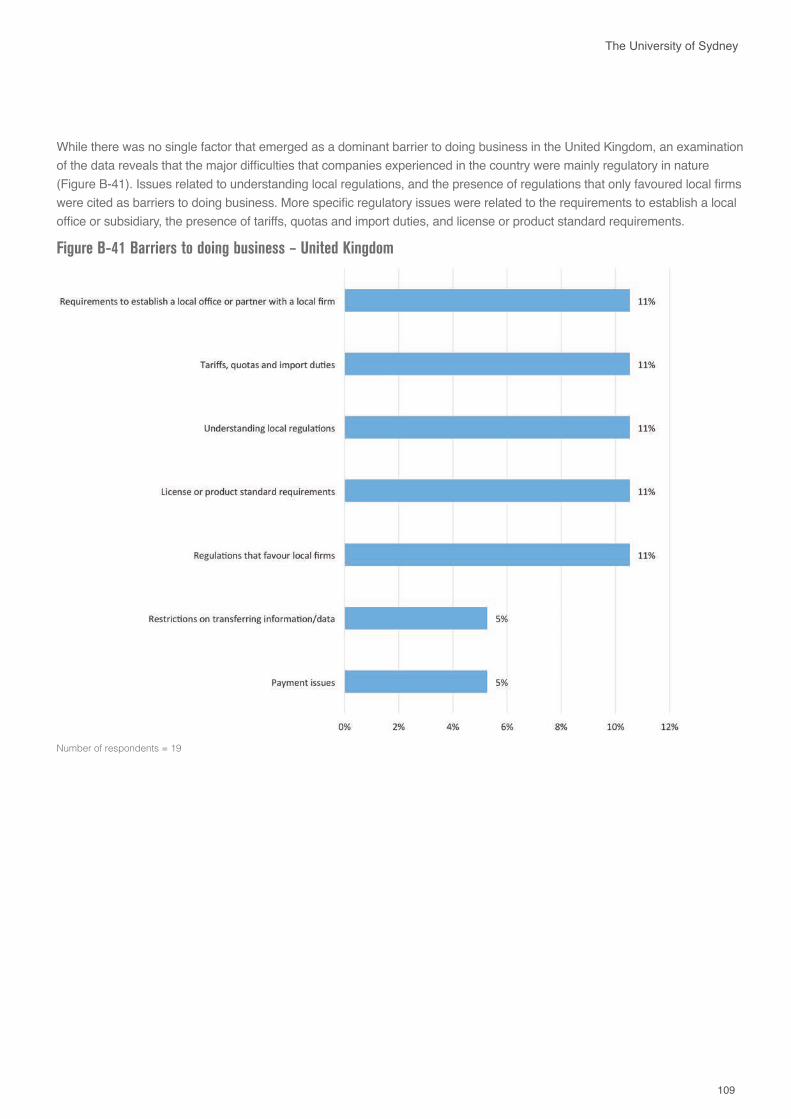
109
The University of Sydney
Figure B-41 Barriers to doing business – United Kingdom
Number of respondents = 19
While there was no single factor that emerged as a dominant barrier to doing business in the United Kingdom, an examination of the data reveals that the major difficulties that companies experienced in the country were mainly regulatory in nature (Figure B-41). Issues related to understanding local regulations, and the presence of regulations that only favoured local firms were cited as barriers to doing business. More specific regulatory issues were related to the requirements to establish a local office or subsidiary, the presence of tariffs, quotas and import duties, and license or product standard requirements.
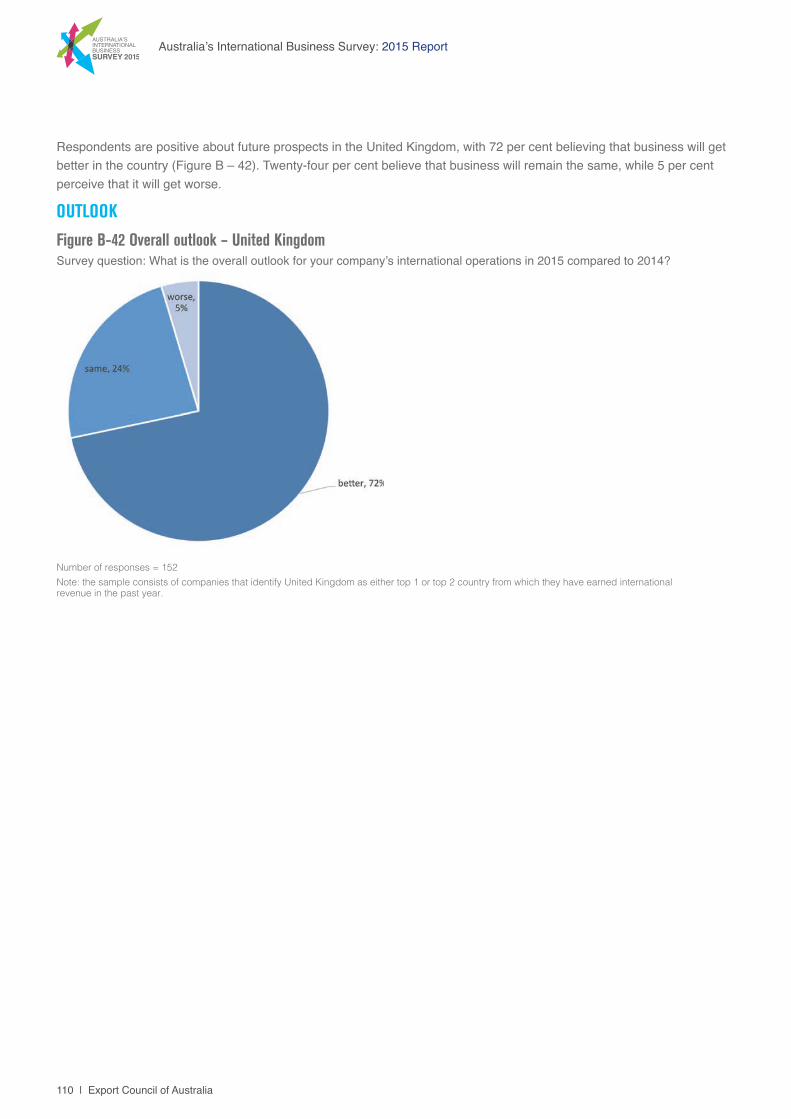
110 | Export Council of Australia
Australia’s International Business Survey: 2015 Report
OUTLOOK
Figure B-42 Overall outlook – United KingdomSurvey question: What is the overall outlook for your company’s international operations in 2015 compared to 2014?
Number of responses = 152Note: the sample consists of companies that identify United Kingdom as either top 1 or top 2 country from which they have earned international revenue in the past year.
Respondents are positive about future prospects in the United Kingdom, with 72 per cent believing that business will get better in the country (Figure B – 42). Twenty-four per cent believe that business will remain the same, while 5 per cent perceive that it will get worse.
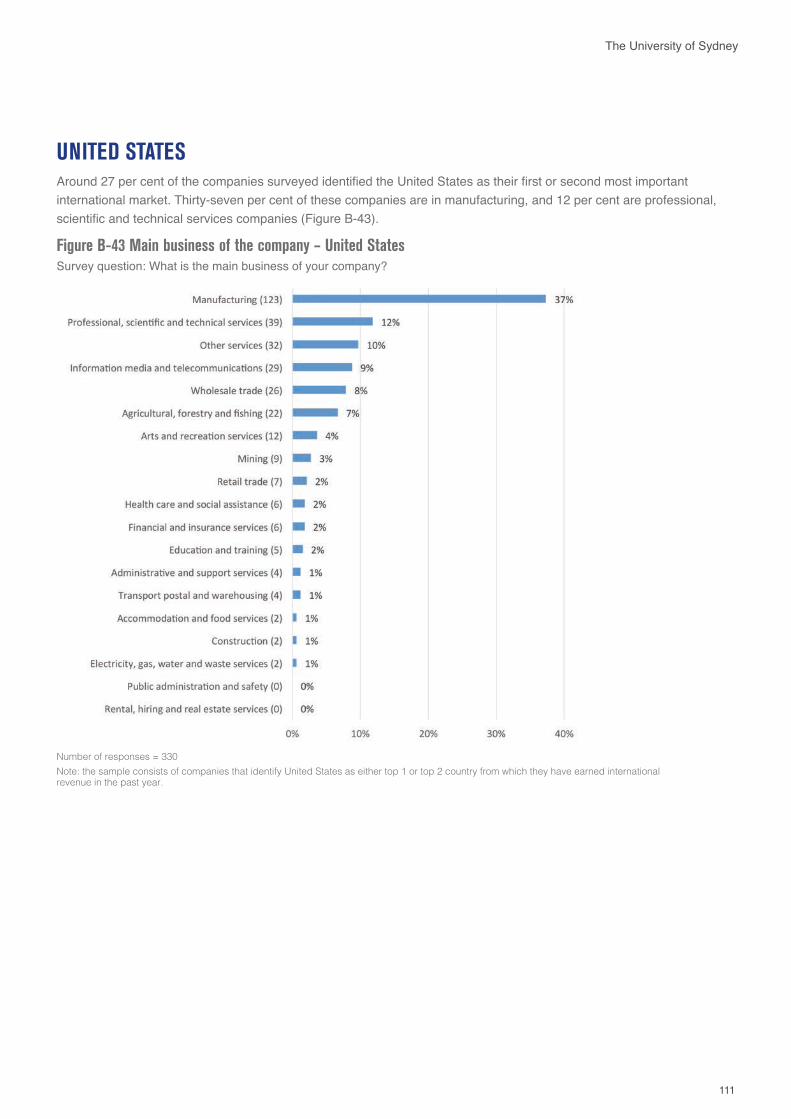
111
The University of Sydney
Figure B-43 Main business of the company – United States Survey question: What is the main business of your company?
Number of responses = 330 Note: the sample consists of companies that identify United States as either top 1 or top 2 country from which they have earned international revenue in the past year.
UNITED STATESAround 27 per cent of the companies surveyed identified the United States as their first or second most important international market. Thirty-seven per cent of these companies are in manufacturing, and 12 per cent are professional, scientific and technical services companies (Figure B-43).
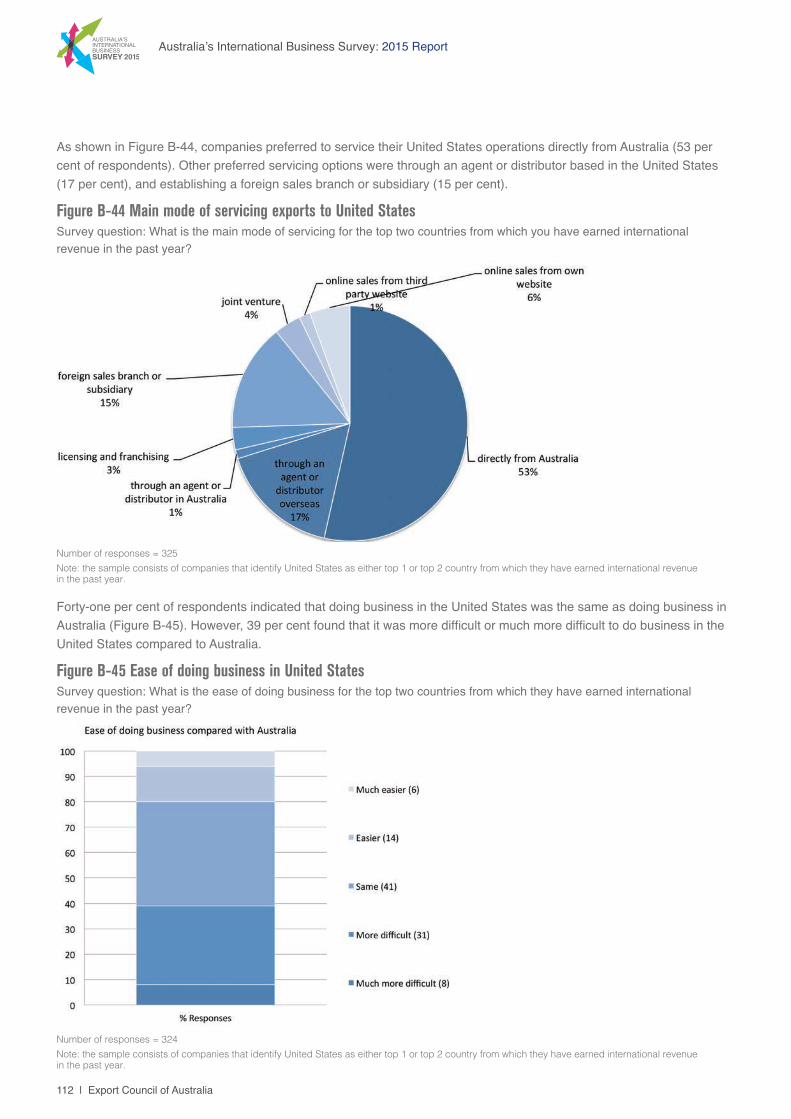
112 | Export Council of Australia
Australia’s International Business Survey: 2015 Report
Figure B-44 Main mode of servicing exports to United StatesSurvey question: What is the main mode of servicing for the top two countries from which you have earned international revenue in the past year?
Number of responses = 325 Note: the sample consists of companies that identify United States as either top 1 or top 2 country from which they have earned international revenue in the past year.
Figure B-45 Ease of doing business in United States Survey question: What is the ease of doing business for the top two countries from which they have earned international revenue in the past year?
Number of responses = 324Note: the sample consists of companies that identify United States as either top 1 or top 2 country from which they have earned international revenue in the past year.
As shown in Figure B-44, companies preferred to service their United States operations directly from Australia (53 per cent of respondents). Other preferred servicing options were through an agent or distributor based in the United States (17 per cent), and establishing a foreign sales branch or subsidiary (15 per cent).
Forty-one per cent of respondents indicated that doing business in the United States was the same as doing business in Australia (Figure B-45). However, 39 per cent found that it was more difficult or much more difficult to do business in the United States compared to Australia.
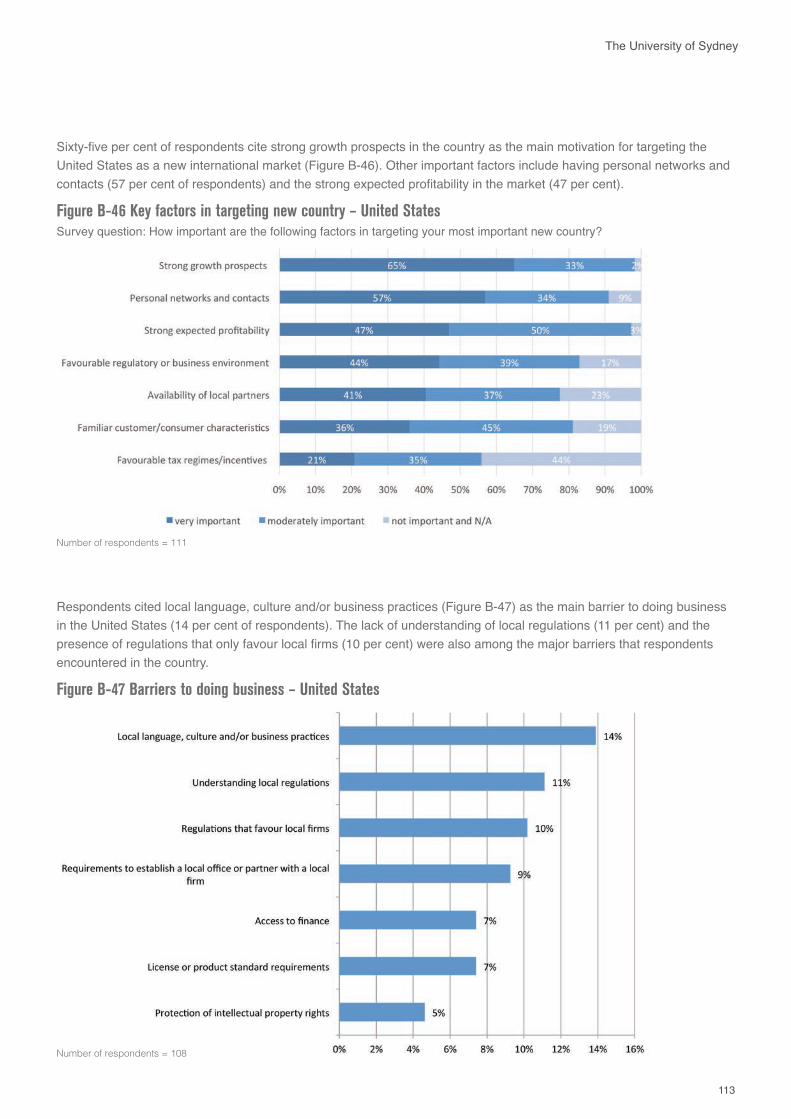
113
The University of Sydney
Figure B-46 Key factors in targeting new country – United StatesSurvey question: How important are the following factors in targeting your most important new country?
Number of respondents = 111
Figure B-47 Barriers to doing business – United States
Number of respondents = 108
Sixty-five per cent of respondents cite strong growth prospects in the country as the main motivation for targeting the United States as a new international market (Figure B-46). Other important factors include having personal networks and contacts (57 per cent of respondents) and the strong expected profitability in the market (47 per cent).
Respondents cited local language, culture and/or business practices (Figure B-47) as the main barrier to doing business in the United States (14 per cent of respondents). The lack of understanding of local regulations (11 per cent) and the presence of regulations that only favour local firms (10 per cent) were also among the major barriers that respondents encountered in the country.
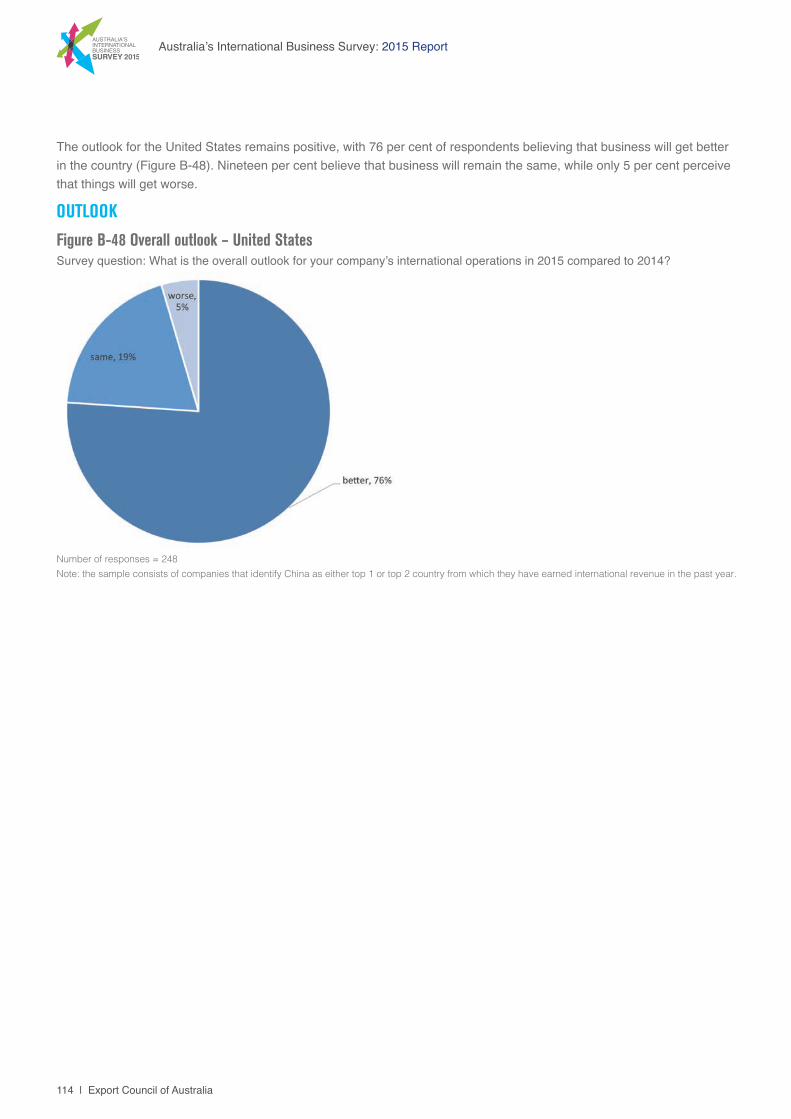
114 | Export Council of Australia
Australia’s International Business Survey: 2015 Report
OUTLOOK
Figure B-48 Overall outlook – United StatesSurvey question: What is the overall outlook for your company’s international operations in 2015 compared to 2014?
Number of responses = 248 Note: the sample consists of companies that identify China as either top 1 or top 2 country from which they have earned international revenue in the past year.
The outlook for the United States remains positive, with 76 per cent of respondents believing that business will get better in the country (Figure B-48). Nineteen per cent believe that business will remain the same, while only 5 per cent perceive that things will get worse.
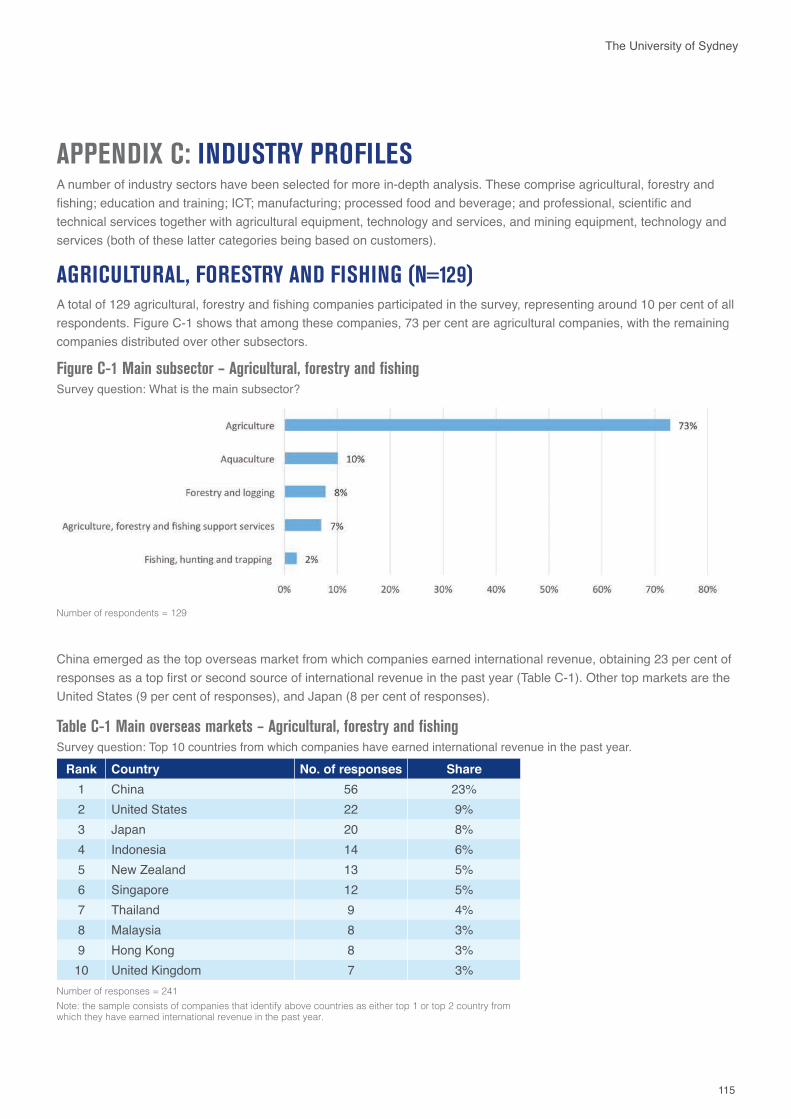
115
The University of Sydney
APPENDIX C: INDUSTRY PROFILESA number of industry sectors have been selected for more in-depth analysis. These comprise agricultural, forestry and fishing; education and training; ICT; manufacturing; processed food and beverage; and professional, scientific and technical services together with agricultural equipment, technology and services, and mining equipment, technology and services (both of these latter categories being based on customers).
AGRICULTURAL, FORESTRY AND FISHING (N=129)A total of 129 agricultural, forestry and fishing companies participated in the survey, representing around 10 per cent of all respondents. Figure C-1 shows that among these companies, 73 per cent are agricultural companies, with the remaining companies distributed over other subsectors.
Figure C-1 Main subsector – Agricultural, forestry and fishing Survey question: What is the main subsector?
Number of respondents = 129
China emerged as the top overseas market from which companies earned international revenue, obtaining 23 per cent of responses as a top first or second source of international revenue in the past year (Table C-1). Other top markets are the United States (9 per cent of responses), and Japan (8 per cent of responses).
Table C-1 Main overseas markets – Agricultural, forestry and fishingSurvey question: Top 10 countries from which companies have earned international revenue in the past year.
Rank Country No. of responses Share1 China 56 23%2 United States 22 9%3 Japan 20 8%4 Indonesia 14 6%5 New Zealand 13 5%6 Singapore 12 5%7 Thailand 9 4%8 Malaysia 8 3%9 Hong Kong 8 3%10 United Kingdom 7 3%
Number of responses = 241 Note: the sample consists of companies that identify above countries as either top 1 or top 2 country from which they have earned international revenue in the past year.
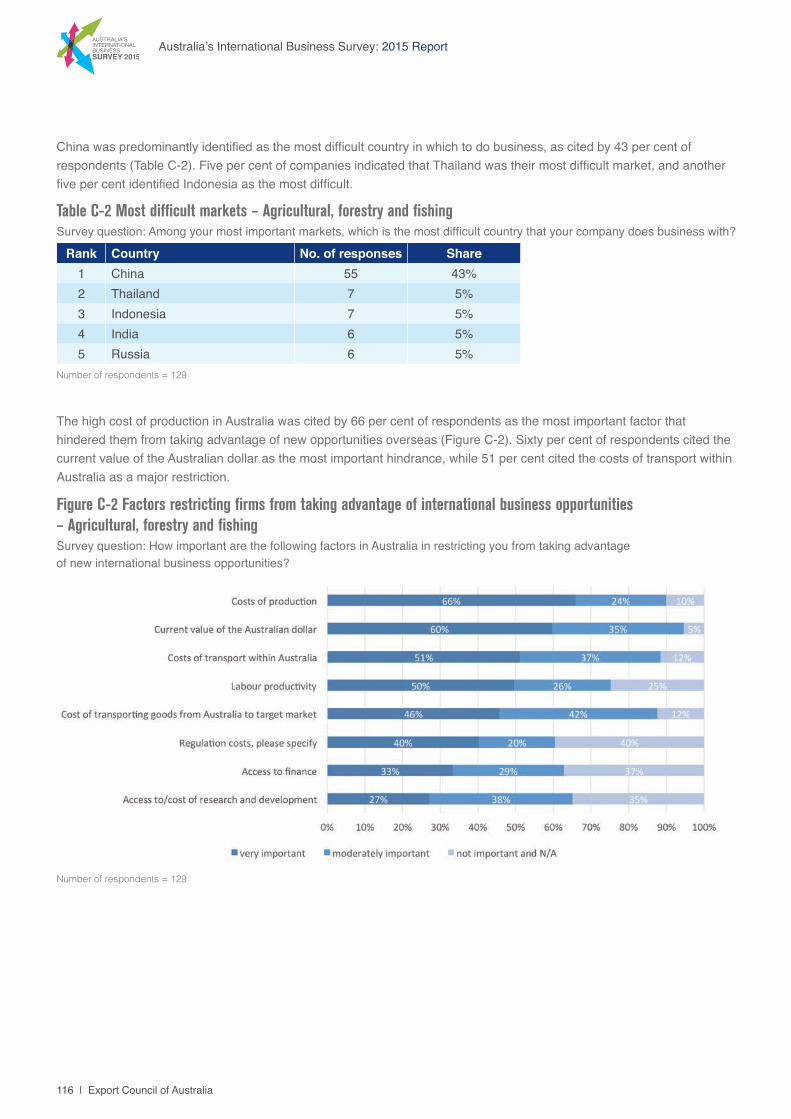
116 | Export Council of Australia
Australia’s International Business Survey: 2015 Report
The high cost of production in Australia was cited by 66 per cent of respondents as the most important factor that hindered them from taking advantage of new opportunities overseas (Figure C-2). Sixty per cent of respondents cited the current value of the Australian dollar as the most important hindrance, while 51 per cent cited the costs of transport within Australia as a major restriction.
Figure C-2 Factors restricting firms from taking advantage of international business opportunities – Agricultural, forestry and fishing Survey question: How important are the following factors in Australia in restricting you from taking advantage of new international business opportunities?
Number of respondents = 129
China was predominantly identified as the most difficult country in which to do business, as cited by 43 per cent of respondents (Table C-2). Five per cent of companies indicated that Thailand was their most difficult market, and another five per cent identified Indonesia as the most difficult.
Table C-2 Most difficult markets – Agricultural, forestry and fishing Survey question: Among your most important markets, which is the most difficult country that your company does business with?
Rank Country No. of responses Share1 China 55 43%2 Thailand 7 5%3 Indonesia 7 5%4 India 6 5%5 Russia 6 5%
Number of respondents = 129
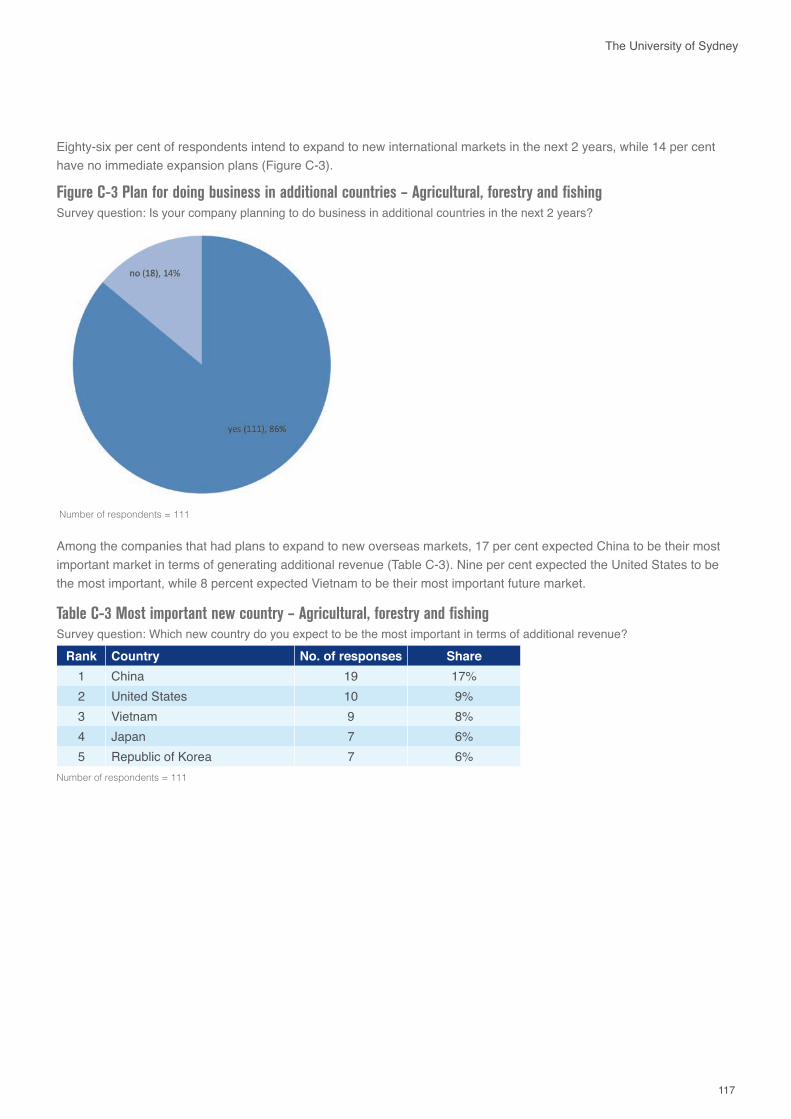
117
The University of Sydney
Eighty-six per cent of respondents intend to expand to new international markets in the next 2 years, while 14 per cent have no immediate expansion plans (Figure C-3).
Among the companies that had plans to expand to new overseas markets, 17 per cent expected China to be their most important market in terms of generating additional revenue (Table C-3). Nine per cent expected the United States to be the most important, while 8 percent expected Vietnam to be their most important future market.
Table C-3 Most important new country – Agricultural, forestry and fishingSurvey question: Which new country do you expect to be the most important in terms of additional revenue?
Rank Country No. of responses Share1 China 19 17%2 United States 10 9%3 Vietnam 9 8%4 Japan 7 6%5 Republic of Korea 7 6%
Number of respondents = 111
Figure C-3 Plan for doing business in additional countries – Agricultural, forestry and fishingSurvey question: Is your company planning to do business in additional countries in the next 2 years?
Number of respondents = 111
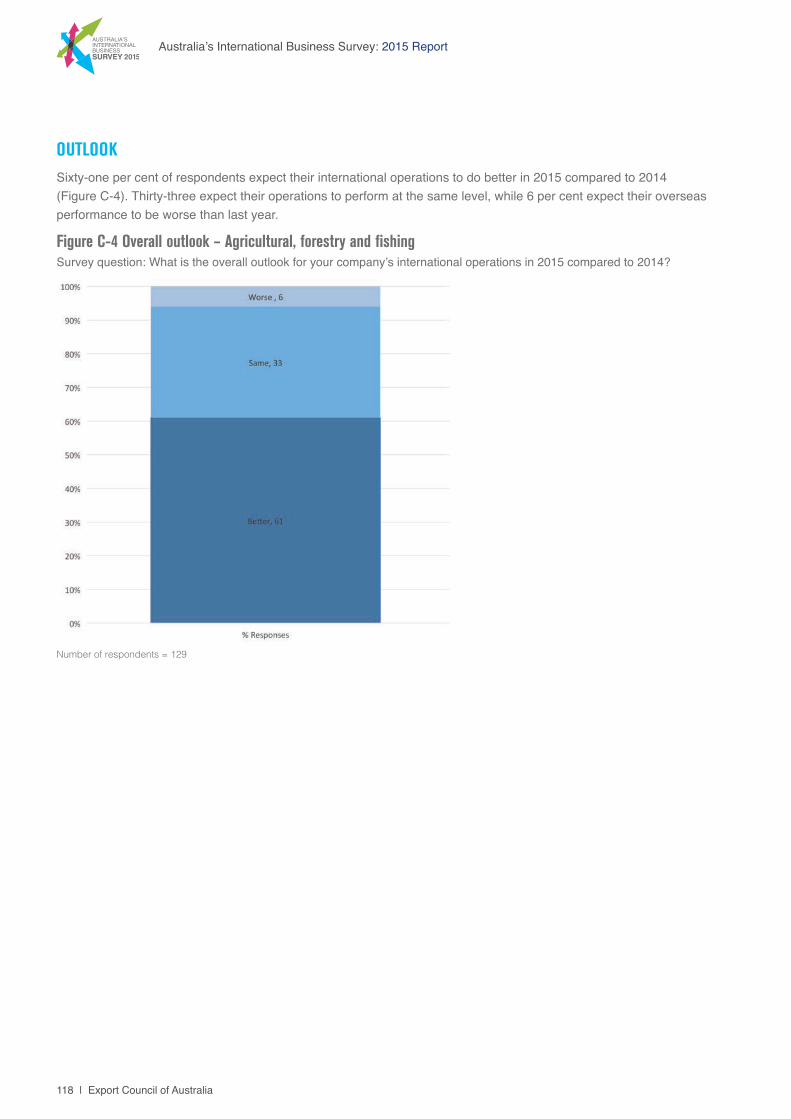
118 | Export Council of Australia
Australia’s International Business Survey: 2015 Report
OUTLOOK Sixty-one per cent of respondents expect their international operations to do better in 2015 compared to 2014 (Figure C-4). Thirty-three expect their operations to perform at the same level, while 6 per cent expect their overseas performance to be worse than last year.
Figure C-4 Overall outlook – Agricultural, forestry and fishingSurvey question: What is the overall outlook for your company’s international operations in 2015 compared to 2014?
Number of respondents = 129
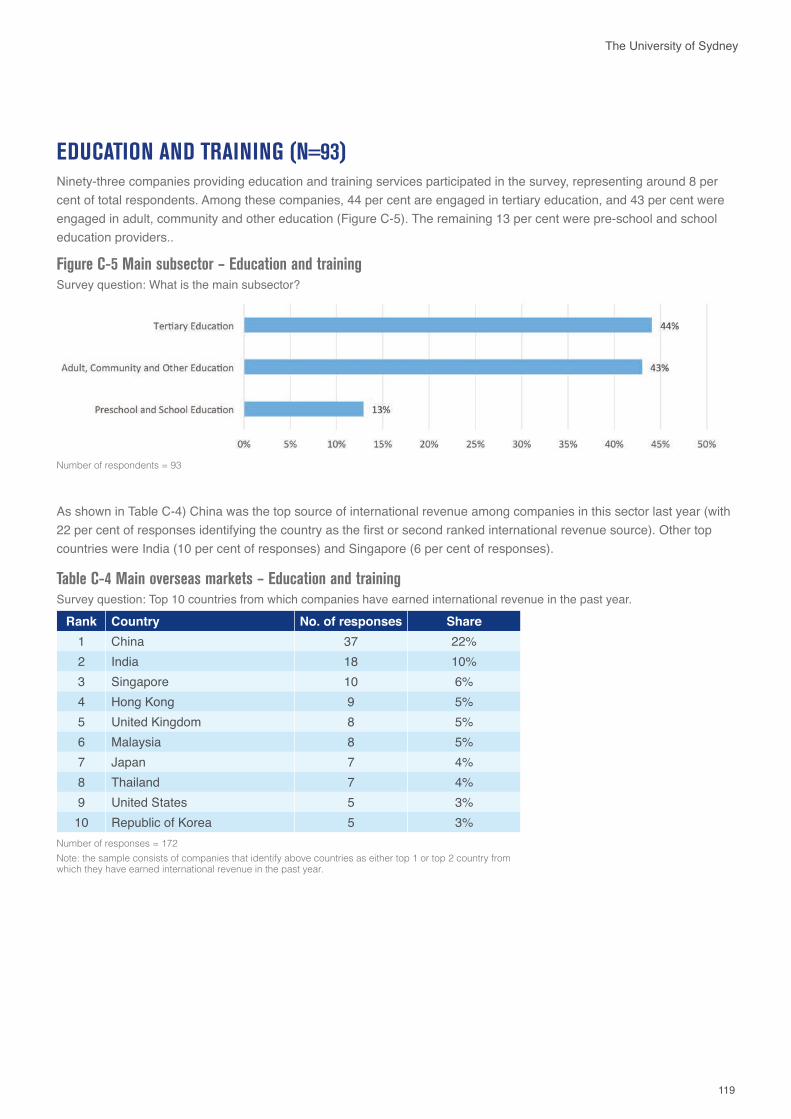
119
The University of Sydney
EDUCATION AND TRAINING (N=93)Ninety-three companies providing education and training services participated in the survey, representing around 8 per cent of total respondents. Among these companies, 44 per cent are engaged in tertiary education, and 43 per cent were engaged in adult, community and other education (Figure C-5). The remaining 13 per cent were pre-school and school education providers..
Figure C-5 Main subsector – Education and training Survey question: What is the main subsector?
Number of respondents = 93
As shown in Table C-4) China was the top source of international revenue among companies in this sector last year (with 22 per cent of responses identifying the country as the first or second ranked international revenue source). Other top countries were India (10 per cent of responses) and Singapore (6 per cent of responses).
Table C-4 Main overseas markets – Education and trainingSurvey question: Top 10 countries from which companies have earned international revenue in the past year.
Rank Country No. of responses Share1 China 37 22%2 India 18 10%3 Singapore 10 6%4 Hong Kong 9 5%5 United Kingdom 8 5%6 Malaysia 8 5%7 Japan 7 4%8 Thailand 7 4%9 United States 5 3%10 Republic of Korea 5 3%
Number of responses = 172 Note: the sample consists of companies that identify above countries as either top 1 or top 2 country from which they have earned international revenue in the past year.
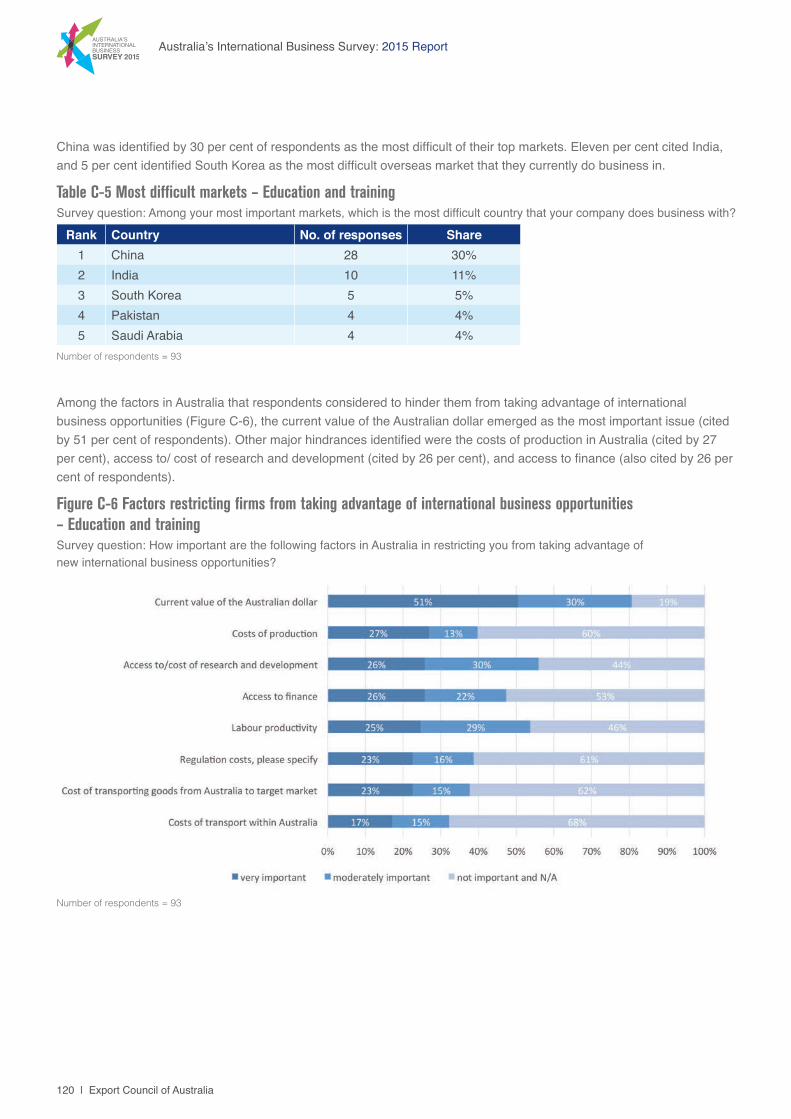
120 | Export Council of Australia
Australia’s International Business Survey: 2015 Report
Among the factors in Australia that respondents considered to hinder them from taking advantage of international business opportunities (Figure C-6), the current value of the Australian dollar emerged as the most important issue (cited by 51 per cent of respondents). Other major hindrances identified were the costs of production in Australia (cited by 27 per cent), access to/ cost of research and development (cited by 26 per cent), and access to finance (also cited by 26 per cent of respondents).
Figure C-6 Factors restricting firms from taking advantage of international business opportunities – Education and trainingSurvey question: How important are the following factors in Australia in restricting you from taking advantage of new international business opportunities?
Number of respondents = 93
China was identified by 30 per cent of respondents as the most difficult of their top markets. Eleven per cent cited India, and 5 per cent identified South Korea as the most difficult overseas market that they currently do business in.
Table C-5 Most difficult markets – Education and training Survey question: Among your most important markets, which is the most difficult country that your company does business with?
Rank Country No. of responses Share1 China 28 30%2 India 10 11%3 South Korea 5 5%4 Pakistan 4 4%5 Saudi Arabia 4 4%
Number of respondents = 93
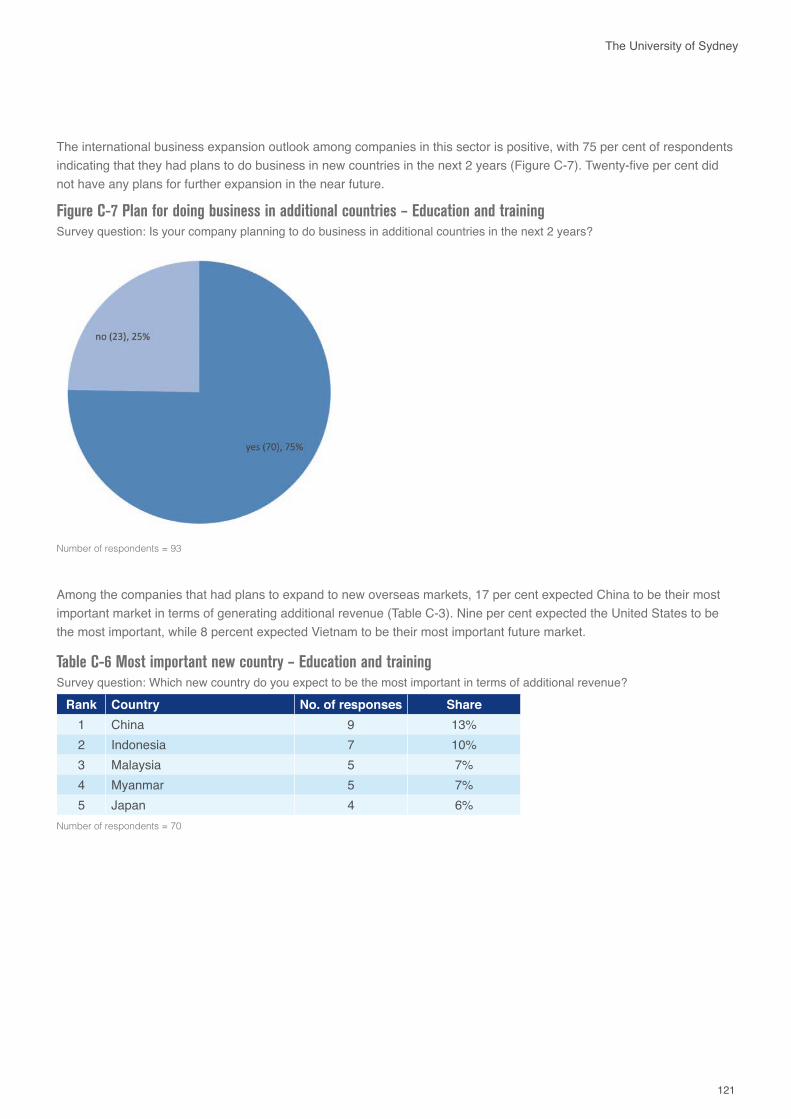
121
The University of Sydney
The international business expansion outlook among companies in this sector is positive, with 75 per cent of respondents indicating that they had plans to do business in new countries in the next 2 years (Figure C-7). Twenty-five per cent did not have any plans for further expansion in the near future.
Among the companies that had plans to expand to new overseas markets, 17 per cent expected China to be their most important market in terms of generating additional revenue (Table C-3). Nine per cent expected the United States to be the most important, while 8 percent expected Vietnam to be their most important future market.
Table C-6 Most important new country – Education and trainingSurvey question: Which new country do you expect to be the most important in terms of additional revenue?
Rank Country No. of responses Share1 China 9 13%2 Indonesia 7 10%3 Malaysia 5 7%4 Myanmar 5 7%5 Japan 4 6%
Number of respondents = 70
Figure C-7 Plan for doing business in additional countries – Education and trainingSurvey question: Is your company planning to do business in additional countries in the next 2 years?
Number of respondents = 93
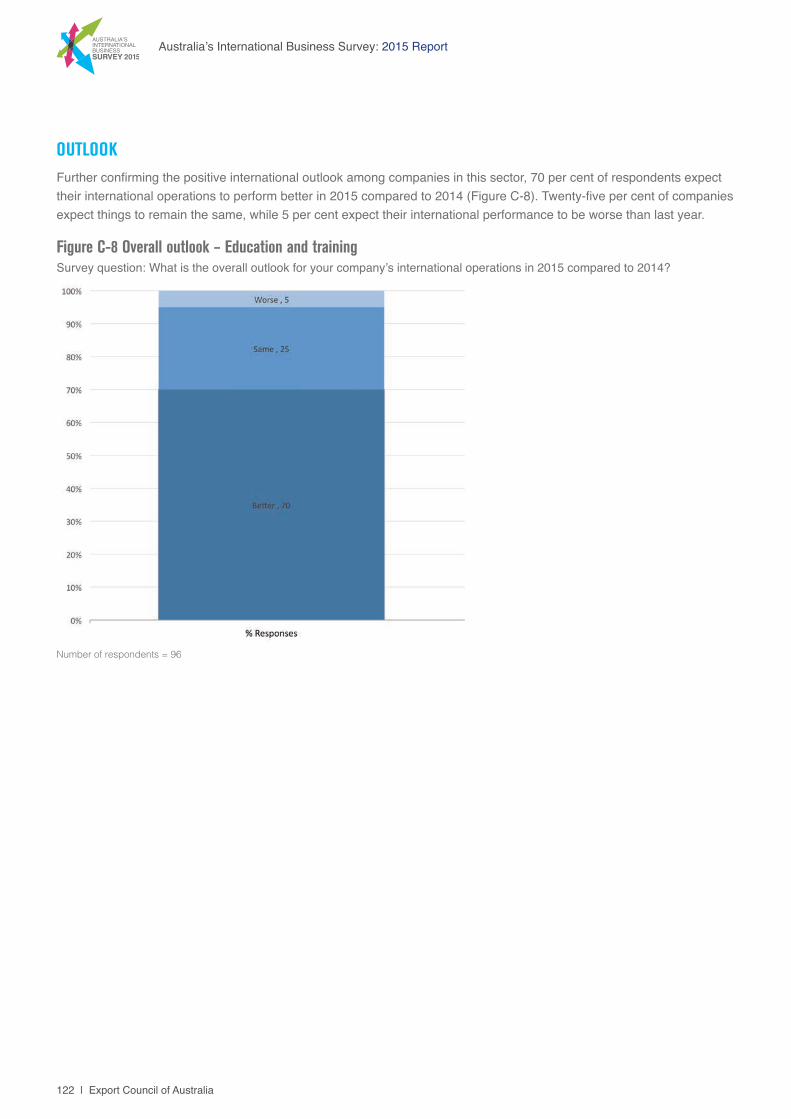
122 | Export Council of Australia
Australia’s International Business Survey: 2015 Report
OUTLOOK Further confirming the positive international outlook among companies in this sector, 70 per cent of respondents expect their international operations to perform better in 2015 compared to 2014 (Figure C-8). Twenty-five per cent of companies expect things to remain the same, while 5 per cent expect their international performance to be worse than last year.
Figure C-8 Overall outlook – Education and trainingSurvey question: What is the overall outlook for your company’s international operations in 2015 compared to 2014?
Number of respondents = 96
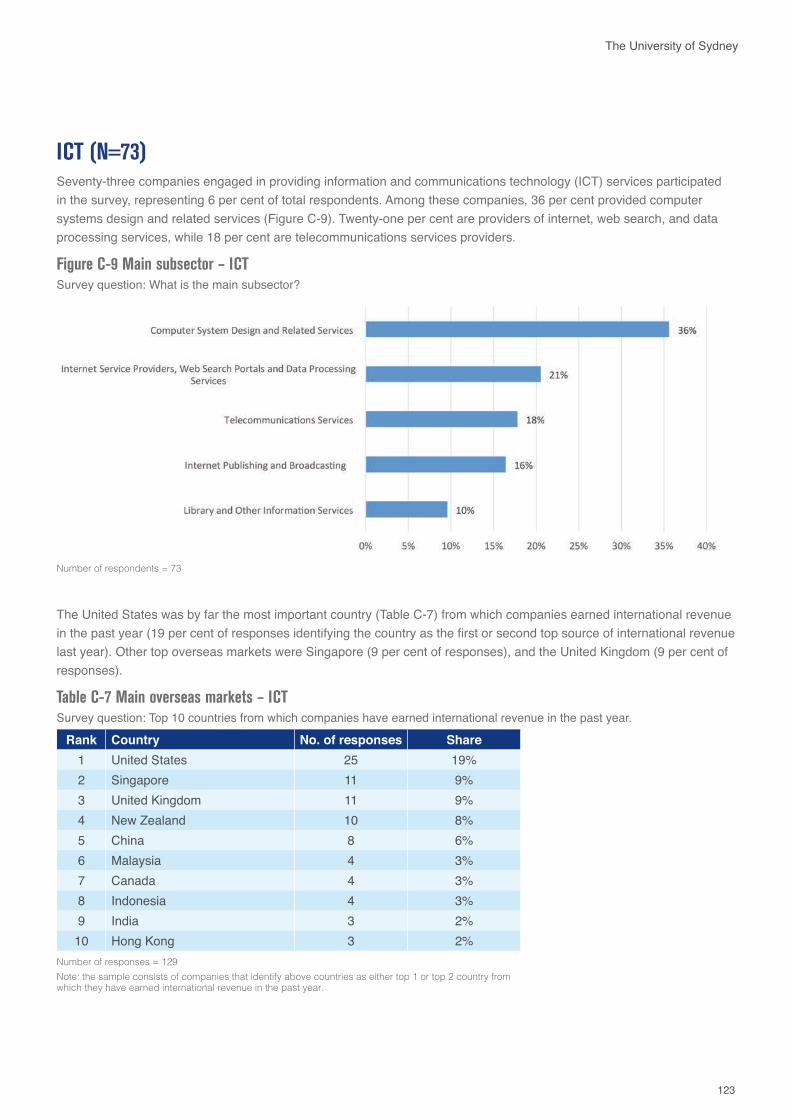
123
The University of Sydney
ICT (N=73)Seventy-three companies engaged in providing information and communications technology (ICT) services participated in the survey, representing 6 per cent of total respondents. Among these companies, 36 per cent provided computer systems design and related services (Figure C-9). Twenty-one per cent are providers of internet, web search, and data processing services, while 18 per cent are telecommunications services providers.
Figure C-9 Main subsector – ICT Survey question: What is the main subsector?
Number of respondents = 73
The United States was by far the most important country (Table C-7) from which companies earned international revenue in the past year (19 per cent of responses identifying the country as the first or second top source of international revenue last year). Other top overseas markets were Singapore (9 per cent of responses), and the United Kingdom (9 per cent of responses).
Table C-7 Main overseas markets – ICTSurvey question: Top 10 countries from which companies have earned international revenue in the past year.
Rank Country No. of responses Share1 United States 25 19%2 Singapore 11 9%3 United Kingdom 11 9%4 New Zealand 10 8%5 China 8 6%6 Malaysia 4 3%7 Canada 4 3%8 Indonesia 4 3%9 India 3 2%10 Hong Kong 3 2%
Number of responses = 129 Note: the sample consists of companies that identify above countries as either top 1 or top 2 country from which they have earned international revenue in the past year.
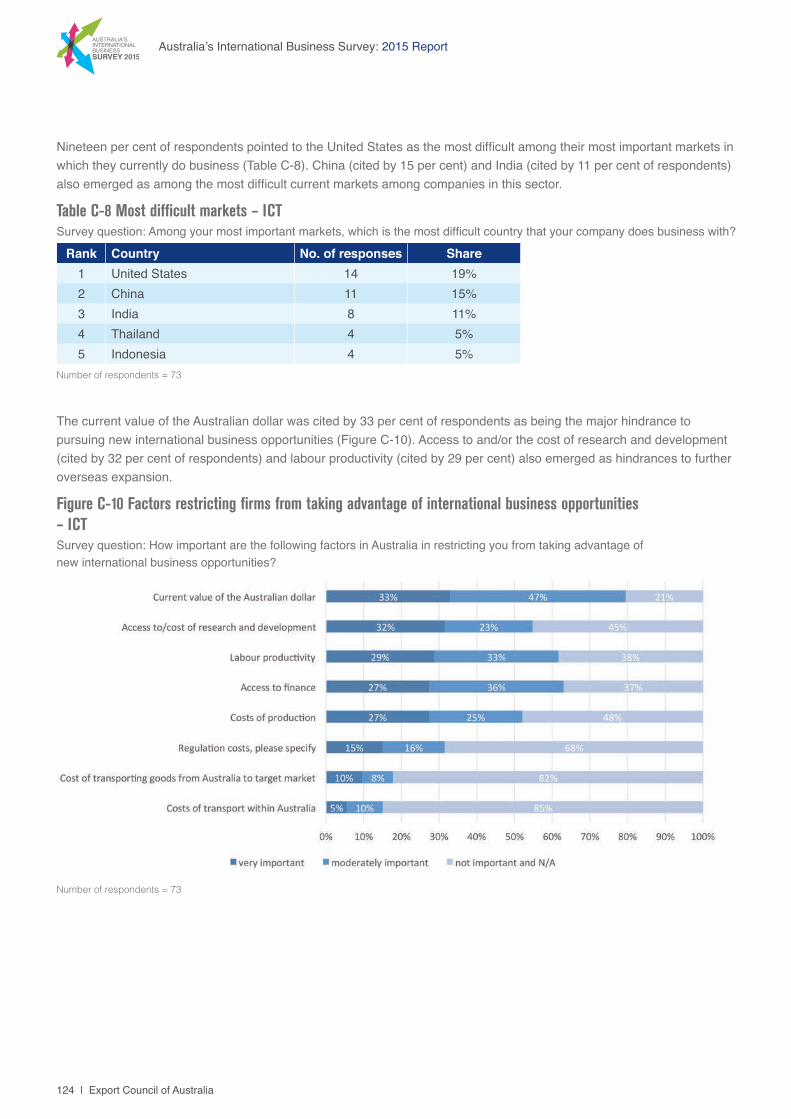
124 | Export Council of Australia
Australia’s International Business Survey: 2015 Report
The current value of the Australian dollar was cited by 33 per cent of respondents as being the major hindrance to pursuing new international business opportunities (Figure C-10). Access to and/or the cost of research and development (cited by 32 per cent of respondents) and labour productivity (cited by 29 per cent) also emerged as hindrances to further overseas expansion.
Figure C-10 Factors restricting firms from taking advantage of international business opportunities – ICT Survey question: How important are the following factors in Australia in restricting you from taking advantage of new international business opportunities?
Number of respondents = 73
Nineteen per cent of respondents pointed to the United States as the most difficult among their most important markets in which they currently do business (Table C-8). China (cited by 15 per cent) and India (cited by 11 per cent of respondents) also emerged as among the most difficult current markets among companies in this sector.
Table C-8 Most difficult markets – ICT Survey question: Among your most important markets, which is the most difficult country that your company does business with?
Rank Country No. of responses Share1 United States 14 19%2 China 11 15%3 India 8 11%4 Thailand 4 5%5 Indonesia 4 5%
Number of respondents = 73
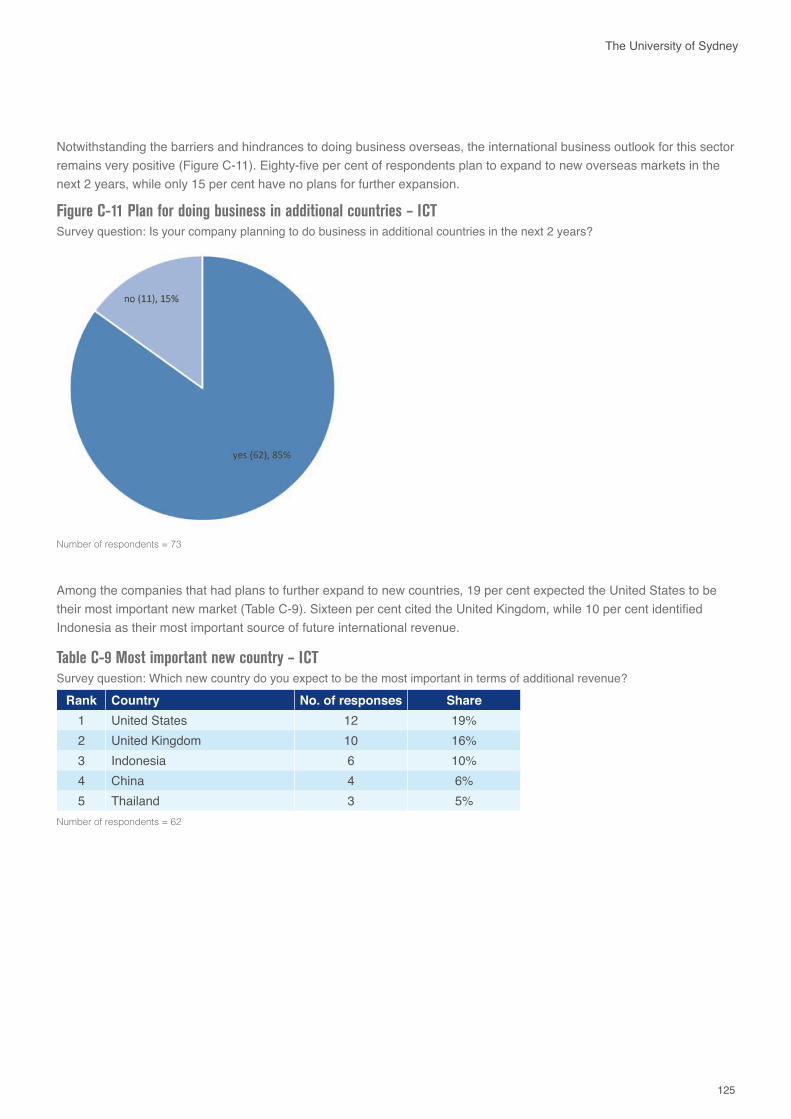
125
The University of Sydney
Notwithstanding the barriers and hindrances to doing business overseas, the international business outlook for this sector remains very positive (Figure C-11). Eighty-five per cent of respondents plan to expand to new overseas markets in the next 2 years, while only 15 per cent have no plans for further expansion.
Among the companies that had plans to further expand to new countries, 19 per cent expected the United States to be their most important new market (Table C-9). Sixteen per cent cited the United Kingdom, while 10 per cent identified Indonesia as their most important source of future international revenue.
Table C-9 Most important new country – ICTSurvey question: Which new country do you expect to be the most important in terms of additional revenue?
Rank Country No. of responses Share1 United States 12 19%2 United Kingdom 10 16%3 Indonesia 6 10%4 China 4 6%5 Thailand 3 5%
Number of respondents = 62
Figure C-11 Plan for doing business in additional countries – ICTSurvey question: Is your company planning to do business in additional countries in the next 2 years?
Number of respondents = 73
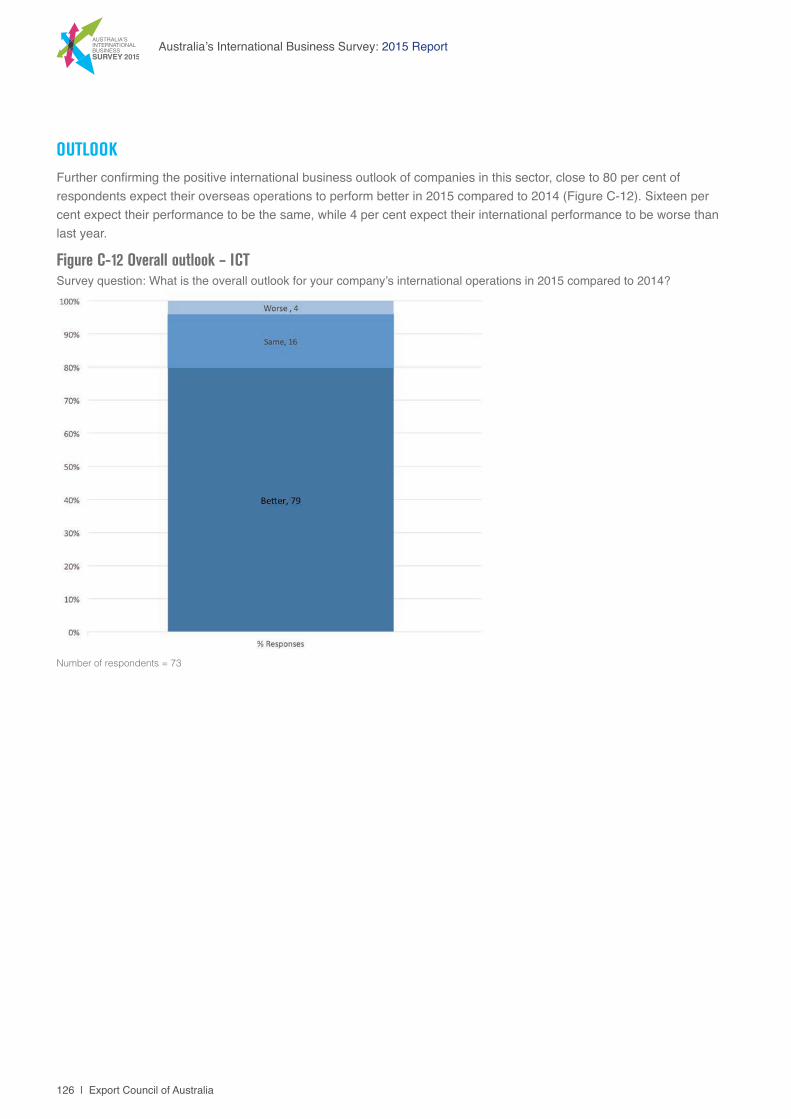
126 | Export Council of Australia
Australia’s International Business Survey: 2015 Report
OUTLOOK Further confirming the positive international business outlook of companies in this sector, close to 80 per cent of respondents expect their overseas operations to perform better in 2015 compared to 2014 (Figure C-12). Sixteen per cent expect their performance to be the same, while 4 per cent expect their international performance to be worse than last year.
Figure C-12 Overall outlook – ICTSurvey question: What is the overall outlook for your company’s international operations in 2015 compared to 2014?
Number of respondents = 73
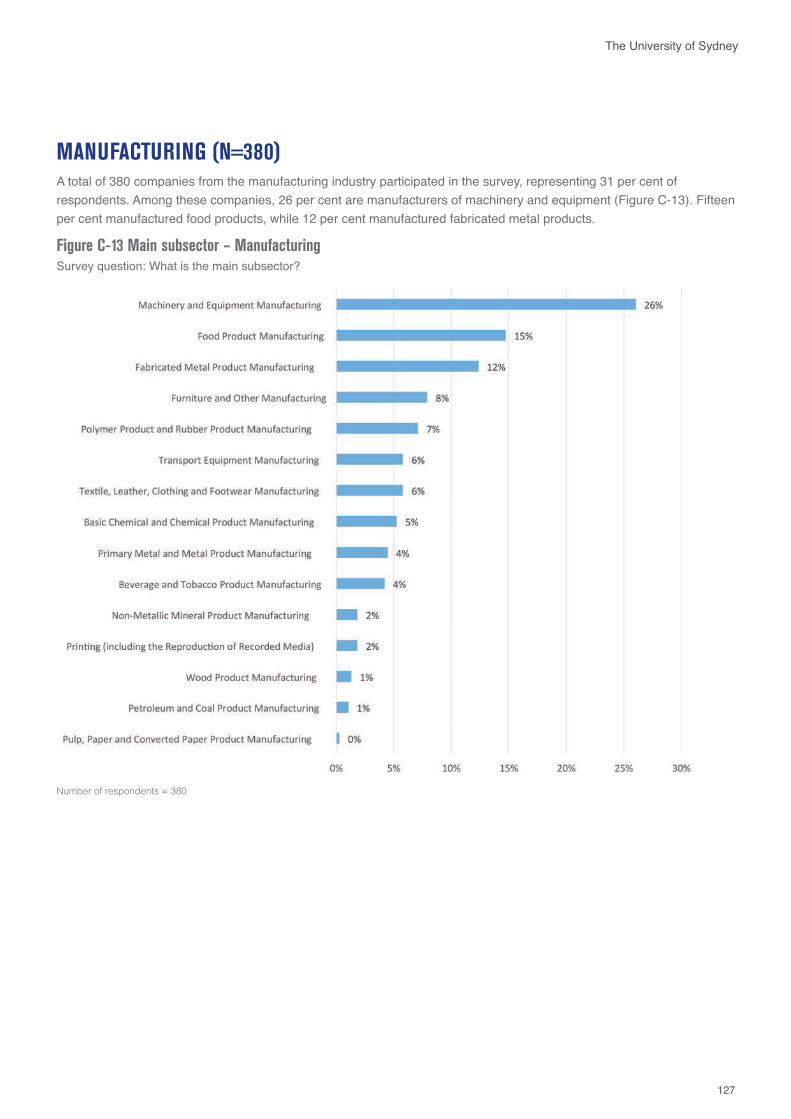
127
The University of Sydney
MANUFACTURING (N=380)A total of 380 companies from the manufacturing industry participated in the survey, representing 31 per cent of respondents. Among these companies, 26 per cent are manufacturers of machinery and equipment (Figure C-13). Fifteen per cent manufactured food products, while 12 per cent manufactured fabricated metal products.
Figure C-13 Main subsector – Manufacturing Survey question: What is the main subsector?
Number of respondents = 380
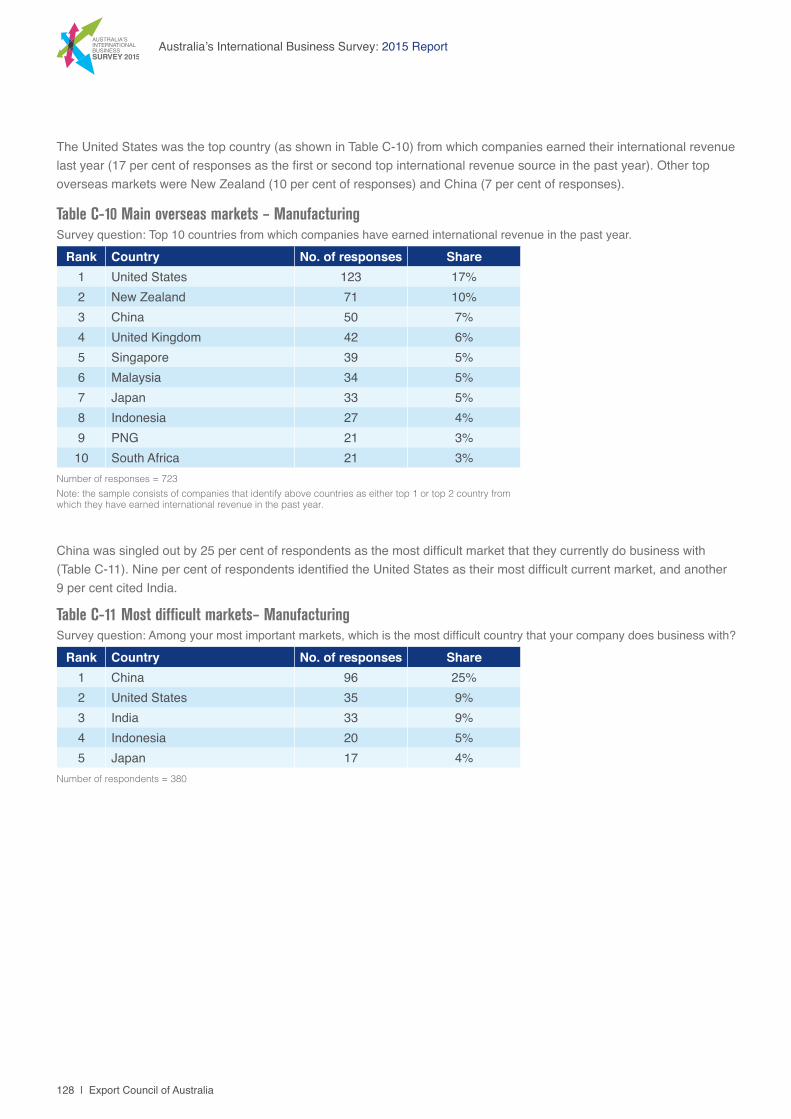
128 | Export Council of Australia
Australia’s International Business Survey: 2015 Report
The United States was the top country (as shown in Table C-10) from which companies earned their international revenue last year (17 per cent of responses as the first or second top international revenue source in the past year). Other top overseas markets were New Zealand (10 per cent of responses) and China (7 per cent of responses).
Table C-10 Main overseas markets – ManufacturingSurvey question: Top 10 countries from which companies have earned international revenue in the past year.
Rank Country No. of responses Share1 United States 123 17%2 New Zealand 71 10%3 China 50 7%4 United Kingdom 42 6%5 Singapore 39 5%6 Malaysia 34 5%7 Japan 33 5%8 Indonesia 27 4%9 PNG 21 3%10 South Africa 21 3%
Number of responses = 723 Note: the sample consists of companies that identify above countries as either top 1 or top 2 country from which they have earned international revenue in the past year.
China was singled out by 25 per cent of respondents as the most difficult market that they currently do business with (Table C-11). Nine per cent of respondents identified the United States as their most difficult current market, and another 9 per cent cited India.
Table C-11 Most difficult markets– Manufacturing Survey question: Among your most important markets, which is the most difficult country that your company does business with?
Rank Country No. of responses Share1 China 96 25%2 United States 35 9%3 India 33 9%4 Indonesia 20 5%5 Japan 17 4%
Number of respondents = 380
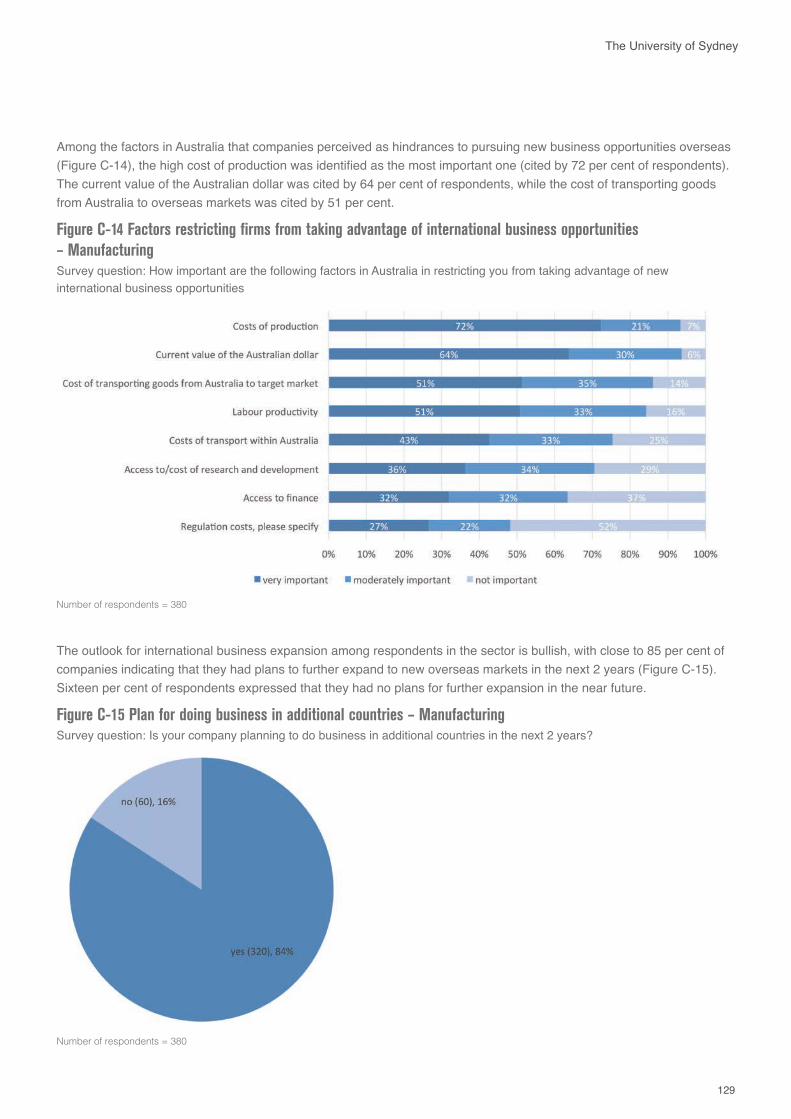
129
The University of Sydney
The outlook for international business expansion among respondents in the sector is bullish, with close to 85 per cent of companies indicating that they had plans to further expand to new overseas markets in the next 2 years (Figure C-15). Sixteen per cent of respondents expressed that they had no plans for further expansion in the near future.
Figure C-15 Plan for doing business in additional countries – ManufacturingSurvey question: Is your company planning to do business in additional countries in the next 2 years?
Number of respondents = 380
Among the factors in Australia that companies perceived as hindrances to pursuing new business opportunities overseas (Figure C-14), the high cost of production was identified as the most important one (cited by 72 per cent of respondents). The current value of the Australian dollar was cited by 64 per cent of respondents, while the cost of transporting goods from Australia to overseas markets was cited by 51 per cent.
Figure C-14 Factors restricting firms from taking advantage of international business opportunities – Manufacturing Survey question: How important are the following factors in Australia in restricting you from taking advantage of new international business opportunities
Number of respondents = 380
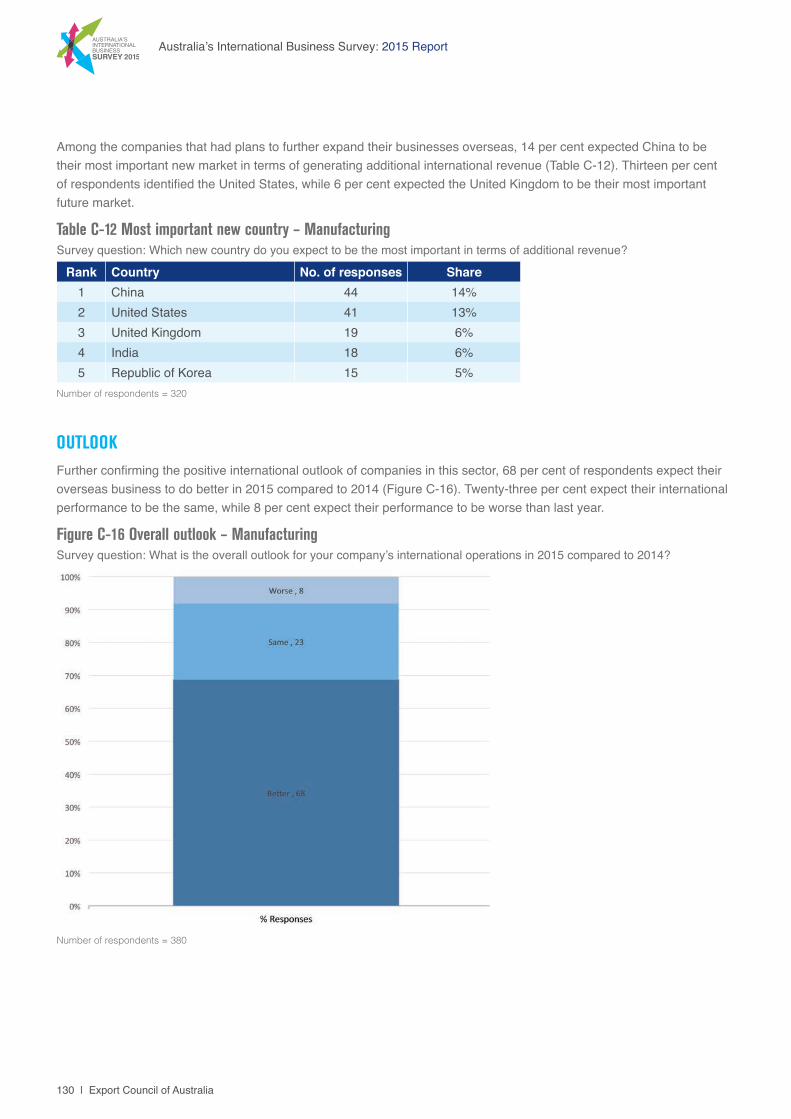
130 | Export Council of Australia
Australia’s International Business Survey: 2015 Report
OUTLOOK Further confirming the positive international outlook of companies in this sector, 68 per cent of respondents expect their overseas business to do better in 2015 compared to 2014 (Figure C-16). Twenty-three per cent expect their international performance to be the same, while 8 per cent expect their performance to be worse than last year.
Among the companies that had plans to further expand their businesses overseas, 14 per cent expected China to be their most important new market in terms of generating additional international revenue (Table C-12). Thirteen per cent of respondents identified the United States, while 6 per cent expected the United Kingdom to be their most important future market.
Table C-12 Most important new country – ManufacturingSurvey question: Which new country do you expect to be the most important in terms of additional revenue?
Rank Country No. of responses Share1 China 44 14%2 United States 41 13%3 United Kingdom 19 6%4 India 18 6%5 Republic of Korea 15 5%
Number of respondents = 320
Figure C-16 Overall outlook – ManufacturingSurvey question: What is the overall outlook for your company’s international operations in 2015 compared to 2014?
Number of respondents = 380
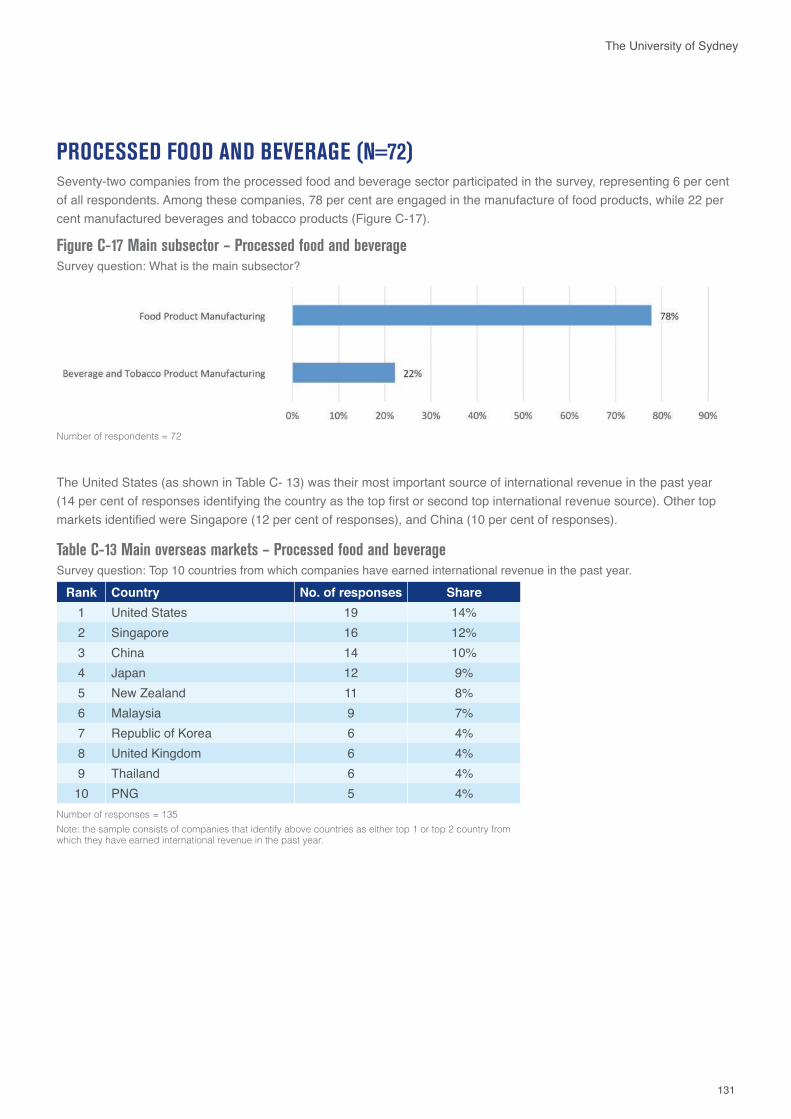
131
The University of Sydney
The United States (as shown in Table C- 13) was their most important source of international revenue in the past year (14 per cent of responses identifying the country as the top first or second top international revenue source). Other top markets identified were Singapore (12 per cent of responses), and China (10 per cent of responses).
Table C-13 Main overseas markets – Processed food and beverageSurvey question: Top 10 countries from which companies have earned international revenue in the past year.
Rank Country No. of responses Share1 United States 19 14%2 Singapore 16 12%3 China 14 10%4 Japan 12 9%5 New Zealand 11 8%6 Malaysia 9 7%7 Republic of Korea 6 4%8 United Kingdom 6 4%9 Thailand 6 4%10 PNG 5 4%
Number of responses = 135 Note: the sample consists of companies that identify above countries as either top 1 or top 2 country from which they have earned international revenue in the past year.
PROCESSED FOOD AND BEVERAGE (N=72)Seventy-two companies from the processed food and beverage sector participated in the survey, representing 6 per cent of all respondents. Among these companies, 78 per cent are engaged in the manufacture of food products, while 22 per cent manufactured beverages and tobacco products (Figure C-17).
Figure C-17 Main subsector – Processed food and beverage Survey question: What is the main subsector?
Number of respondents = 72
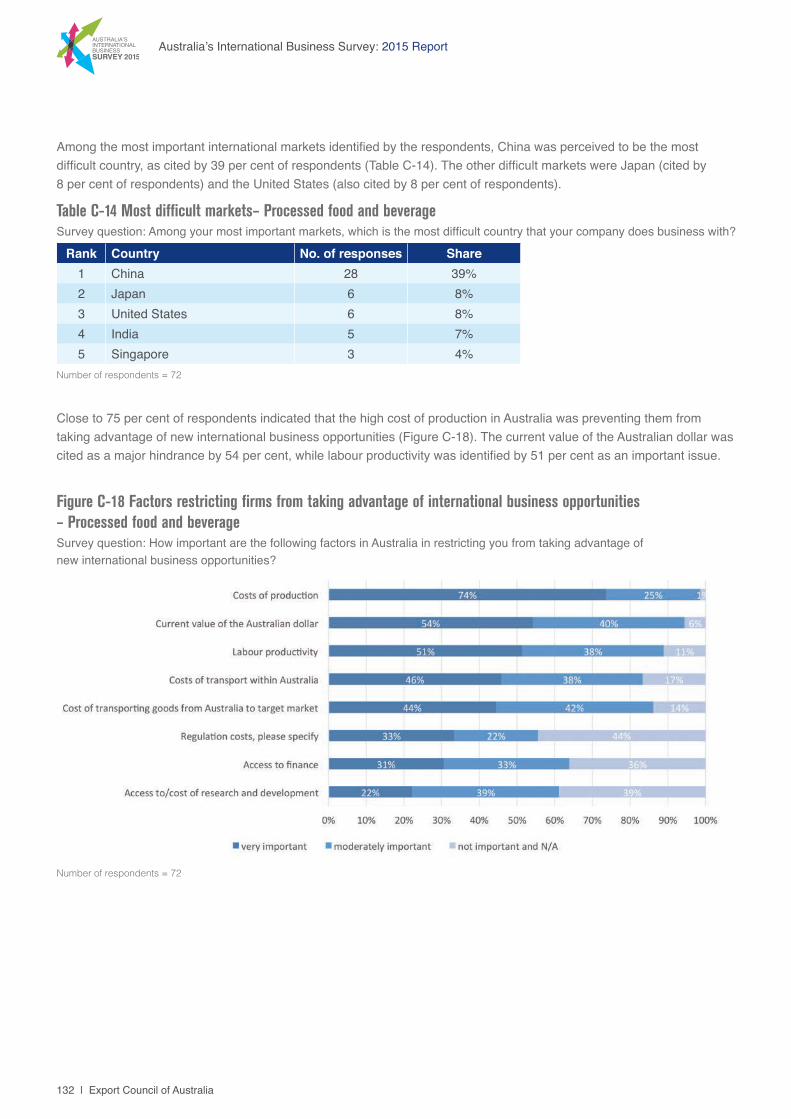
132 | Export Council of Australia
Australia’s International Business Survey: 2015 Report
Close to 75 per cent of respondents indicated that the high cost of production in Australia was preventing them from taking advantage of new international business opportunities (Figure C-18). The current value of the Australian dollar was cited as a major hindrance by 54 per cent, while labour productivity was identified by 51 per cent as an important issue.
Figure C-18 Factors restricting firms from taking advantage of international business opportunities – Processed food and beverageSurvey question: How important are the following factors in Australia in restricting you from taking advantage of new international business opportunities?
Number of respondents = 72
Among the most important international markets identified by the respondents, China was perceived to be the most difficult country, as cited by 39 per cent of respondents (Table C-14). The other difficult markets were Japan (cited by 8 per cent of respondents) and the United States (also cited by 8 per cent of respondents).
Table C-14 Most difficult markets– Processed food and beverageSurvey question: Among your most important markets, which is the most difficult country that your company does business with?
Rank Country No. of responses Share1 China 28 39%2 Japan 6 8%3 United States 6 8%4 India 5 7%5 Singapore 3 4%
Number of respondents = 72
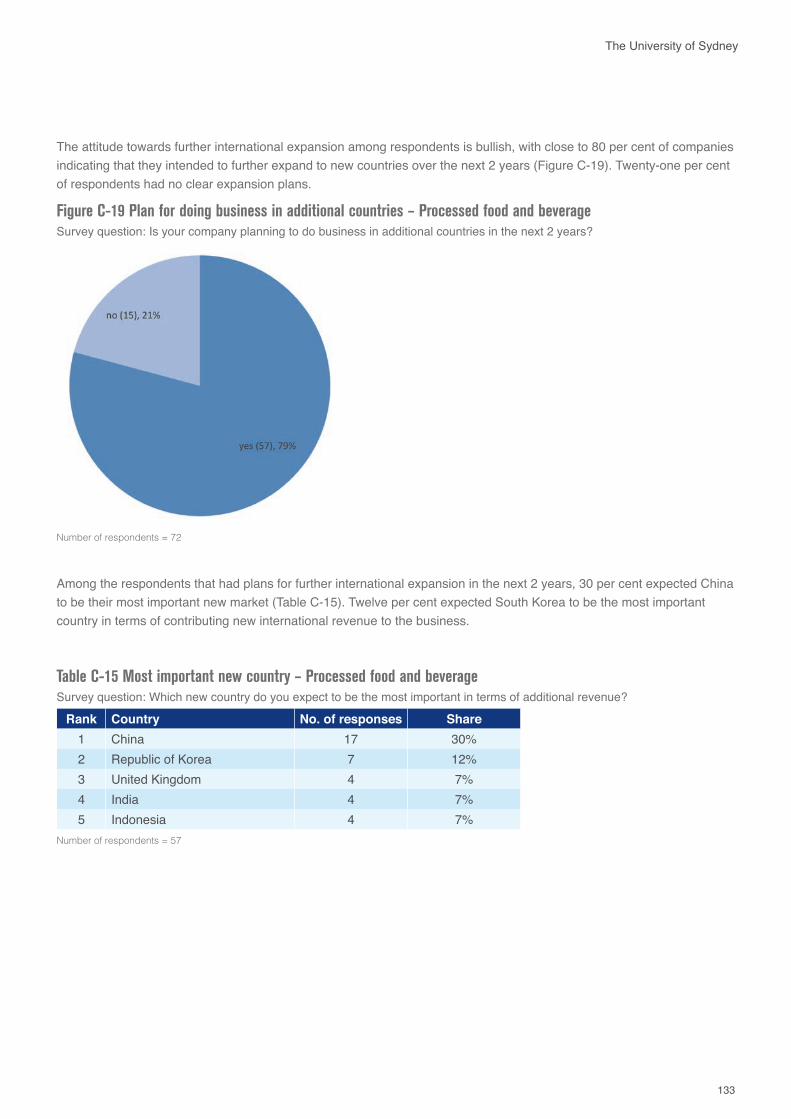
133
The University of Sydney
The attitude towards further international expansion among respondents is bullish, with close to 80 per cent of companies indicating that they intended to further expand to new countries over the next 2 years (Figure C-19). Twenty-one per cent of respondents had no clear expansion plans.
Among the respondents that had plans for further international expansion in the next 2 years, 30 per cent expected China to be their most important new market (Table C-15). Twelve per cent expected South Korea to be the most important country in terms of contributing new international revenue to the business.
Table C-15 Most important new country – Processed food and beverageSurvey question: Which new country do you expect to be the most important in terms of additional revenue?
Rank Country No. of responses Share1 China 17 30%2 Republic of Korea 7 12%3 United Kingdom 4 7%4 India 4 7%5 Indonesia 4 7%
Number of respondents = 57
Figure C-19 Plan for doing business in additional countries – Processed food and beverageSurvey question: Is your company planning to do business in additional countries in the next 2 years?
Number of respondents = 72
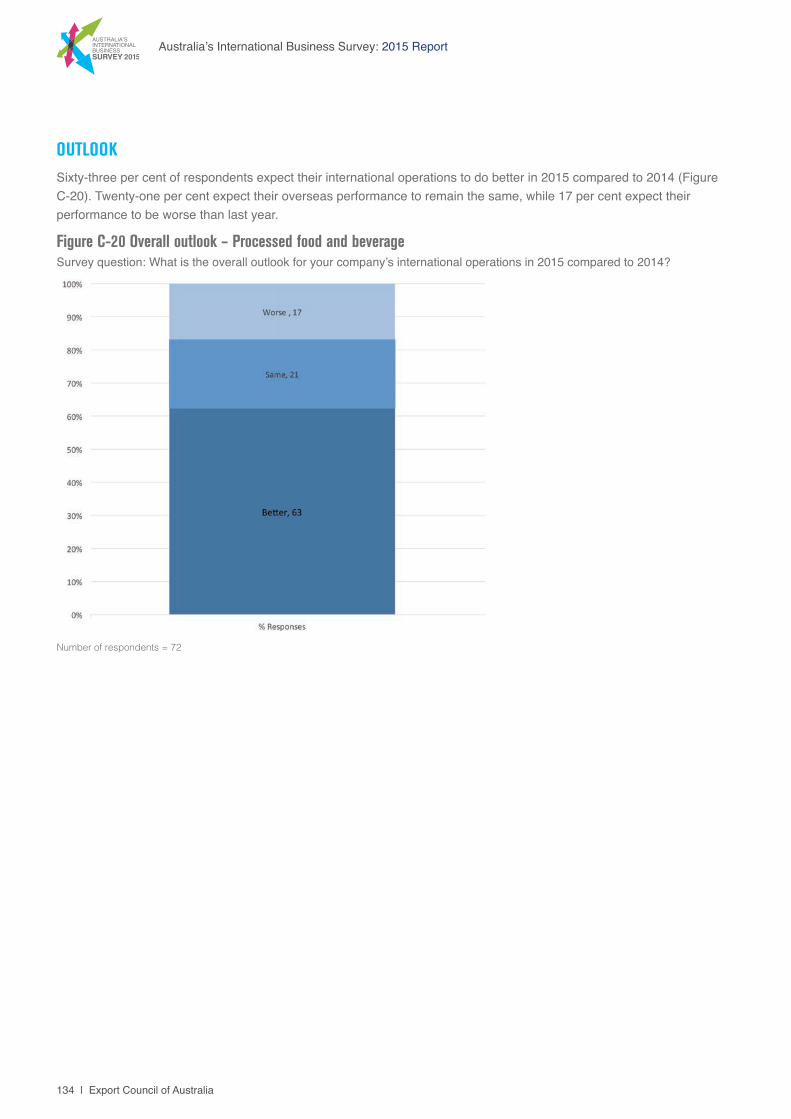
134 | Export Council of Australia
Australia’s International Business Survey: 2015 Report
OUTLOOK Sixty-three per cent of respondents expect their international operations to do better in 2015 compared to 2014 (Figure C-20). Twenty-one per cent expect their overseas performance to remain the same, while 17 per cent expect their performance to be worse than last year.
Figure C-20 Overall outlook – Processed food and beverageSurvey question: What is the overall outlook for your company’s international operations in 2015 compared to 2014?
Number of respondents = 72
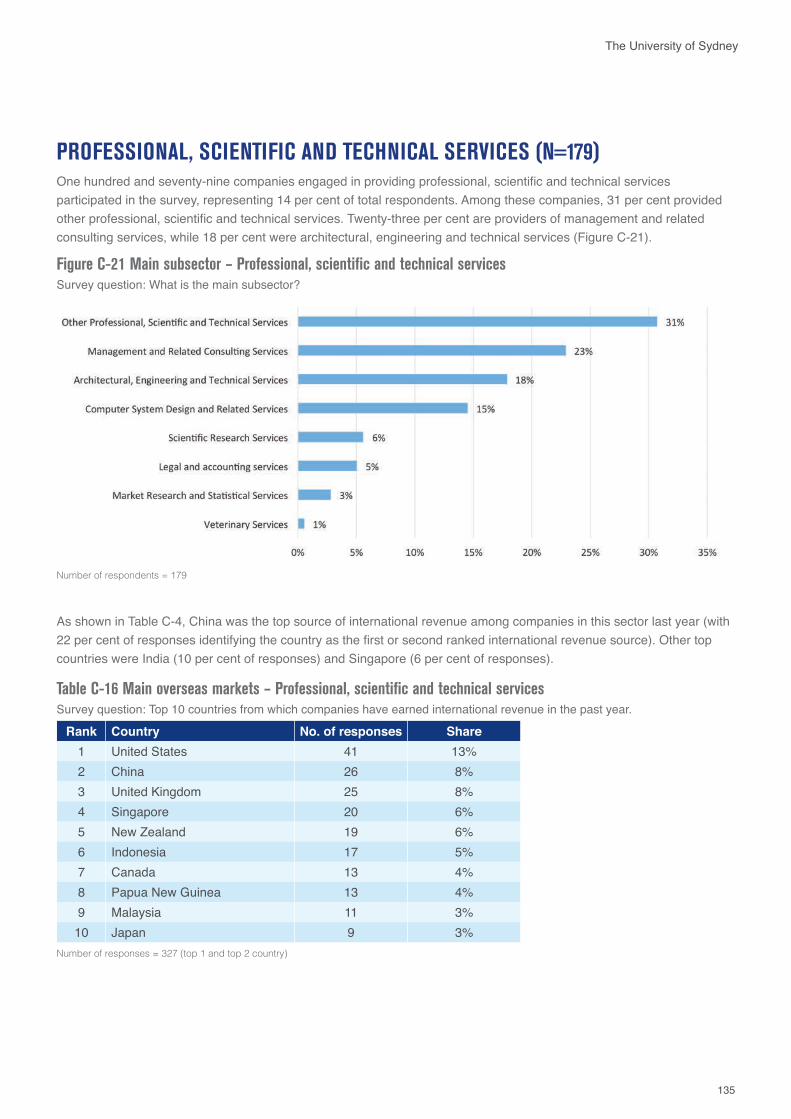
135
The University of Sydney
As shown in Table C-4, China was the top source of international revenue among companies in this sector last year (with 22 per cent of responses identifying the country as the first or second ranked international revenue source). Other top countries were India (10 per cent of responses) and Singapore (6 per cent of responses).
Table C-16 Main overseas markets – Professional, scientific and technical servicesSurvey question: Top 10 countries from which companies have earned international revenue in the past year.
Rank Country No. of responses Share1 United States 41 13%2 China 26 8%3 United Kingdom 25 8%4 Singapore 20 6%5 New Zealand 19 6%6 Indonesia 17 5%7 Canada 13 4%8 Papua New Guinea 13 4%9 Malaysia 11 3%10 Japan 9 3%
Number of responses = 327 (top 1 and top 2 country)
PROFESSIONAL, SCIENTIFIC AND TECHNICAL SERVICES (N=179)One hundred and seventy-nine companies engaged in providing professional, scientific and technical services participated in the survey, representing 14 per cent of total respondents. Among these companies, 31 per cent provided other professional, scientific and technical services. Twenty-three per cent are providers of management and related consulting services, while 18 per cent were architectural, engineering and technical services (Figure C-21).
Figure C-21 Main subsector – Professional, scientific and technical services Survey question: What is the main subsector?
Number of respondents = 179
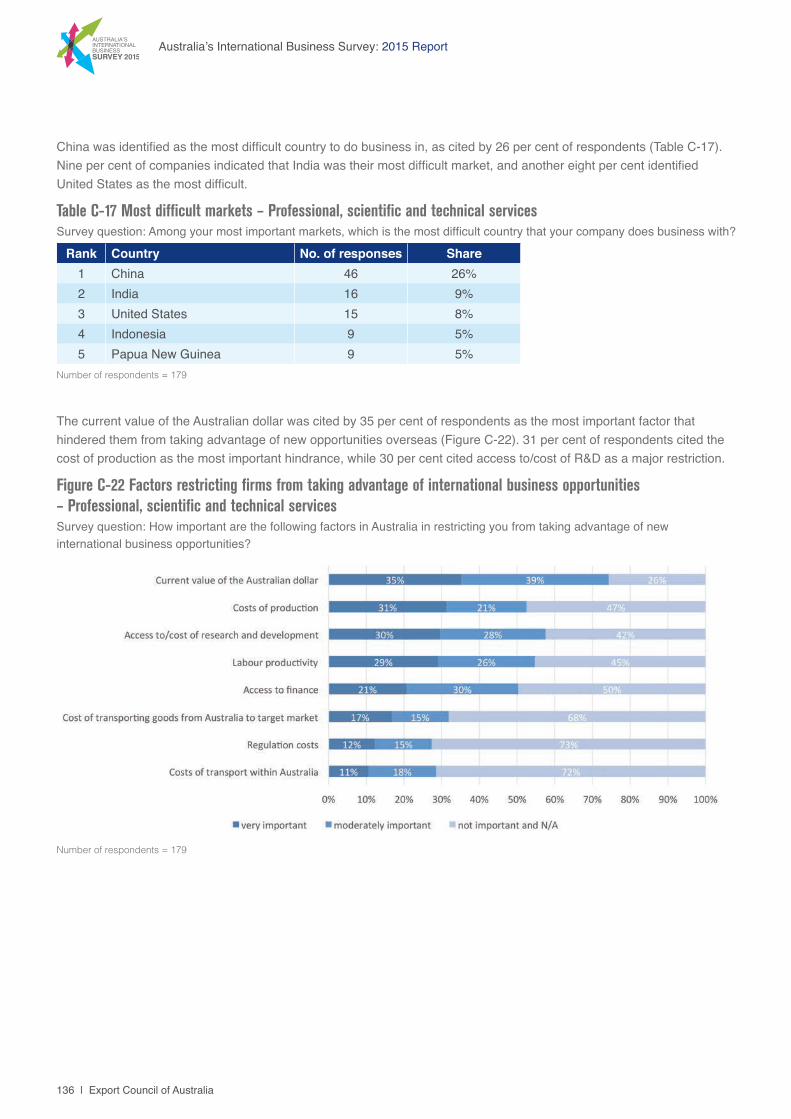
136 | Export Council of Australia
Australia’s International Business Survey: 2015 Report
The current value of the Australian dollar was cited by 35 per cent of respondents as the most important factor that hindered them from taking advantage of new opportunities overseas (Figure C-22). 31 per cent of respondents cited the cost of production as the most important hindrance, while 30 per cent cited access to/cost of R&D as a major restriction.
Figure C-22 Factors restricting firms from taking advantage of international business opportunities – Professional, scientific and technical servicesSurvey question: How important are the following factors in Australia in restricting you from taking advantage of new international business opportunities?
Number of respondents = 179
China was identified as the most difficult country to do business in, as cited by 26 per cent of respondents (Table C-17). Nine per cent of companies indicated that India was their most difficult market, and another eight per cent identified United States as the most difficult.
Table C-17 Most difficult markets – Professional, scientific and technical servicesSurvey question: Among your most important markets, which is the most difficult country that your company does business with?
Rank Country No. of responses Share1 China 46 26%2 India 16 9%3 United States 15 8%4 Indonesia 9 5%5 Papua New Guinea 9 5%
Number of respondents = 179
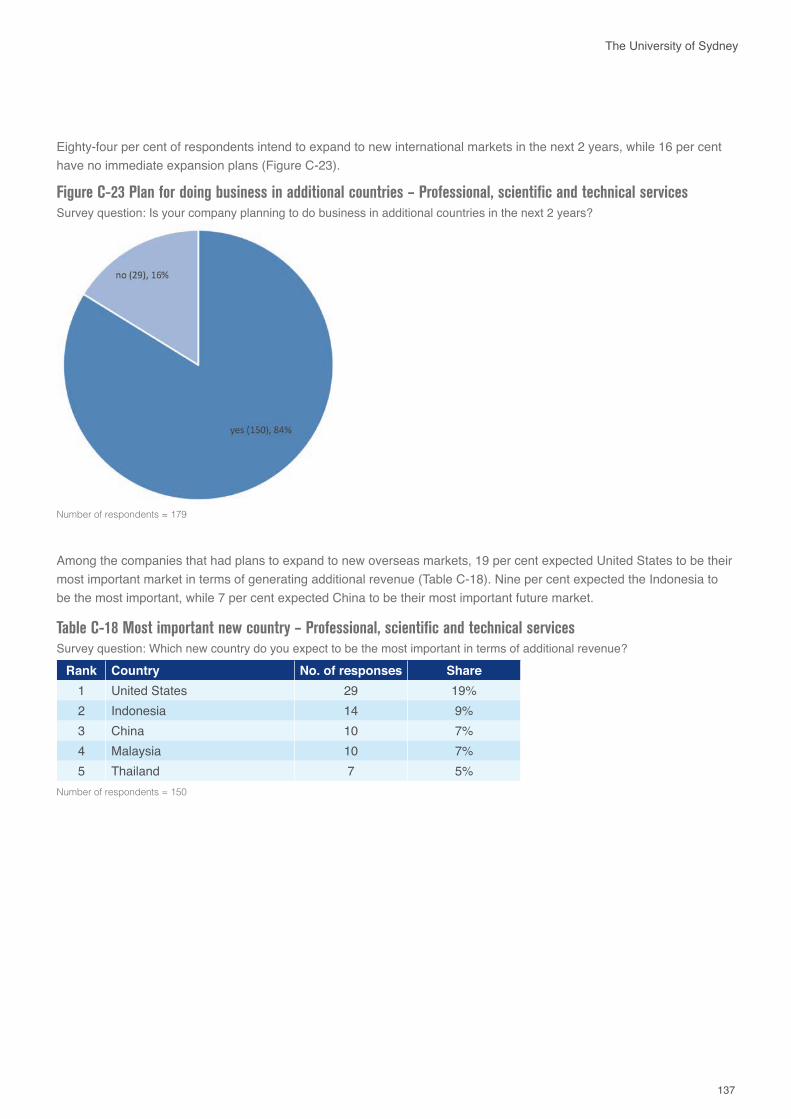
137
The University of Sydney
Eighty-four per cent of respondents intend to expand to new international markets in the next 2 years, while 16 per cent have no immediate expansion plans (Figure C-23).
Among the companies that had plans to expand to new overseas markets, 19 per cent expected United States to be their most important market in terms of generating additional revenue (Table C-18). Nine per cent expected the Indonesia to be the most important, while 7 per cent expected China to be their most important future market.
Table C-18 Most important new country – Professional, scientific and technical servicesSurvey question: Which new country do you expect to be the most important in terms of additional revenue?
Rank Country No. of responses Share1 United States 29 19%2 Indonesia 14 9%3 China 10 7%4 Malaysia 10 7%5 Thailand 7 5%
Number of respondents = 150
Figure C-23 Plan for doing business in additional countries – Professional, scientific and technical servicesSurvey question: Is your company planning to do business in additional countries in the next 2 years?
Number of respondents = 179
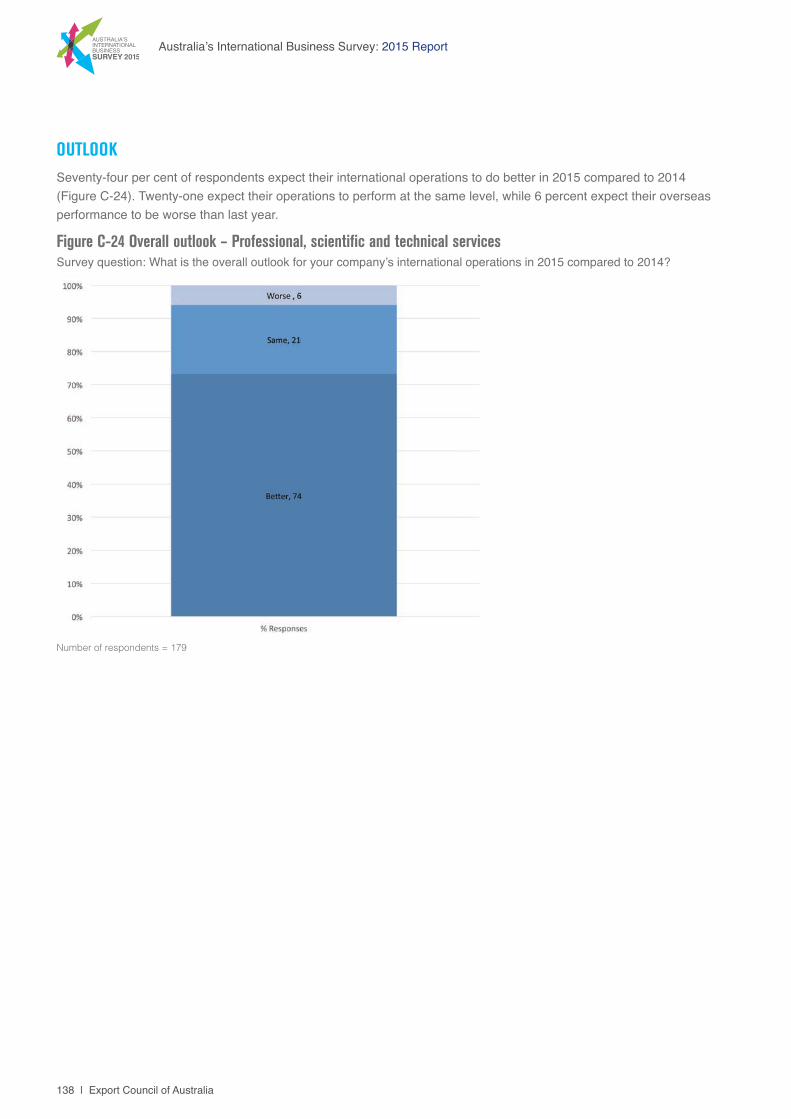
138 | Export Council of Australia
Australia’s International Business Survey: 2015 Report
OUTLOOK Seventy-four per cent of respondents expect their international operations to do better in 2015 compared to 2014 (Figure C-24). Twenty-one expect their operations to perform at the same level, while 6 percent expect their overseas performance to be worse than last year.
Figure C-24 Overall outlook – Professional, scientific and technical servicesSurvey question: What is the overall outlook for your company’s international operations in 2015 compared to 2014?
Number of respondents = 179
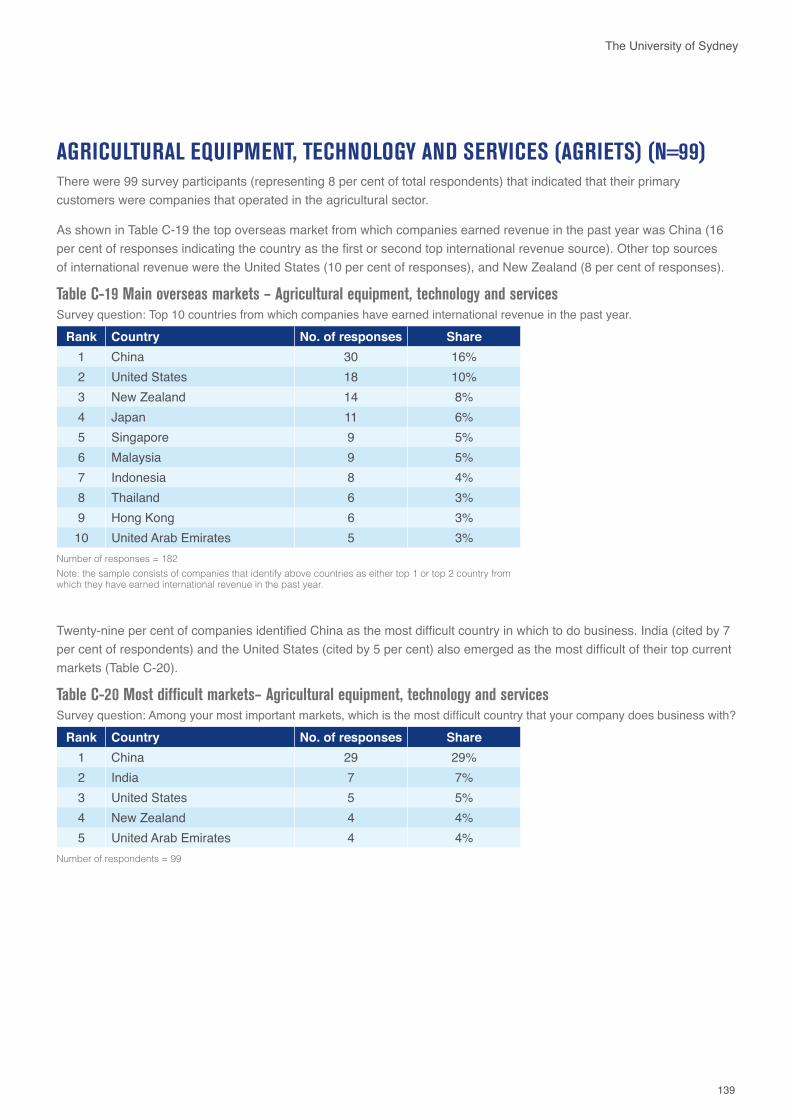
139
The University of Sydney
Table C-19 Main overseas markets – Agricultural equipment, technology and servicesSurvey question: Top 10 countries from which companies have earned international revenue in the past year.
Rank Country No. of responses Share1 China 30 16%2 United States 18 10%3 New Zealand 14 8%4 Japan 11 6%5 Singapore 9 5%6 Malaysia 9 5%7 Indonesia 8 4%8 Thailand 6 3%9 Hong Kong 6 3%10 United Arab Emirates 5 3%
Number of responses = 182 Note: the sample consists of companies that identify above countries as either top 1 or top 2 country from which they have earned international revenue in the past year.
AGRICULTURAL EQUIPMENT, TECHNOLOGY AND SERVICES (AGRIETS) (N=99)There were 99 survey participants (representing 8 per cent of total respondents) that indicated that their primary customers were companies that operated in the agricultural sector.
As shown in Table C-19 the top overseas market from which companies earned revenue in the past year was China (16 per cent of responses indicating the country as the first or second top international revenue source). Other top sources of international revenue were the United States (10 per cent of responses), and New Zealand (8 per cent of responses).
Twenty-nine per cent of companies identified China as the most difficult country in which to do business. India (cited by 7 per cent of respondents) and the United States (cited by 5 per cent) also emerged as the most difficult of their top current markets (Table C-20).
Table C-20 Most difficult markets– Agricultural equipment, technology and servicesSurvey question: Among your most important markets, which is the most difficult country that your company does business with?
Rank Country No. of responses Share1 China 29 29%2 India 7 7%3 United States 5 5%4 New Zealand 4 4%5 United Arab Emirates 4 4%
Number of respondents = 99
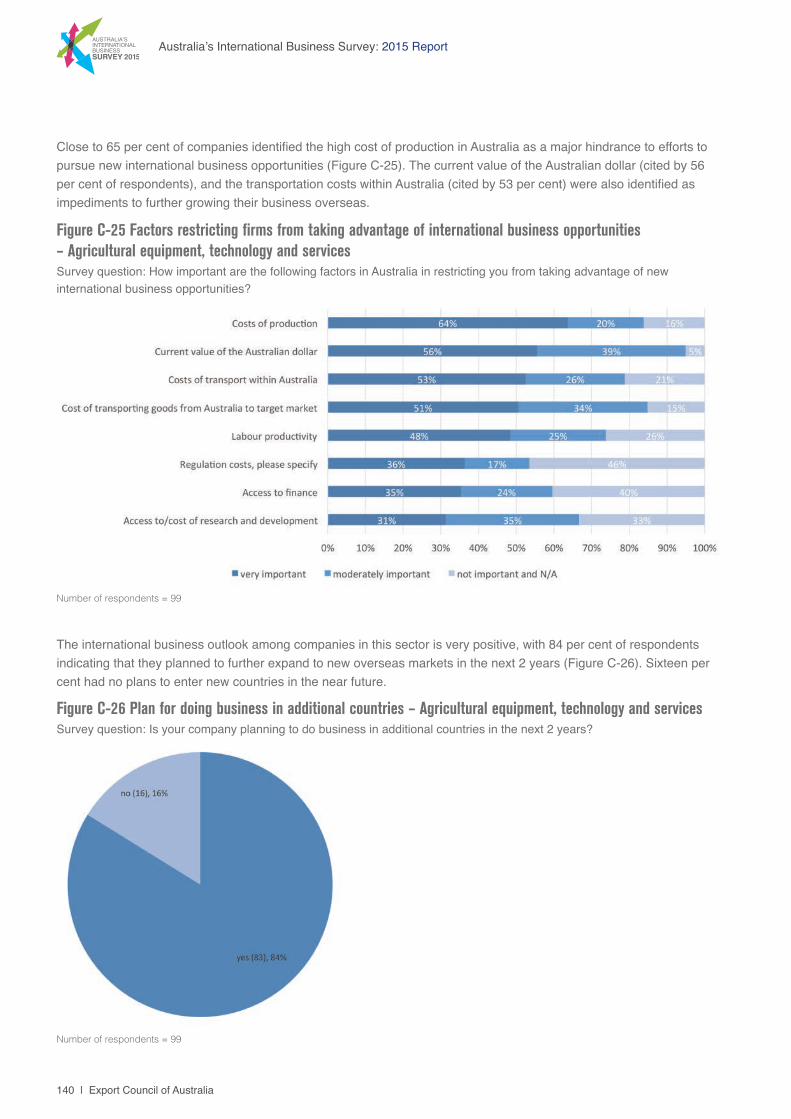
140 | Export Council of Australia
Australia’s International Business Survey: 2015 Report
Close to 65 per cent of companies identified the high cost of production in Australia as a major hindrance to efforts to pursue new international business opportunities (Figure C-25). The current value of the Australian dollar (cited by 56 per cent of respondents), and the transportation costs within Australia (cited by 53 per cent) were also identified as impediments to further growing their business overseas.
Figure C-25 Factors restricting firms from taking advantage of international business opportunities – Agricultural equipment, technology and services Survey question: How important are the following factors in Australia in restricting you from taking advantage of new international business opportunities?
Number of respondents = 99
The international business outlook among companies in this sector is very positive, with 84 per cent of respondents indicating that they planned to further expand to new overseas markets in the next 2 years (Figure C-26). Sixteen per cent had no plans to enter new countries in the near future.
Number of respondents = 99
Figure C-26 Plan for doing business in additional countries – Agricultural equipment, technology and servicesSurvey question: Is your company planning to do business in additional countries in the next 2 years?
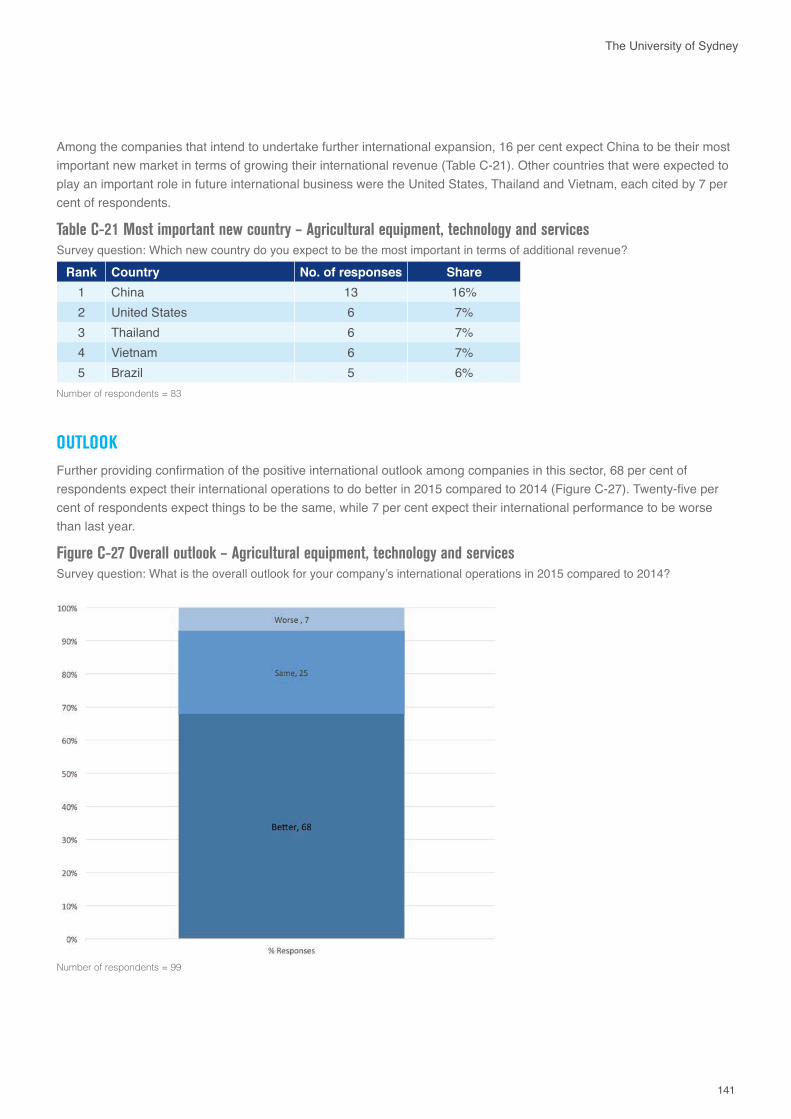
141
The University of Sydney
OUTLOOK Further providing confirmation of the positive international outlook among companies in this sector, 68 per cent of respondents expect their international operations to do better in 2015 compared to 2014 (Figure C-27). Twenty-five per cent of respondents expect things to be the same, while 7 per cent expect their international performance to be worse than last year.
Among the companies that intend to undertake further international expansion, 16 per cent expect China to be their most important new market in terms of growing their international revenue (Table C-21). Other countries that were expected to play an important role in future international business were the United States, Thailand and Vietnam, each cited by 7 per cent of respondents.
Table C-21 Most important new country – Agricultural equipment, technology and servicesSurvey question: Which new country do you expect to be the most important in terms of additional revenue?
Rank Country No. of responses Share1 China 13 16%2 United States 6 7%3 Thailand 6 7%4 Vietnam 6 7%5 Brazil 5 6%
Number of respondents = 83
Figure C-27 Overall outlook – Agricultural equipment, technology and servicesSurvey question: What is the overall outlook for your company’s international operations in 2015 compared to 2014?
Number of respondents = 99
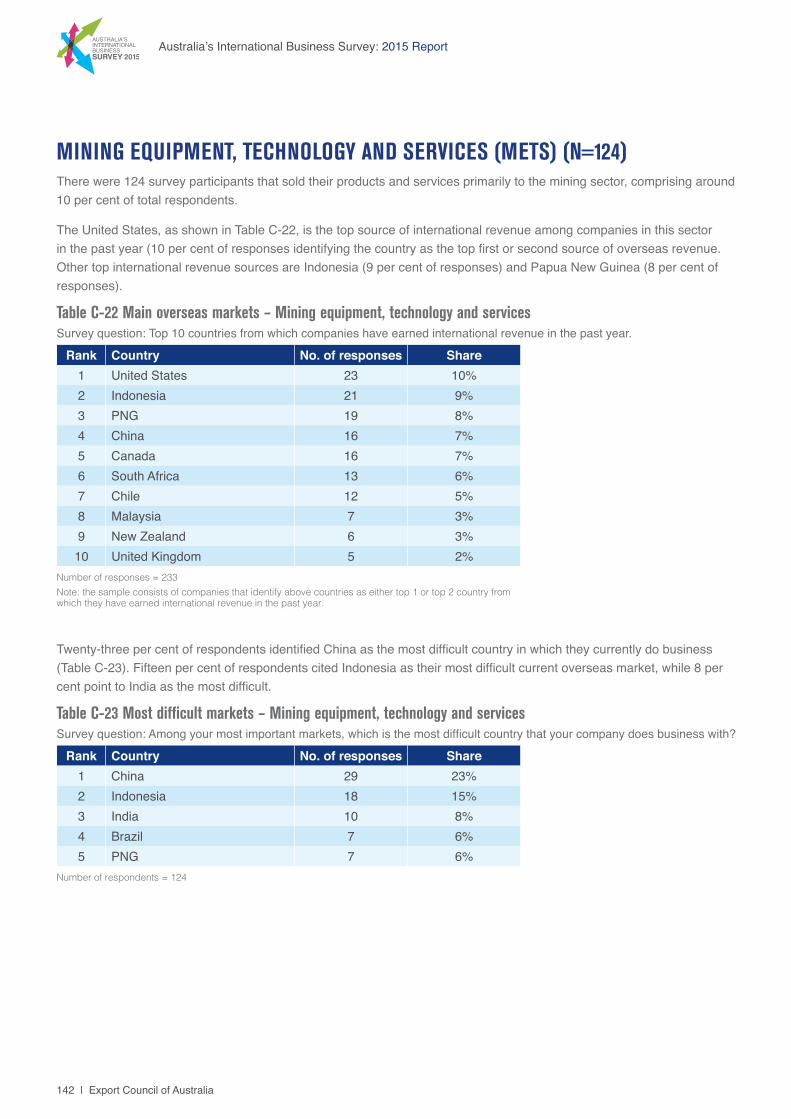
142 | Export Council of Australia
Australia’s International Business Survey: 2015 Report
Table C-22 Main overseas markets – Mining equipment, technology and servicesSurvey question: Top 10 countries from which companies have earned international revenue in the past year.
Rank Country No. of responses Share1 United States 23 10%2 Indonesia 21 9%3 PNG 19 8%4 China 16 7%5 Canada 16 7%6 South Africa 13 6%7 Chile 12 5%8 Malaysia 7 3%9 New Zealand 6 3%10 United Kingdom 5 2%
Number of responses = 233 Note: the sample consists of companies that identify above countries as either top 1 or top 2 country from which they have earned international revenue in the past year.
MINING EQUIPMENT, TECHNOLOGY AND SERVICES (METS) (N=124)There were 124 survey participants that sold their products and services primarily to the mining sector, comprising around 10 per cent of total respondents.
The United States, as shown in Table C-22, is the top source of international revenue among companies in this sector in the past year (10 per cent of responses identifying the country as the top first or second source of overseas revenue. Other top international revenue sources are Indonesia (9 per cent of responses) and Papua New Guinea (8 per cent of responses).
Twenty-three per cent of respondents identified China as the most difficult country in which they currently do business (Table C-23). Fifteen per cent of respondents cited Indonesia as their most difficult current overseas market, while 8 per cent point to India as the most difficult.
Table C-23 Most difficult markets – Mining equipment, technology and servicesSurvey question: Among your most important markets, which is the most difficult country that your company does business with?
Rank Country No. of responses Share1 China 29 23%2 Indonesia 18 15%3 India 10 8%4 Brazil 7 6%5 PNG 7 6%
Number of respondents = 124
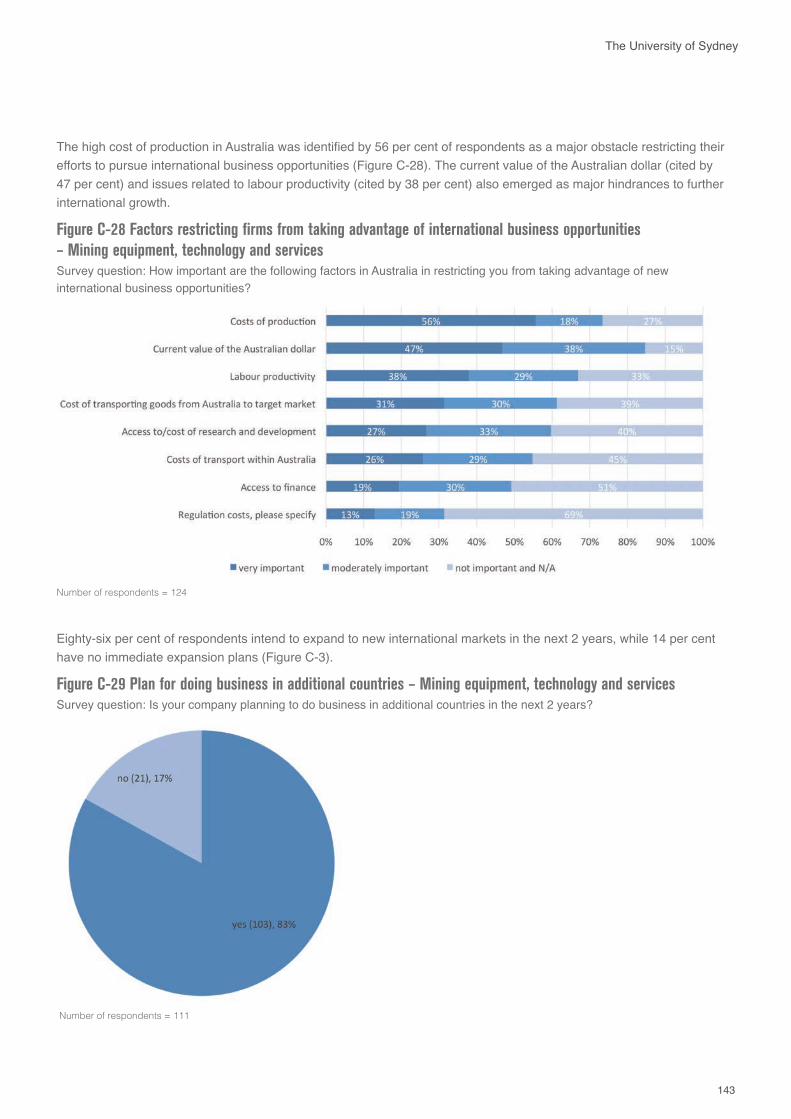
143
The University of Sydney
The high cost of production in Australia was identified by 56 per cent of respondents as a major obstacle restricting their efforts to pursue international business opportunities (Figure C-28). The current value of the Australian dollar (cited by 47 per cent) and issues related to labour productivity (cited by 38 per cent) also emerged as major hindrances to further international growth.
Figure C-28 Factors restricting firms from taking advantage of international business opportunities – Mining equipment, technology and servicesSurvey question: How important are the following factors in Australia in restricting you from taking advantage of new international business opportunities?
Number of respondents = 124
Eighty-six per cent of respondents intend to expand to new international markets in the next 2 years, while 14 per cent have no immediate expansion plans (Figure C-3).
Figure C-29 Plan for doing business in additional countries – Mining equipment, technology and servicesSurvey question: Is your company planning to do business in additional countries in the next 2 years?
Number of respondents = 111
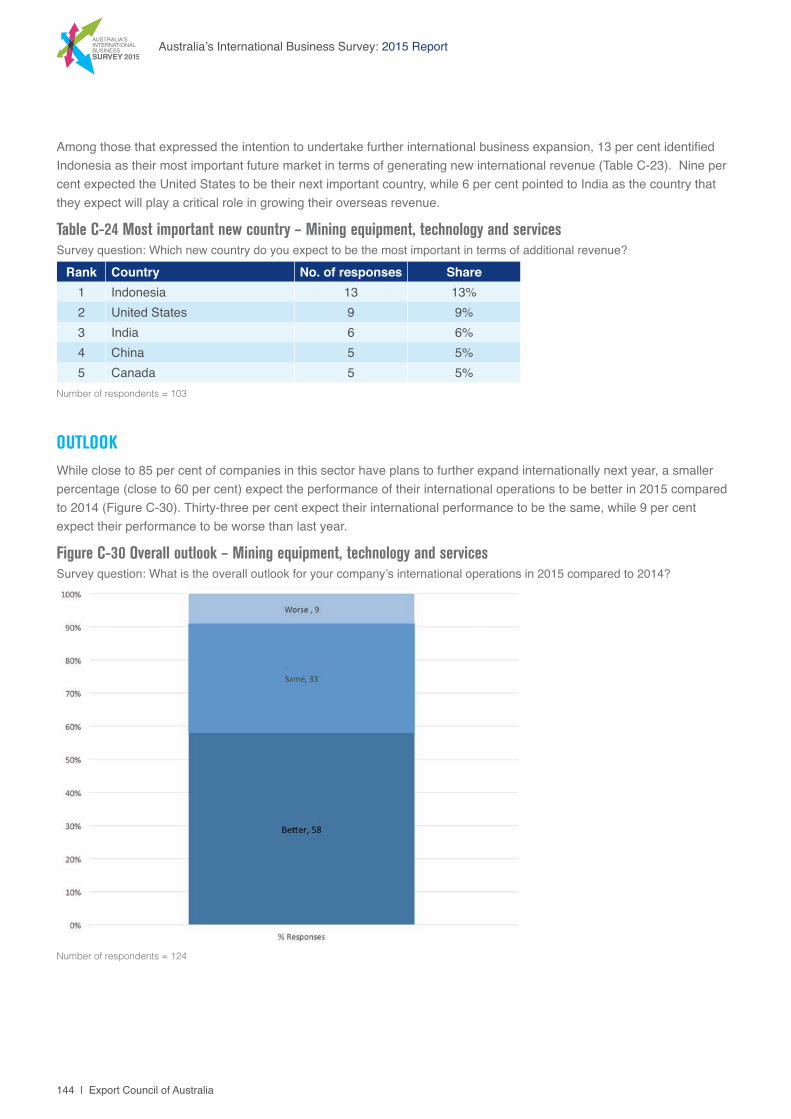
144 | Export Council of Australia
Australia’s International Business Survey: 2015 Report
OUTLOOK While close to 85 per cent of companies in this sector have plans to further expand internationally next year, a smaller percentage (close to 60 per cent) expect the performance of their international operations to be better in 2015 compared to 2014 (Figure C-30). Thirty-three per cent expect their international performance to be the same, while 9 per cent expect their performance to be worse than last year.
Figure C-30 Overall outlook – Mining equipment, technology and servicesSurvey question: What is the overall outlook for your company’s international operations in 2015 compared to 2014?
Number of respondents = 124
Among those that expressed the intention to undertake further international business expansion, 13 per cent identified Indonesia as their most important future market in terms of generating new international revenue (Table C-23). Nine per cent expected the United States to be their next important country, while 6 per cent pointed to India as the country that they expect will play a critical role in growing their overseas revenue.
Table C-24 Most important new country – Mining equipment, technology and servicesSurvey question: Which new country do you expect to be the most important in terms of additional revenue?
Rank Country No. of responses Share1 Indonesia 13 13%2 United States 9 9%3 India 6 6%4 China 5 5%5 Canada 5 5%
Number of respondents = 103
145
The University of Sydney
APPENDIX D: SURVEY METHODOLOGYThe main objective of the 2015 survey, similar to that conducted in 2014, was to investigate the international business activities of Australian businesses: to gain insights into their international operations, their challenges, and their future expansion plans.
Survey questions from the 2014 survey were used as the basis for the 2015 survey subject to further inputs and amendments from the major stakeholders in the survey consortium: the Export Council of Australia (ECA), Austrade, the Export Finance and Insurance Corporation (EFIC), and the University of Sydney Business School. These inputs were aimed at aiding in the process of crafting questions to identify specific characteristics of Australian international businesses, specific aspects of their international business activities and experience, future international plans, and support requirements.
The survey was further refined through an iterative piloting process that involved seeking feedback on the survey questions, form, structure and length from prospective survey respondents. This piloting process was conducted through a combination of face-to-face meetings, document reviews and online tests.
The survey was conducted by researchers in the University of Sydney Business School. The project was approved by the University of Sydney Ethics Committee (USYD Project No. 2013/726).
The final version of the survey was created on an online survey platform licensed to the University of Sydney Business School. The survey site was built and managed by the University of Sydney Business School research team, and the link to the site was progressively sent via email to the databases of the various stakeholders in the survey consortium, industry associations, state agencies and other stakeholders. This was done to ensure the broadest possible reach for the survey given the lack of a pre-existing sampling frame, and increase the probability of recruiting respondents from a wide variety of sectors.
The survey was open from 9 October to 12 December 2014. At the close of the survey, a total of 1,273 fully completed and validated questionnaire responses were collected and recorded on the online system.
The survey responses were from Australian businesses currently and regularly active in international markets and are thus not necessarily representative of all Australian businesses with some international activities, especially occasional exporters.
As is the case with any analysis based on self-reports, the possibility of error cannot be excluded. For example, survey respondents may have interpreted questions incorrectly or may not have provided accurate answers.
146 | Export Council of Australia
Australia’s International Business Survey: 2015 Report
AUSTRALIA’S INTERNATIONAL BUSINESS SURVEY PARTNERSExport Council of Australia (ECA)The Export Council of Australia (ECA) is the peak Industry body for the Australian export community. The ECA is the next exciting step in the evolution of the Australian Institute of Export (AIEx) which, for over 50 years, has had the interests of Australian exporters at heart.
Owned by its members and steered by a Board and a Council of Industry specialists, the ECA is a not-for-profit organisation that has the development of Australia’s resources via the promotion of Australian industry in international markets as its primary goal. The ECA represents all exporters: large, medium and small.
The ECA is the voice for Australia’s exporters:
• Leading Trade Policy Research
• Developing International Trade Skills
• Breaking down Barriers to Trade
• Building Global Networks
• Amplifying Global Trade Success
AustradeThe Australian Trade Commission – Austrade – contributes to Australia’s economic prosperity by helping Australian businesses, education institutions, tourism operators, governments and citizens as they:
• develop international markets
• win productive foreign direct investment
• promote international education
• strengthen Australia’s tourism industry
• seek consular and passport services.
Austrade provides information and advice that can help you reduce the time, cost and risk of exporting. We also administer the Export Market Development Grant Scheme and offer a range of services to Australian exporters in growth and emerging markets.
EficWhen Efic helps you grow, it helps Australia grow.
Efic is committed to unlocking finance for export success.
Efic is a specialist financier that delivers simple and creative solutions for Australian companies – to enable them to win business, grow internationally and achieve export success.
As Australia’s export finance agency, Efic operates on a commercial basis to provide financial solutions for:
• Small and medium enterprises (SMEs) that are exporters
• Australian companies in an export supply chain
• Australian companies looking to expand their business operations overseas to better service their clients
• Australian companies operating in emerging and frontier markets.
Through its loans, guarantees, bonds and insurance products, Efic has helped many Australian exporters and subcontractors take advantage of new contract opportunities that may otherwise have been out of reach.
The University of SydneyThe University of Sydney, founded in 1850, is one of Australia’s leading research intensive universities. In the Business School, the International Business group carries out research in the areas of strategy, entrepreneurship and international business. In the Excellence in Research Australia (ERA) 2012 assessment the quality of research by its members was ranked as “well above world standard” - the highest possible level.
The members of the group teach into coursework programs at both undergraduate and post-graduate level, including the Master of International Business, Master of Management and Master of Business Administration. There is also an honours program and a significant number of PhD students.
The International Business group has an active research program, including research groups on entrepreneurship and innovation, and emerging markets. Research funding is sourced from the Australian Research Council and from industry partners such as Merck & Co. Inc, KPMG and the Export Council of Australia.
147
The University of Sydney
AUTHORSSid Gray is Professor of International Business at the University of Sydney Business School. He is currently Chair of the Discipline of International Business. He was formerly Head of the School of Business. His research interests include internationalization processes and business performance, the effectiveness of cross-cultural and expatriate management, the global convergence of accounting standards, and international corporate governance and transparency. He is the author/co-author of more than 200 academic publications. He is Co-Editor-in-Chief of the Journal of International Financial Management and Accounting based at New York University’s Stern School of Business. Sid was formerly a Professor at the Universities of Glasgow, Warwick, and New South Wales and has also been a visiting professor at many other universities internationally. Prior to academe, His business experience included several years as a manager with a British trading company in the United Kingdom and India. He is a Fellow of the Academy of International Business and Fellow of the Academy of the Social Sciences in Australia.
Wei Li is a Lecturer in the Discipline of International Business at the University of Sydney Business School. She has worked as a researcher on water conservation and renewable energy for the World Bank, the Chinese Ministry of Environmental Protection, and Renmin University of China. She joined the University of Sydney China Studies Centre and Business School in 2011 and held the Australian-Chinese Chamber of Commerce and Industries research fellowship before being appointed to a lectureship in International Business. She is a core member of the KPMG/Business School research team and leads the Chinese outbound investors’ survey project. She co-developed the KPMG/University of Sydney database on Chinese outbound direct investment in Australia. Her research interests are the globalisation of Chinese enterprises and sustainable development. She has published articles on green innovation and solar energy, environmental impact assessment, governance of water resources, small and medium enterprise finance, and Chinese investment in Australia.
Sandra Seno-Alday is a Lecturer in the Discipline of International Business at the University of Sydney Business School. For 15 years, she was a business development consultant for a variety of medium to large organisations from a broad spectrum of industries, providing strategic research and organisation development solutions. Notably, she has served as a consultant for research and business development to public private partnerships and government agencies. Her consulting experience includes assisting private enterprises in international expansion and international business development. Sandra has also been teaching in management and international business for more than ten years, specialising in strategy, organisation development, competitive intelligence and risk. Her current research interests are on the impact of business internationalisation on performance; the internationalisation of higher education; and on strategies for higher education institutions and industry to collaborate to develop a global workforce. She has published in leading academic journals in international business.
Catherine Welch is an Associate Professor in the Discipline of International Business at the University of Sydney. She teaches in the Master of International Business offered by the University of Sydney Business School, including a course on export management which is delivered with input from the Export Council of Australia. Her research interests currently centre on internationalisation processes of the firm. Most recently she was a chief investigator for a project on the internationalisation of high-tech Australian start-ups which was funded by Merck & Co Inc. Catherine publishes regularly in the leading journals in her field. She is on the editorial board of a number of international journals and is an active member of academic associations in her field. She is currently Vice-President of the Australia and New Zealand International Business Academy, a board member of the European International Business Academy and a member of the Research Committee of the International Management Division of the Academy of Management.
148 | Export Council of Australia
Australia’s International Business Survey: 2015 Report
CONTRIBUTORS
ACKNOWLEDGEMENTS
AustradeMark Thirlwell, Chief EconomistChristina Goodman, Executive Officer to the CEODivya Skene, Economist, CEO Office
Export Council of Australia (ECA)Lisa McAuley, CEOStacey Mills-Smith, Trade Policy & Research Manager
EficCassandra Winzenried, Senior EconomistGeir Kristiansen, Senior Manager, Insights & Analytics
The University of SydneySid Gray, Professor of International Business, University of Sydney Business SchoolWei Li, Lecturer in International Business, University of Sydney Business SchoolSandra Seno-Alday, Lecturer in International Business, University of Sydney Business SchoolCatherine Welch, Associate Professor of International Business, University of Sydney Business School
The AIBS partners would like to thank all of the state and federal government agencies that supported the AIBS initiative in 2014-2015 as well as our industry partners.
The University of Sydney
Export Council of Australia | www.export.org.auExport House, Level 2, 22 Pitt Street, Sydney NSW 2000 | e: [email protected] | t: 02 8243 7400
Survey partners