Embed Size (px)
Citation preview
p 1
Authenticity Testing of Liquor Samples using LC-MS/MS and Statistical Data Processing André Schreiber1, Christopher Borton2; and Anna Marques3 1 AB SCIEX Concord, ON (Canada), 2 AB SCIEX Golden, CO (USA), 3 AB SCIEX Framingham, MA (USA)
Overview Various liquor samples (Brazilian cachaça, Cuban rum, Canadian whisky, French cognac, Mexican tequila, Russian vodka, Scotch whisky, etc) were analyzed after simple dilution using Liquid Chromatography Tandem Mass Spectrometry (LC-MS/MS). Spectra were acquired in Enhanced MS mode in negative and positive polarity Electrospray Ionization (ESI) with a 3200 QTRAP® system. Full scan data were processed using Principal Components Analysis (PCA) in MarkerView™ software to find markers for authenticity and adulteration of liquor. In addition, Enhanced Product Ion (EPI) spectra and high resolution accurate mass MS and MS/MS data was collected using a TripleTOF™ 5600 system to further characterize and identify the detected marker compounds. Marker compounds identified included different sugars, acids, and polyphenols.
Introduction Liquors are drinkable liquids containing ethanol that is produced by distilling fermented grain, fruit or vegetable. Popular liquors include brandy, cognac, gin, rum, schnapps, tequila, vodka, whiskey, whisky, etc. Liquors are popular recreational and life style enhancing beverages all over the world.
Authentic and regional liquors can be expensive. For that reason local producers are interested to protect their products from adulteration. Thus, there is a need for analytical methods to prove the authenticity and quality of liquors.1-2
In this work, an LC-MS/MS method was used to analyze various liquor samples (Brazilian cachaça, Cuban rum, Canadian whisky, French cognac, Mexican tequila, Russian vodka, Scotch whisky, etc) directly after simple dilution. Statistical data processing was performed to detect markers for authenticity and adulteration.
Experimental Samples and Sample Preparation
Dilution of liquor samples by a factor of 50 with LC-MS grade water before LC-MS/MS analysis.
All samples were injected in triplicates and in randomized order.
LC Separation
A Shimadzu UFLCXR system was used with a Restek Ultra II Aqueous C18 2.2 µm (50 x 2.1 mm) with a fast gradient of water and methanol containing 10 mM ammonium formate at a flow of 0.3 mL/min. The total run time was 10 min. The injection volume was set to 10 µL.
MS/MS Detection
Analysis was performed using an AB SCIEX 3200 QTRAP® LC/MS/MS system equipped with Turbo V™ source and an ESI probe. Samples were screened using EMS in positive and negative polarity over a mass range of 100 to 1000 Da. The Declustering Potential (DP) was set to ±40 V. In addition Information Dependent Acquisition (IDA) was used to automatically acquire EPI spectra molecular ions. Dynamic Background Subtraction™ (DBS) algorithm was activated to

p 2
allow EPI collection even in the case of co-elution. The Collision Energy (CE) was set to ±35 V with Collision Energy Spread (CES) of 15 V resulting in characteristic fragmentation patterns for compound identification. All scan functions were used at a speed of 4000 Da/sec with Dynamic Fill Time (DFT) being activated to avoid possible space charge of the linear ion trap.
Figure 1. Flowchart of the Information Dependent Acquisition (IDA) experiment used to detect marker ions in EMS (top) and identify them based on automatically acquired EPI (bottom) spectra
In addition, the AB SCIEX TripleTOF™ 5600 LC/MS/MS system was used to acquire high resolution accurate mass MS and MS/MS data to characterize and identify the detected marker compounds.
Statistical Data Processing
Principal Components Analysis (PCA) was performed on all EMS data using MarkerView™ software. PCA finds combinations of variables (LC-MS signals in this case) that explain most of the variance present in the data set. For each principal component (PC), every sample has a score and every variable has a loading that represents its contribution to the combination. It is common practice to plot the scores and loadings for the first two PCs.
Figure 2 illustrates PCA and the resulting PC of two simulated sample clusters.
Results and Discussion Representative chromatograms and EMS spectra of the entire chromatogram of two liquor samples, one Scotch whisky and one Brazilian cachaça are displayed in Figure 3.
Figure 3. Chromatograms (top) and EMS spectra of the entire chromatogram (bottom) of a Scotch whisky (Glenmorangie 10 years) and a Brazilian cachaça (Espírito de Minas)
Threshold and DBS
Base Peak Chrom. of -EMS: Exp 1... Max. 2.3e5 cps.
2 4 6 8 10 12 14Time, min
0.0
5.0e4
1.0e5
1.5e5
2.0e5
2.3e5In
tens
ity, c
ps
9.88.4
0.53.0 10.6
11.26.71.7 5.4
4.4 13.9
-EMS: Exp 1, 0 .175 to 14.686 min... Max. 2.6e4 cps.
200 400 600 800 1000m/z, Da
0.0
5000.0
1.0e4
1.5e4
2.0e4
2.5e4
Inte
nsity
, cps
112.9255.5
283.4
155.0
171.2 233.2
319.3227.4409.6377.5265.4
213.4345.6 585.5 691.7385.3
799.2 985.2
Base P eak Chrom. of -EMS: Exp 1 ... Max. 3 .1e5 cps.
2 4 6 8 10 12 14Time, min
0.0
5.0e4
1.0e5
1.5e5
2.0e5
2.5e5
3.0e5
Inte
nsity
, cps
0.1
10.5
0.4
1.72.6 8.9 11.2
9.86.53.4 13.47.44.9
-EMS: Exp 1 , 0.017 to 14.897 min ... Max. 1 .7e4 cps.
200 400 600 800 1000m/z, Da
0.0
2000.0
4000.0
6000.0
8000.0
1.0e4
1.2e4
1.4e4
1.6e41.7e4
Inte
nsity
, cps
112.9
283.4255.5
137.0
161.2 233.2331.7175.2
227.4199.3 353.5 744.7309.4
691.8453.1 867.1676.3
Scotch whisky Brazilian cachaça
Figure 2. Illustration of Principal Component Analysis (PCA) using two simulated sample clusters (red and blue), PCA “rotates” the three dimensional plot of variables of samples to determine the variables that maximize the variation between groups and those which minimize the variation within a group, a vector is calculated for each PC
x
y
x
y
z
x
y
z
(0, 0, 0)
PC1
PC1 Score
2D 3D Rotated 3D
PC1 = 0.1 x + 0.3 y + 0.95 z

p 3
The example indicates that each liquor has its own representative profile. However, differentiating between different liquors based on the comparison of LC-MS chromatographic profiles alone is not sufficient - further data mining is required at the spectral level as well. Processing such data manually is difficult and very time consuming; additionally, such a manual procedure is incomplete and very likely will not allow distinguishing between original and adulterated or not authentic products.5
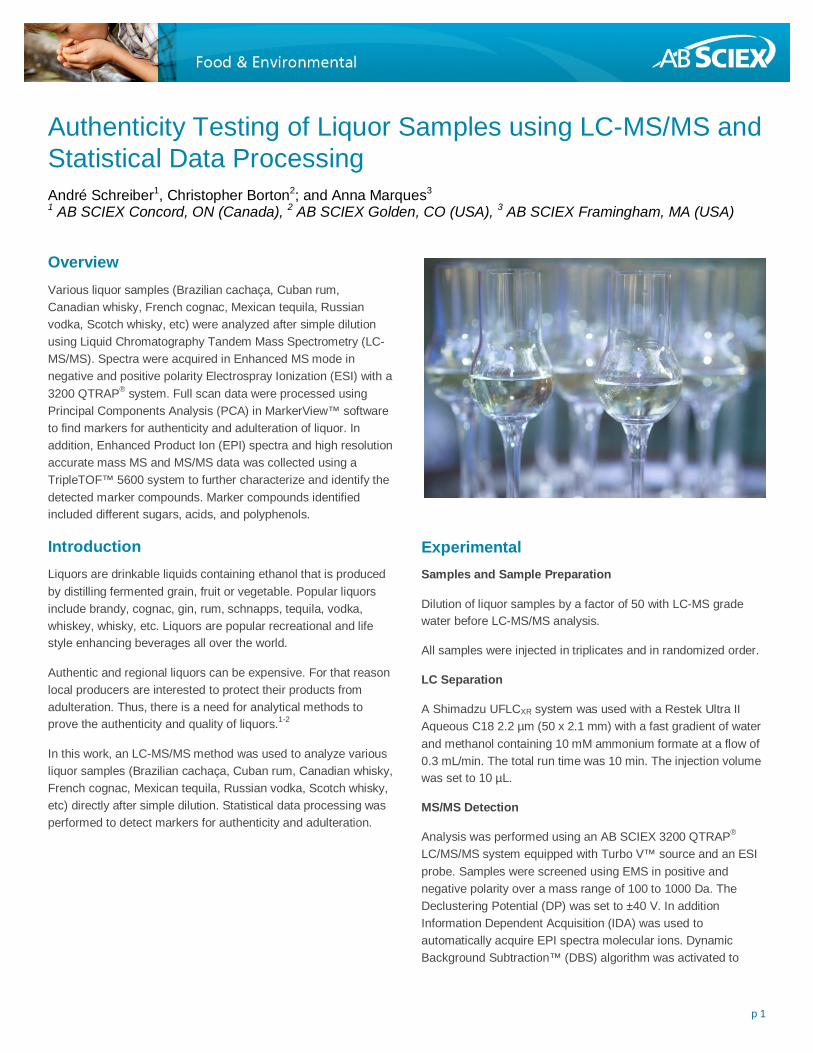
PCA was performed on all EMS data using MarkerView™ software. In the preliminary analysis, the various liquor samples were plotted together. From the scores plots in Figure 4a and 5a, the groupings between the different liquors are shown to be clearly demonstrated.
From this analysis, it was evident that the LC-MS method, developed with data processing based on PCA, was valuable for making distinctions between different liquors. It can be expected that the separation in Figure 4a is based on compounds ionizing in positive polarity, such as amino acid, polyphenols, glucosides, and sugars, while the separation in Figure 5a is based on compounds ionizing in negative polarity, such as acids, sugars etc.
The corresponding loading plots in Figure 4b and 5b show the variables that make the most difference in separating liquor samples. It can be used to identify the molecular ion and retention time of marker compounds.
Characteristic marker compounds of a group of samples are located in the same area of the loadings plot as the group is located in the scores plot.
For example, red wine samples are located in the lower right and French cognac samples are located in the upper left of the scores plot (Figure 4a). Thus, characteristic markers for red wine can be found in the lower right of the loadings plot (Figure 5a), such as malvidin-3-glucoside (oenin), a compound primarily responsible for the color of red wine. Characteristic markers for French cognac can be found in the upper left of loadings plot. These compounds were probably produced during distillation from wine or were extracted from wood during aging. In addition, there is a third group of markers which is located between the markers for red wine and cognac. These compounds are characteristic for both samples means they originate from grapes and were not altered during distillation and aging.
Figure 5a. Scores plot of PCA of different liquor samples analyzed using negative polarity LC-MS showing a clear grouping
-6 -5 -4 -3 -2 -1 0 1 2 3 4 5 6 7 8 9 10 11 12 13 14 15 16 17 18
D1 Score
-5
-4
-3
-2
-1
0
1
2
3
4
5
6
7
8
9
10
11
12
13
14
15
16
17
18
19
20
Wi - Cabernet M erlot (Canada)
Wi - Dogajolo di Toscana (Italy)
Wi - Cabernet M erlot (Canada)
Wi - Dogajolo di Toscana (Italy)
Wi - Dogajolo di Toscana (Italy)
Wi - Cabernet M erlot (Canada)
Li - ApricotLi - Cointreau
Li - CointreauLi - Apricot
Sc - Glenfiddich 12
Sc - Glenfiddich 15
Li - Apricot
Sc - Glenmorangie 10
Sc - M acallan 12Sc - Glenfiddich 18
CW - Canadian Club Reserv e
Li - Cointreau
CW - Crow n Royal
CW - Crow n Royal
CW - Canadian Club Reserv eSc - Ardbeg
Co - St. Remy VSOP
Sc - Highland Park 18
Co - St. Remy VSOPSc - M acallan 18
Ca - Nega Fulo
Ca - Pitu
Ru - Hav ana
Co - St. Remy VSOPSc - M acallan 18
Co - Remy M artin VSOP
Co - Hennessy XOCa - Pitu
Scores for D1 (14.2 %) v ersus D2 (14.2 %), Log | Pareto (DA)
Apricot
Cachaca
Canadian w hiskeyCognac
Cointreau
French brandy
RumScotch Whisky
Tequila
VodkaWine
Red wine
vodkatequila
Fruity and sweet liquor
French cognac and brandy
Cuban rum
Scotch whisky
Brazilian cachaça
Canadian whisky
Figure 4a. Scores plot of PCA of different liquor samples analyzed using positive polarity LC-MS showing a clear grouping
Figure 4b. Loadings plot of PCA of different liquor samples analyzed using positive polarity LC-MS showing identified marker ions
Red wine
Fruity and sweet liquor
French brandy
Scotch whisky
Brazilian cachaça, Cuban rum, Tequila, Vodka
Canadian whisky
French cognac
343, 360: sucrose
181, 198: glucose / fructose 116: proline
493: malvidin-3-glucoside(oenin)
229: resveratrol
Markers for French cognac
Markers for red wine
Markers for French cognac and red wine

p 4
Figure 5b. Loadings plot of PCA of different liquor samples analyzed using negative polarity LC-MS showing identified marker ions
Analysis in negative polarity resulted in grouping of distilled liquors. For further differentiation the wine and sweet liquor samples were excluded from processing. The resulting scores and loadings plot are presented in Figure 6a and 6b.
Three characteristic groups (1: whisky, 2: cognac, brandy, and rum, 3: clear distilled liquors) were observed in the Scores plot (Figure 6a).
The corresponding loadings plot (Figure 6b) was used to identify capric acid and lauric acid as characteristic markers for Scotch whisky. Both compounds were also detected in Canadian whisky and French cognac and brandy but at lower concentration. Capric acid and lauric acid are known markers for alembic distillation using copper pot stills.3
Sucrose was identified as the characteristic marker for French cognac, brandy, and Cuban rum.4 Although both Brazilian cachaça and Cuban rum are produced from sugar cane, only Cuban rum contains sucrose. This can be explained by the difference in production. While cachaça is made from fresh cane sugar juice that is fermented and distilled, rum is usually made from molasses, a by-product from refineries that boil the cane juice to extract as much sugar crystals as possible.
The unidentified ion of 367 Da was found to be characteristic for French cognac and brandy. This compound was not present in Cuban rum. In addition 645 Da was a unique marker for vodka and 162 Da and 241 Da were unique for tequila, respectively.
Figure 6b. Loadings plot of PCA of different distilled liquor samples analyzed using negative polarity LC-MS showing identified marker ions
After initial PCA selected liquor samples were injected into the AB SCIEX TripleTOF™ 5600 system to acquire high resolution and accurate mass MS and MS/MS spectra for compound identification.
The Formula Finder tool of PeakView™ software was used to empirically calculate molecular formulae and to characterize marker ions by comparing MS/MS fragments with a suspected molecular structure (Figure 7a and 7b).
341: sucrose
179: glucose / fructose
171: capric acid
199: lauric acid
169: gallic acid 197: ethyl gallate
149: tartaric acid
114: proline
191: C12H16O2 (C5H10 benzoate)
167: vanillic acid 195: ethyl vanillate
341: sucrose
171: capric acid
199: lauric acid
162241
645
367
Figure 6a. Scores plot of PCA of different distilled liquor samples analyzed using negative polarity LC-MS showing a clear grouping
vodka
tequila
French cognac and brandy
Cuban rum
Scotch whisky
Brazilian cachaça
Canadian whisky

For Research Use Only. Not for use in diagnostic procedures.
© 2011 AB SCIEX. The trademarks mentioned herein are the property of AB Sciex Pte. Ltd. or their respective owners. AB SCIEX™ is being used under license.
Publication number: 2170411-01 Headquarters International Sales 353 Hatch Drive Foster City CA 353 Hatch Drive Foster City CA 94404 USA For our office locations please call the division Phone 650-638-5800 headquarters or refer to our website at www.absciex.com www.absciex.com/offices
Figure 7a. TOF-MS analysis of Cuban rum in negative polarity, a molecular formula of C6H12O6 was calculated based on the accurate molecular ion (-0.6 ppm error) and the isotopic pattern
Figure 7b. TOF-MS/MS analysis of French cognac in negative polarity, accurate mass MS/MS signals were automatically compared to a predicted structure and 11 of 13 fragment ions were explained allowing a maximum cleavage of 2 bonds confirming the identification of sucrose
Acknowledgements The authors would like to thank Debora R. Santos, Takeo Sakuma, and Brent Lefebvre for providing liquor samples for analysis.
Summary Various liquor samples (Brazilian cachaça, Cuban rum, Canadian whisky, French cognac, Mexican tequila, Russian vodka, Scotch whisky, etc) were analyzed using LC-MS/MS in positive and negative polarity.
EMS data acquired on an AB SCIEX 3200 QTRAP® LC/MS/MS system was processed using Principal Components Analysis (PCA) to differentiate between different liquors and to identify characteristic marker compounds. These ions were further investigated by high resolution and accurate mass MS and MS/MS using an AB SCIEX TripleTOF™ 5600 LC/MS/MS system. Empirical formula calculation and software assisted interpretation of MS/MS fragments allowed to identify different acids, sugars, and polyphenols.
Further data acquisition and processing is planned to identify marker compounds for other sample types, geography and differences in production processes.
References 1 J. K. S. Møller et al.: ‘Electrospray ionization mass
spectrometry fingerprinting of whisky: immediate proof of origin and authenticity’ The Analyst 130 (2005) 890-897
2 P. P. de Souza et al.: ‘Electrospray Ionization nMass Spectrometry Fingerprinting of Brazilian Artisan Cachaça Aged in Different Wood Casks’ J. Agric. Food Chem. 55 (2007) 2094-2102
3 P. P. de Souza et al.: ‘Brazilian cachaça: “Single shot” typification of fresh alembic and industrial samples via Electrospray ionization mass spectrometry fingerprinting’ Food Chemistry 115 (2009) 1064-1068
4 P. P. de Souza et al.: ‘Differentiation of rum and Brazilian artisan cachaça via Electrospray ionization mass spectrometry fingerprinting’ J. Mass Spectrom. 42 (2007) 1294-1299
5 Chr. Borton et al.: ‘Authenticity Testing of Liquor Samples using Liquid Chromatography tandem Mass Spectrometry (LC-MS/MS) and Statistical Data Processing’ presentation at AOAC conference (2010) Orlando, FL
TOF-MS
TOF-MS/MS


![EPISODE — GRETCHEN RUBIN - lauracoe.com · AOA Transcript EPISODE — GRETCHEN RUBIN [INTRODUCTION] [0:00:18.0] LC: Welcome to this week’s episode of the Art of Authenticity,](https://img.pdfslide.net/doc/110x75/5b5e2e9d7f8b9a310a8bee04/episode-gretchen-rubin-aoa-transcript-episode-gretchen-rubin-introduction.jpg)