Embed Size (px)
Citation preview
Author: J R Reid
Extended Investigation
IntroductionPlanning an InvestigationWriting a ReportData CollectionData ProcessingConclusions and Discussions
Introduction
As part of the Level 3 assessments we will be planning independent investigations that will analyse varying amounts or concentrations of a substance.Previous years investigations have included:
Iodine levels in iodised saltVitamin C content in various brands of orange juice Dissolved oxygen levels in a fish pond throughout a dayCalcium levels in various brands of milk
Each investigation includes a chemical and conditions in which the levels of the chemical can vary.All data, notes and research collected along the way must be written down in a logbook which will be handed in with the final report. You must acknowledge other peoples work when you use it in your report i.e. the titration method, the importance of your chemical…etc. Then you must include the source in your reference list.
Planning an Investigation
Before starting the investigation we need to ensure that it is possible to get good grades from the final report that we will be writing:
Is it possible to find a method that can be done in a school lab?Is it going to generate accurate results?Is there a point to the investigation?Do you have conditions under which the levels of your chosen substance will vary? These could be brands or environmental conditionsCan it be completed in a short time scale (i.e. two weeks)?
A range of suitable investigations will be given but you have the ability to suggest your own.
Writing the Report – Introduction and Purpose
The final report is similar to investigations from previous years. It must include:
Introduction – This section includes background information that helps explain the purpose of your investigation. It should include information like why your chemical is important, why do the levels vary and what is the importance of this variationPurpose – your report must have a point. This is the thing that directs your entire investigation. The method, results and conclusions will be directly linked to this. Your purpose could be expressed as an aim or a testable question.
Writing the Report - Method
The next section is the method. It must clearly outline every step taken during your investigation. Importantly, it must be your method and not a copy of someone else’s procedure. It should include:
Chemical hazard warningsThe range of samples you will take to get an accurate trendHow you collected your samplesHow you prepared your samplesHow you prepared standard solutions and reagentsHow you analysed your samples, i.e. the titration methodThe number of repeated samples analysedA example of all calculations performed, including how you worked out the mean of repeated samples
Data Collecting – Results I
The results of your investigation consist of a lot of numbers. It is vital that these are recorded accurately and in a clear systematic format. Here are some guidelines:
As you record data they go straight into tables in your logbook. Each table must be clearly labelled.When you transfer the data into your report everything must be able to be understood independently from your report i.e. include titles, labels and unitsContinue to do repeated tests of the same sample until you get precise data (numbers that are close to each other)
Data Analysis – Results II
Once we have collected the raw data we need to process the data to show a trend. Remember to relate this to your purpose. You will need to:
Work out the means of repeated tests – remember to discard results that deviate from the bulk of the dataConvert your data into graph form. Remember – is your data continuous or discrete? Therefore, what sort of graph is appropriate? All tables and graphs in your final report must be able to be understood independently from your report i.e. include titles/headings, units, labels etc…Can a conclusion be clearly drawn from your processed data?Have you used significant figures correctly during calculations?
Conclusion and Discussion
The conclusion is a simple analysis of your results and how it fits into the purpose of your investigationThe discussion is a more complex affair. It should cover:
Limitations of your investigationPossible sources of errorModifications made during the investigation – with reasonsImprovements that could be made to your investigationFurther paths of investigation prompted by your findingsScientific relevance of your findings
References
References – Every external source of information must be noted because if you claim their work for your own it is called plagiarism and you get a big zero for your assessment. The reference section is where you can acknowledge their help and state where you got the information from.
Examples:Web - Merriam Webster Online
http://merriam-webster.com/ Text - Rozakis, L. 1999
Schaum's Quick Guide to Writing Great Research Papers
New York, NY: McGraw-Hill.
Appendix – Significant Figures
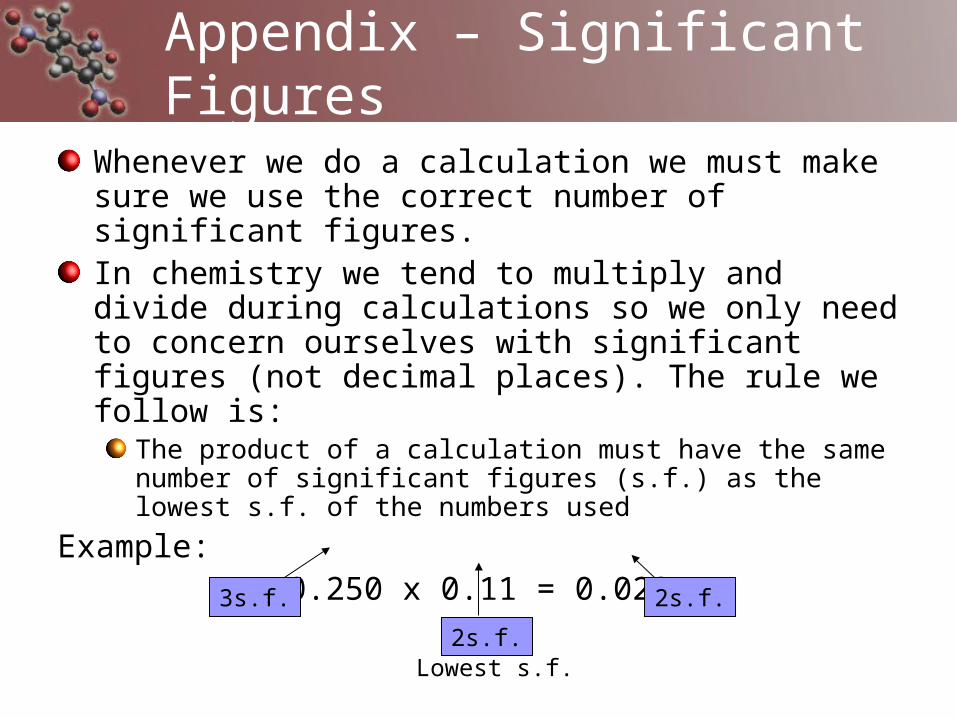
Whenever we do a calculation we must make sure we use the correct number of significant figures.In chemistry we tend to multiply and divide during calculations so we only need to concern ourselves with significant figures (not decimal places). The rule we follow is:
The product of a calculation must have the same number of significant figures (s.f.) as the lowest s.f. of the numbers used
Example:0.250 x 0.11 = 0.028
3s.f.
2s.f.
2s.f.
Lowest s.f.


![Closed Captioning in Games ● Reid Kimball ● Games[CC] ● reid@rbkdesign.com reid@rbkdesign.com ●](https://img.pdfslide.net/doc/110x75/56649e565503460f94b4e219/closed-captioning-in-games-reid-kimball-gamescc-reidrbkdesigncom.jpg)