Embed Size (px)
Citation preview
Autodesk®
Autodesk Moldflow Insight 2017 R2
Fiber orientation Accuracy Validation Report
A new Moldflow rotational diffusion (MRD) model is developed and implemented. The closure approximation of the fourth order orientation tensor is changed from Hybrid to Orthotropic and used along with the MRD model. This document shows the results of the validation test for AMI 2017 R2 release. Results from majority of test cases with the improved model halved the discrepancies between the experimental and predicted data compared to that of previous release, which uses Folgar-Tucker model as default. In other words, the new release gives a much better overall orientation prediction compared to the older release. Therefore, the MRD model with Orthotropic closure is set as the new default for the 3D analysis in this release. This is in line with the dual domain and midplane analyses that already use orthotropic closure.
FIBER ORIENTATION (3D) SOLVER VALIDATION
2
Contents
Introduction ................................................................................................................. 3
Fiber Orientation Solver Enhancement ....................................................................... 4
Moldflow Rotational Diffusion (MRD) Model. ............................................................. 4
Implementation of Orthotropic closure ...................................................................... 6
Fiber Orientation Validation ........................................................................................ 7
BASF Plate .............................................................................................................. 7
Delphi Plaque and Disks .........................................................................................16
Bradford Disk ..........................................................................................................43
DSM Plaque ...........................................................................................................49
Mechanical Plaque .................................................................................................55
Comparison of predictions by different models .........................................................57
Conclusions ...............................................................................................................58
Acknowledgements ....................................................................................................58
References .................................................................................................................59
FIBER ORIENTATION (3D) SOLVER VALIDATION
3
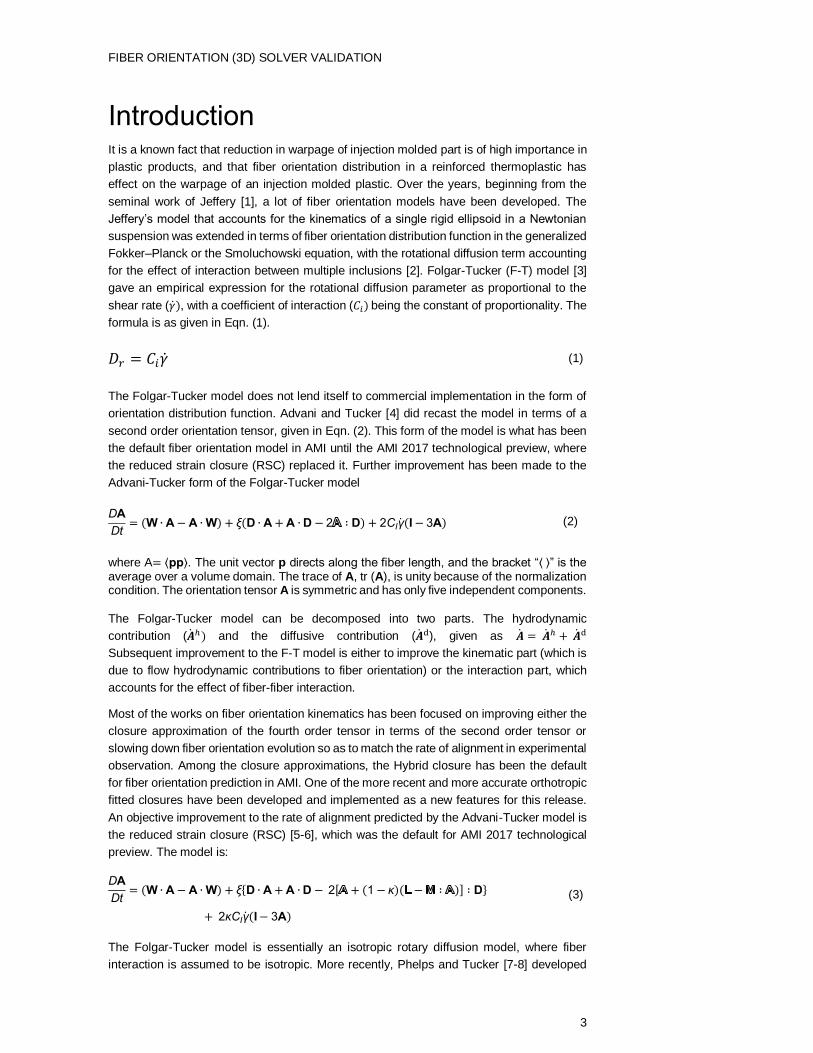
Introduction It is a known fact that reduction in warpage of injection molded part is of high importance in
plastic products, and that fiber orientation distribution in a reinforced thermoplastic has
effect on the warpage of an injection molded plastic. Over the years, beginning from the
seminal work of Jeffery [1], a lot of fiber orientation models have been developed. The
Jeffery’s model that accounts for the kinematics of a single rigid ellipsoid in a Newtonian
suspension was extended in terms of fiber orientation distribution function in the generalized
Fokker–Planck or the Smoluchowski equation, with the rotational diffusion term accounting
for the effect of interaction between multiple inclusions [2]. Folgar-Tucker (F-T) model [3]
gave an empirical expression for the rotational diffusion parameter as proportional to the
shear rate (�̇�), with a coefficient of interaction (𝐶𝑖) being the constant of proportionality. The
formula is as given in Eqn. (1).
𝐷𝑟 = 𝐶𝑖�̇� (1)
The Folgar-Tucker model does not lend itself to commercial implementation in the form of
orientation distribution function. Advani and Tucker [4] did recast the model in terms of a
second order orientation tensor, given in Eqn. (2). This form of the model is what has been
the default fiber orientation model in AMI until the AMI 2017 technological preview, where
the reduced strain closure (RSC) replaced it. Further improvement has been made to the
Advani-Tucker form of the Folgar-Tucker model
DA
Dt= (W ∙ A − A ∙ W) + ξ(D ∙ A + A ∙ D − 2 ∶ D) + 2CIγ̇(I − 3A) (2)
where A= ⟨pp⟩. The unit vector p directs along the fiber length, and the bracket “⟨ ⟩” is the average over a volume domain. The trace of A, tr (A), is unity because of the normalization condition. The orientation tensor A is symmetric and has only five independent components.
The Folgar-Tucker model can be decomposed into two parts. The hydrodynamic
contribution (�̇�ℎ) and the diffusive contribution (�̇�d), given as �̇� = �̇�ℎ + �̇�d
Subsequent improvement to the F-T model is either to improve the kinematic part (which is
due to flow hydrodynamic contributions to fiber orientation) or the interaction part, which
accounts for the effect of fiber-fiber interaction.
Most of the works on fiber orientation kinematics has been focused on improving either the
closure approximation of the fourth order tensor in terms of the second order tensor or
slowing down fiber orientation evolution so as to match the rate of alignment in experimental
observation. Among the closure approximations, the Hybrid closure has been the default
for fiber orientation prediction in AMI. One of the more recent and more accurate orthotropic
fitted closures have been developed and implemented as a new features for this release.
An objective improvement to the rate of alignment predicted by the Advani-Tucker model is
the reduced strain closure (RSC) [5-6], which was the default for AMI 2017 technological
preview. The model is:
DA
Dt= (W ∙ A − A ∙ W) + ξ{D ∙ A + A ∙ D − 2[ + (1 − κ)( − ∶ )] ∶ D}
+ 2κCIγ̇(I − 3A)
(3)
The Folgar-Tucker model is essentially an isotropic rotary diffusion model, where fiber
interaction is assumed to be isotropic. More recently, Phelps and Tucker [7-8] developed
FIBER ORIENTATION (3D) SOLVER VALIDATION
4
an anisotropic rotary diffusion model. The anisotropic rotary diffusion model accounts for
anisotropy in fiber-fiber interaction, but it is limited because of the number of coefficients
that must be fitted to get improved predictions. The reduced strain form of this model is
available in AMI but currently used for long fiber model, and it is:
DA
Dt= (W ∙ A − A ∙ W) + ξ{D ∙ A + A ∙ D − 2[ + (1 − κ)( − ∶ )] ∶ D}
+ γ̇{2[C − (1 − κ) ∶ C] − 2κ(trC)A − 5(C ∙ A + A ∙ C)
+ 10[ + (1 − κ)( − ∶ )] ∶ C}
(4)
Here, the rotary diffusion tensor C is constructed from A and D as:
C = b1I + b2A + b3A2 + b4
D
γ̇+ b5
D2
γ̇2
, (5)
where bi (i = 1, …, 5) are scalar constants and selected by matching experimental steady-
state orientation and requiring stable orientation solutions. Setting b1 = CI and bi = 0 (i = 2,
…, 5) reduces the ARD-RSC model of Eqn. (4) to the RSC model of Eqn. (3).
Fiber Orientation Solver Enhancement The development and implementation of the MRD model and the implementation and use
of the Orthotropic closure are the two main improvements for this release. There are other
additional bug fixes and internal fiber solver enhancements-such as further enhanced to
the RSC model. The default RSC parameter is changed from 0.05 to 0.1.
Moldflow Rotational Diffusion (MRD) Model.
This model is the latest contribution to the AMI fiber orientation models in 3D. It was a
modified version of the Folgar-Tucker model in the Advani-Tucker orientation tensor form.
Essentially, the model modified the diffusive contribution to the model and keeps the
kinematic part (the hydrodynamic contribution) intact. The MRD model is characterized by
four parameters Ci D1, D2 and D3. Fiber interaction coefficient Ci corresponds to the
magnitude of the rotational diffusion while coefficients of asymmetry D1, D2 and D3 show
how the rotational diffusion is biased towards the direction of the principal vectors of fiber
orientation tensor. The higher the value of the correspondent D coefficient, the more
rotational diffusion is biased towards the direction of the correspondent principal vector.
The default values for D𝑖 coefficients are D1=1.0, D2=0.8, D3=0.15, and they are used
when automatic calculations is selected under “Di Options for Moldflow 3D”.
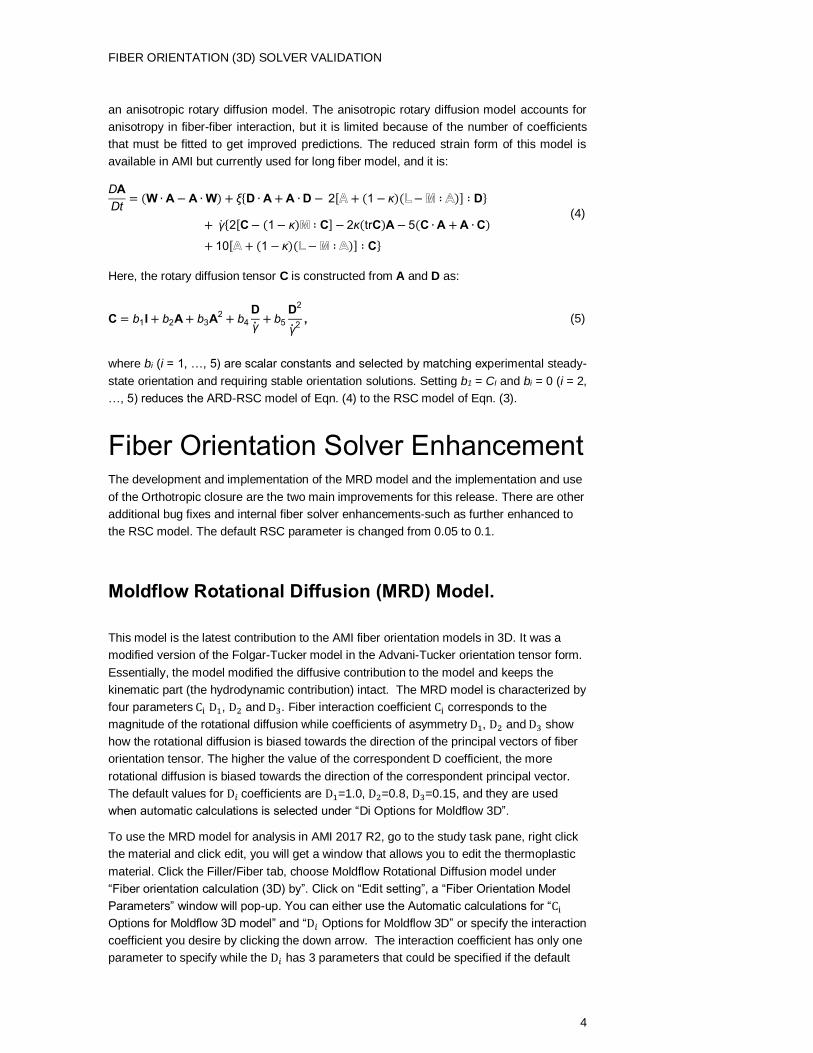
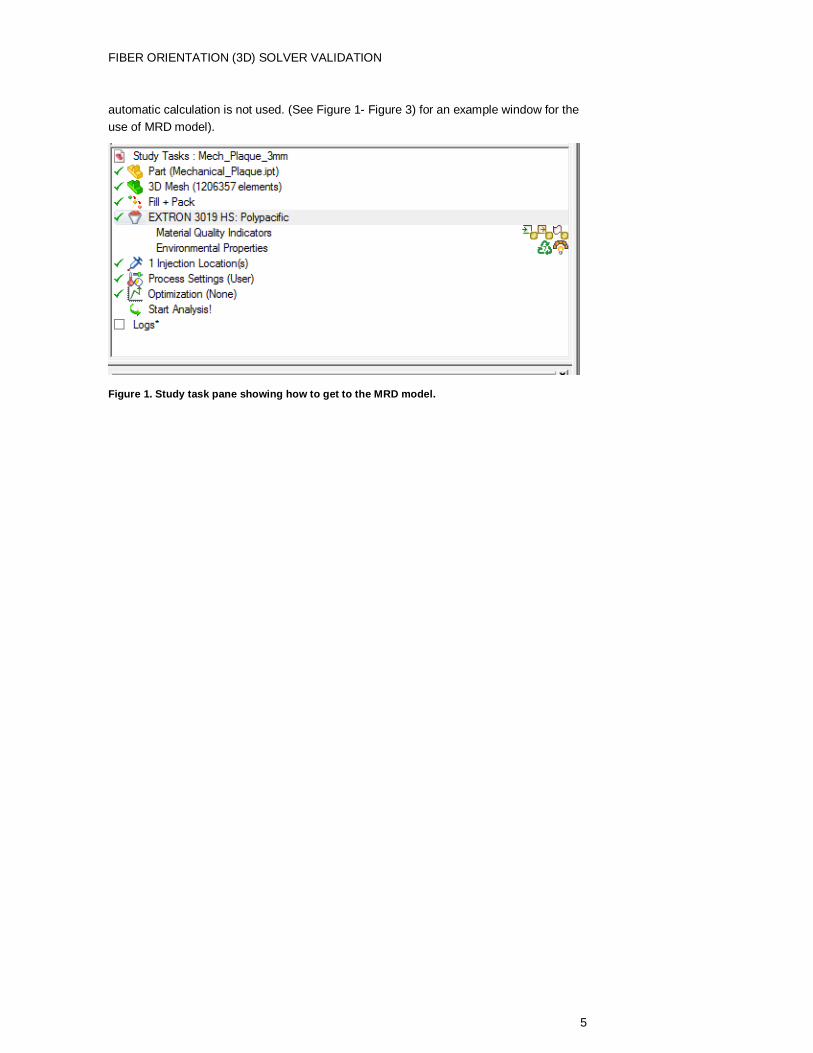
To use the MRD model for analysis in AMI 2017 R2, go to the study task pane, right click
the material and click edit, you will get a window that allows you to edit the thermoplastic
material. Click the Filler/Fiber tab, choose Moldflow Rotational Diffusion model under
“Fiber orientation calculation (3D) by”. Click on “Edit setting”, a “Fiber Orientation Model
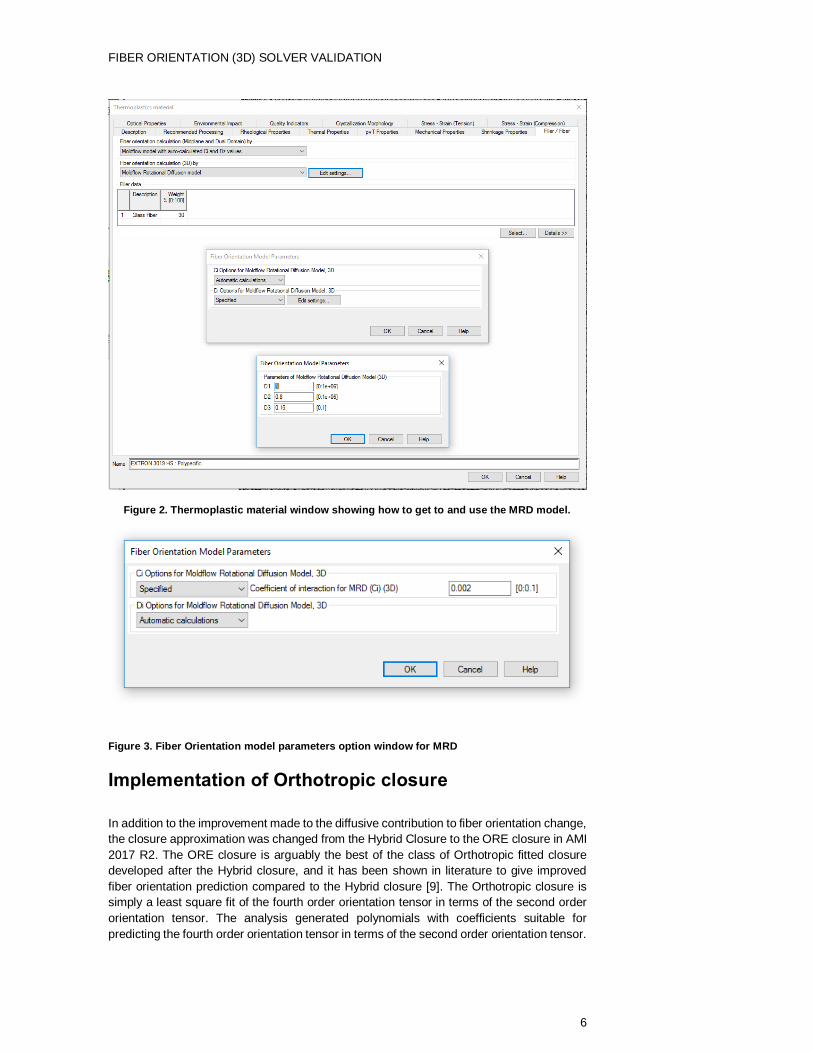
Parameters” window will pop-up. You can either use the Automatic calculations for “Ci
Options for Moldflow 3D model” and “D𝑖 Options for Moldflow 3D” or specify the interaction
coefficient you desire by clicking the down arrow. The interaction coefficient has only one
parameter to specify while the D𝑖 has 3 parameters that could be specified if the default
FIBER ORIENTATION (3D) SOLVER VALIDATION
5
automatic calculation is not used. (See Figure 1- Figure 3) for an example window for the
use of MRD model).
Figure 1. Study task pane showing how to get to the MRD model.
FIBER ORIENTATION (3D) SOLVER VALIDATION
6
Figure 2. Thermoplastic material window showing how to get to and use the MRD model.
Figure 3. Fiber Orientation model parameters option window for MRD
Implementation of Orthotropic closure
In addition to the improvement made to the diffusive contribution to fiber orientation change,
the closure approximation was changed from the Hybrid Closure to the ORE closure in AMI
2017 R2. The ORE closure is arguably the best of the class of Orthotropic fitted closure
developed after the Hybrid closure, and it has been shown in literature to give improved
fiber orientation prediction compared to the Hybrid closure [9]. The Orthotropic closure is
simply a least square fit of the fourth order orientation tensor in terms of the second order
orientation tensor. The analysis generated polynomials with coefficients suitable for
predicting the fourth order orientation tensor in terms of the second order orientation tensor.
FIBER ORIENTATION (3D) SOLVER VALIDATION
7
The implementation of the ORE closure in AMI 2017 R2 necessitate a new empirical model
for determination of the interaction coefficient. Also, the default value of the RSC factor was
changed in order for the Orthotropic closure to give the same shell orientation as that of
Hybrid closure.
There is nothing to be done in the user interface to be able to use the Orthotropic closure.
It is the only closure approximation used in the AMI2017 R2 release. To see the
improvement between the Orthotropic closure and the Hybrid closure result, user will have
to run the same study file in AMI 2017 FCS and either the default in AMI 2017 Technological
preview or chose RSC model in this release (AMI 2017 R2).
Fiber Orientation Validation The fiber orientation was calculated using the MRD model within the 3D Flow solver, for a
number of injection-molded parts. The results from AMI 2017FCS and 2017R2 are
compared against the experimental measurements. In general, the result showed that for
most test cases, the MRD model showed significant improvement over the F-T model, which
has been the default model until this release. In several cases, the MRD halved the
discrepancy between the model prediction and experiment as compared to the F-T model
prediction.
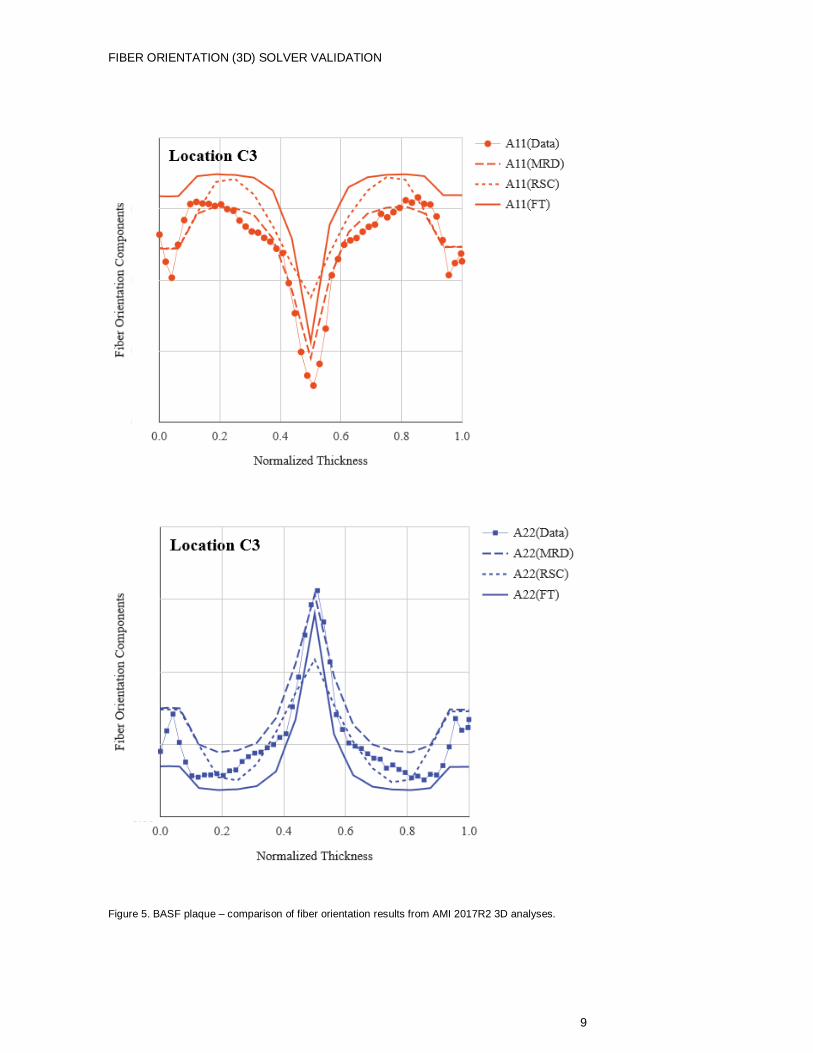
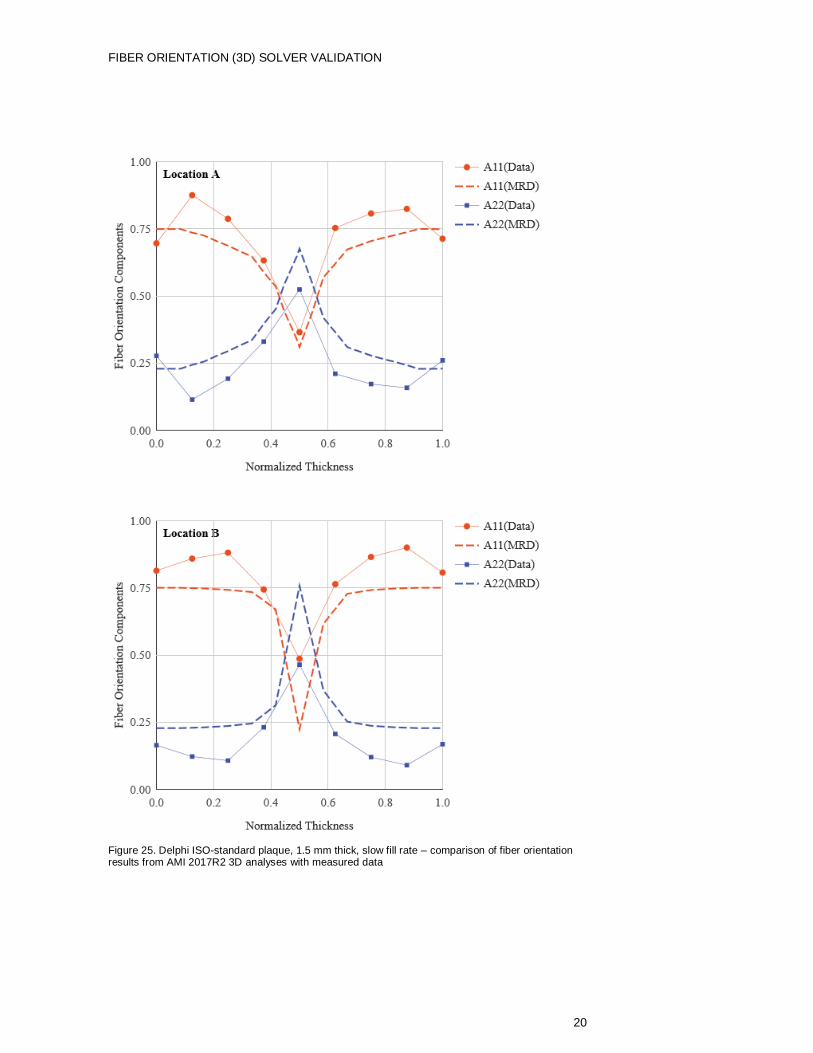
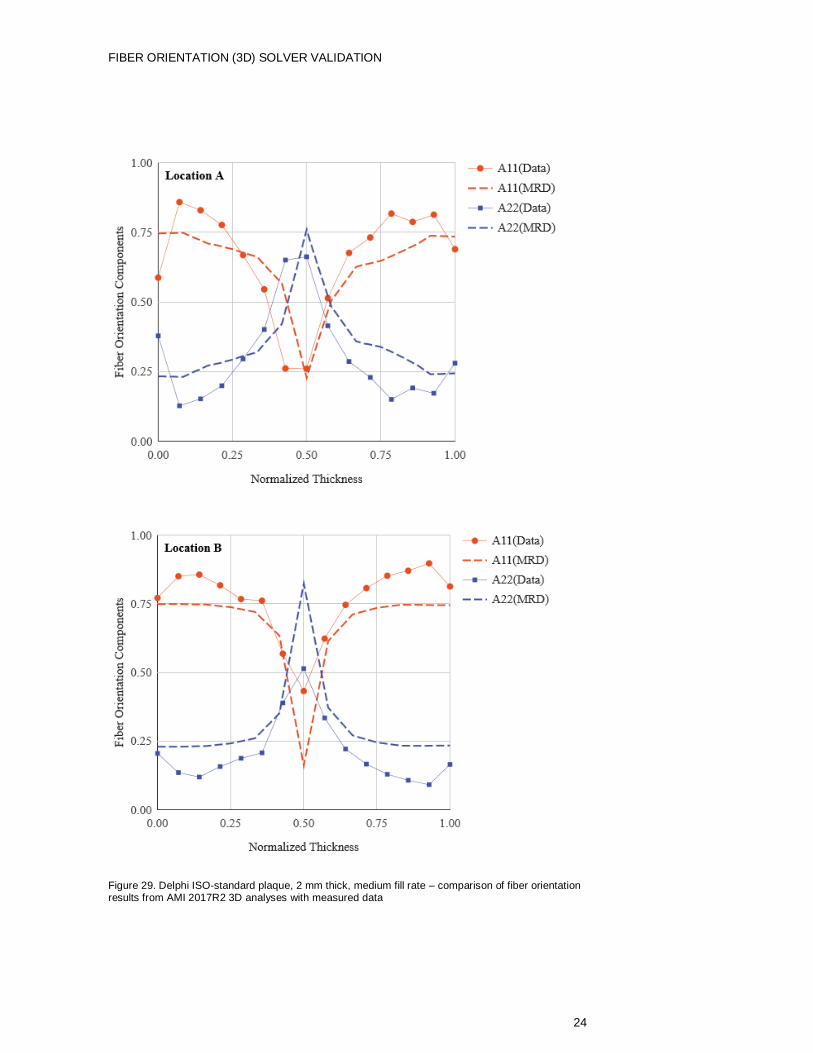
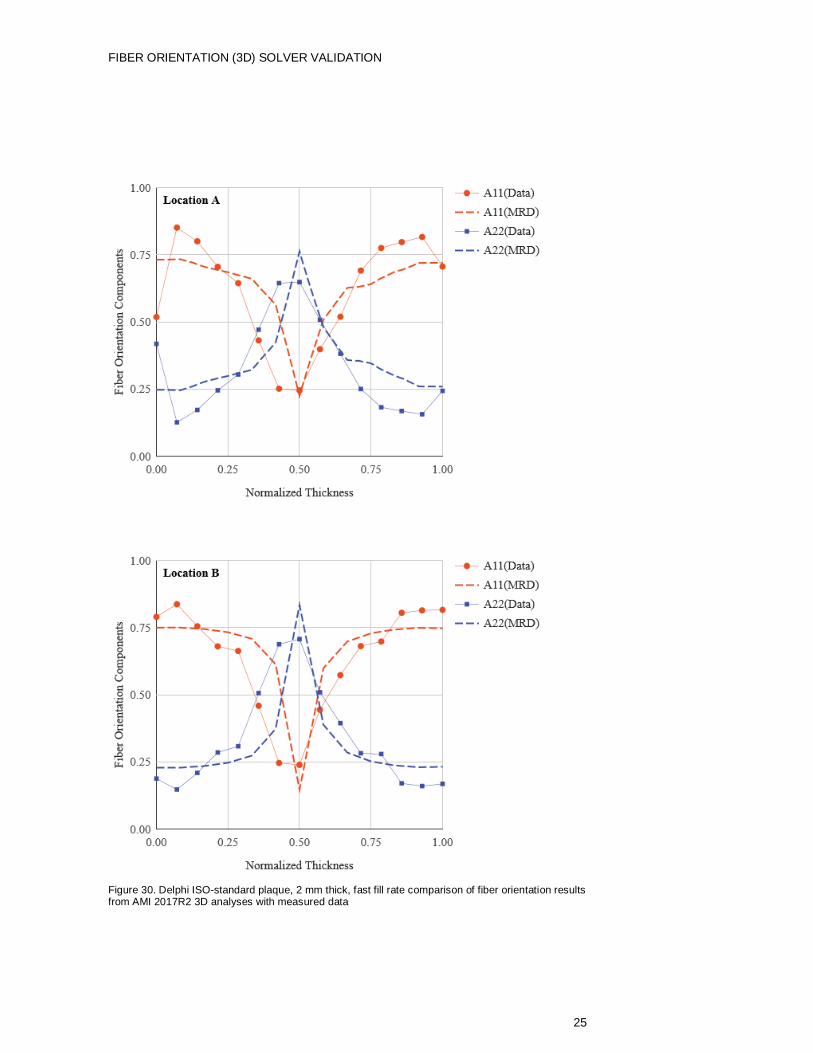
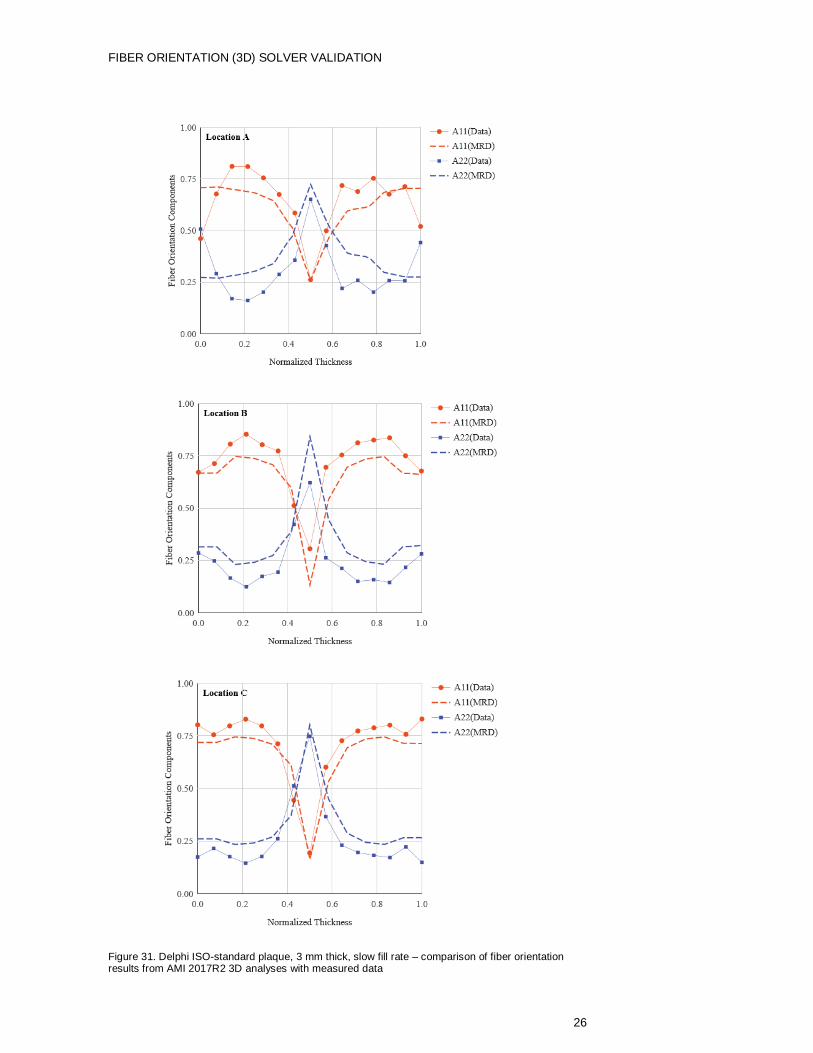
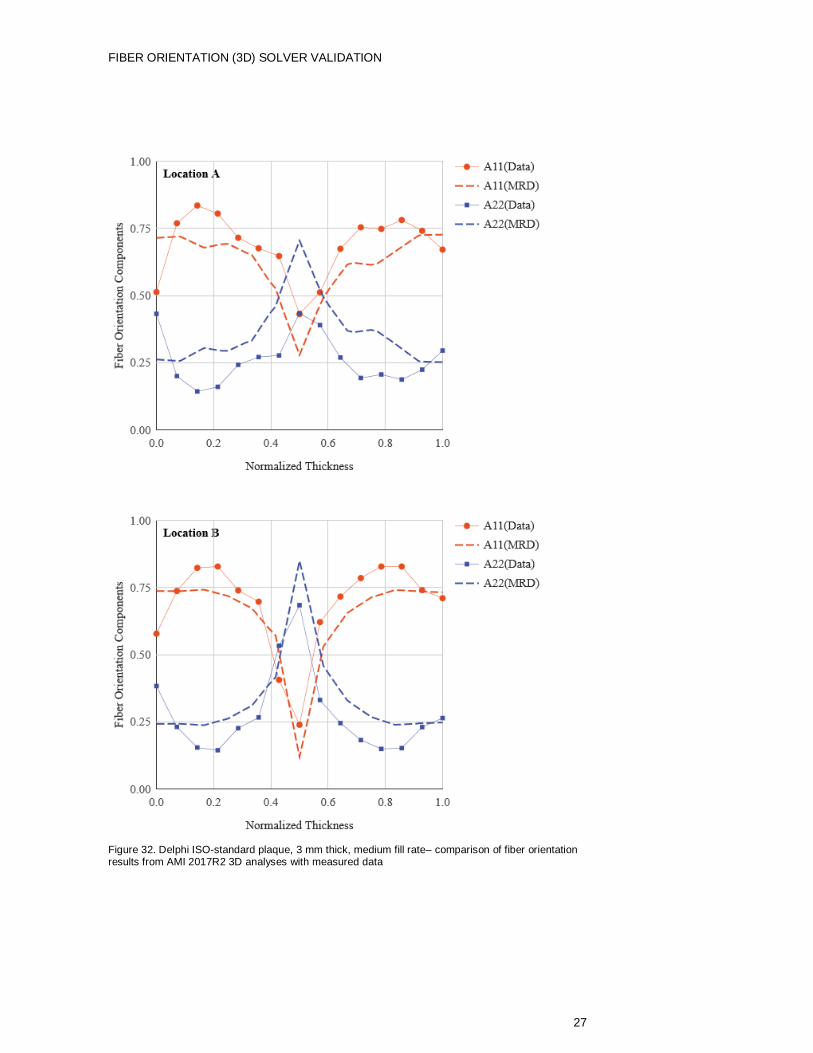
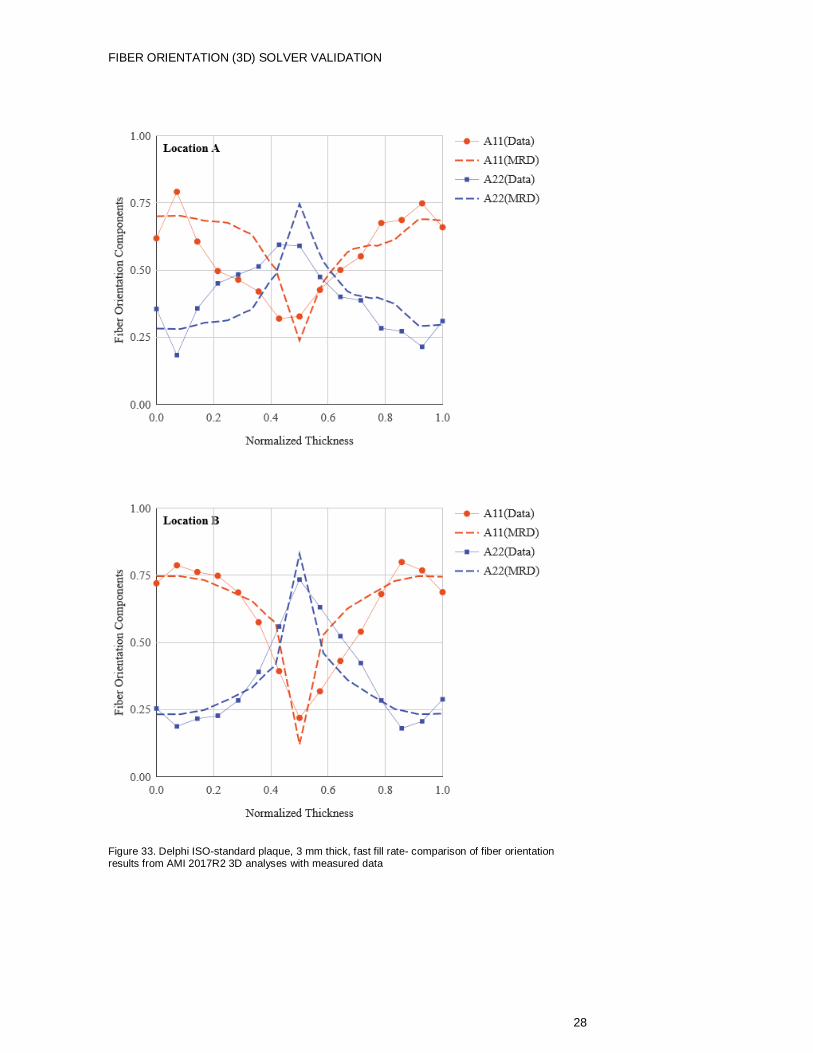
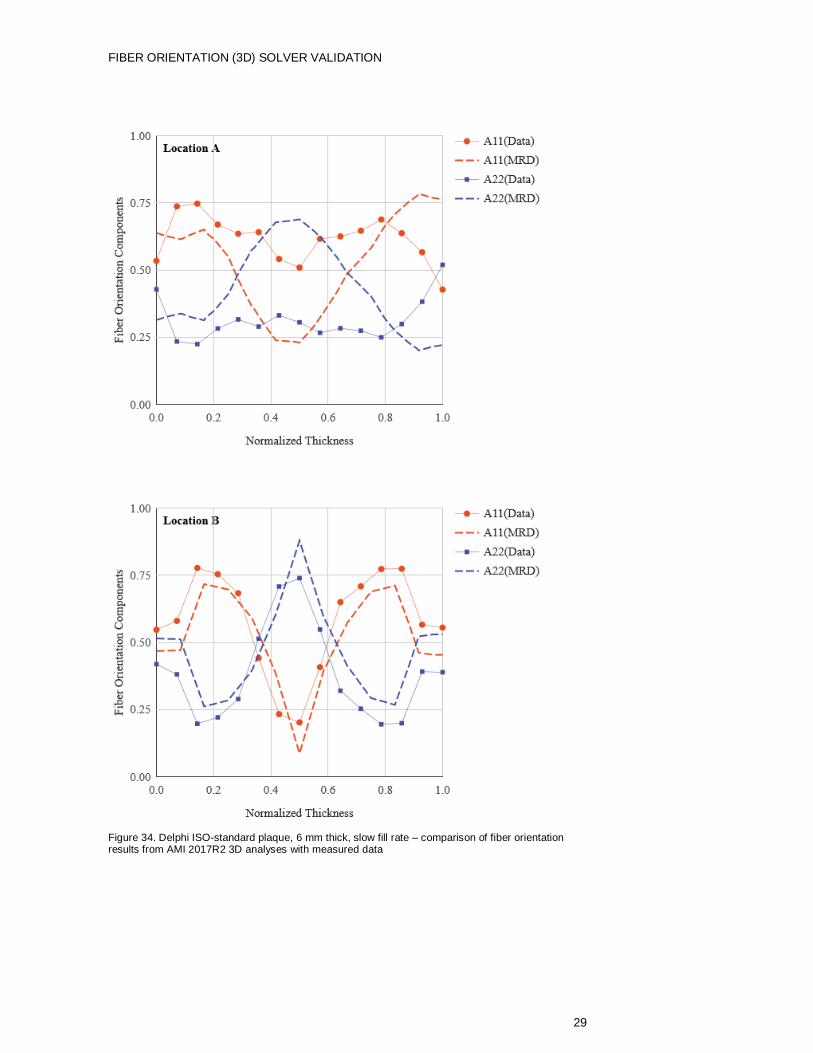
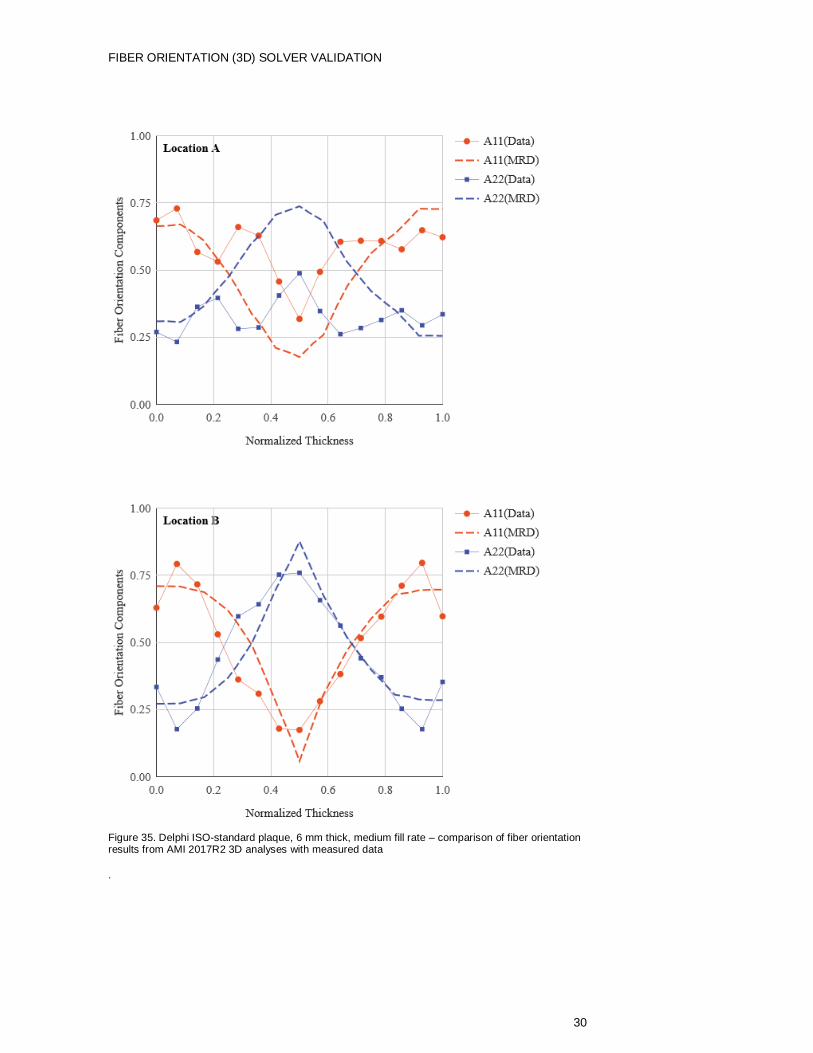
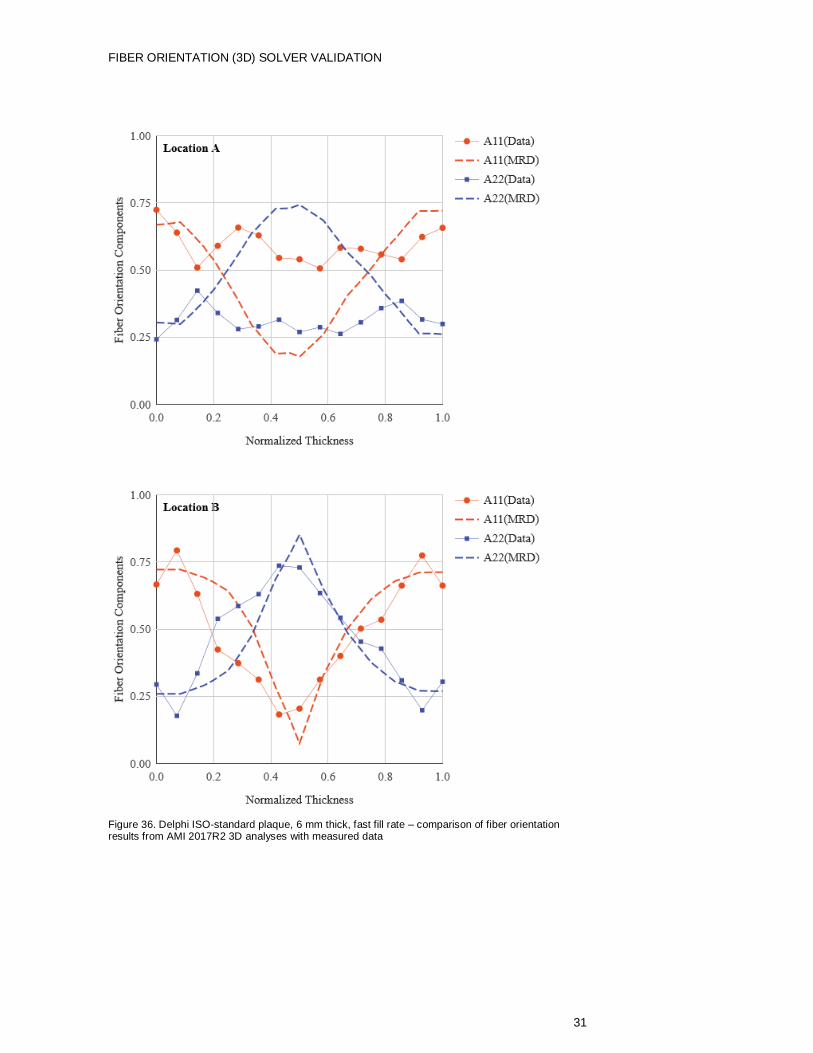
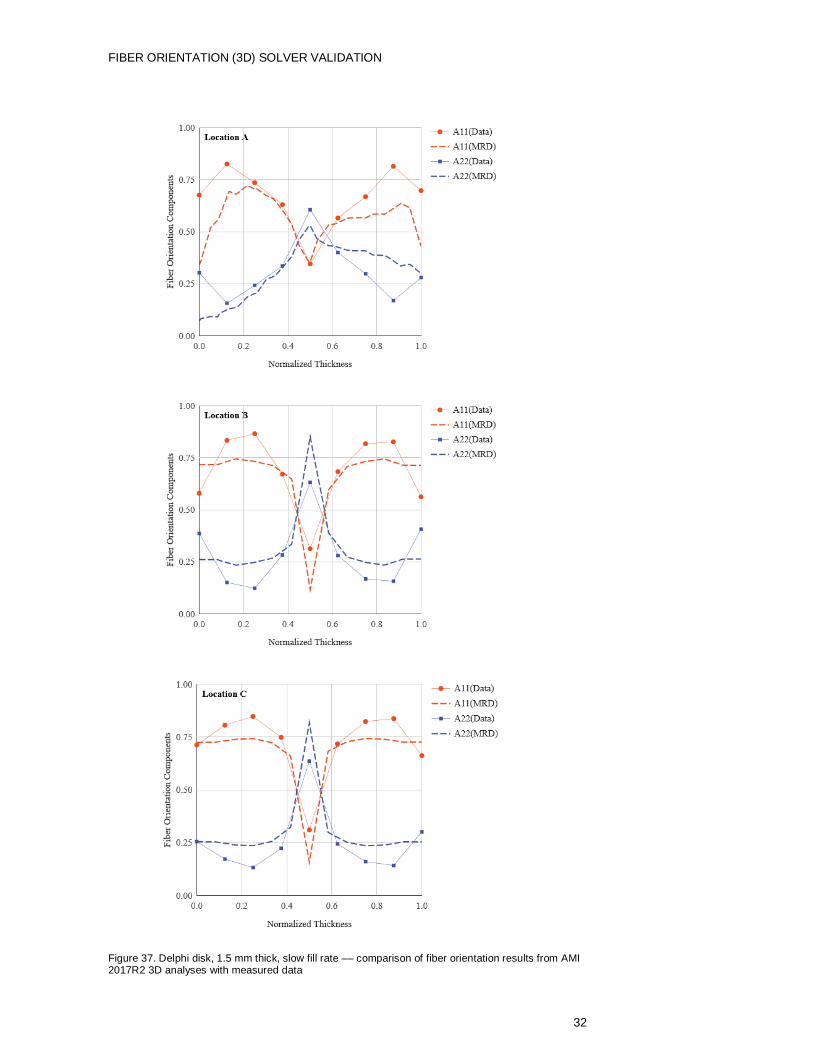
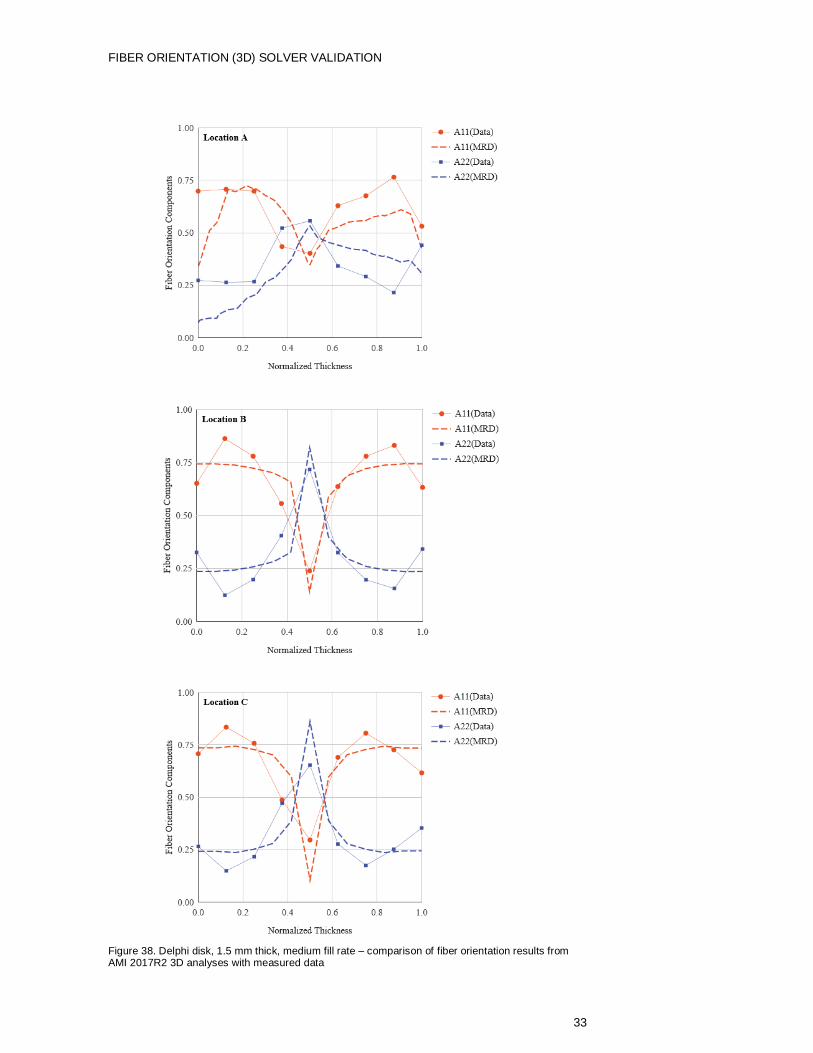
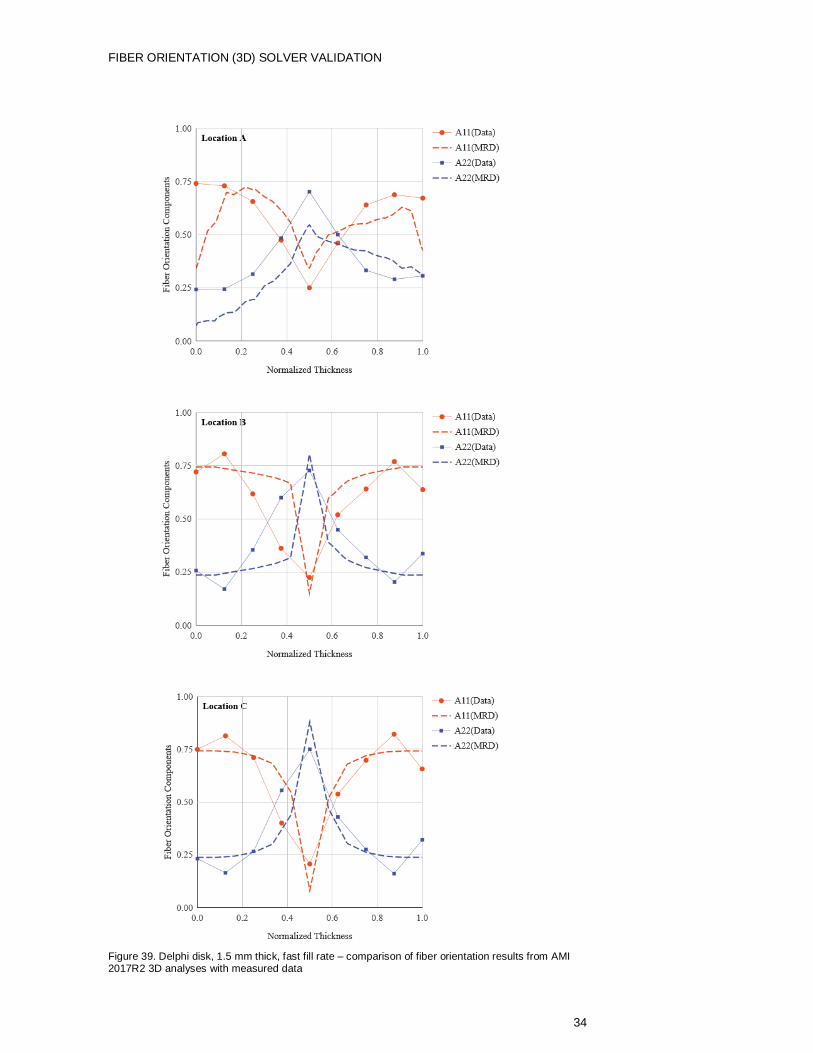
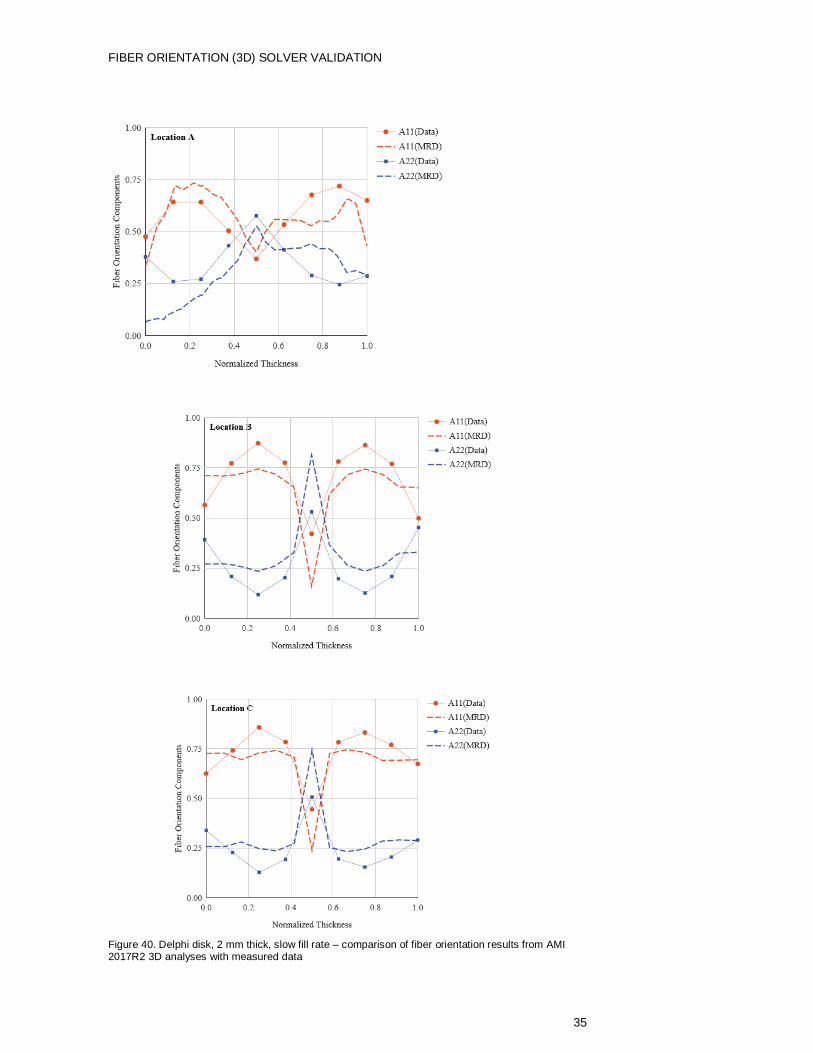
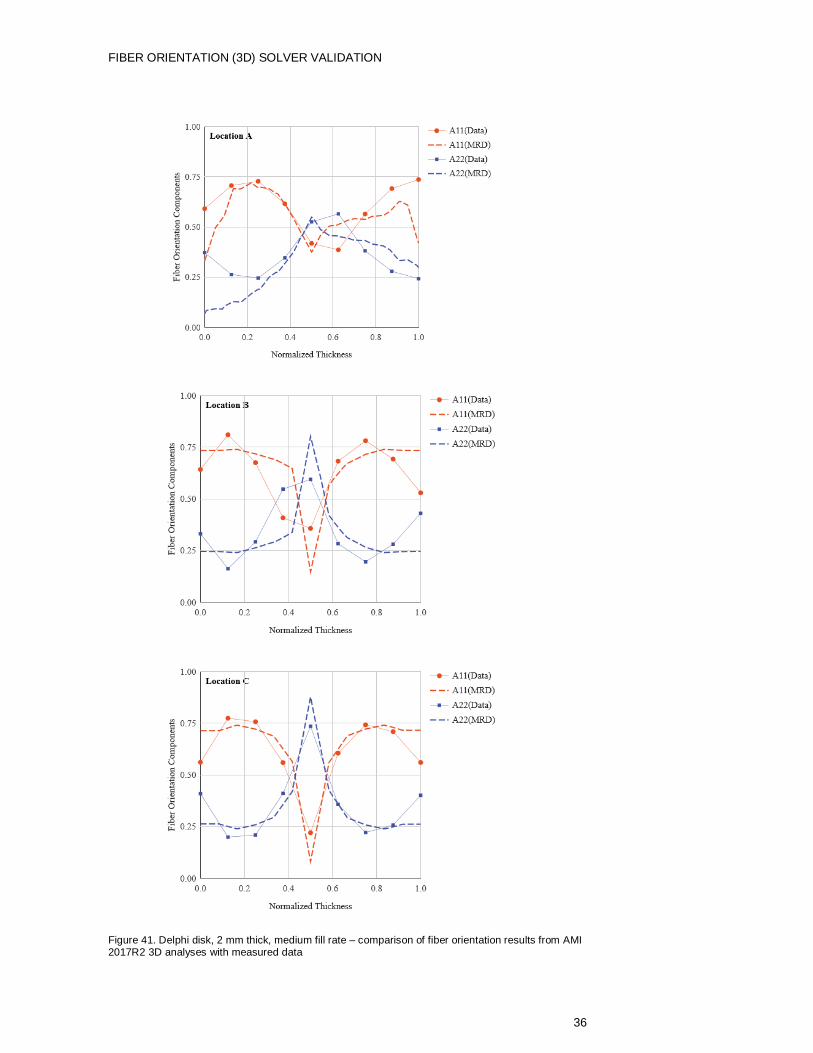
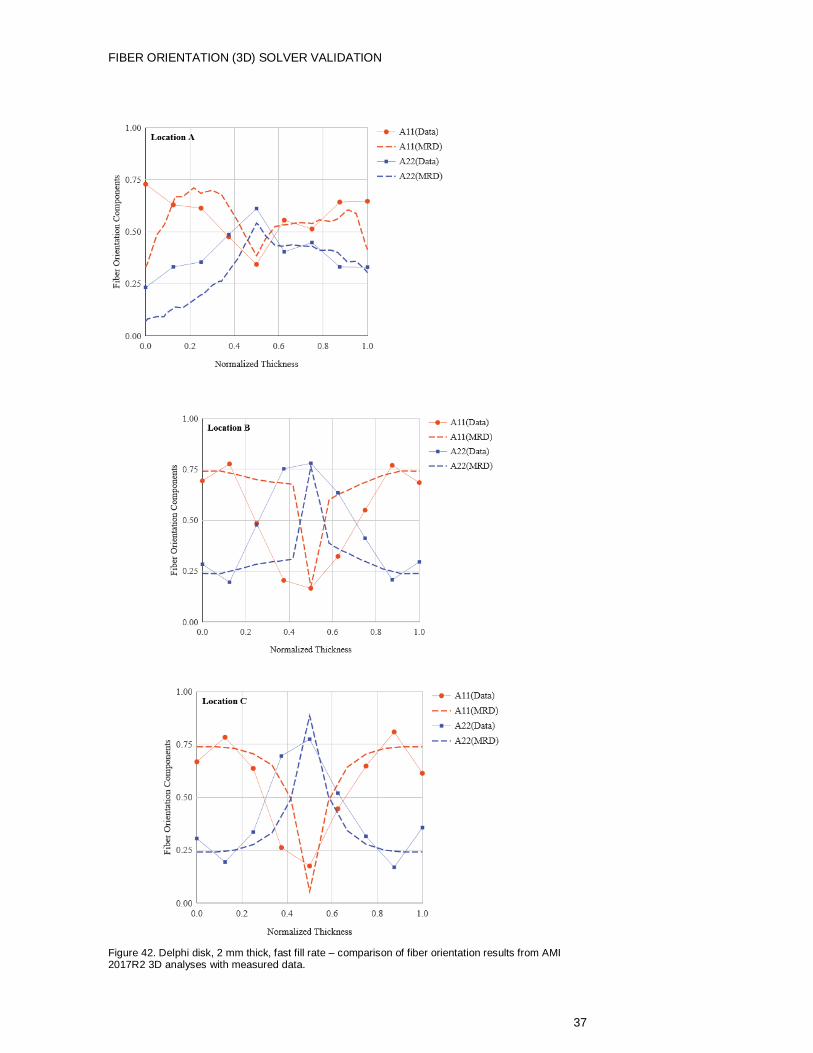
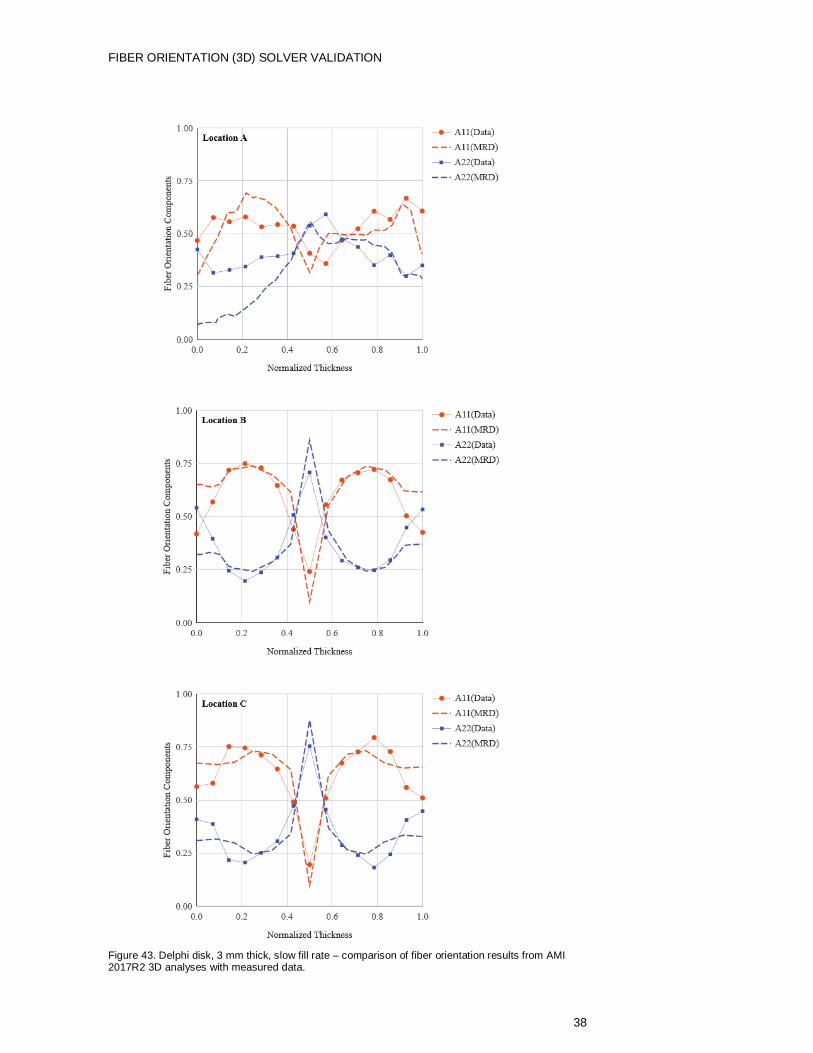
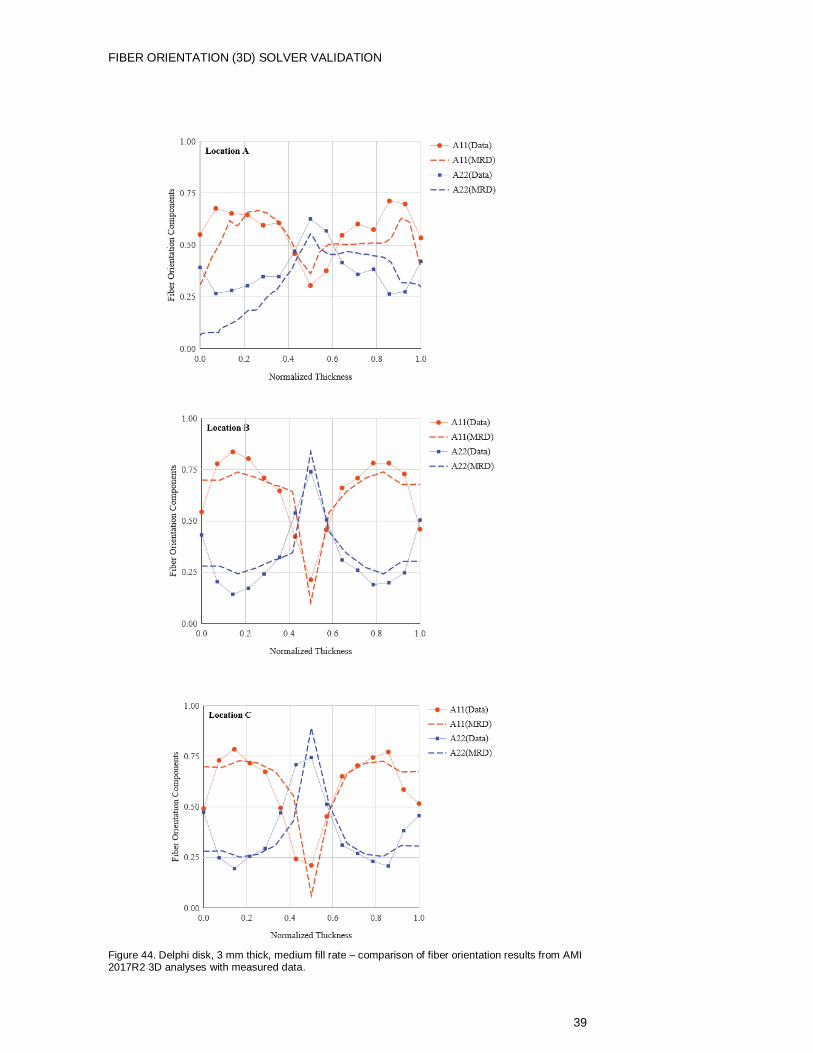
In the subsequent section the nomenclature, A11 represents the orientation tensor
component in the flow direction, A22 the component in the cross-flow direction, and A33 the
component in the thickness direction. The normalized condition of the orientation tensor
implies A11 + A22 + A33 = 1, and only two of three diagonal components are independent.
Thus, only A11 and A22 components are presented. Unless they are specified otherwise, the
default fiber parameters are used, including the automatically calculated CI value based on
the fiber aspect ratio and volume fraction, the default RSC factor κ of 0.01, and the default
values of bi parameters in the ARD model. The MRD model should reproduce the F-T results
with Di coefficients of D1=1.0, D2=1.0, D3=1.0 and same interaction coefficient.
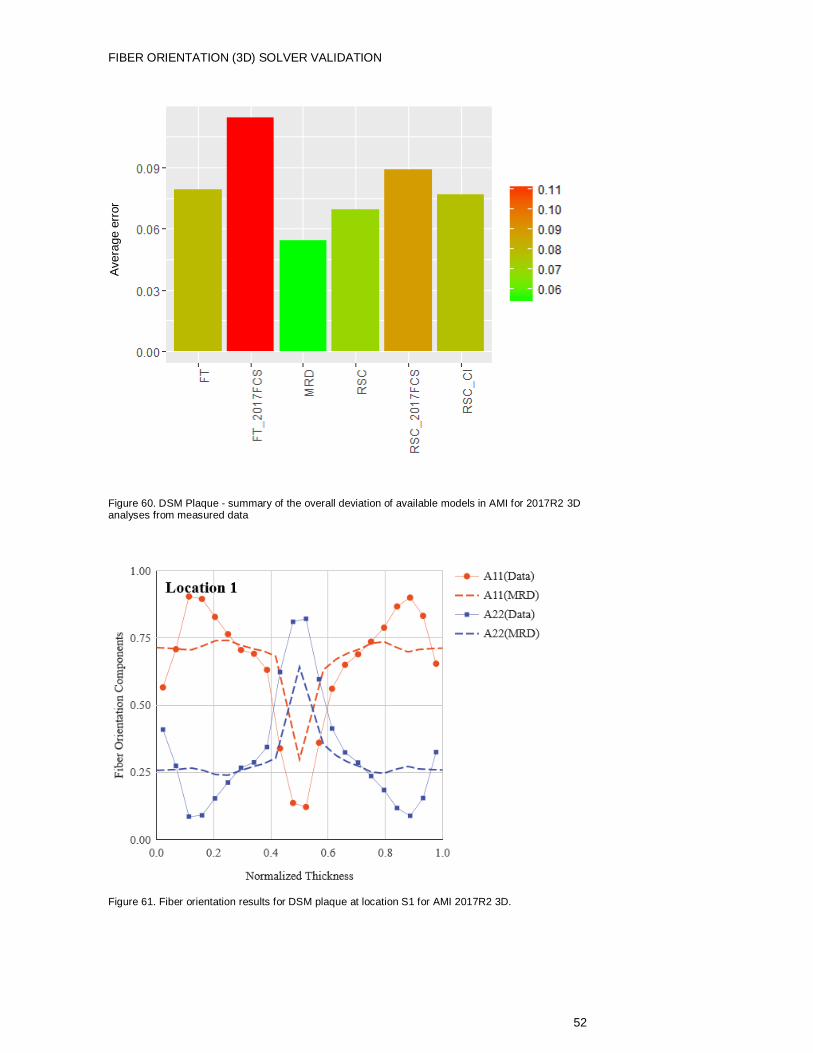
In the plots, the nomenclature FT represents the Folgar-Tucker model in this release after
using the Orthotropic closure. FT_2017FCS represents the Folgar-Tucker model in the
2017 release using the Hybrid closure. MRD is the Moldflow rotation diffusion model. RSC
represent the reduced strain closure model with Orthotropic closure. RSC_2017FCS
represents the RSC model in AMI 2017 release using the Hybrid closure. RSC_CI is the
RSC model in this release using both the Orthotropic closure and a newly fitted calculation
of interaction coefficient in terms of volume fraction and aspect ratio.
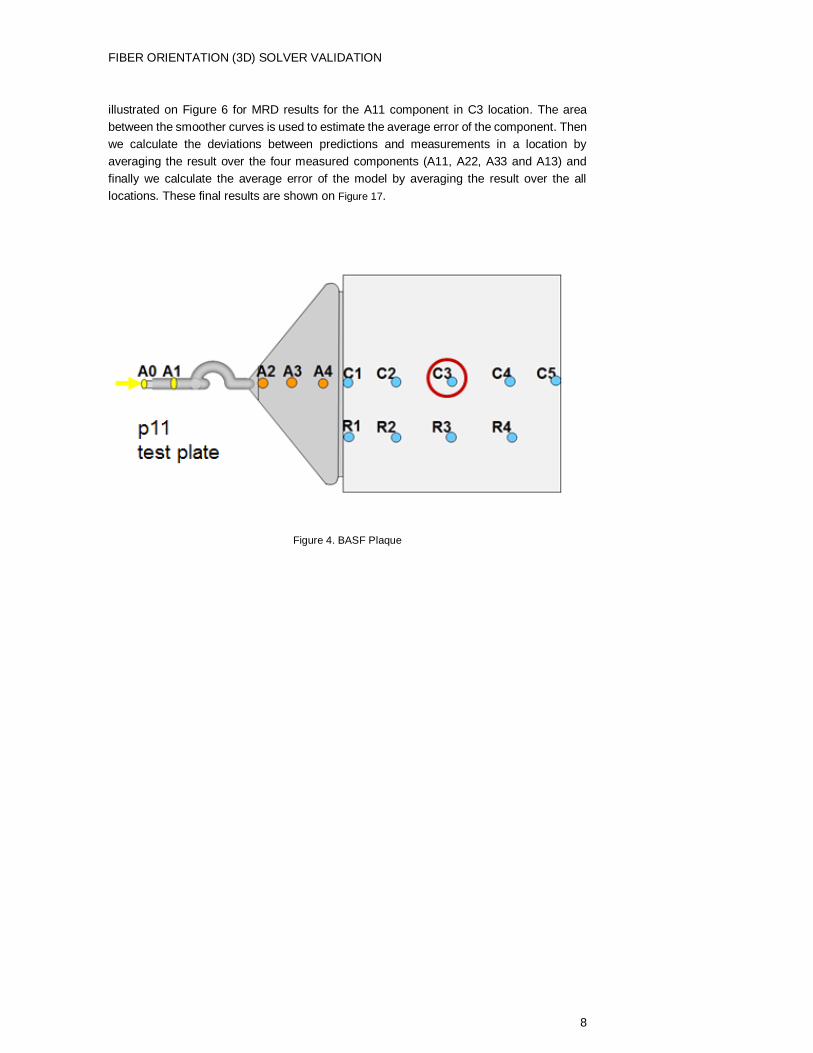
BASF Plate
A 3mm thick BASF plaque was molded from a 50wt% Glass fiber filled thermoplastic. The
plaque is as shown below. Test results are measured from the plaque from the location
labelled A0-R4 in the plate. The results are compared with the AMI 2017R2 release
prediction. Figure 5-Figure 16 are examples of prediction of MRD model for BASF plaque
compared to experimental data provided by BASF.
To automatically estimate quality of fiber orientation predictions we used measured and
predicted data to build smoother curves by the LOESS local regression method [10] as
FIBER ORIENTATION (3D) SOLVER VALIDATION
8
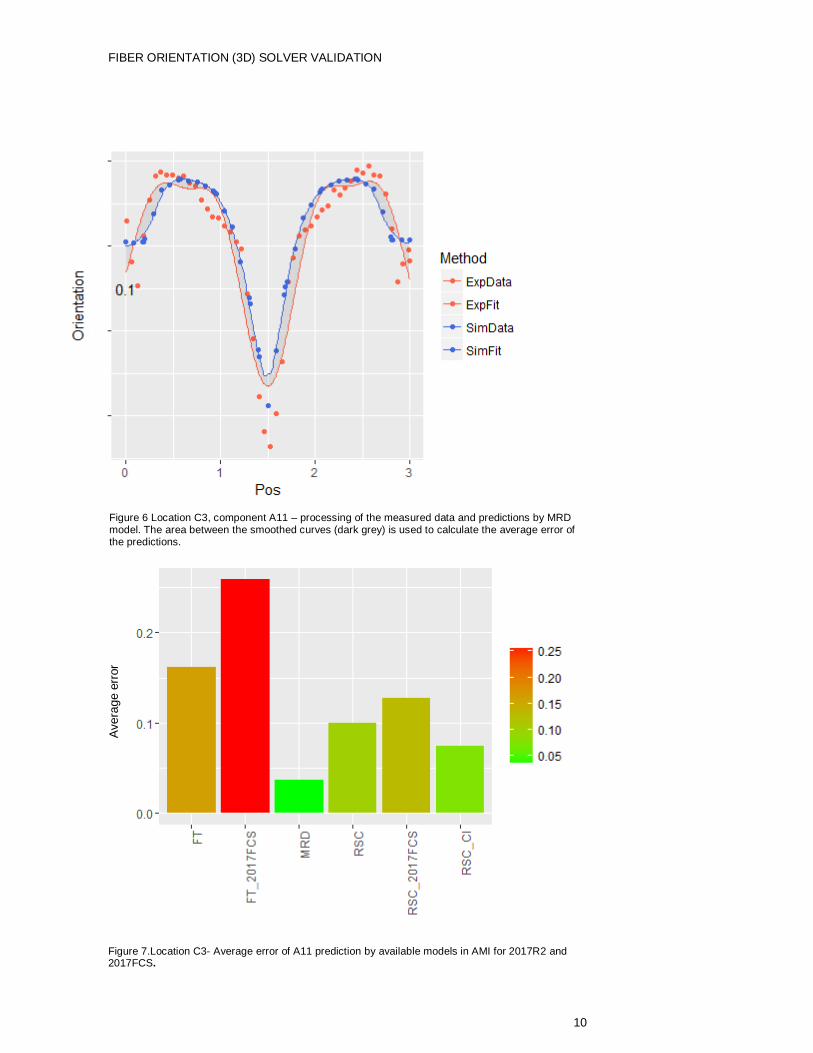
illustrated on Figure 6 for MRD results for the A11 component in C3 location. The area
between the smoother curves is used to estimate the average error of the component. Then
we calculate the deviations between predictions and measurements in a location by
averaging the result over the four measured components (A11, A22, A33 and A13) and
finally we calculate the average error of the model by averaging the result over the all
locations. These final results are shown on Figure 17.
Figure 4. BASF Plaque
FIBER ORIENTATION (3D) SOLVER VALIDATION
9
Figure 5. BASF plaque – comparison of fiber orientation results from AMI 2017R2 3D analyses.
FIBER ORIENTATION (3D) SOLVER VALIDATION
10
Figure 7.Location C3- Average error of A11 prediction by available models in AMI for 2017R2 and 2017FCS.
Avera
ge e
rror
Figure 6 Location C3, component A11 – processing of the measured data and predictions by MRD model. The area between the smoothed curves (dark grey) is used to calculate the average error of the predictions.
Avera
ge e
rror
FIBER ORIENTATION (3D) SOLVER VALIDATION
11
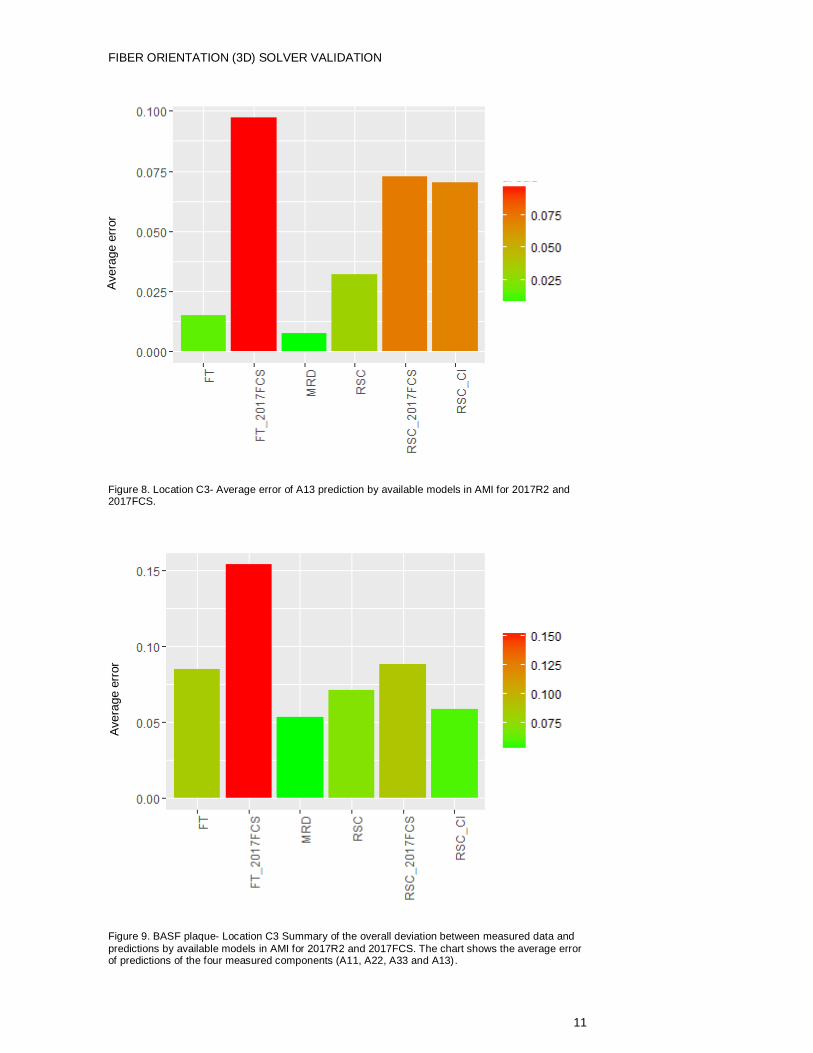
Figure 8. Location C3- Average error of A13 prediction by available models in AMI for 2017R2 and 2017FCS.
Figure 9. BASF plaque- Location C3 Summary of the overall deviation between measured data and
predictions by available models in AMI for 2017R2 and 2017FCS. The chart shows the average error of predictions of the four measured components (A11, A22, A33 and A13).
Avera
ge e
rror
Avera
ge e
rror
Avera
ge e
rror
FIBER ORIENTATION (3D) SOLVER VALIDATION
12
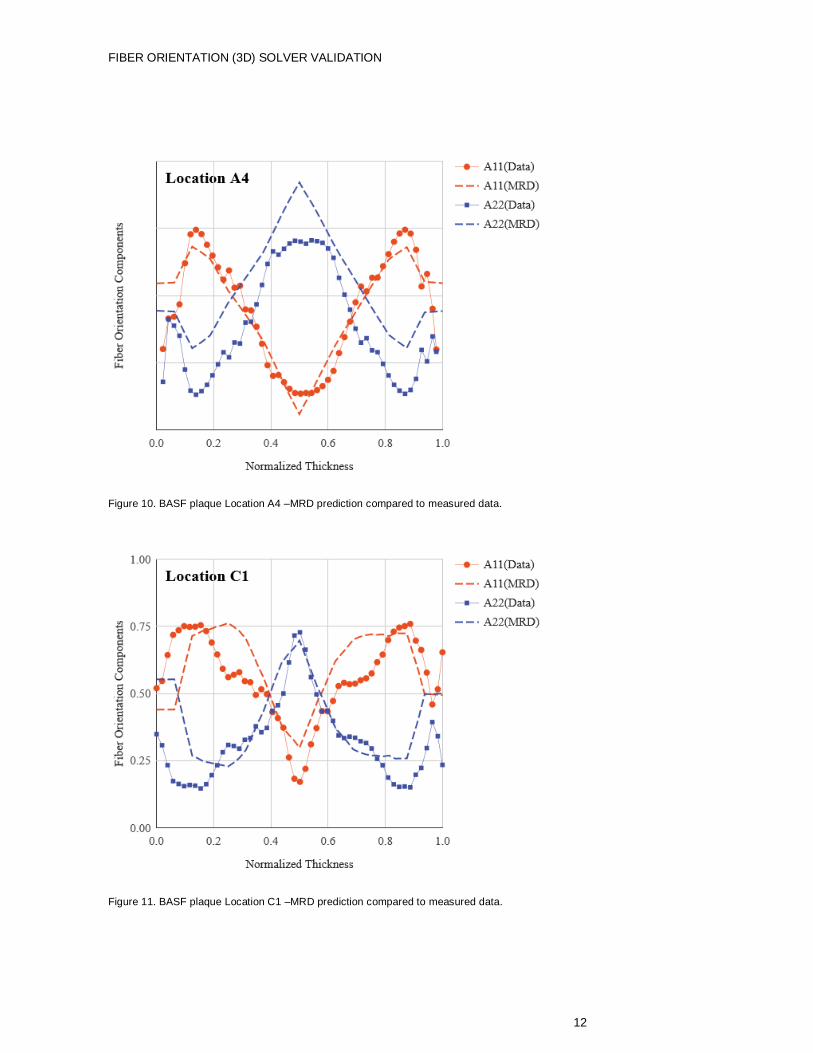
Figure 10. BASF plaque Location A4 –MRD prediction compared to measured data.
Figure 11. BASF plaque Location C1 –MRD prediction compared to measured data.
FIBER ORIENTATION (3D) SOLVER VALIDATION
13
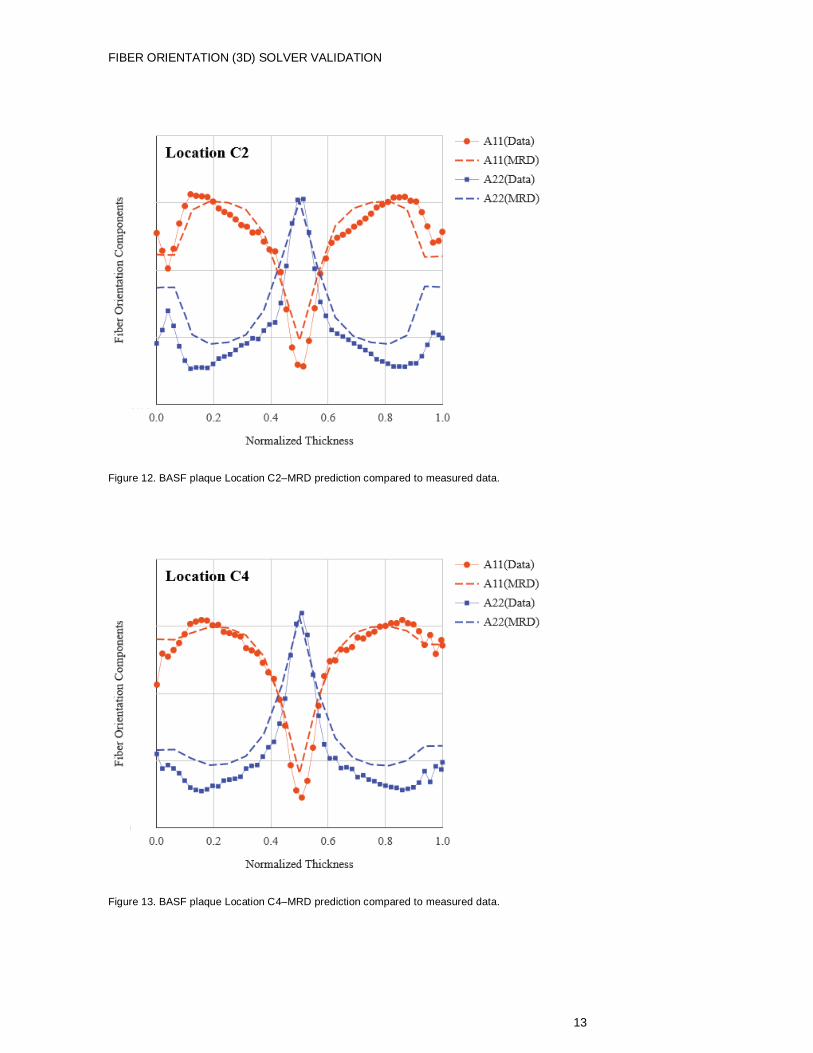
Figure 12. BASF plaque Location C2–MRD prediction compared to measured data.
Figure 13. BASF plaque Location C4–MRD prediction compared to measured data.
FIBER ORIENTATION (3D) SOLVER VALIDATION
14
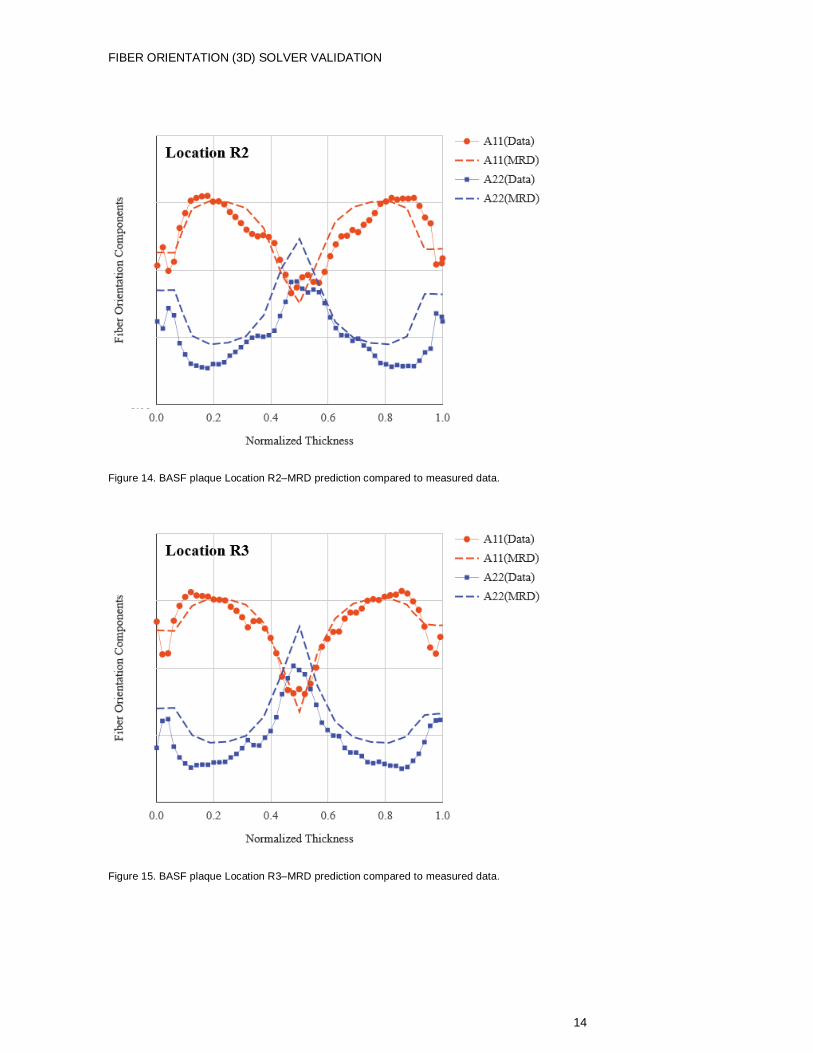
Figure 14. BASF plaque Location R2–MRD prediction compared to measured data.
Figure 15. BASF plaque Location R3–MRD prediction compared to measured data.
FIBER ORIENTATION (3D) SOLVER VALIDATION
15
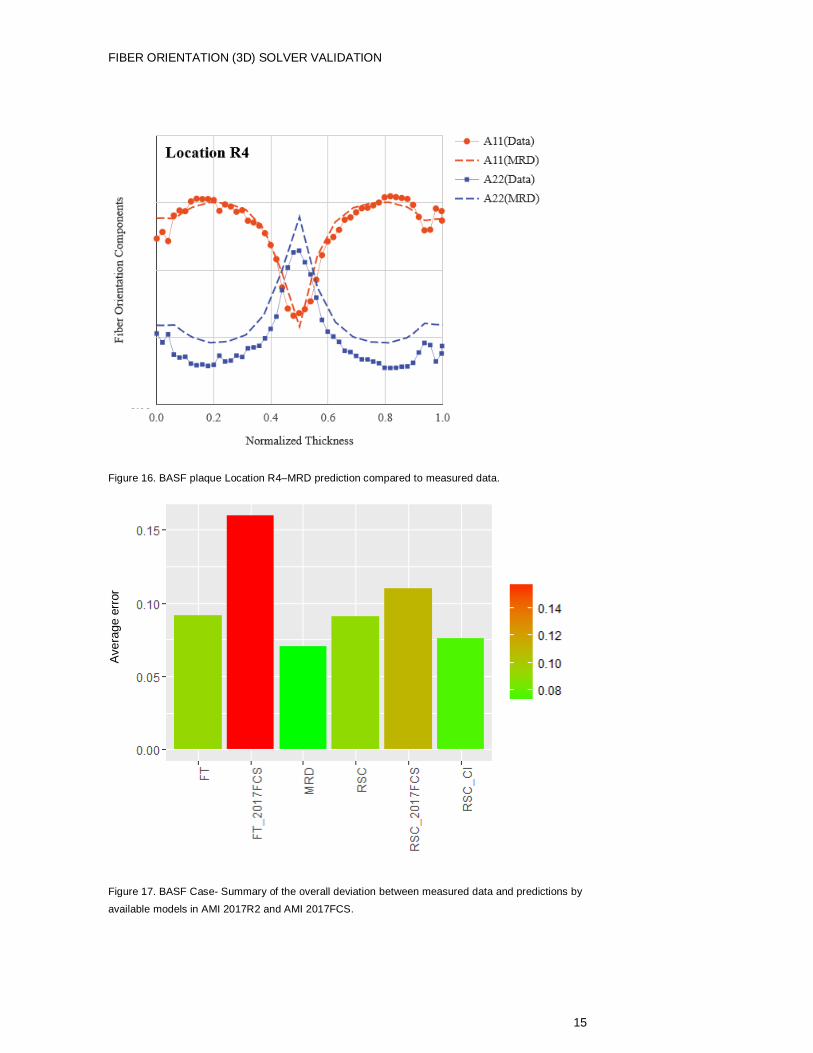
Figure 16. BASF plaque Location R4–MRD prediction compared to measured data.
Figure 17. BASF Case- Summary of the overall deviation between measured data and predictions by
available models in AMI 2017R2 and AMI 2017FCS.
Avera
ge e
rror
FIBER ORIENTATION (3D) SOLVER VALIDATION
16
Conclusion: 2017R2 with the default model option (MRD) provides significantly improved
accuracy over 2017 FCS (FT). The average error of predictions decreased from 0.16 to
0.07. Both FT and RSC model also improved accuracy in the release 2017 R2 over 2017
FCS.
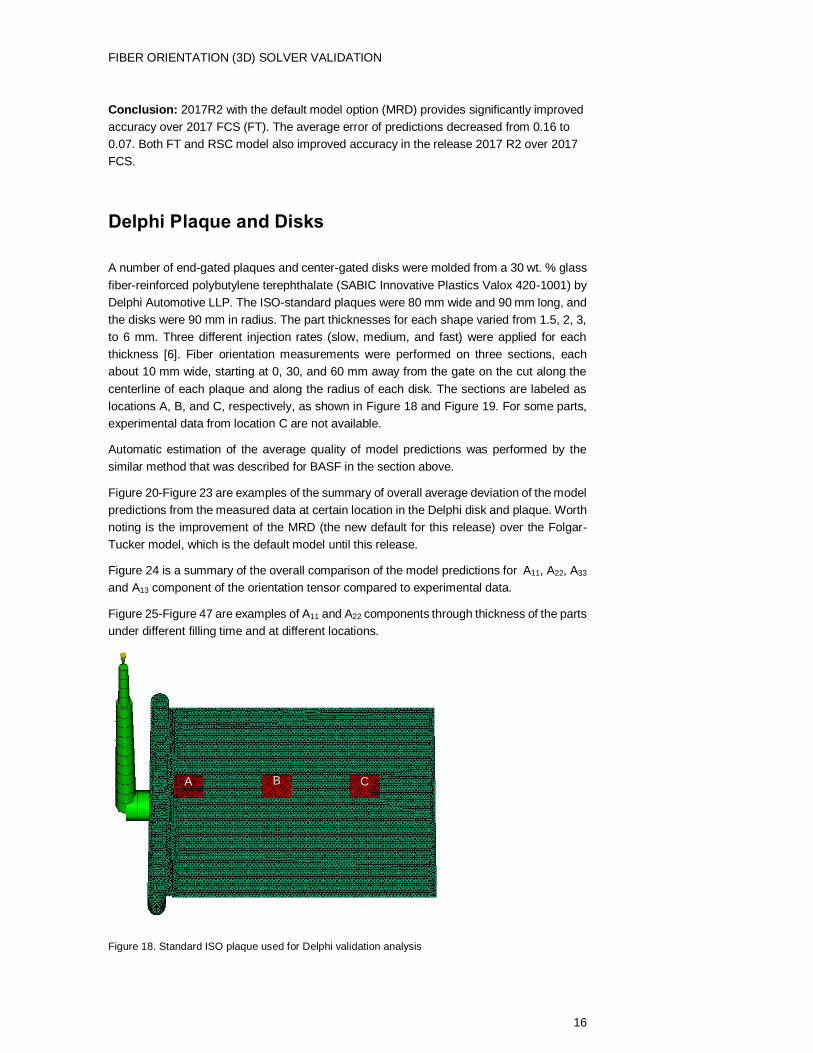
Delphi Plaque and Disks
A number of end-gated plaques and center-gated disks were molded from a 30 wt. % glass
fiber-reinforced polybutylene terephthalate (SABIC Innovative Plastics Valox 420-1001) by
Delphi Automotive LLP. The ISO-standard plaques were 80 mm wide and 90 mm long, and
the disks were 90 mm in radius. The part thicknesses for each shape varied from 1.5, 2, 3,
to 6 mm. Three different injection rates (slow, medium, and fast) were applied for each
thickness [6]. Fiber orientation measurements were performed on three sections, each
about 10 mm wide, starting at 0, 30, and 60 mm away from the gate on the cut along the
centerline of each plaque and along the radius of each disk. The sections are labeled as
locations A, B, and C, respectively, as shown in Figure 18 and Figure 19. For some parts,
experimental data from location C are not available.
Automatic estimation of the average quality of model predictions was performed by the
similar method that was described for BASF in the section above.
Figure 20-Figure 23 are examples of the summary of overall average deviation of the model
predictions from the measured data at certain location in the Delphi disk and plaque. Worth
noting is the improvement of the MRD (the new default for this release) over the Folgar-
Tucker model, which is the default model until this release.
Figure 24 is a summary of the overall comparison of the model predictions for A11, A22, A33
and A13 component of the orientation tensor compared to experimental data.
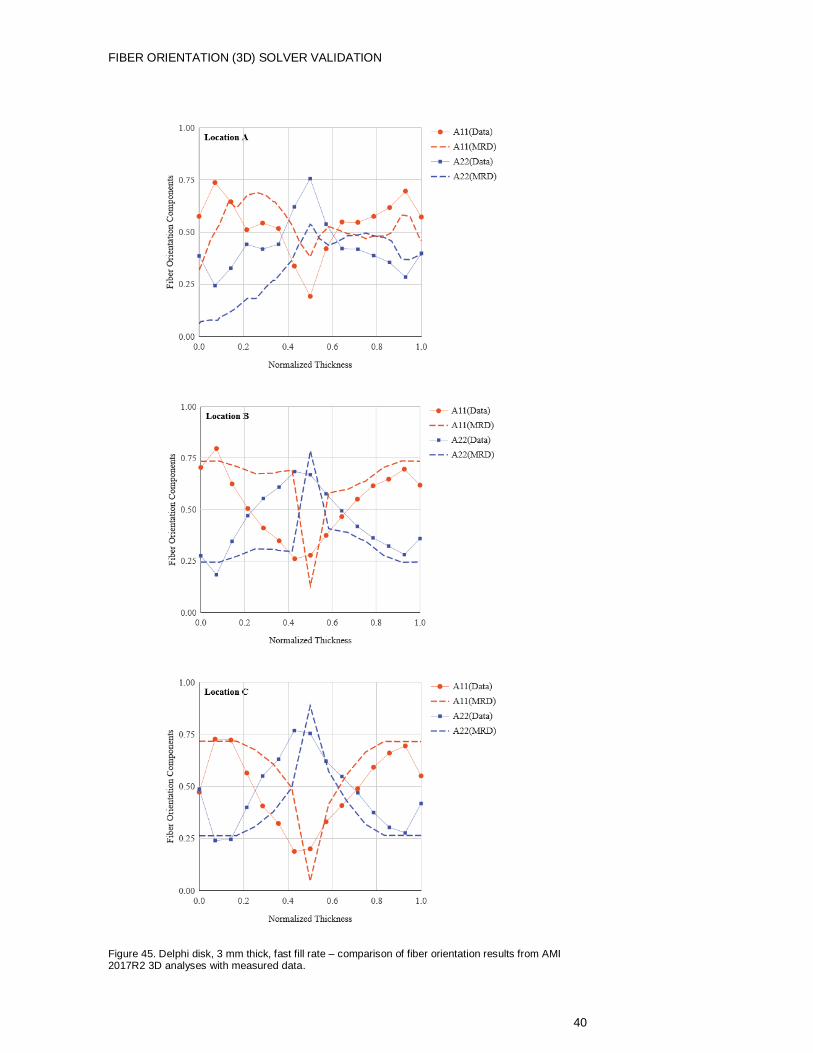
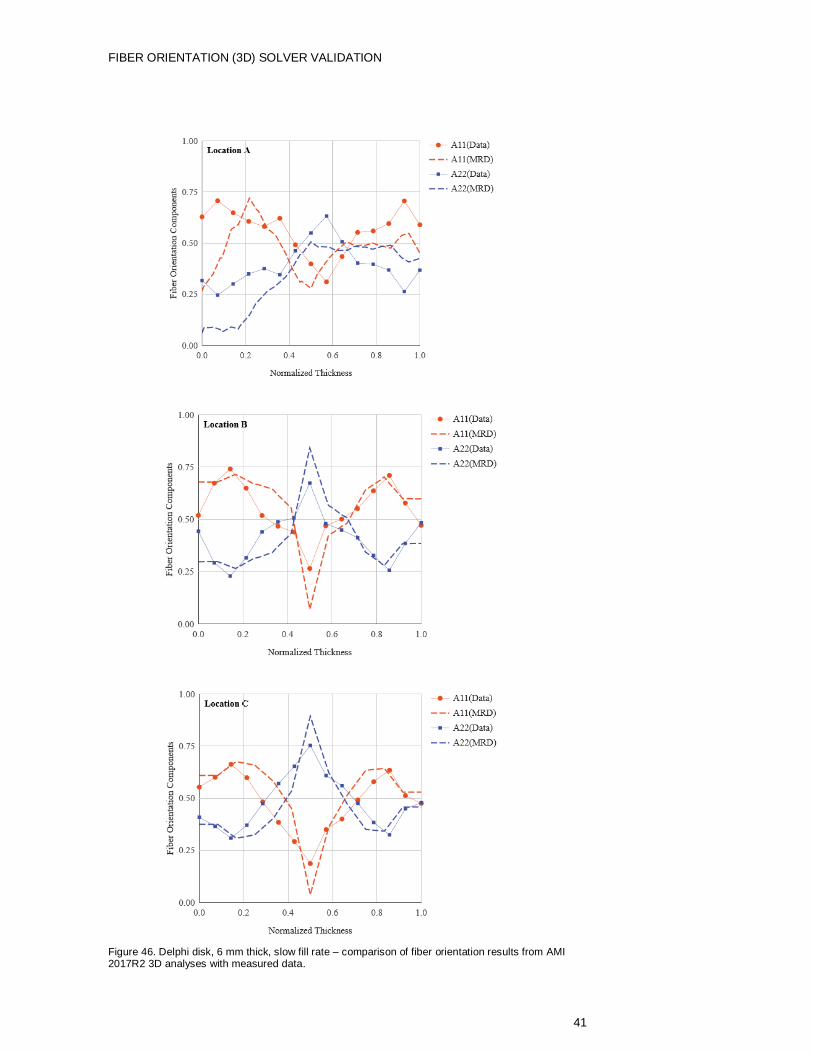
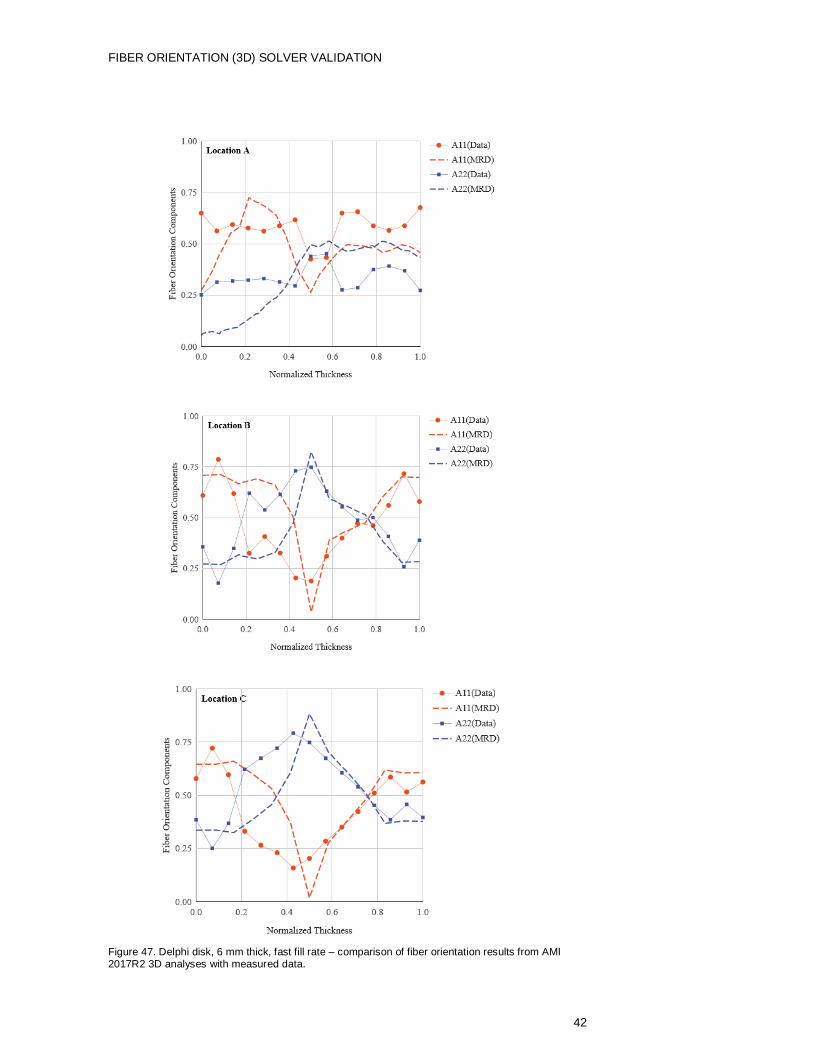
Figure 25-Figure 47 are examples of A11 and A22 components through thickness of the parts
under different filling time and at different locations.
Figure 18. Standard ISO plaque used for Delphi validation analysis
C B A
FIBER ORIENTATION (3D) SOLVER VALIDATION
17
.
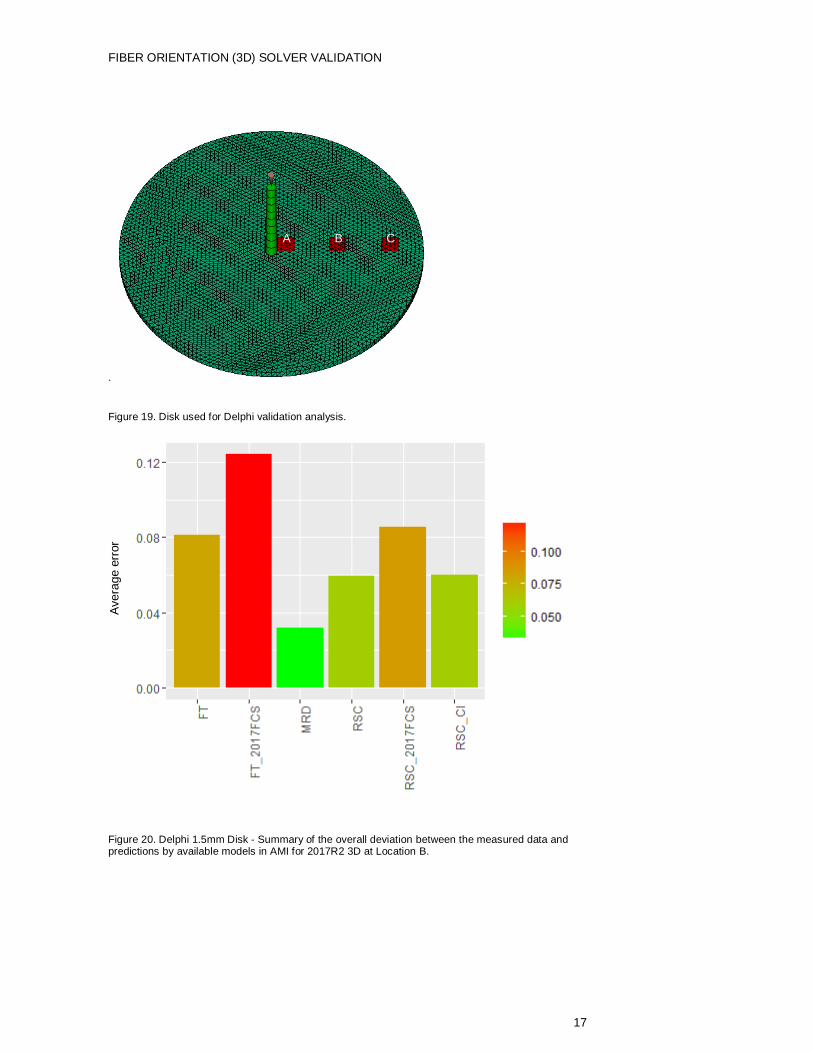
Figure 19. Disk used for Delphi validation analysis.
Figure 20. Delphi 1.5mm Disk - Summary of the overall deviation between the measured data and predictions by available models in AMI for 2017R2 3D at Location B.
A B C
Avera
ge e
rror
FIBER ORIENTATION (3D) SOLVER VALIDATION
18
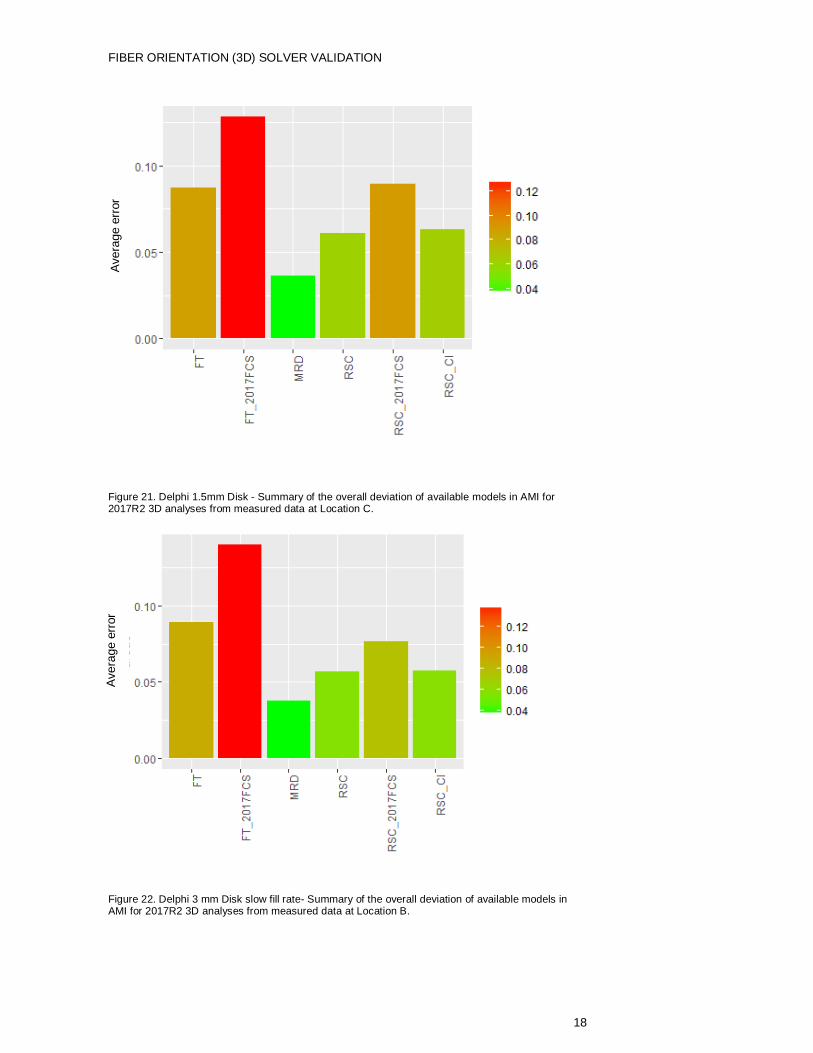
Figure 21. Delphi 1.5mm Disk - Summary of the overall deviation of available models in AMI for 2017R2 3D analyses from measured data at Location C.
Figure 22. Delphi 3 mm Disk slow fill rate- Summary of the overall deviation of available models in AMI for 2017R2 3D analyses from measured data at Location B.
Avera
ge e
rror
Avera
ge e
rror
FIBER ORIENTATION (3D) SOLVER VALIDATION
19
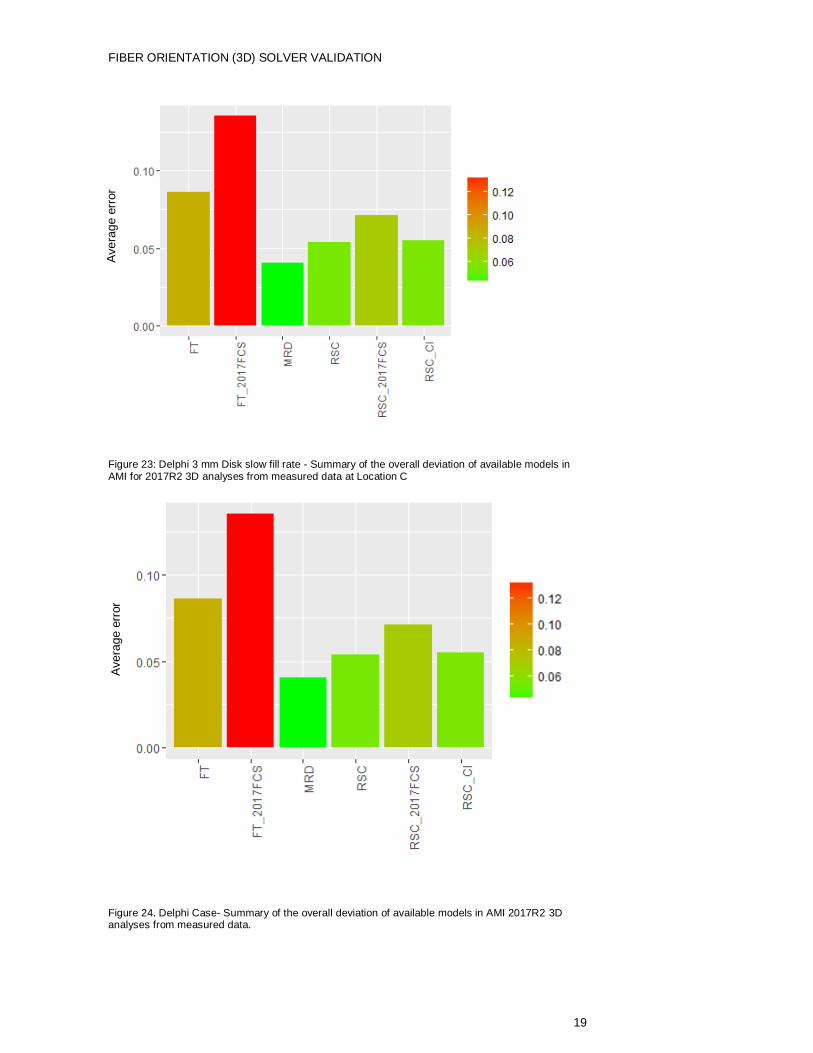
Figure 23: Delphi 3 mm Disk slow fill rate - Summary of the overall deviation of available models in AMI for 2017R2 3D analyses from measured data at Location C
Figure 24. Delphi Case- Summary of the overall deviation of available models in AMI 2017R2 3D analyses from measured data.
Avera
ge e
rror
Avera
ge e
rror
FIBER ORIENTATION (3D) SOLVER VALIDATION
20
Figure 25. Delphi ISO-standard plaque, 1.5 mm thick, slow fill rate – comparison of fiber orientation results from AMI 2017R2 3D analyses with measured data
FIBER ORIENTATION (3D) SOLVER VALIDATION
21
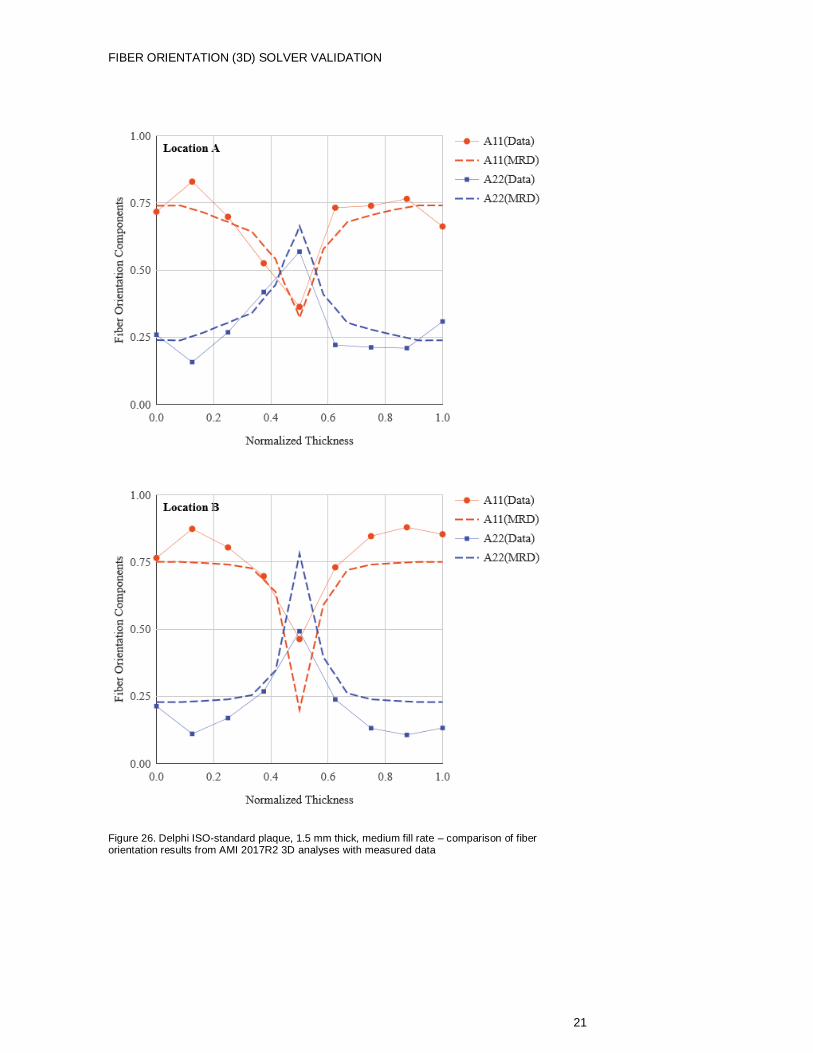
Figure 26. Delphi ISO-standard plaque, 1.5 mm thick, medium fill rate – comparison of fiber orientation results from AMI 2017R2 3D analyses with measured data
FIBER ORIENTATION (3D) SOLVER VALIDATION
22
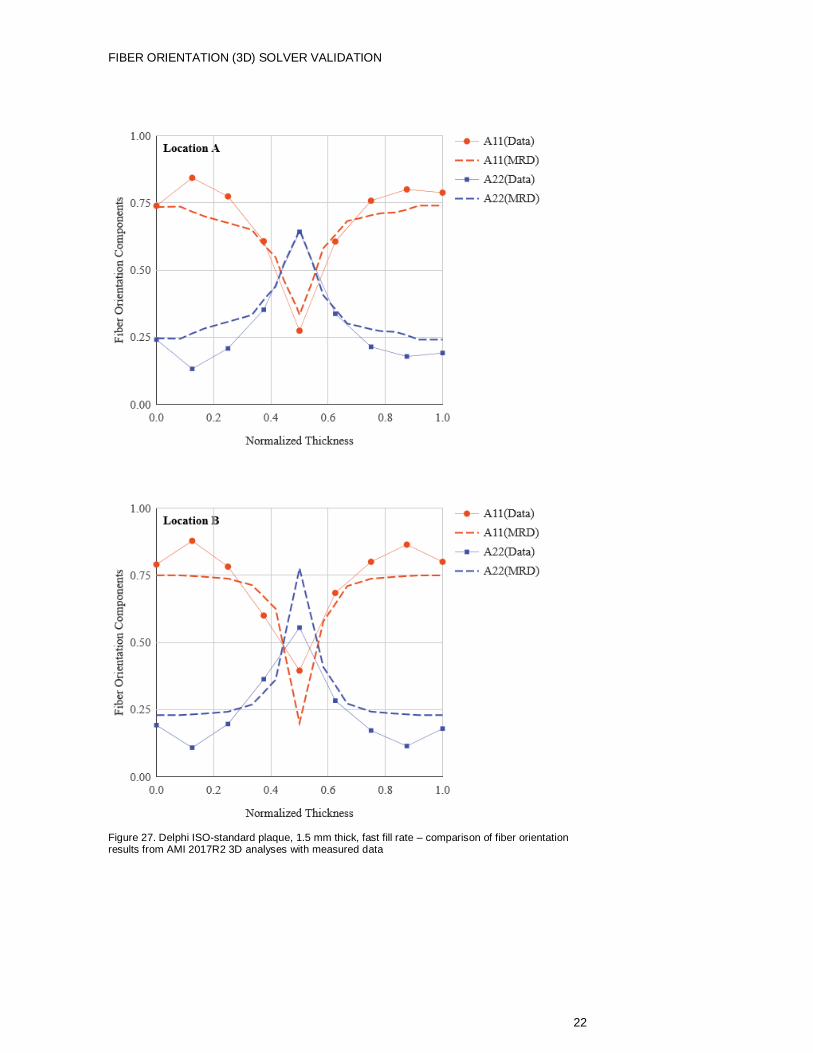
Figure 27. Delphi ISO-standard plaque, 1.5 mm thick, fast fill rate – comparison of fiber orientation results from AMI 2017R2 3D analyses with measured data
0
0.1
0.2
0.3
0.4
0.5
0.6
0.7
0.8
0.9
1
0 0.2 0.4 0.6 0.8 1
Fib
er
ori
enta
tion tensor
com
ponents
Normalized thickness
A11 (Data)
A11 (2016, RSC)
A11(2017,RSC)
A22 (Data)
A22 (2016, RSC)
A22(2017,RSC)
Location A
FIBER ORIENTATION (3D) SOLVER VALIDATION
23
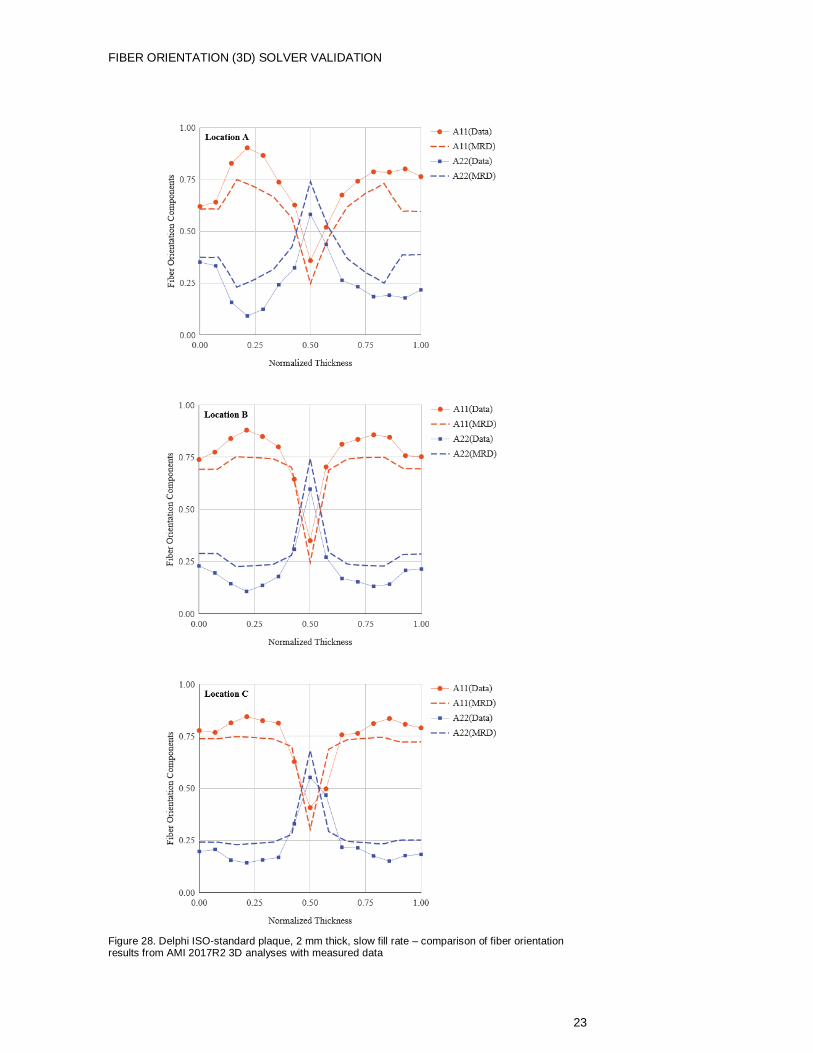
Figure 28. Delphi ISO-standard plaque, 2 mm thick, slow fill rate – comparison of fiber orientation results from AMI 2017R2 3D analyses with measured data
FIBER ORIENTATION (3D) SOLVER VALIDATION
24
Figure 29. Delphi ISO-standard plaque, 2 mm thick, medium fill rate – comparison of fiber orientation results from AMI 2017R2 3D analyses with measured data
FIBER ORIENTATION (3D) SOLVER VALIDATION
25
Figure 30. Delphi ISO-standard plaque, 2 mm thick, fast fill rate comparison of fiber orientation results from AMI 2017R2 3D analyses with measured data
FIBER ORIENTATION (3D) SOLVER VALIDATION
26
Figure 31. Delphi ISO-standard plaque, 3 mm thick, slow fill rate – comparison of fiber orientation results from AMI 2017R2 3D analyses with measured data
FIBER ORIENTATION (3D) SOLVER VALIDATION
27
Figure 32. Delphi ISO-standard plaque, 3 mm thick, medium fill rate– comparison of fiber orientation results from AMI 2017R2 3D analyses with measured data
FIBER ORIENTATION (3D) SOLVER VALIDATION
28
Figure 33. Delphi ISO-standard plaque, 3 mm thick, fast fill rate- comparison of fiber orientation results from AMI 2017R2 3D analyses with measured data
FIBER ORIENTATION (3D) SOLVER VALIDATION
29
Figure 34. Delphi ISO-standard plaque, 6 mm thick, slow fill rate – comparison of fiber orientation results from AMI 2017R2 3D analyses with measured data
FIBER ORIENTATION (3D) SOLVER VALIDATION
30
Figure 35. Delphi ISO-standard plaque, 6 mm thick, medium fill rate – comparison of fiber orientation results from AMI 2017R2 3D analyses with measured data
.
FIBER ORIENTATION (3D) SOLVER VALIDATION
31
Figure 36. Delphi ISO-standard plaque, 6 mm thick, fast fill rate – comparison of fiber orientation results from AMI 2017R2 3D analyses with measured data
FIBER ORIENTATION (3D) SOLVER VALIDATION
32
Figure 37. Delphi disk, 1.5 mm thick, slow fill rate –– comparison of fiber orientation results from AMI 2017R2 3D analyses with measured data
FIBER ORIENTATION (3D) SOLVER VALIDATION
33
Figure 38. Delphi disk, 1.5 mm thick, medium fill rate – comparison of fiber orientation results from AMI 2017R2 3D analyses with measured data
FIBER ORIENTATION (3D) SOLVER VALIDATION
34
Figure 39. Delphi disk, 1.5 mm thick, fast fill rate – comparison of fiber orientation results from AMI 2017R2 3D analyses with measured data
FIBER ORIENTATION (3D) SOLVER VALIDATION
35
Figure 40. Delphi disk, 2 mm thick, slow fill rate – comparison of fiber orientation results from AMI 2017R2 3D analyses with measured data
FIBER ORIENTATION (3D) SOLVER VALIDATION
36
Figure 41. Delphi disk, 2 mm thick, medium fill rate – comparison of fiber orientation results from AMI 2017R2 3D analyses with measured data
FIBER ORIENTATION (3D) SOLVER VALIDATION
37
Figure 42. Delphi disk, 2 mm thick, fast fill rate – comparison of fiber orientation results from AMI 2017R2 3D analyses with measured data.
FIBER ORIENTATION (3D) SOLVER VALIDATION
38
Figure 43. Delphi disk, 3 mm thick, slow fill rate – comparison of fiber orientation results from AMI 2017R2 3D analyses with measured data.
FIBER ORIENTATION (3D) SOLVER VALIDATION
39
Figure 44. Delphi disk, 3 mm thick, medium fill rate – comparison of fiber orientation results from AMI 2017R2 3D analyses with measured data.
FIBER ORIENTATION (3D) SOLVER VALIDATION
40
Figure 45. Delphi disk, 3 mm thick, fast fill rate – comparison of fiber orientation results from AMI 2017R2 3D analyses with measured data.
FIBER ORIENTATION (3D) SOLVER VALIDATION
41
Figure 46. Delphi disk, 6 mm thick, slow fill rate – comparison of fiber orientation results from AMI 2017R2 3D analyses with measured data.
FIBER ORIENTATION (3D) SOLVER VALIDATION
42
Figure 47. Delphi disk, 6 mm thick, fast fill rate – comparison of fiber orientation results from AMI 2017R2 3D analyses with measured data.
FIBER ORIENTATION (3D) SOLVER VALIDATION
43
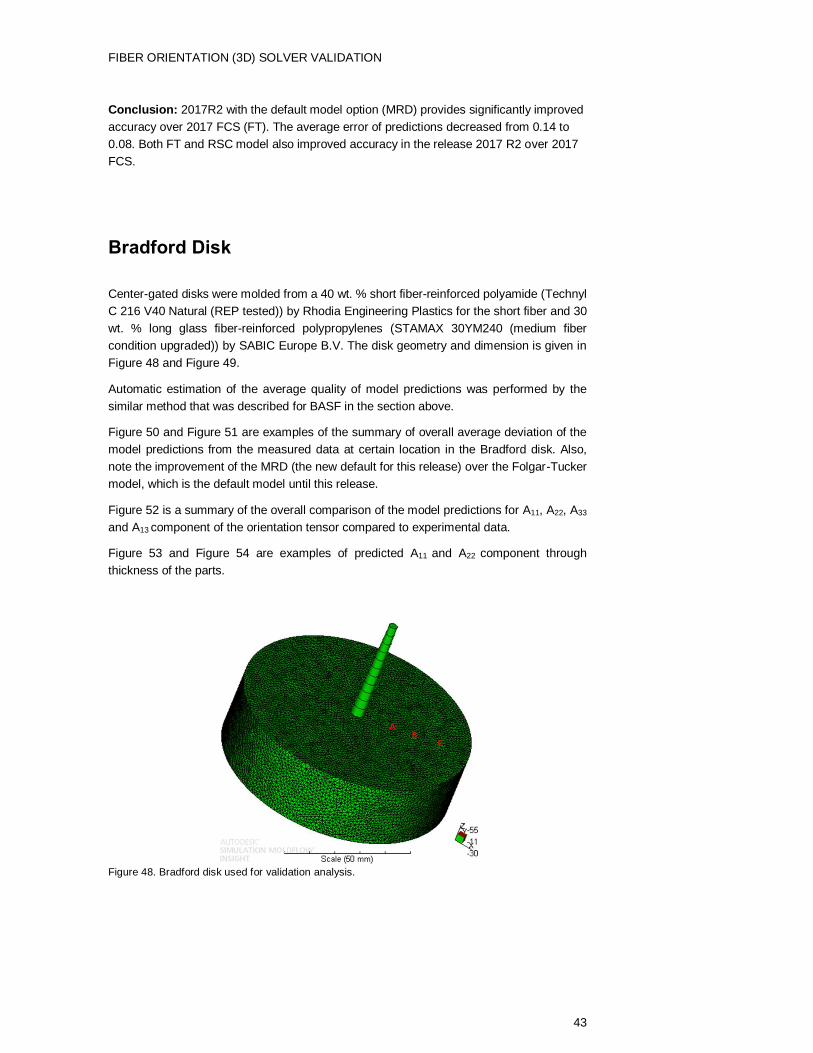
Conclusion: 2017R2 with the default model option (MRD) provides significantly improved
accuracy over 2017 FCS (FT). The average error of predictions decreased from 0.14 to
0.08. Both FT and RSC model also improved accuracy in the release 2017 R2 over 2017
FCS.
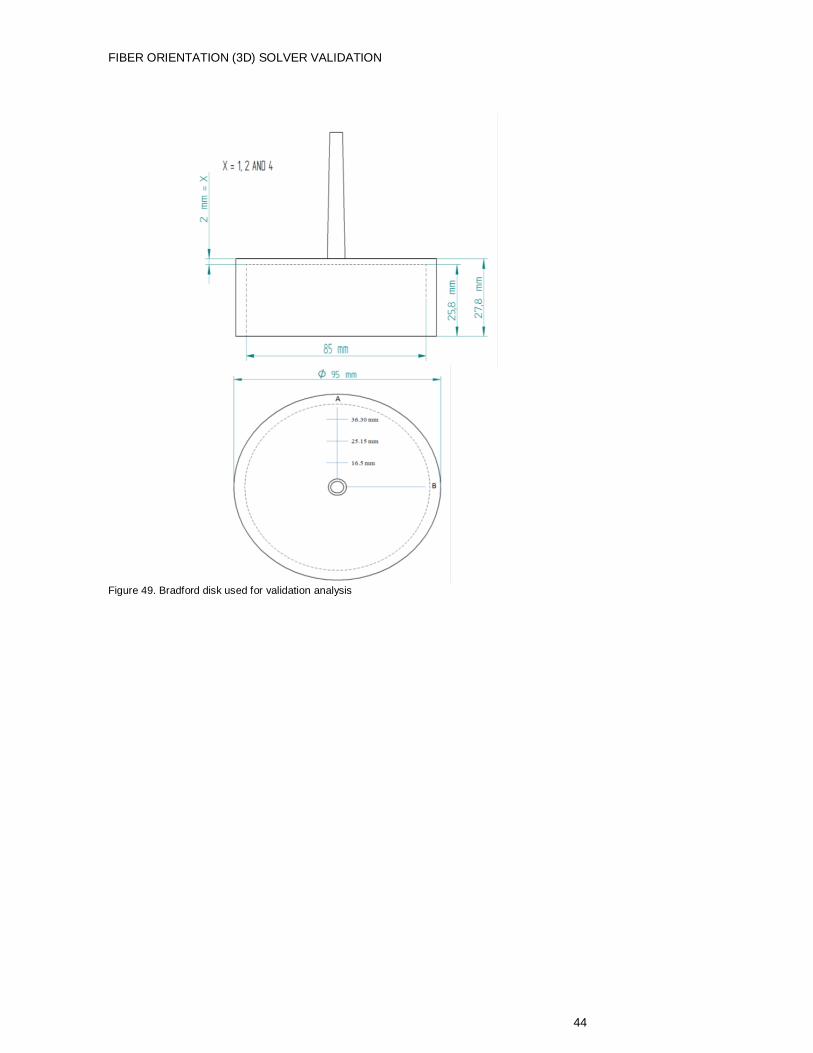
Bradford Disk
Center-gated disks were molded from a 40 wt. % short fiber-reinforced polyamide (Technyl
C 216 V40 Natural (REP tested)) by Rhodia Engineering Plastics for the short fiber and 30
wt. % long glass fiber-reinforced polypropylenes (STAMAX 30YM240 (medium fiber
condition upgraded)) by SABIC Europe B.V. The disk geometry and dimension is given in
Figure 48 and Figure 49.
Automatic estimation of the average quality of model predictions was performed by the
similar method that was described for BASF in the section above.
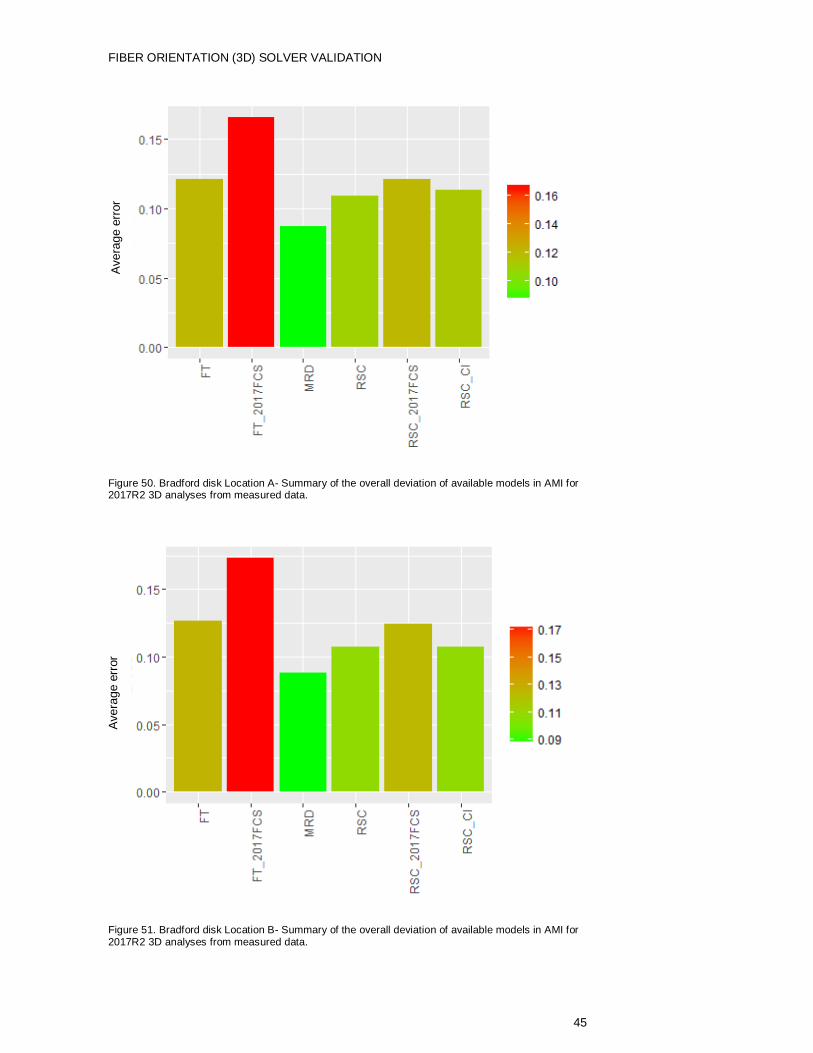
Figure 50 and Figure 51 are examples of the summary of overall average deviation of the
model predictions from the measured data at certain location in the Bradford disk. Also,
note the improvement of the MRD (the new default for this release) over the Folgar-Tucker
model, which is the default model until this release.
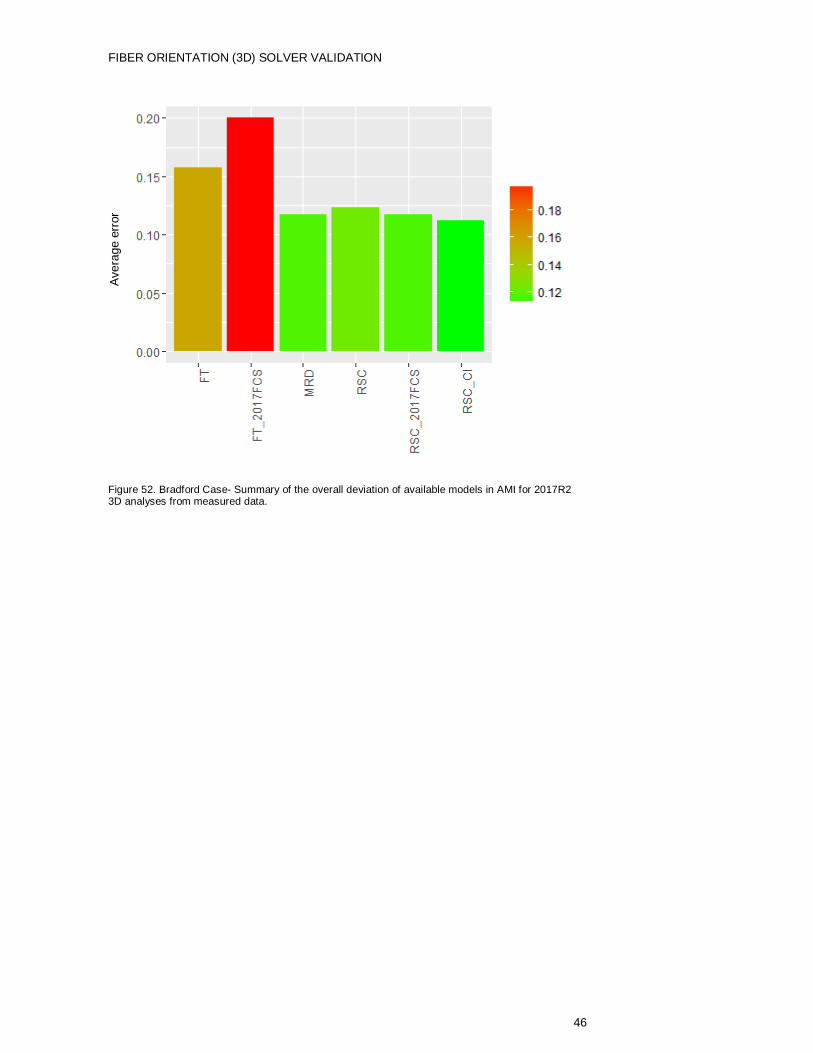
Figure 52 is a summary of the overall comparison of the model predictions for A11, A22, A33
and A13 component of the orientation tensor compared to experimental data.
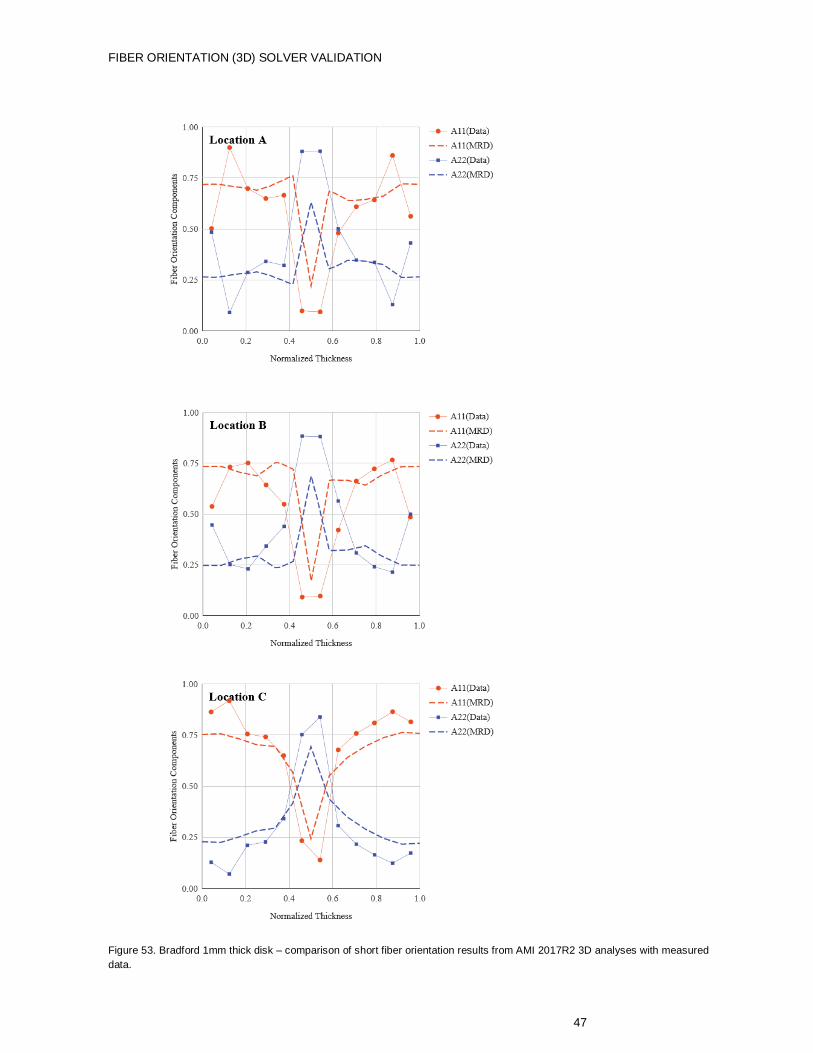
Figure 53 and Figure 54 are examples of predicted A11 and A22 component through
thickness of the parts.
Figure 48. Bradford disk used for validation analysis.
FIBER ORIENTATION (3D) SOLVER VALIDATION
44
Figure 49. Bradford disk used for validation analysis
FIBER ORIENTATION (3D) SOLVER VALIDATION
45
Figure 50. Bradford disk Location A- Summary of the overall deviation of available models in AMI for 2017R2 3D analyses from measured data.
Figure 51. Bradford disk Location B- Summary of the overall deviation of available models in AMI for 2017R2 3D analyses from measured data.
Avera
ge e
rror
Avera
ge e
rror
FIBER ORIENTATION (3D) SOLVER VALIDATION
46
Figure 52. Bradford Case- Summary of the overall deviation of available models in AMI for 2017R2 3D analyses from measured data.
Avera
ge e
rror
FIBER ORIENTATION (3D) SOLVER VALIDATION
47
Figure 53. Bradford 1mm thick disk – comparison of short fiber orientation results from AMI 2017R2 3D analyses with measured
data.
FIBER ORIENTATION (3D) SOLVER VALIDATION
48
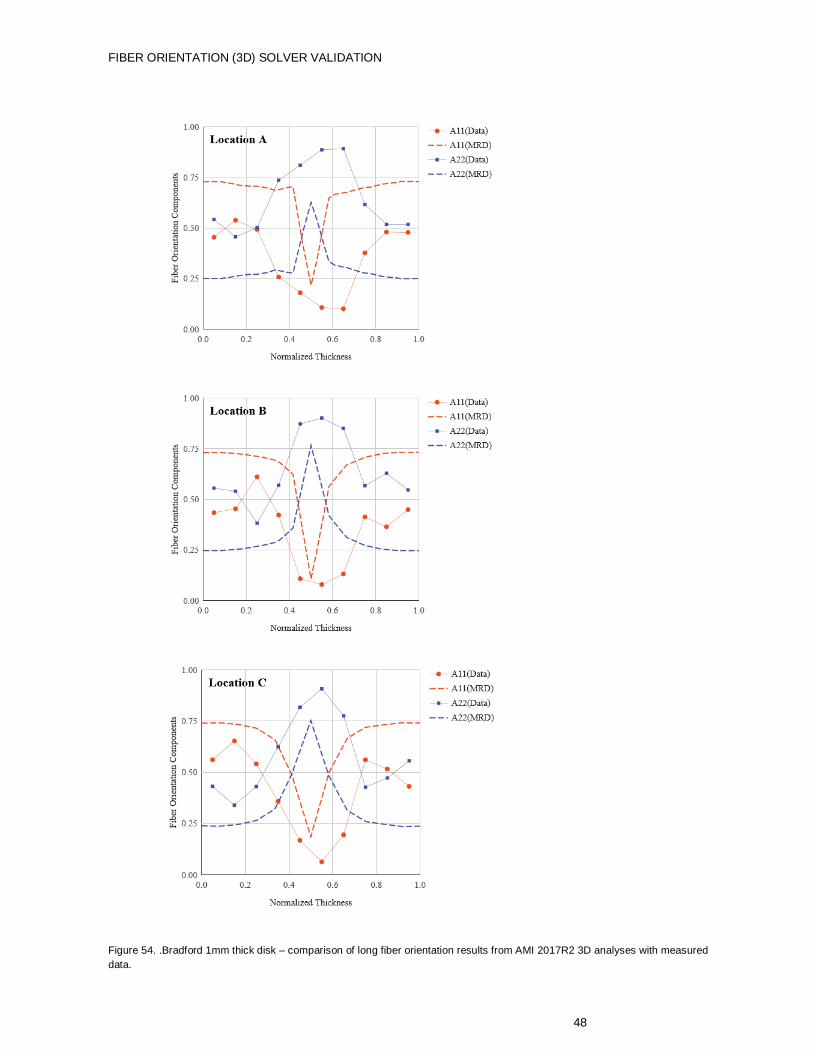
Figure 54. .Bradford 1mm thick disk – comparison of long fiber orientation results from AMI 2017R2 3D analyses with measured
data.
FIBER ORIENTATION (3D) SOLVER VALIDATION
49
Conclusion: 2017R2 with the default model option (MRD) provides significantly improved
accuracy over 2017 FCS (FT). The average error of predictions decreased from 0.20 to
0.11. Both FT and RSC model also improved accuracy in the release 2017 R2 over 2017
FCS.
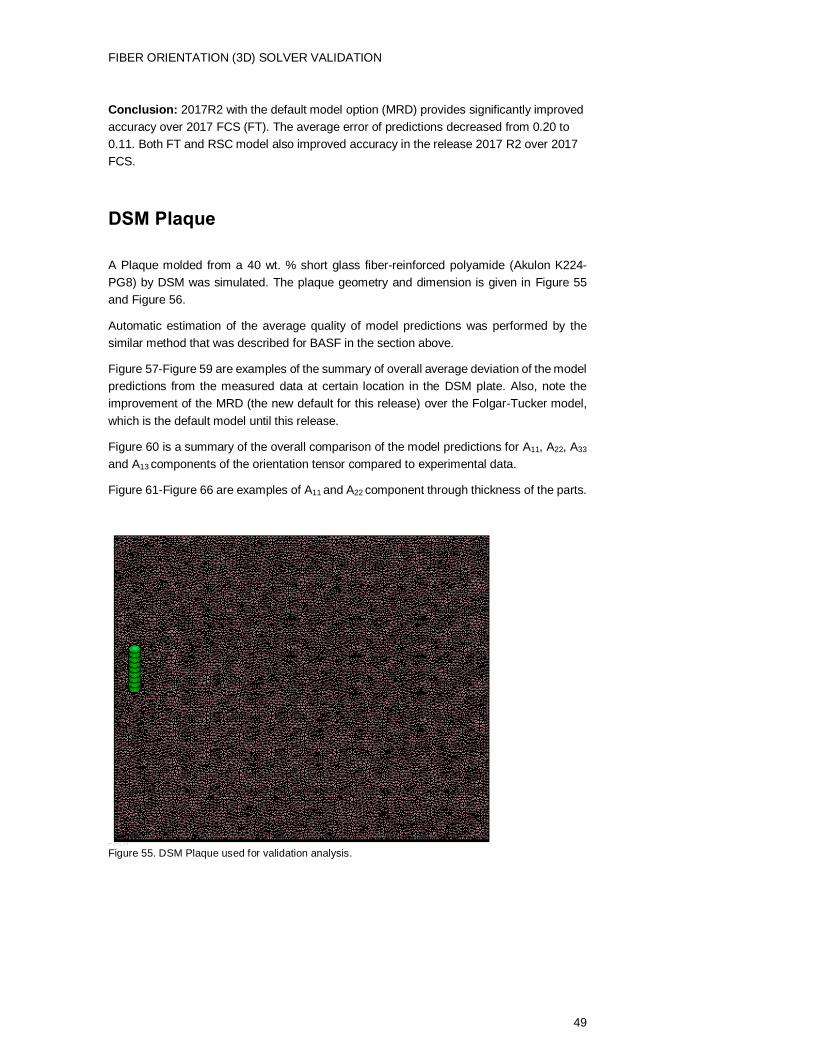
DSM Plaque
A Plaque molded from a 40 wt. % short glass fiber-reinforced polyamide (Akulon K224-
PG8) by DSM was simulated. The plaque geometry and dimension is given in Figure 55
and Figure 56.
Automatic estimation of the average quality of model predictions was performed by the
similar method that was described for BASF in the section above.
Figure 57-Figure 59 are examples of the summary of overall average deviation of the model
predictions from the measured data at certain location in the DSM plate. Also, note the
improvement of the MRD (the new default for this release) over the Folgar-Tucker model,
which is the default model until this release.
Figure 60 is a summary of the overall comparison of the model predictions for A11, A22, A33
and A13 components of the orientation tensor compared to experimental data.
Figure 61-Figure 66 are examples of A11 and A22 component through thickness of the parts.
Figure 55. DSM Plaque used for validation analysis.
FIBER ORIENTATION (3D) SOLVER VALIDATION
50
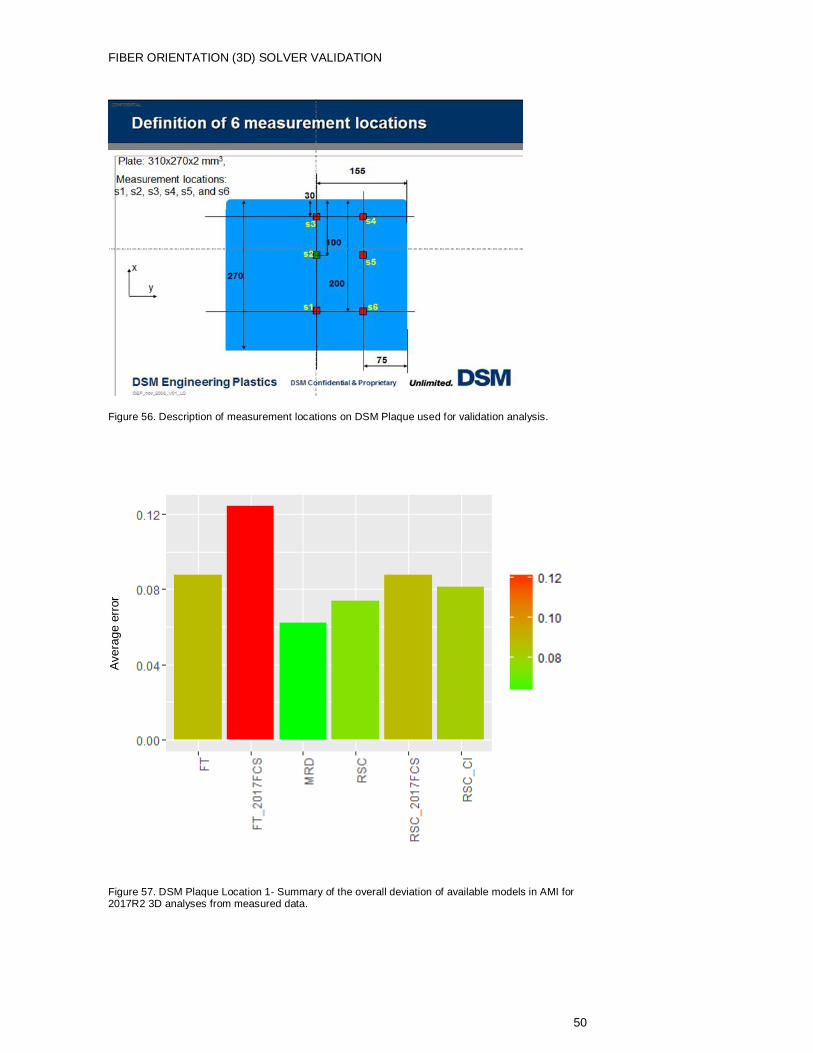
Figure 56. Description of measurement locations on DSM Plaque used for validation analysis.
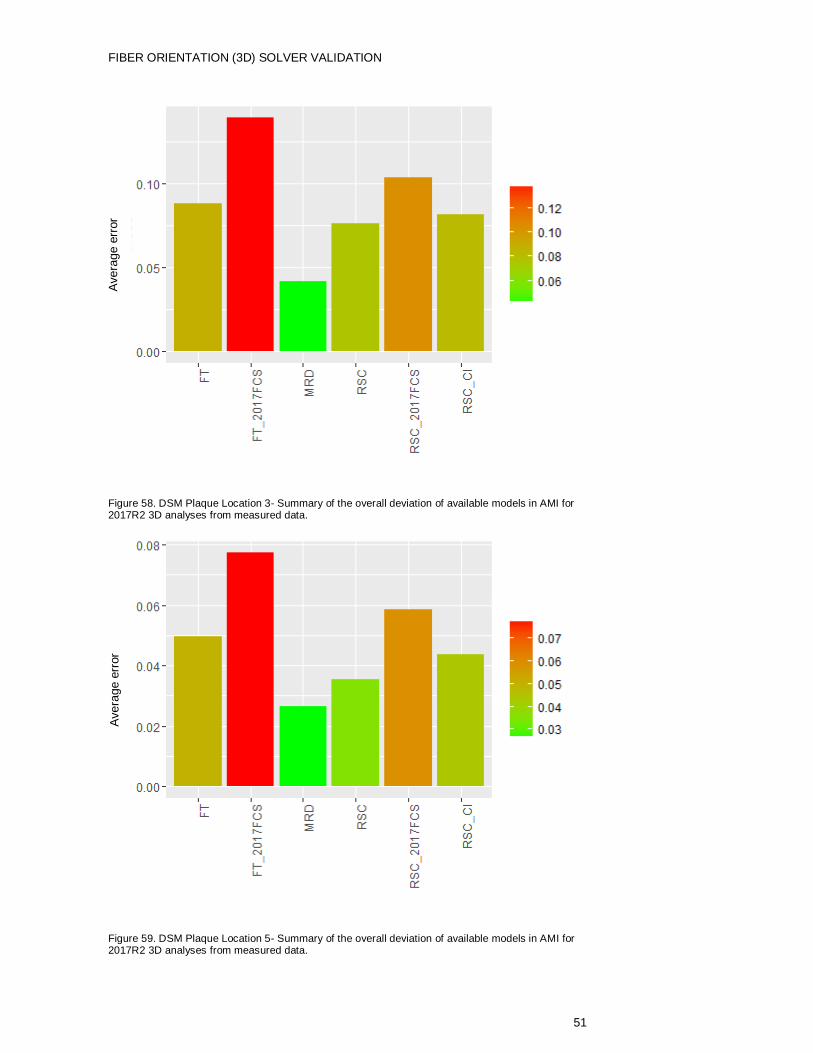
Figure 57. DSM Plaque Location 1- Summary of the overall deviation of available models in AMI for 2017R2 3D analyses from measured data.
Avera
ge e
rror
FIBER ORIENTATION (3D) SOLVER VALIDATION
51
Figure 58. DSM Plaque Location 3- Summary of the overall deviation of available models in AMI for 2017R2 3D analyses from measured data.
Figure 59. DSM Plaque Location 5- Summary of the overall deviation of available models in AMI for 2017R2 3D analyses from measured data.
Avera
ge e
rror
Avera
ge e
rror
FIBER ORIENTATION (3D) SOLVER VALIDATION
52
Figure 60. DSM Plaque - summary of the overall deviation of available models in AMI for 2017R2 3D analyses from measured data
Figure 61. Fiber orientation results for DSM plaque at location S1 for AMI 2017R2 3D.
Avera
ge e
rror
FIBER ORIENTATION (3D) SOLVER VALIDATION
53
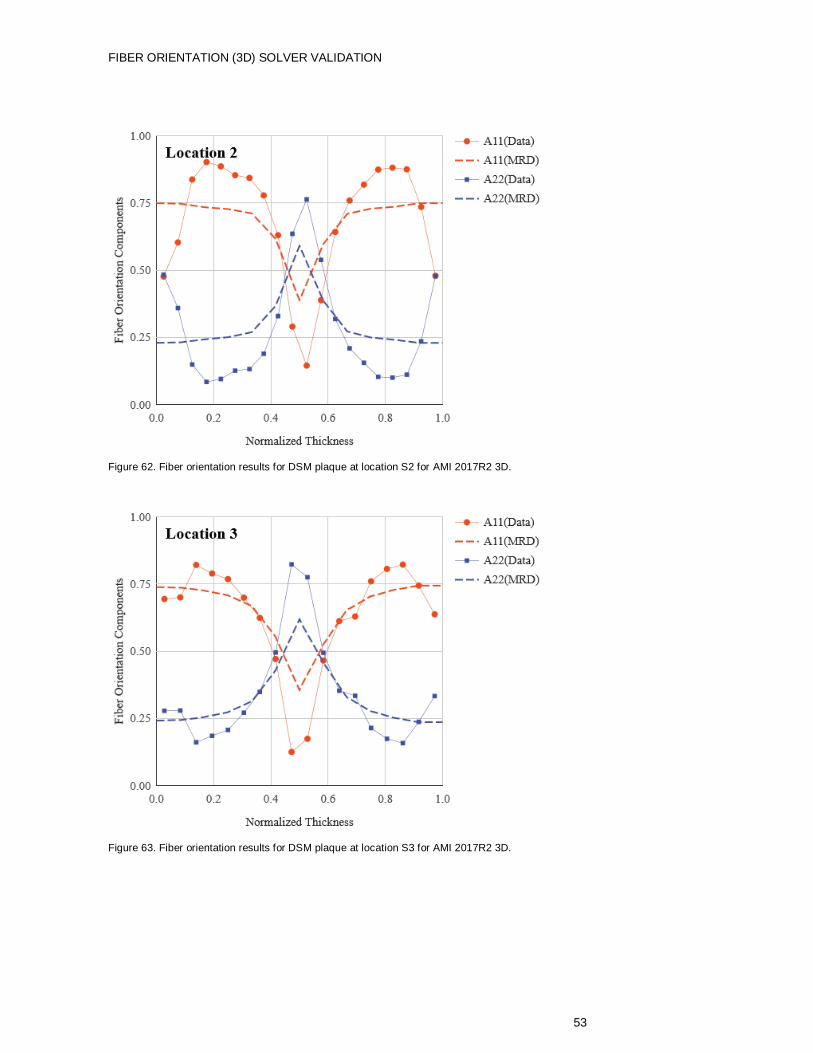
Figure 62. Fiber orientation results for DSM plaque at location S2 for AMI 2017R2 3D.
Figure 63. Fiber orientation results for DSM plaque at location S3 for AMI 2017R2 3D.
FIBER ORIENTATION (3D) SOLVER VALIDATION
54
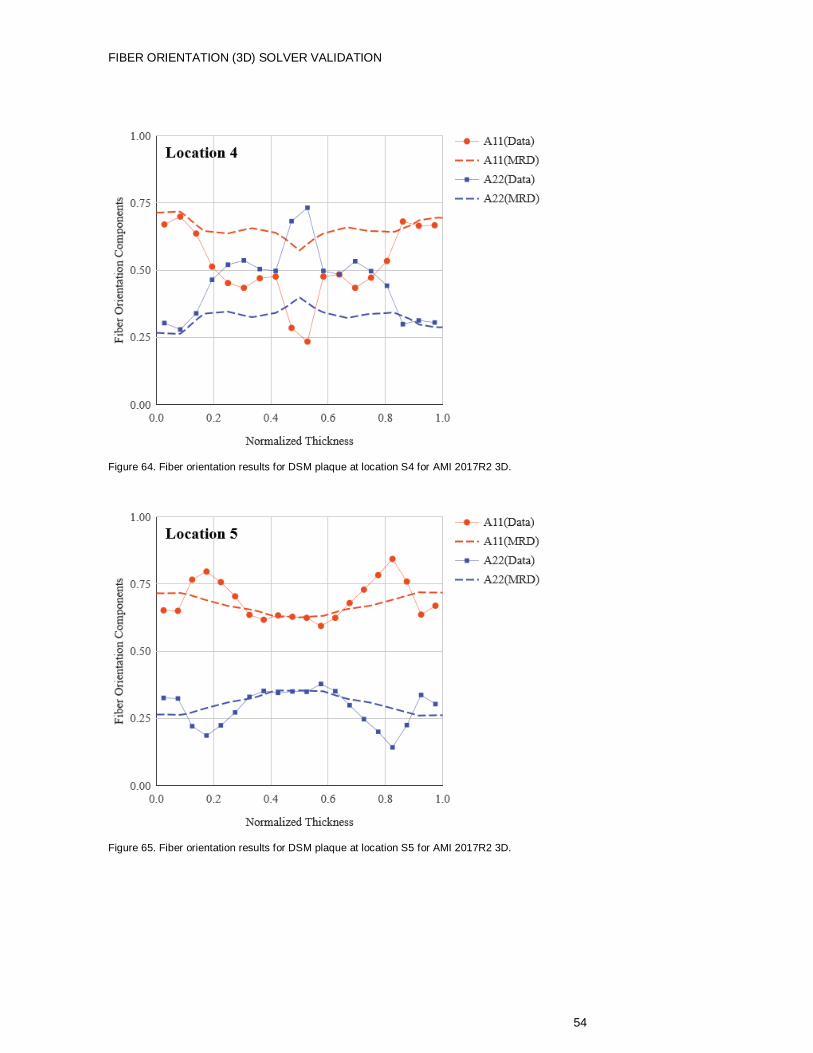
Figure 64. Fiber orientation results for DSM plaque at location S4 for AMI 2017R2 3D.
Figure 65. Fiber orientation results for DSM plaque at location S5 for AMI 2017R2 3D.
FIBER ORIENTATION (3D) SOLVER VALIDATION
55
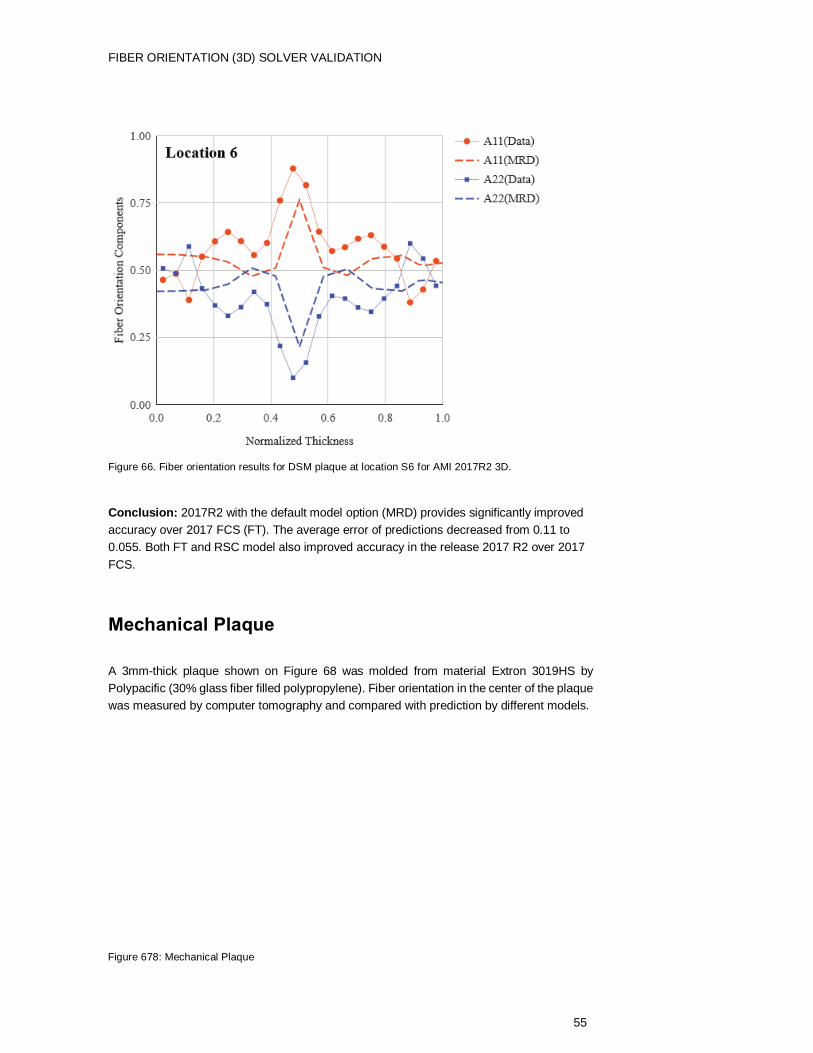
Figure 66. Fiber orientation results for DSM plaque at location S6 for AMI 2017R2 3D.
Conclusion: 2017R2 with the default model option (MRD) provides significantly improved
accuracy over 2017 FCS (FT). The average error of predictions decreased from 0.11 to
0.055. Both FT and RSC model also improved accuracy in the release 2017 R2 over 2017
FCS.
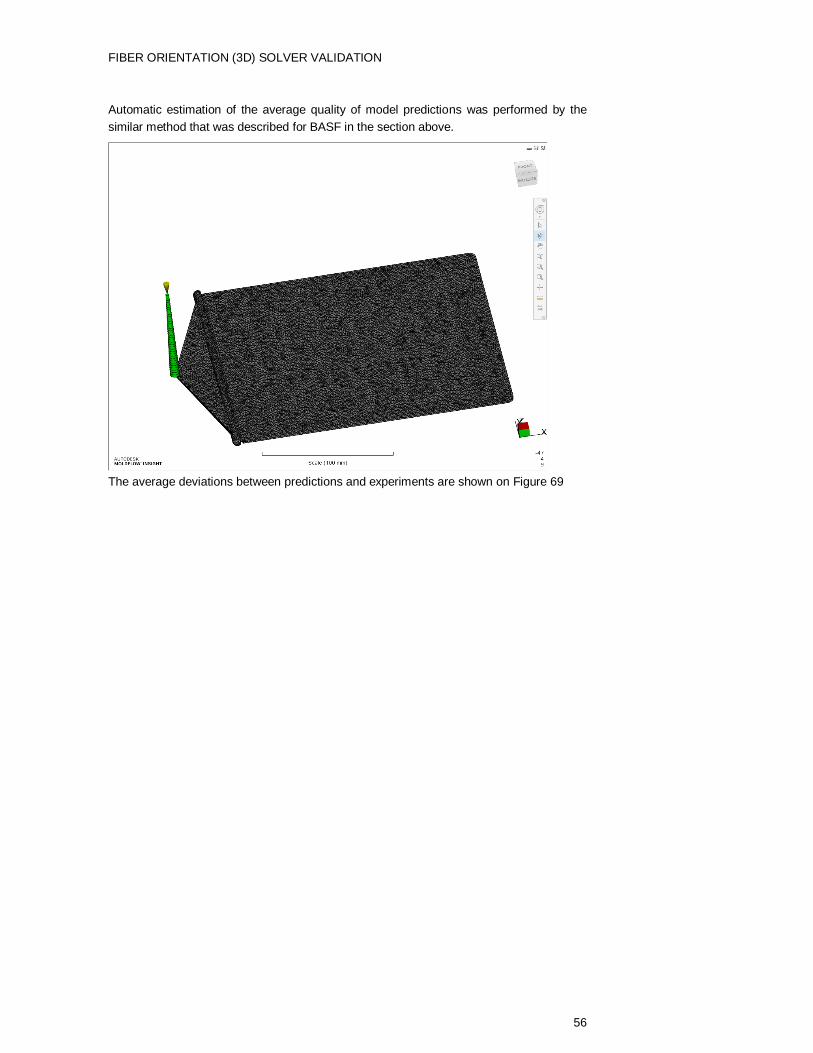
Mechanical Plaque
A 3mm-thick plaque shown on Figure 68 was molded from material Extron 3019HS by
Polypacific (30% glass fiber filled polypropylene). Fiber orientation in the center of the plaque
was measured by computer tomography and compared with prediction by different models.
Figure 678: Mechanical Plaque
FIBER ORIENTATION (3D) SOLVER VALIDATION
56
Automatic estimation of the average quality of model predictions was performed by the
similar method that was described for BASF in the section above.
The average deviations between predictions and experiments are shown on Figure 69
FIBER ORIENTATION (3D) SOLVER VALIDATION
57
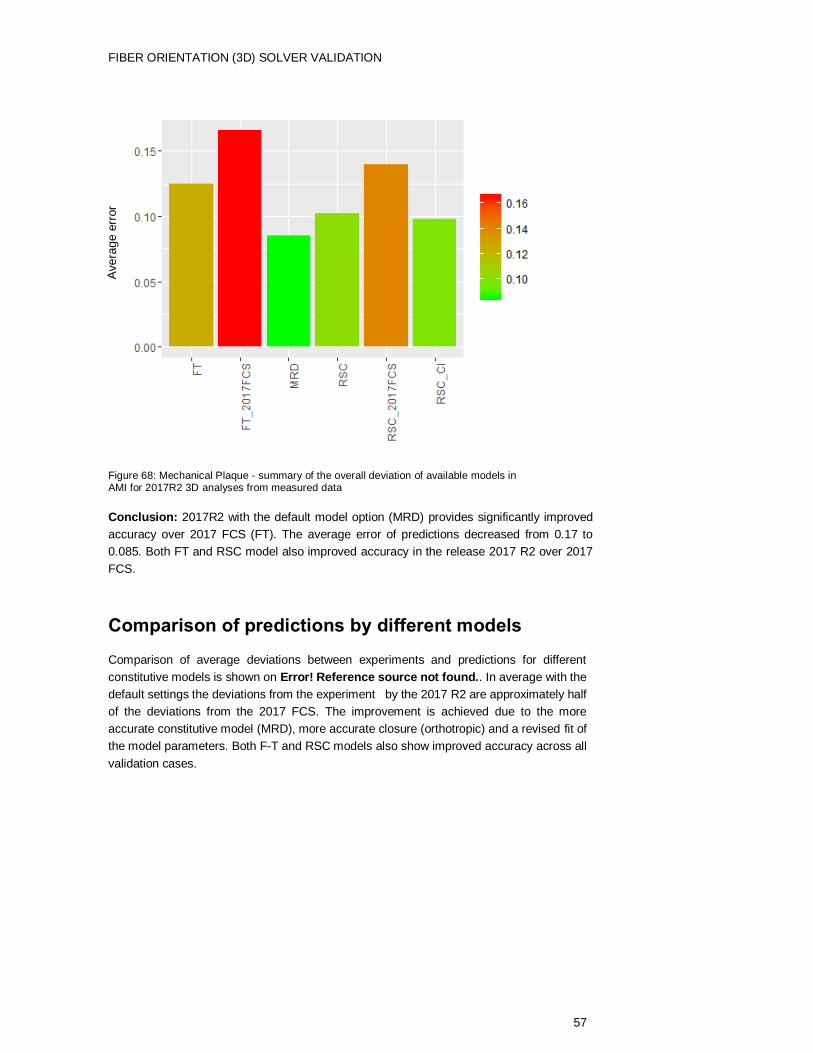
Conclusion: 2017R2 with the default model option (MRD) provides significantly improved
accuracy over 2017 FCS (FT). The average error of predictions decreased from 0.17 to
0.085. Both FT and RSC model also improved accuracy in the release 2017 R2 over 2017
FCS.
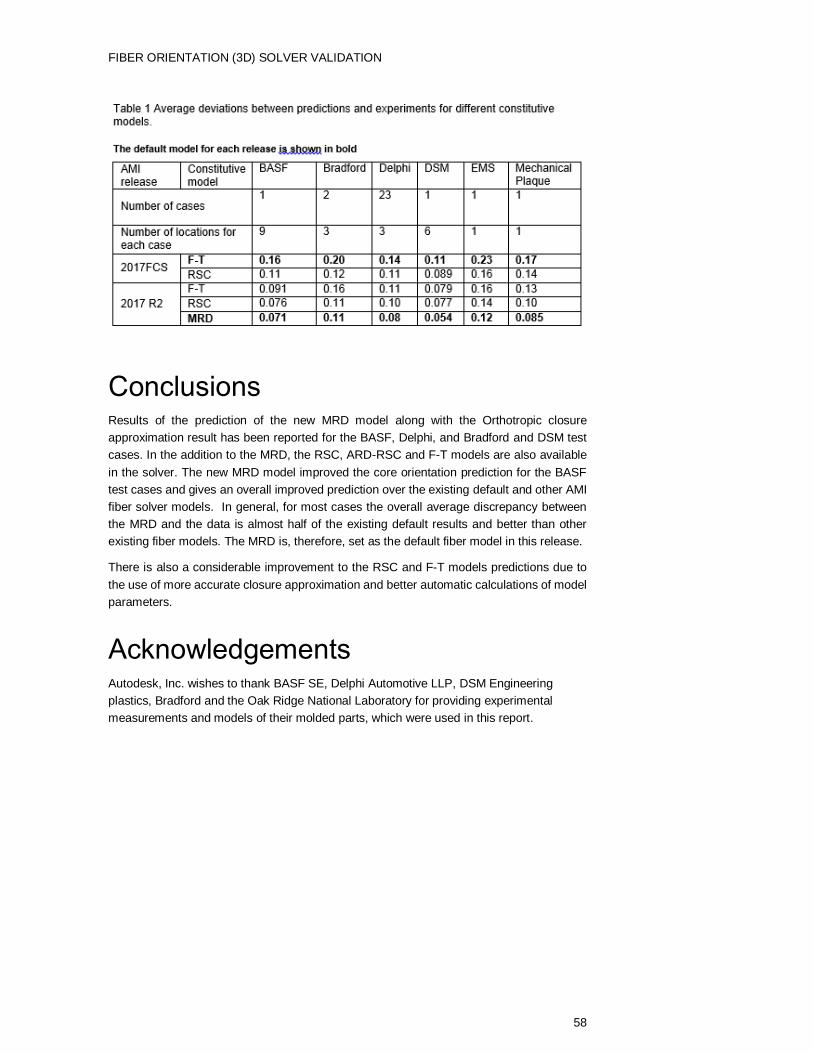
Comparison of predictions by different models
Comparison of average deviations between experiments and predictions for different
constitutive models is shown on Error! Reference source not found.. In average with the
default settings the deviations from the experiment by the 2017 R2 are approximately half
of the deviations from the 2017 FCS. The improvement is achieved due to the more
accurate constitutive model (MRD), more accurate closure (orthotropic) and a revised fit of
the model parameters. Both F-T and RSC models also show improved accuracy across all
validation cases.
Figure 68: Mechanical Plaque - summary of the overall deviation of available models in AMI for 2017R2 3D analyses from measured data
Avera
ge e
rror
FIBER ORIENTATION (3D) SOLVER VALIDATION
58
Conclusions Results of the prediction of the new MRD model along with the Orthotropic closure
approximation result has been reported for the BASF, Delphi, and Bradford and DSM test
cases. In the addition to the MRD, the RSC, ARD-RSC and F-T models are also available
in the solver. The new MRD model improved the core orientation prediction for the BASF
test cases and gives an overall improved prediction over the existing default and other AMI
fiber solver models. In general, for most cases the overall average discrepancy between
the MRD and the data is almost half of the existing default results and better than other
existing fiber models. The MRD is, therefore, set as the default fiber model in this release.
There is also a considerable improvement to the RSC and F-T models predictions due to
the use of more accurate closure approximation and better automatic calculations of model
parameters.
Acknowledgements Autodesk, Inc. wishes to thank BASF SE, Delphi Automotive LLP, DSM Engineering
plastics, Bradford and the Oak Ridge National Laboratory for providing experimental
measurements and models of their molded parts, which were used in this report.
FIBER ORIENTATION (3D) SOLVER VALIDATION
59
References [1] G. Jeffery," The motion of ellipsoidal particles immersed in a viscous
fluid" Proc Roy Soc London A 1923;102:161–79.
[2] R. B Bird, C. Curtiss , R. C. Armstrong, O. Hassager. Dynamics of
polymeric liquids.Kinetic theory, 2nd ed., vol. 2. New York, NY: John
Wiley & Sons, Inc. 1987.
[3] F. Folgar and C. L. Tucker III, “Orientation Behavior of Fibers in Concentrated Suspensions,” J. Reinf. Plast. Compos., vol. 3, no. 2, pp. 98–119, Apr. 1984.
[4] S. G. Advani and C. L. Tucker III, “The Use of Tensors to Describe and Predict Fiber Orientation in Short Fiber Composites,” J. Rheol., vol. 31,
no. 8, pp. 751–784, 1987.
[5] J. Wang, J. F. O’Gara, and C. L. Tucker III, “An objective model for slow orientation kinetics in concentrated fiber suspensions: Theory and rheological evidence,” J. Rheol., vol. 52, no. 5, pp. 1179–1200, 2008.
[6] C. L. Tucker III, J. Wang, and J. F. O’Gara, “Method and Article of Manufacture for Determining a Rate of Change of Orientation of a Plurality of Fibers Disposed in a Fluid,” 7,266,469, 2007.
[7] J. H. Phelps and C. L. Tucker III, “An anisotropic rotary diffusion model for fiber orientation in short- and long-fiber thermoplastics,” J. Nonnewton. Fluid Mech., vol. 156, no. 3, pp. 165–176, Feb. 2009.
[8] J. H. Phelps, “Processing-Microstructure Models For Short- And Long-Fiber Thermoplastic Composites,” Ph.D. Thesis, University of Illinois at Urbana-Champaign, 2009.
[9] B. O. Agboola, D. A. Jack, S. Montgomery-Smith, "Effectiveness of recent fiber-interaction diffusion models for orientation and the part stiffness predictions in injection molded short-fiber reinforced composites" Compos. A: Appl. Sci. Manuf., 43, 1959 (2012).
[10] J. Fox and H.S. Weisberg, "An R Companion to Applied Regression", Sage, 2011

FIBER ORIENTATION (3D) SOLVER VALIDATION
60
Autodesk and Moldflow are registered trademarks or trademarks of Autodesk, Inc., and/or its subsidiaries and/or affiliates in the USA and/or other countries. All other brand names, product names, or trademarks belong to their respective holders. Autodesk reserves the right to alter product and services offerings, and specifications and pricing at any time without notice, and is not responsible for typographical or graphical errors that may appear in this document.
© 2016 Autodesk, Inc. All rights reserved.


![Autodesk Fusion 360 Security Whitepaper Final[2]help.autodesk.com.s3.amazonaws.com/sfdcarticles/kA23A000000mg9S... · Fusion 360 provides end users with the option to use multi-factor](https://img.pdfslide.net/doc/110x75/5e1d6c3152f8d255a65df47f/autodesk-fusion-360-security-whitepaper-final2help-fusion-360-provides-end-users.jpg)