Embed Size (px)
Citation preview
Automated Interpretation of Cardiac Arrhythmias
Design and Evaluation of a Computerized Model
Lorenzo A. DiCarlo, MD, Dongping Lin, PhD, and Janice M. Jenkins, PhD
Abstract: Historically, the development of computerized models that utilize the deductive methods used by clinicians for the interpretation of cardiac arrhyth- mias have been limited by the absence of a consistently reliable means of detect- ing atria1 activation. In this study, a theoretical model was developed with a hierarchical organization of problem-solving strategies utilizing automated anal- ysis of atria1 activation from a commercially available esophageal pill electrode and ventricular activation from a simultaneously recorded surface electrocardio- graphic lead. The theoretical model was then tested in 21 patients with 1 or more of 28 distinct supraventricular and ventricular arrhythmias. Of the 641 individual cardiac cycles analyzed, 636 (99.2%) were correctly identified. The accuracy of a contextual, that is, more comprehensive, interpretation of consecu- tive cardiac cycles was 638/641 (99.5%). The following cardiac arrhythmias were identified: sinus rhythm, sinus bradycardia, atria1 premature depolariza- tions, atria1 flutter, and supraventricular tachycardias with normal and aberrant ventricular conduction, first-degree and second-degree heart block; junctional escape, junctional rhythm, idioventricular rhythm, ventricular premature depo- larization, and ventricular tachycardia with and without retrograde activation; atria1 bigeminy, atria1 trigeminy, atria1 couplets, ventricular bigeminy, ventricu- lar trigeminy, and ventricular couplets. This study represents the first computer- ized model ever developed to incorporate the morphology and timing of atria1 activation with the morphology and timing of ventricular activation for arrhyth- mia diagnosis. Such modeling appears to be capable of achieving accurate inter- pretation of spontaneous, complex clinical cardiac arrhythmias and atrioventric- ular relationships. Key words: computer-assisted diagnosis, arrhythmia, esophageal electrode.
From the Department of Electrical Engineering and Computer Science, School of Engineering, and School of Medicine, University of Michigan, Ann Arbor, the Michigan Heart and Vascular Institute, and the Cardiac Electrophysiolqgy Laboratory, St. Joseph Mercv Hospital, Ann Arbor, . Michigan.
Partially supported by a grant from the Whitaker Foundation, NSF grant Nos. ECS-835 12 15 and ECS-8506494, and a grant from the office of the Vice President for Research at the University of
The clinical interpretation of cardiac arrhythmias using surface electrocardiography requires an incor- poration of the temporal order of atria1 and ventricu- lar depolarizations with an analysis of atrioventricu- lar and ventriculoatrial relationships. Historically, the development of automated systems that utilize
Michigan. Reprint requests: Lorenzo DiCarlo, MD, Reichert He&h Build-
ing R-3003, Catherine McAuley Health Center, P.O. Box 994, Ann Arbor, MI 48 106.
such methods has had limited success. 1-9
Arrhythmia diagnosis requires the determination of individual rates and morphologies of serial atria1
53
54 Journal of Electrocardiology Vol. 26 No. 1 January 1993
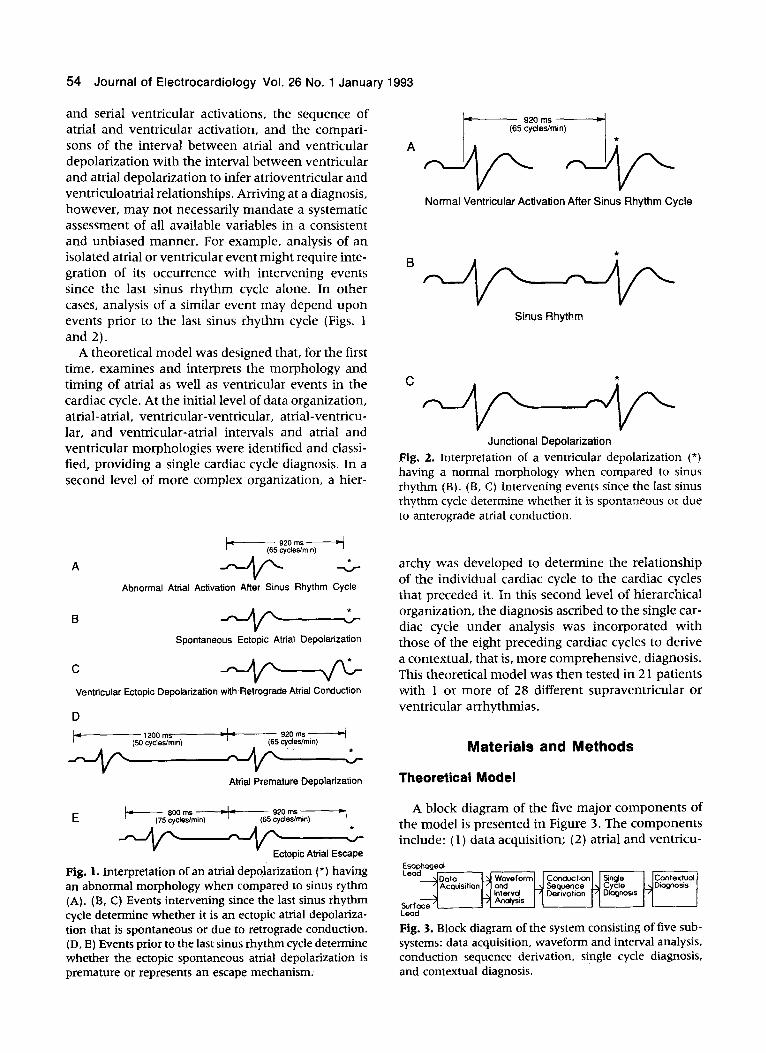
and serial ventricular activations, the sequence of atria1 and ventricular activation, and the compari- sons of the interval between atria1 and ventricular depolarization with the interval between ventricular and atria1 depolarization to infer atrioventricular and ventriculoatrial relationships. Arriving at a diagnosis, however, may not necessarily mandate a systematic assessment of all available variables in a consistent and unbiased manner. For example, analysis of an isolated atria1 or ventricular event might require inte- gration of its occurrence with intervening events since the last sinus rhythm cycle alone. In other cases, analysis of a similar event may depend upon events prior to the last sinus rhythm cycle (Figs. 1 and 2).
A theoretical model was designed that, for the first time, examines and interprets the morphology and timing of atria1 as well as ventricular events in the cardiac cycle. At the initial level of data organization, atrial-atrial, ventricular-ventricular, atrial-ventricu- lar, and ventricular-atria1 intervals and atria1 and ventricular morphologies were identified and classi- fied, providing a single cardiac cycle diagnosis. In a second level of more complex organization, a hier-
+--- 920 Ins ---J (65 cycles/mm)
A + -\;
Abnormal Atrial Activation After Sinus Rhythm Cycle
B
Spontaneous Ectopic Atrial Depolarization
C
Ventricular Ectopic Depohrization wPh Retrograde Atrial Conduction
D
P 1200 ms I_
(50 cycles/min) I- 920 ms --+
(65 cycles/min)
Atrial Premature Depolarization
I_
E I--_ 8M)ms
(75 cycletimin) ’ 92oms-4
(65 cydetimin)
Fig. 1. Interpretation of an atria1 depolarization (*) having an abnormal morphology when compared to sinus rythm (A). (B, C) Events intervening since the last sinus rhythm cycle determine whether it is an ectopic atria1 depolariza- tion that is spontaneous or due to retrograde conduction. (D, E) Events prior to the last sinus rhythm cycle determine whether the ectopic spontaneous atria! depolarization is premature or represents an escape mechanism;
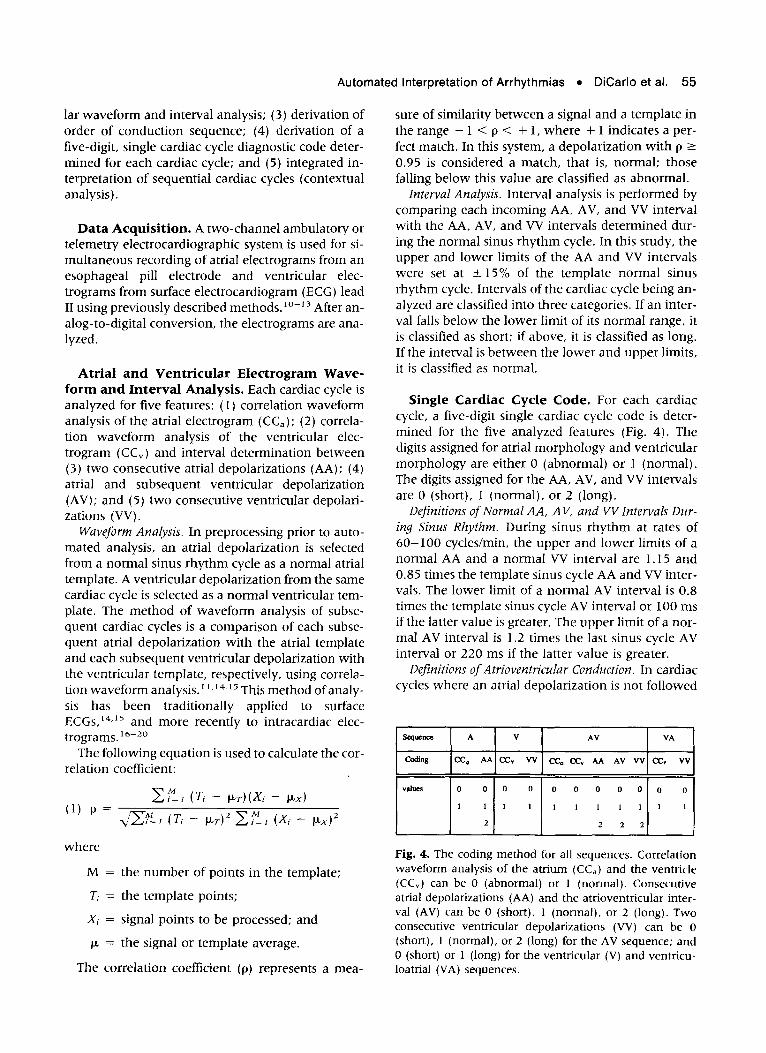
Normal Ventricular Activation After Sinus Rhythm Cycle
Sinus Rhythm
Junctional Depolarization
Fig. 2. Interpretation of a ventricular depolarization (*) having a normal morphology when compared to sinus rhythm (B). (B, C) Intervening events since the last sinus rhythm cycle determine whether it is spontaneous or due to anterograde atria1 conduction.
archy was developed to determine the relationship of the individual cardiac cycle to the cardiac cycles that preceded it. In this second level of hierarchical organization, the diagnosis ascribed to the single car- diac cycle under analysis was incorporated with those of the eight preceding cardiac cycles to derive a contextual, that is, more comprehensive, diagnosis. This theoretical model was then tested in 2 1 patients with 1 or more of 28 different supraventricular or ventricular arrhythmias.
Materials and Methods
Theoretical Model
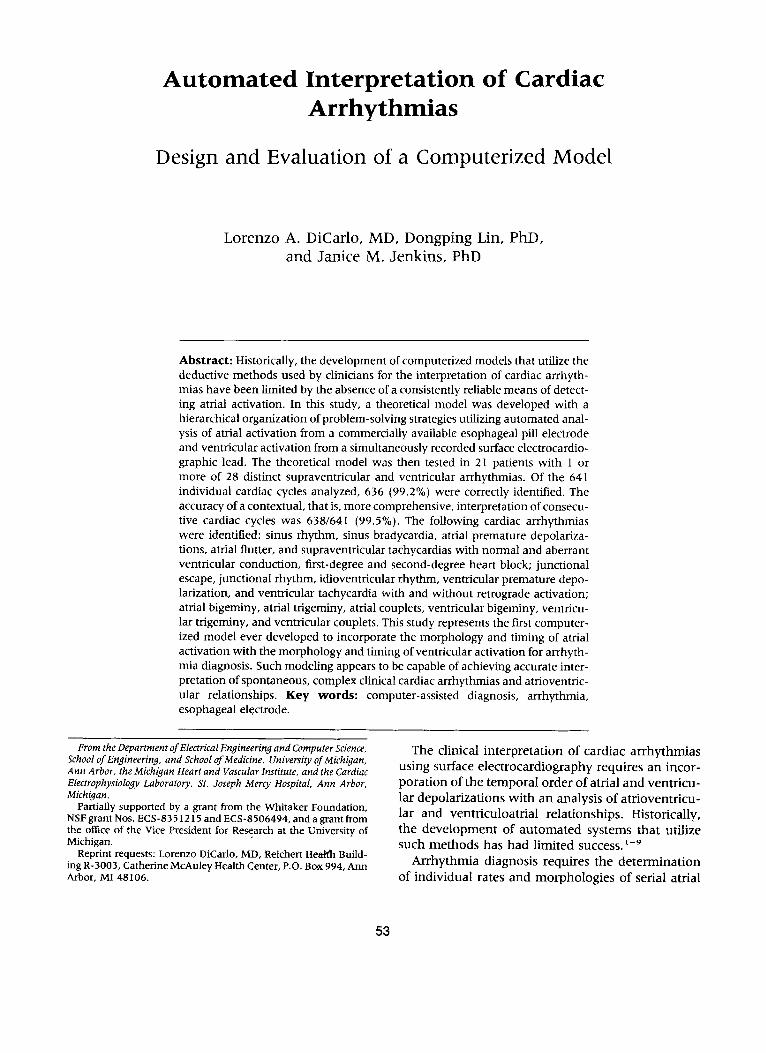
A block diagram of the five major components of the model is presented in Figure 3. The components include: ( 1) data acquisition; (2) atria1 and ventricu-
Ccxltextuol Diagnosis
Lead
Fig. 3. Block diagram of the system consisting of five sub- systems: data acquisition, waveform and interval analysis, conduction sequence derivation, single cycle diagnosis, and contextual diagnosis.
Automated Interpretation of Arrhythmias l DiCarlo et al. 55
lar waveform and interval analysis; (3) derivation of order of conduction sequence; (4) derivation of a five-digit, single cardiac cycle diagnostic code deter- mined for each cardiac cycle; and (5) integrated in- terpretation of sequential cardiac cycles (contextual analysis).
Data Acquisition. A two-channel ambulatory or telemetry electrocardiographic system is used for si- multaneous recording of atria1 electrograms from an esophageal pill electrode and ventricular elec- trograms from surface electrocardiogram (ECG) lead II using previously described methods.‘o-*3 After an- alog-to-digital conversion, the electrograms are ana- lyzed.
Atria1 and Ventricular Electrogram Wave- form and Interval Analysis. Each cardiac cycle is analyzed for five features: (1) correlation waveform analysis of the atria1 electrogram (CC,); (2) correla- tion waveform analysis of the ventricular elec- trogram (CC,) and interval determination between (3) two consecutive atria1 depolarizations (AA); (4) atria1 and subsequent ventricular depolarization (AV); and (5) two consecutive ventricular depolari- zations (VV).
Waveform Analysis. In preprocessing prior to auto- mated analysis, an atria1 depolarization is selected from a normal sinus rhythm cycle as a normal atria1 template. A ventricular depolarization from the same cardiac cycle is selected as a normal ventricular tem- plate. The method of waveform analysis of subse- quent cardiac cycles is a comparison of each subse- quent atria1 depolarization with the atria1 template and each subsequent ventricular depolarization with the ventricular template, respectively, using correla- tion waveform analysis. ’ “‘4,’ 5 This method of analy- sis has been traditionally applied to surface ECGs, 14,15 and more recently to intracardiac elec- trograms. ’ 6-20
The following equation is used to calculate the cor- relation coefficient:
where
M = the number of points in the template;
Tj = the template points;
Xi = signal points to be processed; and
p, = the signal or template average.
The correlation coefficient (p) represents a mea-
sure of similarity between a signal and a template in the range - 1 < p < + 1, where f 1 indicates a per- fect match. In this system, a depolarization with p 2 0.95 is considered a match, that is, normal; those falling below this value are classified as abnormal.
Znterval Analysis. Interval analysis is performed by comparing each incoming AA, AV, and VV interval with the AA, AV, and VV intervals determined dur- ing the normal sinus rhythm cycle. In this study, the upper and lower limits of the AA and VV intervals were set at k 15% of the template normal sinus rhythm cycle. Intervals of the cardiac cycle being an- alyzed are classified into three categories. If an inter- val falls below the lower limit of its normal range, it is classified as short; if above, it is classified as long. If the interval is between the lower and upper limits, it is classified as normal.
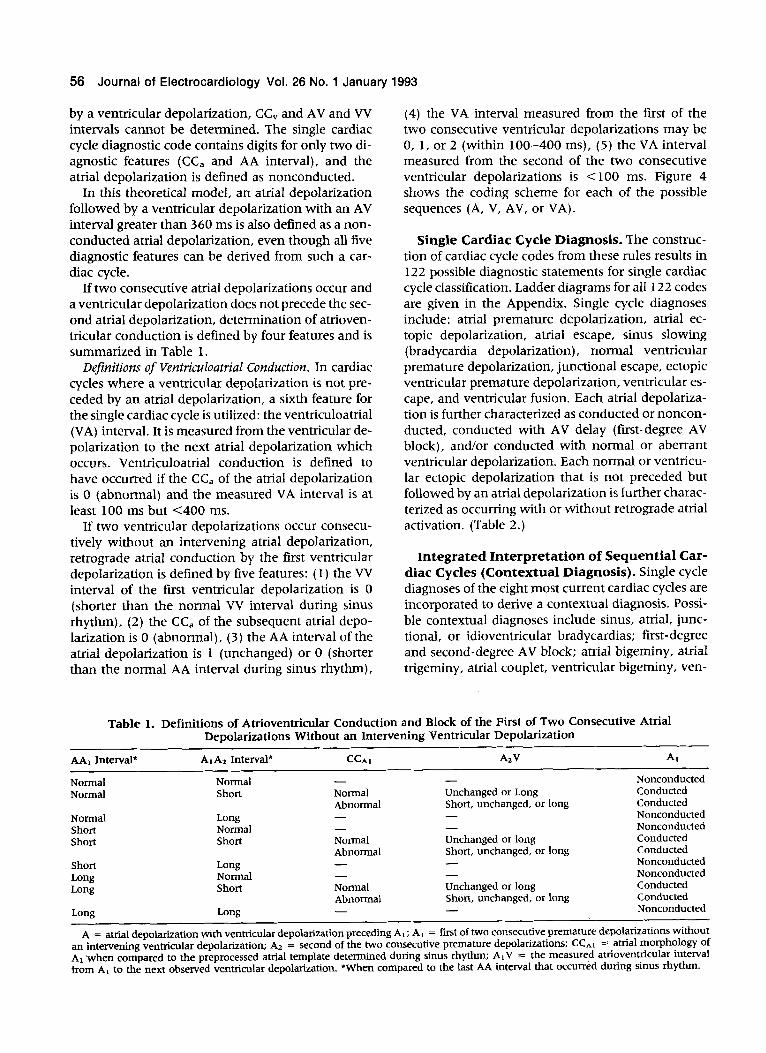
Single Cardiac Cycle Code. For each cardiac cycle, a five-digit single cardiac cycle code is deter- mined for the five analyzed features (Fig. 4). The digits assigned for atria1 morphology and ventricular morphology are either 0 (abnormal) or 1 (normal). The digits assigned for the AA, AV, and VV intervals are 0 (short), 1 (normal), or 2 (long).
Definitions of Normal AA, AV, and W Intervals Dur- ing Sinus Rhythm. During sinus rhythm at rates of 60-100 cycles/min, the upper and lower limits of a normal AA and a normal VV interval are 1.15 and 0.85 times the template sinus cycle AA and VV inter- vals. The lower limit of a normal AV interval is 0.8 times the template sinus cycle AV interval or 100 ms if the latter value is greater. The upper limit of a nor- mal AV interval is 1.2 times the last sinus cycle AV interval or 220 ms if the latter value is greater.
Definitions of Atrioventricular Conduction. In cardiac cycles where an atria1 depolarization is not followed
salm= A V
Coding cc, AA cc” w CC. cc. AA AV VV CCv VV
>,
Fig. 4. The coding method for all sequences. Correlation waveform analysis of the atrium (CC,) and the ventricle (CC,) can be 0 (abnormal) or 1 (normal). Consecutive atria1 depolarizations (AA) and the atrioventricular inter- val (AV) can be 0 (short), 1 (normal), or 2 (long). Two consecutive ventricular depolarizations (VV) can be 0 (short), 1 (normal), or 2 (long) for the AV sequence; and 0 (short) or 1 (long) for the ventricular (V) and ventricu- loatrial (VA) sequences.
56 Journal of Electrocardiology Vol. 26 No. 1 January 1993
by a ventricular depolarization, CC, and AV and W intervals cannot be determined. The single cardiac cycle diagnostic code contains digits for only two di- agnostic features (CC, and AA interval), and the atria1 depolarization is defined as nonconducted.
In this theoretical model, an atria1 depolarization followed by a ventricular depolarization with an AV interval greater than 360 ms is also defined as a non- conducted atria1 depolarization, even though all five diagnostic features can be derived from such a car- diac cycle.
If two consecutive atria1 depolarizations occur and a ventricular depolarization does not precede the sec- ond atria1 depolarization, determination of atrioven- tricular conduction is defined by four features and is summarized in Table 1.
Definitions of Ventriculoatrial Conduction. In cardiac cycles where a ventricular depolarization is not pre- ceded by an atria1 depolarization, a sixth feature for the single cardiac cycle is utilized: the ventriculoatrial (VA) interval. It is measured from the ventricular de- polarization to the next atria1 depolarization which occurs. Ventriculoatrial conduction is defined to have occurred if the CC, of the atria1 depolarization is 0 (abnormal) and the measured VA interval is at least 100 ms but <400 ms.
If two ventricular depolarizations occur consecu- tively without an intervening atria1 depolarization, retrograde atria1 conduction by the first ventricular depolarization is defined by five features: ( 1) the W interval of the first ventricular depolarization is 0 (shorter than the normal W interval during sinus rhythm), (2) the CC, of the subsequent atria1 depo- larization is 0 (abnormal), (3) the AA interval of the atria1 depolarization is 1 (unchanged) or 0 (shorter than the normal AA interval during sinus rhythm),
(4) the VA interval measured from the first of the two consecutive ventricular depolarizations may be 0, 1, or 2 (within 100-400 ms), (5) the VA interval measured from the second of the two consecutive ventricular depolarizations is < 100 ms. Figure 4 shows the coding scheme for each of the possible sequences (A, V, AV, or VA).
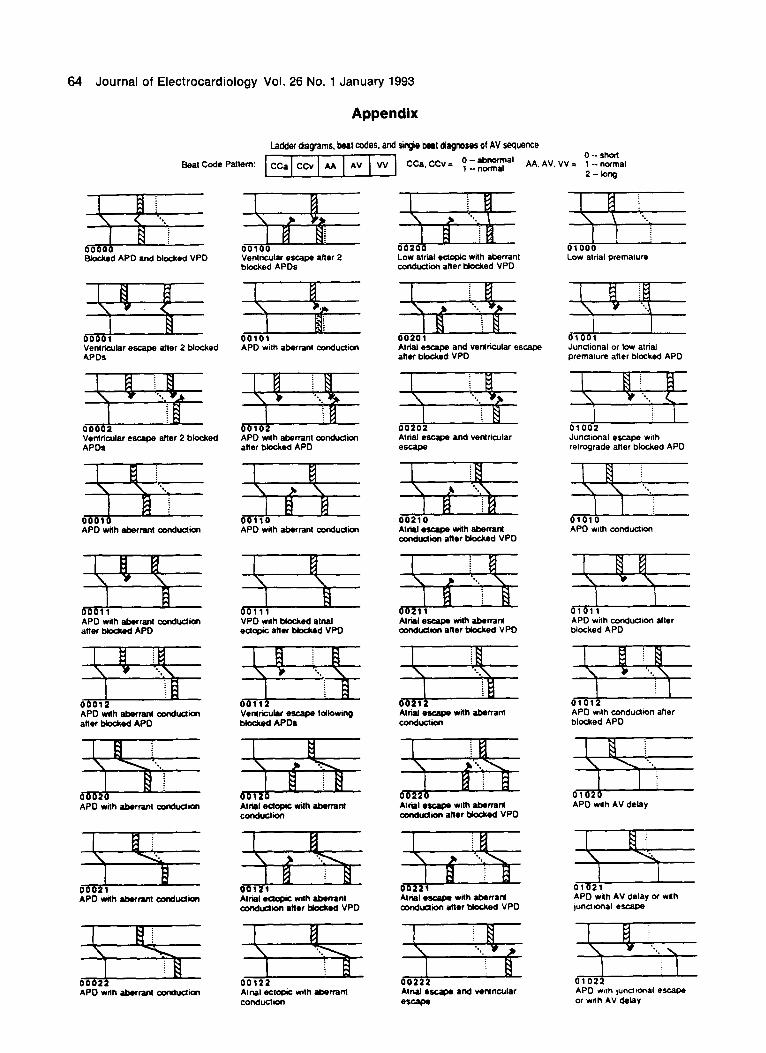
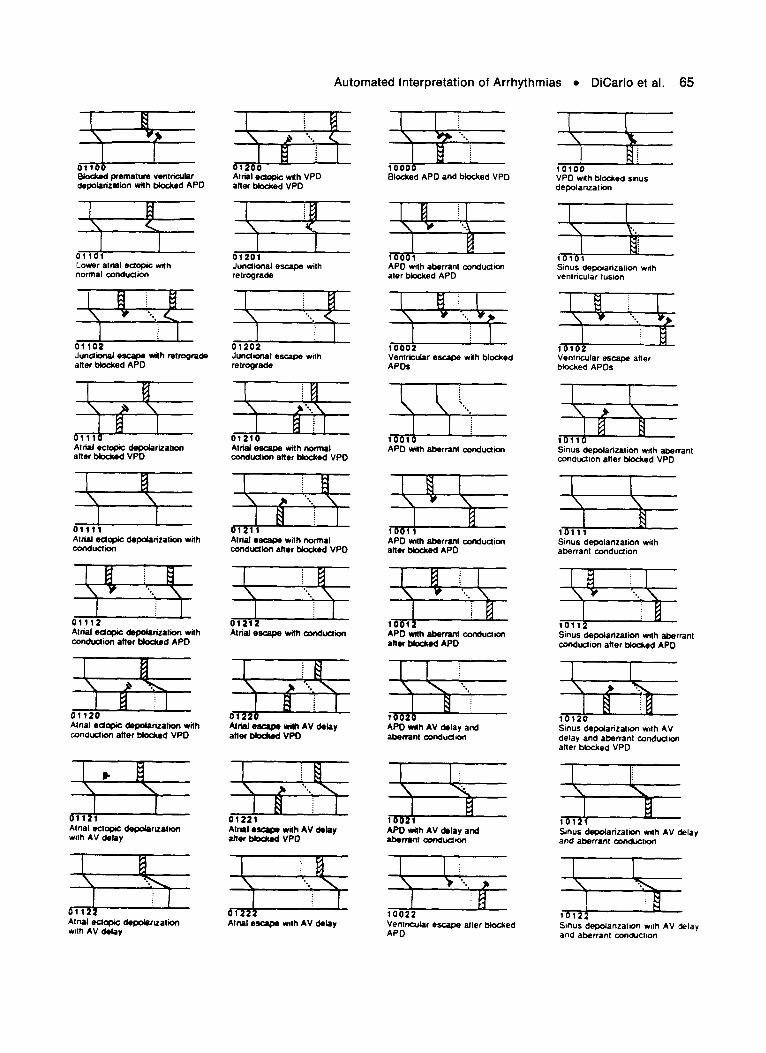
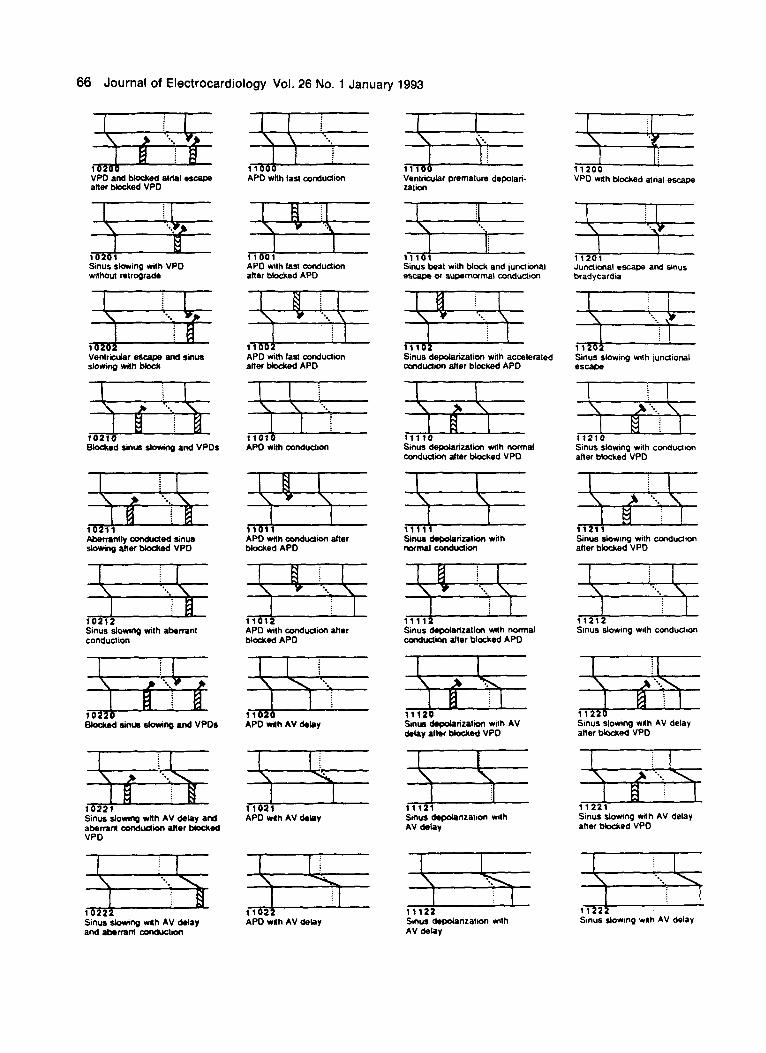
Single Cardiac Cycle Diagnosis. The construc- tion of cardiac cycle codes from these rules results in 122 possible diagnostic statements for single cardiac cycle classification. Ladder diagrams for all 122 codes are given in the Appendix. Single cycle diagnoses include: atria1 premature depolarization, atria1 ec- topic depolarization, atria1 escape, sinus slowing (bradycardia depolarization), normal ventricular premature depolarization, junctional escape, ectopic ventricular premature depolarization, ventricular es- cape, and ventricular fusion. Each atria1 depolariza- tion is further characterized as conducted or noncon- ducted, conducted with AV delay (first-degree AV block), and/or conducted with normal or aberrant ventricular depolarization. Each normal or ventricu- lar ectopic depolarization that is not preceded but followed by an atria1 depolarization is further charac- terized as occurring with or without retrograde atria1 activation. (Table 2 .)
Integrated Interpretation of Sequential Car- diac Cycles (Contextual Diagnosis). Single cycle diagnoses of the eight most current cardiac cycles are incorporated to derive a contextual diagnosis. Possi- ble contextual diagnoses include sinus, atrial, junc- tional, or idioventricular bradycardias; first-degree and second-degree AV block; atria1 bigeminy, atria1 trigeminy, atria1 couplet, ventricular bigeminy, ven-
Table 1. Definitions of Atrioventricular Conduction and Block of the First of Two Consecutive Atria1 Depolarizations Without an Intervening Ventricular Depolarization
AA, Interval* AlAl Interval* CC.41 AzV Al
Normal Normal - - Nonconducted Normal Short Normal Unchanged or Long Conducted
Abnormal Short, unchanged, or long Conducted Normal Long - - Nonconducted Short Normal - - Nonconducted Short Short Normal Unchanged or long Conducted
Abnormal Short, unchanged, or long Conducted Short Long - - Nonconducted Long Normal - - Nonconducted Long Short Normal Unchanged or long Conducted
Abnormal Short, unchanged, or long Conducted Long Long - - Nonconducted
A = atrial depolarization with ventricular depolarization preceding A,; A, = first of two consecutive premature depolarizations without an intervening ventricular depolarization; A2 = second of the two consecutive premature depolarizations; CCAr = atria1 morphology of A, ‘when compared to the preprocessed atrial template determined during sinus rhythm; ArV = the measured atrioventricular interval from A1 to the next observed ventricular depolarization. *When compared to the last AA interval that occurred during sinus rhythm.
Automated Interpretation of Arrhythmias l DiCarlo et al. 57
Table 2. Table of Single Cardiac Cycle Classes
Class Type Characteristics
1 Normal
2 Aberrant
3 AV delay 4 Blocked 5 APD
6 JP
7 VPD
8 ss
9 AE
10 JE
11 VE
12 NS
CC,, CC,, and at least two normal intervals
Sinus depolarization with aberrant conduction
Sinus depolarization with AV delay Blocked sinus depolarization Atria1 premature depolarization with or
without conduction Junctional premature depolarization with
or without retrograde Ventricular premature depolarization with
or without retrograde Sinus slowing with or without
conduction Atria1 ectopic depolarization with or
without conduction Junctional escape with or without
retrograde Ventricular escape with or without
retrograde Nonspecific abnormal depolarization
CC, = atria1 electrogram morphology; CC, = ventricular elec- trogram morphology.
tricular trigeminy, ventricular couplet, atria1 tachy- cardia, atria1 flutter, atria1 fibrillation, ventricular tachycardia, ventricular flutter, and ventricular fibril- lation.
Sustained supraventricular arrhythmias are then further characterized by their blocked or anterograde conduction pattern (1: 1, 2 : 1, 3 : 1, etc.), and sus- tained ventricular arrhythmias are characterized by the presence or absence of atria1 retrograde conduc- tion and the retrograde conduction pattern (1: 1, 2: 1, 3: 1, etc.).
To achieve this characterization four counters are employed. The first counter (AA) records the number of current sequential atria1 depolarizations with short or long AA intervals. The second counter (W) rec- ords the number of current sequential ventricular de- polarizations with short or long W intervals. The third counter (AV) records the number of atrioven- tricular activations that are recorded during a supra- ventricular bradycardia or tachycardia. The fourth counter (VA) records the number of ventriculoatrial activations detected during a ventricular bradycardia or tachycardia.
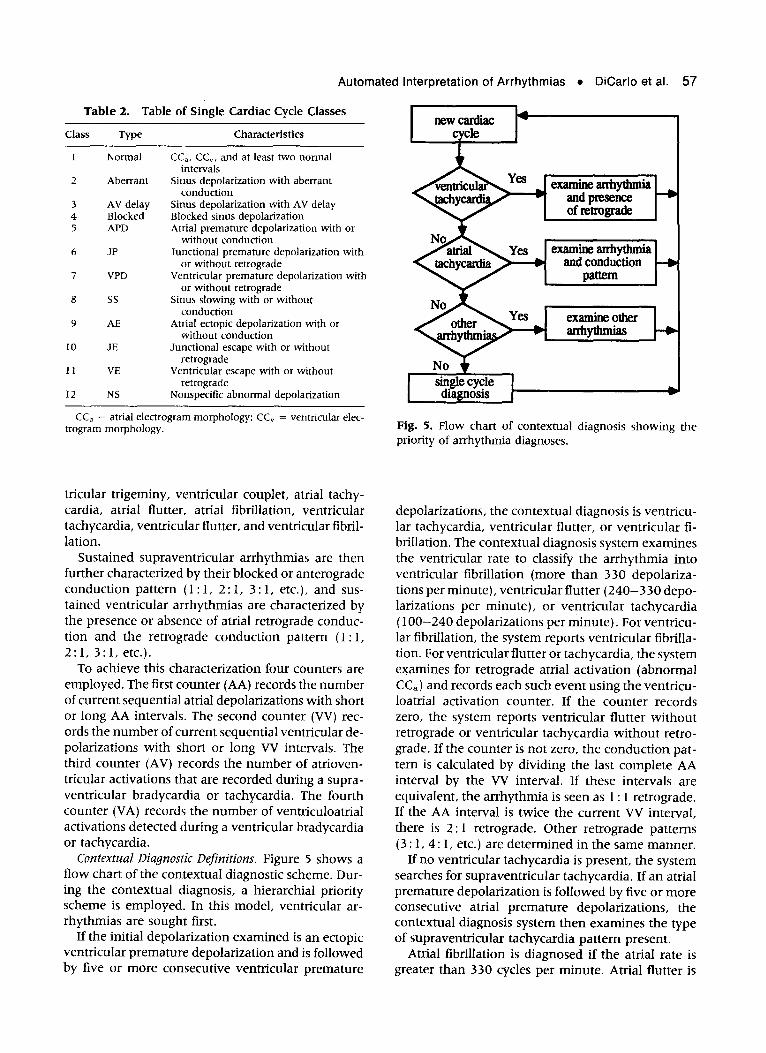
Contextual Diagnostic Definitions. Figure 5 shows a ff ow chart of the contextual diagnostic scheme. Dur- ing the contextual diagnosis, a hierarchial priority scheme is employed. In this model, ventricular ar- rhythmias are sought first.
If the initial depolarization examined is an ectopic ventricular premature depolarization and is followed by five or more consecutive ventricular premature
b
Fig. 5. Flow chart of contextual diagnosis showing the priority of arrhythmia diagnoses.
depolarizations, the contextual diagnosis is ventricu- lar tachycardia, ventricular flutter, or ventricular fi- brillation. The contextual diagnosis system examines the ventricular rate to classify the arrhythmia into ventricular fibrillation (more than 330 depolariza- tions per minute), ventricular flutter (240-330 depo- larizations per minute), or ventricular tachycardia (loo-240 depolarizations per minute). For ventricu- lar fibrillation, the system reports ventricular fibrilla- tion. For ventricular flutter or tachycardia, the system examines for retrograde atria1 activation (abnormal CC,) and records each such event using the ventricu- loatrial activation counter. If the counter records zero, the system reports ventricular flutter without retrograde or ventricular tachycardia without retro- grade. If the counter is not zero, the conduction pat- tern is calculated by dividing the last complete AA interval by the VV interval. If these intervals are equivalent, the arrhythmia is seen as 1: 1 retrograde. If the AA interval is twice the current VV interval, there is 2: 1 retrograde. Other retrograde patterns (3 : 1, 4: 1, etc.) are determined in the same manner.
If no ventricular tachycardia is present, the system searches for supraventricular tachycardia. If an atria1 premature depolarization is followed by five or more consecutive atria1 premature depolarizations, the contextual diagnosis system then examines the type of supraventricular tachycardia pattern present.
Atria1 fibrillation is diagnosed if the atria1 rate is greater than 330 cycles per minute. Atria1 flutter is
58 Journal of Electrocardiology Vol. 26 No. 1 January 1993
diagnosed if the atria1 rate is 240-3 30 cycles per min- ute. Supraventricular tachycardia is diagnosed if the atria1 rate is between 140 and 240 cycles per minute. An atria1 conduction counter indicates whether the dysrhythmia conducts to the ventricles. If so, the con- duction pattern (1: 1, 2 : 1, 3 : 1, etc.) is calculated by dividing the last complete W interval by the current AA interval. The supraventricular tachycardia and its conduction pattern (1: 1, 2 : 1, 3 : 1, etc.) is then reported.
If there is no atria1 or ventricular tachycardia, the system next examines for bradycardia. If the current depolarization is a sinus or atria1 slowing depolariza- tion and is followed by five or more such depolariza- tions in succession, the system reports a contextual diagnosis of bradycardia.
If atria1 tachycardia, ventricular tachycardia, or bradycardia is not present, the system searches for three or more consecutive ventricular or atria1 pre- mature depolarizations by checking ventricular pre- mature or atria1 premature counters. If the number in either counter exceeds two, the consecutive ven- tricular or atria1 premature depolarizations are re- ported along with the retrograde or anterograde con- duction pattern.
Bigeminal and Trigeminal Rhythms. If none of the above is detected, the system examines the last four depolarizations for atria1 and ventricular trigeminy or bigeminy. If there is an atria1 premature depolari- zation (APD) for every two normal ventricular depo- Iarizations in a repeated fashion (Norrnal-Normal- APD), the system reports atria1 trigeminy. If the last atria1 premature depolarization is conducted, a diag- nosis of atria1 trigeminy with conduction is given; otherwise, the diagnosis is atria1 trigeminy without conduction. If there is an ectopic ventricular prema- ture depolarization (VPD) for every two sinus depo- larizations in a repeated fashion (Normal-Normal- VPD), ventricular trigeminy is diagnosed. A diagnosis of ventricular trigeminy with retrograde conduction, or ventricular trigeminy without retrograde conduc- tion is reported depending on whether or not the last ventricular ectopic depolarization causes retrograde atria1 activation. Atria1 and ventricular bigeminy are diagnosed in similar fashion. Anterograde and retro- grade conduction patterns are also diagnosed for atria1 and ventricular bigeminy, respectively.
Couplets. Two consecutive atria1 premature depo- larizations or two atria1 premature depolarizations with an intervening ventricular depolarization with- out retrograde activation will elicit a diagnosis of atria1 couplet. The conduction pattern is determined by a counter that records the number of consecutive AV conductions of atria1 premature depolarizations. Atria1 couplet without conduction will be reported if the counter is zero; atria1 couplet with 1: 1 conduc-
tion if the counter is 2; and atria1 couplet with 2 : 1 conduction if the counter is 1.
Clinical Evaluation of the Theoretical Model
Data Acquisition
After obtaining informed written consent, tape recorded data were acquired from patients in a coro- nary care unit utilizing an esophageal lead and a standard surface lead II. In this study, the esophageal electrograms were recorded from a bipolar pill elec- trode (Arzco Medical Electronics, Inc., Chicago, IL) swallowed by the patient and located posterior to the left atrium.“-I3 The esophageal signal and surface lead were recorded with a bandwidth of 5-100 Hz and 0.05-100 Hz, respectively. The 5 Hz low fre- quency cut-off applied to the esophageal signal elim- inates low-frequency artifact such as respiration and cardiac motion. Recordings ( 15 minutes to 2 hours) were made from 21 patients who had 1 or more of 28 distinct arrhythmias. Data were digitized for computer processing using two-channel concurrent analog-to-digital conversion with a sampling rate of 1,000 Hz per channel. The data acquisition subsys- tem (Tecmar LabMaster, Solon, OH) was interfaced to a personal computer. A software trigger (digital differentiator) was used for P wave and QRS wave- form recognition.
A total of 29 passages, each containing 1 or more of 28 distinct arrhythmias, were tested. The pas- sages to be processed were specifically chosen to con- tain a preponderance of abnormal cardiac cycles in order to assess the robustness of the detection system. Sinus rhythm cycles constituted only 2 5% of the car- diac cycles analyzed.
Each cardiac cycle and cardiac arrhythmia was evaluated and a diagnosis was given by a clinical cardiac electrophysiologist who was blinded to the results of the computerized analysis. The results were subsequently compared.
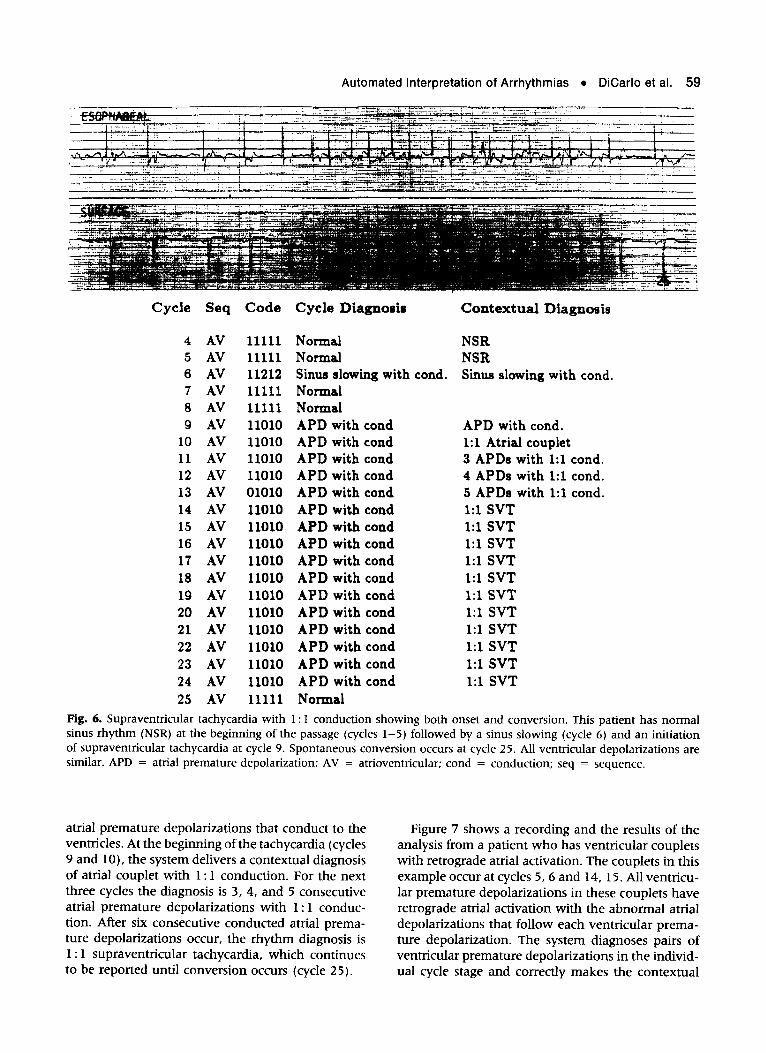
Figures 6 and 7 show two examples of computer- processed passages. Figure 6 shows a recording and the results of the analysis from a patient who has a supraventricular tachycardia with 1: 1 conduction with both onset of the tachycardia and spontaneous conversion. All ventricular depolarizations have nor- mal morphologies. Cardiac cycles 2-5 are normal. Cycle 6 has long AA and W intervals and is diag- nosed as sinus slowing. Cycles 7 and 8 revert to nor- mal. Subsequently, the patient develops a series of
Automated Interpretation of Arrhythmias l DiCarlo et al. 59
Cycle Seq
4 AV 5 AV 6 AV 7 AV 8 AV 9 AV
10 AV
11 AV 12 AV 13 AV 14 AV 15 AV 16 AV 17 AV 18 AV 19 AV 20 AV 21 AV 22 AV 23 AV 24 AV 25 AV
Code Cycle Diagnosis
11111 Normal 11111 Normal 11212 Sinus slowing with cond. 11111 Normal 11111 Normal 11010 APD with cond 11010 APD with cond 11010 APD with cond 11010 APD with cond 01010 APD with cond 11010 APD with cond 11010 APD with cond 11010 APD with cond 11010 APD with cond 11010 APD with cond 11010 APD with cond 11010 APD with cond 11010 APD with cond 11010 APD with cond 11010 APD with cond
11010 APD with cond
11111 Normal
Contextual Diagnosis
NSR NSR Sinus slowing with cond.
APD with cond. 1:l Atria1 couplet 3 APDs with 1:l cond. 4 APDs with 1:l cond. 5 APDs with 1:l cond. 1:l SVT 1:l SVT 1:l SVT 1:l SVT 1:l SVT 1:l SVT 1:l SVT 1:l SVT 1:l SVT 1:l SVT 1:l SVT
Fig. 6. Supraventricular tachycardia with 1: 1 conduction showing both onset and conversion. This patient has normal sinus rhythm (NSR) at the beginning of the passage (cycles l-5) followed by a sinus slowing (cycle 6) and an initiation of supraventricular tachycardia at cycle 9. Spontaneous conversion occurs at cycle 25. All ventricular depolarizations are similar. APD = atria1 premature depolarization; AV = atrioventricular; cond = conduction; seq = sequence.
atria1 premature depolarizations that conduct to the ventricles. At the beginning of the tachycardia (cycles 9 and lo), the system delivers a contextual diagnosis of atria1 couplet with 1: 1 conduction. For the next three cycles the diagnosis is 3, 4, and 5 consecutive atria1 premature depolarizations with 1: 1 conduc- tion. After six consecutive conducted atria1 prema- ture depolarizations occur, the rhythm diagnosis is 1: 1 supraventricular tachycardia, which continues to be reported until conversion occurs (cycle 25).
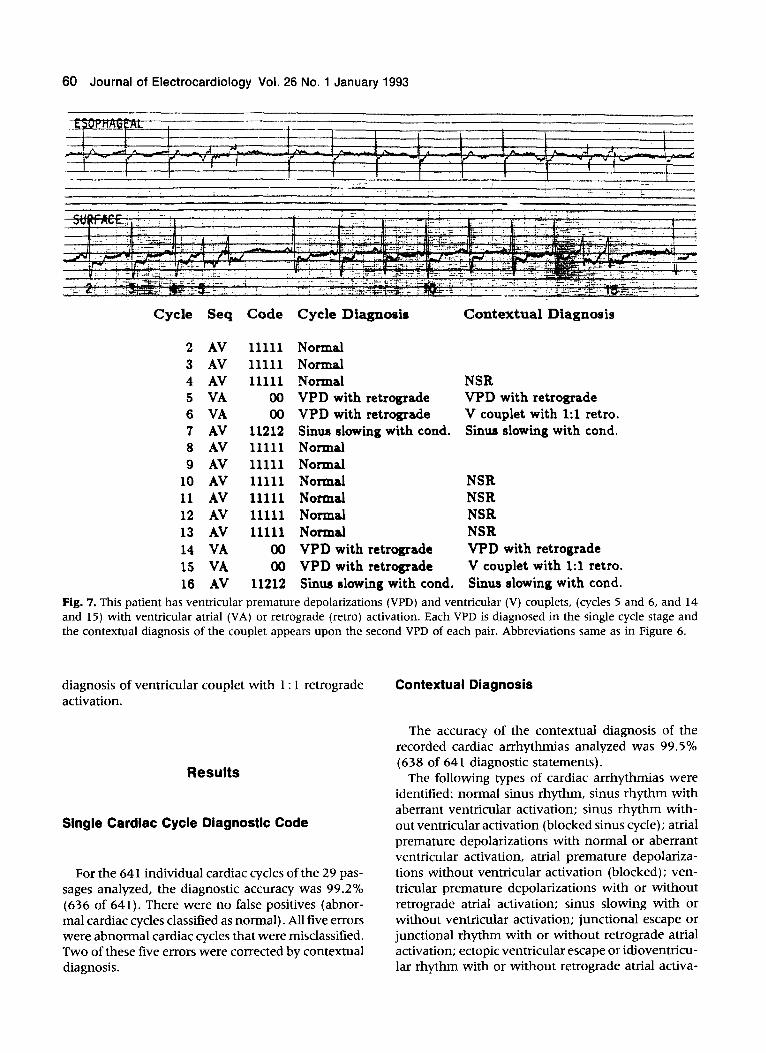
Figure 7 shows a recording and the results of the analysis from a patient who has ventricular couplets with retrograde atria1 activation. The couplets in this example occur at cycles 5,6 and 14, 15. All ventricu- lar premature depolarizations in these couplets have retrograde atria1 activation with the abnormal atria1 depolarizations that follow each ventricular prema- ture depolarization. The system diagnoses pairs of ventricular premature depolarizations in the individ- ual cycle stage and correctly makes the contextual
60 Journal of Electrocardiology Vol. 26 No. 1 January 1993
Cycle Seq Code Cycle Diagnosis Contextual Diagnosis
2 AV
3 AV
4 AV
5 VA
6 VA
7 AV
8 AV
9 AV
10 AV
11 AV
12 AV
13 AV
14 VA
15 VA
16 AV
11111 Normal
11111 Normal
11111 Normal
00 VPD with retrograde
00 VPD with retrograde
11212 Sinus slowing with cond.
11111 Normal
11111 Normal
11111 Normal
11111 Nomal
11111 Normal
11111 Normal
00 VPD with retrograde
00 VPD with retrograde 11212 Sinus slowing with cond.
NSR VPD with retrograde
V couplet with 1:l retro. Sinus slowing with cond.
NSR
NSR
NSR
NSR
VPD with retrograde
V couplet with 1:l retro. Sinus slowing with cond.
Fig. 7. This patient has ventricular premature depolarizations (VPD) and ventricular (V) couplets, (cycles 5 and 6, and 14 and 15) with ventricular atria1 (VA) or retrograde (retro) activation. Each VPD is diagnosed in the single cycle stage and the contextual diagnosis of the couplet appears upon the second VPD of each pair. Abbreviations same as in Figure 6.
diagnosis of ventricular couplet with 1: 1 retrograde activation.
Results
Single Cardiac Cycle Diagnostic Code
For the 641 individual cardiac cycles of the 29 pas- sages analyzed, the diagnostic accuracy was 99.2% (636 of 641). There were no false positives (abnor- mal cardiac cycles classified as normal). All five errors were abnormal cardiac cycles that were misclassified. Two of these five errors were corrected by contextual diagnosis.
Contextual Diagnosis
The accuracy of the contextual diagnosis of the recorded cardiac arrhythmias analyzed was 99.5% (638 of 641 diagnostic statements).
The following types of cardiac arrhythmias were identified: normal sinus rhythm, sinus rhythm with aberrant ventricular activation; sinus rhythm with- out ventricular activation (blocked sinus cycle); atria1 premature depolarizations with normal or aberrant ventricular activation, atria1 premature depolariza- tions without ventricular activation (blocked); ven- tricular premature depolarizations with or without retrograde atria1 activation; sinus slowing with or without ventricular activation; junctional escape or junctional rhythm with or without reuograde atria1 activation; ectopic ventricular escape or idioventricu- lar rhythm with or without retrograde atria1 activa-
Automated Interpretation of Arrhythmias l DiCarlo et al. 61
tion; atria1 bigeminy; atria1 trigeminy; atria1 couplets; ventricular bigeminy; ventricular trigeminy; ventric- ular couplets; ventricular tachycardia; supraventric- ular tachycardia; atria1 flutter; first-degree atrioven- tricular block; and second-degree atrioventricular block.
Discussion
The absence of a consistently reliable means of de- tecting atria1 activation using standard surface elec- trography has been one of the major obstacles to the implementation of automated methods for accurate arrhythmia diagnosis. Models developed to date
have had to rely predominantly upon changes in the timing and morphology of ventricular electrograms to infer relationships between atria1 and ventricular activation. As a result, they have had limited diag- nostic accuracy.‘-9 For example, systems used cur- rently for ambulatory, bedside, and intraoperative ECG monitoring are unable to accurately differen- tiate such elemental arrhythmias as atria1 prema- ture depolarizations, or supraventricular tachyar- rhythmias with aberrant ventricular conduction from ventricular premature depolarizations or wide-com- plex tachycardias that are ventricular in origin.
Recently, the incorporation of surface ECG with the esophageal pill electrodes for the detection of atria1 activity has been demonstrated to improve the accuracy of bedside cardiac arrhythmia interpreta-
Cycle Seq Code Cycle Diagnosis Contextual Diagnosis
2
3
4
5
6
7
8
9
10
11 12
13
14
15
16
17
18
AV VA VA VA VA VA VA VA VA VA
V VA VA VA VA
V VA
01020 APD with AV delay VPD with retrograde VPD with retrograde VPD with retrograde VPD with retrograde VPD with retrograde VPD with retrograde VPD with retrograde VPD with retograde VPD with retrograde J premature w/o retro. VPD with retrograde
VPD with retrograde VPD with retrograde VPD with retrograde J premature w/o retro. VPD with retrograde
APD with AV delay VPD with retrograde V couplet with 1:l retro. 3 VPDs with 1:l retro. 4 VPDs with 1:l retro. 5 VPDs with 1:l retro. VT with 1:l retro. VT with 1:l retro. VT with 1:l retro. VT with 1:l retro. V echo beat VT with 1:l retro.
VT with 1:l retro. VT with 1:l retro. VT with 1:l retro. V echo beat VT with 1:l retro.
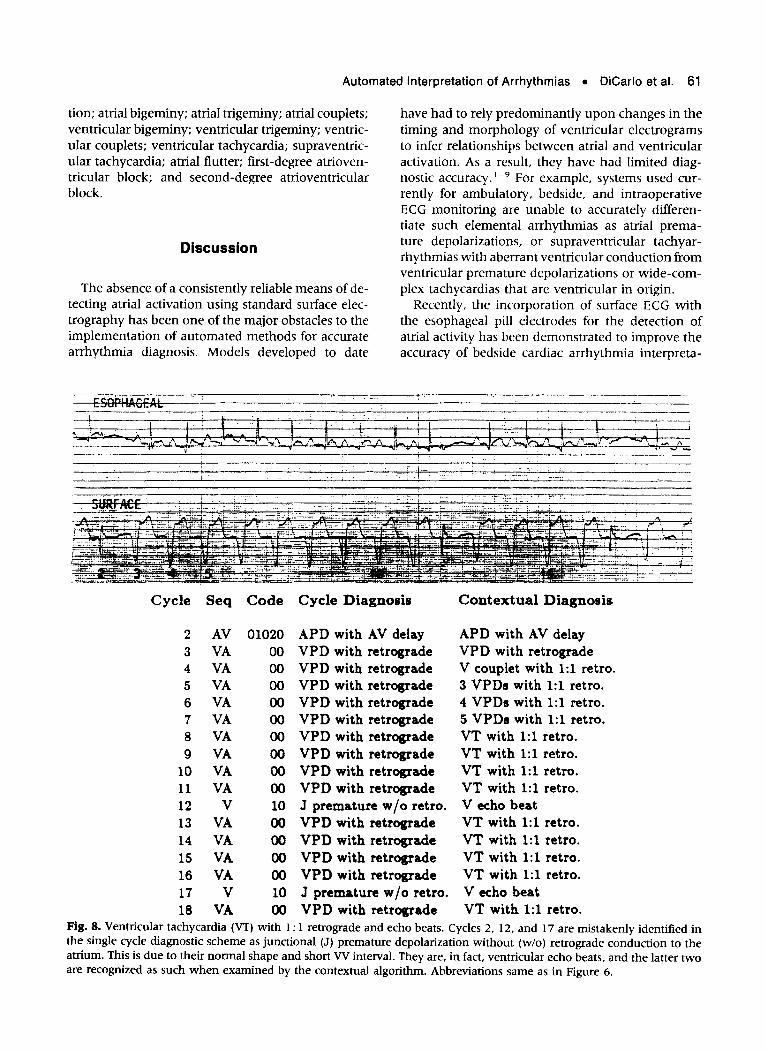
Fig. 8. Ventricular tachycardia (VT) with 1: 1 retrograde and echo beats. Cycles 2, 12, and 17 are mistakenly identified in the single cycle diagnostic scheme as junctional (J) premature depolarization without (w/o) retrograde conduction to the atrium. This is due to their normal shape and short VV interval. They are, in fact, ventricular echo beats, and the latter two are recognized as such when examined by the contextual algorithm. Abbreviations same as in Figure 6.
62 Journal of Electrocardiology Vol. 26 No. 1 January 1993
tion by clinicians.“-13 The results of this study sug- gest that the incorporation of similar data can provide a practical means of increasing the complexity and accuracy of automated ECG analysis. The addition of an esophageal atria1 signal provides an effective feature for the analysis of the morphology, as well as the timing of atria1 activation, thereby permitting the development of an artificial intelligence system for the accurate and comprehensive interpretation of in- dividual cardiac cycles and supraventricular and ven- tricular arrhythmias.
The importance of contextual diagnosis in accurate arrhythmia analysis is emphasized by one of the limi- tations of this model. The single cardiac cycle analysis of this model cannot differentiate single atria1 depo- larizations with normal or prolonged AV conduction or aberrant conduction from single atria1 depolariza- tions followed by a coincidental ventricular ectopic depolarization. There were two such cardiac cycles in a total of 641 analyzed cycles (0.3%) (Fig. 8). In addition, the single cardiac cycle diagnostic code could not detect ventricular echo beats because only the one or two most current depolarizations were considered during cardiac cycle coding. As a conse- quence, two ventricular “echo” depolarizations were misclassified as junctional depolarizations because of their proximity to the antecedent premature ventric- ular depolarization that was followed by retrograde atria1 activation. The recognition of VA activation (which was accurate) precluded the recognition of the consequent AV conduction that followed. De- spite this, the single cardiac cycle errors were cor- rected by the contextual diagnosis.
Present and Future Applications
Among the potential, practical applications of the type of model developed in this study are accurate automated interpretation of ambulatory ECG (Holter Monitor) recordings and improved automated analy- sis during intensive care or intraoperative ECG moni- toring. Prolonged monitoring with esophageal elec- trodes has already demonstrated to be feasible.21 Further improvements and implementation of analo- gous models of arrhythmia analysis into devices such as implantible antitachycardia pacemakers and auto- matic cardioverter-defibrillators might provide more reliable discrimination of ventricular tachycardia and ventricular fibrillation from other, supraventricular tachyarrhythmias, and help prevent inappropriate device-patient interactions.22-24
Among possible improvements to be made in fur-
ther models of arrhythmia analysis is the develop- ment of more streamlined analysis methods in order to decrease computational time. The possibility of de- creasing computational demands for electrogram morphology analysis while maintaining the diagnos- tic accuracy of morphologic evaluation has been re- cently demonstrated. 25,26 Further refinement of the contextual diagnosis system will be another impor- tant step in the development of efficient computer- ized dysrhythmia analysis. For example, future com- puterized modeling that incorporates strategies such as probability could increase the efftciency of the ex- isting system. By limiting the total number of hy- potheses that must be considered when individual cardiac cycles are incorporated into a contextual di- agnosis, the total number ofvariables requiring anal- ysis could also be decreased.
Acknowledgment
The authors wish to express their appreciation to Ms. Debbie Laird for preparation of the manuscript.
References
1.
2.
3.
4.
5.
6.
Pipberger HV, Fries ED, Taback L et al: Preparation of electrocardiographic data for analysis by digital elec- tronic computer. Circulation 2 1:413, 1960 Staples IF, Gustafson JE, Balm GJ et al: Computer interpretation of electrocardiograms. Am Heart J 72: 351, 1966 Banner RE, Schwetman HD: Computer diagnosis of the electrocardiogram II. Computer program for ar- rhythmia diagnosis. Comput Biomed Res 1: 366, 1968 Bonner RE, Crevasse L, Ferrer MI et al: A new com- puter program for analysis of scalar electrocardi- ograms. Comput Biomed Res 5:629, 1972 Pryor TA, Lindsay AE, England RW: Computer analy- sis of serial electrocardiograms. Comput Biomed Res 5:709, 1972 Pipberger HV, McCaughan D, Littman D et al: Clinical application of a second generation electrocardio- graphic computer program. Am J Cardiol 35:597, 1975 Geddes JS, Warner HR: A PVC detection program. Comput Biomed Res 4:493, 1971 Vetter NJ, Julian DG: Comparison of arrhythmia com- puter and conventional monitoring in coronary-care unit. Lancet 1:1151, 1975 Jenkins JM: Automated electrocardiography and ar- rhythmia monitoring. Prog Cardiovasc Dis XXV:367, 1983
Automated Interpretation of Arrhythmias l DiCarlo et al. 63
10.
11.
12.
13.
14.
15.
16.
17.
18.
Arzbaecher R: A pill electrode for the study of cardiac dysrhythmia. Medical Instrumentation, 12:277, 1978 Jenkins J, Wu D, Arzbaecher R: Computer diagnosis of supraventricular and ventricular arrhythmias. Cir- culation 60:977, 1979 Arzbaecher R, Jenkins J, Collins S et al: Atria1 electri- cal activity: the view from the esophagus. p. 314. IEEE/EMBS Conference (Frontiers of Engineering in Health Care), 1979 Lin D, Jenkins JM, DiCarlo LA: Analysis of P-wave changes on the esophageal electrogram: a two-lead arrhythmia analysis system using morphology and timing of both atria1 and ventricular activation. Com- puters in cardiology. IEEE Press, New York, 1987 Feldman CL, Amazeen PG, Klein MD et al: Computer detection of ventricular ectopic beats. Comput Biomed Res 4:666, 1971 Arzbaecher R, Biancalana P, Stibolt T et al: Computer technique for detection of cardiac dysrhythmias. Jour- nal of the Association for the Advancement of Medical Instrumentation 5: 104, 197 (Abstr) Lin D, DiCarlo LA, Jenkins JM: Identification of ven- tricular tachycardia using intracavitary ventricular electrograms: Analysis of time and frequency domain patterns. PACE 11:1592, 1988 Throne R, Jenkins J, Winston S et al: Discrimination of retrograde from anterograde atria1 actrivation using intracardiac electrogram waveform analysis. PACE 12: 1622, 1989 Throne R, DiCarlo LA, Jenkins J et al: Paroxysmal bundle branch block of supraventricular origin: a pos- sible source of misdiagnosis in detecting ventricular
tachycardia using time domain analyses of intraven- tricular electrograms. PACE 13:453, 1990
19. Finelli CJ, DiCarlo LA, Jenkins JM et al: Effects of heart rate and sympathetic tone on intraventricular electrogram morphology. Am J Cardio168: 132 1, 199 1
20. DiCarlo LA, Jenkins JM, Winston SA, Kriegler C: Dif- ferentiation of ventricular tachycardia from ventricu- lar fibrillation using intraventricular electrogram morphology. Am J Cardiol 70:820, 1992
21. Arzbaecher R, Collins S, Jenkins J et al: Feasibility of long-term esophageal electrocardiography in the study of transient arrhythmias. Biomed Sci Instrum 14:1, 1978
22. Manz M, Gerckens U, Luderitz B: Erroneous discharge from an implanted automatic cardioverter/delibrillator during supraventricular tachyarrhythmia-induced ventricular fibrillation. Am J Cardiol 7:343, 1986
23. Platia EV, Griffith LSC, Reid PR et al: Complications with the automatic implantable cardioverter defibrilla- tor. J Am Co1 Card 2:200, 1986 (Abstr)
24. Steinberg JS, Sugalski JS, Haratonic K: Cardiac rhythm precipitating automatic-implantable cardio- verter defibrillator discharge in outpatients. Am J Car- diol 67:95, 1991
25. DiCarlo LA, Throne RD, Jenkins JM: A time-domain analysis of intracardiac analysis electrograms for ar- rhythmia detection. PACE 14:329, 199 1
26. Throne RD, Jenkins JM, DiCarlo LA: A comparison of four new time-domain techniques for discriminating ventricular tachycardia from sinus rhythm using ven- tricular waveform morphology. IEEE Trans Biomed Eng 38:561, 1991
64 Journal of Electrocardiology
Beat Code Pattern:
Vol. 26 No. 1 January 1993
Appendix
ladder diagrams, beat codes, and single beat diagnoses of AV sequence 0--ShCll
CCa CCv AA AV W CCa CCv = y 1 f$sa’ * AA. AV. VV I 1 - normal P-long
R~ Blocked APD and blocked VP0
‘W 01000 Low atria1 premature Low atria1 eclcpic with aberrant
condudion alter Mocked VPD Ventricular escape alter 2 blockad APDs
OOlOl APD with aberrant conduclicn Junclional or low atrial
premalure alter blocked APD Ventricular eacapa aher 2 blocked APDs
**.
B 00 02 Venlricular escape after 2 blocked APDs
i *.
E 0 1 APD wilh aberrant condudian
Atrial escape and VBtWiC~lar es- alter blocked VPD
z= ‘a._
Alrial escape and ver’ericular escape
m 00102 __ _- APD with aberrant conduclicn alter btocked APD
1 I
01002 Juncucnal escape with retrograde aller blocked APD
S 0 110 APD with aberrant condudicn
m 00210
1 01010 APO wnh conduclion AlMl earape with aberrati
ccnduaion aller blocked VP0
s= 1 11 APD wllh conducllon aher blocked APD
z= 111 VPD wdh blocked atria1 edcpic alter bIc&ed VP0
# go01 1 APD with aberrant condudion aher M APD
Ahial escape with abenanl conduction aher Wed VP0 *-. 5= 0 1 Alrial escape wilh abenanl
**. B 0 012 01012 APO wllh conducnon aher blocked APD
APD wnh abenan wndudion Ventricular em Idlowing aller bbcked APD blocked APDs
. .
5= I Alhl edcpic wilh abarranl COMJCliOtl
AIM e- wllh abenan amdudim alter blocked VPD
Alnal eaopic wnh aberrant Amal l arxpe with aberram condudion otter b4ockad VP0 wnduamn ailer Bocked VPD
‘*.
iii= APD with aberrant conduchon APO wlh AV delay
*. 5= 0 0 1 APD tih aberranl conducl~n
01021 APD wlh AV delay or web luncnonal escape
.e e 00122 Atnal ectooic wnh &arranl Alnal e- and venlncular
escape
ZS 0 2 APD wtlh aberrant conduchon
I I
01022 APO wth ~uncncnal escape or wlh AV delay
Automated Interpretation of Arrhythmias l DiCarlo et al. 65
3= ‘*._
01 0 e 011 Blockad pemalum vanhkular de@arlralion wilh blocked APD
‘rf Lower alnal euopcc wtih normal conduclion
rm
01102 Jundimal e- wilh mfrcgmds aller Wed APO
10100 VPD wlh blocked svlus depolarizallon
Atrial eclopic wi(h VPD aller bb&d VP0
Blo&a~I APD and blocked VPD
,ie- ‘-.
Sinus depolarization wllh ventncular fusion
I I
01201 Junclkmal escape with retrograde
__. APD with aberrant corduaion alar bbcked APD
Ventricular escape afler blocked APDs
I I
01202 JuncIional escape wllh retrograde
Ventricular escape wilh blocked APDs
= 1 11 Sinus depolarization wllh aberrant conduclion aller blocked VP0
Atria1 eclapic dapdarization aller bbcked VPD
os Alnal acldapic depdatizalion wilh conduction
10010 APO with aberrant OMdudion Atrial ew with normal
condudion aller bkckad VP0
s 1 11
Slnus depolanratlon wtlh aberrant condudlon
10011 APO wilh Wrmnl conduaion abler bbxkad APO
Al&l escape wlh normal condudion alter bricked VP0
‘*. s Stnus dapolarizalion wlfh arrant wnduavm aller blodred APO
I I 01212 Alrial eacapa wilh conduclion
I I
01112 Atria1 eclopic depolarizalion with condudion aner Wed APD
I El
I w I 01120 A1ml edapic dapdarirallon with conduaton aher Moc.%sd VP0
iis ‘*.
01 Atrial B with AV delay aner bbdmd VP0
SInus depdanzallon wllh AV delay and aberrant condua~n aller blocked VPD
APO wtlh AV delay and aberrant CondudKm
I. *. oS ‘.
Alnal e- with AV delay aIIa bbdud VP0
3= 1 1 1 SInus depolanraton wllh AV delay and aberrant mn&clnrr
1I APO wdh AV dalay and abWmn1 c5flducllon
61121 I
Alnal eciqc depolaruai*x wrlh AV delay
3=
*..
11 Alnal ac10pcc depokuualton wllh AV delay
B *-. 1 Alrkal brc~po wsh AV dehy
-. e 1 1 Sinus depolanrallon wllh AV delay and aberranl conducllon
-.. l* Venlnwhr escape alter blocked APO
66 Journal of Electrocardiology Vol. 26 No. 1 January 1993
VPD and blocked ahial s atier blocked VP0
IS VPD with blocked atnal esceoa
y&J APO with last condudion Ventricular premature depolari-
zation
APD wllh last conduction aher btied APD
Sinus slowing with VPD without retrograde
Sinus beat wah block and iunciional e%oi&pe or supernormal condudion
11201 Junctional escaos and sinus bradycardia
ventricdar esaps and sinus slowing with Mock
I I
I I
11002 APD with last condudion aher blocked APD
L
11202 Sinus slowing wllh )undionaI escape
11102 Sinus depolarization wsh acceleraled ccnduchon alter blocked APD
1 I \ A,\ I w I
11110 Sinus depdarizalim vnth normal condudion alter Mocked VPD
\ ‘a.
10210 Blocked sima slowing and VPDs
I I 11010 APD with condudmn Sinus slowing with conducllon
after bbclred VP0
I fl I I I
Aberrantly Wed sinus slowing aher blocked VPD
I I
I I 11111 Sinus d@WarizaIion wilh rKmnal condlaaion
B
“_*
1111 Sinus depotanzalicn with normal conducban aller blocked APO
I I
11011 APD with conduction aher blocked APO
Sinus sJowmg wsh conducuon aher bbcked VPD
Smus slowmg wllh condudion Sinus sJowq wilh aberrant conducllon
11012 $~$A~duaion alter
$j++ APO web AV delay
-*
11120 Smu dapdarlzallon with AV delay after Wochd VPD
Sinus slowmg wlh AV delay aher blocked VP0
APO wlh AV deky Sinus JOWI~ wsh AV delay and abefrars amdudion after biockad VPD
*.
B
a.
1022 Smus slowing wsh AV delay and abenan conducbon
Smus dapdanratton wtlh AV delay
Sinus slowwtng web AV delay after bkcked VP0
t?
*-.*
1122 Smus s.Jowe-q wsh AV delay
I I 11122 Smus depolanrahon wsh AV delay
11022 APO *rlh AV Way
Automated interpretation of Arrhythmias l DiCarlo et al. 67
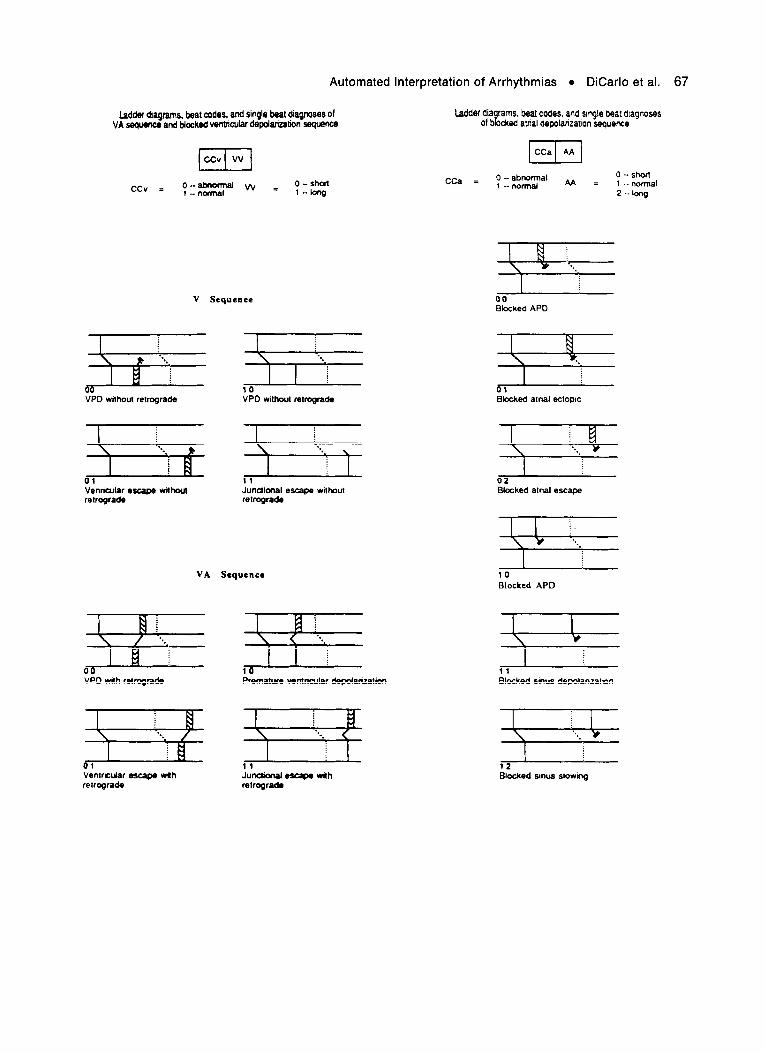
Ladder diagrams, beat c&s, and single bea diagnoses of VA sequence and blccked ventricular depolarizabn sequence
ladder dia rams, beat codes, and sqle beat dragnoses 9 Of bocked arnal depolanzation s.que~e
[CCa! AA ]
O-shod CCa = 0 0 -- -- abnormal shorl
ccv = y-=2’” w = -long
1 -- normal AA = 1 -- normal
1 2 -- long
v Sequence
VPD without retrograde
Qi- 11 Venricular escape without Jundional escape without retrograde retrograde
00 Rocked APD
J i Blocked atnal ectop~c
02 Blocked alnal escape
VA Sequence Blocked APD
VPD wllh retrograde Premature ventncular depolanzaliat
Venlr~Cular escape wlh retrograde retrograde
\ Y
11
Blocked stnus depolanzabon
12 Blocked smue slowmg