Embed Size (px)
Citation preview
Automatic Analysis ofImmunofluorescence Patternsof HEp-2 Cells
RICO HIEMANN,a,b,∗ NADJA HILGERa,∗JORG MICHEL,c,∗ JORG NITSCHKE,b ALEXANDER BOHM,b
URSULA ANDERER,c MARTIN WEIGERT,b AND ULRICH SACKa
aInstitute of Clinical Immunology and Transfusion Medicine, Universityof Leipzig, Leipzig, GermanybDepartment of Computer Science, Lausitz University of Applied Sciences,Senftenberg, GermanycDepartment of Cell Biology and Tissue Engineering, Lausitz Universityof Applied Sciences, Senftenberg, Germany
ABSTRACT: The standard screening test for the recognition of autoim-mune diseases is the proof of autoantibodies in serum of patients by indi-rect immunofluorescence (IIF) based on HEp-2 cells. Manual evaluationof this test is very subjective, slow, and there are no objective parametersas guidelines available. Interlaboratory tests showed occasionally largedeviations in the test evaluation resulting in a high variance of results.The aim of this project is fast, objective, safe, and economical automaticanalysis of HEp-2 IIF patterns. Images of IIF patterns were completelyand automatically captured using an inverse motorized fluorescence mi-croscope. Thereby, device-specific parameters were controlled automat-ically, too. For fast analysis of IIF patterns new algorithms of imageprocessing were developed. Artifacts were recognized and excluded fromanalysis by the developed software. Analysis of more than 80,000 im-ages clearly demonstrated full automatization and fast processing of IIFpatterns. Additionally serum-specific fluorescence could be easily distin-guished from background. Even very weak but positive patterns can berecognized and used for diagnosis. A detailed separation into differentbasic patterns is possible. Objective, fast, and disease-related economicalanalysis of HEp-2 immunofluorescence patterns is feasible. The imple-mented software algorithms allowed a mathematical way of describingIIF patterns and can therefore be a useful tool for the needed standard-ization process.
Address for correspondence: Rico Hiemann, University of Leipzig, Institute of Clinical Immunologyand Transfusion Medicine, Johannisallee 30, 04103 Leipzig, Germany. Voice: 49-3573-85637; fax: 49-3573-85809.
[email protected]∗Authors contributed equally to this article.
Ann. N.Y. Acad. Sci. 1109: 358–371 (2007). C© 2007 New York Academy of Sciences.doi: 10.1196/annals.1398.042
358
HIEMANN et al. 359
KEYWORDS: autoimmune diagnostics; HEp-2 cell; immunofluorescence;automatic analysis; screening
INTRODUCTION
The standard screening test for detection of autoimmune diseases in use since1978 is the indirect immunofluorescence (IIF) test.1,2 Human autoantibodies(AABs) in patient serum are detected by a specific fluorescence pattern on ahumane epithelial cell line (HEp-2).3 Manual test evaluation commonly usedin the laboratories whose read-out consists of various fluorescence patternsis, although evaluated by trained and highly qualified staff, still variable andsubjective. The screening of a large number of sera is cost-intensive and adds anot-to-be underestimated stress component for laboratory staff. Interlaboratoryround-robin tests and studies showed strong differences in diagnostic results.4
International standards for the uniform classification do not exist. Despitethese significant disadvantages, the screening test offers a series of advantages(TABLE 1).
The aim of this project was the development of an automatic analysis systemfor analyzing autoantibody derived IIF patterns using HEp-2 cells. This testsystem should allow us to perform a primary screening of AABs efficiently andto minimize existing disadvantages such as high-interlaboratory variance, aswell as simplifying labor intensive documentation and reducing the test dura-tion. Reducing the costs, a system structure was established with commerciallyavailable standard components. The analysis ends with a suggestion on theserum classification. The following hierarchical decision steps were included:
Step 1: Does a specific AAB generated fluorescence pattern exists?(positive/negative decision)
Step 2: Which basic fluorescence pattern exists?Step 3: Subclassification of the patterns.
Within the various methods of image processing, the objective, robust cap-turing, and analysis were the primary targets in automatic processing. Thismeans there was no influence of the user on the real test evaluation. Further-more, the processing should make a contribution to the objectification of theanalysis results and to improve test quality. Possibilities for the standardizationprocess were also examined.
METHODS
The structure of an automatic system requires the specific choice of suit-able technical components. The primary focus was on the visual system which
360 ANNALS OF THE NEW YORK ACADEMY OF SCIENCES
TABLE 1. Advantages and disadvantages of the indirect immunofluorescene (IIF) test4
Advantages of IIF testTest execution Simple, partial automatizingReproducibility ± 1 titerTest duration < 2 hMultiple colorings Simple to extensiveQuantification Semiquantitative (titer/units)Availability Commercial since 1978Cost of materials Low (HEp-2, rodent organs)Personnel expenditures MeanSensitivity Mean to highSpecificity Low to highDisadvantages of IIF testConjugate Mono/polyspecific, fab fragment, F/P-ratio, biotin-avidin
amplifierReaction process Open, diff. incubation periods, temperaturesQuality control High-interlaboratory varianceDocumentation Labor intensiveAntigens Variable antigen expression, loss by refurbishing, fixativeMicroscopy Lamp (burning time, light intensity), fluorochrome, media,
quenchingStandardization Low
consists of an illumination unit, filters, and optics. Central software compo-nents include image analysis, data analysis, and efficient computer algorithms.Biological components, such as the HEp-2 cells, patient sera, detecting anti-bodies, and preparing steps like cell culture, fixation, fluorescent dyes, and se-lecting an appropriate antibleaching agent were prerequisites for a high-speedand reliable automatic detection system.5,6 The influence of every componenton overall scanning result requires careful choice of every partial componentto ensure reliable results, represented in TABLE 2.
Biological System
Reproducible and defined criteria in delivering optimal HEp-2 cell prepa-rations are the basis of successful analysis of immunofluorescence patterns inantinuclear autoantibody (ANA) diagnosis. Cell density, mitoses rate, and anti-gen preservation are of crucial importance. These parameters were standard-ized. Optimal cell density was defined by the requirements of algorithms forautomatic analysis of immunofluorescence patterns. Different fixation proce-dures were applied. Fixed cells were stained with DAPI and IIF was performedusing patients sera and commercially available FITC-conjugated antibodies.6
Cell number and incubation periods were main parameters to match the re-quirements of cell density for automatic analysis. Appropriate mitotic rateswere modulated by controlling proliferation parameters (serum, medium, sub-strates). Up to 20% of cells undergoing mitosis were achieved.7

HIEMANN et al. 361
TABLE 2. Factors influencing the immunofluorescence of HEp-2 cells
BiologicalCell culture Cell density, culture techniquesPreparation Fixation proceduresAntibodies Primary (patient autoantibody) and detecting antibodyFluorescent dye Concentration, absorbing, and emitting wavelengths, bleaching
TechnicalCamera Sensitivity to fluorescence signalsLight Intensity, spectrum (laser, lamp, diodes)Microscope setting Filter, objective
Using different fixation procedures resulted in a change of IIF patterns innuclei (CENP-A, nucleolar helicase) and cytoplasm (tubulin, cytokeratins).Using formaldehyde demonstrated expected patterns, but required permeabi-lization and preparations were not suited for storage. Using alcohols alone orcombined with acids/aceton showed a loss of typical filamentous structure ofcytoskeleton elements. Nuclear antigens were more consistent in IIF patternsthan cytoplasmic ones.8,9
Technical System
Technical components consist of a microscope, camera, an illumination, anda stage. A motorization of the components was necessary for the automaticanalysis. Two inverse fully motorized microscopes were used (Nikon TE2000[Nikon Corp., Tokyo, Japan], Olympus IX81 [Olympus Corp., Tokyo, Japan]).The motorization contained Z drive, objective turret, filter wheel as well as theillumination control over filters (0%, 50%, 100%). The scanning stage of bothsystems was a Marzhauser IM120 (travel range: 120 × 102 mm; repeatability:< 1 �m; accuracy: ± 3 �m). The cameras were sensitive gray level cameras(Nikon TE2000: Hamamatsu Orca 285; Olympus IX81: Kappa DX2) with1392 (H) × 1040 (V) approx. 1.45M pixels chip (sensor: 2/3′′ Sony ICX285AL-6.45 �m [H] × 6.45 �m [V]).
The main objective was 20-fold, a frequently used one for diagnosticscreening (Nikon: CFI Planfluor ELWD 20X/0.45; Olympus: Plan Semi Apo20X/0.45 LWD). The depth of focus was approx. 2.2 �m (wavelength of 450nm) and they had a resolution of 1 �m. The scene was illuminated by a xenonlamp (75 W).
The test system and controlling equipment consist of a shuttle PC with dualcore processor and 2 GB of RAM. The extensive image data were stored on adual Xeon server connected by 1 GBit LAN.
Computer Algorithms
The principal components of the software were modules for control-ling the equipment, the software autofocus, the image analyzing algorithms

362 ANNALS OF THE NEW YORK ACADEMY OF SCIENCES
as well as methods of data analysis and classification. Implementation of im-age processing and controlling algorithms were done with the programminglanguage C++ (Visual Studio 2005; Microsoft Corp., Redmond, WA) andthe OpenMP specification which was used for automatic scaling on multi-ple processors.10 Real control of components was done by drivers which wereprovided by the hardware manufacturer. Hardware-dependent drivers were em-bedded into an abstract driver layer supporting all hardware instructions in thesoftware project. Using this uniform interface, the developed analysis softwareis compatible with all equipment manufacturers.
For image capturing, different parameters must be checked, corrected, andset: exposure time, x, y, (position of wells), and z position (focus position).
The correct exposure time of the scene was detected using the highest grayvalues in the image. They are a measure for overexposure.11 A new exposuretime for the linear sensor was set. From signal theoretical view an ideal exposuretime is set if the highest signal is below the maximum gray value of the sensorelement. Due to this automatic computing method, a constant objective imagecapturing was guaranteed regarding the image brightness.
Correct positions of detection areas in x and y direction were guaranteedby adaptable profiles in the software. Number, position, and quantity could bedefined for every slider and plate. The scanning stage could be placed correctlyusing the control commands to universal hardware drivers.
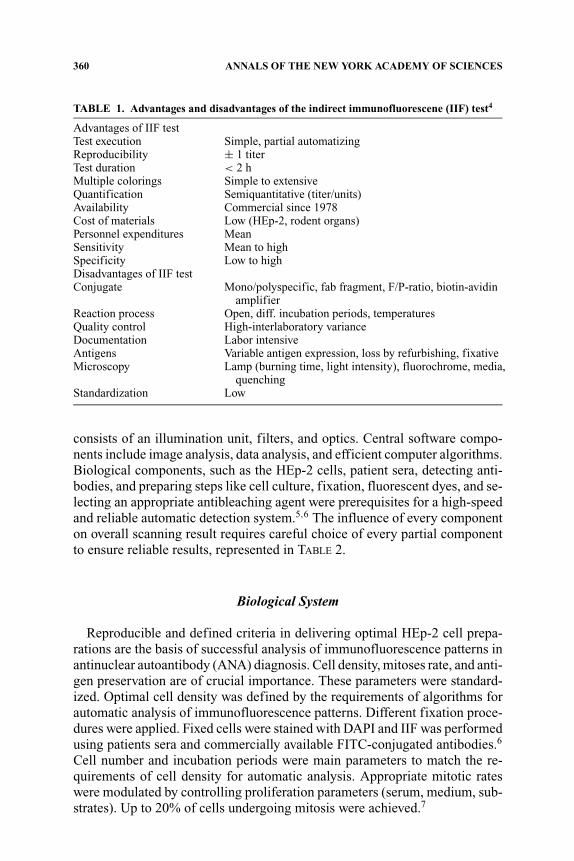
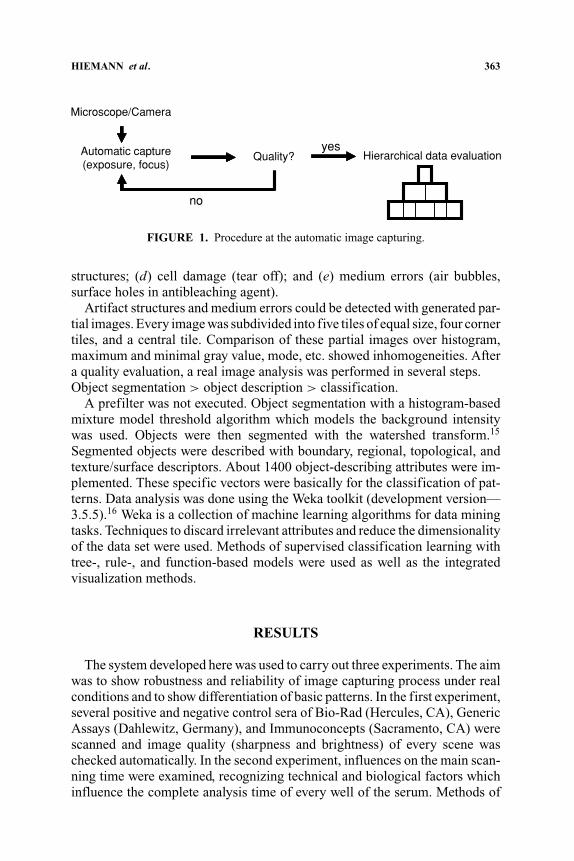
Basically high-quality images, which were captured in the focus plane, wereneeded for an image-based automatic analysis. Using a 20-fold objective, depthof focus in the z axis is very small. HEp-2 cells are shown sharply in just 1�m. An automatic focus point detecting was therefore necessary. Hardwareautofocus elements determine focus position very rapidly using a laser. How-ever, they do not evaluate the actual viewed image scene. Also they increaseinitial costs. To keep the system as compact as possible, a new software-basedautofocus was developed based on Haralick’s characterization of image con-tent by analyzing occurrences of gray level transitions.12,13 Existing softwareautofocus measures produced an insufficient quality of focus detection at flu-orescence images.14 Additionally, they are not comparable if different sceneswere analyzed. Focus function should not depend on any threshold allowingunattended operation for automated microscopy. The algorithm focus in twophases to increase the reliability and accuracy. A rough focus determines theapproximate position of the cells in rough steps (20 �m) using the variance asa focus function. After the initial raw step the fine focus determines the exactfocus position with the FHLSharpness function12 in small steps of half depthof focus of the objective (0.5 �m). Although most image data were capturedsharply, some images were not suitable for further evaluation. Before the realanalysis a qualitative analysis of the scene was performed. FIGURE 1 shows theprocess of the analysis schematically.
The quality decreasing influence factors are: (a) over- or underexposure;(b) inhomogeneous fluorescence (brightness decrease in corners); (c) artifact
HIEMANN et al. 363
Automatic capture(exposure, focus)
no
yesQuality? Hierarchical data evaluation
Microscope/Camera
FIGURE 1. Procedure at the automatic image capturing.
structures; (d) cell damage (tear off); and (e) medium errors (air bubbles,surface holes in antibleaching agent).
Artifact structures and medium errors could be detected with generated par-tial images. Every image was subdivided into five tiles of equal size, four cornertiles, and a central tile. Comparison of these partial images over histogram,maximum and minimal gray value, mode, etc. showed inhomogeneities. Aftera quality evaluation, a real image analysis was performed in several steps.Object segmentation > object description > classification.
A prefilter was not executed. Object segmentation with a histogram-basedmixture model threshold algorithm which models the background intensitywas used. Objects were then segmented with the watershed transform.15
Segmented objects were described with boundary, regional, topological, andtexture/surface descriptors. About 1400 object-describing attributes were im-plemented. These specific vectors were basically for the classification of pat-terns. Data analysis was done using the Weka toolkit (development version—3.5.5).16 Weka is a collection of machine learning algorithms for data miningtasks. Techniques to discard irrelevant attributes and reduce the dimensionalityof the data set were used. Methods of supervised classification learning withtree-, rule-, and function-based models were used as well as the integratedvisualization methods.
RESULTS
The system developed here was used to carry out three experiments. The aimwas to show robustness and reliability of image capturing process under realconditions and to show differentiation of basic patterns. In the first experiment,several positive and negative control sera of Bio-Rad (Hercules, CA), GenericAssays (Dahlewitz, Germany), and Immunoconcepts (Sacramento, CA) werescanned and image quality (sharpness and brightness) of every scene waschecked automatically. In the second experiment, influences on the main scan-ning time were examined, recognizing technical and biological factors whichinfluence the complete analysis time of every well of the serum. Methods of
364 ANNALS OF THE NEW YORK ACADEMY OF SCIENCES
pattern description were used in the last experiment to recognize the visiblefluorescence pattern. The basic patterns were17,18:
1. negative2. homogeneous (Chromatin, dsDNA, Histone, Scl70)3. nucleolar (Fibrillarin, U3 RNP, NOR90, B23, RNAP, Th/To, PM-Scl)4. speckled (mRNP, Sm, PCNA, La(SS-B), Ro(SS-A), Ku, RNAP II)5. rim (nuclear pore complex, Lamins [A, B, C], inner nuclear membrane)6. nuclear dot (Sp100, PML, SUMO)7. centromere (CENP-A, B, C)8. mitotic associated (spindle)
Special attention was set to the ratio of classification quality and speed.
Autocapture
During analysis, in a regular centered grid, 81 images per fluorescence chan-nel were captured (together 162 DAPI+FITC). Starting analysis, the focus, theexposure time, and the table position were dynamically set. After these set-tings were made an image was saved, the channel was changed, and the secondimage was captured using the same methods. Quality of images was describedand a decision for the further analysis was made.
The following exclusion criteria were defined: (a) blurred; (b) too brightbackground; (c) over- or underexposed; and (d) inhomogeneous.
During analysis, captured images were evaluated with previously describedanalysis methods. If both channels were suitable for further analysis, a realanalysis of immunofluorescence followed. For scientific analysis, an imagedatabase of 219 patient sera and different control sera with 81,500 images(DAPI+FITC) were created within 10 months.
Scanning Time
The time required to carry out an analysis is an important cost factor forfuture practical realization. Different components of the scanning system weretested and optimized to shorten the overall scanning time. Increasing of thesignal level was important for image capturing. On one hand, stronger fluo-rescence made a more sensitive analysis possible because weak signals couldalso be included. On the other hand, the recording time decreases for indi-vidual images through a shorter exposure time of the camera. For the rise ofthe signal level different filter sets of the company Chroma Optics for FITCwere compared (Chroma Technology Corp., Rockingham, VT). The standardfilter set (Chroma F31-001: emitter D 535/40, beamsplitter 505 DCLP, ex-citer D 480/30), one high-quality filter set (Chroma F41-001: emitter HQ
HIEMANN et al. 365
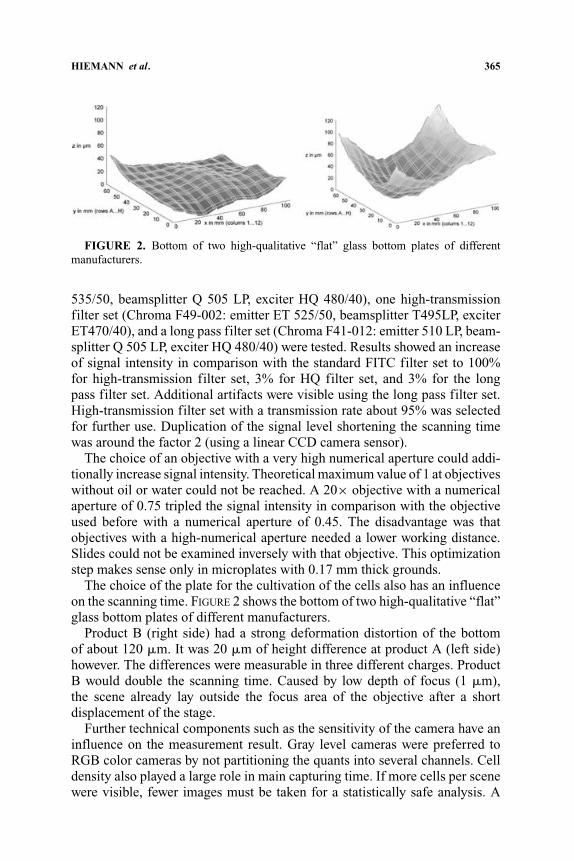
FIGURE 2. Bottom of two high-qualitative “flat” glass bottom plates of differentmanufacturers.
535/50, beamsplitter Q 505 LP, exciter HQ 480/40), one high-transmissionfilter set (Chroma F49-002: emitter ET 525/50, beamsplitter T495LP, exciterET470/40), and a long pass filter set (Chroma F41-012: emitter 510 LP, beam-splitter Q 505 LP, exciter HQ 480/40) were tested. Results showed an increaseof signal intensity in comparison with the standard FITC filter set to 100%for high-transmission filter set, 3% for HQ filter set, and 3% for the longpass filter set. Additional artifacts were visible using the long pass filter set.High-transmission filter set with a transmission rate about 95% was selectedfor further use. Duplication of the signal level shortening the scanning timewas around the factor 2 (using a linear CCD camera sensor).
The choice of an objective with a very high numerical aperture could addi-tionally increase signal intensity. Theoretical maximum value of 1 at objectiveswithout oil or water could not be reached. A 20× objective with a numericalaperture of 0.75 tripled the signal intensity in comparison with the objectiveused before with a numerical aperture of 0.45. The disadvantage was thatobjectives with a high-numerical aperture needed a lower working distance.Slides could not be examined inversely with that objective. This optimizationstep makes sense only in microplates with 0.17 mm thick grounds.
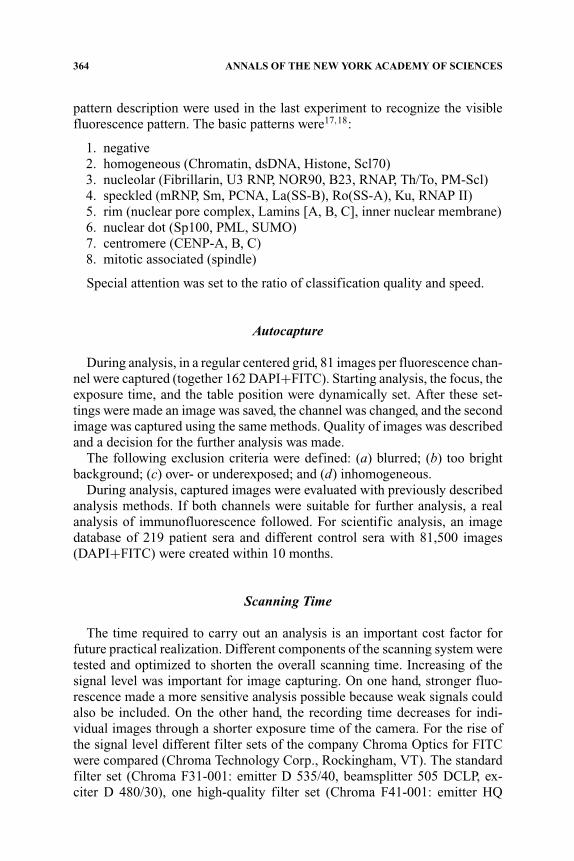
The choice of the plate for the cultivation of the cells also has an influenceon the scanning time. FIGURE 2 shows the bottom of two high-qualitative “flat”glass bottom plates of different manufacturers.
Product B (right side) had a strong deformation distortion of the bottomof about 120 �m. It was 20 �m of height difference at product A (left side)however. The differences were measurable in three different charges. ProductB would double the scanning time. Caused by low depth of focus (1 �m),the scene already lay outside the focus area of the objective after a shortdisplacement of the stage.
Further technical components such as the sensitivity of the camera have aninfluence on the measurement result. Gray level cameras were preferred toRGB color cameras by not partitioning the quants into several channels. Celldensity also played a large role in main capturing time. If more cells per scenewere visible, fewer images must be taken for a statistically safe analysis. A
366 ANNALS OF THE NEW YORK ACADEMY OF SCIENCES
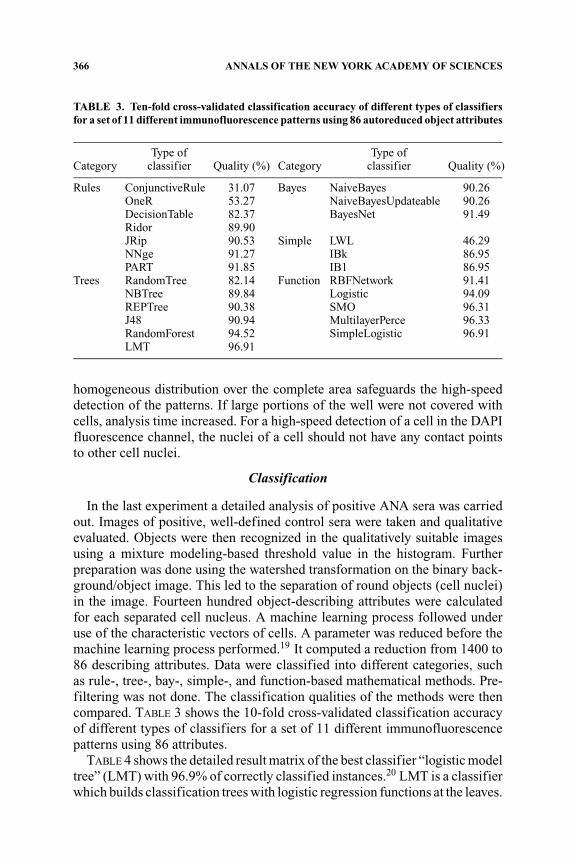
TABLE 3. Ten-fold cross-validated classification accuracy of different types of classifiersfor a set of 11 different immunofluorescence patterns using 86 autoreduced object attributes
Type of Type ofCategory classifier Quality (%) Category classifier Quality (%)
Rules ConjunctiveRule 31.07 Bayes NaiveBayes 90.26OneR 53.27 NaiveBayesUpdateable 90.26DecisionTable 82.37 BayesNet 91.49Ridor 89.90JRip 90.53 Simple LWL 46.29NNge 91.27 IBk 86.95PART 91.85 IB1 86.95
Trees RandomTree 82.14 Function RBFNetwork 91.41NBTree 89.84 Logistic 94.09REPTree 90.38 SMO 96.31J48 90.94 MultilayerPerce 96.33RandomForest 94.52 SimpleLogistic 96.91LMT 96.91
homogeneous distribution over the complete area safeguards the high-speeddetection of the patterns. If large portions of the well were not covered withcells, analysis time increased. For a high-speed detection of a cell in the DAPIfluorescence channel, the nuclei of a cell should not have any contact pointsto other cell nuclei.
Classification
In the last experiment a detailed analysis of positive ANA sera was carriedout. Images of positive, well-defined control sera were taken and qualitativeevaluated. Objects were then recognized in the qualitatively suitable imagesusing a mixture modeling-based threshold value in the histogram. Furtherpreparation was done using the watershed transformation on the binary back-ground/object image. This led to the separation of round objects (cell nuclei)in the image. Fourteen hundred object-describing attributes were calculatedfor each separated cell nucleus. A machine learning process followed underuse of the characteristic vectors of cells. A parameter was reduced before themachine learning process performed.19 It computed a reduction from 1400 to86 describing attributes. Data were classified into different categories, suchas rule-, tree-, bay-, simple-, and function-based mathematical methods. Pre-filtering was not done. The classification qualities of the methods were thencompared. TABLE 3 shows the 10-fold cross-validated classification accuracyof different types of classifiers for a set of 11 different immunofluorescencepatterns using 86 attributes.
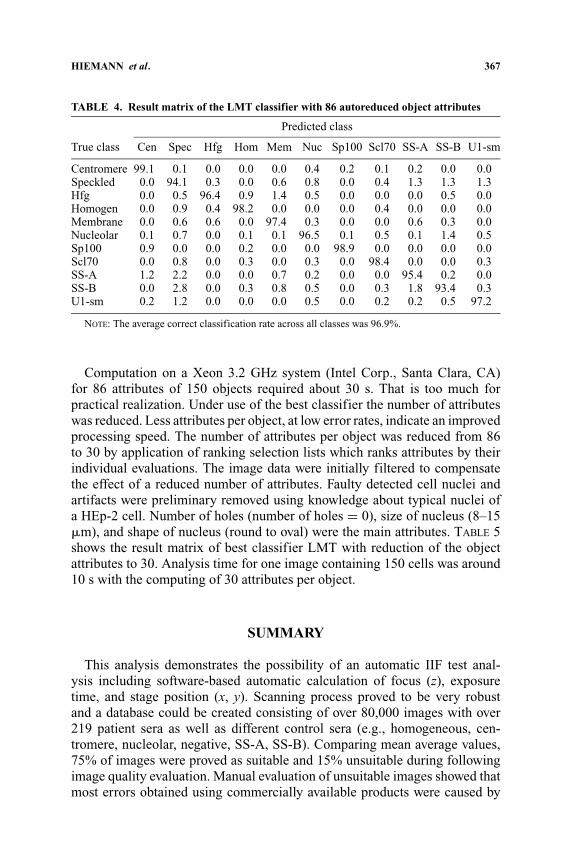
TABLE 4 shows the detailed result matrix of the best classifier “logistic modeltree” (LMT) with 96.9% of correctly classified instances.20 LMT is a classifierwhich builds classification trees with logistic regression functions at the leaves.
HIEMANN et al. 367
TABLE 4. Result matrix of the LMT classifier with 86 autoreduced object attributes
Predicted class
True class Cen Spec Hfg Hom Mem Nuc Sp100 Scl70 SS-A SS-B U1-sm
Centromere 99.1 0.1 0.0 0.0 0.0 0.4 0.2 0.1 0.2 0.0 0.0Speckled 0.0 94.1 0.3 0.0 0.6 0.8 0.0 0.4 1.3 1.3 1.3Hfg 0.0 0.5 96.4 0.9 1.4 0.5 0.0 0.0 0.0 0.5 0.0Homogen 0.0 0.9 0.4 98.2 0.0 0.0 0.0 0.4 0.0 0.0 0.0Membrane 0.0 0.6 0.6 0.0 97.4 0.3 0.0 0.0 0.6 0.3 0.0Nucleolar 0.1 0.7 0.0 0.1 0.1 96.5 0.1 0.5 0.1 1.4 0.5Sp100 0.9 0.0 0.0 0.2 0.0 0.0 98.9 0.0 0.0 0.0 0.0Scl70 0.0 0.8 0.0 0.3 0.0 0.3 0.0 98.4 0.0 0.0 0.3SS-A 1.2 2.2 0.0 0.0 0.7 0.2 0.0 0.0 95.4 0.2 0.0SS-B 0.0 2.8 0.0 0.3 0.8 0.5 0.0 0.3 1.8 93.4 0.3U1-sm 0.2 1.2 0.0 0.0 0.0 0.5 0.0 0.2 0.2 0.5 97.2
NOTE: The average correct classification rate across all classes was 96.9%.
Computation on a Xeon 3.2 GHz system (Intel Corp., Santa Clara, CA)for 86 attributes of 150 objects required about 30 s. That is too much forpractical realization. Under use of the best classifier the number of attributeswas reduced. Less attributes per object, at low error rates, indicate an improvedprocessing speed. The number of attributes per object was reduced from 86to 30 by application of ranking selection lists which ranks attributes by theirindividual evaluations. The image data were initially filtered to compensatethe effect of a reduced number of attributes. Faulty detected cell nuclei andartifacts were preliminary removed using knowledge about typical nuclei ofa HEp-2 cell. Number of holes (number of holes = 0), size of nucleus (8–15�m), and shape of nucleus (round to oval) were the main attributes. TABLE 5shows the result matrix of best classifier LMT with reduction of the objectattributes to 30. Analysis time for one image containing 150 cells was around10 s with the computing of 30 attributes per object.
SUMMARY
This analysis demonstrates the possibility of an automatic IIF test anal-ysis including software-based automatic calculation of focus (z), exposuretime, and stage position (x, y). Scanning process proved to be very robustand a database could be created consisting of over 80,000 images with over219 patient sera as well as different control sera (e.g., homogeneous, cen-tromere, nucleolar, negative, SS-A, SS-B). Comparing mean average values,75% of images were proved as suitable and 15% unsuitable during followingimage quality evaluation. Manual evaluation of unsuitable images showed thatmost errors obtained using commercially available products were caused by

368 ANNALS OF THE NEW YORK ACADEMY OF SCIENCES
TABLE 5. Prefiltering and LMT classifier with reduction of object attributes to 30
Predicted class
True class Cen Spec Hfg Hom Mem Nuc Sp100 Scl70 SS-A SS-B U1-sm
Centromere 98.3 0.6 0.0 0.0 0.0 0.3 0.1 0.0 0.6 0.0 0.0Speckled 1.0 93.6 0.2 0.0 0.5 0.5 0.2 0.5 1.7 1.2 0.7Hfg 0.5 0.0 97.8 0.5 0.0 0.0 0.0 1.1 0.0 0.0 0.0Homogen 0.0 0.5 0.0 98.4 0.0 0.0 0.0 1.1 0.0 0.0 0.0Membrane 0.4 0.4 0.8 0.0 96.8 0.0 0.0 0.0 1.6 0.0 0.0Nucleolar 0.0 0.1 0.0 0.0 0.3 98.2 0.1 0.3 0.1 0.5 0.3Sp100 0.2 0.0 0.0 0.0 0.0 0.7 98.8 0.2 0.0 0.0 0.0Scl70 0.0 0.0 0.3 0.3 0.0 0.0 0.0 99.1 0.0 0.3 0.0SS-A 0.9 2.0 0.0 0.0 0.9 0.6 0.0 0.0 95.2 0.6 0.0SS-B 0.0 2.1 0.0 0.0 0.3 0.3 0.0 0.3 1.2 95.3 0.6U1-sm 0.3 1.7 0.0 0.0 0.0 0.0 0.0 0.0 0.0 0.3 97.8
NOTE: The average correct classification rate across all classes was 97.2%.
inhomogeneous cell distributions, inhomogeneous cell labeling, and procedureartifacts, such as destroyed cells on the covered slide. Differences in handlingprocedures in laboratories and HEp-2 cell preparations from various originswith unknown quality control were another source of variation. We suggestinstallation of regulations to prepare slides with HEp-2 cells which could behelpful in reducing variations in diagnosis of autoimmune diseases betweendifferent diagnostic laboratories. It is of particular importance to validate andcarefully select the cell culture and preparation methods for offering a soundbasis for automatic analysis of IIF patterns. Additionally, the analysis timeand the sensitivity of the analysis were influenced by the choice of a suitableplate, fluorescence filter set, and objective. A particularl selection of visualcomponents made reinforcements in signal intensity possible around the factor6 (2× filter set, 3× high-numerical aperture objective). For optimization ofthe scanning system a high-transmission filter and a high-numerical apertureobjective were used.
Single scenes were very strongly influenced by local effects. An analysisof the immunofluorescence patterns was therefore possible only by capturingimages of several scenes. Two fluorescence channels were necessary for thisapproach. The nucleus of a cell was stained with DAPI for cell detection.The second channel was stained with FITC, it showed the immunoresponseof patient. The last experiment showed that the IIF test can be recognizedautomatically for certain patterns (TABLE 4).
The range of the classification qualities without the use of prefilteringreached from 31.07% to 96.91%. Imaging a mitosis rate of 5%, 100% correctclassification would be overfitting. Therefore plausible rates were around 95%.The analysis in the third experiment showed that 11 basic patterns (negative,homogeneous, nucleolar, centromere, SS-A, SS-B, Sp100, Scl-70, membrane,
HIEMANN et al. 369
homogeneous fine speckled, and U1-sm) can be distinguished successfullywith a probability of more than 95% with 30 descriptive object attributes. Ata too strong reduction on 10 attributes, similar patterns were summarized intogroups. Attributes did not suffice any more for fine separation of the patternsand the classification quality decreased to 90% per single cell. For the singlecell this discrimination quality was already good if noticed that every singlecell does not classically show the pattern and quantity variation occurs in thebiological world.
A complete decision for the patterns can be derived from a suitable com-bination of the individual object decisions. Every antinuclear pattern can beassigned to a basic group with a few characteristics. These basic groups couldbe: homogeneous, speckled, nucleolar, centromere, a few dots, membrane, andmitotic. By reduction of the attributes in the third experiment, the patterns SS-Aand SS-B were assigned to the group of speckled.
For the discrimination of more patterns more attributes must be computed.The fine distinctions of patterns, which are very much alike, require imageswith higher magnifications (40× objective) which are also common in man-ual diagnostic. Mixing patterns which occur very frequently and are seldomrecognized correctly in the routine diagnostics could be recognized using sub-patterns in different states of mitosis. The difference of the pattern specificattribute vector of reference data can give references to mixing patterns. Atypical modifications of the attribute vector can also be identified which letthemselves be seen in different titers. This must be examined in further work.Correct artificial machine learning can lead to a basic and uniform patterndivision. Certain sera can create an attribute vector representing a new goldstandard for the standardization process and allowing easy comparison withpatient sera from the routine diagnostic.
FUTURE WORK
In further analyses, systematically more of the well-known patterns willbe captured, analyzed, and archived. Cytoplasmic pattern should be included.Comparison of patients sera with some known pattern could lead to new an-tibody entities which are still unknown. The analysis of the IIF test could bestandardized with objective image capturing without human influences. Withthe help of data mining, new antibodies will hopefully be identified. Over thenext few months a free reference database will be created.
ACKNOWLEDGMENTS
We wish to thank Dr. Sonya Faber for reviewing the manuscript. This workwas supported by Federal Ministry of Education and Research (BMBF) withinthe scope of the project BioResponse.
370 ANNALS OF THE NEW YORK ACADEMY OF SCIENCES
REFERENCES
1. FRITZLER, M.J. 1992. Immunofluorescent antinuclear antibody test. In Manual ofClincal Laboratory Immunology, 4th ed. N.R. Rose, E.C. DeMacario, J.L. Fahey,H. Friedman & G.M. Penn, Eds.: 724–729. American Society for Microbiology.Washington, DC.
2. CONRAD K., J. STEINMANN, D. KABELITZ, et al. 2001. Klinische Bedeutung vonAutoantikorpern. Dtsch. Med. Wschr. 126: 1005–1010.
3. DAHLE, C., T. SKOGH, A.K. ABERG, et al. 2004. Methods of choice for diagnosticantinuclear antibody (ANA) screening. Benefit of adding antigen-specific assaysto immunofluorescence microscopy. J. Autoimmun. 22: 241–248.
4. SEELIG, H. P. 2006. Stellenwert der indirekten Immunfluoreszenz in der Au-toantikorperdiagnostik. Presented at 5. Immundiagnostisches Meeting, Dresden,March.
5. ONO, M., T. MURAKAMI, A. KUDO, et al. 2001. Quantitative comparison of anti-fading mounting media for confocal laser scanning microscopy. J. Histochem.Cytochem. 49: 305–311.
6. MICHEL, J., R. HIEMANN, et al. 2006. Impact of Cell Culture and Fixation Proce-dures for Autoantibody Laboratories Using HEp-2 cells as Diagnostic Tools inImmunofluorescence Pattern Analysis. Autoimmunity Reviews, p. 319. ElsevierB.V. Amsterdam, Boston, London.
7. MICHEL, J., R. HIEMANN, et al. 2006. Discriminating DNA fine structure of cells inmitosis by using four different DNA-specific fluorescent dyes. Cell Prolif. 39:371–372.
8. HAHM, D. & U. ANDERER. 2006. Establishment of HEp-2 cell preparation forautomated analysis of ANA fluorescence pattern. Cytometry A 69A: 178–181.
9. BRAND, F., F. MARTIN, S. PHILIPP, et al. 2005. Difference in fluorescence patternof cytoplasmic and nuclear antigens in cultivated human cells dependend on theapplied fixation procedure. Cell Prolif. 38: 205.
10. http://www.openmp.org11. HIEMANN, R., N. HILGER, U. SACK, et al. 2006. Objective quality evaluation of
fluorescence images to optimize automatic image acquisition. Cytometry A 69:182–184.
12. HIEMANN, R., J. NITSCHKE, A. BOHM, et al. 2005. A new focus algorithm forautomated microscopy. Cell Prolif. 38: 177.
13. HARALICK, R.M., K. SHANMUGAN & I. DINSTEIN. 1973. Textural features for imageclassification. IEEE Trans. Syst. Man Cybern. 3: 610–621.
14. SUN, Y., S. DUTHALER & B.J. NELSON. 2004. Autofocusing in computer mi-croscopy: selecting the optimal focus algorithm. Microsc. Res. Tech. 65: 139–149.
15. ROERDINK, J. & A. MEIJSTER. 2001. The watershed transform: definitions,algorithms and parallelization strategies. Fundam. Informaticae 41: 187–228.
16. WITTEN, I.H. & F. EIBE. 2005. Data Mining: Practical Machine Learning Tools andTechniques, 2nd ed. Morgan Kaufmann. San Fransisco, CA.
17. INVERNIZZI, P. 2006. Antinuclear antibodies: general introduction. In Autoantibod-ies, 2nd ed. Y. Shoenfeld, M.E. Gershwin & P.I. Meroni, Eds.: 135–139. Elsevier.Amsterdam.

HIEMANN et al. 371
18. HUMBEL, R.L. 2004. Autoantibodies to mitotic chromosomes and spindle appa-ratus. In Autoantigens, Autoantibodies, Autoimmunity, Vol 4. K. Conrad & U.Sack. Eds.: 228–235. Pabst Science Publishers. Lengerich, Germany.
19. HALL, M.A. 1998. Correlation-based feature selection for machine learning. PhDThesis, Department of Computer Science, Waikato University, Hamilton, NZ.
20. LANDWEHR, N., M. HALL & F. EIBE. 2005. Logistic model trees. Mach Learn. 59:161–205.