Embed Size (px)
Citation preview

1
Automatic Classification and Prediction Models for Early
Parkinson's Disease Diagnosis from SPECT Imaging
R. Prashantha,1
, Sumantra Dutta Roya, Pravat K. Mandal
b,c, and Shantanu Ghosh
d
a Department of Electrical Engineering, Indian Institute of Technology Delhi, India
b Neurospectroscopy and Neuroimaging Laboratory, National Brain Research Centre, India
c Department of Radiology, Johns Hopkins Medicine, Maryland, USA
d Martinos Center for Biomedical Imaging, Massachusetts General Hospital and Harvard
Medical School, Massachusetts, USA
Abstract
Early diagnosis of Parkinson’s Disease (PD) is crucial for effective neuroprotection and early
management. Recent neuroimaging techniques such as dopaminergic imaging using Single
Photon Emission Computed Tomography (SPECT) with 123
I-Ioflupane (DaTSCAN) have
shown to detect even early stages of the disease. In this paper, we use the Striatal Binding
Ratio (SBR) values that are calculated from the 123
I-Ioflupane SPECT scans (as obtained
from the Parkinson’s Progression Markers Initiative (PPMI) database) for developing
automatic classification and prediction/prognostic models for Early PD. We used support
vector machine (SVM) and logistic regression in the model building process. We observe that
the SVM classifier with RBF kernel produced a high accuracy of more than 96 % in
classifying subjects into Early PD and healthy Normal; and the logistic model for estimating
the risk of PD also produced high degree of fitting with statistical significance indicating its
usefulness in PD risk estimation. Hence, we infer that such models have the potential to aid
the clinicians in the PD diagnostic process.
Keywords: Computer aided Early Diagnosis, Parkinson’s Disease, Risk Prediction, Pattern
Analysis, Support Vector Machine, Logistic Regression
1. Introduction
Parkinson's disease (PD) is a severe progressive neurodegenerative disorder which is
neuropathologically characterized by the loss of dopaminergic neurons in the substantia nigra
which result in substantial reduction of dopamine content in the striatum (which is composed
of caudate nucleus and putamen, and is the main output region of the substantia nigra), and a
corresponding loss of dopamine transporters (DATs) (Booij, et al., 1997). Currently, there are
no definitive tests for the diagnosis of PD, and the clinical diagnosis is based on the presence
1 Corresponding author: Email: [email protected], Ph: +91-9891279885
Abbreviations: PD− Parkinson's disease, PPMI− Parkinson's Progression Markers Initiative, SPECT− Single
Photon Emission Computed Tomography, SVM− Support Vector Machine, SBR− Striatal Binding Ratio

2
of cardinal symptoms (tremor at rest, rigidity, bradykinesia, postural instability) and the
response of the subject to PD medications (mainly levodopa).
The clinical diagnosis is clear-cut in the advanced stage of the disease when the symptoms
are full-blown. However, in the early stages of the disease, when the symptoms are
mild/incomplete or subtle, an accurate diagnosis becomes difficult (Booij & Knol, 2007;
Cummings, et al., 2011; Sixel-Doring, Liepe, Mollenhauer, Trautmann, & Trenkwalder,
2011; Tolosa, Borght, Moreno, & Da, 2007). For instance, the Parkinson's Progression
Markers Initiative (PPMI), which is the first large-scale study to explore and identify PD
progression markers, points out that early diagnosis of de novo PD subjects, like those being
recruited for PPMI, is difficult because characteristic signs and symptoms have not yet fully
emerged and patients may present atypical signs and symptoms (PPMI Study Protocol,
http://www.ppmi-info.org/wp-content/uploads/2013/09/Attachment-4-PPMI-Protocol-AM6-
V7-FINAL-Final.pdf).
Early and accurate diagnosis of PD is crucial for several reasons: early management,
avoidance of unnecessary medical examinations and therapies and their associated financial
costs, side-effects and safety risks (Cummings, et al., 2011). Correct diagnosis is also critical
for patients being recruited for clinical trials like the PPMI study. Single Photon Emission
Computed Tomography (SPECT) with 123
I-Ioflupane (DaTSCANTM
, GE Healthcare; also
known as [123I]FP-CIT) has shown the potential to discriminate PD patients from healthy
controls by depicting the presynaptic dopaminergic deficits in the caudate and putamen, even
in the early stages of the disease and are becoming a valuable tool for the clinician
(Bairactaris, et al., 2009; Benamer, et al., 2000; Booij, et al., 1997; Seifert & Wiener, 2013;
Tolosa, et al., 2007; Winogrodzka, et al., 2001).
Diagnostic tools based on machine learning techniques such as the support vector machine
(SVM) and multivariate logistic regression (MLR), are important as they could assist the
clinician in the early diagnosis, treatment planning and monitoring of disease progression
(Orru, Pettersson-Yeo, Marquand, Sartori, & Mechelli, 2012). Both SVM as well as the MLR
are increasingly used in neuroimaging studies due to the following advantages: they allow
characterization at the individual level, rather than at group level, therefore yielding results
with a potentially high level of clinical translation; and they are multivariate and supervised
techniques which take into account characteristics of different distributed populations
encoded in complex high-dimensional feature space and use them to train the model and then,
categorize the data. SVM aims to find a hyperplane that classifies subjects into Early PD or
Normal Control. On the other hand, MLR determines the probability of subject having PD
that might be useful to classify subjects into different risk categories as studies suggest that
the SPECT imaging using 123
I-Ioflupane can also depict the progression of dopaminergic
degeneration in PD (Winogrodzka, et al., 2001).
Closely related work are that of Segovia et al. 2012, Illán et al. 2012, Rojas et al. 2013 and
Towey, Bain & Nijran 2011. Segovia et al. 2012 extracted out the voxels corresponding to
the striatum and then performed data decomposition using partial least squares followed by
3
classification into controls and Parkinsonian syndrome (PS) by means of an SVM classifier.
Illán et al. 2012 also extracted the voxels corresponding to the striatum and then performed
classification into controls and PS by using a SVM classifier with linear kernel. Rojas et al.
2013 also selected the voxels corresponding to the striatum and then carried out three
experiments. One using all features followed by classification using SVM classifier. Two
using reduced number of features through independent component analysis (ICA) followed
by classification using SVM. Third using reduced number of features through principal
component analysis (PCA) followed by classification using SVM. They observed that they
obtained the highest accuracy with PCA. Towey, Bain & Nijran 2011 used information from
all voxels to a feature extraction process through singular value decomposition followed by
classification into PS or non-PS (this study did not include controls). These studies had the
following three limitations: they used huge number of features which required effective
feature reduction techniques and such techniques may cause loss of information which may
affect in the decision making process; their data set was of limited size; and none of the
studies concentrated on prognostic or prediction models for estimating the probability of PD
in subjects that might be useful in categorizing subjects into different risk categories.
The contributions of the paper are as follows:
1. We use only four features which are the striatal binding ratio (SBR) values for each of
the four striatal regions (left and right caudate, the left and right putamen) computed
using either semi-automatic or highly accurate automated algorithms (Zubal,
Wisniewski, Marek, & Seibyl, 2011), obtained from the PPMI (Kenneth Marek, et al.,
2011) database, which is the first large-scale landmark study to identify progression
biomarkers in PD, to develop automated classification and prediction/prognostic
models which may aid the clinician in early diagnosis of the disease. We observe that
the performance of SVM classifier using RBF kernel produced an accuracy which is
higher than that obtained for the closely related works (Illan, et al., 2012; Rojas, et al.,
2013; Segovia, et al., 2012; Towey, Bain, & Nijran, 2011).
2. The sample size used for the experiments is also the highest as compared to the
related works (Illan, et al., 2012; Rojas, et al., 2013; Segovia, et al., 2012; Towey,
Bain, & Nijran, 2011) and the PPMI database which we have used is an multi-centre
international study involving subjects from different countries adding diversity in the
database which was not there in related works, thereby making the models robust.
3. This is also first time that prediction/prognostic models based on SBR features for
estimating the risk of PD is attempted using MLR and we observe the logistic model
showed high performance with statistical significance indicating its usefulness in PD
risk estimation.
The paper is organized as follows. Section 2 contains the flowchart of the analysis carried out
and describes about the PPMI database, study cohort, SBR values, statistical analysis of
features, classification and prediction/prognostic model design. Section 3 provides the results
and discussion as observed from the experiments carried out. And finally we provide the
conclusion of the work carried out.
4
2. Materials and Methods
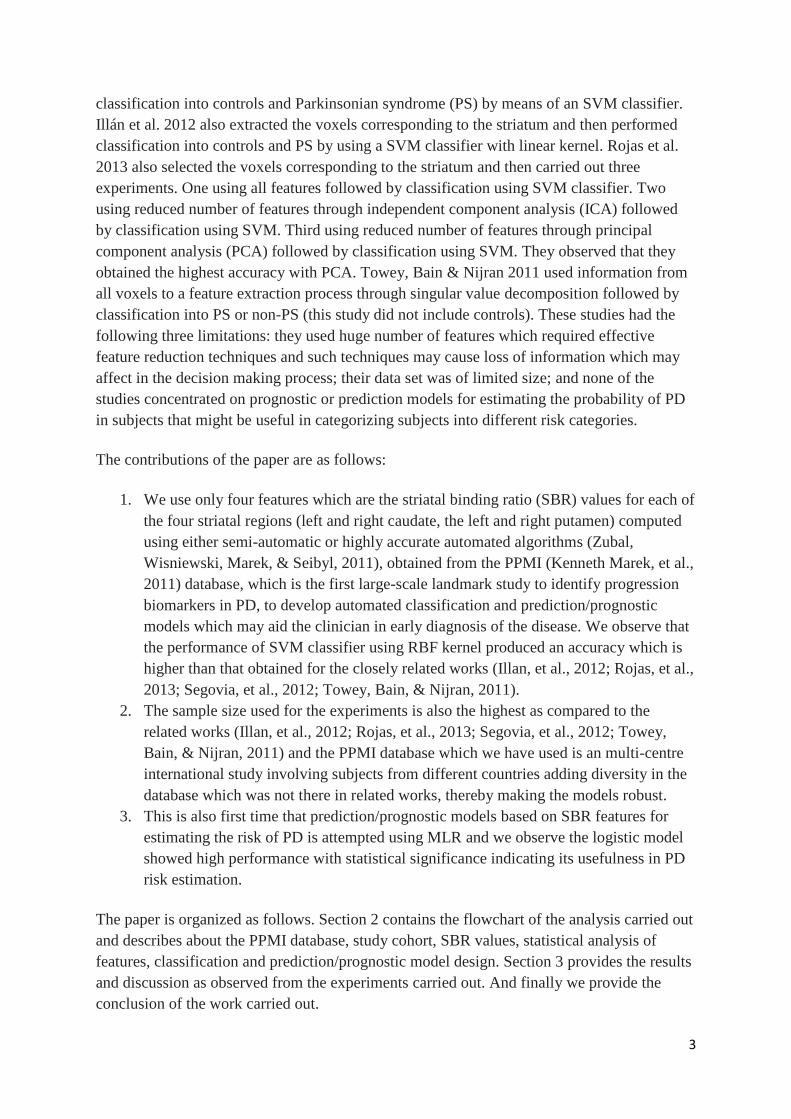
A flow chart of the analysis that is carried out in the paper is shown in Fig. 1. We use the
SBR values from the four striatal regions (left and right caudate, and left and right putamen)
as obtained from the PPMI database for the experiments. All the four features are tested for
statistical significance before performing classification and PD risk estimation.
Fig. 1. Flowchart of the analysis carried out
2.1 Database and Study Cohort and details
Data used in the preparation of this article were obtained from the Parkinson’s Progression
Markers Initiative (PPMI) database (www.ppmi-info.org/data). For up-to-date information on
the study, please visit www.ppmi-info.org. The PPMI (Kenneth Marek, et al., 2011) is a
landmark and first large-scale, comprehensive, observational, international, multi-center
study to identify PD progression biomarkers to improve understanding of the disease etiology
as well as effectiveness of disease modifying therapeutic trials. For our experiments, we used
the Striatal Binding Ratio (SBR) values of the four striatal regions (left and right caudate, the
left and right putamen) that were computed from DaTSCAN SPECT images and were
available from the PPMI database.
The database was downloaded on 18th
March 2013. As per this date, the database contained
SBR values from 179 normal (total of 181 observations as two of the subjects were scanned
at 12 months along with the scan at screening visit) and 369 early PD (a total of 493
observations) subjects (Table 1). As PPMI is a longitudinal study, the subjects are evaluated
longitudinally, i.e., evaluations occur at screening/baseline and at 3 month intervals during
the first year of participation and then every 6 months thereafter.
Table 1.
SBR values (mean ± standard deviation) corresponding to right caudate, left caudate, right
putamen and left putamen, for Normal and Early PD population. For the Early PD group, all
the subjects were in their early stage of the disease (Hoehn and Yahr (HY) stage I and II) and
the mean ± standard deviation of the HY for the Early PD population is 1.58 ± 0.49.
Case No. of
Observations
right caudate left caudate right putamen left putamen
Normal 181 1.93 ± 0.42 1.91 ± 0.42 1.29 ± 0.40 1.33 ± 0.40
Early PD 493 1.28 ± 0.38 1.26 ± 0.36 0.63 ± 0.24 0.63 ± 0.25
5
The details of PPMI subject selection criteria, protocols in DaTSCAN imaging and the steps
used by the Imaging Core (http://www.ppmi-info.org/about-ppmi/who-we-are/study-cores/)
of the PPMI for calculating the SBR is provided in Appendices A, B and C respectively. The
PPMI Central SPECT Core Lab reconstructed, attenuation corrected, and analyzed the data
with a standardized region of interest template for the extraction of regional count densities in
the left and right caudate and putamen. The SBR values are calculated for the right caudate,
left caudate, right putamen and left putamen using occipital lobe region as the reference.
2.2 Statistical significance of SBR-based features
To assess the statistical significance of each of the SBR-based features (predictors),
univariate logistic regression analysis (Bewick, Cheek, & Ball, 2005) was used. All statistical
analysis was carried out using SPSS 21 software (SPSS Inc., Chicago, IL). The threshold of
significance was defined as a value of p < 0.05.
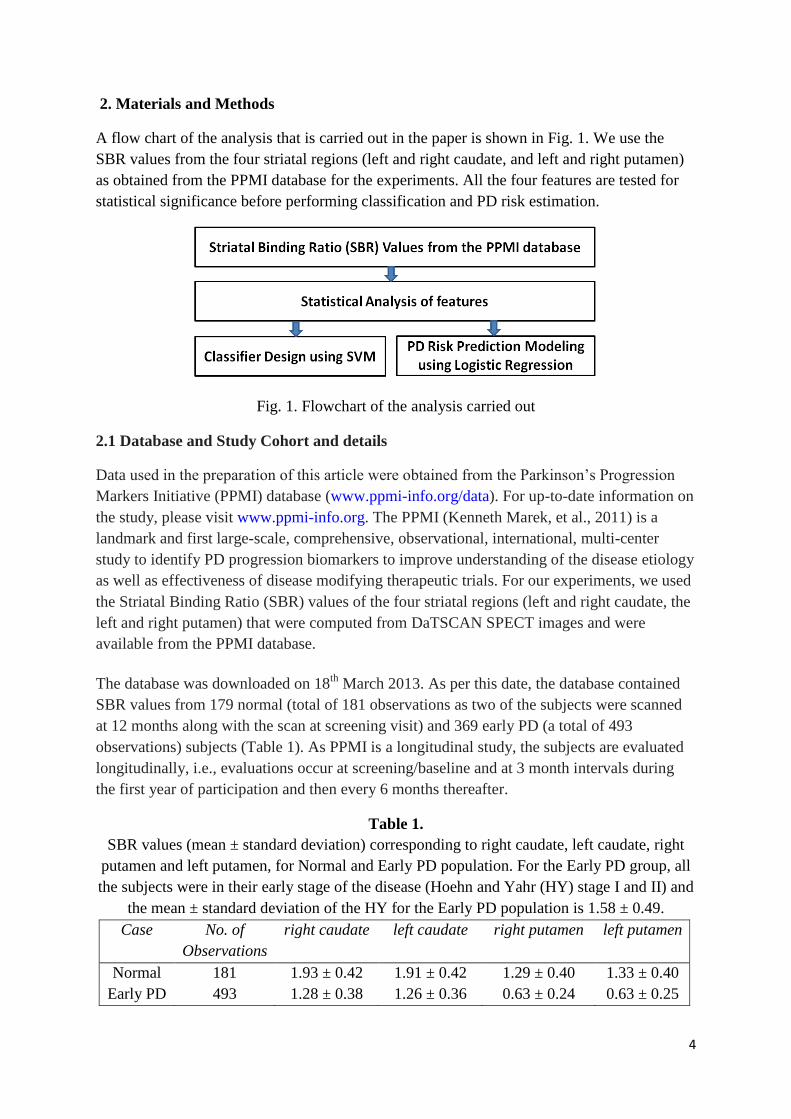
Along with it, we also plot the histograms and notched box plots for each SBR feature to
visualize distribution of a feature between Normal and Early PD population (Fig. 2). The
notched box plots (Fig. 2 (b, d, f, h)) shows that notches of the two boxes corresponding to
Normal and Early PD, are fairly separated indicating the significance of these features. The
histogram plots (Fig. 2 (a, c, e, f)) show that amount of overlap of distribution between the
normal and early PD groups. The overlap is relatively higher for the SBRs of the right and
left caudate as compared to the SBRs of right and left putamen. The amount of overlap of the
distribution of SBR measures determines the difficulty of the classification problem. Higher
the overlap, the more difficult is the classification. The application of diagnostic tools comes
into play here as they are capable of incorporating characteristics of these different
distributed populations encoded in complex high-dimensional feature space, and using them
to train the model and categorize the data.
(a)
(b)

6
(c)
(d)
(e)
(f)
(g)
(h)
Fig. 2. Histogram plots and notched box plots2 of the Striatal Binding Ratio (SBR) values for
(a, b) right caudate (c, d) left caudate (e, f) right putamen (g, h) left putamen for Normal and
Early PD population
2.3 SBR-based classification and prediction/prognostic modeling to distinguish Early
PD from Healthy Controls
Among the techniques for model building, Support Vector Machine (SVM) and logistic
regression are widely used in biomedicine (Dreiseitl & Ohno-Machado, 2002). SVMs are
hard classifiers which directly target on the classification decision boundary without
producing the probability estimation (Boser, Guyon, & Vapnik, 1992). On the other hand,
logistic regression is a soft classifier which explicitly estimate the class conditional
2 On each box of the notched box plot, the central mark is the median (q2), the edges of the box are the 25th (q1)
and 75th (q3) percentiles , the whiskers extend to the most extreme data points not considered outliers, and
outliers are plotted individually. The extremes of the notches or the centers of the triangular markers correspond
to q2±1.57(q3-q1)/n where n (n=674) is the number of observations.
7
probabilities and then perform classification based on estimated probabilities. The advantage
with soft classifier techniques like the logistic regression is that, it produces output in the
form of probabilities which enable us to categorize the subject into clinically-important
categories based on the predicted probability. However, the classification accuracy with
logistic regression can be lower because of their linearity as compared to SVM (as we see in
Sections 3.2 and 3.3) as SVMs can nonlinearly map samples into a higher dimensional space,
so it is able to handle the case when the relation between the class label and features is
nonlinear. We used LIBSVM (Chang & Lin, 2011) for building the SVM classifier and SPSS
21 software (SPSS Inc., Chicago, IL) for developing the logistic model.
2.3.1 Automatic SVM-based Classification to classify Early PD from healthy controls
Support vector machines (SVMs) are supervised techniques for classification which finds a
linear hyperplane (decision boundary) with the largest margin by mapping the input features
to a higher dimension through either linear or non-linear kernel functions (Boser, et al.,
1992).
Given training vectors (which are the observations) , where n is the
number of observations which is 674 and d is the number of features which is 4), in two
classes (Normal and Early PD) and the class label for each observation such
that . In our case as the data is unbalanced for both the
classes (different proportion of both classes: Normal, n1 = 181 (26.85%) and Early PD,
n2=493 (73.15%)), we use the SVM formulation incorporating different penalty parameters
for positive (Early PD) and negative (Normal) classes as described in (Chang & Lin, 2011;
Osuna, Freund, & Girosi, 1997) as shown below
subject to
where and are regularization parameters for positive and negative classes,
respectively, is called the slack variable, is a function that maps into a higher
dimension feature space. The optimal obtained after solving, satisfies
and the decision function is given by

8
where is the kernel function defined by and are the
Lagrange multipliers used.
By using different kernel functions, varying degrees of nonlinearity and flexibility can be
included in the model. For our experiments, we used the linear kernel defined
by , and the non-linear kernel of Radial Basis Function (RBF) defined by
for the SVM classifier. The classifier was evaluated
using 10-fold cross validation.
2.3.2 Prediction/Prognostic modeling for Early PD using multivariate logistic regression
In this work, multivariate binomial logistic regression technique (Bewick, et al., 2005;
Dreiseitl & Ohno-Machado, 2002; Kerr, et al., 2010) was used for developing
prediction/prognostic models for the purpose of risk prediction in PD. Binomial logistic
regression basically models the probability of occurrence of one (Early PD group) of the two
classes of a dichotomous criterion.
A linear combination of predictors (features) is used to fit a logit transformation of the
probability of Early PD for each observation ( ) as
where is the likelihood of subject outcome to be PD, for each subject ( ), which is given
by ; is the intercept in the model which a constant and
are the regression coefficients and are the features in the
logistic model (can be interaction tem also). The regression coefficients are estimated using
maximum likelihood estimation, and then solving the logit in order to , the probability of
having PD for each subject, which is the risk predictor, is given by
3. Results and Discussion
3.1 Statistical significance of SBR-based features
Table 2 shows the results of univariate logistic regression analysis performed on the four
SBR features (right caudate, left caudate, right putamen and left putamen). It is observed that
all of them are statistically significant with p<0.05. Table 2 also shows the Nagelkerke R2
values (Nagelkerke, 1991), which is a variation of index R2 that is used in ordinary least
squares (OLS) regression. It is observed that higher Nagelkerke R2 values are obtained for
putamenal SBR (both right and left) as compared to the caudate SBR indicating that
putamenal SBR is more useful in discriminating healthy Normal and Early PD. This is also
evident from the histogram plots where we observed lower overlaps for putamenal SBR (as
shown in Fig.2 (e, g)) than for caudate SBR (as shown in Fig.2 (a, c)). We observe that this

9
finding goes with the findings from following studies (Kish, Shannak, & Hornykiewicz,
1988; Piggott, et al., 1999) which did post-mortem studies to demonstrate severe reductions
in the dopamine concentration in the striatum of PD patients, with greater reduction in the
putamen than the caudate.
Table 2
Result of statistical testing of each feature through univariate logistic regression using SPSS
Predictor β
Wald df p-value Nagelkerke R2
right caudate -4.137 .346 142.689 1 .0000 0.492
left caudate -4.243 .351 146.220 1 .0000 0.499
right putamen -6.367 .502 160.937 1 .0000 0.638
left putamen -7.015 .568 152.625 1 .0000 0.682
Each feature was tested for statistical significance using univariate logistic regression analysis. The table does
not show the constants (α's) for each model. β is the value of the regression coefficient in the univariate model,
SE is its standard error, Wald is the Wald test statistic, df is the degree of freedom, p-value is the significance of
each regression coefficient, Nagelkerke R2 is the pseudo- R
2 measure that is a variation of R
2 used in ordinary
least squares (OLS) regression.
3.2 Automatic Classification and prediction/prognostic modeling for Early PD
We use SVM and multivariate logistic regression to develop models for distinguishing Early
PD from healthy Normal. SVMs performed hard classification, where as MLR performed soft
classification enabling us to develop prediction/prognostic model for PD risk estimation. We
used SVM with RBF kernel and compared it with the SVM classifier with the linear kernel.
Subsections below shows the performance measures obtained for the SVM classifiers and
logistic model.
The highlights of the present study are that: We observe that the performance measure
obtained by the SVM classier using RBF kernel is highest among all the closely related
works (Illan, et al., 2012; Rojas, et al., 2013; Segovia, et al., 2012; Towey, Bain, & Nijran,
2011). We used only four features without needing any feature selection techniques
preventing any loss of information from the features. The sample size used for the
experiments is also the highest as compared to the related works and the PPMI database
which we have used is an multi-centre international study involving subjects from different
countries adding diversity in the database which was not there in related works. This is also
first time that prediction/prognostic models based on SBR features for estimating the risk of
PD is attempted using MLR and we observe high performance from these models also.
3.2.1 SVM-based automatic classification to distinguish Early PD from Healthy controls
Table 3 shows the accuracies obtained during the 10-fold cross validation for the SVM
classifier using RBF and linear kernels. Table 4 shows the confusion matrices for the SVM
classifier with the RBF and linear kernel respectively. It is observed that the SVM classifier
with RBF kernel (Accuracy = 96.14%, Sensitivity = 96.55% and Specificity = 95.03%)
performs better than the linear one (Accuracy = 92.28%, Sensitivity = 95.33%, Specificity =
83.98%). This is because RBF kernel can nonlinearly map samples into a higher dimensional

10
space, so it is able to handle the case when the relation between the class label and features is
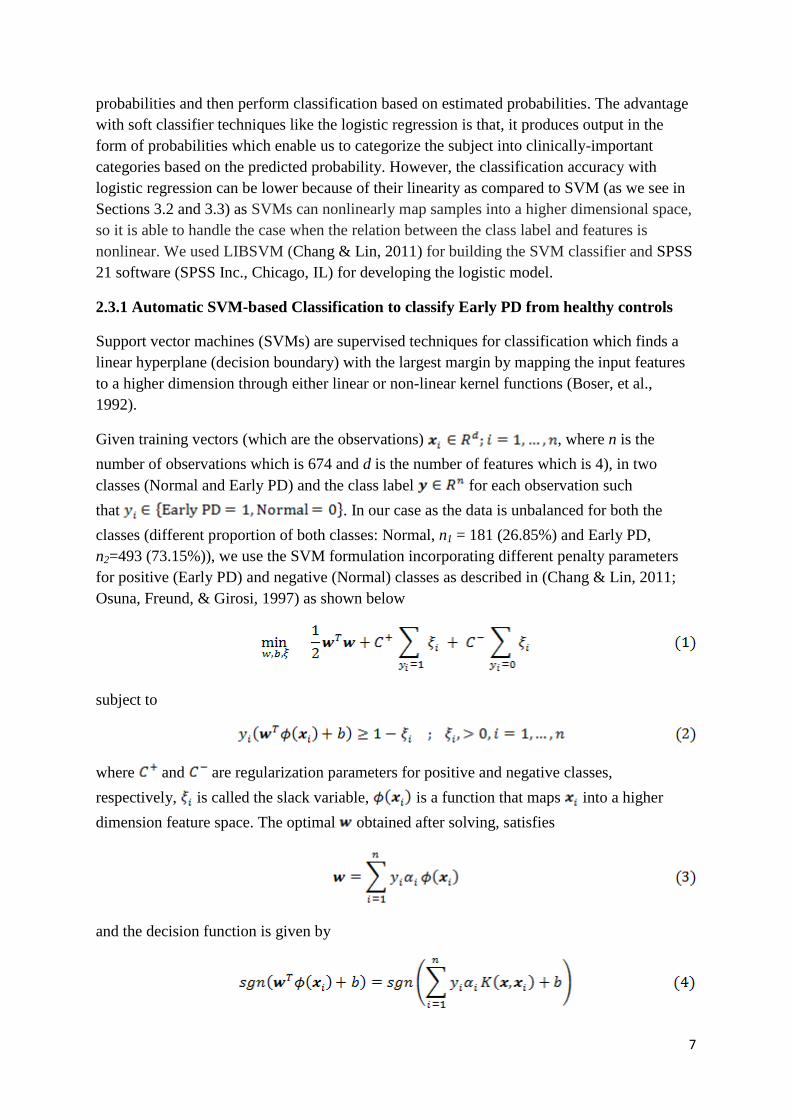
nonlinear. Fig. 3 shows the box plot of SBRs for misclassified cases for the SVM classifier
using RBF kernel which shows the cases misdiagnosed as PD had higher values of SBR than
usual and cases misdiagnosed as healthy normal had lower values of SBR than usual.
Table 3
Accuracies (in %) obtained for the SVM classifier using RBF and linear kernel, for each fold
during 10-fold cross-validation
Accuracy(%)
Fold No. RBF Linear
1 97.01 94.03
2 97.06 92.65
3 95.59 92.65
4 97.06 92.65
5 95.59 94.12
6 94.03 92.54
7 98.51 95.52
8 92.54 89.55
9 95.52 92.54
10 98.51 86.57
Mean
Accuracy 96.14 92.28
Table 4
Confusion matrix components and performance measures for the SVM classifier with RBF
kernel (SVMRBF) and SVM classifier with Linear kernel (SVMLinear)
Classifiers True
Positive
False
Negative
False
Positive
True
Negative
Accuracy
(%)
Sensitivity
(%)
Specificity
(%)
SVMRBF 476 17 9 172 96.14 96.55 95.03
SVMLinear 470 23 29 152 92.28 95.33 83.98
(a)
(b)
11
(c)
(d)
Fig. 3. Box plot of Striatal Binding Ratio (SBR) of (a) right caudate (b) left caudate (c) right
putamen (d) left putamen for the misclassified samples from SVM classifier with RBF kernel.
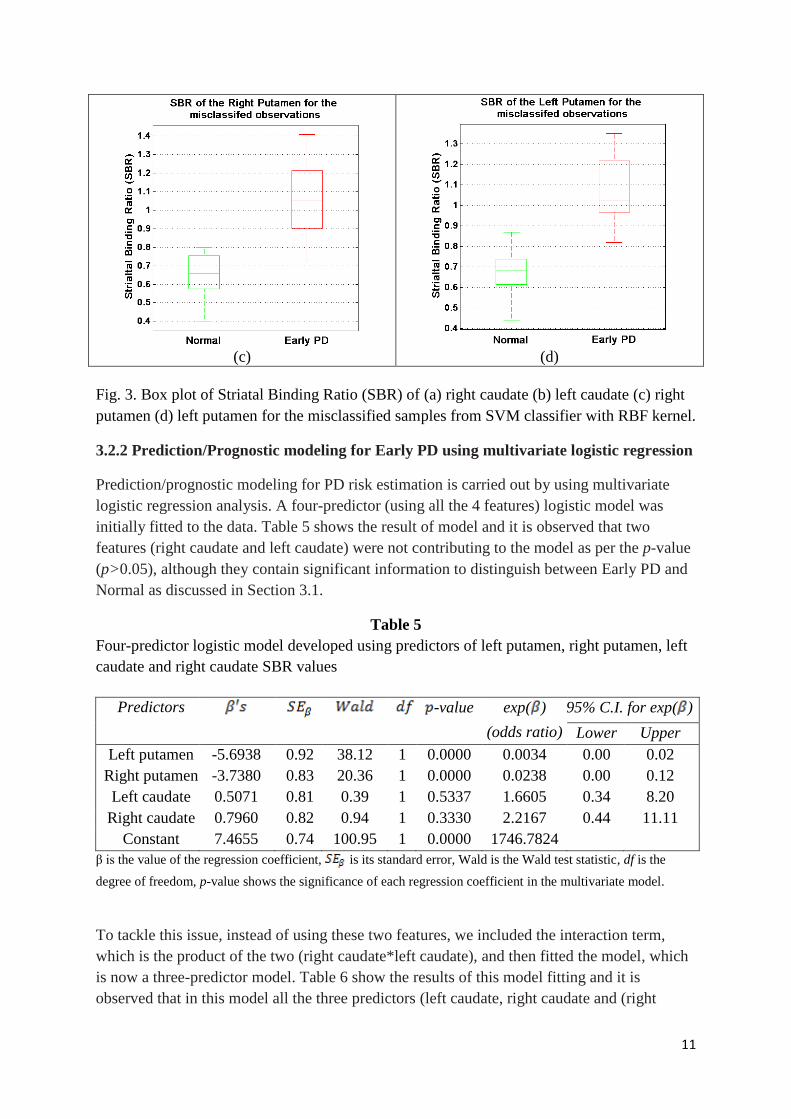
3.2.2 Prediction/Prognostic modeling for Early PD using multivariate logistic regression
Prediction/prognostic modeling for PD risk estimation is carried out by using multivariate
logistic regression analysis. A four-predictor (using all the 4 features) logistic model was
initially fitted to the data. Table 5 shows the result of model and it is observed that two
features (right caudate and left caudate) were not contributing to the model as per the p-value
(p>0.05), although they contain significant information to distinguish between Early PD and
Normal as discussed in Section 3.1.
Table 5
Four-predictor logistic model developed using predictors of left putamen, right putamen, left
caudate and right caudate SBR values
Predictors -value exp( )
(odds ratio)
95% C.I. for exp( )
Lower Upper
Left putamen -5.6938 0.92 38.12 1 0.0000 0.0034 0.00 0.02
Right putamen -3.7380 0.83 20.36 1 0.0000 0.0238 0.00 0.12
Left caudate 0.5071 0.81 0.39 1 0.5337 1.6605 0.34 8.20
Right caudate 0.7960 0.82 0.94 1 0.3330 2.2167 0.44 11.11
Constant 7.4655 0.74 100.95 1 0.0000 1746.7824
β is the value of the regression coefficient, is its standard error, Wald is the Wald test statistic, df is the
degree of freedom, p-value shows the significance of each regression coefficient in the multivariate model.
To tackle this issue, instead of using these two features, we included the interaction term,
which is the product of the two (right caudate*left caudate), and then fitted the model, which
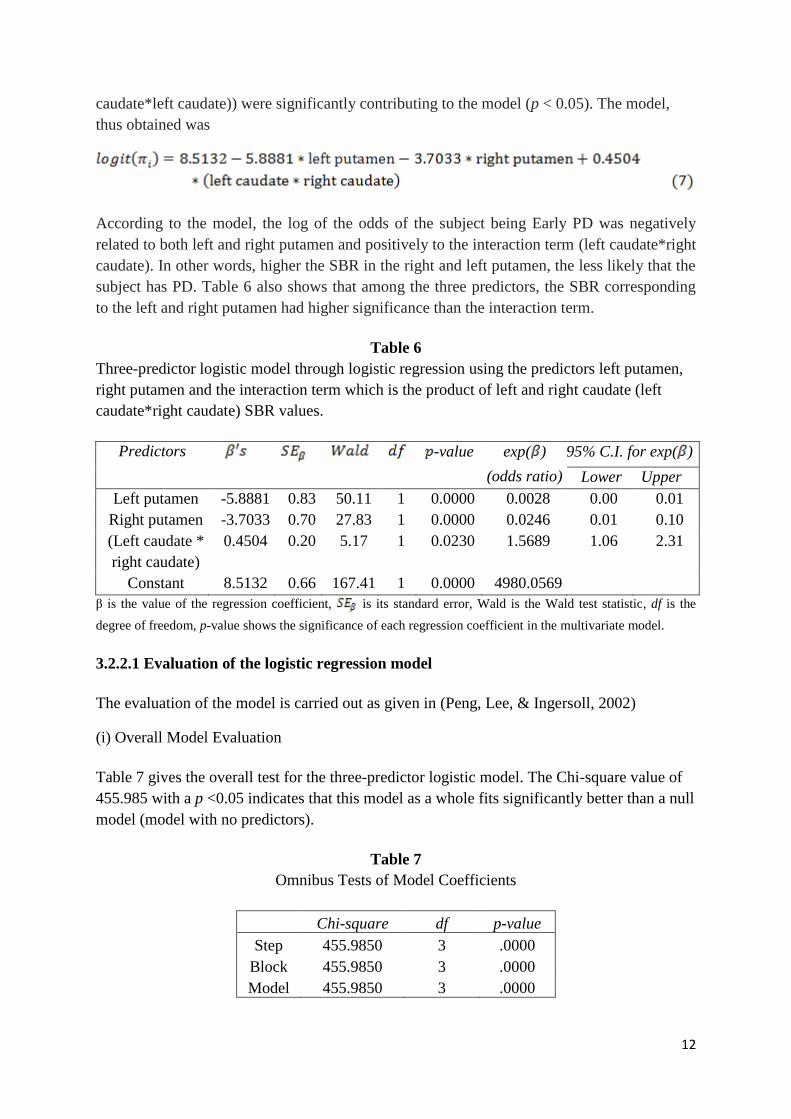
is now a three-predictor model. Table 6 show the results of this model fitting and it is
observed that in this model all the three predictors (left caudate, right caudate and (right
12
caudate*left caudate)) were significantly contributing to the model (p < 0.05). The model,
thus obtained was
According to the model, the log of the odds of the subject being Early PD was negatively
related to both left and right putamen and positively to the interaction term (left caudate*right
caudate). In other words, higher the SBR in the right and left putamen, the less likely that the
subject has PD. Table 6 also shows that among the three predictors, the SBR corresponding
to the left and right putamen had higher significance than the interaction term.
Table 6
Three-predictor logistic model through logistic regression using the predictors left putamen,
right putamen and the interaction term which is the product of left and right caudate (left
caudate*right caudate) SBR values.
Predictors -value exp( )
(odds ratio)
95% C.I. for exp( )
Lower Upper
Left putamen -5.8881 0.83 50.11 1 0.0000 0.0028 0.00 0.01
Right putamen -3.7033 0.70 27.83 1 0.0000 0.0246 0.01 0.10
(Left caudate *
right caudate)
0.4504 0.20 5.17 1 0.0230 1.5689 1.06 2.31
Constant 8.5132 0.66 167.41 1 0.0000 4980.0569
β is the value of the regression coefficient, is its standard error, Wald is the Wald test statistic, df is the
degree of freedom, p-value shows the significance of each regression coefficient in the multivariate model.
3.2.2.1 Evaluation of the logistic regression model
The evaluation of the model is carried out as given in (Peng, Lee, & Ingersoll, 2002)
(i) Overall Model Evaluation
Table 7 gives the overall test for the three-predictor logistic model. The Chi-square value of
455.985 with a p <0.05 indicates that this model as a whole fits significantly better than a null
model (model with no predictors).
Table 7
Omnibus Tests of Model Coefficients
Chi-square df p-value
Step 455.9850 3 .0000
Block 455.9850 3 .0000
Model 455.9850 3 .0000

13
(ii) Statistical tests of individual parameters in the multivariate logistic model
The statistical significance of regression coefficients corresponding to each predictor is tested
using the Wald chi-square statistic. As observed in Table 6, all the three predictors along with
the constant, which is the intercept, are all significant (p<0.05).
(iii) Goodness-of-fit statistics
The Goodness-of-fit statistics, through Hosmer and Lemeshow test (Hosmer & Lemeshow,
2000) and R2 indices, assess the fit of a logistic model against actual outcomes. The Hosmer
and Lemeshow test is a statistical test for goodness of fit for logistic regression models. In
Hosmer and Lemeshow test, the data are divided into approximately ten groups and then chi-
square statistics is calculated using the observed and expected number of cases in each group
defined by increasing order of estimated risk. Table 8 shows the result of the Hosmer and
Lemeshow test. It gave a small chi-square of 2.916 (with larger p-value closer to 1) with 8
degrees of freedom indicating that the actual outcome (Early PD or Normal) is not
significantly different from those predicted risk and therefore, the overall model was well fit
to the data. Table 8 also shows R2 indices, defined by Cox and Snell (Cox & Snell, 1989),
and Nagelkerke (Nagelkerke, 1991). These indices are variations of the R2 that is defined for
the ordinary least squares (OLS) regression model. Cox and Snell R2 of 0.4916 and
Nagelkerke R2 of 0.713 indicates that the model is useful in risk prediction.
Table 8
Goodness-of-fit tests
1. Hosmer and Lemeshow Test
Chi-square df p-value
2.9162 8 .9395
2. Cox & Snell R Square = 0.4916
3. Nagelkerke R Square = 0.7149
(iv) Validation of the predicted probabilities
Logistic regression predicts the logit of an event outcome (Early PD or Normal) from a set of
predictors. The predicted probabilities, which are obtained from the logit, can then be
revalidated with the actual outcome to determine if high probabilities are indeed associated
with higher risk of PD and low probabilities with lower risk of PD. The degree to which
predicted probabilities agree with actual outcome is shown through a classification table as
shown in Table 9. The overall classification accuracy was as high as 90.8 (with cutoff set as
0.5) indicating that the model with 3 predictors performs well in predicting the subject
outcome. It is observed that the classification accuracy is not as high as that we obtained
using SVM classifier with RBF kernel. This is because logistic regression models are
discriminative models for classification that produces linear decision boundaries, and are not
that flexible as the non-linear SVMs.
14
Table 9
Classification Tablea
Observed Predicted
Normal Early PD % Correct
Normal 140 41 77.35
Early PD 21 472 95.74
Overall % 90.80 acutoff value is 0.5.
Sensitivity = 95.74% , Specificity = 77.35%
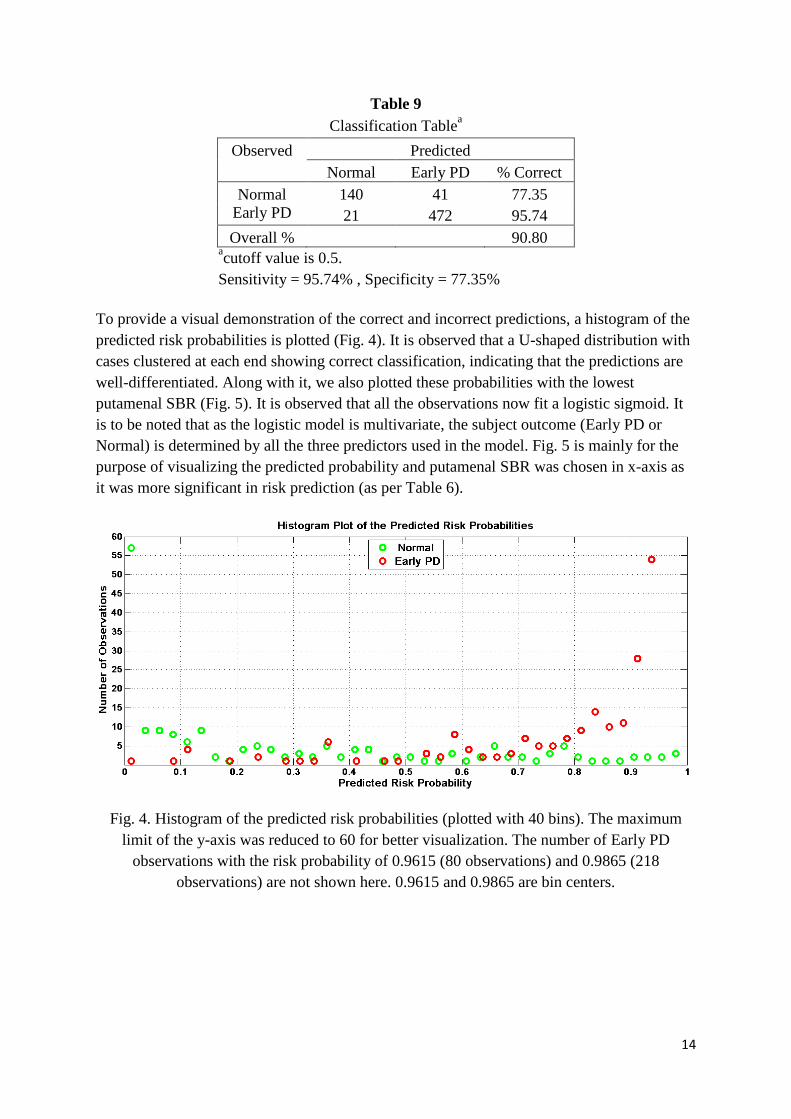
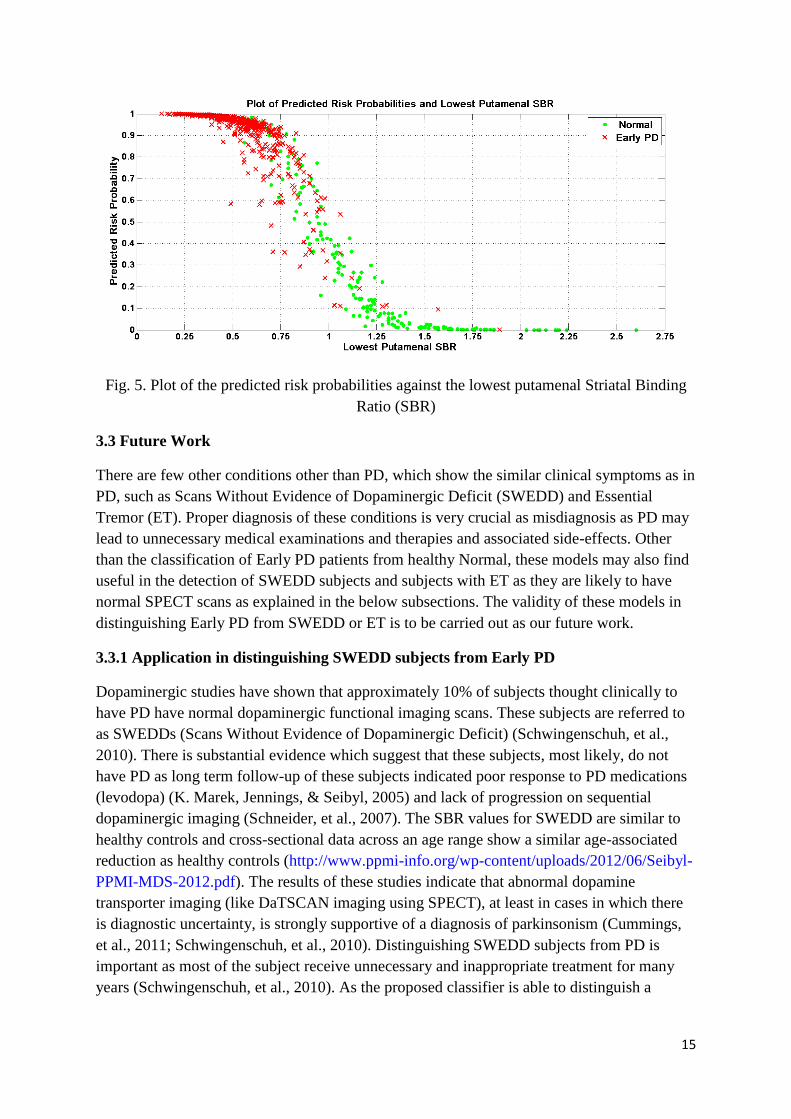
To provide a visual demonstration of the correct and incorrect predictions, a histogram of the
predicted risk probabilities is plotted (Fig. 4). It is observed that a U-shaped distribution with
cases clustered at each end showing correct classification, indicating that the predictions are
well-differentiated. Along with it, we also plotted these probabilities with the lowest
putamenal SBR (Fig. 5). It is observed that all the observations now fit a logistic sigmoid. It
is to be noted that as the logistic model is multivariate, the subject outcome (Early PD or
Normal) is determined by all the three predictors used in the model. Fig. 5 is mainly for the
purpose of visualizing the predicted probability and putamenal SBR was chosen in x-axis as
it was more significant in risk prediction (as per Table 6).
Fig. 4. Histogram of the predicted risk probabilities (plotted with 40 bins). The maximum
limit of the y-axis was reduced to 60 for better visualization. The number of Early PD
observations with the risk probability of 0.9615 (80 observations) and 0.9865 (218
observations) are not shown here. 0.9615 and 0.9865 are bin centers.
15
Fig. 5. Plot of the predicted risk probabilities against the lowest putamenal Striatal Binding
Ratio (SBR)
3.3 Future Work
There are few other conditions other than PD, which show the similar clinical symptoms as in
PD, such as Scans Without Evidence of Dopaminergic Deficit (SWEDD) and Essential
Tremor (ET). Proper diagnosis of these conditions is very crucial as misdiagnosis as PD may
lead to unnecessary medical examinations and therapies and associated side-effects. Other
than the classification of Early PD patients from healthy Normal, these models may also find
useful in the detection of SWEDD subjects and subjects with ET as they are likely to have
normal SPECT scans as explained in the below subsections. The validity of these models in
distinguishing Early PD from SWEDD or ET is to be carried out as our future work.
3.3.1 Application in distinguishing SWEDD subjects from Early PD
Dopaminergic studies have shown that approximately 10% of subjects thought clinically to
have PD have normal dopaminergic functional imaging scans. These subjects are referred to
as SWEDDs (Scans Without Evidence of Dopaminergic Deficit) (Schwingenschuh, et al.,
2010). There is substantial evidence which suggest that these subjects, most likely, do not
have PD as long term follow-up of these subjects indicated poor response to PD medications
(levodopa) (K. Marek, Jennings, & Seibyl, 2005) and lack of progression on sequential
dopaminergic imaging (Schneider, et al., 2007). The SBR values for SWEDD are similar to
healthy controls and cross-sectional data across an age range show a similar age-associated
reduction as healthy controls (http://www.ppmi-info.org/wp-content/uploads/2012/06/Seibyl-
PPMI-MDS-2012.pdf). The results of these studies indicate that abnormal dopamine
transporter imaging (like DaTSCAN imaging using SPECT), at least in cases in which there
is diagnostic uncertainty, is strongly supportive of a diagnosis of parkinsonism (Cummings,
et al., 2011; Schwingenschuh, et al., 2010). Distinguishing SWEDD subjects from PD is
important as most of the subject receive unnecessary and inappropriate treatment for many
years (Schwingenschuh, et al., 2010). As the proposed classifier is able to distinguish a
16
abnormal scan (PD) from a normal scan with a high accuracy, such system may be useful in
differentiating SWEDD from PD and act as an adjunct to other diagnostic evaluations.
3.3.2 Application in distinguishing Essential Tremor (ET) subjects from Early PD
Although distinguishing PD from essential tremor (ET) on a clinical basis is straightforward,
ET is increasingly recognized as a heterogeneous disorder that can encompass features such
as rest tremor which can challenge accurate diagnosis (Cohen, Pullman, Jurewicz, Watner, &
Louis, 2003; Louis, 2009). In a study with 71 patients with ET, it was observed that about 1
in 3 patients with tremor was misdiagnosed as having ET, with most frequent false diagnosis
being PD and dystonia (Jain, Lo, & Louis, 2006). A series of studies, cross-sectional and
longitudinal, have shown a decrease in dopamine transporter density in PD patients compared
to ET and no differences between ET and healthy controls (Benamer, et al., 2000; Doepp, et
al., 2008; Isaias, et al., 2010). As the ET patients have scans in the normal range, the
proposed classifier system may aid in distinguishing ET from PD and act as an adjunct to
other diagnostic evaluations.
Conclusion
Early diagnosis of Parkinson's disease is of at most importance for early management and
treatment planning as clinical symptoms in PD arise only when there is more than 60% loss
of dopaminergic neurons. There are no laboratory tests for the diagnosis of PD causing a high
rate of misdiagnosis especially when the disease in the early stages and when the diagnosis is
made by a non-specialist. Hence, diagnostic tools based on machine learning techniques are
important as they can aid the clinician in the diagnosis process. Recent neuroimaging studies
with SPECT using 123
I-Ioflupane (DaTSCAN) as radiotracer have shown to be a sensitive
marker even in the early stages of the disease. In this work, we developed diagnostic models
using machine learning techniques for classification into Early PD and healthy Normal as
well as prediction/prognostication of PD. We use the striatal binding ratio (SBR) values for
the four striatal regions (left and right caudate, and left and right putamen) obtained from the
Parkinson's Progression Marker's Initiative (PPMI) database which is a landmark and first
large-scale longitudinal study of PD to explore progression biomarkers. We observe that the
SVM classifier using RBF kernel produced a high accuracy in classifying Early PD from
Normal, and the prediction/prognostic model based using multivariate logistic regression also
gave high performance along with statistical significance indicating the usefulness of the
model in PD risk estimation. The contributions of the present study are 1) We obtained high
classification performance using only four features without needing any feature selection
techniques making the system simple. 2) The sample size used for the experiments is very
high and the PPMI database which we have used is an multi-centre international study
involving subjects from different countries adding diversity in the database and therby
making the models more robust 3) This is also first time that prediction/prognostic models
based on SBR features for estimating the risk of PD is attempted using MLR and we observe
high performance from these models also. Other than classifying Early PD from Normal,
these models can also find useful in detecting Early PD from SWEDD subjects and subjects
with Essential Tremor as these subjects are likely to have normal SPECT scans. Hence, we
17
infer from the study that these models have the potential to distinguish abnormal scans from
Early PD from normal scans from healthy Normal or SWEDD subjects or subjects with
Essential Tremor. Application of these models needs to be validated for SWEDD and ET
conditions which we propose to carry out as the future work.
Author's Contributions
RP has setup the conceptual research design, did most of the data analysis and interpretation
and wrote the first draft of the manuscript. SDR and SG collaborated on data analysis and in
the writing and revision of the manuscript. PKM collaborated on the conceptual design of the
research and in the critical revision of the manuscript for important intellectual content. PPMI
provided the necessary data for analysis. All authors read and approved the final manuscript.
Acknowledgement
PPMI – a public-private partnership – is funded by the Michael J. Fox Foundation for
Parkinson’s Research and funding partners, including [list the full names of all of the PPMI
funding partners found at www.ppmi-info.org/fundingpartners].
References
Bairactaris, C., Demakopoulos, N., Tripsianis, G., Sioka, C., Farmakiotis, D., Vadikolias, K., Heliopoulos, I., Georgoulias, P., Tsougos, I., Papanastasiou, I., & Piperidou, C. (2009). Impact of dopamine transporter single photon emission computed tomography imaging using I-123 ioflupane on diagnoses of patients with parkinsonian syndromes. Journal of Clinical Neuroscience, 16, 246-252.
Bassotti, G., Maggio, D., Battaglia, E., Giulietti, O., Spinozzi, F., Reboldi, G., Serra, A. M., Emanuelli, G., & Chiarioni, G. (2000). Manometric investigation of anorectal function in early and late stage Parkinson's disease. Journal of Neurology, Neurosurgery & Psychiatry, 68, 768-770.
Benamer, T. S., Patterson, J., Grosset, D. G., Booij, J., de Bruin, K., van Royen, E., Speelman, J. D., Horstink, M. H., Sips, H. J., Dierckx, R. A., Versijpt, J., Decoo, D., Van Der Linden, C., Hadley, D. M., Doder, M., Lees, A. J., Costa, D. C., Gacinovic, S., Oertel, W. H., Pogarell, O., Hoeffken, H., Joseph, K., Tatsch, K., Schwarz, J., & Ries, V. (2000). Accurate differentiation of parkinsonism and essential tremor using visual assessment of [123I]-FP-CIT SPECT imaging: the [123I]-FP-CIT study group. Movement Disorders, 15, 503-510.
Bewick, V., Cheek, L., & Ball, J. (2005). Statistics review 14: Logistic regression. Crit Care, 9, 112-118. Booij, J., & Knol, R. J. (2007). SPECT imaging of the dopaminergic system in (premotor) Parkinson's
disease. Parkinsonism Relat Disord, 13 Suppl 3, S425-428. Booij, J., Tissingh, G., Boer, G. J., Speelman, J. D., Stoof, J. C., Janssen, A. G., Wolters, E. C., & van
Royen, E. A. (1997). [123I]FP-CIT SPECT shows a pronounced decline of striatal dopamine transporter labelling in early and advanced Parkinson's disease. Journal of Neurology, Neurosurgery & Psychiatry, 62, 133-140.
Boser, B. E., Guyon, I. M., & Vapnik, V. N. (1992). A training algorithm for optimal margin classifiers. In D. Haussler (Ed.), Proceedings of the 5th Annual Workshop on Computational Learning Theory (COLT'92) (pp. 144-152): ACM Press, Pittsburgh, PA,.
Chang, C.-C., & Lin, C.-J. (2011). LIBSVM: A Library for Support Vector Machines. ACM Transactions on Intelligent Systems and Technology, 2, 1--27.
Cohen, O., Pullman, S., Jurewicz, E., Watner, D., & Louis, E. D. (2003). Rest tremor in patients with essential tremor: prevalence, clinical correlates, and electrophysiologic characteristics. Arch Neurol, 60, 405-410.
18
Cox, D. R., & Snell, E. J. (1989). The analysis of binary data (2nd ed.). London: Chapman and Hall. Cummings, J. L., Henchcliffe, C., Schaier, S., Simuni, T., Waxman, A., & Kemp, P. (2011). The role of
dopaminergic imaging in patients with symptoms of dopaminergic system neurodegeneration. Brain, 134, 3146-3166.
Doepp, F., Plotkin, M., Siegel, L., Kivi, A., Gruber, D., Lobsien, E., Kupsch, A., & Schreiber, S. J. (2008). Brain parenchyma sonography and 123I-FP-CIT SPECT in Parkinson's disease and essential tremor. Movement Disorders, 23, 405-410.
Dreiseitl, S., & Ohno-Machado, L. (2002). Logistic regression and artificial neural network classification models: a methodology review. J Biomed Inform, 35, 352-359.
Hosmer, D. W. J., & Lemeshow, S. (2000). Applied logistic regression (2nd ed.). New York: Wiley. Illan, I. A., Gorrz, J. M., Ramirez, J., Segovia, F., Jimenez-Hoyuela, J. M., & Ortega Lozano, S. J. (2012).
Automatic assistance to Parkinson's disease diagnosis in DaTSCAN SPECT imaging. Med Phys, 39, 5971-5980.
Isaias, I. U., Marotta, G., Hirano, S., Canesi, M., Benti, R., Righini, A., Tang, C., Cilia, R., Pezzoli, G., Eidelberg, D., & Antonini, A. (2010). Imaging essential tremor. Movement Disorders, 25, 679-686.
Jain, S., Lo, S. E., & Louis, E. D. (2006). Common misdiagnosis of a common neurological disorder: how are we misdiagnosing essential tremor? Arch Neurol, 63, 1100-1104.
Kerr, G. K., Worringham, C. J., Cole, M. H., Lacherez, P. F., Wood, J. M., & Silburn, P. A. (2010). Predictors of future falls in Parkinson disease. Neurology, 75, 116-124.
Kish, S. J., Shannak, K., & Hornykiewicz, O. (1988). Uneven pattern of dopamine loss in the striatum of patients with idiopathic Parkinson's disease. Pathophysiologic and clinical implications. N Engl J Med, 318, 876-880.
Long, D., Wang, J., Xuan, M., Gu, Q., Xu, X., Kong, D., & Zhang, M. (2012). Automatic classification of early Parkinson's disease with multi-modal MR imaging. PLoS One, 7, e47714.
Louis, E. D. (2009). Essential tremors: a family of neurodegenerative disorders? Arch Neurol, 66, 1202-1208.
Marek, K., Jennings, D., Lasch, S., Siderowf, A., Tanner, C., Simuni, T., Coffey, C., Kieburtz, K., Flagg, E., Chowdhury, S., Poewe, W., Mollenhauer, B., Klinik, P.-E., Sherer, T., Frasier, M., Meunier, C., Rudolph, A., Casaceli, C., Seibyl, J., Mendick, S., Schuff, N., Zhang, Y., Toga, A., Crawford, K., Ansbach, A., De Blasio, P., Piovella, M., Trojanowski, J., Shaw, L., Singleton, A., Hawkins, K., Eberling, J., Brooks, D., Russell, D., Leary, L., Factor, S., Sommerfeld, B., Hogarth, P., Pighetti, E., Williams, K., Standaert, D., Guthrie, S., Hauser, R., Delgado, H., Jankovic, J., Hunter, C., Stern, M., Tran, B., Leverenz, J., Baca, M., Frank, S., Thomas, C.-A., Richard, I., Deeley, C., Rees, L., Sprenger, F., Lang, E., Shill, H., Obradov, S., Fernandez, H., Winters, A., Berg, D., Gauss, K., Galasko, D., Fontaine, D., Mari, Z., Gerstenhaber, M., Brooks, D., Malloy, S., Barone, P., Longo, K., Comery, T., Ravina, B., Grachev, I., Gallagher, K., Collins, M., Widnell, K. L., Ostrowizki, S., Fontoura, P., Ho, T., Luthman, J., Brug, M. v. d., Reith, A. D., & Taylor, P. (2011). The Parkinson Progression Marker Initiative (PPMI). Prog Neurobiol, 95, 629-635.
Marek, K., Jennings, D., & Seibyl, J. (2005). Long-term follow-up of patients with scans without evidence of dopaminergic deficit (SWEDD) in the ELLDOPA study. Neurology, 64 (Suppl. 1), A274.
Nagelkerke, N. J. D. (1991). A note on a general definition of the coefficient of determination. Biometrika, 78, 691-692.
Orru, G., Pettersson-Yeo, W., Marquand, A. F., Sartori, G., & Mechelli, A. (2012). Using Support Vector Machine to identify imaging biomarkers of neurological and psychiatric disease: a critical review. Neuroscience & Biobehavioral Reviews, 36, 1140-1152.
Osuna, E., Freund, R., & Girosi, F. (1997). Support vector machines: Training and applications. In AI Memo 1602: Massachusetts Institute of Technology.
19
Peng, C.-Y. J., Lee, K. D., & Ingersoll, G. M. (2002). An Introduction to Logistic Regression Analysis and Reporting. The Journal of Educational Research, 96, 3-14.
Piggott, M. A., Marshall, E. F., Thomas, N., Lloyd, S., Court, J. A., Jaros, E., Burn, D., Johnson, M., Perry, R. H., McKeith, I. G., Ballard, C., & Perry, E. K. (1999). Striatal dopaminergic markers in dementia with Lewy bodies, Alzheimer's and Parkinson's diseases: rostrocaudal distribution. Brain, 122 ( Pt 8), 1449-1468.
Rojas, A., Górriz, J. M., Ramírez, J., Illán, I. A., Martínez-Murcia, F. J., Ortiz, A., Gómez Río, M., & Moreno-Caballero, M. (2013). Application of Empirical Mode Decomposition (EMD) on DaTSCAN SPECT images to explore Parkinson Disease. Expert Systems with Applications, 40, 2756-2766.
Schneider, S. A., Edwards, M. J., Mir, P., Cordivari, C., Hooker, J., Dickson, J., Quinn, N., & Bhatia, K. P. (2007). Patients with adult-onset dystonic tremor resembling parkinsonian tremor have scans without evidence of dopaminergic deficit (SWEDDs). Movement Disorders, 22, 2210-2215.
Schwingenschuh, P., Ruge, D., Edwards, M. J., Terranova, C., Katschnig, P., Carrillo, F., Silveira-Moriyama, L., Schneider, S. A., Kagi, G., Palomar, F. J., Talelli, P., Dickson, J., Lees, A. J., Quinn, N., Mir, P., Rothwell, J. C., & Bhatia, K. P. (2010). Adult onset asymmetric upper limb tremor misdiagnosed as Parkinson’s disease: A clinical and electrophysiological study. Movement Disorders, 25, 560-569.
Segovia, F., Gorriz, J. M., Ramirez, J., Alvarez, I., Jimenez-Hoyuela, J. M., & Ortega, S. J. (2012). Improved parkinsonism diagnosis using a partial least squares based approach. Med Phys, 39, 4395-4403.
Seifert, K. D., & Wiener, J. I. (2013). The impact of DaTscan on the diagnosis and management of movement disorders: A retrospective study. Am J Neurodegener Dis, 2, 29-34.
Sixel-Doring, F., Liepe, K., Mollenhauer, B., Trautmann, E., & Trenkwalder, C. (2011). The role of 123I-FP-CIT-SPECT in the differential diagnosis of Parkinson and tremor syndromes: a critical assessment of 125 cases. J Neurol, 258, 2147-2154.
Tolosa, E., Borght, T. V., Moreno, E., & Da, T. C. U. P. S. S. G. (2007). Accuracy of DaTSCAN (123I-Ioflupane) SPECT in diagnosis of patients with clinically uncertain parkinsonism: 2-year follow-up of an open-label study. Movement Disorders, 22, 2346-2351.
Towey, D. J., Bain, P. G., & Nijran, K. S. (2011). Automatic classification of 123I-FP-CIT (DaTSCAN) SPECT images. Nucl Med Commun, 32, 699-707.
Winogrodzka, A., Bergmans, P., Booij, J., van Royen, E. A., Janssen, A. G., & Wolters, E. C. (2001). [123I]FP-CIT SPECT is a useful method to monitor the rate of dopaminergic degeneration in early-stage Parkinson's disease. J Neural Transm, 108, 1011-1019.
Zubal, G., Wisniewski, G., Marek, K., & Seibyl, J. (2011). Automated program for analyzing striatal uptake of DaTSCAN SPECT images in humans suspected of Parkinson's disease. J NUCL MED MEETING ABSTRACTS, 52, 2098-.
Appendices
A. Subject Selection Criteria
The PPMI mainly concentrates in recruiting early-untreated PD subjects and age-matched
healthy controls for the study. As per the PPMI subject selection criteria (Kenneth Marek, et
al., 2011), PD subjects are recruited at disease threshold, i.e., they are required to have an
asymmetric resting tremor or asymmetric bradykinesia or two of bradykinesia, resting tremor
and rigidity with diagnosis within two years and to be untreated for PD (Kenneth Marek, et
al., 2011). All subjects in the PPMI study undergo dopamine transporter (DAT) imaging and
20
DAT deficit was required for enrollment into PD category. Healthy subjects have no
significant neurologic dysfunction, no first degree family member with PD and have
Montreal Cognitive Assessment > 26 (Kenneth Marek, et al., 2011).
B. DaTSCAN Imaging
As per the PPMI Imaging Protocol (Schedule of Activities) (http://www.ppmi-info.org/wp-
content/uploads/2010/07/Imaging-Manual.pdf), subjects with PD have DaTSCAN imaging at
screening and at months 12 (Visit 4), 24 (Visit 6), and 48 (Visit 10) or at prematural
withdrawal (if a scan has not been completed in the last 12 months). Healthy control subjects
have DaTSCAN imaging at screening. Prior to DaTSCAN injection, subjects are pretreated
with saturated iodine solution (10 drops in water) or perchlorate (1000 mg,). The target dose
for subjects is 185 MBq or 5.0 mCi of DaTSCAN. The dose range for injection is 111 to 185
MBq or 3.0 to 5.0 mCi of DaTSCAN. Subjects are imaged 4 ± 0.5 hours later.
Reconstructed SPECT scans from the PPMI Imaging sites are sent to the Imaging Core at
Institute for Neurodegenerative Disorders (IND) in New Haven, CT for visual assessment to
check for the evidence of dopamine transporter deficit. Two qualified readers assess each
scan and their assessment must be in agreement. If the reader’s assessments differ, the scan
will be adjudicated and the agreed interpretation will be sent to the site. The imaging
interpretation will serve as final criteria for enrolment into the study (http://www.ppmi-
info.org/wp-content/uploads/2013/02/PPMI-Protocol-AM5-Final-27Nov2012v6-2.pdf). For
each subject, the Imaging Core calculates Striatal Binding Ratios (SBR) values, which is the
DaTSCAN uptake in the striata, relative to the DaTSCAN uptake in the occipital area and
this ratio is the primary outcome that is used for quantitating dopamine transporters in
suspected parkinsonian syndromes.
C. Striatal binding ratio calculation
For calculating the striatal binding ratio (SBR) from a specific region, the Imaging Core of
the PPMI carried out following steps (http://www.ppmi-info.org/wp-
content/uploads/2013/06/Seibyl-PPMI-MDS-2013-Sydney__sjl.pdf):
1. Central SPECT Core lab iteratively (HOSEM) reconstructs the data from raw
projection data using HERMES (Hermes Medical Solutions, Skeppsbron 44, 111 30
Stockholm, Sweden) system.
2. The HOSEM reconstructed files were then transferred to the PMOD (PMOD
Technologies, Zurich, Switzerland) for subsequent processing including attenuation
correction based on phantoms acquired during the site visit.
3. Spatial normalization of image is carried out next to standard Montreal Neurologic
Institute (MNI)space to create consistent orientation.
4. Next the transaxial slice with the highest striatal uptake was identified and the 8
hottest striatal slices around it were averaged in to generate a single slice image.
5. Apply standard region of interest template on the four striatal regions (left and right
caudate, and left and right putamen), and the occipital cortex (reference region).

21
6. Extract count densities and calculate Striatal Binding Ratios (SBR) for each of the
four striatal regions using:
Striatal Binding Ratios (SBR) = Specific striatal binding/occipital reference region
= (Total striatal count density – occipital count density)/ occipital reference count
density