Embed Size (px)
Citation preview

Automatic Defect Inspection and Classification for PDP (Plasma
Display Panels)
By
Renyan Ge
A thesis
Presented to the University of Waterloo
in fulfillment of the
Thesis requirement for the degree of
Master of Applied Science
in
Systems Design Engineering
Waterloo, Ontario, Canada, 2003
Copyright 2003, Renyan Ge
ii
I hereby declare that I am the sole author of this thesis.
I authorize the University of Waterloo to lend this thesis to other institutions or
individuals for the purpose of scholarly research.
I further authorize the University of Waterloo to reproduce this thesis by photocopying
or by other means, in total or in part, at the request of other institutions or individuals
for the purpose of scholarly research.
ii
The University of Waterloo requires the signatures of all persons using or photocopying
this thesis. Please sign below, and give address and date.
iii
Abstract
The popularity of flat-panel displays (FPDs), including plasma display panels (PDPs)
and liquid-crystal displays (LCDs), has given rise to the need to streamline their
production. FPDs are increasingly replacing cathode-ray tube (CRT) screens, and are at
a critical juncture where high availability and lower prices will drive further customer
adoption. As a result, FPD manufacturers such as Pioneer, NEC, Fujitsu, Matsushita
and Sony are currently making large investments to drive their costs down. Currently
one of the most important, time-consuming and costly phases of FPD production is the
inspection process, in which automated optical inspection and image processing
techniques are used to identify production defects. Historically, the digital signal
processor (DSP) functions required by this application would be implemented in DSP
hardware processors. However, much higher speed DSP functions can be built using
programmable logic, which retains the needed flexibility of DSP processors while
achieving several magnitudes of a performance advantage compared to normal
multi-DSP processor systems.
This thesis presents a part of the research work at VTEC ( V Technology Co., Ltd.,
website: www.vtec.co.jp ) on developing a prototype automatic inspection system for PDP.
The main efforts of the research are placed on investigating algorithms for image
skeletonization, as well as the detection, extraction, and classification of defects. To this
end, automatic defects detection using binarization, DRC (design rule check) logic
design, binary morphology, skeletonization, and ADC (automatic defect classification)

iv
techniques are implemented. In this study, based on a wealth of image data provided by
PDP manufacturers, new algorithms for inspection and classification have been
developed. An attempt has been made to develop algorithms using advanced field
programmable gate array (FPGA) modules. The developed inspection algorithms have
been successfully installed in the PDP manufacturing process at Panasonic and Pioneer
Company. The ADC software has been installed in Panasonic PDP production line and is
used to help reduce the cost for quality control in the production line. In this
environment, the ADC software can reduce the inspection time from three minutes to
fifteen seconds per 50 inch PDP panel.

v
Acknowledgements
There are a great number of people who have contributed significantly to my graduate
life at the University of Waterloo.
My graduate life started with the prompting of my advisor Prof. David Clausi after I had
worked many years for a large Japanese engineering company. I would like to express
my gratitude to Prof. Clausi for his guidance through my studies and providing me with
invaluable advice and support during the duration of my graduate life at the University
of Waterloo. His suggestions and the many enriching discussions in the initial phases of
my research were instrumental to the success of my work. I would also like to thank him
for leaving me considerable space for independent work and for the financial support
provided for this project.
I would like to thank Profs. Ed. Jernigan, Paul Fieguth, and Andrew Wong for their
guidance and valuable lessons that helped my research.
I would also like to thank Mr. Sugimoto, the president of V Technology Co., Ltd. of Japan,
for giving me the opportunity to talk with numerous Japanese PDP manufacturers and
allowing me to collect the sample images required for my research. Thanks also to Mr.
Ron Strauss, the president of Avvida Systems Inc. Mr Strauss provided me with
facilities in which I could do my research and have access to Avvida’s FPGA based logic
vi
system allowing me to fully test my algorithms. Also thanks many engineers at Focus
Automation Systems Inc. including Mr. David Dolson and Mr. Dave Hoover for their
valuable suggestions and discussions during the development and integration phases of
my inspection systems for PDP products.
Thanks to my many Japanese friends for their valuable friendship and cooperation for
the experimental project and allowing me to install my software in a real world test
environment. These friends include Mr. Fujisawa and Mr. Takeda both of V Technology
Co., Ltd., as well as Mr. Nagamura and Mr. Tsuda both of Toray Engineering Co., Ltd. A
special thanks to Mr. Masahiro Narushima and Mr. Hiroshi Tokuhisa of Do Systems Co.,
Ltd. who allowed me to install and evaluate my algorithms at the Panasonic PDP factory
during the period of December 25, 2001 to January 5, 2002.
Thanks to my fellow students at the Visual Image Processing Group for their valuable
friendship and helpful discussions. Many thanks in particular to Bing Yue for her
valuable suggestions and discussions.
My acknowledgements also extend to my wife and my two sons. They have provided me
with incessant support during this long period and have put up with me working over
many evenings and weekends.
Finally, thanks go to my parents for their continual support and encouragement in all
aspects of life.
vii
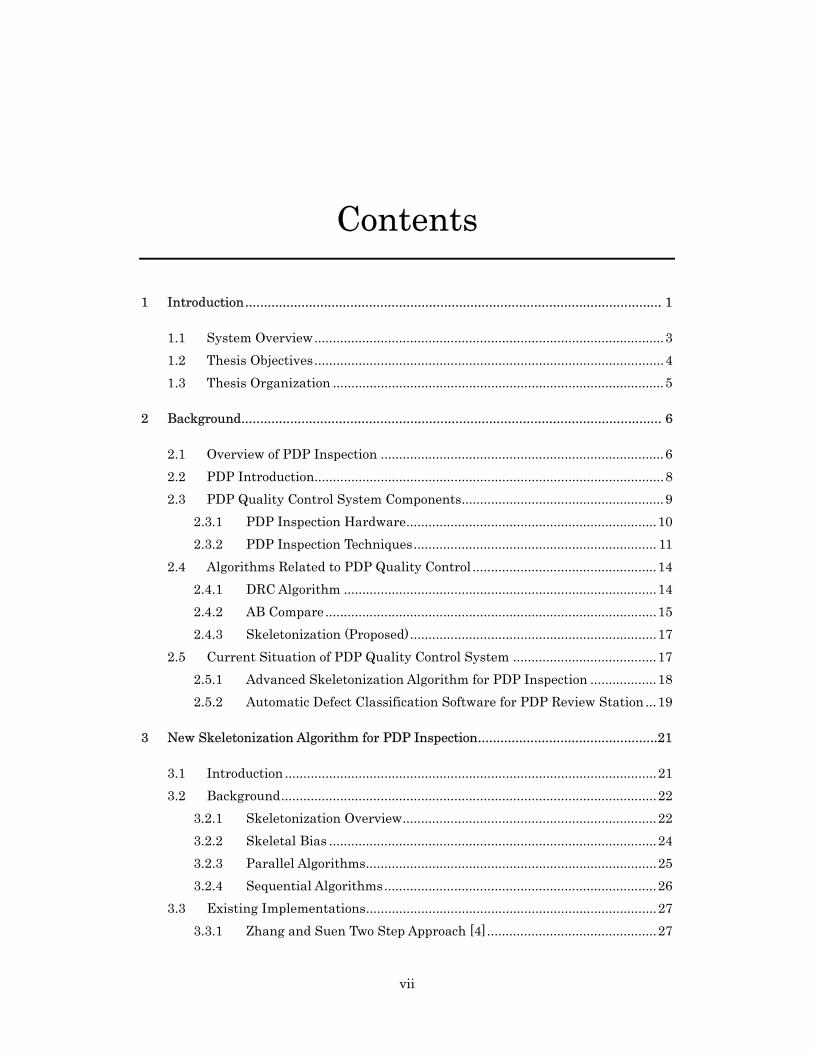
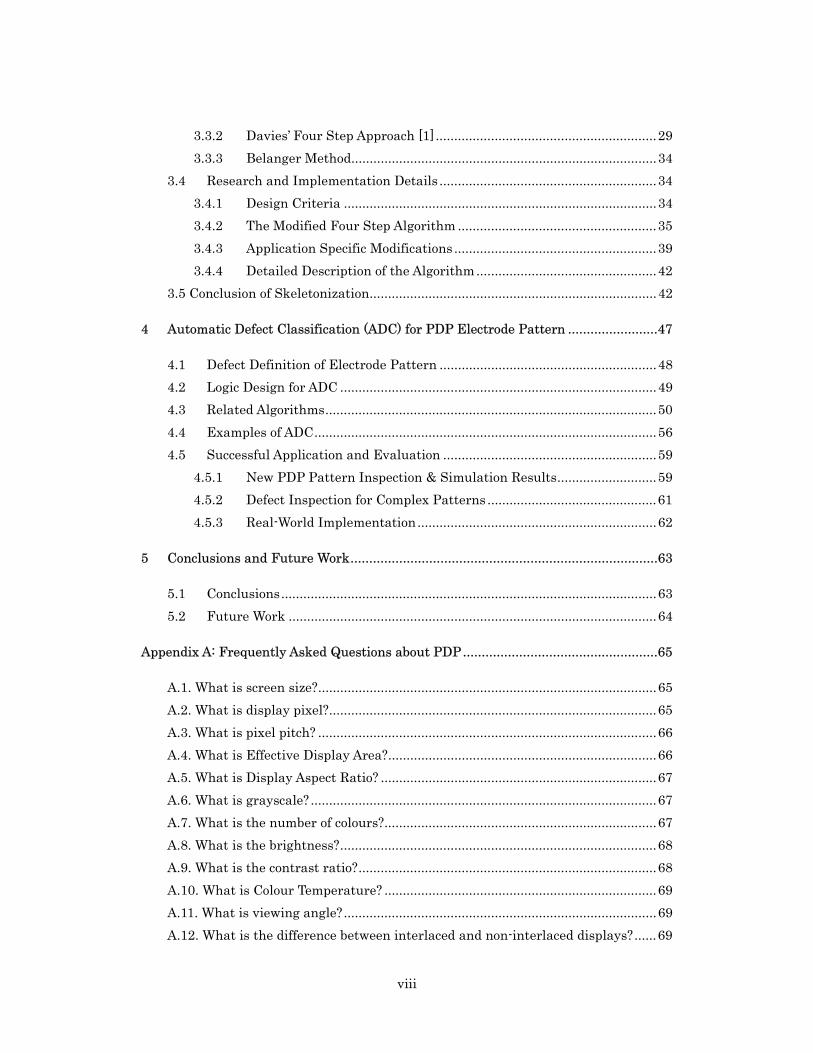
Contents
1 Introduction............................................................................................................... 1
1.1 System Overview...............................................................................................3
1.2 Thesis Objectives...............................................................................................4
1.3 Thesis Organization ..........................................................................................5
2 Background................................................................................................................ 6
2.1 Overview of PDP Inspection .............................................................................6
2.2 PDP Introduction...............................................................................................8
2.3 PDP Quality Control System Components.......................................................9
2.3.1 PDP Inspection Hardware....................................................................10
2.3.2 PDP Inspection Techniques.................................................................. 11
2.4 Algorithms Related to PDP Quality Control ..................................................14
2.4.1 DRC Algorithm .....................................................................................14
2.4.2 AB Compare..........................................................................................15
2.4.3 Skeletonization (Proposed)...................................................................17
2.5 Current Situation of PDP Quality Control System .......................................17
2.5.1 Advanced Skeletonization Algorithm for PDP Inspection ..................18
2.5.2 Automatic Defect Classification Software for PDP Review Station ...19
3 New Skeletonization Algorithm for PDP Inspection................................................21
3.1 Introduction .....................................................................................................21
3.2 Background......................................................................................................22
3.2.1 Skeletonization Overview.....................................................................22
3.2.2 Skeletal Bias .........................................................................................24
3.2.3 Parallel Algorithms...............................................................................25
3.2.4 Sequential Algorithms..........................................................................26
3.3 Existing Implementations...............................................................................27
3.3.1 Zhang and Suen Two Step Approach [4]..............................................27
viii
3.3.2 Davies’ Four Step Approach [1]............................................................29
3.3.3 Belanger Method...................................................................................34
3.4 Research and Implementation Details ...........................................................34
3.4.1 Design Criteria .....................................................................................34
3.4.2 The Modified Four Step Algorithm ......................................................35
3.4.3 Application Specific Modifications .......................................................39
3.4.4 Detailed Description of the Algorithm.................................................42
3.5 Conclusion of Skeletonization..............................................................................42
4 Automatic Defect Classification (ADC) for PDP Electrode Pattern ........................47
4.1 Defect Definition of Electrode Pattern ...........................................................48
4.2 Logic Design for ADC ......................................................................................49
4.3 Related Algorithms..........................................................................................50
4.4 Examples of ADC.............................................................................................56
4.5 Successful Application and Evaluation ..........................................................59
4.5.1 New PDP Pattern Inspection & Simulation Results...........................59
4.5.2 Defect Inspection for Complex Patterns ..............................................61
4.5.3 Real-World Implementation.................................................................62
5 Conclusions and Future Work..................................................................................63
5.1 Conclusions......................................................................................................63
5.2 Future Work ....................................................................................................64
Appendix A: Frequently Asked Questions about PDP....................................................65
A.1. What is screen size?............................................................................................65
A.2. What is display pixel?.........................................................................................65
A.3. What is pixel pitch? ............................................................................................66
A.4. What is Effective Display Area?.........................................................................66
A.5. What is Display Aspect Ratio? ...........................................................................67
A.6. What is grayscale? ..............................................................................................67
A.7. What is the number of colours?..........................................................................67
A.8. What is the brightness?......................................................................................68
A.9. What is the contrast ratio?.................................................................................68
A.10. What is Colour Temperature? ..........................................................................69
A.11. What is viewing angle?.....................................................................................69
A.12. What is the difference between interlaced and non-interlaced displays?......69

ix
A.13. What is the difference between Analogue Interface and Digital Interface? ..70
A.14. What is digital RGB?........................................................................................71
A.15. What is analogue RGB?....................................................................................71
Appendix B: PDP Inspection Machine and Review Station of V Technology Co., Ltd. ..72
B.1. V Technology Co., Ltd. (www.vtec.co.jp) ............................................................72
B.2. PDP Inline Pattern Inspection System..............................................................73
B.3. PDP Review Station ...........................................................................................74
Appendix C: Test Images and Results Based on New Skeletonization Algorithm.........75
Appendix D: Detail Logic Design of the Related Algorithms..........................................83
Subroutine one: Generate Skeletonization Look-up Tables .....................................84
Subroutine two: Modified Four Step Skeletonization (12 cycle approach) ..............85
Subroutine three: Logic Design for Defect Classification Based on Feature Points....................................................................................................................................86
References........................................................................................................................93
x
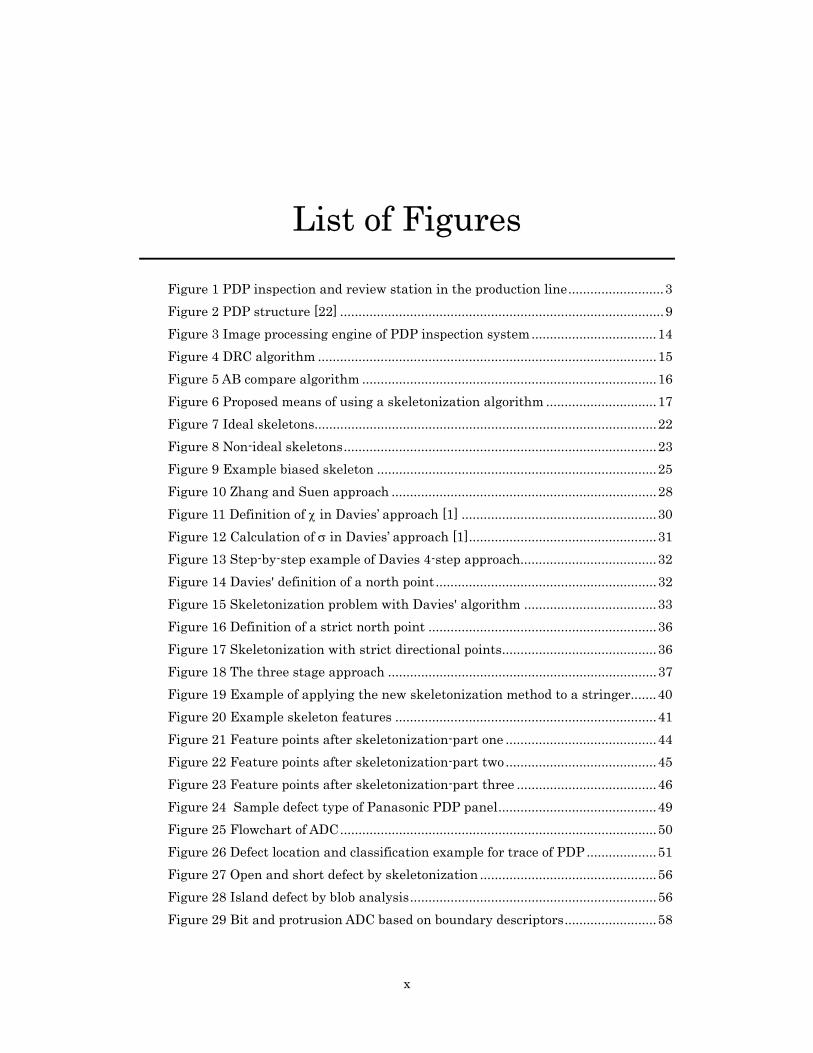
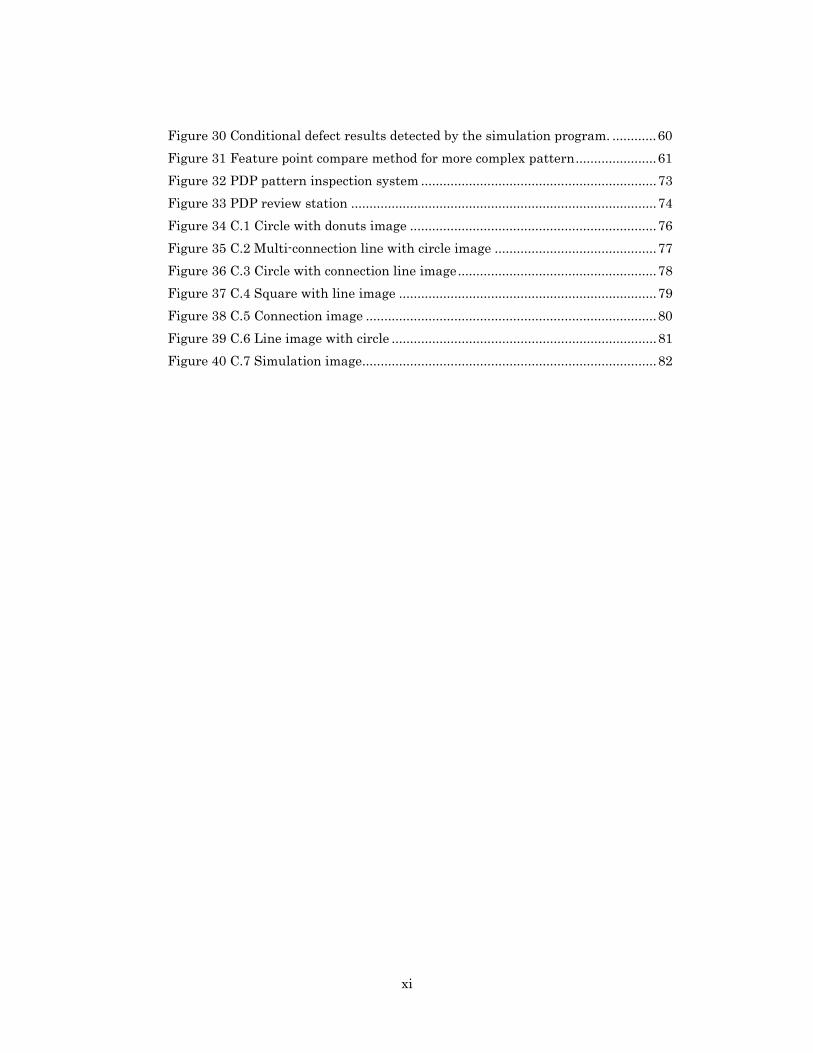
List of Figures
Figure 1 PDP inspection and review station in the production line..........................3
Figure 2 PDP structure [22] ........................................................................................9
Figure 3 Image processing engine of PDP inspection system..................................14
Figure 4 DRC algorithm ............................................................................................15
Figure 5 AB compare algorithm ................................................................................16
Figure 6 Proposed means of using a skeletonization algorithm ..............................17
Figure 7 Ideal skeletons.............................................................................................22
Figure 8 Non-ideal skeletons.....................................................................................23
Figure 9 Example biased skeleton ............................................................................25
Figure 10 Zhang and Suen approach ........................................................................28
Figure 11 Definition of χ in Davies’ approach [1] .....................................................30
Figure 12 Calculation of σ in Davies’ approach [1]...................................................31
Figure 13 Step-by-step example of Davies 4-step approach.....................................32
Figure 14 Davies' definition of a north point............................................................32
Figure 15 Skeletonization problem with Davies' algorithm ....................................33
Figure 16 Definition of a strict north point ..............................................................36
Figure 17 Skeletonization with strict directional points..........................................36
Figure 18 The three stage approach .........................................................................37
Figure 19 Example of applying the new skeletonization method to a stringer.......40
Figure 20 Example skeleton features .......................................................................41
Figure 21 Feature points after skeletonization-part one .........................................44
Figure 22 Feature points after skeletonization-part two.........................................45
Figure 23 Feature points after skeletonization-part three ......................................46
Figure 24 Sample defect type of Panasonic PDP panel...........................................49
Figure 25 Flowchart of ADC......................................................................................50
Figure 26 Defect location and classification example for trace of PDP ...................51
Figure 27 Open and short defect by skeletonization ................................................56
Figure 28 Island defect by blob analysis...................................................................56
Figure 29 Bit and protrusion ADC based on boundary descriptors.........................58
xi
Figure 30 Conditional defect results detected by the simulation program. ............60
Figure 31 Feature point compare method for more complex pattern......................61
Figure 32 PDP pattern inspection system ................................................................73
Figure 33 PDP review station ...................................................................................74
Figure 34 C.1 Circle with donuts image ...................................................................76
Figure 35 C.2 Multi-connection line with circle image ............................................77
Figure 36 C.3 Circle with connection line image......................................................78
Figure 37 C.4 Square with line image ......................................................................79
Figure 38 C.5 Connection image ...............................................................................80
Figure 39 C.6 Line image with circle ........................................................................81
Figure 40 C.7 Simulation image................................................................................82
- 1 -
1 Introduction
Over the past few years machine vision has consolidated its early promise and has
become a vital component in the design of advanced manufacturing systems. An
important application of machine vision – automated assembly line inspection – can be
performed using vision systems employing dedicated algorithms. An obvious use of
inspection is to check products for quality so that defective products may be rejected or
modified to satisfy a quality index. Also, one can measure specific parameters to classify
particular defects. Plasma display panels (PDPs) must be inspected on the production
line to ensure quality control. PDPs are expected to represent the next generation of
displays in the new century. PDPs are an improvement over traditional cathode-ray
tubes (CRTs) since they produce a clearer image and occupy less space. Automated
machine vision procedures to find defects in PDP panels will save considerable time and
money. Defects in the PDPs take on many forms and different techniques that classify
each of these various defects must be developed.
Current PDP inspection equipment takes a long time to detect major defects because it
requires the collection of a statistically confident sample. The challenge for future
inspection and yield management solutions will be to produce predictive systems that
have sufficient sensitivity and repeatability to prevent defect excursions by
automatically alerting the user to potential problems or modifying equipment
parameters before significant yield loss occurs. To effectively accomplish this, the
2
various components must be closely integrated into an overall yield management
solution. Linking these elements through intelligent software algorithms will result in a
system with close interaction that will provide users with immediate, powerful data
feedback.
The related emerging technology that is already beginning to have a huge impact on
PDP yield enhancement is automatic defect classification (ADC) [24]. ADC replaces
manual microscope classification inspections performed by engineers and technicians,
providing higher performance in classification accuracy and repeatability (by reducing
subjectivity and classification error), and significantly increases the overall throughput.
ADC can be performed during a single pass inspection working together with an
inspection machine, through a second-pass classification on an inspection system output,
or off-line on a review station.
An ideal inspection system would detect the defect features and provide the information
on how to repair it in a short time. To do this economically, we need to identify the defect
types and their relationship with the production line, so that cost-effective defect
inspection systems can be built. The system can only seek specific problems at specific
times. More detailed defect information require reducing the speed of the production
equipment and will generate longer inspection times. New solutions be required to
provide cost-effective defect detection, classification, and control for very small defects
and finer geometry. Using a wealth of image data provided by PDP manufacturers (eg.,
Panasonic, Pioneer, NEC, etc.) a new skeletonization algorithm for inspection and
classification be developed. This is the purpose and the target of this research work
aiming at reducing the production line cost.
3
1.1 System Overview
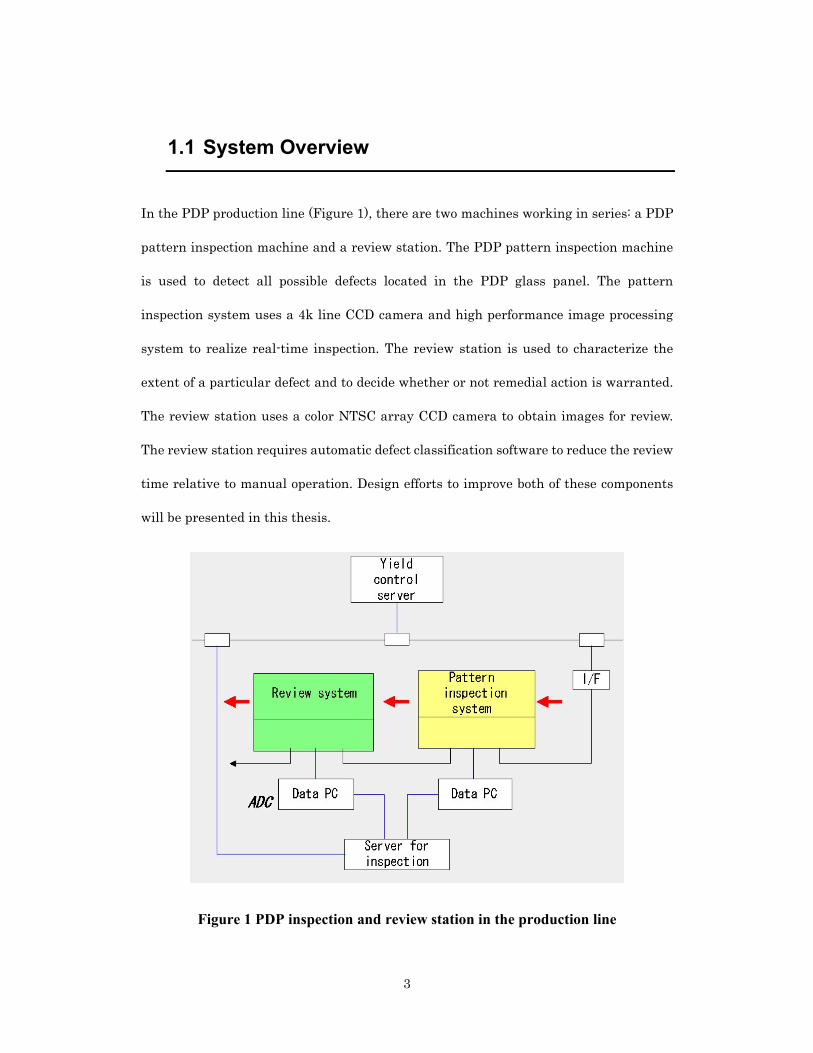
In the PDP production line (Figure 1), there are two machines working in series: a PDP
pattern inspection machine and a review station. The PDP pattern inspection machine
is used to detect all possible defects located in the PDP glass panel. The pattern
inspection system uses a 4k line CCD camera and high performance image processing
system to realize real-time inspection. The review station is used to characterize the
extent of a particular defect and to decide whether or not remedial action is warranted.
The review station uses a color NTSC array CCD camera to obtain images for review.
The review station requires automatic defect classification software to reduce the review
time relative to manual operation. Design efforts to improve both of these components
will be presented in this thesis.
Figure 1 PDP inspection and review station in the production line

4
In the production line, the inspection machine processes the PDP first. The type and
coordinates of each defect are passed to the review station. The review station will
automatically make the decision about whether or not the PDP can be repaired, based on
the nature of the defects.
1.2 Thesis Objectives
The overall objective of this thesis is to design an improved means to automatically
identify objects in PDPs and implement this methodology in a real-world environment.
To achieve this overall goal, the following objectives will be accomplished.
Skeletonization is a critical part of inspecting the PDP images for defects.
Shortcomings of current skeletonization algorithms restrict their use in real-world
applications. This thesis will demonstrate these shortcomings and recent improved
means of performing skeletonization.
The automatic defect classification component of existing PDP inspection systems is
unable to consistently detect all possible defects in PDP images. As a result,
considerable manual intervention is required. This thesis will demonstrate
improved means to characterize these defects and completely remove any manual
needs.
The algorithms will be implemented and tested on an industry PDP assembly line.
This will demonstrate that the proposed algorithms will improve the throughput
and detection rate compared to the current systems.
5
1.3 Thesis Organization
Chapter 2 will present the background knowledge about PDP and PDP inspection. In
Chapter 3, the new skeletonization algorithm for PDP inspection will be introduced in
detail. Chapter 4 cover the topics on automatic defect classification (ADC) of PDPs after
the inspection procedure. Chapter 5 presents research conclusions and gives some
suggestions for future work. Some knowledge related to PDPs is added and figures from
simulation and real world are added for better understanding of the thesis as a set of
appendices.

6
2 Background
2.1 Overview of PDP Inspection
Many important applications of vision are found in the manufacturing and defense
industries. In particular, the areas in manufacturing where vision plays a major role are
inspection, measurement, and assembly. The emphasis among these topics closely
reflects the manufacturing needs. In most mass-production manufacturing facilities, an
attempt is made to achieve 100% quality assurance of all parts, subassemblies, and
finished products. One of the most difficult tasks in this process is that of inspecting for
visual appearance --- an inspection that seeks to identify both functional and cosmetic
defects. Advances in computers (including high speed, large memory, and low cost),
image processing, pattern recognition, and artificial intelligence have resulted in
important functionality and cheaper equipment for industrial image analysis. This
development has made the electronics industry active in applying automated visual
inspection to manufacturing/fabricating processes of printed circuit boards, photomasks,
etc. PDP inspection technology is a relatively new application in the semiconductor
inspection field.
Human operators monitor the results of many process steps required to fabricate a PDP.
They simply inspect the work visually against prescribed standards. The decisions made
by these human inspectors often involve subjective judgement, in addition to being labor
intensive and therefore costly, whereas automatic inspection systems remove the

7
subjective aspects and provide potentially faster, quantitative, and objective
assessments. These automatic systems do not fatigue. Applied at each appropriate step
of the assembly process they can determine a defect, reduce rework costs, and make
electrical testing and repairing more efficient. All of this means improving quality at a
lower cost. Over the years many researchers [25, 26, 27] have emphasized the
importance of automatic inspection systems in the electronics industry.
The major PDP manufacturing stages and process steps involve bare-board fabrication
(glass based), electrode pattern printing, rib pattern design, loaded board assembly, and
soldered board process. The increase in automated production line technology has
rapidly initiated substitutes for human visual inspection. These automatic systems have
been produced with distinct and limited capability for covering the fault spectrum at
each significant stage of PDP manufacture. Today the machine vision community
considers automatic PDP inspection to be a very useful industrial visual inspection
application. Every PDP panel built today has been automatically inspected. The main
reasons that automatic inspection is used in PDP production include the following.
1. The automatic inspection machines relieve human inspectors of tedious tasks.
2. Manual inspection is slow and costly.
3. Some inspection procedures such as fluorescent paint patterns are not suitable for
human eyes to inspect, because the ultraviolet light source is used for such
inspection systems. The human can not inspect ultraviolet images because
ultraviolet light is harmful to human health.
4. With the aid of magnifying lens, the average fault-finding rate of a human being is
8
about 90% (reported by a Panasonic PDP manufacturer). However, with further
development of PDP technology, the electrode pattern’s design will become smaller
and smaller. Given that this can be on the order of micrometers, it is very hard to
manually inspect even using a magnifying lens.
5. The industry has set quality levels so high that sampling inspection is not
applicable.
6. Production rates are so high that manual inspection is not feasible.
7. Tolerances are so tight that manual visual inspection is inadequate.
Most vision systems for automated industrial inspection are custom designed, so they
are only suitable for one specific application. With regards to PDP, the companies NEC,
Panasonic and Pioneer all use similar manufacturing processes.
2.2 PDP Introduction
To understand PDP quality control and defect inspection, knowledge of PDP
architecture is helpful. Compared to CRT, a PDP has virtually unlimited screen size, a
thin and light weight construction, distortion free images, self-lighting, and a wide
viewing angle. As an example, consider the specification of a PDP built by NEC. NEC’s
color PDP has an AC-type structure (Figure 2). The PDP is composed basically of two
sheets of glass set a few hundred microns apart. Between the glass substrates, there are
pixels containing cells which are filled with inert gases (xenon, neon, etc.). The cells are
each coated on the bottom with a different color of phosphor --- red, green or blue. Thin
electrodes can be found at the top and bottom of the glass substrates.

9
Figure 2 PDP structure [22]
2.3 PDP Quality Control System Components
In this section, the most commonly used terminology in this field will be briefly defined.
This section also identifies the major components of an inspection system. Most of the
defects and techniques of defect analysis are typical for PDP systems. It is worth
mentioning that some of these techniques would be used in other types of inspection
systems such as those used for printed circuit boards and LCDs. The following outlines
some of the major components involved in automated visual inspection system:
hardware systems and inspection algorithms.
10
2.3.1 PDP Inspection Hardware
Industrial PDP visual inspection ideally requires a cost-effective off-the-shelf system.
This means that it should be designed to take into account operation speed, reliability,
ease of use, and modular flexibility, in order to adapt to different inspection tasks. The
main hardware components of the inspection system are the material and
component-handling system, illumination system, image acquisition system, and the
processor.
The illumination system provides suitable lighting and viewing conditions to facilitate
inspection, avoiding the need for additional complex image processing algorithms. Many
researchers have pointed out the importance of lighting techniques [5,6,7]. The main
parameters that characterize the suitability of an illumination system to acquire a
quality image are: (a) intensity, (b) uniformity, (c) directionality, and (d) spectral profile.
The relative importance of these parameters and the degree to which each one must be
controlled are largely governed by the surface characteristics of a given PDP and the
constraints imposed by the camera. For some special patterns of PDP such as phosphor,
a special UV light source is needed.
Images are usually acquired by use of a camera or a digitizer that acts as a sensor. There
are several types of cameras available (eg. CCD, laser scanners) and the determination
of the appropriate type is dictated by use. The line scan camera can be used for high
speed inspection purposes, eg., Dalsa’s line scan camera (http://www.dalsa.com). Every
camera has its own microprocessor system to support functions such as automatic focus,
automatic exposure, and real-time digitization facilities.
11
The processor system usually consists of a high speed computer. The commercially
available inspection system Cyberscan (made by Avvida Systems Inc. Canada) uses a
high speed parallel processing system. In this system all algorithms are realized by
FPGA (field programmable gate array) hardware, so it can process the data in real-time.
Any adequate vision system must have sufficient resolution to detect the potential faults
under inspection. The pixel size of the smallest fault to be detected should be at least
twice that of the vision system. For example, a two micrometer minimum fault size
requires a one micrometer system pixel size. A smaller pixel size usually means a
smaller field of vision if no compensating techniques are employed (multiple cameras,
etc.). The resolution range of the PDP inspection systems employed here is 3.5
micrometres to 15 micrometres. So given a 42-inch PDP panel approximately 50GB of
data must be processed in about 60 seconds.
2.3.2 PDP Inspection Techniques
Since PDP inspection behaves like most general pattern inspection systems, some
common image processing techniques should be mentioned here.
Image Enhancement
Image enhancement involves aspects such as noise removal, edge enhancement, and
contrast enhancement. Thresholding and convolution are examples of picture processing
(processing over the entire image) techniques used for image enhancement.
12
Feature Extraction
The decision regarding what features are to be considered depends on the nature of the
object to be identified. Features provide data reduction while preserving the information
required for the inspection. Once an image has been clearly segmented into discrete
objects of interest, the next step in the image analysis process is to measure the
individual features of each object. Many features can be used to describe an object. Most
of the procedures used for feature extraction involve edge detection, line tracing, and
shape description techniques.
Model-Based System
The most common inspection technique is the model-based process [28, 29], which
performs inspection by matching the part under inspection with a set of predefined
models.
Modeling
Modeling involves training, in which the user uses a model part to teach the system the
features to be examined, their relations, and their acceptable tolerances.
Detection/Verification
The detection process consists of matching the extracted features from the image under
inspection with those of the predefined model. A typical detection procedure involves
simple comparison, such as image subtraction. The detection process becomes very
complex if the image to be inspected is noisy and features could occur at random
positions and orientations. Detection using representative features and their
13
relationships provide a way to inspect a part and locate defects on the basis of
measurements taken from key features. These methods are usually computationally
intensive.
Boundary Analysis
Models of accurate boundaries are compared with those of the PDP patterns being
inspected. Fourier Descriptors are an often used method for boundary analysis [8].
Morphological Operator
Thinning, contraction, and expansion are basic transformation operations. These
operations are defined using neighborhood connectivity relations. An expansion sets all
background pixels in an image to foreground pixel value, if any one of the neighboring
pixel values is equal to the foreground pixel value. Thinning reduces an entity to its
skeleton, a simplified version contained in the original entity that retains the basic
shape of an entity. Unlike expansion or contraction, thinning maintains the connectivity
of an entity and preserves its holes (none are removed or added). There are several
different definitions and implementations of these operations that can be found in some
image processing textbooks [9,10,11], or recent published papers [12,13].
Morphology [21, 22] refers to a branch of nonlinear image processing and analysis. The
basic idea is to probe an image with a structuring element and quantify the manner in
which the structuring element fits (or does not fit) within the image. The operations of
dilation, erosion, opening, closing, etc., are used in this type of image processing.
14
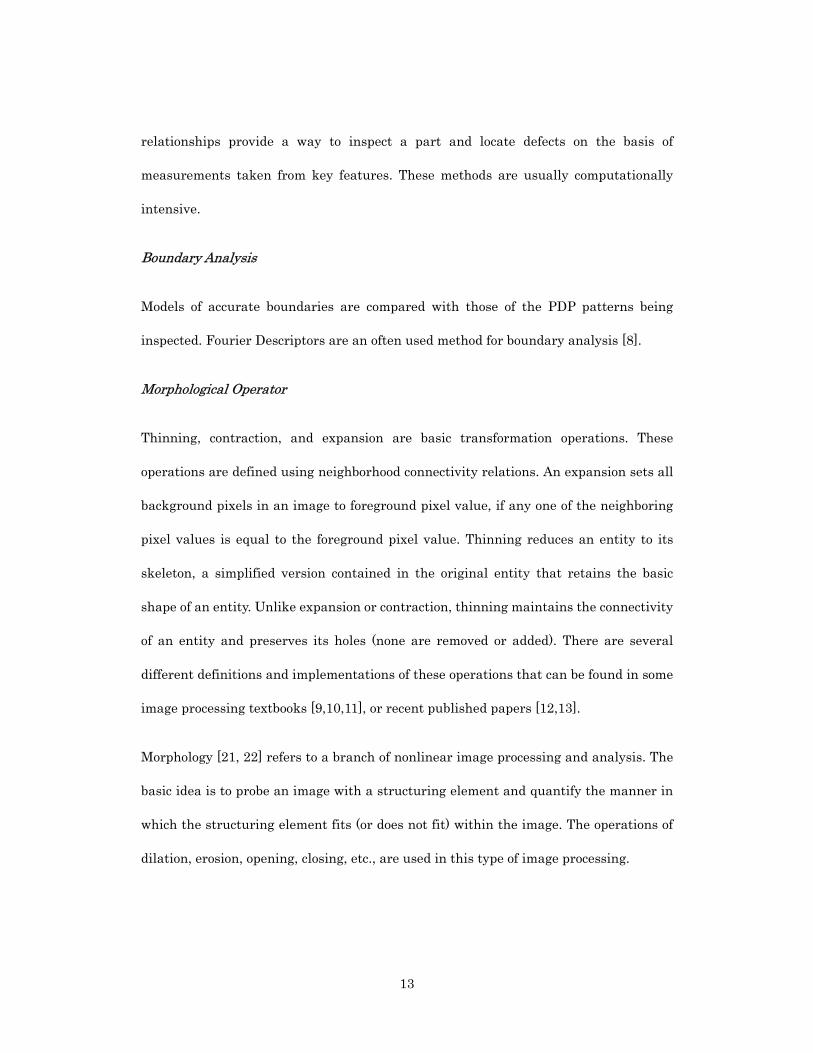
2.4 Algorithms Related to PDP Quality Control
Figure 3 Image processing engine of PDP inspection system
There are two algorithms currently working in the image processing engine of the PDP
inspection system (Figure 3): AB compare and design rule check (DRC). All algorithms
are implemented using a parallel processing system. The skeletonization algorithm
should be added to improve the inspection system. These three components will now be
described.
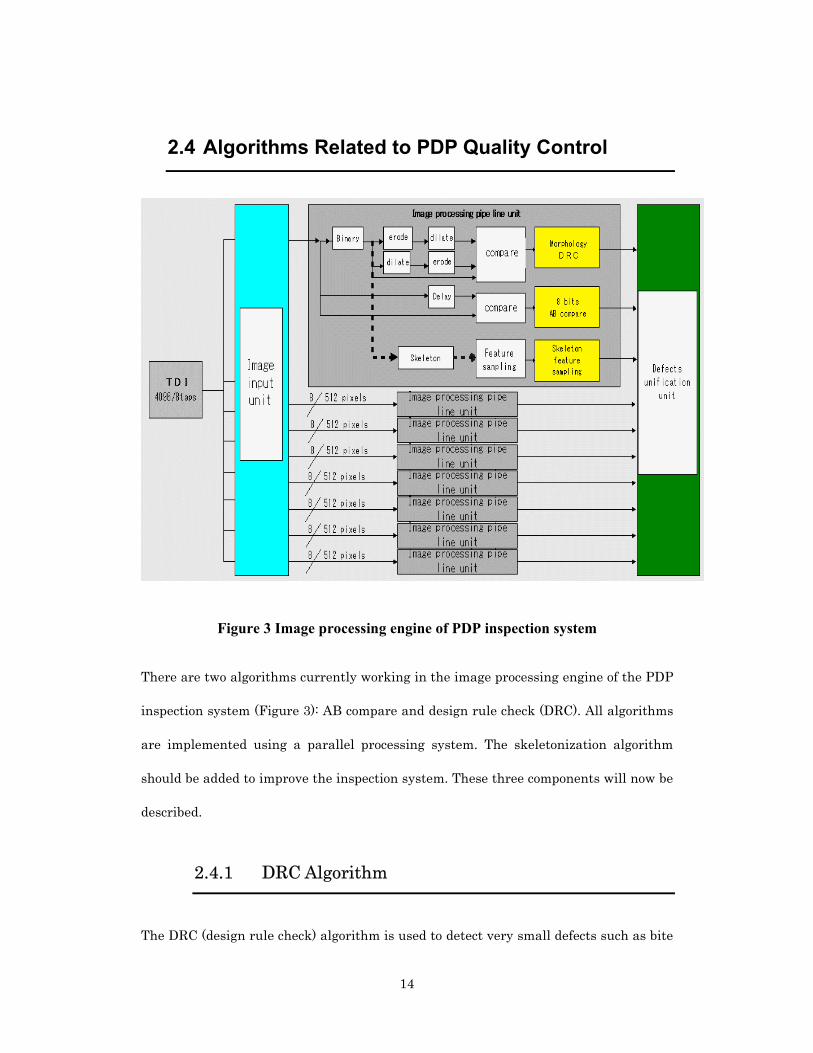
2.4.1 DRC Algorithm
The DRC (design rule check) algorithm is used to detect very small defects such as bite
15
and protrusion (see Ch. 4.2 for a description of these defects). The DRC algorithm is a set
of morphological operators, as shown in Figure 4. This algorithm can only detect very
small defects such as mouse bite, protrusion, and very thin shorts and opens, but can not
detect wide shorts and opens. It is necessary for DRC to work together with other
algorithms such as skeletonization to detect relatively larger defects.
Figure 4 DRC algorithm
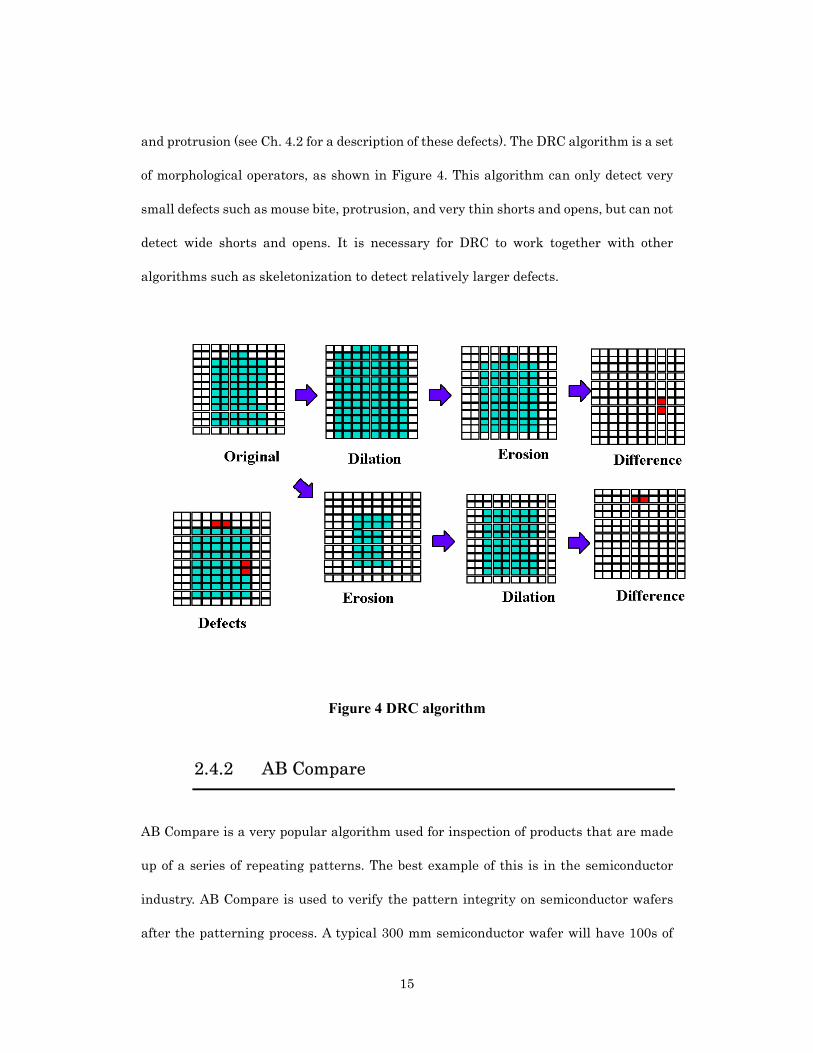
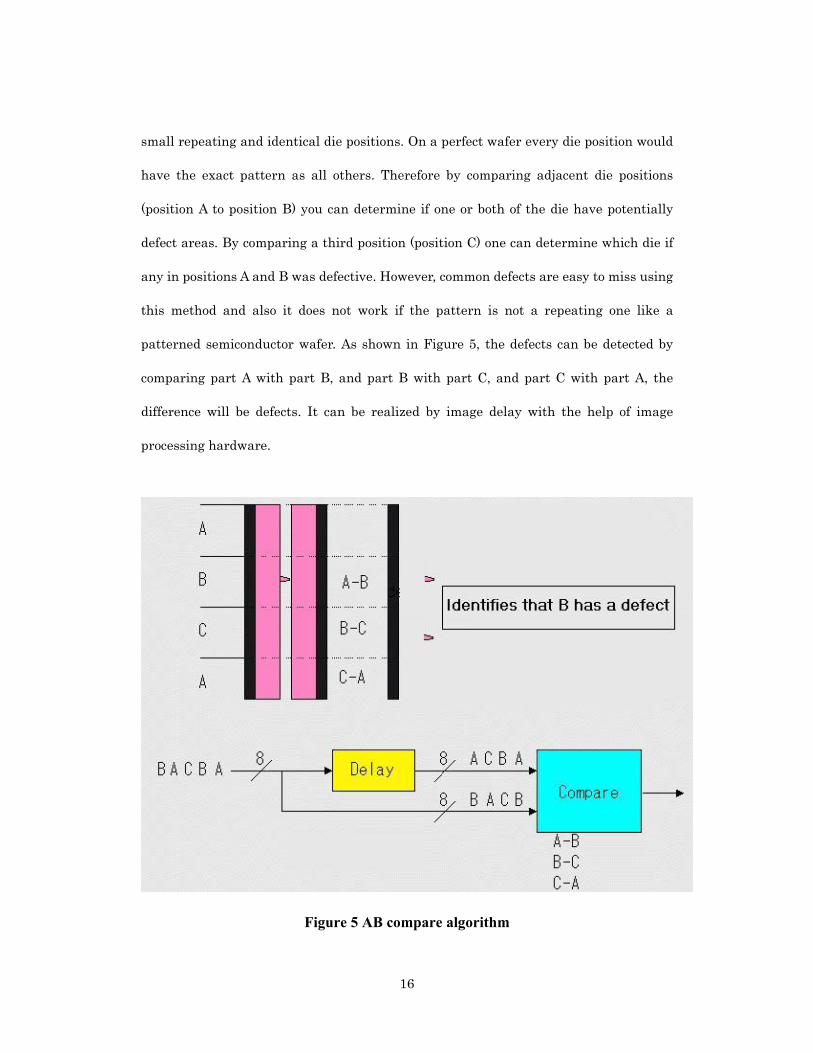
2.4.2 AB Compare
AB Compare is a very popular algorithm used for inspection of products that are made
up of a series of repeating patterns. The best example of this is in the semiconductor
industry. AB Compare is used to verify the pattern integrity on semiconductor wafers
after the patterning process. A typical 300 mm semiconductor wafer will have 100s of
16
small repeating and identical die positions. On a perfect wafer every die position would
have the exact pattern as all others. Therefore by comparing adjacent die positions
(position A to position B) you can determine if one or both of the die have potentially
defect areas. By comparing a third position (position C) one can determine which die if
any in positions A and B was defective. However, common defects are easy to miss using
this method and also it does not work if the pattern is not a repeating one like a
patterned semiconductor wafer. As shown in Figure 5, the defects can be detected by
comparing part A with part B, and part B with part C, and part C with part A, the
difference will be defects. It can be realized by image delay with the help of image
processing hardware.
Figure 5 AB compare algorithm

17
2.4.3 Skeletonization (Proposed)
Development of a skeletonization algorithm is proposed to compensate for the deficiency
of the DRC and AB Compare algorithms for PDP inspection for the relative big open and
short defects, especially with respect to the terminal part of the PDP panel. As shown in
Figure 6, if the DRC algorithm is combined with an appropriate skeletonization
algorithm, the relative big open and short defects will be detected by feature point based
identification.
Figure 6 Proposed means of using a skeletonization algorithm
2.5 Current Situation of PDP Quality Control System
As discussed in Chapter 1, the quality control system in PDP production line includes
two parts: the inspection system and the review station. The current inspection system
18
is unable to detect large defects found in the PDP panel. A skeletonization algorithm is
proposed to deal with this problem. The review station is unable to automatically
classify defects. An algorithm to perform automatic defect classification will be
presented. Hence, the two systems are briefly described. Details of the solution are
found in Chapter 3 (Skeletonization) and Chapter 4 (Automatic Defect Classification).
2.5.1 Advanced Skeletonization Algorithm for PDP
Inspection
V Technology (VTEC) is a company that specializes in the design of automated optical
inspection systems. Please refer to Appendix B.1 for more details about VTEC. These
systems are designed to inspect various products, ranging from lottery tickets to
state-of-the-art flexible circuit and PDP technologies.
Skeletonization is an image processing technique that reduces complex, thick-lined
images to a series of single pixel lines which accurately represent the original shapes.
This procedure is especially useful to simplify automated applications requiring simple
shape analysis and continuity checking by reducing the amount of redundant image
data.
At VTEC, skeletonization is a key process used to detect defects during plasma display
panel (PDP) inspection, ball grid array (BGA) inspection, printed circuit board (PCB)
inspection and flexible circuit (FLEX) inspection. In the systems developed, the majority
of the algorithms used are implemented on an RCON Module (Reconfigureable Module) -
a part of the proprietary, generic image analysis platform. The "skel" module, which
19
executes the skeletonization algorithm during an inspection, is realized using an RCON
and is designed to be used as one of the many stages of an image inspection pipeline.
The skeletonization team was responsible for the development of the necessary
algorithms, firmware and software to provide fast and accurate image skeletonization
and skeleton analysis. Most of this functionality had to be implemented in hardware due
to speed requirements. The details of the hardware implementation are proprietary and
as a result they are not discussed here.
The skeletonization algorithm was implemented in hardware and a basic "personality"
was written for the RCON, but it was missing some of the required functionality. The
author began working on this project with the development of an advanced
skeletonization personality for the RCON. Debugging portions of the host side software
was also employed in an application of this work. The work concluded with the research
and design of a new algorithm to perform the skeletonization.
2.5.2 Automatic Defect Classification Software for PDP
Review Station
Contamination-induced defects (eg. dust, etc.) are a major source of yield loss in the
semiconductor industry. Defect detection, review and analysis are critical steps toward
understanding and eliminating these sources of yield loss. Automatic defect detection on
PDP must be accomplished at high speed and with high sensitivity. However, defect
review and analysis are currently performed manually. This is costly because manual
defect classification is generally more time and labor intensive than the inspection itself,
20
even when only a small number of defects is reviewed. Moreover, manual classification is
frequently inaccurate and inconsistent due to human error and bias.
Automatic defect classification (ADC) is an emerging defect management technology
that uses computer-based artificial intelligence to replace human defect classification.
ADC can reduce manufacturing costs by improving review station productivity and
increasing data accuracy [27]. By providing faster defect review and classification,
larger defect sample sizes can be collected to identify a statistically significant source of
yield loss. Additional sampling can help minimize the risk of missed yield excursions.
Since ADC is computer-based, it has the potential to provide greater classification
accuracy and reproducibility. Most important, ADC technologies may alleviate the
burden of defect review on manufacturing staff, allowing them to focus on eliminating
the root causes of yield loss.
The goal of the ADC project is to accelerate the development of ADC technologies for
in-line defect inspection and review applications. The ADC program has been installed
on a review station. The systems consist of commercially available optical microscopes
equipped with ADC software. They have been evaluated against a comprehensive set of
performance metrics including accuracy, repeatability, and speed. The evaluation has
been accomplished in the manufacture of PDPs and the first customer was Matsusita
Electric Industrial Co., Ltd. (National/Panasonic).
21
3 New Skeletonization Algorithm for PDP Inspection
3.1 Introduction
Skeletonization is a process designed to reduce objects in any binary image to a set of
single pixel lines that are an accurate representation of the overall original shape [9, 10].
Research has been conducted in the field of image processing to determine various
methods to efficiently perform skeletonization.
Various optical inspection systems developed at VTEC utilize skeletonization as a key
process in the computerized detection of manufacturing defects. By reducing complex
images to a simple set of basic features, including intersections and endpoints, defect
analysis can be performed more easily.
The purpose of this investigation is to research the development of a new skeletonization
algorithm. This was prompted by the shortcomings of the existing skeletonization
procedure which prevented it from correctly skeletonizing circles. The goal of this
research is to provide a new technique that properly reduces circles to dots and more
accurately maintains the shapes of objects during the skeletonization process. The new
algorithm has been designed to replace the existing one at VTEC.
Here, the concept of skeletonization, some of its background theory and two existing
algorithms currently in use are discussed. The design criteria for a new skeletonization
algorithm, its development, and the outline of some application-specific modifications
22
which can be made to deal with various input and output requirements as discussed.
3.2 Background
3.2.1 Skeletonization Overview
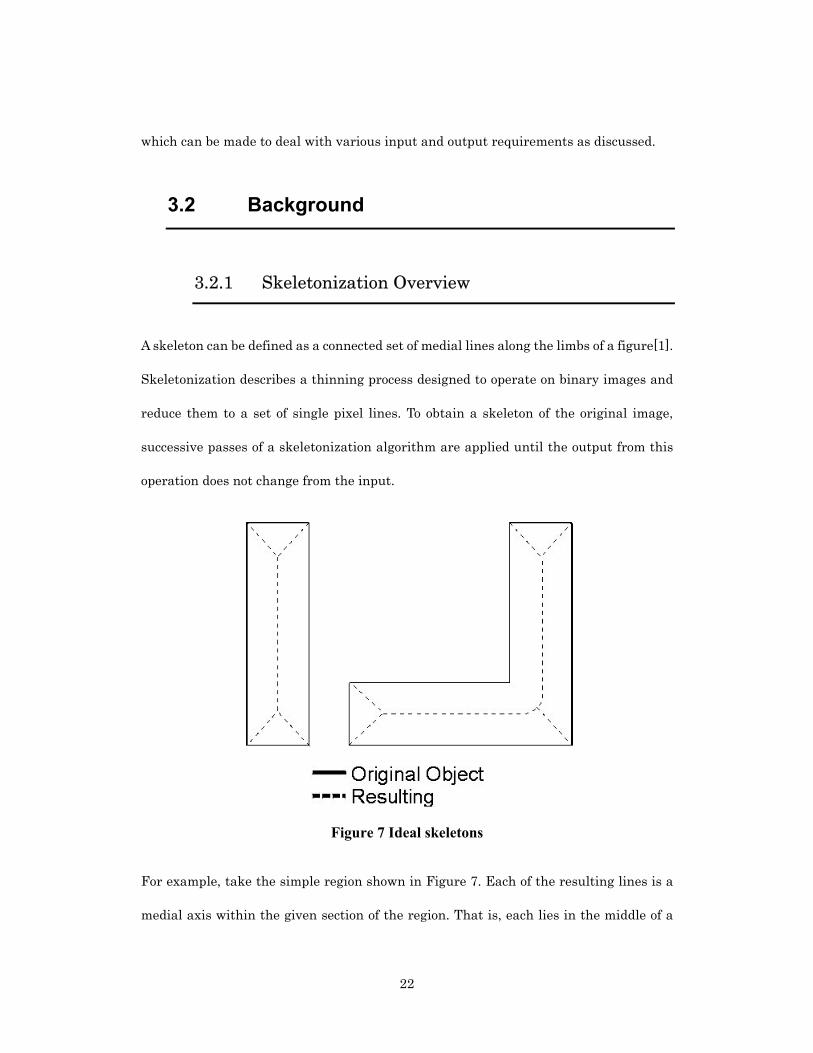
A skeleton can be defined as a connected set of medial lines along the limbs of a figure[1].
Skeletonization describes a thinning process designed to operate on binary images and
reduce them to a set of single pixel lines. To obtain a skeleton of the original image,
successive passes of a skeletonization algorithm are applied until the output from this
operation does not change from the input.
Figure 7 Ideal skeletons
For example, take the simple region shown in Figure 7. Each of the resulting lines is a
medial axis within the given section of the region. That is, each lies in the middle of a
23
region, equidistant from the boundaries of that region.
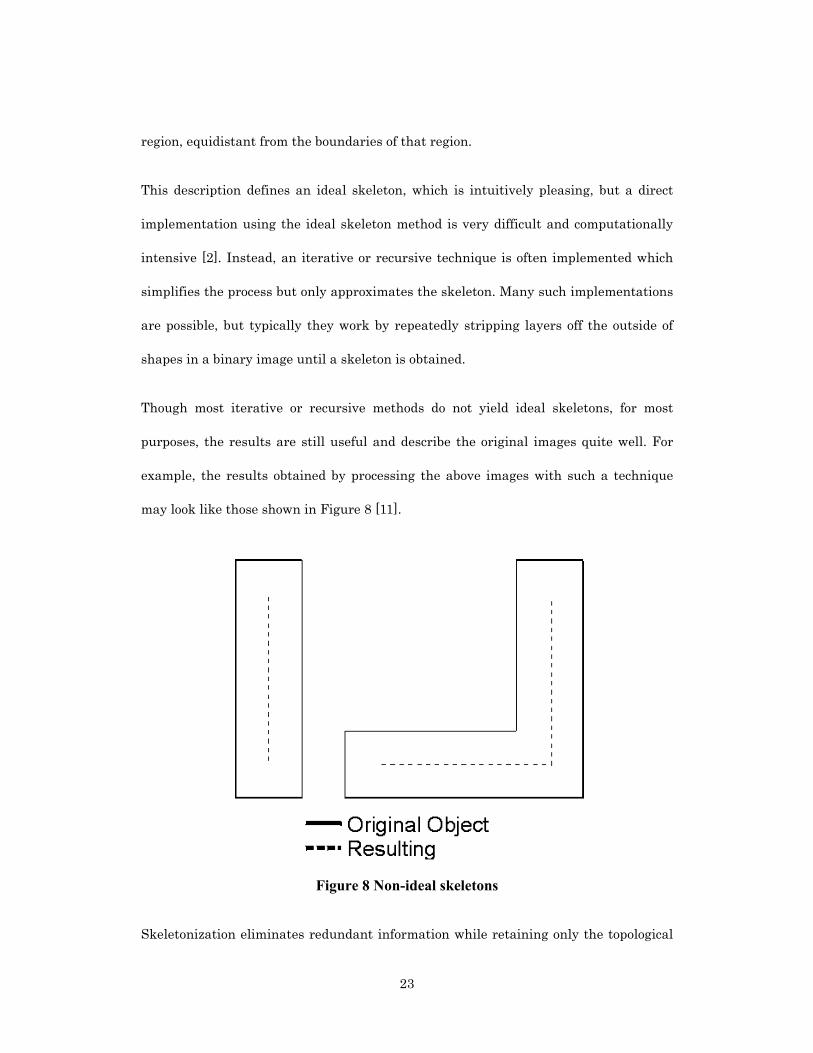
This description defines an ideal skeleton, which is intuitively pleasing, but a direct
implementation using the ideal skeleton method is very difficult and computationally
intensive [2]. Instead, an iterative or recursive technique is often implemented which
simplifies the process but only approximates the skeleton. Many such implementations
are possible, but typically they work by repeatedly stripping layers off the outside of
shapes in a binary image until a skeleton is obtained.
Though most iterative or recursive methods do not yield ideal skeletons, for most
purposes, the results are still useful and describe the original images quite well. For
example, the results obtained by processing the above images with such a technique
may look like those shown in Figure 8 [11].
Figure 8 Non-ideal skeletons
Skeletonization eliminates redundant information while retaining only the topological

24
information about the shape of the form [1]. This is ideal when a machine must process
the image. The information that is removed is often not necessary to the analysis and
eliminates confusion and complexities in the original image.
In a large number of applications, analysis of every pixel of the skeleton is not necessary.
As a result, the skeletonization engine actually eliminates the majority of the data and
returns only those "features" of the skeleton which are needed for processing. For this
application, the only points of interest are line endpoints and intersections.
3.2.2 Skeletal Bias
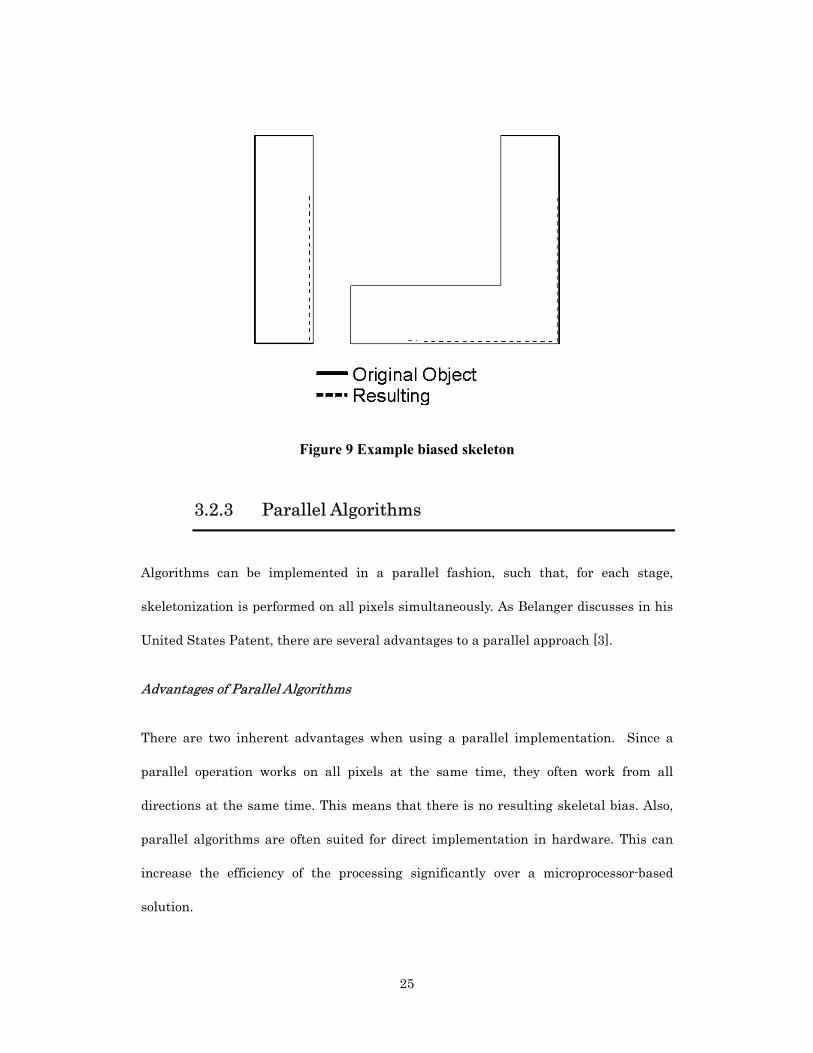
Skeletal bias refers to the asymmetric results of skeletonization which can occur if
preference is given to a certain direction over others during the thinning process. Ideally,
the stripping action would be performed symmetrically around the object.
In practice, the image is often processed in a normal forward raster scan - starting in the
top left and moving row by row to the bottom right. The result of this process is to
produce a highly distorted skeleton, made up of lines along the right-hand and bottom
edges of objects [1]. An example is shown in Figure 9.
25
Figure 9 Example biased skeleton
3.2.3 Parallel Algorithms
Algorithms can be implemented in a parallel fashion, such that, for each stage,
skeletonization is performed on all pixels simultaneously. As Belanger discusses in his
United States Patent, there are several advantages to a parallel approach [3].
Advantages of Parallel Algorithms
There are two inherent advantages when using a parallel implementation. Since a
parallel operation works on all pixels at the same time, they often work from all
directions at the same time. This means that there is no resulting skeletal bias. Also,
parallel algorithms are often suited for direct implementation in hardware. This can
increase the efficiency of the processing significantly over a microprocessor-based
solution.
26
Disadvantages of Parallel Algorithms
There are three disadvantages in using a parallel skeletonization algorithm. First, the
complexity of the implementation is an obvious disadvantage. Second, designing a
parallel skeletonization algorithm can be more difficult than designing a sequential
algorithm. For instance, a parallel algorithm which works from all directions at the
same time, such as that described in Belanger's Patent [3], can be tricky to implement in
field programmable gate array (FPGA), though easily implemented in a discrete fashion.
The third fundamental problem with some parallel algorithms results from the fact that
each block of the image is being examined independently, yet concurrently. Since a given
block does not have a view of the neighboring, overlapping blocks, it cannot ascertain
whether the current point can be safely removed. Even if the ability to "spy" on adjacent
blocks was implemented, the resources required to do so and the amount of logic
necessary to determine the resulting action outweighs the benefits gained.
3.2.4 Sequential Algorithms
In most cases, designers choose to implement sequential algorithms to meet the needs of
computational requirements time or to suit the requirements of their application.
Sometimes, the implementation cannot be distinguished as purely parallel or
sequential.
Advantages of Sequential Algorithms
In practice, images are rarely provided as one solid block, where every pixel is received
at the same time. Raster images are commonly used, which are usually presented by
27
scanning from left to right and top to bottom. Sequential algorithms can be designed to
take advantage of this fact and process each small section of the image as it arrives. This
saves time and allows the implementation to be used as part of a pipeline which
continuously skeletonizes input images.
Disadvantages of Sequential Algorithms
The main disadvantage of sequential algorithms is the resulting bias in the skeleton.
Since the image is accessed in an orderly, often rastered fashion, the direction of this
scanning can often affect the output of the process. Algorithms must be designed,
specifically, to avoid this inherent skeletal bias.
3.3 Existing Implementations
There are two algorithms which have been implemented and tested. The first is the
Zhang and Suen Two Step Approach [4] and the second is the Davies' Four Step
Approach [1]. Both of these are commonly used skeletonization algorithms and have
been implemented directly from their textbook descriptions. Each works by examining
the image, one 3x3 region at a time, and mathematically determining whether to keep or
remove the center pixel.
3.3.1 Zhang and Suen Two Step Approach [4]
This was the first algorithm to be implemented and tested. Developed in 1984, this
approach strips pixels from the outside of a binary object - first from the northwest and
then from the southeast. Figure 10 shows the regions contained in cycle 1 and cycle 2.
28
Figure 10 Zhang and Suen approach
There is a fundamental problem with this approach, namely, it skeletonizes a circle to
become a cross but not a dot. Skeletonization of a circle to a dot is important because
only one feature is required for one object in defect inspection systems. Hence, further
research to improve this approach was not conducted. The mechanics of this algorithm
will, therefore, not be described in any further detail here. Gonzalez and Wintz[2]
provide a full development of this approach.
Since this algorithm requires only two cycles to strip an entire set of pixels from the
outside of an object, it is considered quite "fast." In practice, this means that in n passes
through the image, circuit traces of width n+1 pixels or less can be fully skeletonized.
This algorithm works well only with non-rotated rectangular based shapes which are
approximately aligned with the object axes. For example, circuit traces tend to be
composed of straight lines, with 90° bends. These are, therefore, rectangular shapes. The
circular pads at the ends of these traces or the ball contacts of a BGA (Ball Grid Array)
do not skeletonize well with this procedure. Cycle one removes the top and left side of a
square and cycle two removes the bottom and right side of a square. This is sufficient for
29
maintaining the shape of square lines, but other shapes are not preserved nearly as well
through this skeletonization process.
Another problem found, experimentally, with this algorithm is the complete erosion of
2x2 squares. This means that any object which starts as a 2x2 square or becomes a 2x2
square during the skeletonization process will disappear completely from the image.
This presents a potentially significant problem for the final image analysis stages.
3.3.2 Davies’ Four Step Approach [1]
The four step approach, described by Davies[1], is the algorithm currently in use by
Avvida Systems Inc. This algorithm has fewer problems than the Zhang and Suen
approach and so research was conducted to improve this algorithm. Some details of this
process will be described because they are the basis for the new approach.
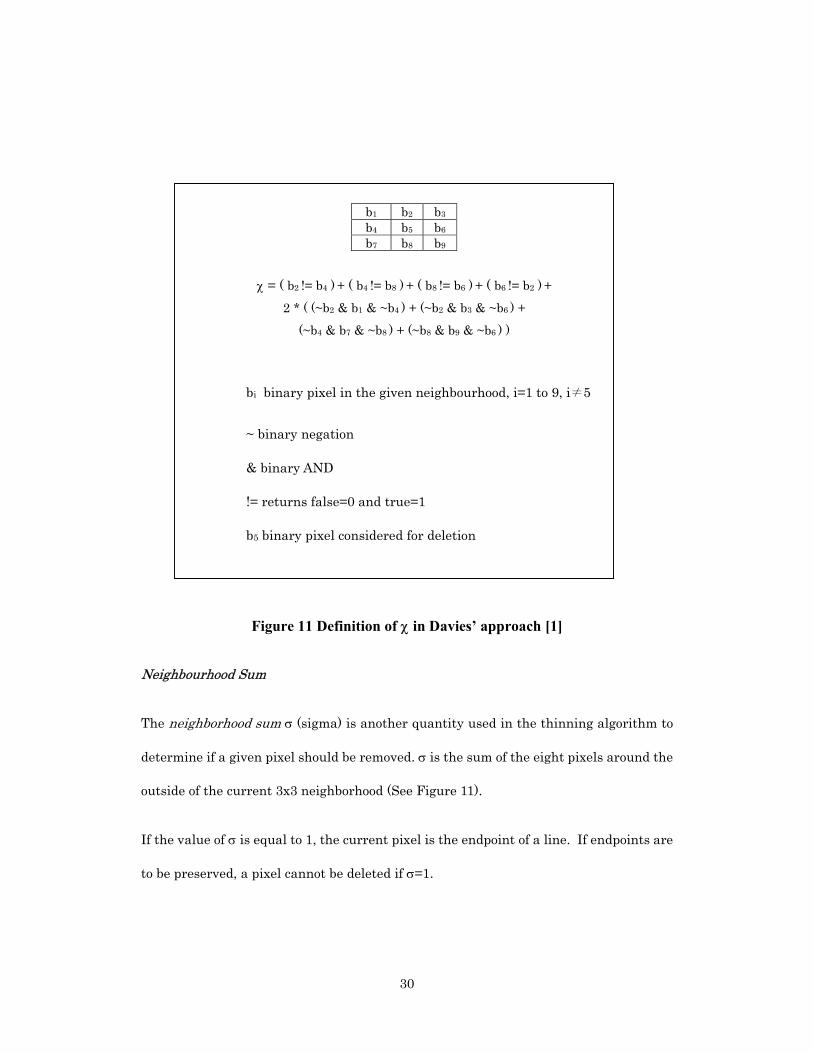
Crossing Number
The crossing number χ (chi) is a quantity used by the thinning algorithm when
determining pixel deletion. The crossing number of any particular 3x3 neighborhood is
defined as the total number of 0-to-1 and 1-to-0 transitions encountered while travelling
once around the eight bits bordering the neighborhood [1]. In essence, it is a
measurement of twice the number of possible connections joining this 3x3 region to the
surrounding ones.
Davies presents a discussion of various methods for determining χ. His final definition of
χ is defined in Figure 11.
30
bi binary pixel in the given neighbourhood, i=1 to 9, i≠5
~ binary negation
& binary AND
!= returns false=0 and true=1
b5 binary pixel considered for deletion
Figure 11 Definition of χ in Davies’ approach [1]
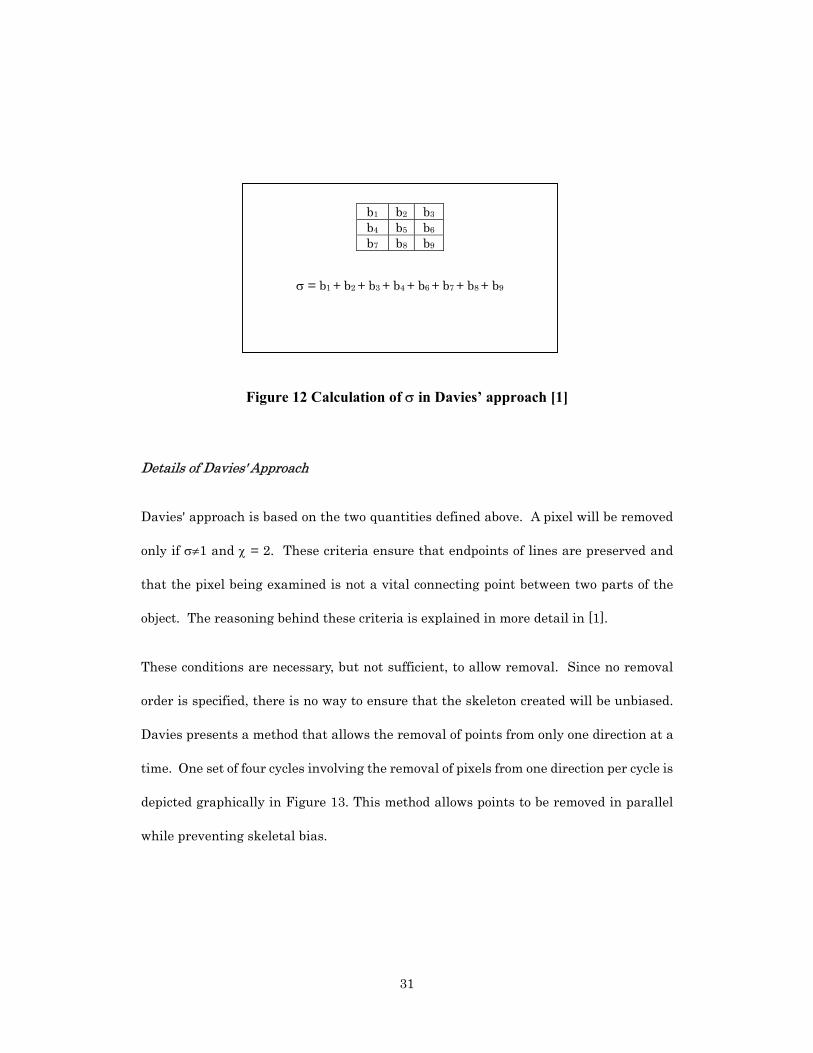
Neighbourhood Sum
The neighborhood sum σ (sigma) is another quantity used in the thinning algorithm to
determine if a given pixel should be removed. σ is the sum of the eight pixels around the
outside of the current 3x3 neighborhood (See Figure 11).
If the value of σ is equal to 1, the current pixel is the endpoint of a line. If endpoints are
to be preserved, a pixel cannot be deleted if σ=1.
b1 b2 b3
b4 b5 b6
b7 b8 b9
χ = ( b2 != b4 ) + ( b4 != b8 ) + ( b8 != b6 ) + ( b6 != b2 ) + 2 * ( (~b2 & b1 & ~b4 ) + (~b2 & b3 & ~b6 ) +
(~b4 & b7 & ~b8 ) + (~b8 & b9 & ~b6 ) )
31
Figure 12 Calculation of σ in Davies’ approach [1]
Details of Davies' Approach
Davies' approach is based on the two quantities defined above. A pixel will be removed
only if σ≠1 and χ = 2. These criteria ensure that endpoints of lines are preserved and
that the pixel being examined is not a vital connecting point between two parts of the
object. The reasoning behind these criteria is explained in more detail in [1].
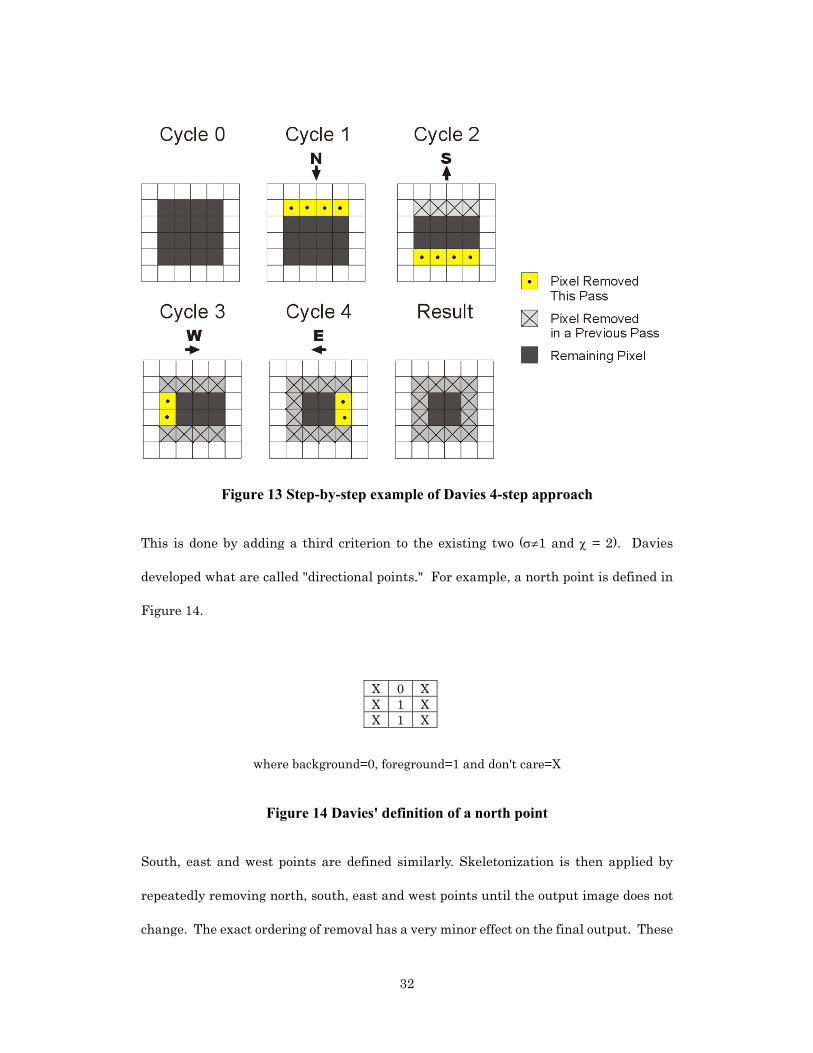
These conditions are necessary, but not sufficient, to allow removal. Since no removal
order is specified, there is no way to ensure that the skeleton created will be unbiased.
Davies presents a method that allows the removal of points from only one direction at a
time. One set of four cycles involving the removal of pixels from one direction per cycle is
depicted graphically in Figure 13. This method allows points to be removed in parallel
while preventing skeletal bias.
b1 b2 b3
b4 b5 b6
b7 b8 b9
σ = b1 + b2 + b3 + b4 + b6 + b7 + b8 + b9
32
Figure 13 Step-by-step example of Davies 4-step approach
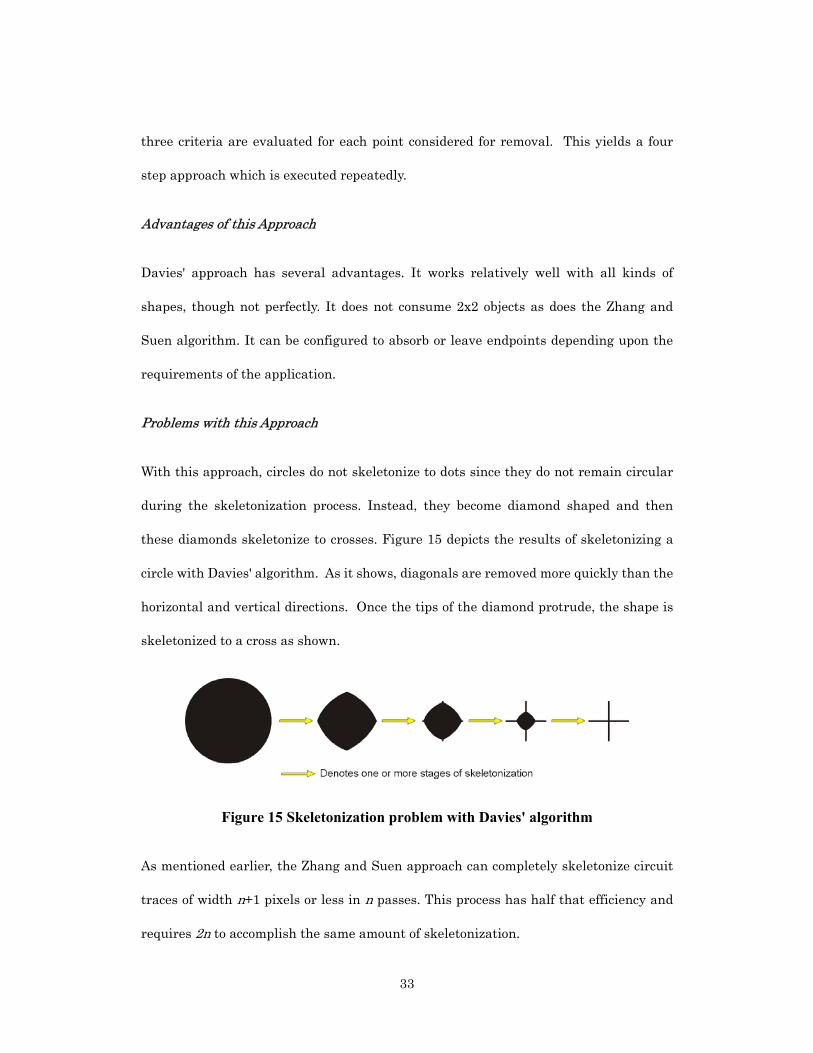
This is done by adding a third criterion to the existing two (σ≠1 and χ = 2). Davies
developed what are called "directional points." For example, a north point is defined in
Figure 14.
where background=0, foreground=1 and don't care=X
Figure 14 Davies' definition of a north point
South, east and west points are defined similarly. Skeletonization is then applied by
repeatedly removing north, south, east and west points until the output image does not
change. The exact ordering of removal has a very minor effect on the final output. These
X 0 X X 1 X X 1 X
33
three criteria are evaluated for each point considered for removal. This yields a four
step approach which is executed repeatedly.
Advantages of this Approach
Davies' approach has several advantages. It works relatively well with all kinds of
shapes, though not perfectly. It does not consume 2x2 objects as does the Zhang and
Suen algorithm. It can be configured to absorb or leave endpoints depending upon the
requirements of the application.
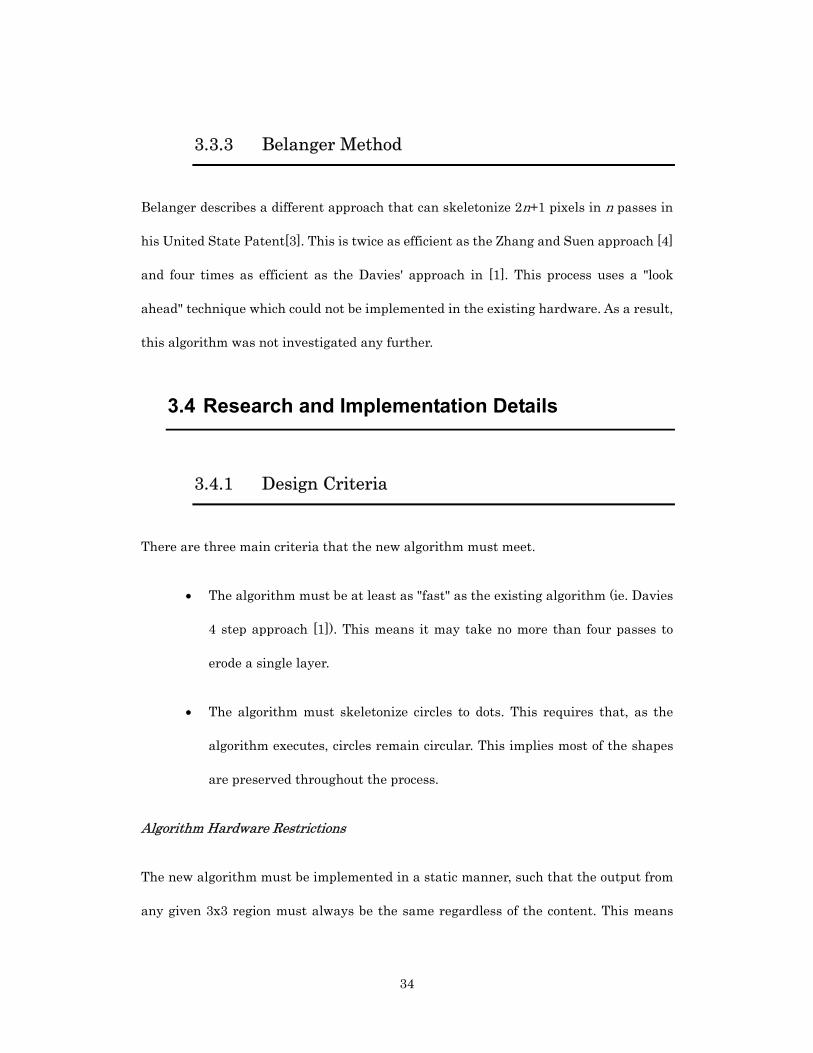
Problems with this Approach
With this approach, circles do not skeletonize to dots since they do not remain circular
during the skeletonization process. Instead, they become diamond shaped and then
these diamonds skeletonize to crosses. Figure 15 depicts the results of skeletonizing a
circle with Davies' algorithm. As it shows, diagonals are removed more quickly than the
horizontal and vertical directions. Once the tips of the diamond protrude, the shape is
skeletonized to a cross as shown.
Figure 15 Skeletonization problem with Davies' algorithm
As mentioned earlier, the Zhang and Suen approach can completely skeletonize circuit
traces of width n+1 pixels or less in n passes. This process has half that efficiency and
requires 2n to accomplish the same amount of skeletonization.
34
3.3.3 Belanger Method
Belanger describes a different approach that can skeletonize 2n+1 pixels in n passes in
his United State Patent[3]. This is twice as efficient as the Zhang and Suen approach [4]
and four times as efficient as the Davies' approach in [1]. This process uses a "look
ahead" technique which could not be implemented in the existing hardware. As a result,
this algorithm was not investigated any further.
3.4 Research and Implementation Details
3.4.1 Design Criteria
There are three main criteria that the new algorithm must meet.
• The algorithm must be at least as "fast" as the existing algorithm (ie. Davies
4 step approach [1]). This means it may take no more than four passes to
erode a single layer.
• The algorithm must skeletonize circles to dots. This requires that, as the
algorithm executes, circles remain circular. This implies most of the shapes
are preserved throughout the process.
Algorithm Hardware Restrictions
The new algorithm must be implemented in a static manner, such that the output from
any given 3x3 region must always be the same regardless of the content. This means
35
that a static skeletonization lookup table can be generated for all possible 3x3
neighborhoods to specify the output. The hardware implementation of the algorithm is
the reason for this restriction.
The method used for applying the skeletonization algorithm is fixed in hardware. This
means that only some parameters can change, namely the skeletonization lookup tables.
There is no "look ahead" or information exchanged between adjacent processing
elements as is done in [3]. This restricts the algorithm to processing each 3x3
neighborhood as a separate entity.
Due to the hardware's design, there is also a limit of 64 skeletonization passes (cycles)
per skeletonization module. The skeletonization lookup table is individually
configurable for each of these 64 passes. Davies' algorithm has been implemented
successfully under all these conditions, so it was used as the basis of the new approach.
3.4.2 The Modified Four Step Algorithm
To produce an unbiased skeleton and obtain a set of truly medial lines, it is critical that
pixels be removed as evenly as possible from the outer boundary of objects [1]. Research
was conducted using Davies' approach [1]. An attempt was made to improve upon the
existing algorithm rather than developing an entirely new procedure.
As was touched upon in a previous section, Davies' algorithm skeletonizes pixels faster
in diagonal directions than in horizontal and vertical directions. Davies' definition of
directional points (for example, north or south points) is "wide" and includes the
diagonals. For example, a northeast point falls into his definition of both a north and an

36
east point. This means that diagonals may be consumed in two of the four stages,
whereas horizontal and vertical directions are included in only one cycle. This accounts
for the shape alteration that is apparent in Figure 15 and the resulting error in
skeletonization.
A modification was made to the definition of a directional point. Instead of defining the
directional points to include the diagonals, as Davies' did, only the horizontal and
vertical points were included. This yielded the strict definition of a north point found in
Figure 16.
(a) Davies' North Point; (b) Strict North Point where background=0, foreground=1 and don't care=X
Figure 16 Definition of a strict north point
Tests were done using these newly defined strict direction points. Now, instead of
consuming diagonals in two of the four cycles, diagonals were not consumed at all. This
yielded an output as depicted in Figure 17. This output was then compared to that of the
original algorithm as presented in Figure 15.
Figure 17 Skeletonization with strict directional points
0 0 0 X 1 X X 1 X
(b)
X 0 X X 1 X X 1 X
(a)
37
These outputs appear to be geometric opposites of one another. One consumes diagonals
quickly while the other consumes horizontal and vertical directions quickly. This was
the motivation behind the development of the final algorithm. If these algorithms are
combined, each can cancel out the negative effect of the other - in essence, preserving the
overall shape of the image.
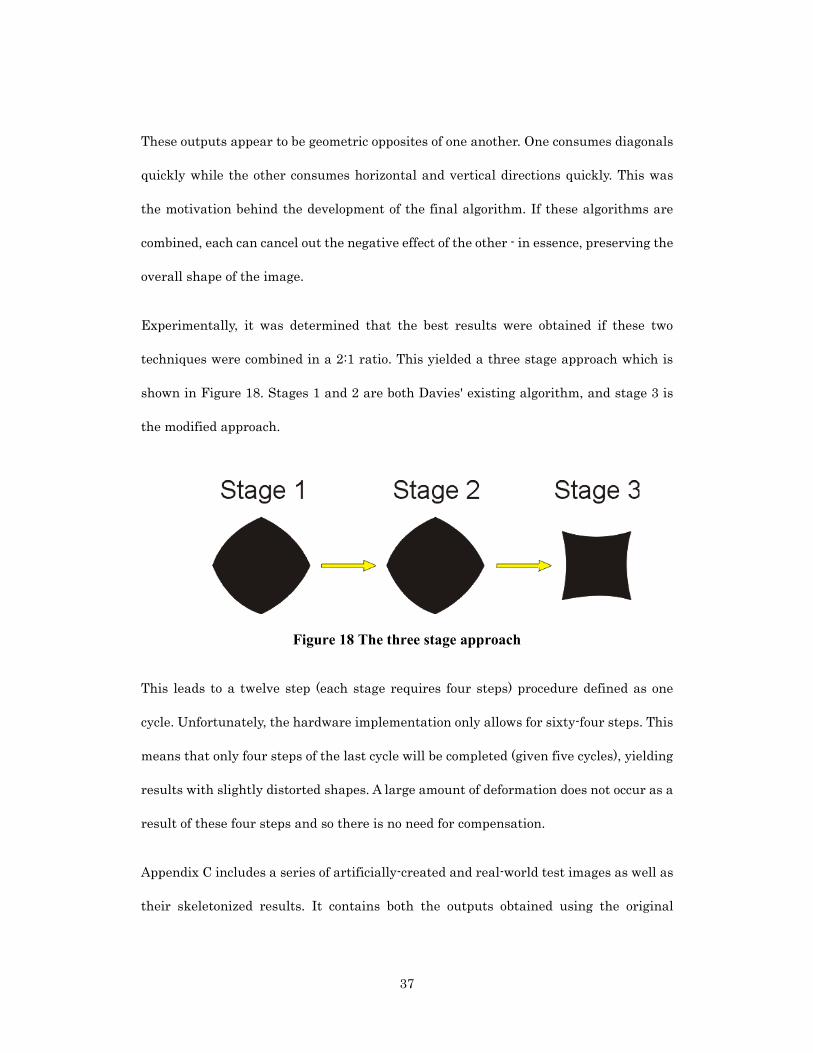
Experimentally, it was determined that the best results were obtained if these two
techniques were combined in a 2:1 ratio. This yielded a three stage approach which is
shown in Figure 18. Stages 1 and 2 are both Davies' existing algorithm, and stage 3 is
the modified approach.
Figure 18 The three stage approach
This leads to a twelve step (each stage requires four steps) procedure defined as one
cycle. Unfortunately, the hardware implementation only allows for sixty-four steps. This
means that only four steps of the last cycle will be completed (given five cycles), yielding
results with slightly distorted shapes. A large amount of deformation does not occur as a
result of these four steps and so there is no need for compensation.
Appendix C includes a series of artificially-created and real-world test images as well as
their skeletonized results. It contains both the outputs obtained using the original
38
skeletonization from Davies' approach [1] and the modified algorithm.
The existing Davies' technique can completely skeletonize circuit traces of width n+1
pixels or less in 2n passes. This process has the same efficiency as that method requiring
2n to accomplish the same amount of skeletonization.
Problems With This Approach
There are some problems remaining with this approach. Depending on the order of the
skeletonization process (N-S-E-W, N-W-S-E, etc.) objects which should skeletonize to
single pixels, such as a 5x5 square, will not. Instead, small lines of 2x1 pixels or 3x1
pixels will remain. Once the object reaches this size, it is a single pixel line, and if it is
decided that endpoints are not to be consumed, these lines will not skeletonize any
further. Allowing endpoint consumption during the last several cycles can compensate
for this quite easily. Note that this problem exists with the Zhang and Suen approach as
well as the Davies’ approach presented early. As shown in Figure 40, the relative big
ellipses in the middle of artificially-created image do not maintain their shape very well.
Their aspect ratio is changed. This was caused by the last cycle of the skeletonization in
which only four steps are implemented.
The other known shortcoming becomes apparent after a very large number of cycles
(>512). After this point, very large circles (diameter > 1024) begin to look octagonal. The
algorithm processes the image by using two variations (normal and strict) of each of four
directions (north, south, east and west). These eight combinations produce the eight
sides of the octagon. This problem does not affect objects after a small number of cycles.
This algorithm will be sufficient, since the typical configuration, normally involves only
39
64 passes (cycles). It is possible that there may have to be some modifications to this
design if operations involving more than 512 skeletonization cycles are required.
3.4.3 Application Specific Modifications
Depending on the input and output requirements of the skeletonization module, several
alterations can be made to the first and last stages of the algorithm to properly process
the image and reduce the bandwidth required to analyze the results.
Stringers
A single erroneous pixel can produce confusing skeletonization results. An incorrect
pixel on the boundary of an object may result from various sources: image noise,
digitization error or even binarization techniques. For the majority of image processing
applications, a single pixel of error does not have a significant effect. This may not be the
case with skeletonization.
If an erroneous pixel lies on the border of an object that is being skeletonized, the process
may yield incorrect medial lines. If the algorithm is designed in such a way that
endpoints are passed through to further stages, this erroneous pixel may be considered
an endpoint of a line and as such will generate a medial line starting at a point which
may not lie along any medial axis. This is called a stringer.
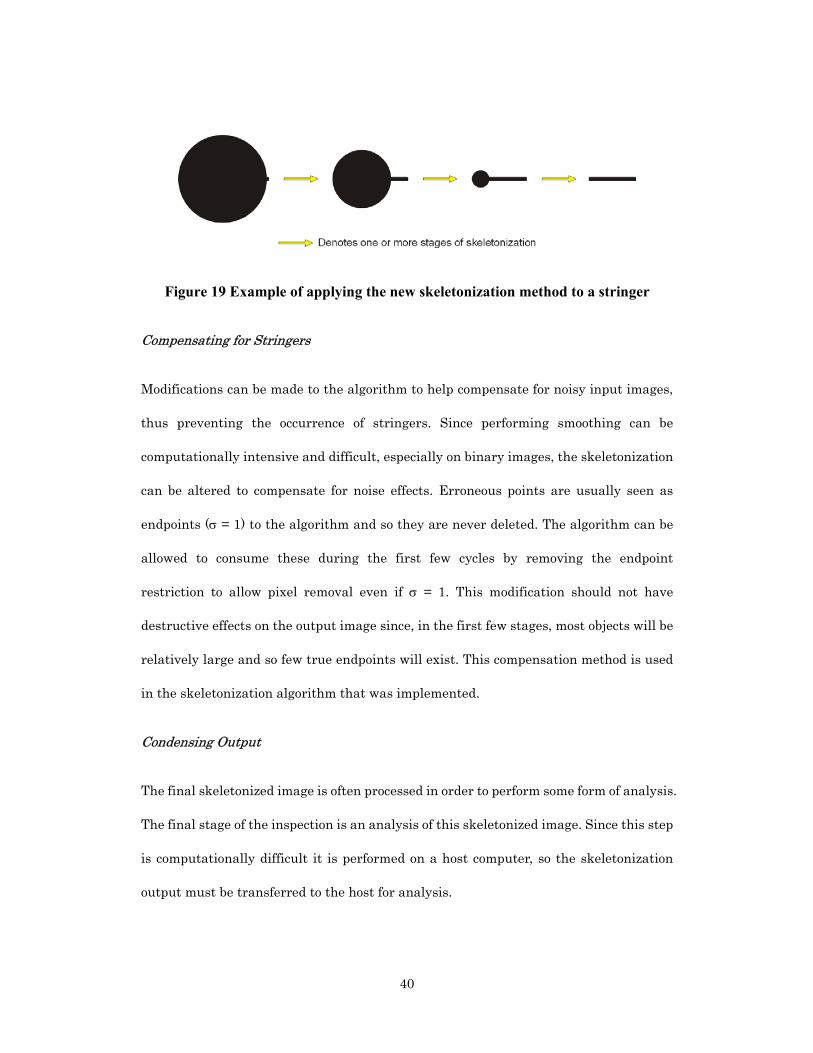
For example, a filled circle should skeletonize to a dot. If there is a pixel or two which lie
along the circumference of this circle, it may be skeletonized to a line. An example of this
appears in Figure 19. As is shown, the resulting skeleton does not accurately represent
the original shape.
40
Figure 19 Example of applying the new skeletonization method to a stringer
Compensating for Stringers
Modifications can be made to the algorithm to help compensate for noisy input images,
thus preventing the occurrence of stringers. Since performing smoothing can be
computationally intensive and difficult, especially on binary images, the skeletonization
can be altered to compensate for noise effects. Erroneous points are usually seen as
endpoints (σ = 1) to the algorithm and so they are never deleted. The algorithm can be
allowed to consume these during the first few cycles by removing the endpoint
restriction to allow pixel removal even if σ = 1. This modification should not have
destructive effects on the output image since, in the first few stages, most objects will be
relatively large and so few true endpoints will exist. This compensation method is used
in the skeletonization algorithm that was implemented.
Condensing Output
The final skeletonized image is often processed in order to perform some form of analysis.
The final stage of the inspection is an analysis of this skeletonized image. Since this step
is computationally difficult it is performed on a host computer, so the skeletonization
output must be transferred to the host for analysis.
41
Instead of transferring the entire skeletonized image, which would be time consuming
due to the size of image and the bandwidth available, the final stage of the
skeletonization process performs feature point classification. Since the analysis of these
features only requires the knowledge of a given 3x3 neighborhood, this can be performed
in the existing skeletonization architecture. This stage reduces the image to a set of
feature codes. For example, in the analysis of circuits, the only points of interest are the
endpoints or intersections of traces. These main defect categories permit the detection of
circuit breaks or shorts or solder splashes. All other skeleton pixels can be eliminated,
reducing the image to feature codes consisting of endpoints, T-junctions and cross or
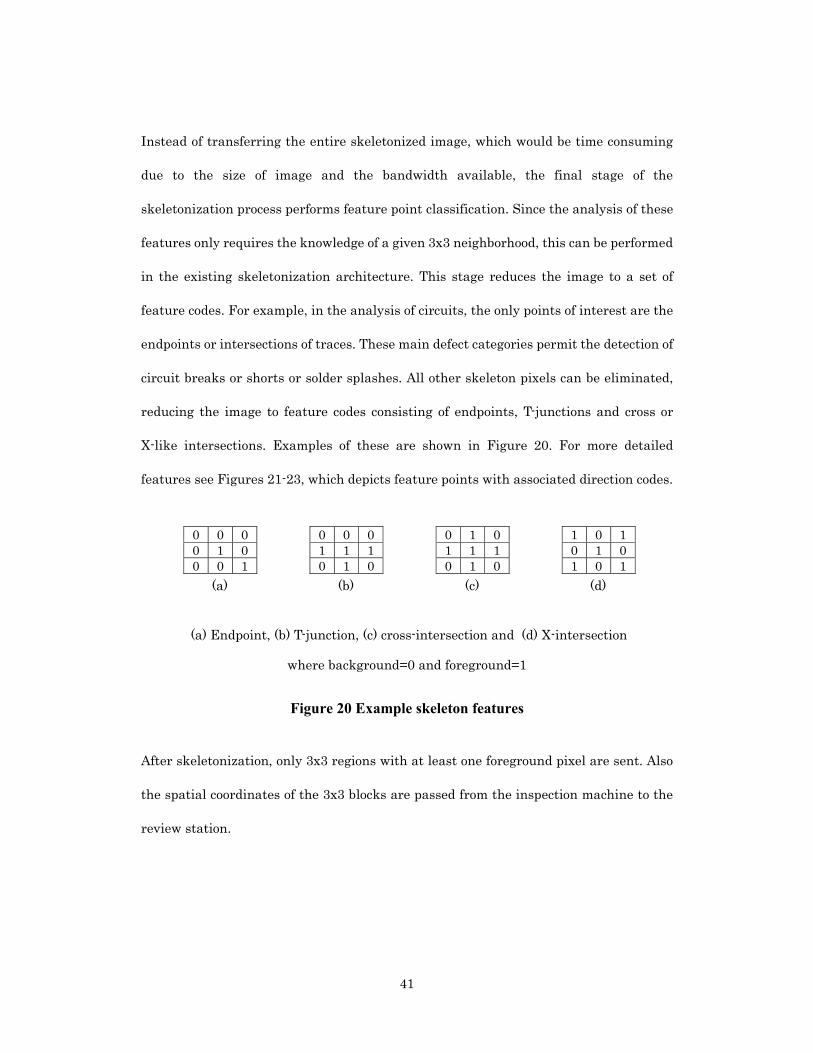
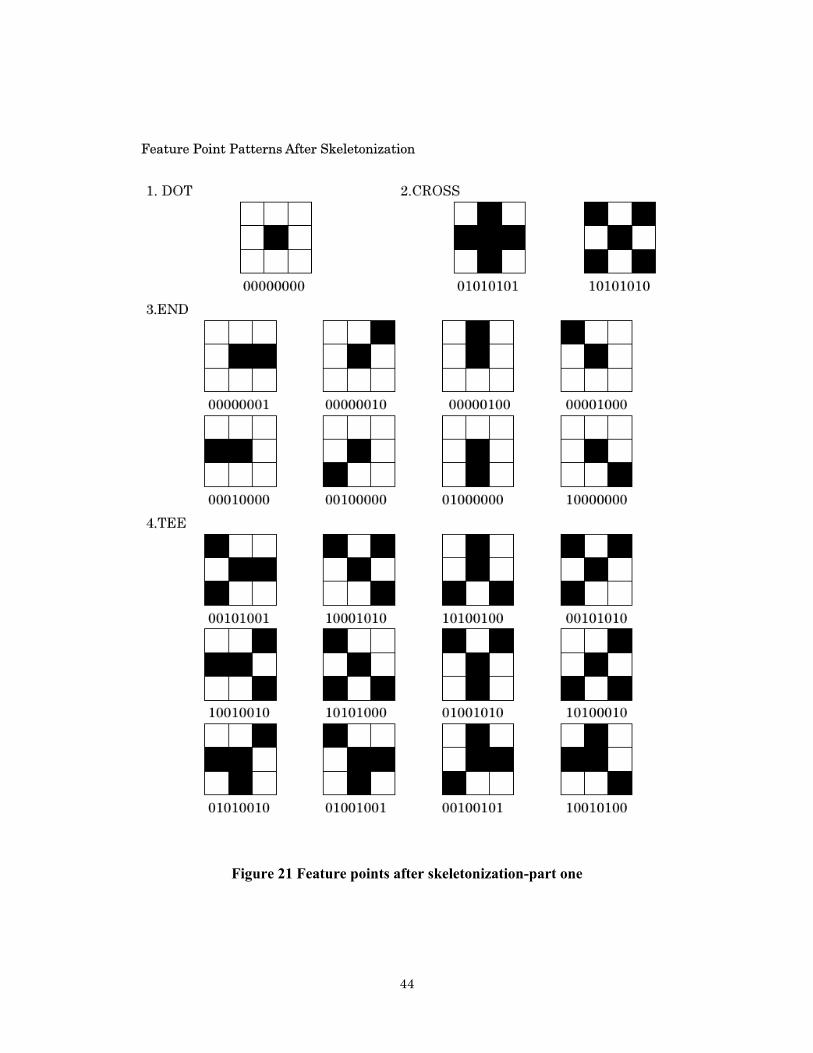
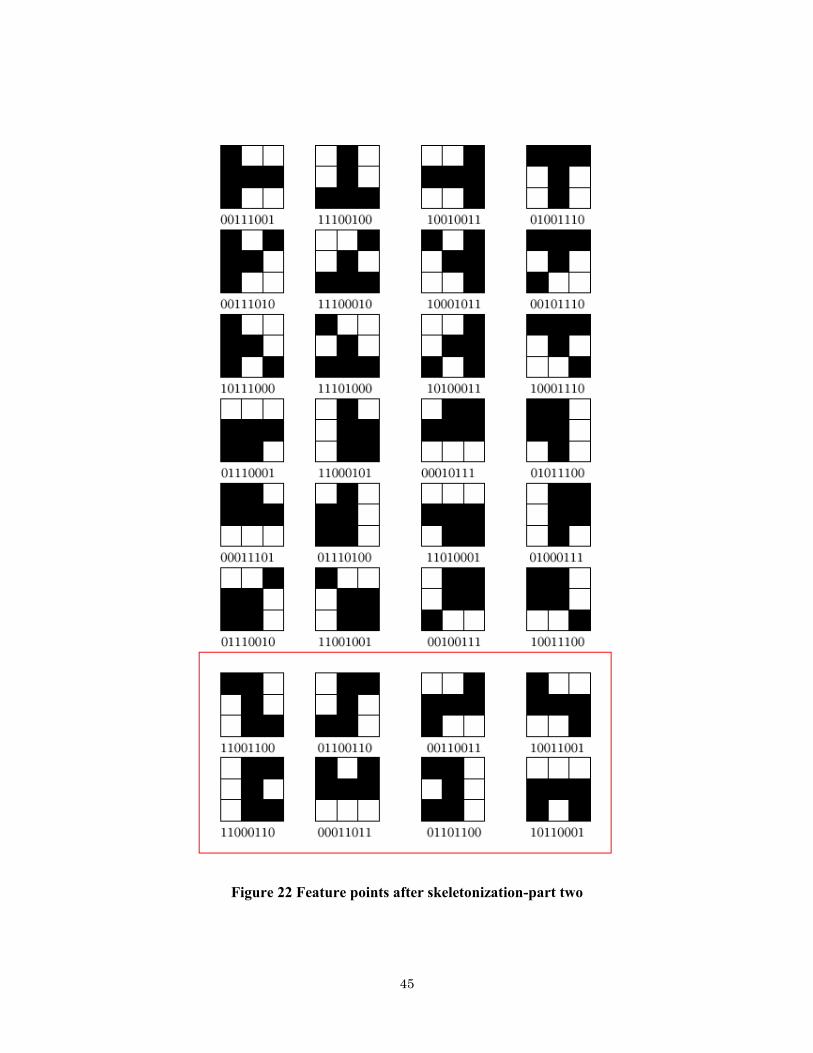
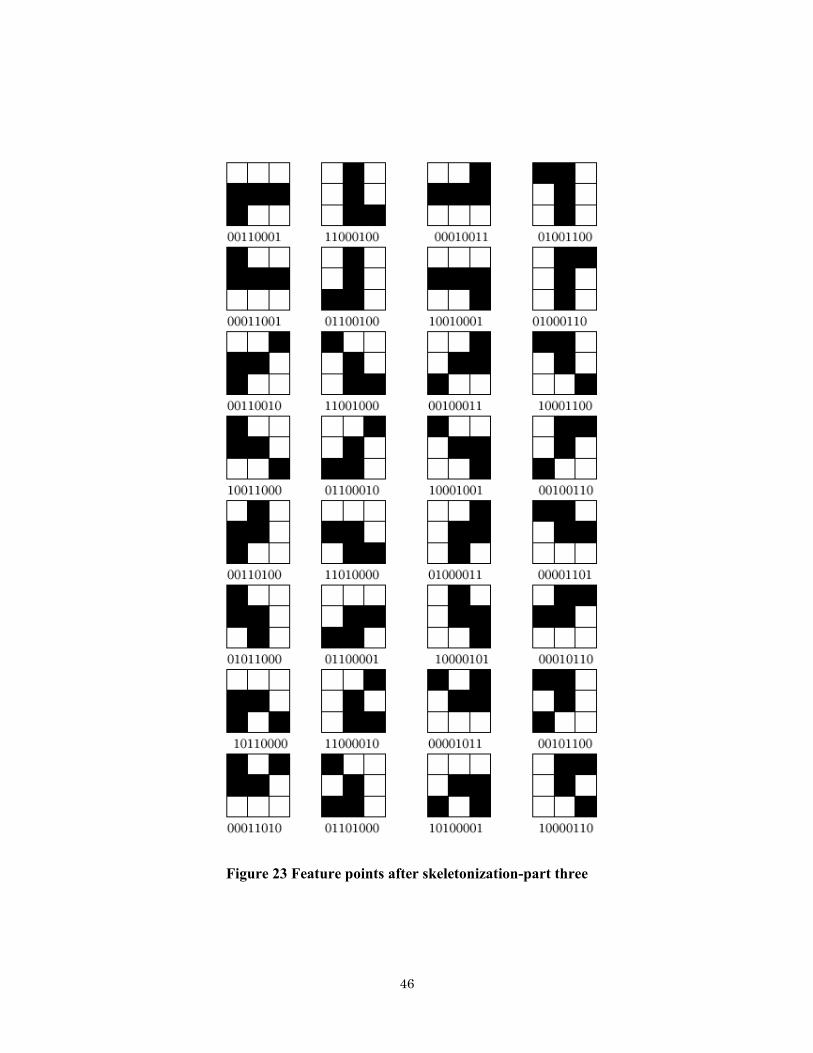
X-like intersections. Examples of these are shown in Figure 20. For more detailed
features see Figures 21-23, which depicts feature points with associated direction codes.
(a) Endpoint, (b) T-junction, (c) cross-intersection and (d) X-intersection
where background=0 and foreground=1
Figure 20 Example skeleton features
After skeletonization, only 3x3 regions with at least one foreground pixel are sent. Also
the spatial coordinates of the 3x3 blocks are passed from the inspection machine to the
review station.
0 0 0 0 1 0 0 0 1
(a)
0 0 0 1 1 1 0 1 0
(b)
0 1 0 1 1 1 0 1 0
(c)
1 0 1 0 1 0 1 0 1
(d)
42
3.4.4 Detailed Description of the Algorithm
The skeletonization look-up tables (LUTs) must be implemented in hardware. Input to
the LUT is a 9-bit address representing the bits in the 3×3 area as defined as Figure 12.
The output from the LUT is a single bit indicating whether the centre pixel ( 5b ) should
be retained (1) or removed (0). This LUT is the binary decision used in industry. The
option of the skeletonization is also designed, how many stages at the end should cause
end-points to be shortened. This permits removal of spider-web-like appearance of
skeleton and reduces the total number of features. The parameter of
consume-end-points is 0 for no end points removal and 32 for removal on every pass.
Referring to Appendix D, subroutine one is the logic design to generate skeletonization
look-up tables. Subroutine two is the modified four step skeletonization (12 cycle
approach).
3.5 Conclusion of Skeletonization
A new 3-stage process was designed by interleaving the approach currently in use with a
new one. The details and reasoning behind the developed algorithm are presented in
this chapter. This new procedure reduces circles to smaller circles or dots, depending on
the circle diameter and the number of applied skeletonization passes. This chapter also
outlines some application-specific modifications that can be made to the general
algorithm to handle various types of input and output requirements. Appendix C
illustrates additional test images and results based on new skeletonization algorithm.
43
It is concluded that the new algorithm has many advantages over existing algorithms. It
overcomes the disadvantages of the original. This new method is superior to previous
methods and has met the design criteria without loss of efficiency. Its benefits include its
ability to correctly skeletonize circles and to be realized in the existing hardware. It is
recommended that this new three stage process replace the existing single stage
skeletonization technique in all future systems.
There are still some small problems remaining with this skeletonization algorithm. But
it can be compensated by allowing endpoint consumption during the last several cycles
in the algorithm design procedure.
44
Feature Point Patterns After Skeletonization
Figure 21 Feature points after skeletonization-part one
45
Figure 22 Feature points after skeletonization-part two
46
Figure 23 Feature points after skeletonization-part three
47
4 Automatic Defect Classification (ADC) for PDP Electrode Pattern
Quality control on a PDP panel production line is a very important factor to improve
product reliability. To meet the needs of quality control in every PDP manufacturing step,
an inspection system is needed for checking and detecting the defects on the PDP panels.
There are inspection machines from a number of different vendors currently on the
market. Since PDP inspection machines are in the very early stage of their development,
there are still many outstanding problems. The following related problems need to be
resolved:
(1) The current inspection systems find the typical defects successfully but are unable to
detect complex or abnormal defect types.
(2) Due to the misreported defects by the inspection machine, judgement is needed for
the next step in the processing, namely modification. Such judgement requires
considerable operator time, because each defect must be confirmed manually. The
degree of human error depends on the ability and experience of the operator.
(3) On average, it takes about 3.5 seconds to manually review and confirm one defect. If
the line-target total time is two minutes, only about 35 defects can be confirmed by
one operator. Since there are about fifty to sixty defects that a panel normally has,
this motivates the need for an automated review station to meet the needs of the
throughput requirements.
48
In the future, the production line will be automated and also the system will be robot
controlled motivating the use of an automatic review station. In the meantime, the
automatic defect review, classification, and modification algorithms will play a very
important role in the review station system. The new function is called automatic defect
classification (ADC).
4.1 Defect Definition of Electrode Pattern
There are many types of defects for electrode pattern of PDP, which can be classified as
open, short, bite, protrusion, pinhole and island. There are illustrated in the following
figures. These figures represent a Panasonic PDP pattern. They are taken using the
NTSC CCD camera of the review station and have a size of 640 x 480 pixels. These
images are stored in JPEG format.
The open defect shown in Fig. 24 (a) is usually caused by a broken tracer. The black
defect in Fig. 24(b) is caused by two or more connected tracers. This white defect shown
in Fig. 24 (c) causes the tracer’s width to become narrow. This defect is caused by print
problem or dust. This black defect in Fig. 24 (d) is caused by the width of the tracer
becoming too big. This white defect shown in Fig. 24 (e) is usually caused by dust, which
cause an extra-pattern to appear on the panel. This black defect shown in Fig. 24 (f) is
also usually caused by dust.

49
(a) open defect
(b) short defect
(d) bite defect
(d) protrusion defect
(e) pinehole defect
(f) island defect
Figure 24 Sample defect type of Panasonic PDP panel
4.2 Logic Design for ADC
The functionality of ADC will include the following items:
(1) Defect Relocation
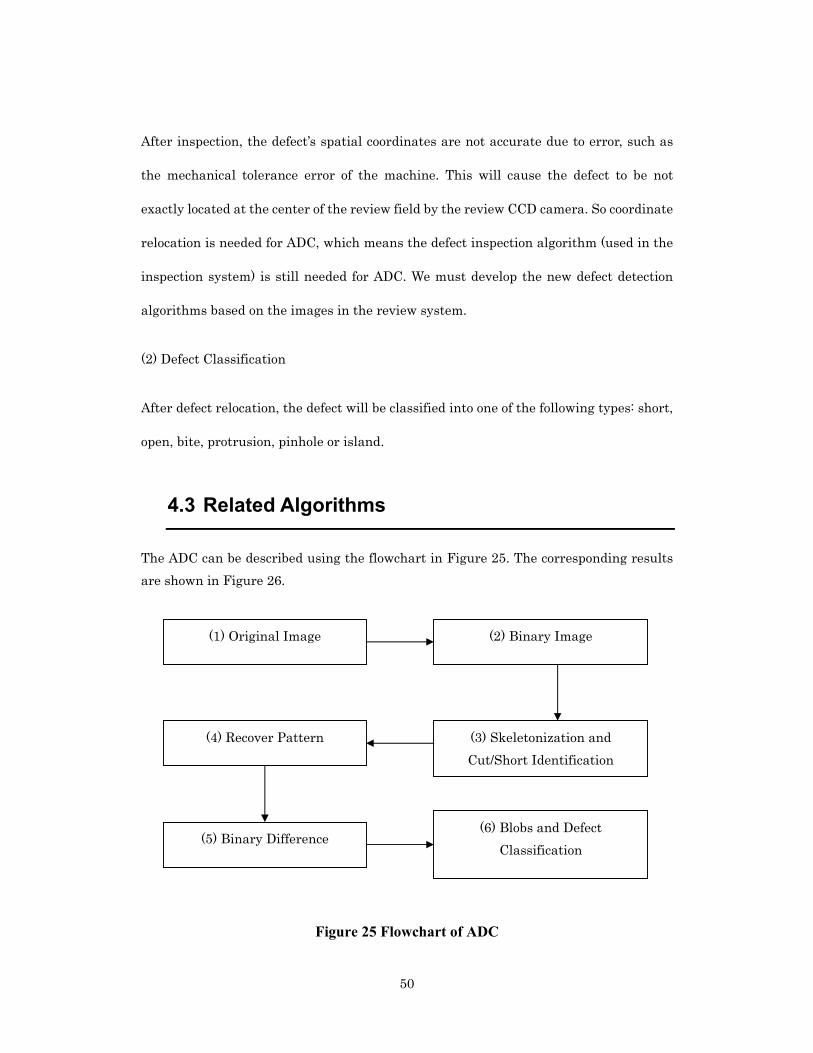
50
After inspection, the defect’s spatial coordinates are not accurate due to error, such as
the mechanical tolerance error of the machine. This will cause the defect to be not
exactly located at the center of the review field by the review CCD camera. So coordinate
relocation is needed for ADC, which means the defect inspection algorithm (used in the
inspection system) is still needed for ADC. We must develop the new defect detection
algorithms based on the images in the review system.
(2) Defect Classification
After defect relocation, the defect will be classified into one of the following types: short,
open, bite, protrusion, pinhole or island.
4.3 Related Algorithms
The ADC can be described using the flowchart in Figure 25. The corresponding results are shown in Figure 26.
Figure 25 Flowchart of ADC
(1) Original Image (2) Binary Image
(3) Skeletonization and Cut/Short Identification
(4) Recover Pattern
(5) Binary Difference (6) Blobs and Defect
Classification
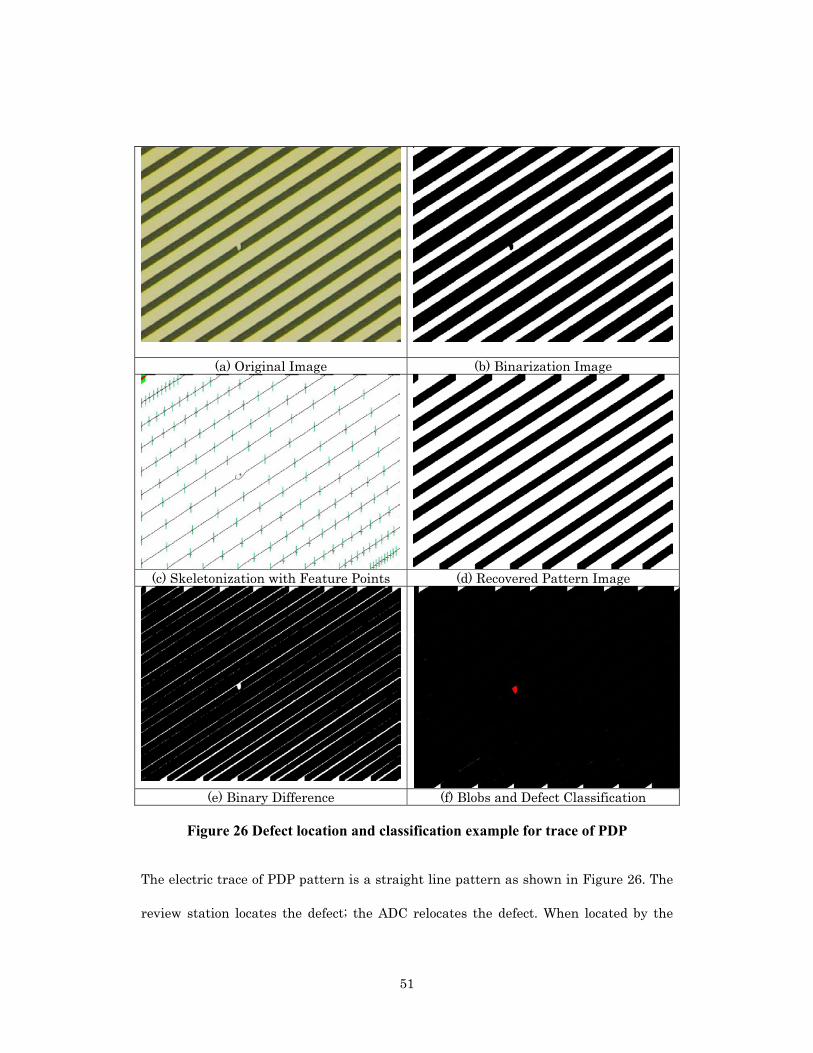
51
(a) Original Image (b) Binarization Image
(c) Skeletonization with Feature Points (d) Recovered Pattern Image
(e) Binary Difference (f) Blobs and Defect Classification
Figure 26 Defect location and classification example for trace of PDP
The electric trace of PDP pattern is a straight line pattern as shown in Figure 26. The
review station locates the defect; the ADC relocates the defect. When located by the
52
review station, the CCD will take the image and transfer to buffer automatically. After
automatic image binarization, then the image can be skeletonized. Based on the Hough
transformation [1] and feature point of the trace, the perfect patterns can be recovered.
With the help of comparison of the perfect pattern and the original binary pattern, the
binary defects can be detected. These related algorithms will next be described in more
detail.
(1) Original Image
The original image is taken by the NTSC CCD camera of the review station, the image
size is 640 x 480 pixels. This image will be used for binarization in the next step.
(2) Automatic Binarization [23]
Automatic binarization of the image is the basic method of image segmentation. The
method introduced here is based on the cluster separation according to the maximum
separability value for the threshold selection given the image histogram. The
separability of the image cluster separation is defined in a continuous sense as:
where )(2 tBσ and 2Tσ represent the combined variance of the two clusters and the image
respectively. Since 2Tσ is a constant for the image, the maximum of the η(t) is based on
the maximum of )(2 tBσ . Briefly, the term )(2 tBσ and can be represented discretely by a
binary weighted function:
2
2 )()(
T
B ttσσ
η =
211
200
2 )()()( TTB k µµωµµωσ −+−=
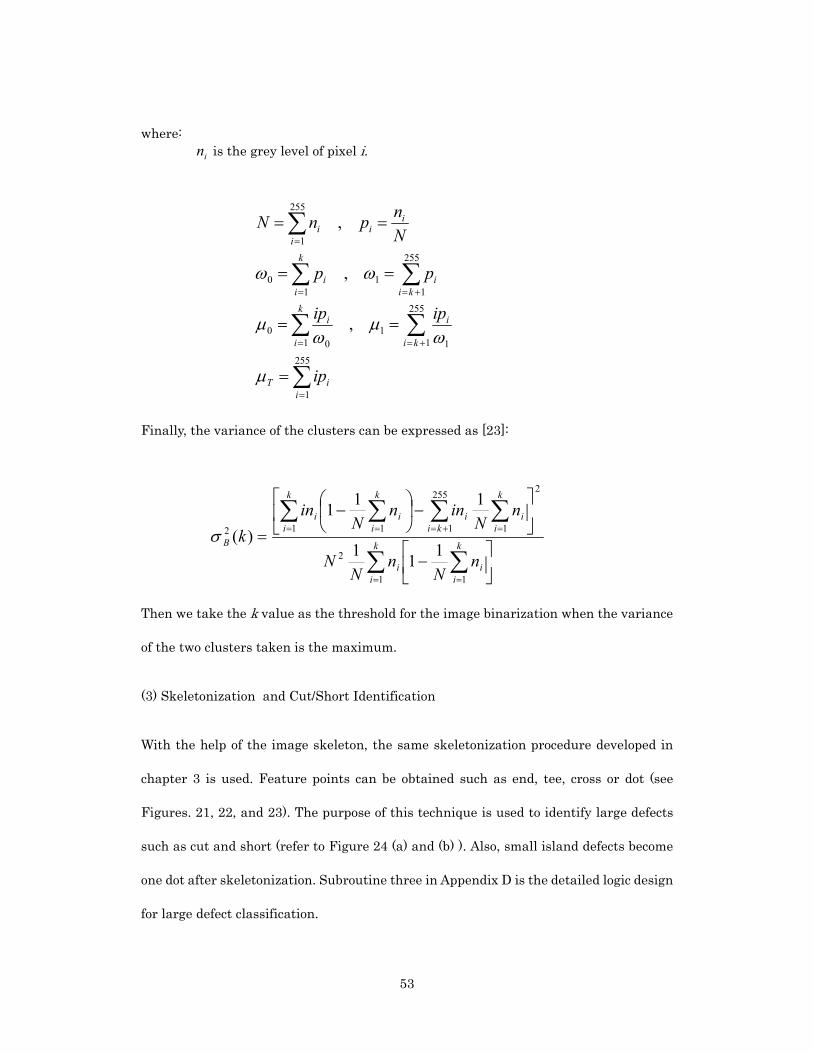
53
where: in is the grey level of pixel i.
Finally, the variance of the clusters can be expressed as [23]:
Then we take the k value as the threshold for the image binarization when the variance
of the two clusters taken is the maximum.
(3) Skeletonization and Cut/Short Identification
With the help of the image skeleton, the same skeletonization procedure developed in
chapter 3 is used. Feature points can be obtained such as end, tee, cross or dot (see
Figures. 21, 22, and 23). The purpose of this technique is used to identify large defects
such as cut and short (refer to Figure 24 (a) and (b) ). Also, small island defects become
one dot after skeletonization. Subroutine three in Appendix D is the detailed logic design
for large defect classification.
−
−
−
=
∑∑
∑∑∑∑
==
=+===
k
ii
k
ii
k
ii
kii
k
ii
k
ii
B
nN
nN
N
nN
innN
ink
11
2
2
1
255
1112
111
111)(σ
∑
∑ ∑
∑∑
∑
=
= +=
+==
=
=
==
==
==
255
1
1
255
1 11
00
255
11
10
255
1
,
,
,
iiT
k
i ki
ii
kii
k
ii
ii
ii
ip
ipip
pp
NnpnN
µ
ωµ
ωµ
ωω
54
(4) Recover Patterns
With help of the Hough transformation after skeletonization, the direction of the PDP
trace is known. Also the feature points of the trace along every trace can be obtained.
Based on the direction of the trace and the feature points of every trace, the perfect
patterns can be recovered.
(5) Binary difference
Based on the recovered perfect pattern, difference of two images (b) and (d), the binary
defects can be detected. Considerable edge noise remains as shown in Figure 26(e).
(6) Blobs and Defect Classification
After image difference, the binary image can be blob analyzed using many different
algorithms. Many of the object’s features can be computed based on boundary
information using chain-codes. These include moments [8], and boundary length and
area based on a discrete version of Green’s theorem [20]. Also the Fourier descriptors [1]
are used for shape analysis. These methods are useful to analyze small blobs identified
in the PDP pattern. If some small blobs on the view image are found, they can be
considered as dust or anomalous.
So far, some methods for object recognition based on global feature measurements such
as skeleton’s feature points, object’s area, size as well as shape measurement techniques
have been considered. Furthermore, several assumptions should be made concerning the
PDP images. First the normal or perfect pattern for PDP should not contain curved
boundaries or edges, which means boundaries and edges should be approximately
55
straight lines. Second, if the defect occurs in a PDP pattern, its boundary should have
some damage or distortion. As a result, to detect defects with the help of boundary
descriptors is possible.
Here the linear regression and local description length method is used for detecting the
bite and protrusion defects. Another useful idea is that some small acceptable defects
could be also detected with the computation of the maximum residual based on linear
equation regression for the electric trace of PDP.
A mathematical model of the linear regression can be described as follows. Given the
local boundary coordinates such as ),(,),,(),,.( 2211 nn yxyxyx L , then we have an
equation:
),,2,1( ntebaxy ttt L=++=
Ordinary least squares estimators of a and b are given by
xaybxx
yyxxa
t
tt
−=
−
−−=
∑∑
2)())((
Based on the above equation, the local maximum residual can be computed according to
the value of the local residuals, the defects can be judged as acceptable or not acceptable.
If the residual is bigger than a given threshold, the defect is deemed not acceptable,
otherwise the defect is accepted. Also, the defect type can be classified by its shape or
whether or not it is a white or black defect.
So the comprehensive algorithms are used for different kind defect classification.

56
4.4 Examples of ADC
Figure 27 illustrates an example of an open and short defect detected using
skeletonization. The open defect is constructed by two end feature points, and the short
defect is bridged by two tee feature points.
Figure 27 Open and short defect by skeletonization
Figure 28 Island defect by blob analysis
Figure 28 shows an example of an island defect using Fourier descriptors of blob
analysis techniques. Usually the small blob of the black defect is the type of island which
57
is caused by dust.
Figure 29 shows additional details of many kinds mouse bite and protrusions which are
caused by screen printing problem during the manufacturing process. Based on the
figures we can see that even the very small bite and protrusions can be detected by the
same boundary descriptors.
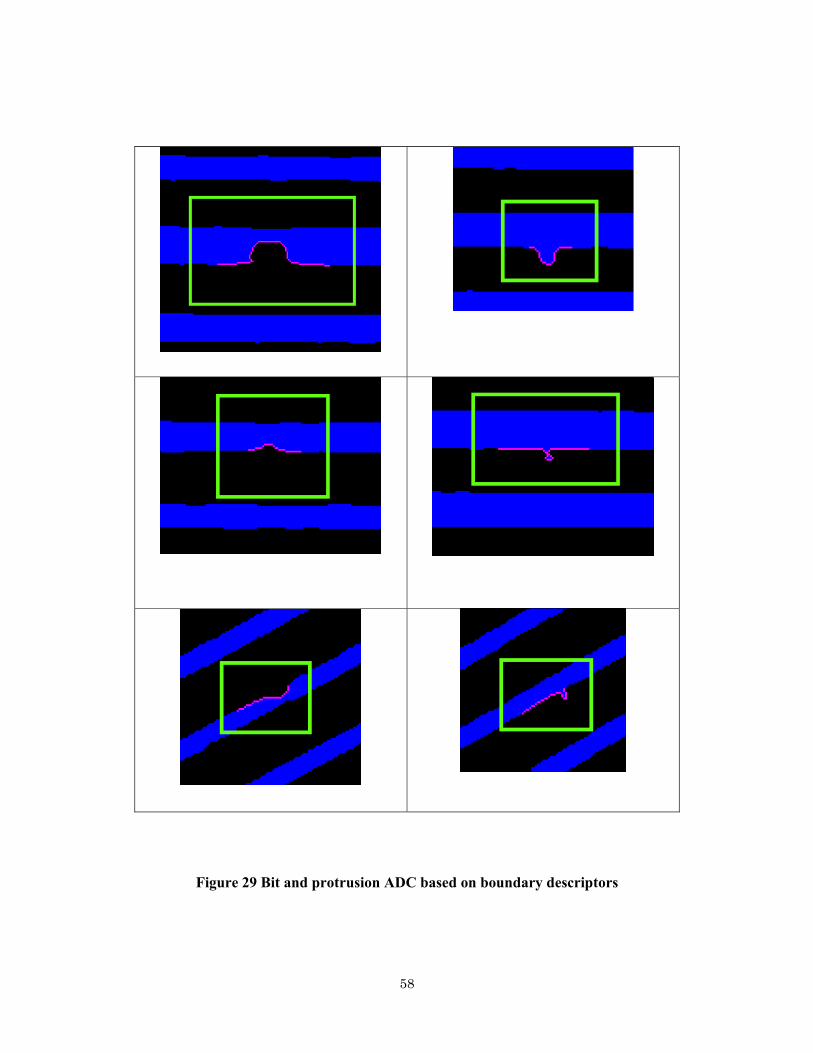
58
Figure 29 Bit and protrusion ADC based on boundary descriptors

59
4.5 Successful Application and Evaluation
Two successful examples applying the skeletonization algorithm are presented here. The
first example is the design for a special inspection algorithm for the Panasonic PDP
research center. The second successful application is a field known as glass mask
inspection.
4.5.1 New PDP Pattern Inspection & Simulation Results
Defect inspection is performed in a simple manner. For every feature point, with the
help of their feature type and feature directions, the surround feature points are
searched. If targets are found, the direction code may or may not be matched by one of
the codes (see Figs. 21, 22, 23). In this manner, several types of defects can be identified
eg. open, short. This methodology is designed especially to detect electrode defects in
PDPs.
The simulation results can be seen in Figure 30. In this example, the PDP pattern was
designed by PDP research center of Panasonic. It is very successful application of
feature point matching after skeletonization. The logic is that searching the feature
points along the vertical direction, once the feature point found, check its direction code
to look it is matching point or not. Also some conditional connection judgement is used
for the detect inspection.
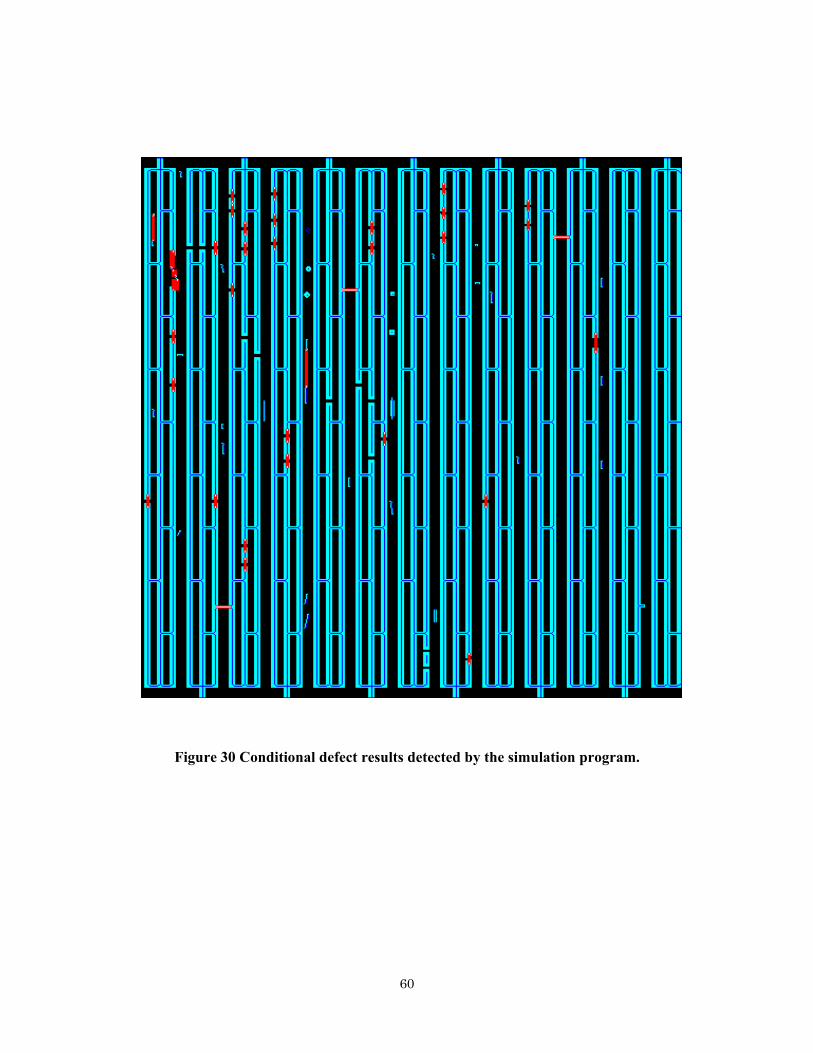
60
Figure 30 Conditional defect results detected by the simulation program.
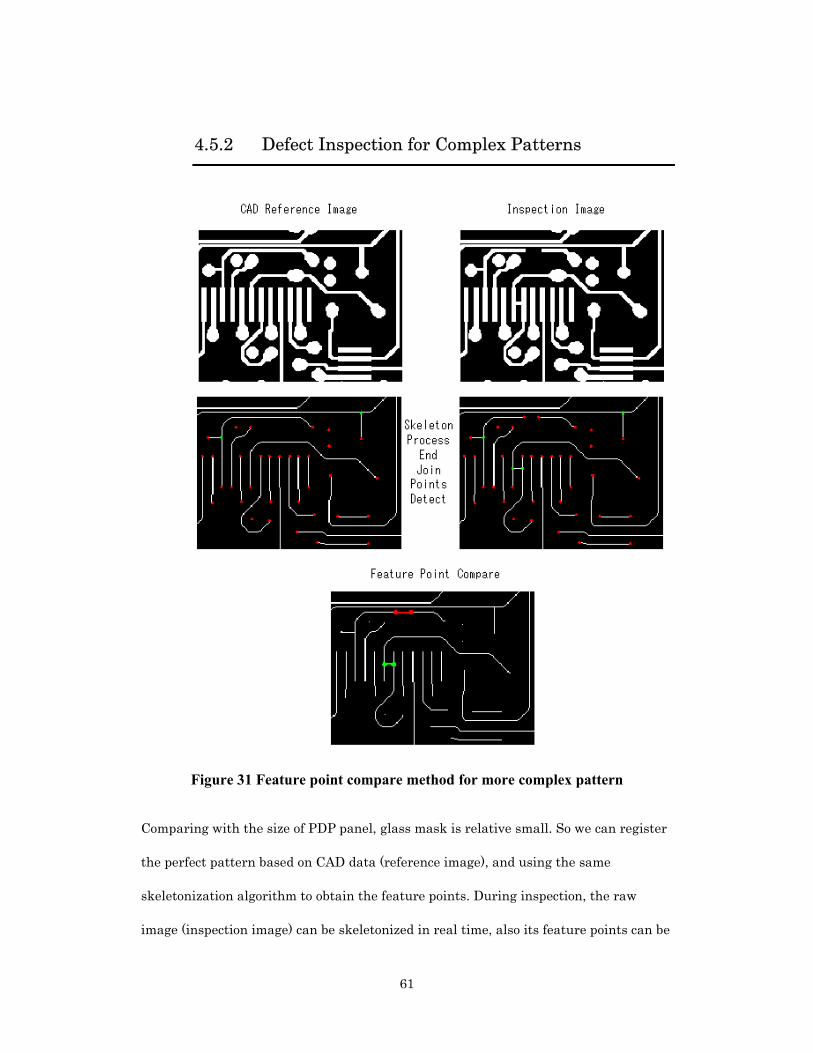
61
4.5.2 Defect Inspection for Complex Patterns
Figure 31 Feature point compare method for more complex pattern
Comparing with the size of PDP panel, glass mask is relative small. So we can register
the perfect pattern based on CAD data (reference image), and using the same
skeletonization algorithm to obtain the feature points. During inspection, the raw
image (inspection image) can be skeletonized in real time, also its feature points can be
62
detected in real time. Comparing the feature points of the registered CAD reference
image with the feature points of the inspection image after skeletonization, defects such
as shorts or opens can be detected. Figure 31 illustrates successful application based on
feature point detection after skeletonization.
4.5.3 Real-World Implementation
Shown in Appendix B is a PDP inspection machine and review station designed and
manufactured by V Technology Co., Ltd. The inspection algorithms have been
successfully installed in many PDP inspection machines. The ADC software described in
this paper has been installed in this review station shown. Appendix C shows some
real-world test images as well as their skeletonization results based on the developed
algorithm. I spent many months at V Technology Co., Ltd to debug and test the
algorithm and delivered to the production line in 2001 and 2002.
The developed skeletonization algorithm has enhanced the ability of PDP inspection
machine. The throughput has been enhanced from three minutes per 50 inch PDP panel
to fifteen seconds. And ADC software is installed in review station to improve location
accuracy of the defect from seven micrometre to one micrometre. The review station can
now automatically make decisions about whether or not the PDP can be repaired based
on the nature of the defect.
63
5 Conclusions and Future Work
In this thesis, a new 12-step approach to skeletonization has been developed. This
algorithm has made improvement and has met the required design criteria. This
produces a more desirable output in which circles are properly skeletonized to dots
instead of crosses. This 12-step procedure has been implemented using the existing
hardware and skeletonization lookup tables. Simple modifications can be made to
handle noise input and generate condensed, application-specific output. There are two
shortcomings of this new method, first, circles are reduced to 12× or 13× lines, instead
of single pixels. The second weakness is only apparent after a large number of
skeletonization passes. After 512 cycles, circles in the image begin to becomes
octagon-shaped. This, however, does not present a problem in the 64 passes used for
PDP inspection which are realized by FPGA module. The ADC software is implemented
in the host computer, which improve the judgement speed of the review station.
5.1 Conclusions
The new skeletonization algorithm has been demonstrated to be an improvement
over existing techniques. The algorithm has been successfully implemented within a
PDP inspection machine used by popular PDP manufacturers eg. Panasonic, NEC,
Pioneer, etc.
The new skeletonization algorithm works parallel with existed DRC and AB
compare methods, hundred percent of the defects on the PDP panel can be detected
by a PDP inspection machine.
64
Skeletonization method usually is complex and computational slow. In this case, the
algorithm was implemented by FPGA module (Flex) of Altera Corporation [30]. And
also implemented by Altera FPGA module Stratix [31] recently.
The discussed algorithms for ADC works well for defect detection and classification.
Defects such as cut, bite, short, protrusion, pinhole, and island are properly
identified on a PDP review station.
The new algorithms of skeletonization and ADC have been used in the real world
systems for PDP inspection machine and review station by V Technology Co., Ltd.
5.2 Future Work
With the development of PDP technology, the PDP pattern will be modified in the
future, so modified inspection algorithms will be required. The existing methods are
expected play an important role in the inspection of PDPs.
The ADC software currently only supports PDP electrode patterns. For any color
PDP patterns, new ADC algorithms will need to be developed for the review station.
The new algorithm will be used for PCB inspection systems.
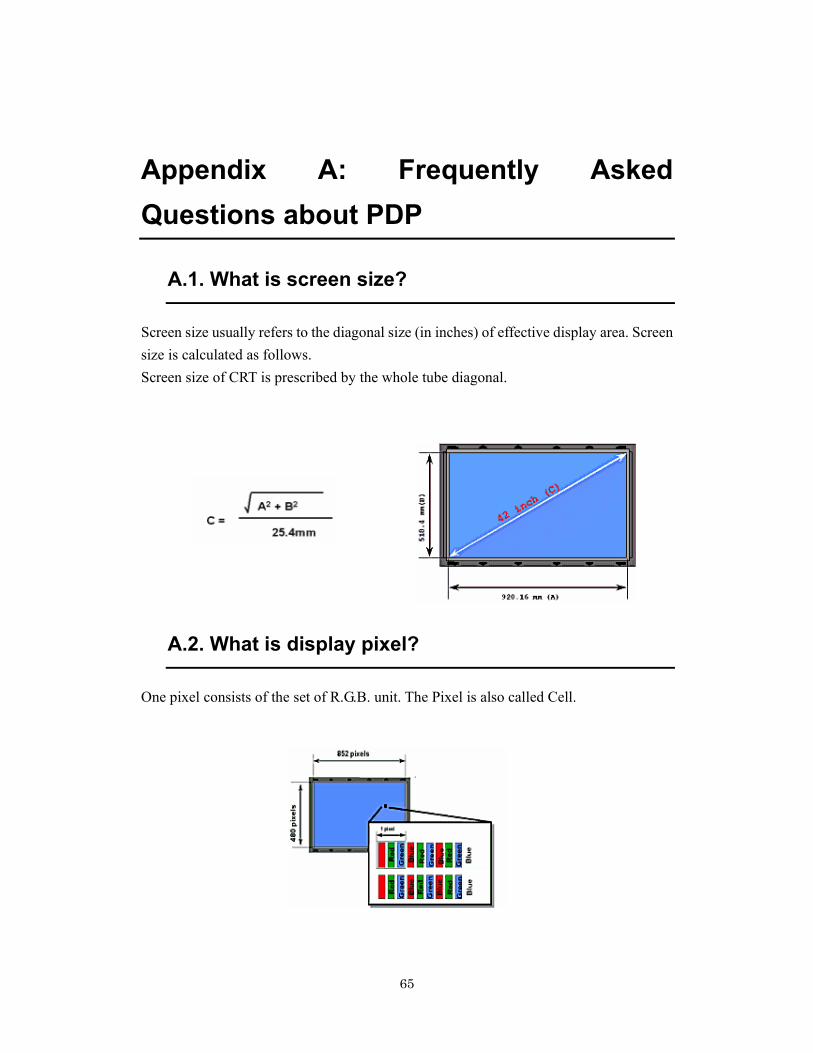
65
Appendix A: Frequently Asked Questions about PDP
A.1. What is screen size?
Screen size usually refers to the diagonal size (in inches) of effective display area. Screen size is calculated as follows. Screen size of CRT is prescribed by the whole tube diagonal.
A.2. What is display pixel?
One pixel consists of the set of R.G.B. unit. The Pixel is also called Cell.

66
A.3. What is pixel pitch?
Defined as the distance from one pixel to the next pixel.
A.4. What is Effective Display Area?
Displayable area of the screen (H, V)
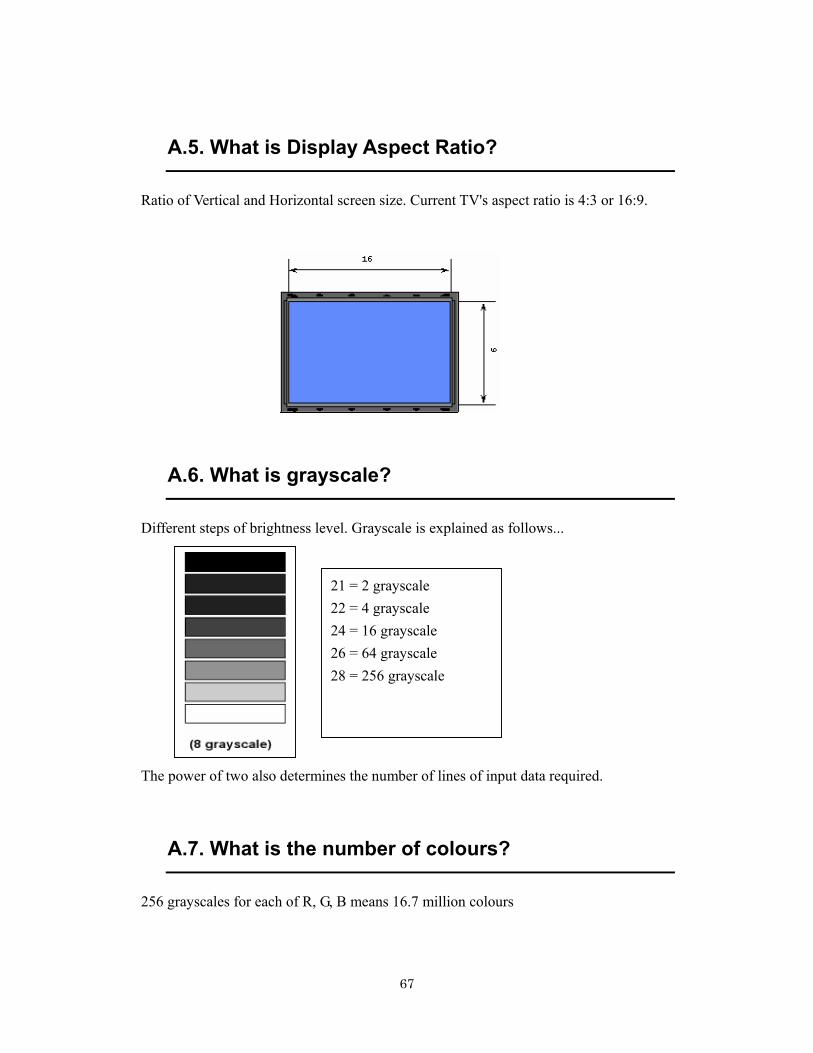
67
A.5. What is Display Aspect Ratio?
Ratio of Vertical and Horizontal screen size. Current TV's aspect ratio is 4:3 or 16:9.
A.6. What is grayscale?
Different steps of brightness level. Grayscale is explained as follows... The power of two also determines the number of lines of input data required.
A.7. What is the number of colours?
256 grayscales for each of R, G, B means 16.7 million colours
21 = 2 grayscale 22 = 4 grayscale 24 = 16 grayscale 26 = 64 grayscale 28 = 256 grayscale

68
A.8. What is the brightness?
Unit of the luminance of display. Spot brightness is the peak brightness at the centre of the dot. Surface average brightness is the averaged brightness of lighting dot and non-lighting dot in the measured circle area. PDP uses cd/m2 unit as brightness
A.9. What is the contrast ratio?
. 10. What is Colour Temperature?
Ratio of the brightness of lighting and non-lighting. There is a distinction between dark room contrast and room (day- light) contrast
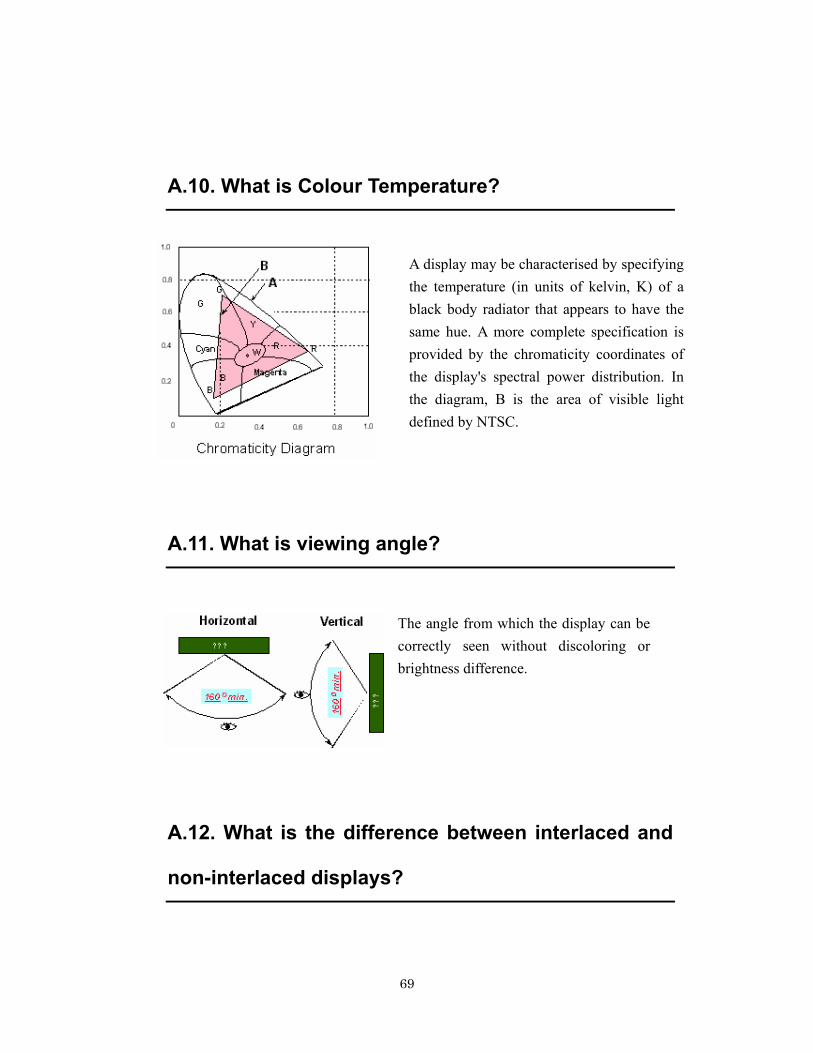
69
A.10. What is Colour Temperature?
A.11. What is viewing angle?
A.12. What is the difference between interlaced and
non-interlaced displays?
A display may be characterised by specifying the temperature (in units of kelvin, K) of a black body radiator that appears to have the same hue. A more complete specification is provided by the chromaticity coordinates of the display's spectral power distribution. In the diagram, B is the area of visible light defined by NTSC.
The angle from which the display can be correctly seen without discoloring or brightness difference.
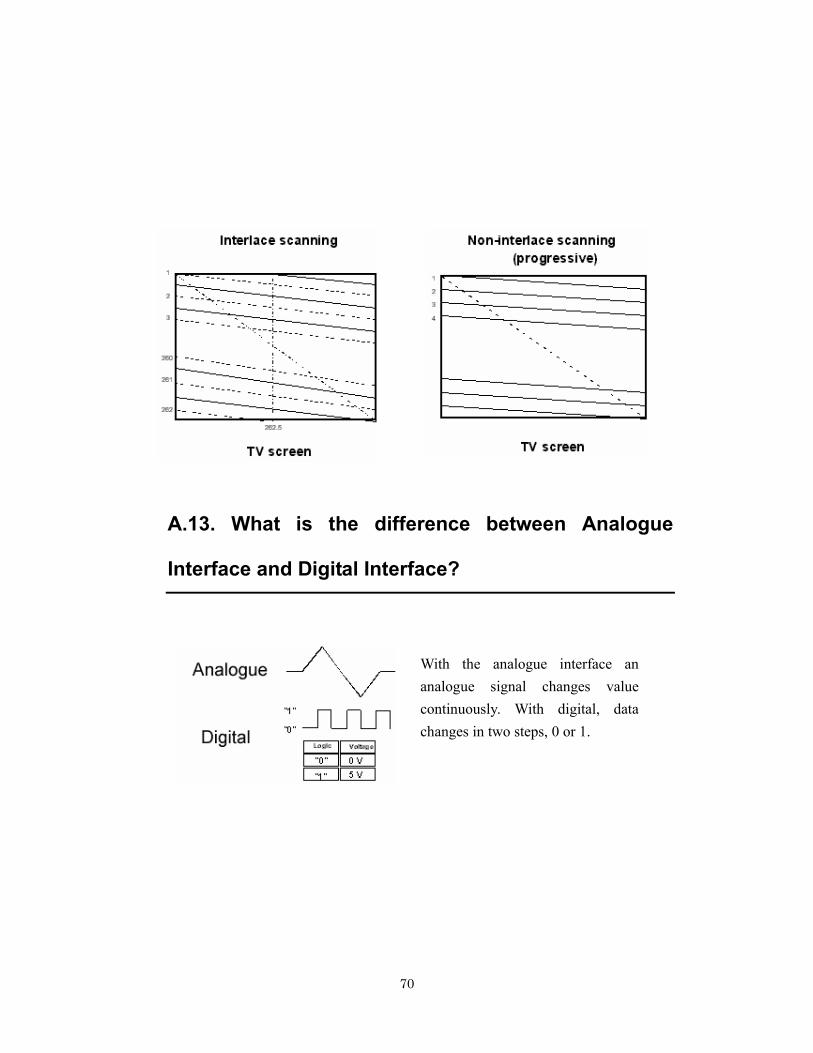
70
A.13. What is the difference between Analogue
Interface and Digital Interface?
With the analogue interface an analogue signal changes value continuously. With digital, data changes in two steps, 0 or 1.
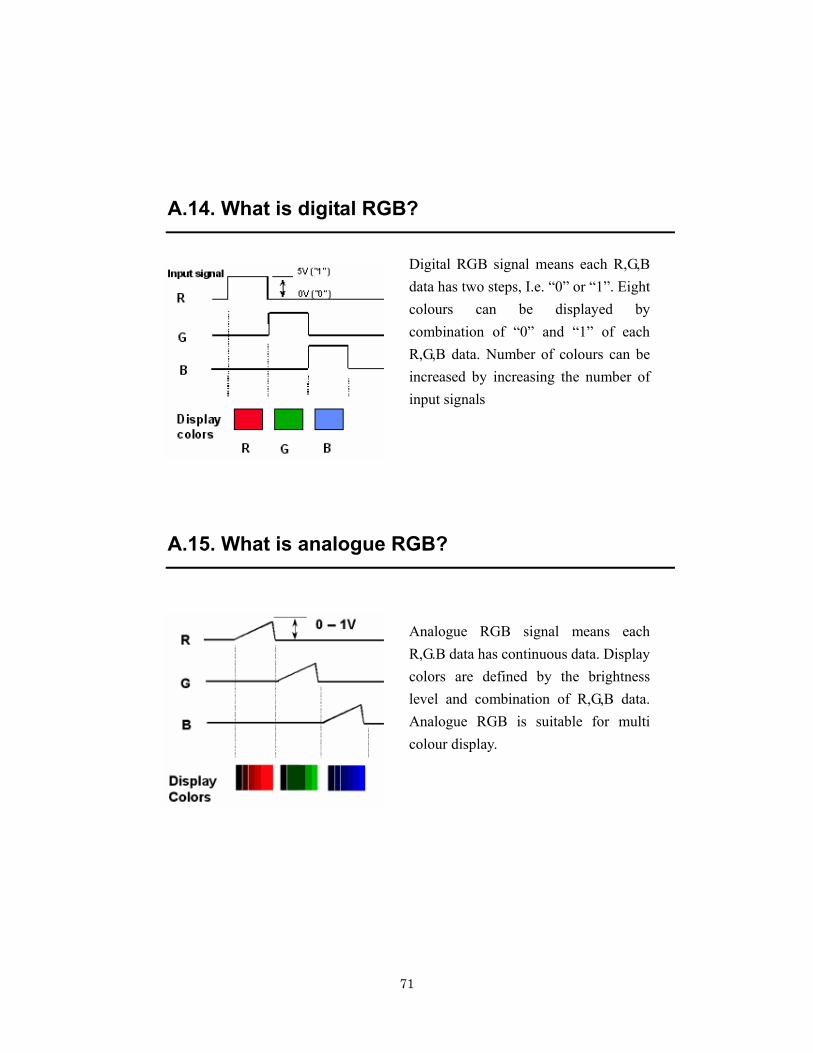
71
A.14. What is digital RGB?
A.15. What is analogue RGB?
Digital RGB signal means each R,G,B data has two steps, I.e. “0” or “1”. Eight colours can be displayed by combination of “0” and “1” of each R,G,B data. Number of colours can be increased by increasing the number of input signals
Analogue RGB signal means each R,G.B data has continuous data. Display colors are defined by the brightness level and combination of R,G,B data. Analogue RGB is suitable for multi colour display.
72
Appendix B: PDP Inspection Machine and Review Station of V Technology Co., Ltd.
B.1. V Technology Co., Ltd. (www.vtec.co.jp)
V Technology has been rapidly growing at an incredible pace according to the market
growth since its establishment in 1997 as a manufacturer of inspection, measurement,
review, and repair systems for flat-panel displays (PDP, LCD and FED), the key devices
in IT and multimedia technologies. The market of flat-panel display devices will reach
$100 billion (whereas $51 billion in 2000). The market of flat-panel itself will get up to
$83 billion (whereas $22 billion in 2000).
LCD & PDP manufacturing requires inspection machines available for 8-9 inspection
layers. V Technology is the first manufacturer in the world having fully completed a
series of inspection system which gives advanced and highly available total yield
management solution. Their robust total solution and expansion of capital investment
will expedite growth in the inspection system market. Furthermore, they will reinforce
their sales & service support channel in Taiwan, Korea and China.
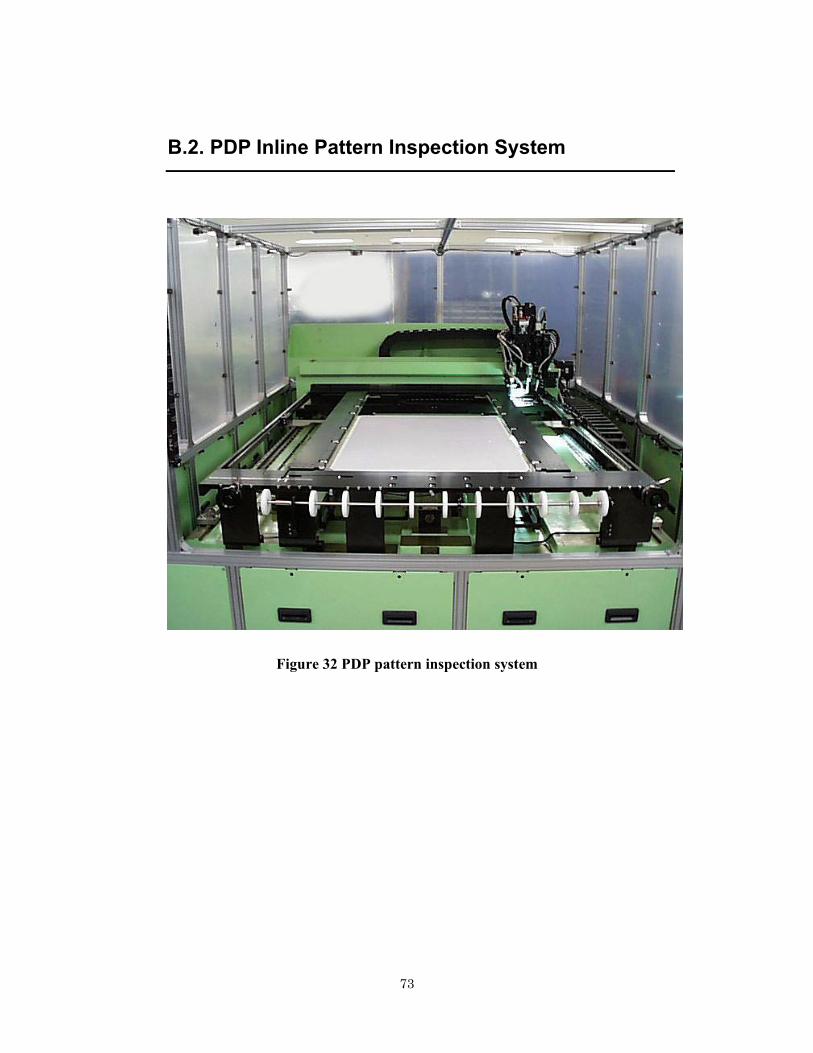
73
B.2. PDP Inline Pattern Inspection System
Figure 32 PDP pattern inspection system
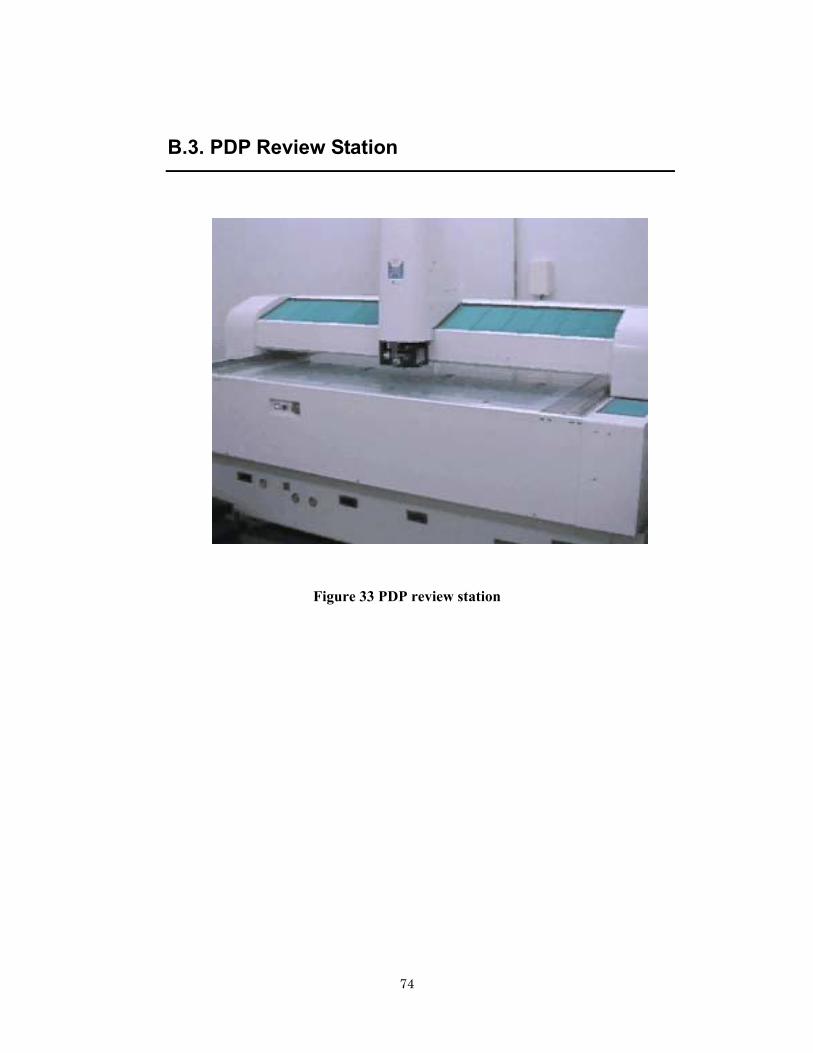
74
B.3. PDP Review Station
Figure 33 PDP review station

75
Appendix C: Test Images and Results Based on New Skeletonization Algorithm
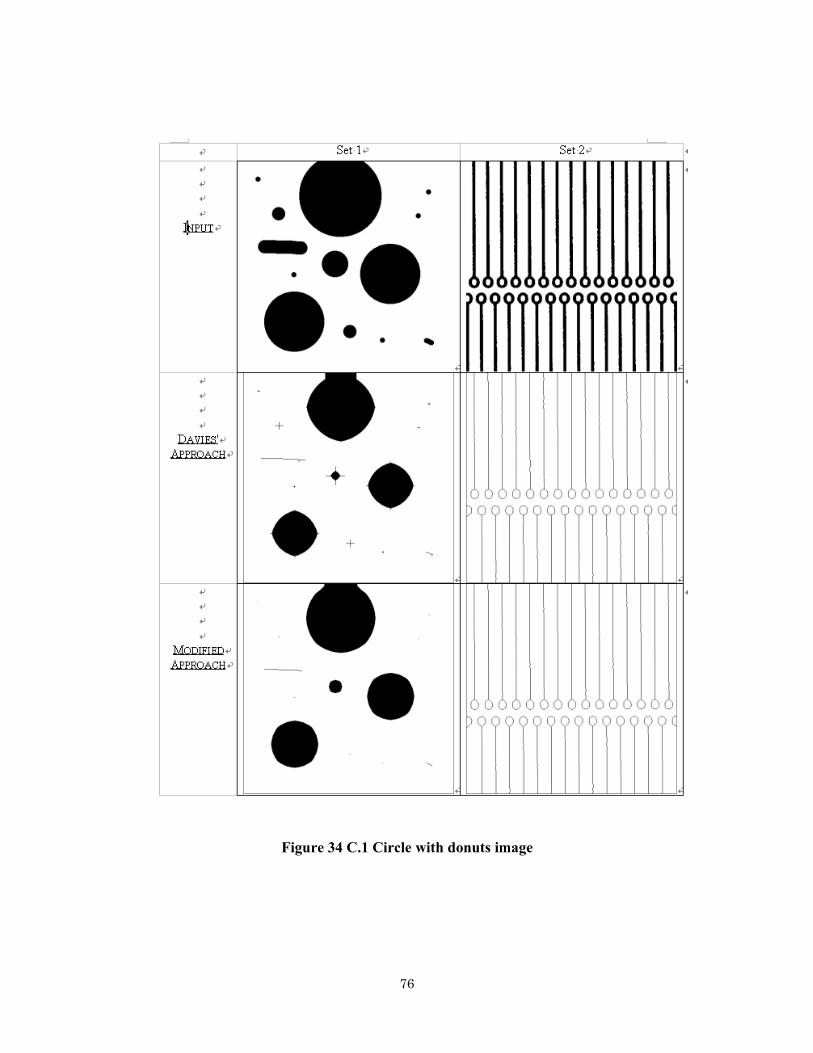
76
Figure 34 C.1 Circle with donuts image
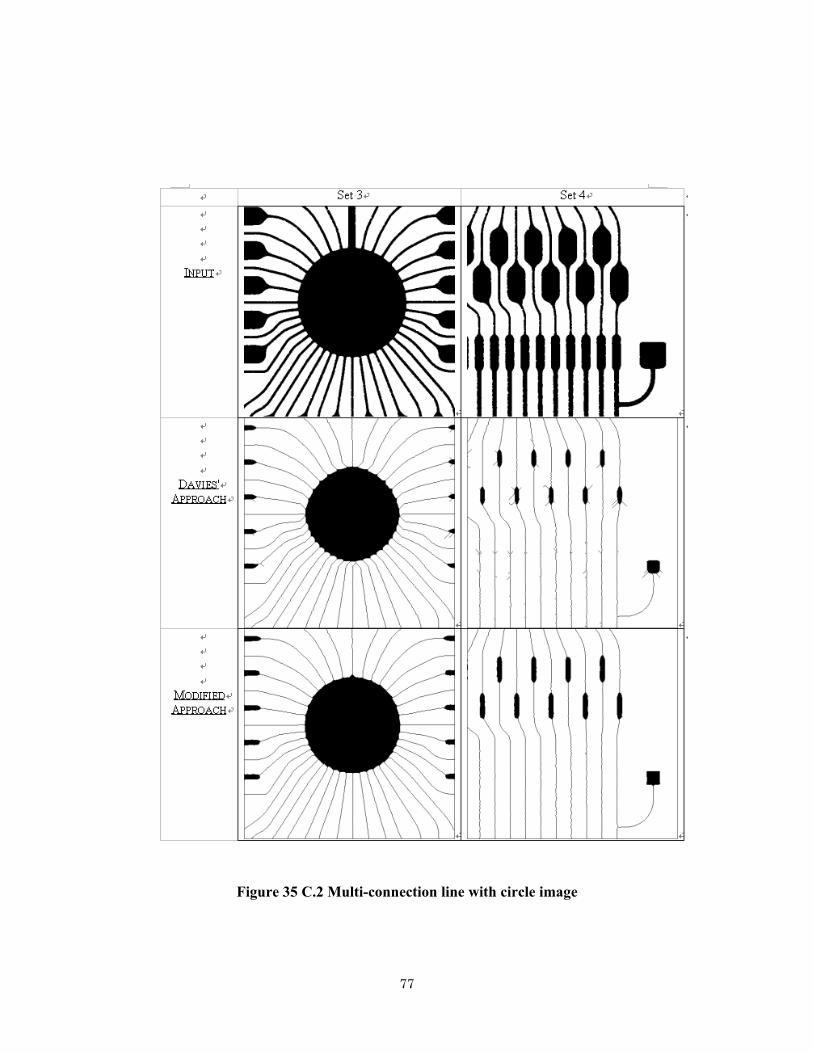
77
Figure 35 C.2 Multi-connection line with circle image

78
Figure 36 C.3 Circle with connection line image
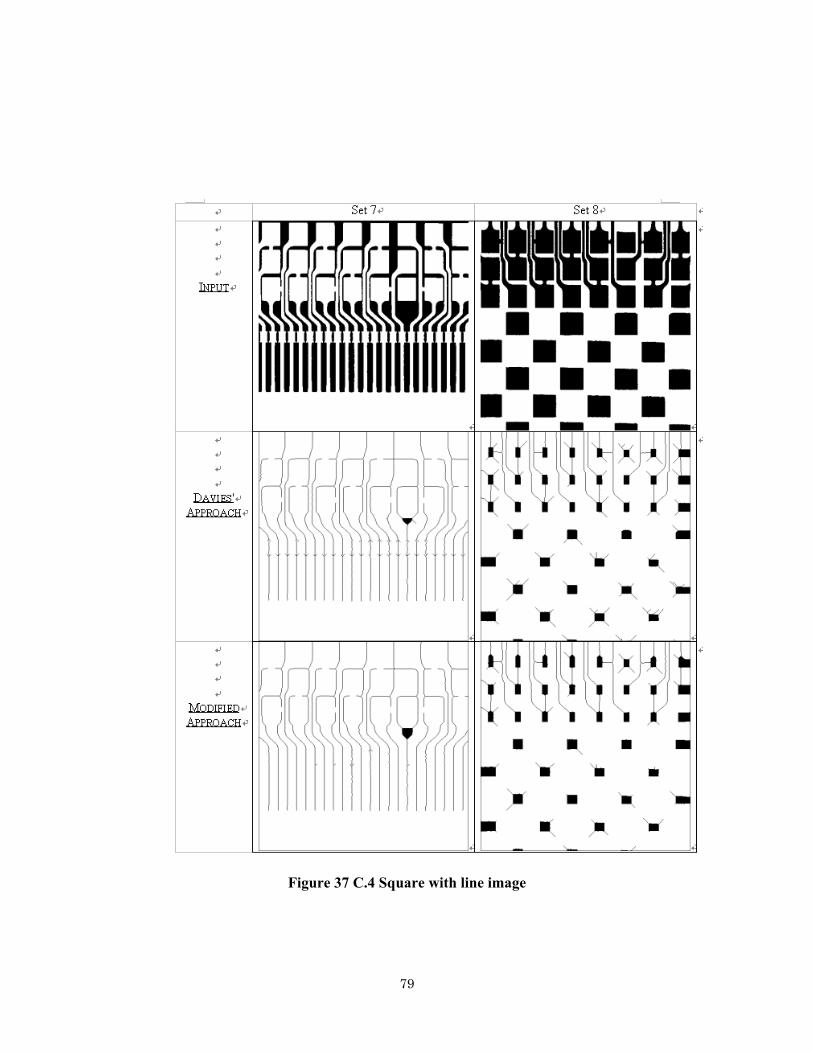
79
Figure 37 C.4 Square with line image

80
Figure 38 C.5 Connection image

81
Figure 39 C.6 Line image with circle
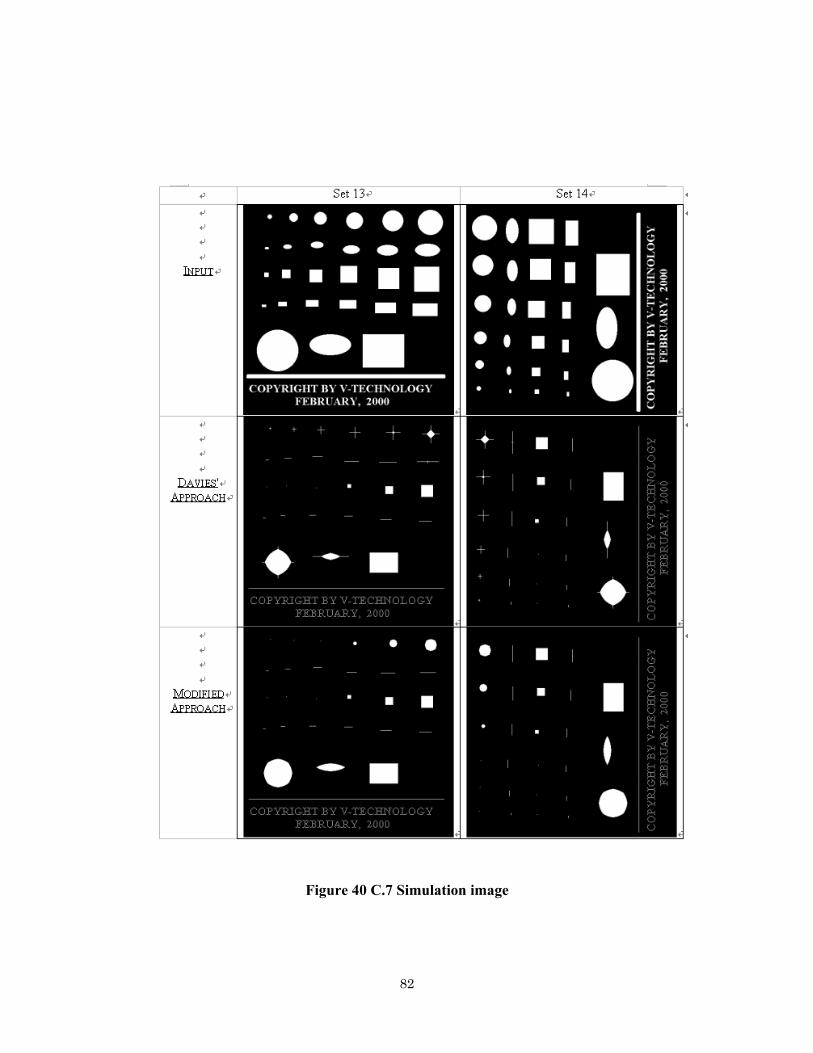
82
Figure 40 C.7 Simulation image
83
Appendix D: Detail Logic Design of the Related Algorithms
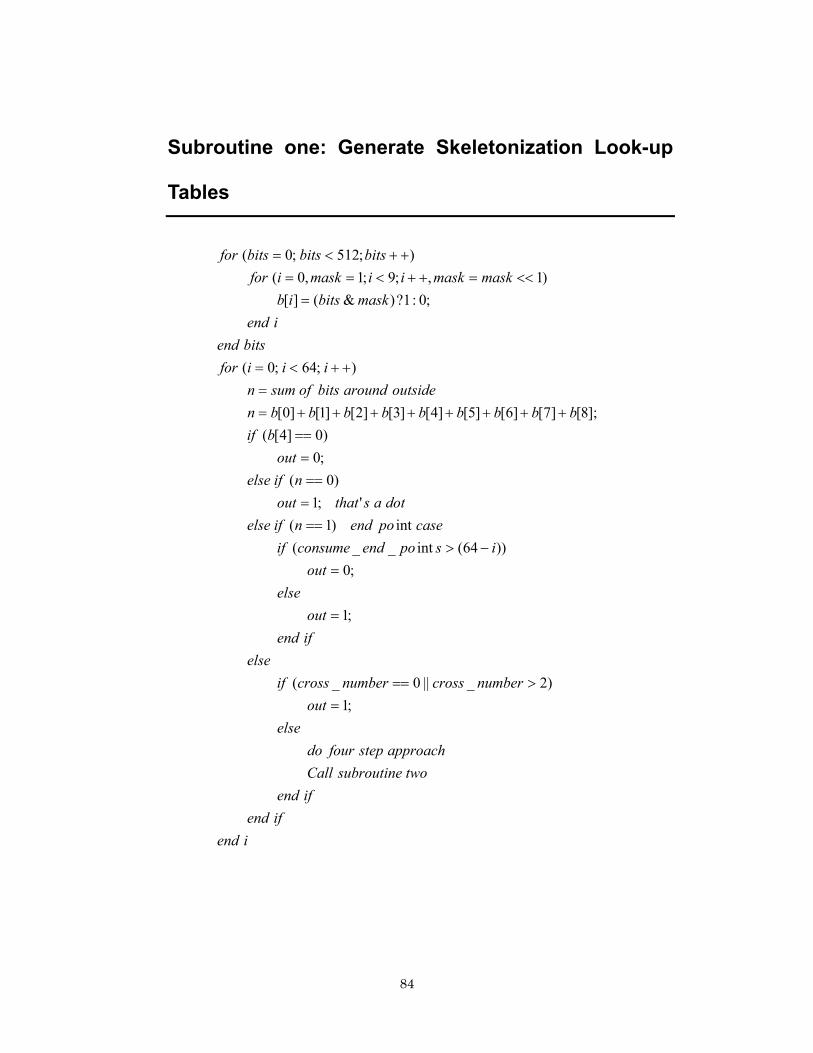
84
Subroutine one: Generate Skeletonization Look-up
Tables
iendifend
ifendtwosubroutineCall
approachstepfourdoelse
outnumbercrossnumbercrossif
elseifendout
elseout
ispoendconsumeifcasepoendnifelse
dotasthatoutnifelse
outbif
bbbbbbbbbnoutsidearoundbitsofsumn
iiiforbitsend
iendmaskbitsib
maskmaskiimaskiforbitsbitsbitsfor
;1)2_||0_(
;1
;0))64(int__(
int)1(';1
)0(;0)0]4[(
];8[]7[]6[]5[]4[]3[]2[]1[]0[
);64;0(
;0:1?)&(][)1,;9;1,0(
);512;0(
=>==
=
=−>
========
++++++++==
++<=
=<<=++<==
++<=
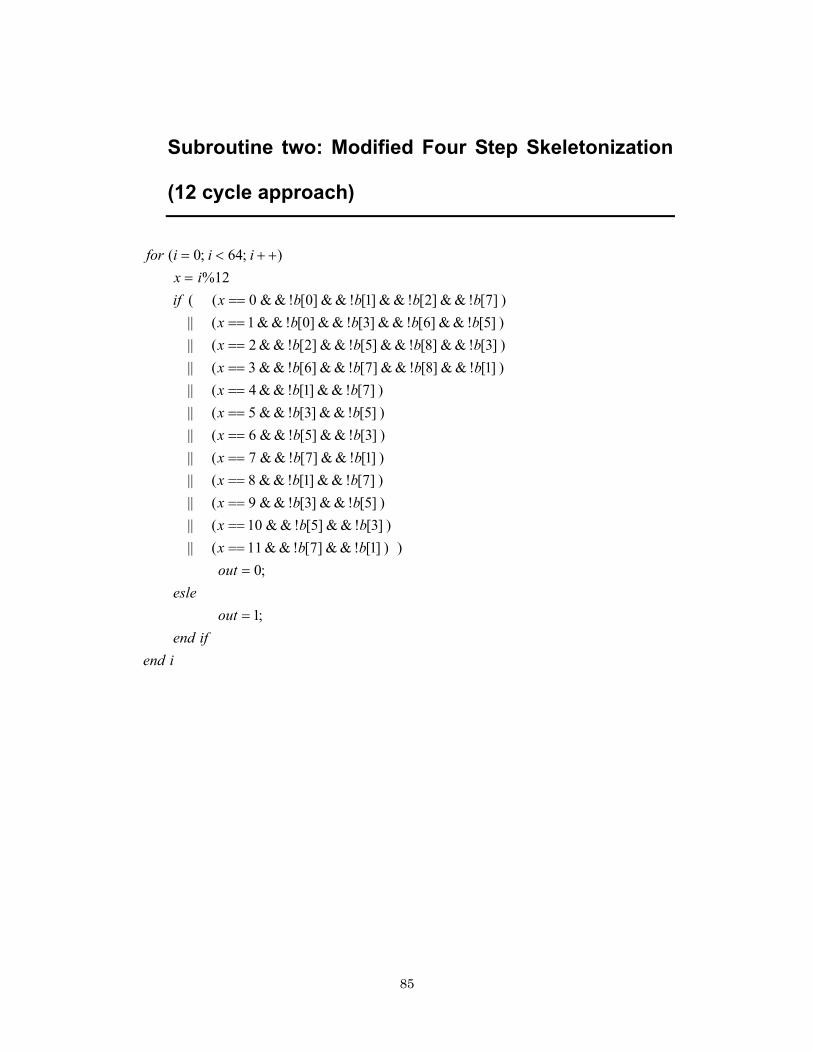
85
Subroutine two: Modified Four Step Skeletonization
(12 cycle approach)
iendifendout
esleout
bbxbbxbbxbbxbbxbbxbbxbbx
bbbbxbbbbxbbbbxbbbbxif
ixiiifor
;1
;0))]1[!&&]7[!&&11(||
)]3[!&&]5[!&&10(||)]5[!&&]3[!&&9(||)]7[!&&]1[!&&8(||)]1[!&&]7[!&&7(||)]3[!&&]5[!&&6(||)]5[!&&]3[!&&5(||)]7[!&&]1[!&&4(||
)]1[!&&]8[!&&]7[!&&]6[!&&3(||)]3[!&&]8[!&&]5[!&&]2[!&&2(||)]5[!&&]6[!&&]3[!&&]0[!&&1(||)]7[!&&]2[!&&]1[!&&]0[!&&0((
12%);64;0(
=
=========================
=++<=
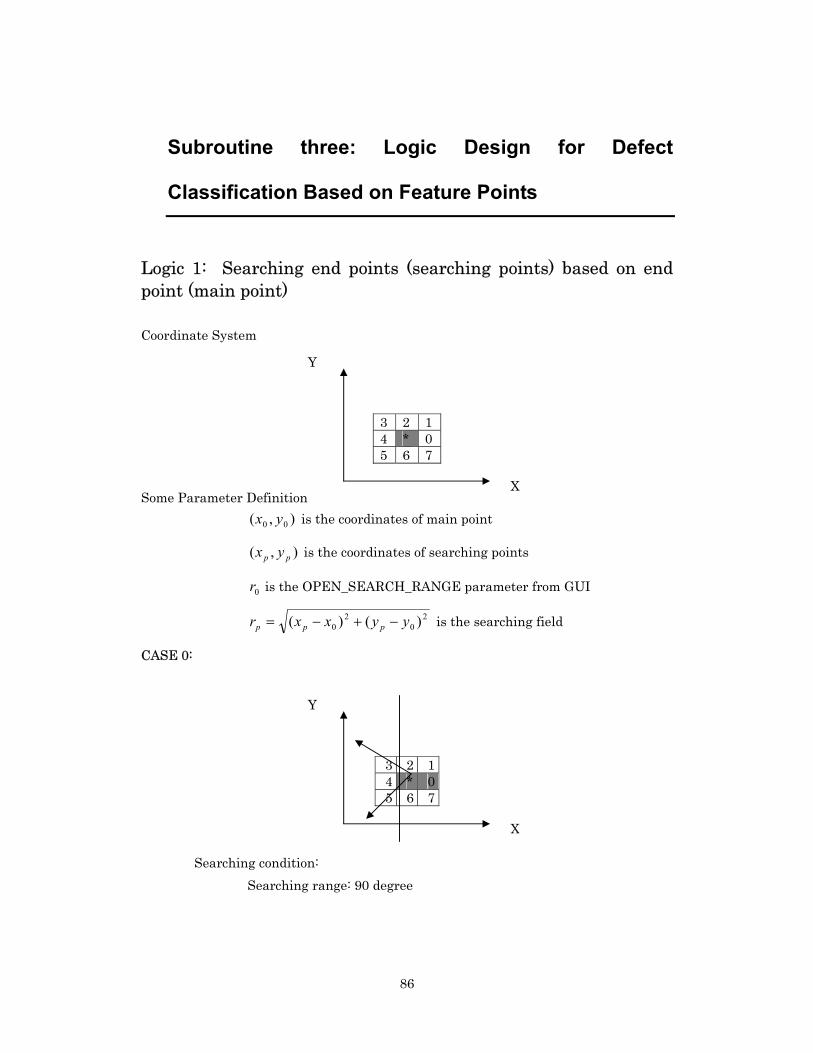
86
Subroutine three: Logic Design for Defect
Classification Based on Feature Points
Logic 1: Searching end points (searching points) based on end point (main point) Coordinate System
3 2 1 4 * 0 5 6 7
Some Parameter Definition ),( 00 yx is the coordinates of main point
),( pp yx is the coordinates of searching points
0r is the OPEN_SEARCH_RANGE parameter from GUI
20
20 )()( yyxxr ppp −+−= is the searching field
CASE 0:
3 2 1 4 * 0 5 6 7
Searching condition: Searching range: 90 degree
Y
X
Y
X
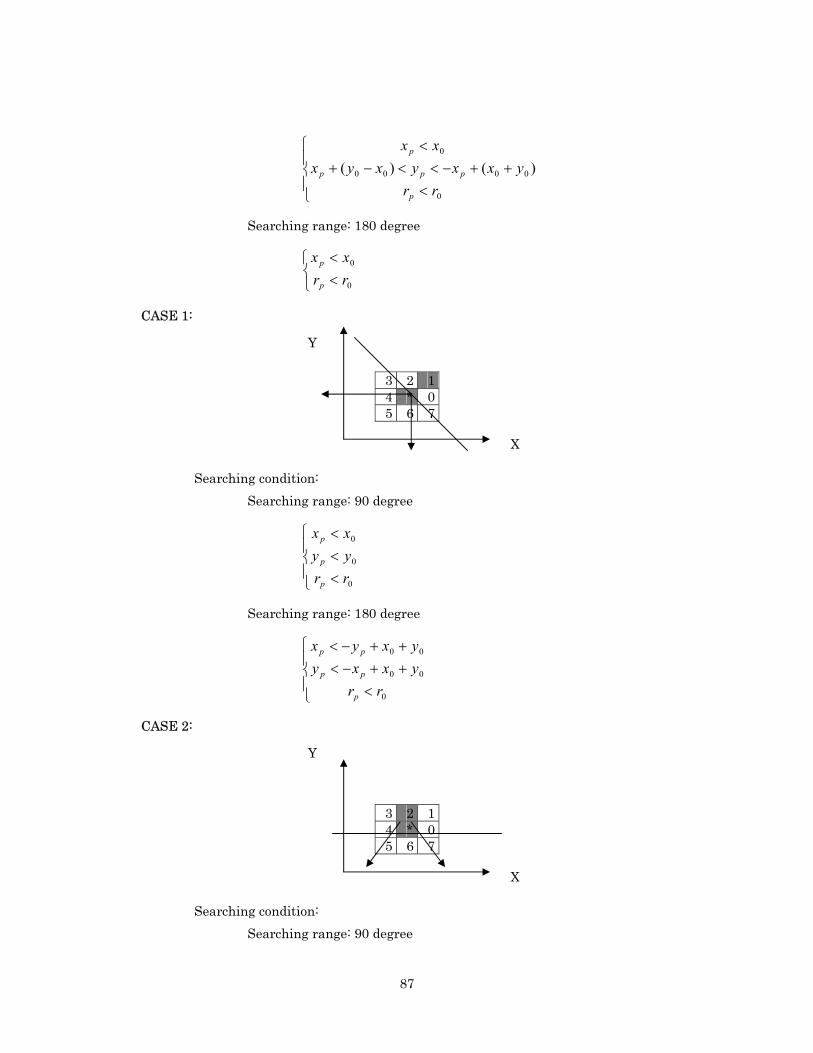
87
<++−<<−+
<
0
0000
0
)()(rr
yxxyxyxxx
p
ppp
p
Searching range: 180 degree
<<
0
0
rrxx
p
p
CASE 1:
3 2 1 4 * 0 5 6 7
Searching condition: Searching range: 90 degree
<<<
0
0
0
rryyxx
p
p
p
Searching range: 180 degree
<++−<++−<
0
00
00
rryxxyyxyx
p
pp
pp
CASE 2:
3 2 1 4 * 0 5 6 7
Searching condition: Searching range: 90 degree
Y
X
Y
X

88
<<
++−<<−−
0
0
0000 )()(
rryy
yxyxxyy
p
p
ppp
Searching range: 180 degree
<>
0
0
rryy
p
p
CASE 3:
3 2 1 4 * 0 5 6 7
Searching condition: Searching range: 90 degree
<<>
0
0
0
rryyxx
p
p
p
Searching range: 180 degree
<+−<−+<
0
00
00
rryxxyyxyx
p
pp
pp
CASE 4:
3 2 1 4 * 0 5 6 7
Searching condition: Searching range: 90 degree
Y
X
Y
X
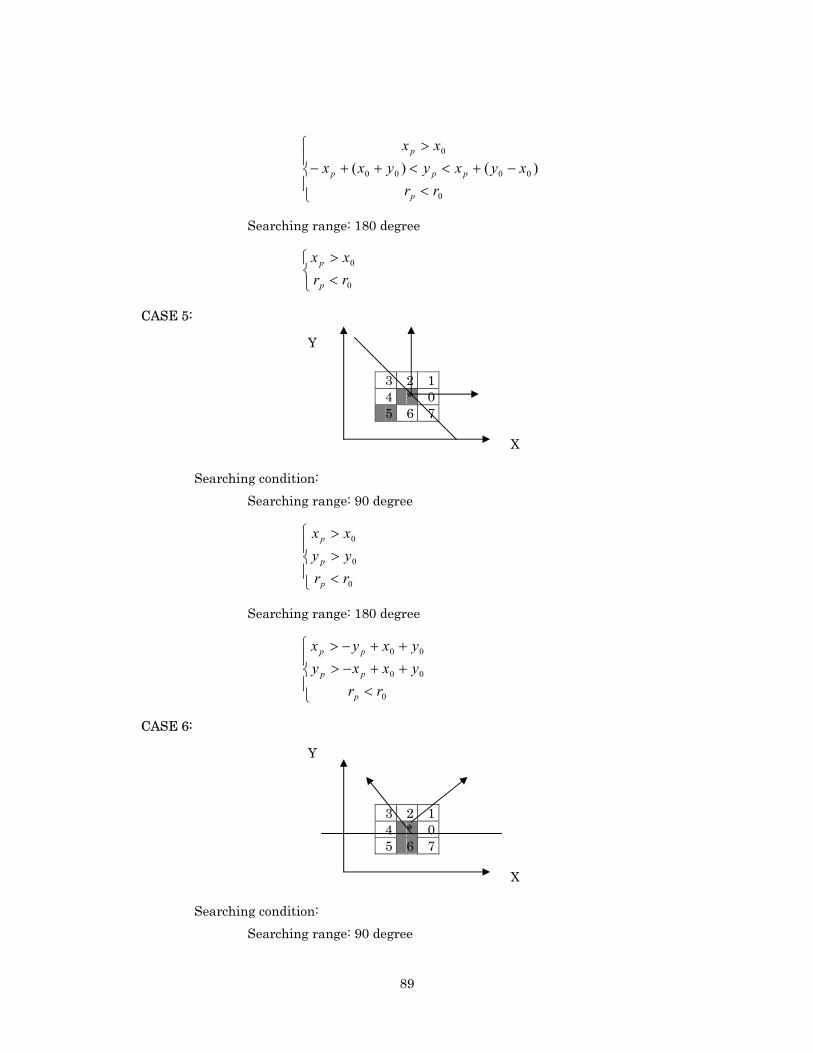
89
<−+<<++−
>
0
0000
0
)()(rr
xyxyyxxxx
p
ppp
p
Searching range: 180 degree
<>
0
0
rrxx
p
p
CASE 5:
3 2 1 4 * 0 5 6 7
Searching condition: Searching range: 90 degree
<>>
0
0
0
rryyxx
p
p
p
Searching range: 180 degree
<++−>++−>
0
00
00
rryxxyyxyx
p
pp
pp
CASE 6:
3 2 1 4 * 0 5 6 7
Searching condition: Searching range: 90 degree
Y
X
Y
X
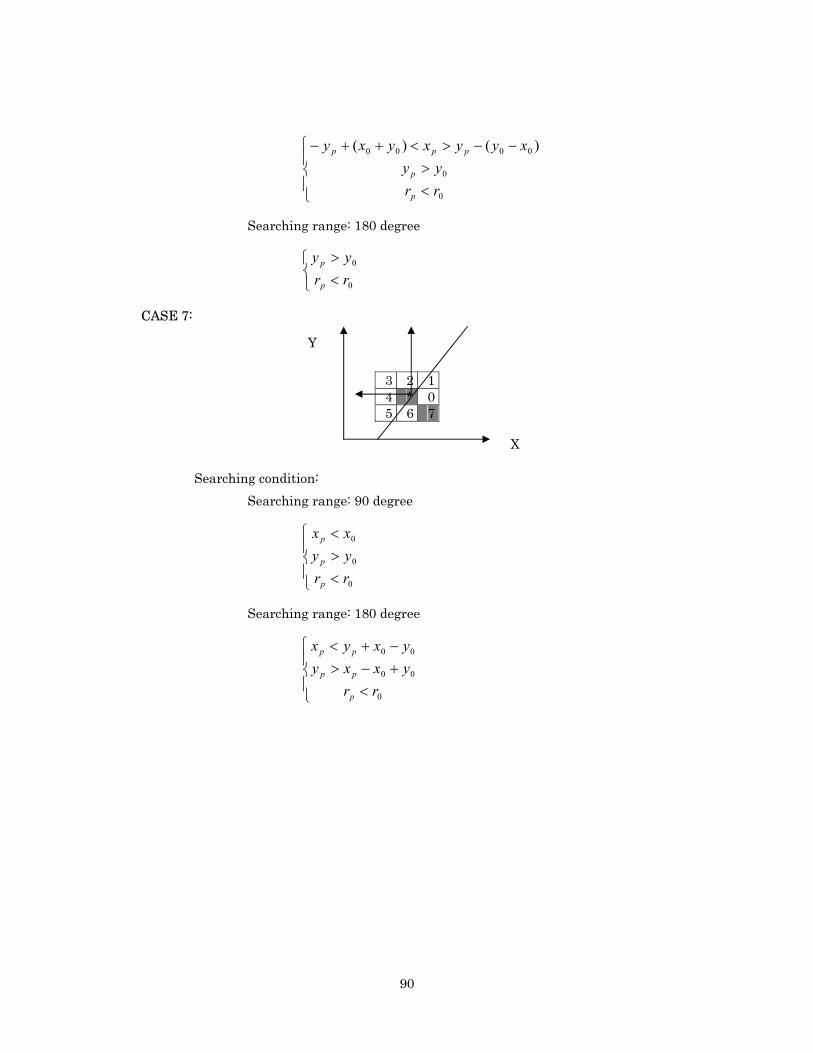
90
<>
−−><++−
0
0
0000 )()(
rryy
xyyxyxy
p
p
ppp
Searching range: 180 degree
<>
0
0
rryy
p
p
CASE 7:
3 2 1 4 * 0 5 6 7
Searching condition: Searching range: 90 degree
<><
0
0
0
rryyxx
p
p
p
Searching range: 180 degree
<+−>−+<
0
00
00
rryxxyyxyx
p
pp
pp
Y
X
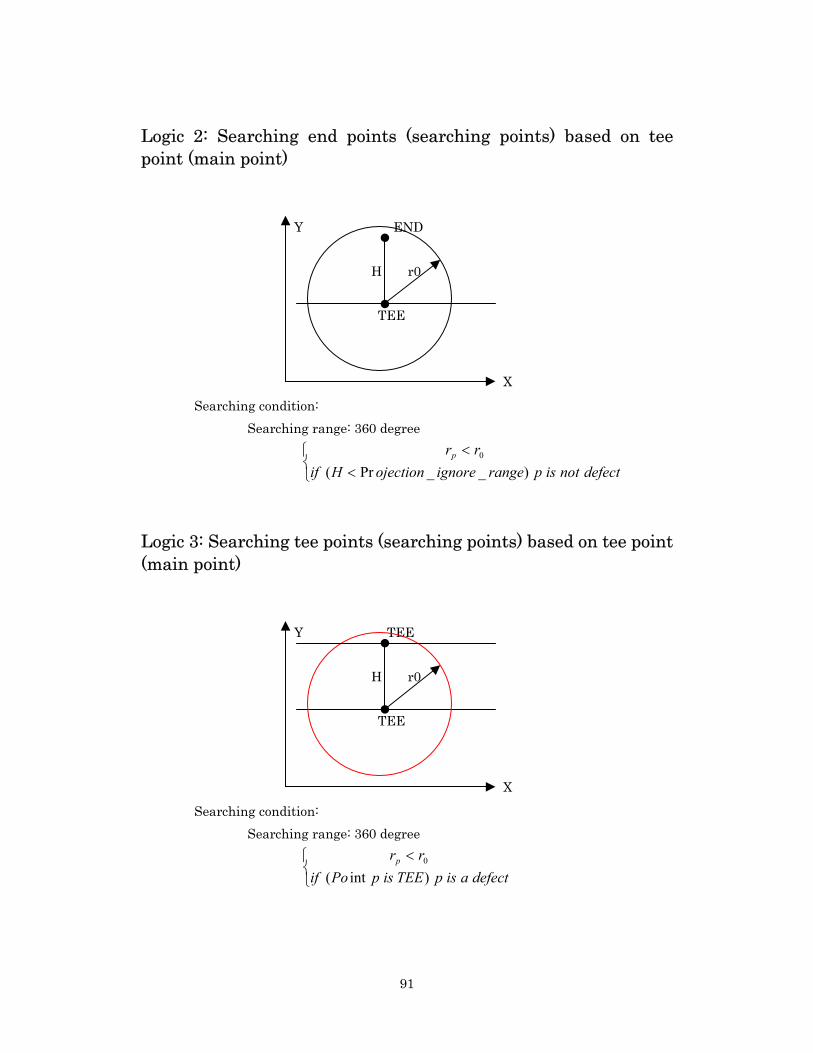
91
Logic 2: Searching end points (searching points) based on tee point (main point)
Y END
H r0
TEE
X Searching condition: Searching range: 360 degree
<<
defectnotisprangeignoreojectionHifrrp
)__Pr(0
Logic 3: Searching tee points (searching points) based on tee point (main point)
Y TEE
H r0
TEE
X Searching condition: Searching range: 360 degree
<
defectaispTEEispPoifrrp)int(0
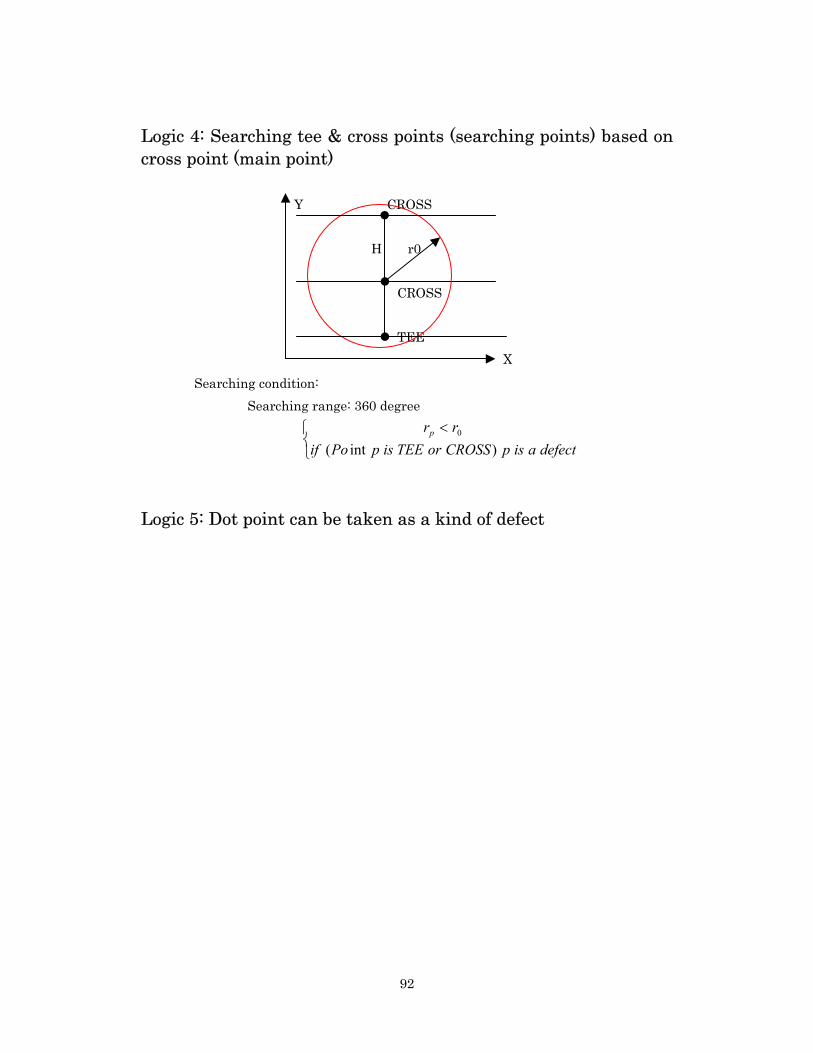
92
Logic 4: Searching tee & cross points (searching points) based on cross point (main point)
Y CROSS
H r0
CROSS
TEE X
Searching condition: Searching range: 360 degree
<
defectaispCROSSorTEEispPoifrrp
)int(0
Logic 5: Dot point can be taken as a kind of defect

93
References [1] E. R. Davies, Machine Vision: Theory, Algorithms, Practicalities. (Second Edition)
San Diego: Academic Press, 1997. pp. 151-163.
[2] R. C. Gonzalez, C. Rafael and P. Wintz, Digital Image Processing. (Second Edition)
Massachusetts: Addison-Wesley Publishing, 1987. pp. 398-403.
[3] R. P. Belanger, “Morphological Processing System,” United States Patent.
Massachusetts, 15 September 1992. Sections 1-10.
[4] T. Y. Zhang, and C. Y. Suen, “A Fast Parallel Algorithm for Thinning Digital
Patterns.” Communication of the ACM, vol. 27, no. 3. 1984. pp. 236-239.
[5] B. G. Batchelor, Illumination and image acquisition techniques for industrial vision
systems, in Industrial Application of Image Analysis (N. J. Zimmerman and A.
Oosterlink, Eds.) PP. 97-118, D.E.B. Publishers, Pijnacker, Netherlands, 1984.
[6] G. T. Uber, Illumination methods for machine vision, in Proc.SPIE 1005, 1986,
93-102.
[7] J. K. Chou, Automated inspection of printed circuit board, in Vision ’85 (TECON):
Conference Proceedings, 1985, pp.5.20-5.33.
[8] Z. Hussain, Digital Image Processing, practical Application of Parallel Processing
Techniques, Ellis Horwood press, 1991
[9] R. C. Gonzalez and P. Wintz., Digital Image Processing, Addison-Wesley, Reading,
Ma, 1984.
[10] T. Pavlidis, Algorithm for Graphics and Image Processing, Springer-Verlag,
94
Beilin, 1982.
[11] A. Rosenfeld and A. C. Kak, Digital Picture Processing, Volume1 & 2, Academic
Press, New York, 2nd edition, 1982.
[12] A. E. Essam and M. R. Kabuka, Binary object representation and recognition
using the Hilbert morphological skeleton transform, Pattern recognition 33 (2000)
pp.1621-1636.
[13] L. Lam and S. W. Lee, etc., Thinning methodologies – A comprehensive survey,
IEEE transaction on PAMI, Vol.14, No.9, September 1992.
[14] H. Freeman, Computer processing of line-drawing images, Comput. Surveys 6(1),
1974
[15] R. H. Thibadeau, Automated visual inspection as skilled perception, in Vision ’85
(TECON): Conference Proceedings, 1985, pp.5.1-5.19.
[16] J. R. Mandeville, Novel method for analysis of printed circuit images, IBM J.Res.
Dev. 29(1), 1985, pp.73-87.
[17] B. C. Eduard, Review of Automated visual inspection 1983 to 1993 --- Part I:
Conventional approaches, SPIE --- Intell. Robots Comput. Vision XII 2055, 1993,
pp.128-158.
[18] H. Tsunekawa, Latest image evaluation systems aid efforts for product quality,
J.Electron, Eng. 29(306), 1992, pp.72-77.
[19] M. Ando, Oka, S. Iwata, and T. Inagaki, Automated optical pattern inspection for
high-density printed wiring boards, SPIE, Autom. Insp. High Speed Vision Archt. II
1004, 1988, pp.135-141.
95
[20] G. Y. Tang. A Discrete Version of Greens’s Theorem. IEEE Trans. Pattern
Analysis and Machine Intelligence, PAMI-4: pp.242-249, 1983.
[21] E. R. Dougherty, Introduction to Morphological Image Processing, SPIE Optical
Engineering Press, Bellingham, WA, 1992.
[22] J. Serra, Image Analysis and Mathematical Morphology, Academic Press, San
Diego, 1982.
[22] http://www.nec.co.jp/plasma/en/product/pdp/structure.html
[23] N. Otsu, A Threshold Selection Method from Gray Level Histograms, IEEE
Trans. Systems, Man, and Cybernetics, 1979, pp. 62-66.
[24] A. Shapiro, Automatic Classification of Wafer Detections: Status and Industry
Needs, IEEE Trans. Components, Packaging, and Manufacturing Technology – Part C,
Vol.20, No.2, April 1997.
[25] A.D.H. Thomas, M. G. Rodd, J. D. Holt, and C. J. Neill, Real-time Industrial
Visual Inspection: A Review, Real-Time Imaging 1, 139-158, 1995
[26] K. Schroeder, The Future of Vision Technology in a Changing Semiconductor
Industry, Vision Conference, October 1999.
[27] W. Tomlinson, B. Halliday, etc, In-Line SEM based ADC for Advanced Process
Control, 2000 IEEE/SEMI Advanced Semiconductor Manufacturing Conference.
[28] T. Pavlidis, A Minimum Storage Boundary Tracing Algorithm and Its
Application to Automatic Inspection, Princeton University Technical Report 222, Dec.

96
1976.
[29] C. M. Bjorklund and T. Pavlidis, On the Automatic Inspection and Description
of Printed Wiring Boards, in Proceedings of International Conference on Cybernetic Soc.,
Princeton, NJ, 1977, pp. 690-693.
[30] http://www.altera.com/products/devices/flex10k/f10-index.html
[31] http://www.altera.com/products/devices/stratix/stx-index.jsp


![Pioneer Pdp 434cmx Pdp 43mxe1 s [ET]](https://img.pdfslide.net/doc/110x75/55cf8eae550346703b948a48/pioneer-pdp-434cmx-pdp-43mxe1-s-et.jpg)