Embed Size (px)
Citation preview
Automatic Identification of Grey Matter Structures from MRI toImprove the Segmentation of White Matter Lesions
Simon Warfield�
Joachim Dengler�
Joachim Zaers�
Charles R.G. Guttmann�
William M. Wells III�
Gil J. Ettinger�
John Hiller���
Ron Kikinis���
AbstractThe segmentation of MRI scans of patients with
white matter lesions (WML) is difficult because theMRI characteristics of white matter lesions are simi-lar to those of grey matter. Intensity based statisticalclassification techniques misclassify some WML asgrey matter and some grey matter as WML.
We developed a fast elastic matching algorithmthat warps a reference data set containing informa-tion about the location of the grey matter into the ap-proximate shape of the patient’s brain. The regionof white matter was segmented after segmenting thecortex and deep grey matter structures. The cortexwas identified using a 3D region growing algorithmconstrained by anatomical, intensity gradient and tis-sue class parameters. White matter and white mat-ter lesions were then segmented without interferencefrom grey matter using a two class minimum distanceclassifier.
Analysis of double echo spin echo MRI scans ofsixteen patients with clinically determined multiplesclerosis (MS) was carried out. The segmentation ofthe cortex and deep grey matter structures providesanatomical context. This was found to improve thesegmentation of MS lesions by allowing correct clas-sification of the white matter region despite the over-lapping tissue class distributions of grey matter andMS lesion.
1 Introduction
The segmentation of MRI scans of patients with white matterlesions is difficult because the MRI characteristics of whitematter lesions (WML) are similar to those of grey matter. In-tensity based statistical classification techniques misclassifysome WML as grey matter and some grey matter as WML.
We developed a technique to identify a mask of the whitematter region of the brain. White matter and white matterlesions were then segmented without interference from greymatter.
The use of MRI for monitoring of treatment trials in MShas been analyzed.9 The characterization of MS requireslong term serial studies (typically 1-2 years) because of therelatively slow progression of the disease. MRI scans withthin contiguous slices are desirable, with scanning repeatedat intervals of 1-3 months. Quantitative assessment of the ap-pearance of high intensity regions in MRI scans is importantto evaluate the disease activity and progression.12 Manualanalysis of this volume of data is expensive and tedious. Theintra- and inter-rater reliability of semi-automatic methodsof analysis range from 5-20%.9 The requirements to reducehuman interaction (in order to improve reproducibility and toderive a measure of lesion burden that is independent of theoperator) and to improve the accuracy of lesion load mea-surements were identified as important goals for any newsegmentation methods in a recent review.4 However, auto-matic segmentation is difficult because of the similarity ofthe pixel intensity of MS lesions and grey matter.
Attempts have been made to deal with the overlappingintensity range of normal grey matter and lesion tissue. Oneapproach used a model involving a spatially varying priorprobability density for brain tissue class.7 The search forMS lesions was confined to those regions with at least a 50%prior probability of being white matter. In this way, the in-correct classification of grey matter as MS lesion was greatlyreduced. This model compensates for the tissue class inten-sity overlap by using a probabilistic model of the location ofMS lesions. Our method segments the white matter regionfrom each scan, rather than using a probabilistic model for
�[email protected]. Journal Image Guided Surgery, Vol. 1, Num. 6, pp.326–338, 1995,
and at http://journals.wiley.com/cas/v1n6/95042-intro.htmlVision Systems, Neckargemuend, Germany, [email protected] (German Cancer Research Center) D-69120 Heidelberg Germany, [email protected]�Harvard Medical School and Brigham and Women’s Hospital, Department of Radiology, 75 Francis St., Boston, MA 02115,
[email protected]�Harvard Medical School and Brigham and Women’s Hospital, Department of Radiology, 75 Francis St., Boston, MA 02115, [email protected] AI Lab NE43-771, Massachusetts Institute of Technology, 545 Technology Square, Cambridge MA 02139, [email protected]���UCLA School of Medicine, Department of Radiological Sciences, [email protected]�Harvard Medical School and Brigham and Women’s Hospital, Department of Radiology, 75 Francis St., Boston, MA 02115, [email protected]
all scans, and is able to correct both grey matter as MS lesionand MS lesion as grey matter classification errors.
Another approach is to use a combination of interactivemanual intervention and statistical classification.11 A trainedoperator interactively selects locations inside a lesion, andthen
�-NN classification and connected component labelling
are used to segment the lesion. This process is repeated untilthe operator is satisfied with the segmentation of the lesion.The analysis procedure is repeated for each lesion to be seg-mented. Incorrect classification caused by overlapping pixelintensities is avoided by having the operator interactivelycorrect the classification. The operator uses knowledge ofnormal brain anatomy in order to differentiate between MSlesion and other brain tissue.
One approach to incorporating knowledge of normalbrain anatomy automatically is to regard the segmentationof the brain as a registration problem. An atlas containing adescription of normal brain anatomy is registered to a patientdata set using a rigid transformation. Local shape differencebetween the patient and the atlas are then resolved using lo-cal elastic deformations. This technique has been used toachieve robust segmentation of sub-structures of the brain.1
Patient data sets were registered to an average brain volume,and a polyhedral model of important brain structures used toidentify anatomical structures.
Elastic matching algorithms are not able to segmentstructures in the patient that are not present in the atlas,such as white matter lesions. Unlike some brain tumours,MS lesions do not cause significant distortion of a patient’sanatomy. Elastic matching may be unable to compensate forthe distortion caused by a tumour, because the difference be-tween the atlas and patient brain structure shape is not welldescribed by an elastic deformation. The normal anatomi-cal variability of the cortex is also not well described by anelastic deformation.
We have developed a segmentation method that uses thepositive features of both statistical classification and elas-tic matching methods to overcome the limitations presentwhen the techniques are used alone. Our method is a generalmethod which uses anatomical information to disambiguatethe segmentation when class distributions overlap in featurespace. This approach is well suited to the segmentation ofMRI scans of MS patients because of the substantial degreeof overlap of the MS lesion class with other tissue classes(particularly grey matter). It is a new automatic method thatproduces a segmentation that is superior to that possible witheither elastic matching or statistical classification alone.
The principal results of this study are an algorithm forthe automatic segmentation of the cortex, a method for theautomatic identification of the region of white matter and amethod for the segmentation of WML. This method has beenapplied to MRI scans of sixteen patients with clinically de-termined MS and to scans with simulated lesions. Togetherthese indicate that the method accounts for the ambiguitydue to the overlapping intensity distributions of grey matterand WML, and consequently improves the segmentation ofthese tissue classes.
2 Description of Method
Motivation
A major difficulty for accurate segmentation of WML is theoverlapping intensity distributions of WML and grey mat-ter. Some regions of lesion cannot be distinguished fromgrey matter and vice versa even when powerful nonpara-metric multispectral statistical classification techniques areused. Some lesions have intensity characteristics entirely inthe range of that of grey matter, with no voxel having anunambiguous lesion intensity. They can be recognized aslesion by an experienced observer as they appear in the re-gion of the white matter where no grey matter is expected.The segmentation must be done in 3D since 2D slices canshow small blobs of cortex which appear to be white mat-ter lesions. In a slice these appear isolated, but examinationof neighbouring slices shows that they are connected to thecortical mantle.
The same problem manifests itself in another form. Thetypical slice thickness used in MS studies with double echospin echo MRI gives rise to significant partial volume ar-tifacts. The relatively low spatial resolution of these scansgives rise to boundaries between different tissue types thatare difficult to distinguish. This occurs particularly at theedge of the brain, where cerebrospinal fluid (CSF) and greymatter are averaged together. This sometimes causes voxelsto have a pixel intensity range typical of MS lesion. Any in-tensity based statistical classifier will misclassify such vox-els as MS lesion.
If it is assumed that MS lesions always occur withinwhite matter then we can differentiate between MS lesionsin white matter and other voxels with pixel intensities similarto MS lesions using our new segmentation algorithm.
Segmentation Algorithm Overview
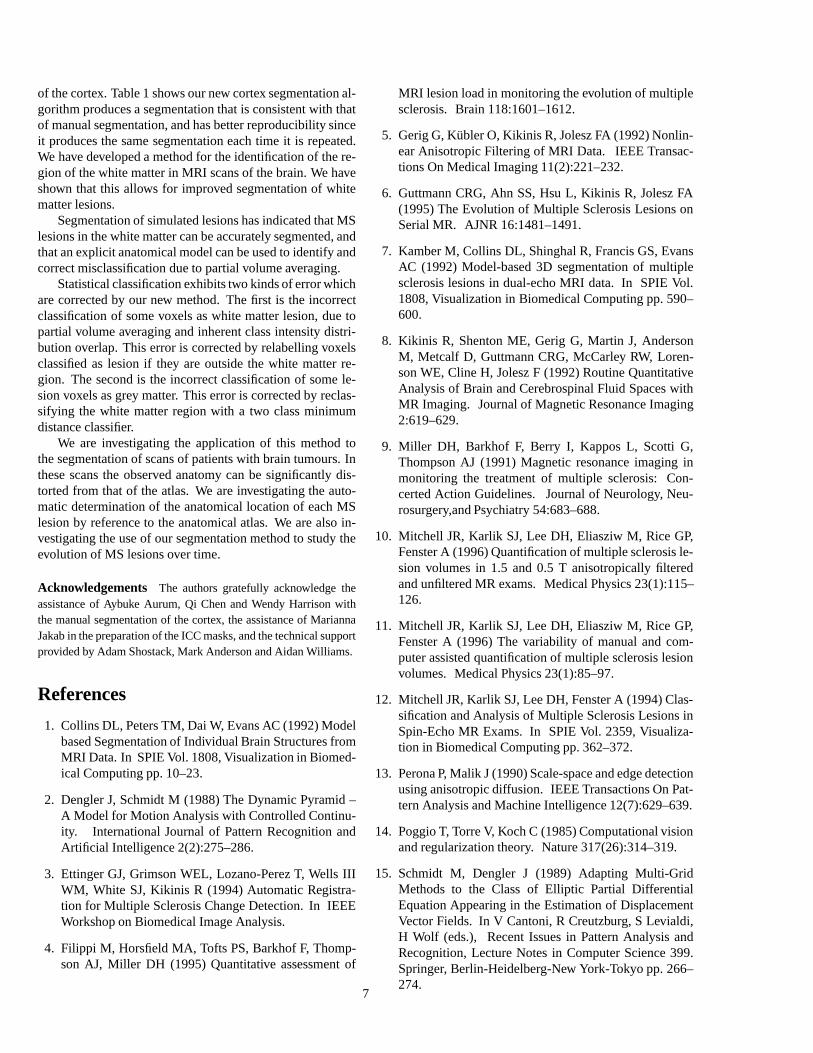
The segmentation algorithm is represented schematically inFigure 1. The primary input to the segmentation process isa double echo spin echo MRI scan of a patient. The MRIscan is smoothed to improve SNR and the intracranial cav-ity is segmented. Classification and intensity inhomogeneitycorrection is carried out with the Expectation-Maximizationalgorithm. Our atlas is first aligned to the patient scan witha six parameter (three translation and three rotation) lineartransformation, and then local shape differences are resolvedwith our elastic matching algorithm. The deep grey matterstructures are segmented directly by elastic matching. How-ever, the normal anatomical variability of the grey matter ofthe neocortex is not well described by an elastic deformation.Consequently, a new 3D constrained region growing algo-rithm was developed in order to segment the cortex. Afterthe grey matter structures have been segmented using thesealgorithms, the white matter region is segmented and reclas-sified into white matter and WML classes. This process re-
2
solves the ambiguity caused by the overlapping intensity dis-tributions of the grey matter and WML classes.
Contrast Preserving Noise Smoothing
Edge preserving noise smoothing is carried out on the scanby iteratively solving the nonlinear diffusion equation������������� �� ���where
�is the vector-valued MRI scan,
�is time (iteration
number), �� �������� ������ �"! is the spatially varying conduc-
tance function and # is the noise strength parameter.5 Sincethe in-plane resolution of our scans (0.9375mm) is muchsmaller than the thickness of the slices (3mm), the conduc-tance across the slices of the scans is negligible. It has beenshown that the use of nonlinear diffusion filtering reduces thevariability of operator-guided segmentation of MS lesionsacquired with 1.5 T MRI exams.10
Intracranial Cavity Segmentation
The intracranial cavity (ICC) is segmented using a semi-automatic method.8 A parzen window classifier is used tosegment the volume into brain and non-brain classes. Somematerial outside the ICC is still classified as brain, so 3D ero-sion followed by supervised connectivity analysis and 3D di-lation is performed. The resulting binary data set representsthe region of the intracranial cavity. This is the only pro-cessing step that requires manual interaction for each patientvolume. The interrater reliability has been assessed and thestandard deviation of the area of the ICC segmentation wasfound to be 0.5%.8 The ICC mask is used for the calculationof the linear registration and to exclude material external tothe brain from the later processing steps.
Classification and Intensity Inhomogeneity Correction
Intensity-based statistical classification and intensity in-homogeneity correction are calculated simultaneously us-ing the Expectation-Maximization (EM) segmentation algo-rithm.17 The EM segmenter generates two data sets for eachpatient data set. These are the statistical classification ofeach voxel and the value of the DE SE MRI after correc-tion for the intensity inhomogeneity. Automatic correctionof intensity inhomogeneity in this way makes the segmenta-tion robust against minor changes in MR operating charac-teristics as well as correcting for the inherent intensity inho-mogeneity (shading artifact). Consequently, it is possible tocarry out supervised classification on one patient scan andto use the same statistical model for the distribution of tis-sue classes to segment other scans of the same acquisitiontype. There is no need to retrain the classifier. This algorithmis run fully automatically, without any user intervention, oneach noise smoothed patient scan.
The algorithm proceeds by iteratively estimating the tis-sue class and intensity inhomogeneity at each voxel, until
both estimates have converged. The intensity inhomogene-ity is modelled as an additive bias field in a log-transformeddata set and is estimated by solving$%'&)( ��*,+.-/ �where
$%is a vector representing the bias field,
(is a low
pass filter, * is a vector of the observed tissue intensities(image pixel values), /0�1�324�� � �65 24�7 68 �65�9"9�9:� is a vector ofthe mean intensity of each tissue class, <; represents tissueclass k and - is a matrix of a posteriori tissue class proba-bilities (weights used to predict the signal intensity).
The distribution of observed pixel values for a singlechannel data set is modelled by= �7*�>@? AB> 5 % > � �DCFEG�7*�>G+H24��AB> � + % > �where C E ��I � is a zero mean Gaussian distribution with vari-ance J 8 , and the tissue probability (weight) matrix - >:K canbe estimated by
- >LK & MN�7 OK � = ��*�>P? OK 5 $% > �QSR�T MN��A > � = ��* > ? A > 5 $% > �where MN�� K � is the a priori probability of tissue class K .Voxel U is classified by selecting the class for which - >LK islargest.
Linear Registration
A linear transformation (with three translation and three ro-tation parameters) is computed in order to align the ICC ofthe atlas with that of the patient. The goal of the linear reg-istration is to compute a global alignment of the atlas andpatient data sets so that the elastic matching algorithm thatfollows can successfully deform the atlas to account for localshape differences. The linear transformation is computed byminimizing the distance between the surfaces of the ICCs.
The voxels at the surface of the ICC for the atlas andpatient are segmented. For each slice, the largest connectedcomponent of the background is found and the voxels of theICC adjacent to this are identified as the surface voxels. Thelinear transformation V is found by using Powell’s methodto minimize W > XZY\[
]_^ 8`baPc 5 XZY\[K ? V�d >�+ = K�? ewhere d > are the atlas surface voxels, = K are the patient sur-face voxels and
^ `baPcis a maximum distance threshold to
limit the contribution any single voxel can make. The RMSerror in the match obtained with this method is of the orderof the voxel size.3
3

Elastic Matching
A 3D volumetric reference data set (atlas) is matched to theanatomy of the patient in order to provide a segmentation ofthe normal anatomy. Our anatomical atlas was constructedby a combination of statistical classification and manual la-belling of every voxel in a 3D SPGR MRI scan of a nor-mal volunteer. It consists of both a grey scale data set anda labelled data set.16 The purpose of the atlas is to describenormal brain anatomy for a specific person in such a waythat the atlas labels can be transferred to another person’sanatomy, without the need to repeat the arduous and time-consuming hand labelling that was required to construct theatlas. We have developed a fast and effective elastic match-ing algorithm by which the atlas labels can be transferredautomatically to another data set.2
The nonlinear transformation relating the atlas anatomyto the patient anatomy is modelled as a 3D deformationfield. Estimation of the local displacement vector / �� � 5���5�� ��� � /N�3I 5���5���� can be formulated as a standardregularization problem.14 The deformation is determined byminimizing
� � / � � MN� / ���� �� � / � ^ I ^ � ^ �This functional describes a balance between the deforma-tion energy
� � / � and local similarity of the images MN� / �as a function of the deformation. The local similarity MN� / �is determined by binary correlation of the atlas and patientsegmented data sets over a small neighbourhood. The defor-mation energy term
� � / � is based on a physical model of a3D elastic membrane, and is independent of the data. This is
� � / � � � 8c � � 8� � � 8� ��� 8c ��� 8� ��� 8� ��� 8c ��� 8� ��� 8�Applying a finite element discretization leads to linear
Euler-Lagrange equations corresponding to the functional.This system of equations can be efficiently solved using anested multigrid algorithm with conjugate gradient relax-ation.15
The deformation field is calculated in two stages. Ini-tially it is assumed to be flat. / is estimated on the basis ofthe brain parenchyma (grey matter and white matter and forthe purpose of matching, WML is treated as white matter).This is done by solving for / using binary data sets corre-sponding to the brain parenchyma from the atlas labels andfrom the classified patient data set. The deformation fieldobtained is then used as the initial deformation and the es-timate is refined by repeating the matching procedure usingbinary data sets corresponding to only white matter.
Brain structures that have a regular and consistent shapeacross many people, such as the deep grey matter structuresof the diencephalon and telencephalon, and the cerebellumare directly segmented. Some deep grey matter structures(particularly the globus pallidus) can have an intensity char-acteristic similar to that of white matter, and so are mis-classified by intensity based statistical classification. Elastic
matching provides robust and accurate localization of thesestructures.
However, the variation of the shape of the cortex betweendifferent people is not well described by an elastic deforma-tion. The atlas represents the anatomy of one normal vol-unteer. The normal anatomical variability of the cortex canmean that a patient has a gyrus where the atlas has none, orvice versa. When elastic matching is carried out, the regionof the cortex is recovered, but precise localization of the bor-ders of the cortex is not achieved.
Segmentation of the Cortex
Segmentation of the cortex has not been achieved using ei-ther statistical classification or elastic matching techniquesalone. Statistical classification is able to identify the greymatter that makes up the cortex, but not to differentiate be-tween the cortex and other grey matter structures. Elasticmatching provides an estimate of the region of the cortex,but not a precise localization of the boundary of the cortex.
We have developed a new algorithm for segmentation ofthe cortex with a constrained 3D region growing algorithm.The algorithm uses the anatomical information provided inthe atlas, tissue class information from statistical classifica-tion, the data intensity gradient and a simple model of thestructure of the cortex.
Model of the cortex
We assume that the cortex has the form of a thick “blanket”crumpled over itself. One edge of the cortex, the outer edge,is adjacent to CSF. There exists a path joining every pair ofvoxels in the cortex that passes only through voxels of thecortex. Therefore, it is possible for a region growing algo-rithm to segment the cortex. It is necessary to consider thestructure of the cortex in 3D, since in 2D slices parts of thecortex may appear to be disconnected from other parts.
Selection of cortex seed voxels
The region growing algorithm is started from seed locationsautomatically identified at the outer edge of the cortex. Theregion outside the ICC is masked out of the classified MRIdata set and CSF is removed by relabelling it as background.At the outer boundary of the cortex there is often a layer ofmisclassified voxels, caused by partial volume averaging ofthe brain and CSF. This is removed by performing erosionon each slice of the classified data set with a 3x3 circularstructuring element. Voxels on the outer surface of the brainare identified with the same algorithm that is used to identifythe surface of the ICC for linear registration. The atlas labelsare used to identify and eliminate voxels that are outside theregion of the cortex. The location of each voxel identified isthen used as a seed location for the region growing.
4
Anatomical constraint
The elastic match of the atlas to the cortex provides a goodestimate of the region of the cortex but doesn’t accuratelylocalize the borders of the cortex. A region that includesthe borders of the cortex is generated by 3D dilation of thematched cortex. This new region forms a mask that is usedto restrict the range over which region growing is carried out.The mask represents an estimate of the maximum error thatis possible in the elastic match of the cortex.
The deep grey matter structures and the cerebellum, asdetermined by the elastic match, are masked out so that thesestructures can’t be incorrectly included in the cortex region.
Tissue intensity constraint
The cortex is a structure of grey matter. Only voxels withthe pixel intensity range of grey matter, as determined withthe EM segmentation algorithm, are considered. Partial vol-ume averaging artifacts are corrected by relabelling after thecortex is segmented.
Tissue gradient constraint
White matter lesions can appear as a bright centre regionwith a dimmer “halo” surrounding it and also as a bright rimsurrounding a darker centre.6 This implies that there is a sig-nificant rate of change of intensity as we move out from thecentre of a lesion. A high rate of change of pixel intensityis indicative of an edge in the image. An edge is found bylocating local maxima of the gradient after smoothing withnonlinear diffusion.13 The region growing process is not al-lowed to cross an edge. This constraint is implemented byconstructing a binary volume in which voxels are set if anedge is indicated, and are not set in the absence of an edge.This constraint is used so that the region will not be able togrow from the cortex region to voxels around a lesion if thereis an intensity gradient present.
Cortex Segmentation Region Growing Algorithm
The location of each seed voxel is placed in a queue andmarked in a binary volume representing the cortex. Regiongrowing proceeds by applying the following until the queueis empty, creating a binary volume representing the segmen-tation of the cortex.
Take location v from head of queue,For each l in the neighbourhood of v,
if (l is not marked as cortex) andif (l is in the cortex mask) andif (l has grey matter class) andif (l is not at a peak in the intensity gradient) then
mark l as cortexadd l to the queue
Segmentation of the White Matter Region
The white matter region consists of those voxels in the brainMRI scan that are healthy or diseased white matter (lesion).Some of these voxels are incorrectly classified as grey mat-ter because the pixel intensity of the white matter lesion classand the grey matter class overlap. The combination of elasticmatching and the cortex segmentation algorithm allow us tosegment the grey matter of the brain.
Partial volume averaging causes some grey matter to beincorrectly classified as white matter lesion. This error isparticularly severe in the slices at the top of the brain andaround the cerebellum. The regions at the boundary betweenthe cortex and CSF which are classified as lesion due to par-tial volume averaging are corrected by relabelling these re-gions as grey matter.
The white matter region is then segmented. The whitematter region is the region inside the intracranial cavity, lessthose voxels identified as CSF, less those voxels segmenteddirectly by elastic matching, less those voxels identified ascortex.
Segmentation of White Matter Lesions
Some voxels in the white matter region are erroneously clas-sified as grey matter by the EM segmenter because of theoverlapping intensity range of the grey matter and the whitematter lesion classes. Voxels in this region should be clas-sified only as white matter or as white matter lesion. Eachvoxel in the region is reclassified as either white matter or aswhite matter lesion using a two class two channel minimumdistance classifier.
3 Results
Double echo spin echo MRI scans of sixteen patientswith clinically determined multiple sclerosis were acquiredon a GE Signa 1.5T clinical scanner with TR/TE � /TE 83000/30/80 ms, FOV 24cm and contiguous 3mm thick ax-ial slices covering the entire brain.
The segmentation process was applied to each MRI scan.The segmented data sets were then analysed to assess theconsistency and accuracy of the segmentation of the cortexand MS lesions.
The EM segmentation algorithm and rigid registrationeach required about one hour to execute on each scan, run-ning on a Sun SPARCstation 20/612. The 3D elastic defor-mation was calculated on an IBM RS/6000 workstation. Thecalculation required about 7 minutes to project the 3D volu-metric atlas data set onto a MS patient data set. The accuracyof the match was improved by iterating the elastic match pro-cedure 5 times. The cortex and lesion segmentation requiredabout 30 minutes per scan on a Sun SPARCstation 20/612.The segmentation of a typical data set required about 3 hoursoverall.
To assess the effectiveness of our cortex segmentationalgorithm, we compared the segmentation with the segmen-
5
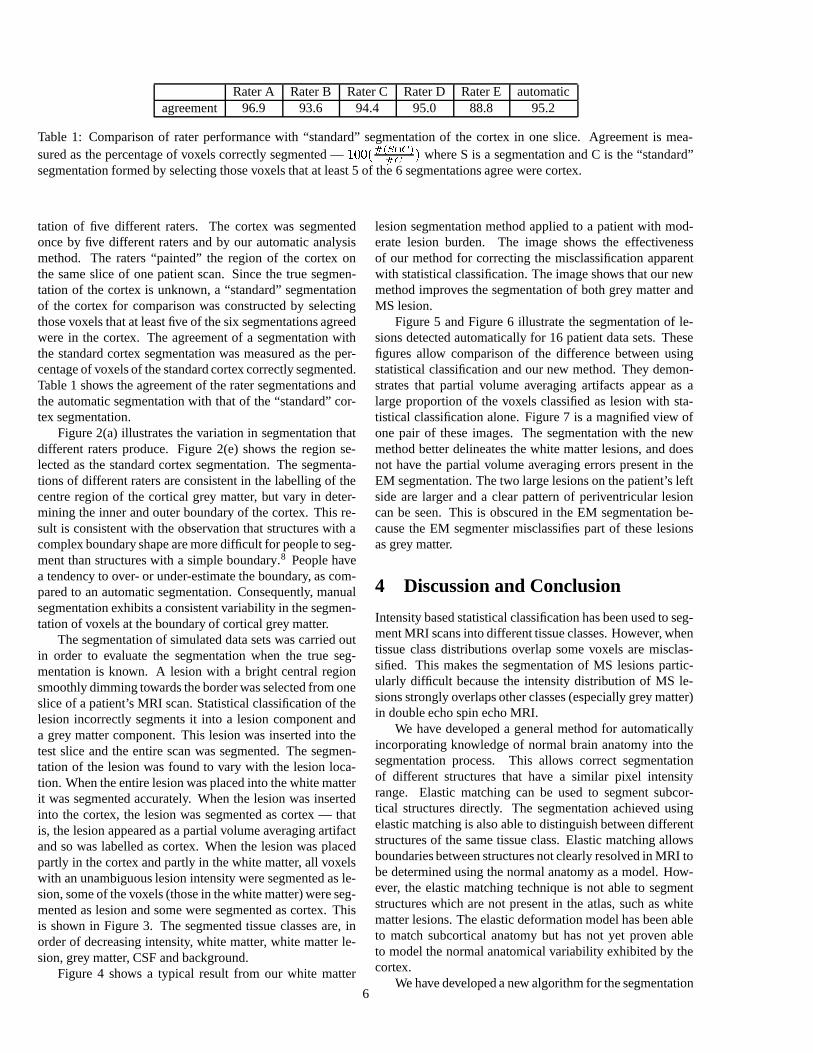
Rater A Rater B Rater C Rater D Rater E automaticagreement 96.9 93.6 94.4 95.0 88.8 95.2
Table 1: Comparison of rater performance with “standard” segmentation of the cortex in one slice. Agreement is mea-sured as the percentage of voxels correctly segmented —
����� � �������� ����
where S is a segmentation and C is the “standard”segmentation formed by selecting those voxels that at least 5 of the 6 segmentations agree were cortex.
tation of five different raters. The cortex was segmentedonce by five different raters and by our automatic analysismethod. The raters “painted” the region of the cortex onthe same slice of one patient scan. Since the true segmen-tation of the cortex is unknown, a “standard” segmentationof the cortex for comparison was constructed by selectingthose voxels that at least five of the six segmentations agreedwere in the cortex. The agreement of a segmentation withthe standard cortex segmentation was measured as the per-centage of voxels of the standard cortex correctly segmented.Table 1 shows the agreement of the rater segmentations andthe automatic segmentation with that of the “standard” cor-tex segmentation.
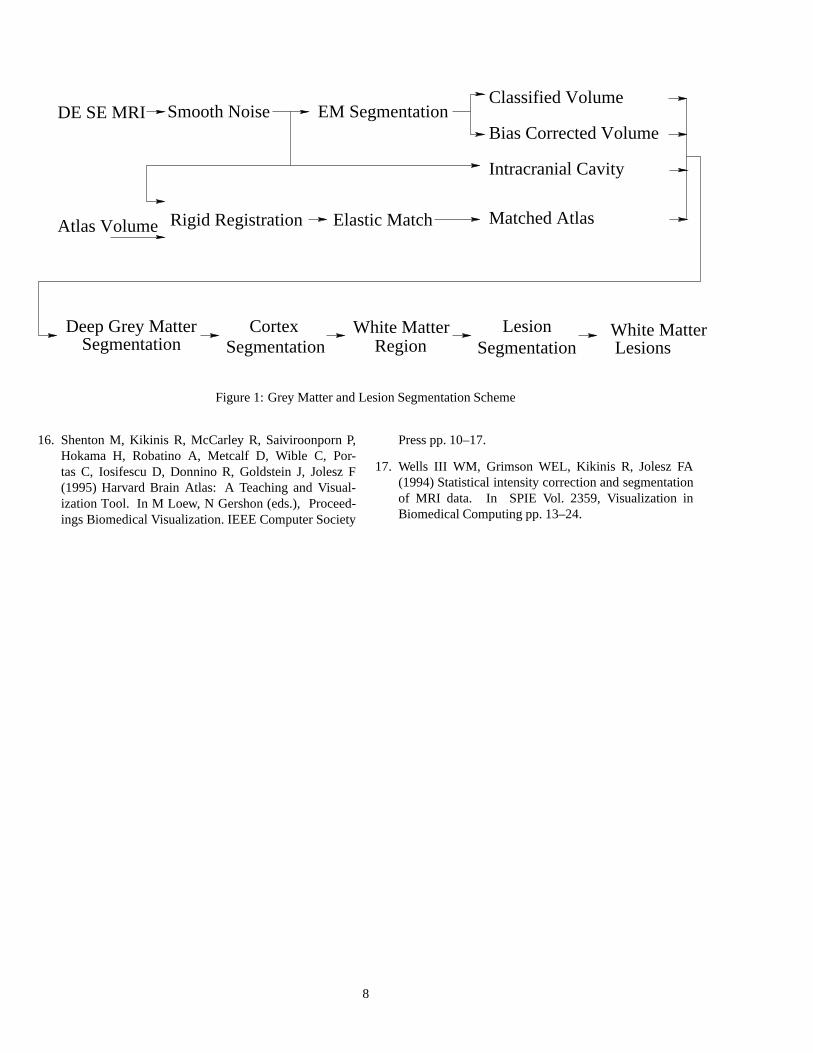
Figure 2(a) illustrates the variation in segmentation thatdifferent raters produce. Figure 2(e) shows the region se-lected as the standard cortex segmentation. The segmenta-tions of different raters are consistent in the labelling of thecentre region of the cortical grey matter, but vary in deter-mining the inner and outer boundary of the cortex. This re-sult is consistent with the observation that structures with acomplex boundary shape are more difficult for people to seg-ment than structures with a simple boundary.8 People havea tendency to over- or under-estimate the boundary, as com-pared to an automatic segmentation. Consequently, manualsegmentation exhibits a consistent variability in the segmen-tation of voxels at the boundary of cortical grey matter.
The segmentation of simulated data sets was carried outin order to evaluate the segmentation when the true seg-mentation is known. A lesion with a bright central regionsmoothly dimming towards the border was selected from oneslice of a patient’s MRI scan. Statistical classification of thelesion incorrectly segments it into a lesion component anda grey matter component. This lesion was inserted into thetest slice and the entire scan was segmented. The segmen-tation of the lesion was found to vary with the lesion loca-tion. When the entire lesion was placed into the white matterit was segmented accurately. When the lesion was insertedinto the cortex, the lesion was segmented as cortex — thatis, the lesion appeared as a partial volume averaging artifactand so was labelled as cortex. When the lesion was placedpartly in the cortex and partly in the white matter, all voxelswith an unambiguous lesion intensity were segmented as le-sion, some of the voxels (those in the white matter) were seg-mented as lesion and some were segmented as cortex. Thisis shown in Figure 3. The segmented tissue classes are, inorder of decreasing intensity, white matter, white matter le-sion, grey matter, CSF and background.
Figure 4 shows a typical result from our white matter
lesion segmentation method applied to a patient with mod-erate lesion burden. The image shows the effectivenessof our method for correcting the misclassification apparentwith statistical classification. The image shows that our newmethod improves the segmentation of both grey matter andMS lesion.
Figure 5 and Figure 6 illustrate the segmentation of le-sions detected automatically for 16 patient data sets. Thesefigures allow comparison of the difference between usingstatistical classification and our new method. They demon-strates that partial volume averaging artifacts appear as alarge proportion of the voxels classified as lesion with sta-tistical classification alone. Figure 7 is a magnified view ofone pair of these images. The segmentation with the newmethod better delineates the white matter lesions, and doesnot have the partial volume averaging errors present in theEM segmentation. The two large lesions on the patient’s leftside are larger and a clear pattern of periventricular lesioncan be seen. This is obscured in the EM segmentation be-cause the EM segmenter misclassifies part of these lesionsas grey matter.
4 Discussion and Conclusion
Intensity based statistical classification has been used to seg-ment MRI scans into different tissue classes. However, whentissue class distributions overlap some voxels are misclas-sified. This makes the segmentation of MS lesions partic-ularly difficult because the intensity distribution of MS le-sions strongly overlaps other classes (especially grey matter)in double echo spin echo MRI.
We have developed a general method for automaticallyincorporating knowledge of normal brain anatomy into thesegmentation process. This allows correct segmentationof different structures that have a similar pixel intensityrange. Elastic matching can be used to segment subcor-tical structures directly. The segmentation achieved usingelastic matching is also able to distinguish between differentstructures of the same tissue class. Elastic matching allowsboundaries between structures not clearly resolved in MRI tobe determined using the normal anatomy as a model. How-ever, the elastic matching technique is not able to segmentstructures which are not present in the atlas, such as whitematter lesions. The elastic deformation model has been ableto match subcortical anatomy but has not yet proven ableto model the normal anatomical variability exhibited by thecortex.
We have developed a new algorithm for the segmentation6
of the cortex. Table 1 shows our new cortex segmentation al-gorithm produces a segmentation that is consistent with thatof manual segmentation, and has better reproducibility sinceit produces the same segmentation each time it is repeated.We have developed a method for the identification of the re-gion of the white matter in MRI scans of the brain. We haveshown that this allows for improved segmentation of whitematter lesions.
Segmentation of simulated lesions has indicated that MSlesions in the white matter can be accurately segmented, andthat an explicit anatomical model can be used to identify andcorrect misclassification due to partial volume averaging.
Statistical classification exhibits two kinds of error whichare corrected by our new method. The first is the incorrectclassification of some voxels as white matter lesion, due topartial volume averaging and inherent class intensity distri-bution overlap. This error is corrected by relabelling voxelsclassified as lesion if they are outside the white matter re-gion. The second is the incorrect classification of some le-sion voxels as grey matter. This error is corrected by reclas-sifying the white matter region with a two class minimumdistance classifier.
We are investigating the application of this method tothe segmentation of scans of patients with brain tumours. Inthese scans the observed anatomy can be significantly dis-torted from that of the atlas. We are investigating the auto-matic determination of the anatomical location of each MSlesion by reference to the anatomical atlas. We are also in-vestigating the use of our segmentation method to study theevolution of MS lesions over time.
Acknowledgements The authors gratefully acknowledge theassistance of Aybuke Aurum, Qi Chen and Wendy Harrison withthe manual segmentation of the cortex, the assistance of MariannaJakab in the preparation of the ICC masks, and the technical supportprovided by Adam Shostack, Mark Anderson and Aidan Williams.
References
1. Collins DL, Peters TM, Dai W, Evans AC (1992) Modelbased Segmentation of Individual Brain Structures fromMRI Data. In SPIE Vol. 1808, Visualization in Biomed-ical Computing pp. 10–23.
2. Dengler J, Schmidt M (1988) The Dynamic Pyramid –A Model for Motion Analysis with Controlled Continu-ity. International Journal of Pattern Recognition andArtificial Intelligence 2(2):275–286.
3. Ettinger GJ, Grimson WEL, Lozano-Perez T, Wells IIIWM, White SJ, Kikinis R (1994) Automatic Registra-tion for Multiple Sclerosis Change Detection. In IEEEWorkshop on Biomedical Image Analysis.
4. Filippi M, Horsfield MA, Tofts PS, Barkhof F, Thomp-son AJ, Miller DH (1995) Quantitative assessment of
MRI lesion load in monitoring the evolution of multiplesclerosis. Brain 118:1601–1612.
5. Gerig G, Kubler O, Kikinis R, Jolesz FA (1992) Nonlin-ear Anisotropic Filtering of MRI Data. IEEE Transac-tions On Medical Imaging 11(2):221–232.
6. Guttmann CRG, Ahn SS, Hsu L, Kikinis R, Jolesz FA(1995) The Evolution of Multiple Sclerosis Lesions onSerial MR. AJNR 16:1481–1491.
7. Kamber M, Collins DL, Shinghal R, Francis GS, EvansAC (1992) Model-based 3D segmentation of multiplesclerosis lesions in dual-echo MRI data. In SPIE Vol.1808, Visualization in Biomedical Computing pp. 590–600.
8. Kikinis R, Shenton ME, Gerig G, Martin J, AndersonM, Metcalf D, Guttmann CRG, McCarley RW, Loren-son WE, Cline H, Jolesz F (1992) Routine QuantitativeAnalysis of Brain and Cerebrospinal Fluid Spaces withMR Imaging. Journal of Magnetic Resonance Imaging2:619–629.
9. Miller DH, Barkhof F, Berry I, Kappos L, Scotti G,Thompson AJ (1991) Magnetic resonance imaging inmonitoring the treatment of multiple sclerosis: Con-certed Action Guidelines. Journal of Neurology, Neu-rosurgery,and Psychiatry 54:683–688.
10. Mitchell JR, Karlik SJ, Lee DH, Eliasziw M, Rice GP,Fenster A (1996) Quantification of multiple sclerosis le-sion volumes in 1.5 and 0.5 T anisotropically filteredand unfiltered MR exams. Medical Physics 23(1):115–126.
11. Mitchell JR, Karlik SJ, Lee DH, Eliasziw M, Rice GP,Fenster A (1996) The variability of manual and com-puter assisted quantification of multiple sclerosis lesionvolumes. Medical Physics 23(1):85–97.
12. Mitchell JR, Karlik SJ, Lee DH, Fenster A (1994) Clas-sification and Analysis of Multiple Sclerosis Lesions inSpin-Echo MR Exams. In SPIE Vol. 2359, Visualiza-tion in Biomedical Computing pp. 362–372.
13. Perona P, Malik J (1990) Scale-space and edge detectionusing anisotropic diffusion. IEEE Transactions On Pat-tern Analysis and Machine Intelligence 12(7):629–639.
14. Poggio T, Torre V, Koch C (1985) Computational visionand regularization theory. Nature 317(26):314–319.
15. Schmidt M, Dengler J (1989) Adapting Multi-GridMethods to the Class of Elliptic Partial DifferentialEquation Appearing in the Estimation of DisplacementVector Fields. In V Cantoni, R Creutzburg, S Levialdi,H Wolf (eds.), Recent Issues in Pattern Analysis andRecognition, Lecture Notes in Computer Science 399.Springer, Berlin-Heidelberg-New York-Tokyo pp. 266–274.
7
LesionSegmentation
Bias Corrected Volume
Classified VolumeEM Segmentation
Elastic Match
DE SE MRI
Atlas Volume
Intracranial Cavity
SegmentationDeep Grey Matter Cortex
SegmentationWhite Matter
RegionWhite MatterLesions
Smooth Noise
Rigid Registration Matched Atlas
Figure 1: Grey Matter and Lesion Segmentation Scheme
16. Shenton M, Kikinis R, McCarley R, Saiviroonporn P,Hokama H, Robatino A, Metcalf D, Wible C, Por-tas C, Iosifescu D, Donnino R, Goldstein J, Jolesz F(1995) Harvard Brain Atlas: A Teaching and Visual-ization Tool. In M Loew, N Gershon (eds.), Proceed-ings Biomedical Visualization. IEEE Computer Society
Press pp. 10–17.
17. Wells III WM, Grimson WEL, Kikinis R, Jolesz FA(1994) Statistical intensity correction and segmentationof MRI data. In SPIE Vol. 2359, Visualization inBiomedical Computing pp. 13–24.
8
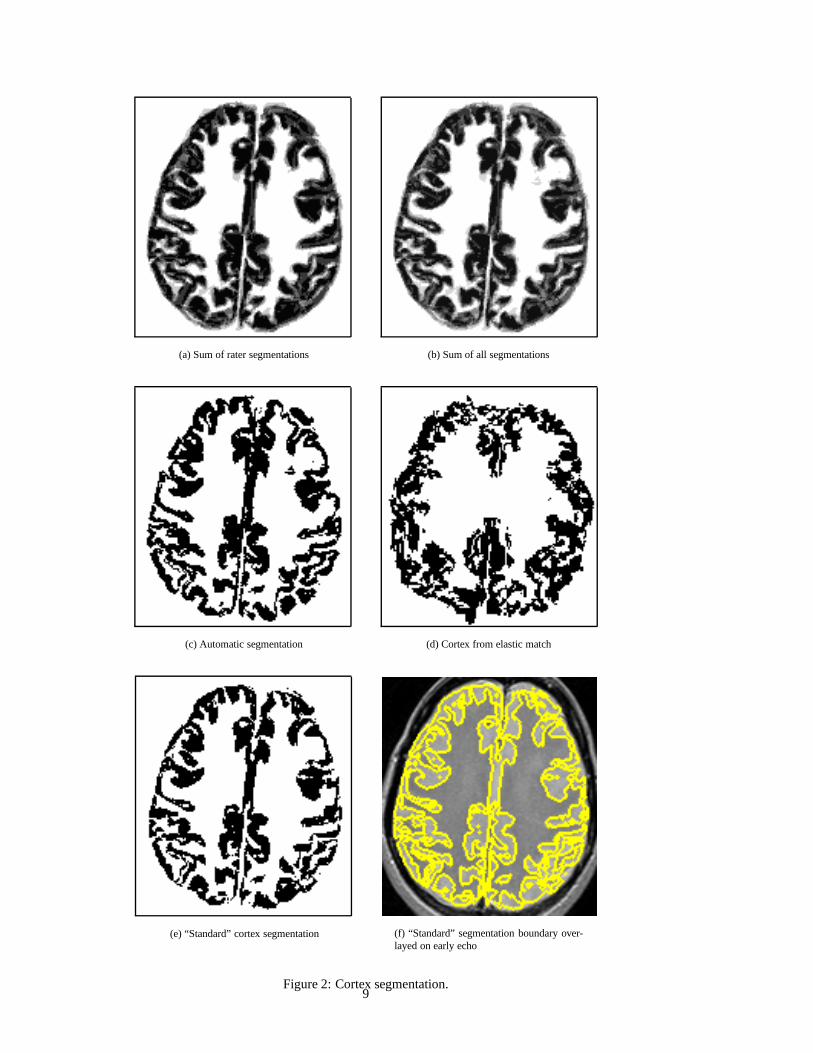
(a) Sum of rater segmentations (b) Sum of all segmentations
(c) Automatic segmentation (d) Cortex from elastic match
(e) “Standard” cortex segmentation (f) “Standard” segmentation boundary over-layed on early echo
Figure 2: Cortex segmentation.9
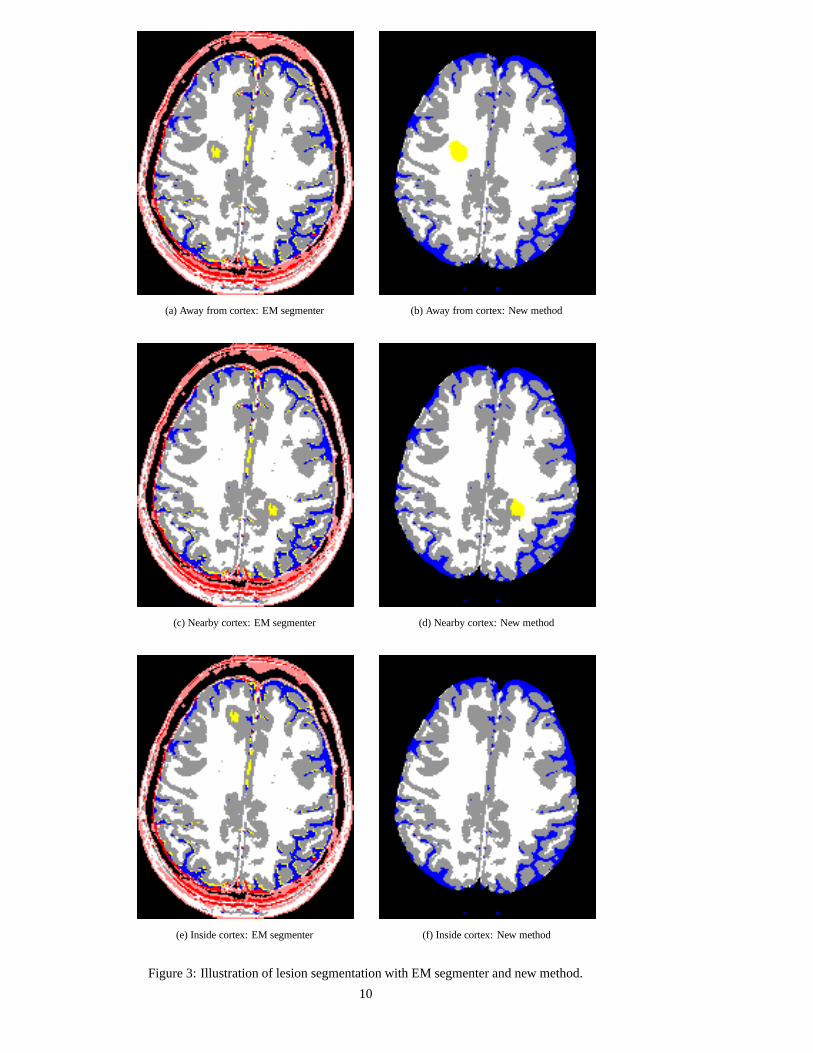
(a) Away from cortex: EM segmenter (b) Away from cortex: New method
(c) Nearby cortex: EM segmenter (d) Nearby cortex: New method
(e) Inside cortex: EM segmenter (f) Inside cortex: New method
Figure 3: Illustration of lesion segmentation with EM segmenter and new method.
10

(a) Early echo (b) Late echo
(c) EM segmenter (d) New method
Figure 4: Segmentation of white matter, grey matter and white matter lesion: The top row shows the early and late echoimages, the bottom row shows the segmentation with statistical classification and with our new algorithm.
11

Figure 5: Visualization of segmentation of lesions using the new algorithm (columns 1,3) and the EM segmenter (columns2,4).
12

Figure 6: Visualization of segmentation of lesions using the new algorithm (columns 1,3) and the EM segmenter (columns2,4).
13

(a) New Method (b) EM segmenter
Figure 7: Magnified view of images three and four from row one of figure six, showing the segmentation of WML with thenew method and the EM segmenter.
14