Embed Size (px)
Citation preview

National Conference on Research Advances in Communication, Computation, Electrical Science and Structures (NCRACCESS-2015)
ISSN: 2348 – 8549 www.internationaljournalssrg.org Page 106
AUTOMATIC LPG REFILLING SYSTEM Vaishnavi1, Selvi.D2
[1] Head of the Department, [2] PG Scholar, Department of Electronics and Communication Engineering Bharathiyar Institute of Engineering for Women
ABSTARCT -Booking for a LPG Cylinder Refill and getting it delivered in time is getting easier. The new system is an Indian Oil initiative to introduce simpler ways for customers to book for their Indane gas LPG refill. The system is provided and maintained by Cellular Ltd. SMS (Short Message Service): This too is a 24 x 7 facility where Indane customers can send an SMS from their mobile phone to register for the service and subsequently book for refills. • If the customer is
using SMS facility for the first time, then SMS IOC < STD Code + Distributor's T e l . N u m b e r ><Consumer Number> to the unique Idea number for your city. For example, in case the distributor's telephone number in Delhi is 26024289 and consumer number is QX00827C, SMS shall be sent as follows: IOC 01126024289 QX00287C. For subsequent bookings, send SMS IOC to the same number. With a view to provide better services to the customers and to reduce the scope for irregularities, we have introduced the facility of refill booking through Short Messaging Service (SMS).and also if an gas leakage is detected automatically main supply will OFF in order to avoid fire accident.
I. INTRODUCTION
One of the biggest areas of concern for LPG customers is registering their requests for refill cylinders with the distributors. While analyzing the data on the complaints being received by the oil marketing companies (OMCs), it has been observed that a major chunk of them pertain to refill booking and non-receipt of acknowledgement for bookings made. To effectively address this issue, it was required to have a system of registering the booking for new refills and providing a registration number as acknowledgement without any manual intervention. Traditionally, Indane customers were required to register their requests for sourcing LPG cylinder refills either through telephone or a personal visit to the distributor's premises. As the technology progressed, the sms system of refill
booking emerged as an ideal option. To be introduced. Being a shift to a computerized system, like any other similar systems implemented, some inconvenience may be faced by a marginal section of the LPG customers in the initial period. However, once implemented in full and all the customers get used to such advanced and progressive systems, the chances of errors inherent to manual systems will get eliminated, which will help in better customer service and satisfaction.
BLOCK DIAGRAM
TRANSMITTER
Fig.1(a)
RECEIVER
Fig.1(b)

National Conference on Research Advances in Communication, Computation, Electrical Science and Structures (NCRACCESS-2015)
ISSN: 2348 – 8549 www.internationaljournalssrg.org Page 107
A load cell is classified as a force transducer. This device converts force or weight into an electrical signal. The strain gage is the heart of a load cell. A strain gage is a device that changes resistance when it is stressed. The gages are developed from an ultra-thin heat-treated metallic foil and are chemically bonded to a thin dielectric layer. "Gage patches" are then mounted to the strain element with specially formulated adhesives. The precise positioning of the gage, the mounting procedure, and the materials used all have a measurable effect on overall performance of the load cell. Load cell is used to measure the weight of the gas cylinders. Gas sensors work by having some kind of electrical transducer that converts the presence of gas into a measurable signal. When micro controller will receive the signal from gas sensor ,zigbee transmitted the signal to receiver side to take necessary action. Keypad is used to enter the mobile phone numbers to send messages.LCD used to display the status of the system.
II.ATMEL 168
The high-performance, low-power Atmel 8-bit AVR RISC-based microcontroller combines 16KB ISP flash memory, 1KB SRAM, 512B EEPROM, an 8-channel/10-bit A/D converter (TQFP and QFN/MLF), and debug. WIRE for on-chip debugging. The device supports a throughput of 20 MIPS at 20 MHz and operates between 2.7-5.5 volts. By executing powerful instructions in a single clock cycle, the device achieves throughputs approaching 1 MIPS per MHz, balancing power consumption and processing speed. The AVR core combines a rich instruction set with 32 general purpose working registers. All the 32 registers are directly connected to the Arithmetic Logic Unit (ALU), allowing two independent registers to be accessed in one single instruction executed in one clock cycle. The resulting architecture is more code efficient while achieving throughputs up to ten times faster than conventional CISC microcontrollers. The Idle mode stops the CPU while allowing the SRAM, Timer/Counters, USART, 2-wire Serial Interface, SPI port, and interrupt system to continue to function.
The Power-down mode saves the register contents but freezes the Oscillator, disabling all other chip functions until the next interrupt or hardware reset. In Power-save mode, the asynchronous timer continues to run, allowing the user to maintain a timer base while the rest of the device is sleeping. The ADC Noise Reduction mode stops the CPU and all I/O modules except asynchronous timer and ADC, to minimize switching noise during ADC conversions. In Standby mode, the crystal/resonator Oscillator is running while the rest of the device is sleeping. This allows very fast start-up combined with low power consumption. Atmel offers the QTouch Library for embedding capacitive touch buttons, sliders and wheel functionality into AVR microcontrollers. The patented charge-transfer signal acquisition offers robust sensing and includes fully debounced reporting of touch keys and includes Adjacent Key Suppression technology for unambiguous detection of key events. The easy-to-use QTouch Suite tool chain allows you to explore, develop and debug your own touch applications.The device is manufactured using the Atmel high density non-volatile memory technology. The On-chip ISP Flash allows the program memory to be reprogrammed In-System through an SPI serial interface, by a conventional non-volatile memory programmer, or by an On-chip Boot program running on the AVR core. The Boot program can use any interface to download the application program in the Application Flash memory.

National Conference on Research Advances in Communication, Computation, Electrical Science and Structures (NCRACCESS-2015)
ISSN: 2348 – 8549 www.internationaljournalssrg.org Page 108
Software in the Boot Flash section will continue to run while the Application Flash section is updated, providing true Read-While-Write operation. By combining an 8-bit RISC CPU with In-System Self-Programmable Flash on amonolithic chip, the Atmel ATmega 168 is a powerful microcontroller that provides a highly flexible and cost effective solution to many embedded control applications.TheATmega 168 AVR is supported with a full suite of program and system development tools including: C Compilers, Macro Assemblers, Program Debugger/Simulators, In-Circuit Emulators, and Evaluation kit This section discusses the AVR core architecture in general. The main function of the CPU core is to ensure correct program execution. The CPU must therefore be able to access memories,perform calculations, control peripherals, and handle interrupts.
ARCHITECTURAL OVERVIEW
In order to maximize performance and parallelism, the AVR uses a Harvard architecture – with separate memories and buses for program and data. Instructions in the program memory are executed with a single level pipelining. While one instruction is being executed, the next instruction is pre-fetched from the program memory. This concept enables instructions to be executed in every clock cycle. The program memory is In-System Reprogrammable Flash memory.The ALU supports arithmetic and logic operations between registers or between a constant and a register. Single register operations can also be executed in the ALU. After an arithmetic operation, the Status Register is updated to reflect information about the
result of the operation.Program flow is provided by conditional and unconditional jump and call instructions, able to directly address the whole address space. Most AVR instructions have a single 16-bit word format. Every program memory address contains a 16-bit or 32-bit instruction.Program Flash memory space is divided in two sections, the Boot Program section and the Application Program section.
Both sections have dedicated Lock bits for write and read/write protection. The SPM instruction that writes into the Application Flash memory section must reside in the Boot Program section. The memory spaces in the AVR architecture are all linear and regular memory maps.A flexible interrupt module has its control registers in the I/O space with an additional Global Interrupt Enable bit in the Status Register. All interrupts have a separate Interrupt Vector in the Interrupt Vector table. The interrupts have priority in accordance with their Interrupt Vector position. The lower the Interrupt Vector address, the higher the priority. The I/O memory space contains 64 addresses for CPU peripheral functions as Control Registers, SPI, and other I/O functions. The I/O Memory can be accessed directly, or as the Data Space locations following those of the Register File, 0x20 - 0x5F. In addition, the ATmega48/88/168 has Extended I/O space from 0x60 - 0xFF in SRAM where only the ST/STS/STD and LD/LDS/LDD instructions can be used.
SREG – AVR Status Register
III.ZIGBEE TRANSCIEVER:
Zigbeeis a specification for a suite of high level communication protocols using small, low-power digital radios based on the ieee 802.15.4-2003 standard for wireless personal area networks (wpans), such as wireless headphones connecting with cell phones via short-range radio. The technology defined by the zigbee specification is intended to be simpler and less expensive than

National Conference on Research Advances in Communication, Computation, Electrical Science and Structures (NCRACCESS-2015)
ISSN: 2348 – 8549 www.internationaljournalssrg.org Page 109
other wpans, such as bluetooth. Zigbee is targeted at radio-frequency (rf) applications that require a low data rate, long battery life, and secure networking.
WPANs cover a radius of about 10m around a person or object. The core aim is to design systems offering low cost, low power, and compact size. The IEEE 802.15 working group has defined three classes of WPANs, differentiated by data rate, power requirements and level of performance.
The high data rate WPAN technology, UWB, is suitable for multi-media applications that require very high performance levels. Medium rate WPANs (IEEE 802.15.1/Blueetooth) handle a variety of tasks ranging from mobile phones to PDA communications. The low data rate WPAN standard, ZigBee, is intended to serve a set of industrial, residential and medical applications with very low power consumption and cost requirement and with much lower requirements in terms of data rate and performance. A ZigBee network links a number of electronic devices (nodes). Each node in the network forms part of the transmission chain, receiving messages, deciding if the messages are for local use, and re-transmitting them to other nodes in the network if not.
A common use of ZigBee is to form „sensor area networks‟. For example in a factory environment many ZigBee nodes can be quickly installed to provide complete low power wireless coverage of the many sensors needed in a factory for fire and burglar alarm systems. Was formally
adopted in December 2004 Is targeting control applications in industry, which do not require high data rates, but must have low power demand, low cost and offer ease of use (remote controls, home automation, etc.) , Offers data rates of 250 Kbits at 2.4 GHz, 40 Kpbs at 915 Mhz, and 20 Kpbs at 868 Mhz with a range of 10-100m Currently offers three levels of security Costs around half that of Bluetooth Can network up to 256 devices Has as power requirements much less than Bluetooth uses star, tree or mesh topology. ULTRA-WIDEBAND (UWB):
Transmits digital data over a wide frequency spectrum using very low power; can transmit data at very high rates (for wireless local area network applications) over distances of up to 10m; has two competing UWB standards currently - one based on direct sequence spread spectrum techniques, (DS-UWB), the other based on Multi-band Orthogonal Frequency Division Modulation (OFDM), with each standard offering data rates around 500 Mbps at a range of 2 metres; has power demands typically twice that of Bluetooth and is typically twice as expensive as Bluetooth implementation the Zig Bee Alliance is an association of companies working together to meet an open Global standard for making low-power wireless networks. The intended outcome of Zig Bee Alliance is to create a specification defining how to build different network topologies with data security features and interoperable application roles. The association includes companies from a wide spectrum of categories, from chip manufacturers to system integration companies. The number of members in the association is rapidly growing and is currently over 125 (Q1 2005). Among the members one can and Philips, Samsung, Motorola and LG. The rest specification was rated in Q4 2004 and the rest generation of Zig Bee products may reach the market sometime in 2005. A big challenge for the alliance is to make the interoperability to work among different products. The name Zig Bee is said to come from the domestic honeybee which uses a zigzag type of dance to communicate important information to other hive members. This communication dance (the "Zig Bee Principle") is

National Conference on Research Advances in Communication, Computation, Electrical Science and Structures (NCRACCESS-2015)
ISSN: 2348 – 8549 www.internationaljournalssrg.org Page 110
what engineers are trying to emulatewiththis protocol bunch of separate and simple organisms that join together to tackle complex tasks.
The goal IEEE had when they specified the IEEE 802.15.4 standard was to provide a Standard for ultra-low complexity, ultra-low cost, ultra-low power consumption and low data rate wireless connectivity between inexpensive devices. The raw data rate will be high enough (maximum of 250 KB/s) for applications like sensors, alarms and toys. IEEE 802.15.4 networks use three types of devices:The Reduced Function Device (RFD) carries limited (as specified by the standard) functionality for lower cost and complexity. It is generally found in network-edge devices. The RFD can be used where extremely low power consumption is a necessity
Zig Bee can use so-called mesh networking,
which may extend over a large area and contain thousands of nodes. Each FFD in the network also acts as a router to direct messages. The routing protocol optimizes the shortest and most reliable path through the network and can dynamically change, so as to take evolving conditions into account. This enables an extremely reliable network, since the network can heal itself if one node is disabled. This is very similar to the redundancy employed in the Internet. ZigBee networks are primarily intended for low duty cycle sensor networks (<1%). A new network node may be recognized and associated in about 30 ms. Waking up a sleeping node takes about 15 ms, as does accessing a channel or transmitting data .ZigBee applications benefit from the ability to quickly attachinformation,detach, and go to deep sleep,
which results in low power consumption and extended batterylife. IV.GSM MODEM
Global System for Mobile Communications or GSM (originally from GroupeSpécial Mobile), is the world's most popular standard for mobile telephone systems. The GSM Association estimates that 80% of the global mobile market use the standard. GSM is used by over 1.5 billion people across more than 212 countries and territories. This ubiquity means that subscribers can use their phones throughout the world, enabled by international roaming arrangements between mobile network operators. GSM differs from its predecessor technologies in that bothsignaling and speech channels are digital, and thus GSM is considered a second generation (2G) mobile phone system. The GSM standard has been an advantage to both consumers, who may benefit from the ability to roam and switch carriers without replacing phones, and also to network operators, who can choose equipment from many GSM equipment vendors.
Fig 1. GSM Modem
Global system for mobile communication (GSM) is a globally accepted standard for digital cellular communication. GSM is the name of a standardization group established in 1982 to create a common European mobile telephone standard that would formulate specifications for a pan-

National Conference on Research Advances in Communication, Computation, Electrical Science and Structures (NCRACCESS-2015)
ISSN: 2348 – 8549 www.internationaljournalssrg.org Page 111
European mobile cellular radio system operating at 900 MHz.A GSM modem is a wireless modem that works with a GSM wireless network. A wireless modem behaves like a dial-up modem. The main difference between them is that a dial-up modem sends and receives data through a fixed telephone line while a wireless modem sends and receives data through radio waves. The working of GSM modem is based on commands, the commands always start with AT (which means ATtention) and finish with a <CR> character. For example, the dialing command is ATD<number>; ATD3314629080; here the dialing command ends with semicolon. The AT commands are given to the GSM modem with the help of PC or controller. The GSM modem is serially interfaced with the controller with the help of MAX 232.
MINIMIZING POWER LOSSES:
Please pay special attention to the supply power when you are designing your applications. Please make sure that the input voltage will never drops below 3.4v even in a transmit burst during which the current consumption may rise up to 2a. If the power voltage drops below 3.4v, the module may be switched off. Using the board-to-boardconnector will be the best way to reduce the voltage drops. You should also take the resistance of the power supply lines on the host board or of battery pack into account.After this moment, no further more at commands can be executed. The module will log off from network and enters power down mode, only the rtc is still active.
MONITORING POWER SUPPLY:
To monitor the supply voltage, you can use the “at+cbc” command which include three parameters: voltage percent and voltage value (in mv). It returns the battery voltage 1-100 percent of capacity and actual value measured at vbat and gnd. The voltage is continuously measured at intervals depending on the operating mode. The displayed voltage (in mv) is averaged over the last measuring period before the at+cbc command was executed.
RDY ALARM MODE:
During alarm mode, using at+cfun command to query the status of software protocol stack; it will return 0 which indicates that the protocol stack is closed. Then after 90s, sim300 will power down automatically. However, during alarm mode, if the software protocol is started by at+cfun=1, 1 command, the process of automatic power down will not available. In alarm mode, driving the pwrkey to a low level voltage for a period will cause sim300 to power down
POWER DOWN
After this moment, no any at commands can be executed. Module enters the power down mode, only the rtc is still active. Power down can also be indicated by vdd_ext pin, which is a low level voltage in this mode.
POWER SAVING :
There are two methods to achieve sim300 module extreme low power. “at+cfun” is used to
set module into minimum functionality mode and /dtr hardware interface signal can be used to set system to be sleep mode (or slow clocking mode).
TURN OFF SIM300 USING AT COMMAND You can use an at command “at+cpowd=1” to turn off the module. This
command will let the module to log off from the network and allow the software to enter into a

National Conference on Research Advances in Communication, Computation, Electrical Science and Structures (NCRACCESS-2015)
ISSN: 2348 – 8549 www.internationaljournalssrg.org Page 112
secure state and safe data before completely disconnect the power supply.
UNDER-VOLTAGE AUTOMATIC SHUTDOWN:
Software will constantly monitors the voltage applied on the vbat, if the measured battery voltage is no more than 3.5v, the following urc will be presented:
POWER LOW WARNING:
If the measured battery voltage is no more than 3.4v, the following urc will be presented.
POWER LOW DOWN
After this moment, no further more at commands can be executed. The module will log off from network and enters power down mode, only the rtc is still active.
MINIMUM FUNCTIONALITY MODE :
Minimum functionality mode reduces the functionality of the module to a minimum and, thus, minimizes the current consumption to the lowest level. This mode is set with the “at+cfun”
command which provides the choice of the functionality levels <fun>=0,1,4 0: minimum functionality; If sim300 has been set to minimum functionality by “at+cfun=0”, then the rf function and the SIM card function will be closed, in this case, the serial ports is still accessible, but all at commands need Rf function or SIM card function will not accessible. If sim300 has disable all rf function by “at+cfun=4”, then rf function will be
closed, the serial ports is still active in this case but all at commands need rf function will not accessible. When sim300 is in minimum
functionality or has been disable all rf functionality by “at+cfun=4”, it can return to full
functionality by “at+cfun=1”.
SLEEP MODE (SLOW CLOCKING MODE)
Through DTR signal control sim300 module to enter or exit the sleep mode in customer applications. When dtr is in high level, at the same time there is no on air or audio activity is required and no hardware interrupt (such as gpio interrupt or data on serial port), sim300 will enter sleep mode automatically. In this mode, sim300 can still receive paging or sms from network.
In sleep mode, the serial port is not accessible.Originally GSM had been planned as a European system. However the first indication that the success of GSM was spreading further afield occurred when the Australian network provider, Telstra signed the GSM Memorandum of Understanding.
WAKE UP SIM300 FROM SLEEP MODE :
When sim300 is sleep mode, the following method can wake up the module. Enable dtr pin to wake up sim300; If DTR pin is pull down to a low level this signal will wake up sim300 from power saving mode. The serial port will be active after DTR change to low level about Originally GSM had been planned as a European system. However the first indication that the success of GSM was spreading further a field occurred when the Australian network provider, Telstra signed the GSM Memorandum of Understanding Originally it had been intended that GSM would operate on frequencies in the 900 MHz cellular band. In September 1993, the British operator Mercury One-to-One launched a network. Termed DCS 1800 it operated at frequencies in a new 1800 MHz band. By adopting new frequencies new operators and further competition were introduced into the market apart from allowing additional spectrum to be used and further increasing the overall capacity. This trend was followed in many countries, and soon the term DCS 1800 was dropped in favor of calling it GSM as it was purely the same cellular technology but operating on a

National Conference on Research Advances in Communication, Computation, Electrical Science and Structures (NCRACCESS-2015)
ISSN: 2348 – 8549 www.internationaljournalssrg.org Page 113
different frequency band. In view of the higher frequency Used the distances the signals travelled was slightly shorter but this was compensated for by additional base stations. In the USA as well a portion of spectrum at 1900 MHz was allocated for cellular usage in 1994. The licensing body, the FCC, did not legislate which technology should be used, and accordingly this enabled GSM to gain a foothold in the US market. This system was known as PCS 1900 (Personal Communication System).
V.THE GSM NETWORK
The operations and maintenance center (OMC) is connected to all equipment in the switching system and to the BSC. The implementation of OMC is called the operation and support system (OSS). The OSS is the functional entity from which the network operator monitors and controls the system. The purpose of OSS is to offer the customer cost-effective support for centralized, regional, and local operational and maintenance activities that are required for a GSM network.
An important function of OSS is to provide a network overview and support the maintenance activities of different operation and maintenance organizations. To low amounts of drift, and capacitive load cells where the capacitance of a capacitor changes as the load preses the two plates of a capacitor closer together. Every load cell is subject to "ringing" when
subjected to abrupt load changes. This stems from the spring-like behavior of load cells. In order to measure the loads, they have to deform. As such, a load cell of finite stiffness must have spring-like behavior, exhibiting vibrations at its natural frequency. An oscillating data pattern can be the result of ringing. Ringing can be suppressed in a limited fashion by passive means. Alternatively, a control system can use an actuator to actively damp out the ringing of a load cell. This method offers better performance at a cost of significant increase in complexity.
LOAD CELL
A load cell is a transducer that is used to convert a force into electrical signal.This conversion is indirect and happens in two stages.Through a mechanical arrangement, the force being sensed deforms a strain gauge. The strain gauge measures the deformation (strain) as an electrical signal, because the strain changes the effective electrical resistance of the wire. A load cell usually consists of four strain gauges in a Wheatstone bridge configuration. Load cells of one strain gauge (quarter bridge) or two strain gauges (half bridge) are also available.[1] The electrical signal output is typically in the order of a few millivolts and requires amplification by an instrumentation amplifier before it can be used. The output of the transducer can be scaled to calculate the force applied to the transducer. The various types of load cells that are present are: 1) Hydraulic Load cell 2) Pneumatic Load cell 3) Strain Gauge Load cell Hydraulic Load Cell: the piston is placed in a thin elastic diaphragm. The piston does‟nt actually comes in contact with the load cell. Mechanical stops are placed to prevent over strain of the diaphragm when the loads exceed certain limit. The load cell is completely filled with oil. When the load is applied on the piston, the movement of the pistonand the diaphragm arrangement result in an increase of oil pressure which in turn produces a change in the pressure on a bourdon tube connected with the load cellsPneumatic load cells: the load cell is designed to automatically regulate the balancing pressure. Air pressure is applied to one end of the diaphragm and it escapes through the nozzle

National Conference on Research Advances in Communication, Computation, Electrical Science and Structures (NCRACCESS-2015)
ISSN: 2348 – 8549 www.internationaljournalssrg.org Page 114
placed at the bottom of the load cell. A pressure gauge is attached with the load cell to measure the pressure incide the cell. The deflection of the diaphragm affects the airflow through the nozzle as well as the pressure inside the chamber.
LOAD CELL
GAS SENSOR:
They are used in gas leakage detecting equipments in family and industry, are suitable for detecting of LPG, cooking fumes and cigarette smoke.natural gas , town gas, avoid the noise of alcohol and
VI.LIQUID CRYSTAL DISPLAY:
LCD stands for Liquid Crystal Display. LCD is finding wide spread use replacing LEDs (seven segment LEDs or other multi segment LEDs) because of the following reasons :The declining prices of LCDs. The ability to display numbers, characters and graphics. This is in contrast to LEDs, which are limited to numbers and a few characters. Incorporation of a refreshing controller into the LCD, thereby relieving the CPU of the task of refreshing the LCD. In contrast, the LED must be refreshed by the CPU to keep displaying the data. Ease of programming for characters and graphics. These components are “specialized” for being used with the microcontrollers, which means that they cannot be activated by standard IC circuits. They are used for writing different messages on a miniatureLCD.
LCD Display
LCD screen consists of two lines with 16 characters each. Each character consists of 5x7 dot matrix. Contrast on display depends on the power supply voltage and whether messages are displayed in one or two lines. For that reason, variable voltage 0-Vdd is applied on pin marked as Vee. Trimmer potentiometer is usually used for that purpose. Some versions of displays have built in backlight (blue or green diodes). When used during operating, a resistor for current limitation should be used (like with any LE diode).
KEY PAD (4X1 MATRIX)
This note describes an method of interfacing a matrix keyboard to EZ328 using minimum number of I/O ports. We use a 4x1 matrix keypad as an example. It requires only five I/O ports. (In general, it takes n+1 ports to interface a nxn matrix keyboard). It is a low cost solution. No TTL logic ICs are used. The components mainly used in the interfacing circuitry include only diodes and resistors. which can greatly reduce the system cost and size of the product.

National Conference on Research Advances in Communication, Computation, Electrical Science and Structures (NCRACCESS-2015)
ISSN: 2348 – 8549 www.internationaljournalssrg.org Page 115
Figure 1 shows a functional block diagram of the keyboard interface. As seen in this diagram, there are two majorparts.The transistor part is designed as an inverter for generating interrupt signal to EZ328 when there is a key pressed. There are two groups of diodes mainly for restricting signal flow in single direction so as to enable this circuitry to identify the pressed key uniquely. One of these two groups of diodes have been wired together to provide a “OR” function which in turn allows any key
RELAY DRIVER AND RELAY
A relay is an electrically controllable switch widely used in industrial controls, automobiles and appliances. The relay allows the isolation of two separate sections of a system with two different voltage sources i.e., a small amount of voltage/current on one side can handle a large amount of voltage/current on the other side but there is no chance that these two voltages mix up. But, the microcontroller cannot provide the sufficient current required for the relay coil to be energized. Therefore, a power transistor or an ULN driver should be connected between the microcontroller and the relay. Power transistor can be connected as the current driver but if more number of relays are required to operate the loads, ULN driver is the best choice.
For the relay to be operated, coil should be energized i.e., current should flow through the coil. Thus, a voltage difference should exist
between the terminals for the current to flow through the coil. One terminal of the. Therefore, the relay will be operated and the load will be applied.
VII.RELAY INTERFACING WITH THE MICROCONTROLLER:
Relay interfacing with microcontroller
An SPDT relay consists of five pins, two for the magnetic coil, one as the common terminal and the last pins as normally connected pin and normally closed pin. When the current flows through this coil, the coil gets energized. Initially when the coil is not energized, there will be a connection between the common terminal and normally closed pin. But when the coil is energized, this connection breaks and a new connection between the common terminal and normally open pin will be established. Thus when there is an input from the microcontroller to the relay, the relay will be switched on. Thus when the relay is on, it can drive the loads connected between the common terminal and normally open pin. Therefore, the relay takes 5V from the microcontroller and drives the loads which consume high currents. Thus the relay acts as an isolation device.
VIII.CONCLUSION:
One of the biggest areas of concern for LPG customers is registering their requests for refill cylinders with the distributors. While analyzing the data on the complaints being received by the oil marketing companies (OMCs), it has been observed that a major chunk of them pertain to refill booking and non-receipt of acknowledgement for bookings made. Being a

National Conference on Research Advances in Communication, Computation, Electrical Science and Structures (NCRACCESS-2015)
ISSN: 2348 – 8549 www.internationaljournalssrg.org Page 116
shift to a computerized system, like any other similar systems implemented, some inconvenience may be faced by a marginal section of the LPG customers in the initial period. However, once implemented in full and all the customers get used to such advanced and progressive systems, the chances of errors inherent to manual systems will get eliminated, which will help in better customer service and satisfaction.
Booking for a LPG cylinder refill and getting it delivered in time is getting easier. With a view to provide better services to the customers and to reduce the scope of irregularities in existing system.
REFERENCES
[1] HASANKARIMINEZHAD, “SF6 leak detection of high-voltage installations using TEA-CO2 laser-based DIAL,”
Optics and Lasers in Engineering, vol. 48, pp. 491-499, 2010. [2] GENGJIANGHAI, GAOSHUGUO, “Laser Imaging Detection Technology of SF6 Gas Leakage,” Laser & Infrared, vol.38, pp.34, 2008. [3] KIM MUNCHUR,KIMJINWOONG, “Moving video objects segmentation using statistical hypothesis testing,” Electronics Letters, vol.36, pp128-129, 2000. [4] LI XIAOPENG, YAN YAN, “Analysis and Comparision of Background Modeling Methods,”China Academic Journal Electronic Publishing House, pp.469-473,2006. [5] MILAN SONKA, VACLAV HLAVAC, Roger Boyle, Image Processing, Analysis and Machine Vision, 2nd ed., Thomson Learning and PT Press, 2003,pp.65-67. [6] DEMIN W, LIMIN W, “Global motion parameters estimation using a fast and robust algorithm,” IEEE Trans. on Circuits and Systems for Video Technology, vol. 7, pp. 823-826, 1997. [7] L.M. PO, W. C. MA, “A novel four-step searchalgorithmfor fast block motion estimation,” IEEE Trans. on Circuits and Systems for Video Technology, vol.6,pp.313317,1996. [8] NERI A, COLONNESS S, “Automatic moving object and background separation,” Signal Processing, vol.66, pp.219-232, 1998. [9] MEIER T, KING N, Automatic Segmentation of Moving Objects for Video Object Plane Generation,� IEEE Trans. on Circuits and System for Video Technology, vol.8 pp.525-538, 1998.

National Conference on Research Advances in Communication, Computation, Electrical Science and Structures (NCRACCESS-2015)
ISSN: 2348 – 8549 www.internationaljournalssrg.org Page 117
Low cost and high efficient Smart HEMS by using Zigbee with MPPT techniques
Sethuraman M* S.Jayanthi M.E student,Dept of EEE Associate professor,Dept of EEE
Dhanalakshmi srinivasan engineering college Dhanalakshmi srinivasan Engineering College
Abstract— Home power consumption tends to grow in proportion to increase in the number of large-sized electric home appliances. Hence home energy management system (HEMS) needs to consider both energy consumption and generation of electricity. This paper proposes a smart HEMS architecture using renewable energies. The current energy crisis has required significant energy reduction in all areas but energy consumption has been increased in home areas due to more home appliances installed. Home energy problems are solved by using renewable energy sources and energy saving method. PIC microcontroller can be used to monitor and control the energy generation from renewable energies such as solar panel, wind turbine. Zigbee used for the measurement of energy consumption from home appliances. The efficiency of power generation can be increased by using Maximum Power Point Tracking (MPPT) techniques and power saving can be done using stand alone cut off technique. The energy consumption of home appliances and generation of renewable energies are collected from home server which is used for analyzing the total energy estimation and control the energy consumption in home to minimize the energy cost. Keywords— PIC,PV panel, Wind turbine, Current sensor, Zigbee, MPPT
I. INTRODUCTION In our today world most considerable one is
energy saving and generation by build Smart home energy management system for consider in home areas. Particularly the energy can be saved from home and industrial appliances are undergone more often than not. Smart home energy management system is used to save the energy from home appliances by using solar panel and wind turbine. Today day to day life people are using internet so it helps this paper to know the generation and consumption of energy. PIC microcontroller can be used here as to obtain the low cost and MPPT technique can be used to achieve high efficiency in energy generation. Current sensor can used to measure the current consumption from home appliances and generation from renewable energies. Several electric appliances are such as iron box, TV or microwave
oven is running and it can be automatically cut off when no one is present in the place by using PIR sensor. Subsequently PIC controller should be interface with mobile devices or PC or Laptop to know the details such as generation of renewable energies and consumption of home appliance details with the help of internet server.
II. SMART HOME ENERGY MANAGEMENT SYSTEM
The concept of home energy management system has been an interesting topic for researchers and practitioners during the last few years. The majority for recent techniques concentrate on exploiting wireless communications on the way to make communicate with the other devices such as Mobile phones and Laptop’s.
Mostly Smart HEMS architectures are prepared by using the renewable energies and PLC controller. The energy readings are taken by the smart meter sometimes they preferred digital meters. This be prepared the smart home energy management system implementation cost is higher as PLC controller is cost wise higher than embedded controllers reminiscent of 8051, PIC, ARM.
Controllers are interface with the Bluetooth for display the reading in mobile phones and Laptops. But the bluetooth range is short then it cannot send the reading information’s for longer distance. Now-a-days there are lots of techniques used to send the data for longer duration. One of the far and wide used techniques is internet.
Zigbee based Smart home energy
management system are integrated with Wi-Fi network through gateway. Gateway can provide the user interface and openness to the particular system. Through using Zigbee designed for take the electrical readings such as energy consumption from home appliances.
. A system via the Global System for Mobile communications (GSM) and Internet was proposed for real-time monitoring and remote control in home appliances to display the energy readings. These add flexibility for the

National Conference on Research Advances in Communication, Computation, Electrical Science and Structures (NCRACCESS-2015)
ISSN: 2348 – 8549 www.internationaljournalssrg.org Page 118
implemented system, but, it increases the cost when using GSM technology. The designing system also exploits Internet for monitor the home energy also from outside.
III. GENERAL ARCHITECTURE
The overall architecture is shown in below Fig.1.The pic16f877a is the heart of this system. PIC: 16F877A PIC has 128kB program memory and 40-pin package. It has special internal features such as internal ADC, Timer, I2C and Serial port.
Transmitter Block
Receiver Block
Solar Panel with MPPT: A solar panel is
consists of many Photo voltaic cells. It used to absorb the sun rays at day time and take a backup for use it night time. In today world the usage of the solar panel is very high to reduce the power consumption. To increasing the power generation in solar panel by using Maximum Power Point Tracking Technique. This technique can be simply done by using two LDR and a DC motor.
Wind turbine with MPPT: Wind turbine
is used to absorb the wind from atmosphere and using the kinetic energy from wind to generate the electrical power. Here also employed the MPPT
technique to increase the power generation from wind by using peak detection method.
Battery with Charge controller: Here
12v battery can be used to store the power from wind turbine and solar panel. Both can produce above ranges then it can be controlled by using Charge controller circuit. Here a NPN transistor should be used to provide the safety purpose for drive the power from renewable energy to battery supply and maintain to don’t send the power from
battery to renewable energy sources such as solar panel and wind turbine.
Inverter: It can be used to convert the 12v
to 230v supply for providing the power to the home appliances form solar and wind. Step up transformer can be used to increase the power from 12v–230v power supply.
Current Sensor: Current sensor is a
device used to sense the current from solar panel, wind turbine and main panel for knowing the power generation and consumption by home appliances. This current sensor is worked based on the principle of Hall Effect. To convert the current into power by using the P=VI formula. It is also possible to measure the DC and ac supply directly from the source.
PIR sensor: PIR sensor is used to sense
the presence of the human being in a particular place. If there is no human being is present all the power is switched off otherwise power is switched on. The PIR can sense is based on the photo cell. So it should be worked as differently in during day and night time. In day time photo cell based sensor save the electricity through disable the lighting load which is connect to the sensor. For the duration of night time lighting load is enabled and turned on by using adjusting luminosity knob (LUX). This adjustable time knob provides an opportunity to you for staying the light on after activation.
Relay: Relay is an electrical device used
to switching device for change the contact automatically. It have consist of a coil it will be generated the magnetic field for helps to change the contacts. In relay there are two operating mode NO and NC.
Zigbee: It is the wireless device for transmitting and receiving purpose or simply it called as Transceiver. Zigbee is based on the IEEE802.15.4 protocol. The range of the Zigbee is

National Conference on Research Advances in Communication, Computation, Electrical Science and Structures (NCRACCESS-2015)
ISSN: 2348 – 8549 www.internationaljournalssrg.org Page 119
covered as 100m. It range is 10 times better than bluetooth device so it can be more preferable one in wireless device. The data rate is very low for transmission while using this device.
Web server: In today world it is more
important one is internet. Web server is look like a computer system with the intention of processes the request by way of HTTP platform is basic protocol at ease with allocates the information on World Wide Web. The limit of the web server for client connection is between 2 to 80,000 per IP address. At any time the web server is overloaded since appropriate to heavy traffic. To updated the energy consumption and generation continuously by using web server. A web server can be created by using router and access point.
IV. DESIGN AND WORKING
PIR sensor is interface with the PIC 16f877a micro controller. The PIC 16f877a controller is programmed with MPLAB. When PIR is turned on, then entire electrical home appliances in building is off that means power save mode on and display PIR on and no human being is detected in the home. If PIR is turned off, then electrical home appliances are start working as before and it sends a message to the internet like PIR is turned on and Human presence in the home. So it makes easy to viewer if there is any body present in his/her building or home.
The efficiency of the power generation could be increased by using MPPT techniques such as incremental conductance for solar panel and peak tracking for wind turbine. Especially in
solar the power can be increased by using two LDR sensors and a DC motor. The LDR sensors are connected at top of the solar panel and the resistance changes according to the sun scorching direction by rotate the solar panel using DC motor. In wind tracking, the peak of the blade can be tracked for increase the power generation by wind.
The wind and solar panel is connected to the battery according with the help of charge controller. The charge controller makes the suitable 12v for charge the battery. The battery can be charged with the help of those energies, once it charged and supply the power to the home appliances by these energies. If there is enough supply voltage is produced then this operation could be done. Otherwise the battery supply voltage is not enough then taking the main supply for providing the power to those home appliances. The switching of the power supplies are done by using relays. At the same time the power generation from solar, wind and power consumption by home appliances are calculated and displayed in the web server.
V. APPLICATIONS
1. Energy cost can be reduced
2. Increase the power generation
3. Energy Monitoring
4. Know the cost of energy usage VI. CONCLUSION Here in thesis the smart home energy management system using PIC controller is developed. This home energy management system is works well on real time. The system can be fully controlled by controller and it can also controlled by computer using a RS232 interface. Power generation and consumption details are successfully upload into the web server continuously without interpreting other servers. Solar power and wind is enough for supply the home appliances but in addition main panel are also connected. Anyway the implementation cost of the system is low and this System is also reducing the cost of the power. During peak hour the heavy load home appliances kept off to maintain the energy management and save the energy for nature and upcoming future generations.

National Conference on Research Advances in Communication, Computation, Electrical Science and Structures (NCRACCESS-2015)
ISSN: 2348 – 8549 www.internationaljournalssrg.org Page 120
VII. ACKNOWLEDGEMENT
I owe my heartfelt gratitude to God almighty for all the blessings showered on me during make an effort. I take this opportunity to express my sincere gratitude to all the people who have been instrumented in bringing out this work to the accurate form. I would reminiscent of express my sincere thanks to Ms.Jayanthi.s, HOD of EE, Dhanalakshmi srinivasan engineering college,Perambalur for her precious advice for the successful completion of this project. My heartfelt words of gratitude to Mrs. Chandra, PG Coordinator and Associate Professor in Electronics and Electrical Engineering Department due to her kind Coöperation and valuable suggestions and I thank the Staff members of Electronics and Communication Engineering Department due to their coöperation for completion of this project. Finally I said thank my friends, classmates and family who are providing me the strength and endurance.
VIII. REFERENCES
1. Jinsoo Han, Chang-Sic Choi, Wan-Ki Park, Ilwoo
Lee, and Sang-Ha Kim, ―Smart home energy management system including renewable energy based on ZigBee and PLC,‖ in Proc. IEEE International Conference on Consumer Electronics, Las Vegas, USA, pp. 544-545, Jan. 2014.
2. Jinsoo Han, Chang-Sic Choi, Wan-Ki Park, and Ilwoo Lee, ―Green home energy management system through comparison of energy usage between the same kinds of home appliances,‖ in Proc. IEEE,International Symposium on Consumer Electronics, Singapore, pp. 1-4,Jun. 2011.
3. Chia-Hung Lien, Hsien-Chung Chen, Ying-Wen Bai, and Ming-Bo Lin, ―Power monitoring and control for electric home appliances based on power line communication,‖ in Proc. IEEE International Instrumentation and Measurement Technology Conference, British Columbia, Canada, pp. 2179-2184, May 2008.
4. Jinsoo Han, Chang-Sic Choi, Wan-Ki Park, Ilwoo Lee, and Sang-Ha Kim, ―PLC-Based Photovoltaic System Management for Smart Home Energy Management System,‖ in Proc. IEEE International Conference on Consumer Electronics, Las Vegas, USA, pp. 542-543, Jan. 2014.
5. Chia-Hung Lien, Hsien-Chung Chen, Ying-Wen Bai, and Ming-Bo Lin, ―Power monitoring and control for electric home appliances based on power line communication,‖ in Proc. IEEE International Instrumentation and Measurement Technology Conference, British Columbia, Canada, pp. 2179-2184, May 2008.
6. Saeed Jahdi and Loi Lei Lai, ―Grid integration of wind-solar hybrid renewable using AC/DC converters as DG power sources,‖ in Proc. World Congress Sustainable Technologies, London, UK, pp. 171-177, Nov. 2011.
7. Hayato Yamauchi, Kosuke Uchida, and Tomonobu Senjyu, ―Advanced Smart Home,‖ in Proc. IEEE International Conference on Harmonics and Quality of Power, Hong Kong, China, pp. 130-135, Jun. 2012.
8. Sarah Darby, ―The Effectiveness of Feedback on Energy Consumption,‖ Environmental Change Institute, Univ. of Oxford, Apr. 2006.
9. Tsuyoshi Ueno, Ryo Inada, Osamu Saeki, and Kiichiro Tsuji, ―Effectiveness of Displaying Energy
Consumption Data in Residential Houses - Analysis on How the Residents act in response‖ Proceedings of ECEEE 2005 Summer Study, 2005.
10. Sungjin Park, Eun Ju Lee, Jae Hong Ryu, Seong-Soon Joo, and Hyung Seok Kim, ―Distributed Borrowing Addressing Scheme for ZigBee/IEEE 802.15.4 Wireless Sensor Networks,‖ ETRI Journal, vol.31, no.5,
11. IEEE P802.11, The Working Group for Wireless LANs, retrieved September 20, 2003,Available: http://www.ieee8o2.org/11/
12. IEEE 802.15, retrieved August 28,2007, Available: http://www. ieee802.org15/pub/TG1.html.
IX.BIOGRAPHY
Sethuraman.M is a P.G. student in the Electronics and electrical Department, Dhanalakshmi srinivasan engineering college under Anna university, Perambalur. He received Bachelor of engineering degree in 2012 from Trichy engineering college under Anna university, Trichy, India. His research interests are in electronics such as programming in Micro controllers and design related hardware’s.

National Conference on Research Advances in Communication, Computation, Electrical Science and Structures (NCRACCESS-2015)
ISSN: 2348 – 8549 www.internationaljournalssrg.org Page 121
EFFICIENT APPROACH FOR SECURE DATA TRANSMISSION IN WIRELESS SENSOR NETWORKS
P. Sowmiya ,Assistant Professor,
Department of Electronics & Communication Engineering Bharathiyar Institute of engineering for women,Tamilnadu,India
Abstract-In a wireless sensor network, data collection is the major function. How adequately we gather the information from all the sensor nodes to the sink node. The data collected from the wireless sensor network have many to one communication. The major limitation in this paper was no secure transmission of messages and packet loss is high. To overcome these problems by using two approaches, one is a packet loss reduction approach and the other is secure message transmission approach. The first approach contains the moving node, it reduces the packet loss. The moving node can help to collect the loss packets and it retransmits the data to the sink node. Here, we include the RSA algorithm for security purpose.This algorithm generates two keys, namely, public and private key for encryption and decryption of the data. The encryption can be done in the sensing node and the data can be decrypted in the sink node.
Keywords: wireless sensor network, data collection, many to one communication, packet loss, RSA algorithm.
I. INTRODUCTION
Recently, remote sensor systems have been used in most of the applications such as Environmental monitoring, Military surveillance, Emergency Relief, Medical monitoring, Process Monitoring and so on. The important application in wireless sensor network is the data collection [1]; the sensor can be used to sense the node in the network. The sensed data are collected continuously and it can be forwarded through wireless communications to the base station. From the base station the data can be transferred to the particular destination. A sensor is a gadget that measures a physical amount, and delivers it into an indicator which might be perused by an eyewitness or by an instrument. Each sensor node can be operated under the powered battery and it uses the wireless communication for data transmission. Thus, the sensor node has a small size and it can be
deployed anywhere in the environment without any disturbance.
The sensor can be operated in battery with less energy and it cannot be recharged intermediately. A remote sensor system is a network which consists of an expansive number of processing nodes called sensors and it can be connected to the outside world through the base station. Normally a sensor consists of transmitting module, data processing module, sensing and power modules. These modules can be used for the process of data collection, storage, routing and computing. The major function in the sensor network is the data collection by using less amount of energy.
First, it senses entire nodes in the network and gathers data from the target node to destination through sink node. The sink node is nothing but the node which can be chosen nearly for the destination. We assume that the networks, in this sensor having random structures in the region, which it take place, each sensor are responsible for field values in the each sensing cases. These sensed results are travelling through sink nodes to the destination.The main process of the information gathering is to convey the previews to the sink node. The basic network used here is wireless sensor networks [2], which have small networks with nodes, which is powered battery sensor with processing on-board; radio capacity and storage are limited.
The nodes are used to sense the network, which will produce a report to a center of processing, namely “sink”. In order to extend the lifetime [3] of the networks, the energy usage should be in aware for some networks, such as, protocol designs and applications. This is done due to the difficulty in replacement of the batteries embedded after they are deployed. In a sensor network, the balanced distribution of energy is not

National Conference on Research Advances in Communication, Computation, Electrical Science and Structures (NCRACCESS-2015)
ISSN: 2348 – 8549 www.internationaljournalssrg.org Page 122
assured in classical approaches, such as, minimum and direct transmission.
In the procedure of Direct Transmission (DT), transmission is done directly between sensor nodes to sink, such that the nodes which are far from sink are destroyed first, but in the procedure of Minimum Transmission Energy (MTE), the data are specifically routed with the less cost - route. Here the nodes nearing sink will act as higher probability relays. Thus, the near nodes of the sink will die faster. The monitoring of the fields cannot be done all the time on the field of both the transmission such as, DT and MTE which results in biasing of field sensing process. The packet loss can be reduced by using the moving node. The moving node will be initially positioned at a random point in the topology. The node will move at a randomly generated speed in a random direction and the movement will be periodically updated. The encryption can be done by using the Rivest, Shamir & Adleman (RSA) algorithm. A public key, which may be known by anybody, and can be used to encrypt messages and a private key, known only by the recipient, and used to decrypt messages. The RSA algorithm [4] gives more secure for the data transmission in the network.
Network Simulator is used in the simulation of
routing protocols, among others, and is heavily used in ad-hoc networking research. NS will supports popular network protocols, offering simulation results for wired and wireless networks alike. The simulation is done by using the NS2 simulator. NS were built in C++ and provide a simulation interface through OTcl, an object-oriented dialect of Tcl. The user describes a network topology by writing OTcl scripts, and then the main NS program simulates that topology with specified parameters. NS-2 can run either in Fedora version of Linux Operating Systems or in the surface used Windows XP with Cygwin.
II. RELATED WORK
Gupta et al. [5] Initiated the research on
capacity of random wireless networks by studying the unicast capacity in the seminal paper. A number of following papers studied capacity under different communication scenarios in random networks: unicast, multicast and broadcast. In this paper, we
focus on the capacity of data collection in a many-to-one communication scenario. Capacity of data collection in random wireless sensor networks has been investigated. Duarte-Melo et al. [6] first studied the many-to-one transport capacity in random sensor networks under a protocol interference model. They showed that the overall capacity of data collection is Θ(W).
El Gamal [7] studied data collection capacity subject to a total average transmitting power constraint. They relaxed the assumption that every node can only receive from one source node at a time. It was shown that the capacity of random network scales as Θ(log n, W) when n goes to infinity and the total average power remains fixed. Their method uses antenna sharing and channel coding. Barton and Zheng [8] also investigated data collection capacity under more complex physical layer models (non cooperative SINR (Signal to Interference plus Noise Ratio) model and cooperative time reversal communication (CTR) model).
III. SYSTEM OVERVIEW
In this paper we include the secure data
transmission, and the packet loss can be reduced by using the moving nodes. All sensor nodes should register with sink node and encrypt the message using a sink node public key. Every user should overhear while transmitting its packet to the next node. If the next node drops the packet means, the previous node should send the packet to move a node. The RSA algorithm can be used for the secure data transmission.
A. NETWORK DEPLOYMENT AND AUTHENTICATION
This module contains details about network and authentication details. Initially the wireless sensor network contains n number of sensor nodes and a sink node. The communication of the network is multihop network. That is one node is connected to nearest node. In this network, all nodes make registration to by entering required details. Then the sink node generates public key and private key for every user and sends with the help of moving node.
B. PROCESS OF REQUEST SCHEDULING In this wireless sensor network [9] the every
node is plotted in the upper direction. So each node

National Conference on Research Advances in Communication, Computation, Electrical Science and Structures (NCRACCESS-2015)
ISSN: 2348 – 8549 www.internationaljournalssrg.org Page 123
sends a request to upper direction, then waiting for a response. Then the intermediate node, after receiving the request schedules the request based on the received time.
C. MESSAGE ENCRYPTION AND
DECRYPTION The intermediate node sends responds message
to request node. Then the user encrypts the data and sent to the requested node. Then the intermediate node sends ACK to sender and forwards the packet to upper node. Next intermediate node sent the packet to sink node. Whenever the sink node starts to receive the packet from sensor nodes first initialize the packet scheduling mechanism.
This mechanism allows first received packet
and the other packets are blocked. The sink node after receiving the packet the scheduling mechanism allows the next priority packet. Then the sink node decrypts the message using its private key. The flow chart for the system process is given below.
D. MESSAGE RETRANSMISSION TO MOVING NODE
The previous node after receiving
acknowledgement overhears the packet transmission. If that node drops the packet means the previous node sends the packet to move a node. Then the moving node sent the packet to the destination. The Class Diagram is the main building block of object oriented modeling. It is used for both general conceptual modeling of the systematics of the application and also in the detailed modeling translating the models into programming code. Class diagrams can also be used for data modeling. The classes in a class diagram represent both the main objects and or interactions with the application and the objects to be programmed. In the class diagrams these classes are represented by the boxes which contain three parts.
• The upper part holds the name of the class • The middle part contains the attributes of
the class • The bottom part gives the methods or
operations of the class which can take or undertake.
sensor node sends required information to sink node
sink node generates public key and private key and sent to corresponding sensor node with help of moving node
every sensor node receives key and store
every sensor node sense the environment and sent request to nearest node
the intermediate node schedule the request and sent response for first request
the response received node encrypt the message and sends information to responded node
then that node sends the packet to next upper node and overhears
if that node drops the packet
the previous node sent packet to moving node
yes
the sink node perform scheduling operation and receive the message
no
finally the sink node decrypt the data and store
NewActivitymoving node sent packet to sink node

Natio
ISSN: 23
E. R
In RSdecryptioncorrect demessage. and decrysuch a weasily dedsecurity ovalidated,yet been sfactoring large primalgorithmexample a
• C• C• C
20• C
ar• C
φ20
• Pu• Pr• T
29
sensor_no
name : strID : string
sense()request()receive()sentreadin
onal Conferenc
348 – 8549
RSA ALGORIT
SA, encryption keys are noecryption keyEveryone ha
yption keys. way that the duced from thof the RSA , since no knosuccessful, mlarge numberme numbers
m can be givenas given below
Choose p = 3 aCompute n = pCompute φ(n)
0 Choose e suchre co prime. L
Compute a val(n) = 1. One 0 = 1] ublic key is (rivate key is (
The encryption9
odes
ring
ngs()
ce on Research
w
THM
on keys are pot, so only they can deciphas their own The keys mdecryption k
he public encralgorithm h
own attempts mostly due to
rs n = pq, whs. The calcun as step by sw
and q = 11 p * q = 3 * 11= (p - 1) * (q
h that 1 < e < Let e = 7 lue for d suchsolution is d
e, n) => (7, 3(d, n) => (3, 3n of m = 2 is
moving_node
name : stringID : string
receive()sent()
h Advances in C(N
www.interna
public, while e person with her an encryp
encryption [must be madekey may not ryption key. Thas so far b
to break it hthe difficulty
here p and q ulation of Rstep process w
= 33 q - 1) = 2 * 1
φ(n) and e an
h that (d * e)d = 3 [(3 * 7)
3) 33) s c = 27 % 33
sink_node
name : stringID : string
schedule()receive()decrypt()generate()sent()
CommunicatioNCRACCESS-2
ationaljourna
the the
pted [10] e in
be The een
have y of are
RSA with
0 =
nd n
) % ) %
3 =
n, Computatio2015)
alssrg.org
• The d= 2
The Fifrom the neach node Fig.2 reprelost data frsink node.
Fig.1 send
Fig.2 movin
n, Electrical S
ecryption of
IV. RE
ig.1 representnetwork and s
are registeredesents the morom the sourc
ds the sensed dWSN
ng nodes receisends to the
Science and Str
Page
c = 29 is m =
ESULTS
ts the sendingend to the sind in the sink n
oving node recce node and se
data to the sinN
ive the packesink node
ructures
124
= 293 % 33
g of data nk node and node. The ceive the end it to the
nk node in
t loss and

National Conference on Research Advances in Communication, Computation, Electrical Science and Structures (NCRACCESS-2015)
ISSN: 2348 – 8549 www.internationaljournalssrg.org Page 125
V. CONCLUSION
We proposed a moving node method for the reduction of packet loss and RSA algorithm gives the security for the data transmission. The RSA algorithm is most commonly used algorithm for the secure transmission in the communication field. The sink node is the intermediate node for the source and destination. The packet loss can be reduced due to the moving node retransmission process. The moving node will helps to retransmit the packet to the sink node and each node is registered in the sink node, which gives public key and the private key for encryption and decryption. This method provides secure data transmission and reduced packet loss.
REFERENCES
[1]. P. Sowmiya, S. Sathya, R. Vijayaraghavan, G. Rajkumar,”Time Reduction-Cluster Based Data Collection in Arbitrary Wireless Sensor Networks” International Journal of Applied Engineering Research ISSN 0973-4562 Volume 9, Number 7 (2014) pp. 813-823
[2]. Giuseppe Anastasi, Marco Conti, Mario Di
Francesco, Andrea Passarella,"Energy conservation in wireless sensor networks: A survey",Ad Hoc Networks, Volume 7, Issue 3, May 2009, Pages 537-568.Xiaojun Zhu, Xiaobing Wu, Guihai Chen,"Relative localization for wireless sensor networks with linear topology",Computer Communications,Volume 36, Issues 15–16, September–October 2013, Pages 1581–1591.
[3]. Concepción Torres, Peter Glösekötter,"Reliable and
energy optimized WSN design for a train application", Journal of Systems Architecture, Volume 57, Issue 10, November 2011, Pages 896-904.
[4]. Wang, J. , Liu, X., Ji, X."A secure communication
system with multiple encryption algorithms", Proceedings of the International Conference on E-Business and E-Government, ICEE 2010, Article number 5591471, Pages 3574-3577
[5]. ]P. Gupta and P.R. Kumar,“The Capacity of Wireless
Networks,”IEEE Trans. Information Theory, vol. 46, no. 2, pp. 388-404, Mar2000.
[6]. E.J. Duarte-Melo and M. Liu,“Data-Gathering
Wireless Sensor Networks: Organization and Capacity,” Computer Networks, Vol. 43, pp. 519-537, 2003.
[7]. H. El Gamal,“On the Scaling Laws of Dense Wireless Sensor Networks: The Data Gathering Channel,” IEEE Trans. Information Theory, vol. 51, no. 3, pp. 1229-1234, Mar. 2005.
[8]. R. Zheng and R.J. Barton,“Toward Optimal Data
Aggregation in Random Wireless Sensor Networks,” Proc. IEEE INFOCOM, 2007.
[9]. M. Franceschetti, O. Dousse, D.N.C. Tse, and P.
Thiran,“Closing the Gap in the Capacity of Wireless Networks via Percolation Theory,” IEEE Trans. Information Theory, vol. 53, no. 3, pp. 1009- 1018, Mar. 2007.
[10]. V. Bonifaci, P. Korteweg, A. Marchetti-Spaccamela,
and L. Stougie,“An Approximation Algorithm for the Wireless Gathering Problem,” Operations Research Letters, vol. 36, pp. 605-608, 2008.

National Conference on Research Advances in Communication, Computation, Electrical Science and Structures (NCRACCESS-2015)
ISSN: 2348 – 8549 www.internationaljournalssrg.org Page 126
FUSION APPROACH FOR LAND MAP USING VERY-HIGH RESOLUTION SATELLITE IMAGES
P.Sudha, Assistant Professor,
Department of Electronics & Communication Engineering
Abstract
A new procedure is proposed for agricultural land mapping that addresses a known weakness of classical per-pixel methods in situations involving mixed tree crops. The proposed scheme uses a pair of very-high resolution satellite-brone panchromatic and multispectral images and integrates classification results of two parallel and independent analyses, respectively based on spectral and textural information. Median filtering is used in preprocessing of multispectral image. Spectral information can be obtained by fuzzy C-means clustering. The multispectral image is divided into spectrally homogeneous but non-contiguous segments using unsupervised classification. In parallel, the panchromatic image is split into a grid of square blocks on which is performed a texture-driven supervised classification. Local Fourier Histogram is used to perform texture analysis. Finally, the spectral and the textural classifications are fused to generate the land map. Keywords--- spectral, texture, land map, tree crops, classification, fusion.
I. INTRODUCTION
LAND-USE maps play an important role in
the environmental management. With the increasing availability and decreasing cost of the satellite imagery, along with the advanced image processing techniques, the automated land-use mapping using satellite-borne remote sensing (RS) images is now practically a viable procedure. The land-cover maps range from the simplest, e.g., thematic map showing water bodies in a landscape, snow cover or oil spills in the ocean to the most complex e.g., classification of crops or forest stands , or coastal land-cover. Traditionally, land-cover/land-use classifications have been extracted from multispectral (MS) optical images, panchromatic (PAN) optical images, or Synthetic Aperture Radar (SAR) images, as well as fusion of any two or all at different levels of abstraction. In most cases, the discriminative information is based on the pixel radiometry, even though different land-uses are not completely spectrally separable.
The problem of land-use classification
aggravated even more with the introduction of the very high resolution (VHR) images since 1999 as satellite images captured by Ikonos or Quick Bird became available. This is because higher resolution causes higher spectral variability within a class and lessens the statistical reparability among different classes in a traditional pixel-based classification. Therefore, classifying a pixel by using its own information alone is often regarded by the remote
sensing experts as insufficient; hence they emphasize the use of the spatial context in which the pixel occurs, i.e., the information on the neighboring pixels.
Using texture information might be the best way of taking into account the information on the neighboring pixels. Better land-use classification results, i.e., assignation of the type of crop to each Parcel, have been reported while using texture features than while classifying without them. Texture was also considered useful for segmenting high-resolution images, i.e., for delimitating the parcels containing the same type of crop. The problem of land-use classification remains non-trivial due to a multitude of complications. For instance, any two regions belonging to the same class as per ground-truth might have different image characteristics due to different vigor, health, stage of growth, phenology, weather conditions, soil type, different sensors, etc. Because of this multiplicity of complexities, spectral or textural information alone fails to bear successful classification results.
Recent developments thus tend to harness
the very high resolution of the remote sensing images combining the different image descriptors to increase separability among confused classes. Most publications report object-based or region-based classifications of the VHR optical RS images. These approaches are based on image segmentation before classification of the resulting segments: the process of image segmentation divides the image into spatially contiguous regions that are later classified

National Conference on Research Advances in Communication, Computation, Electrical Science and Structures (NCRACCESS-2015)
ISSN: 2348 – 8549 www.internationaljournalssrg.org Page 127
as single whole objects instead of classifying each pixel individually. Morphological features such as shape, area, length, width, perimeter, area/perimeter, and spectral and textural features are then used collectively to classify the regions. Although found more effective than the pixel-based classification, region-based approaches are apparently parametrically complex and computationally quite expensive as they require prior image-segmentation at different scales. Since most region-growing segmentation algorithms for remote sensing images need user-supplied parameters, one of the challenges for using these algorithms is selecting suitable parameters to ensure best quality results.
Another approach concentrates on effective
means of fusing different image characteristics to classify a remote sensing image. Considering the possible schemes, the examples of fusion include pixel-level, feature-level and decision-level fusion. The proposed approach is at the decision level merges the products of two independent and parallel processes: spectrum-driven unsupervised classification and texture-driven supervised classification. Thus, unlike region- or object-based methods that first segment the image into spatially contiguous regions to be classified afterwards, our approach first divides it into spectrally homogeneous segments that are not necessarily spatially contiguous. Because of their simplicity and easy handling, the Fuzzy C-means clustering and the Neural Network classifier are used for unsupervised and supervised classifications, respectively. A. Panchromatic (PAN) Image The PAN image was delivered with a resolution of 70 cm/pixel, with a frame of 2411 2122 pixels, and compressed in binary TIF format (thus containing 43 grey-levels only from 0 to 254). This reduction of radiometric contrast has possibly removed part of the information that could have been useful in discrimination of the land-use types. But, due to the use of Local Fourier Analysis, the proposed processing will even more drastically compress this digital number information without information loss. B. Multispectral (MS) Images
The MS image originally has four bands, including near infrared (NIR), red (R), green (G), and blue (B) bands, acquired at the spatial resolution of 2.8 m/pixel. But the blue band provides with very
faint reflectance variability and is not very discriminative for vegetation. Hence, only the first three spectral bands (NIR, R, and G) were pan-sharpened to enhance their spatial resolution, using the pixel-level fusion based on the Brovey transform that performs better with three bands only.
Figure 1. Remote sensing image
This resulted in a new multispectral image, the one used in this study, of 2411 2122 pixels, having the resolution of 70 cm/pixel in all the three bands (NIR, R, and G).B. Multispectral (MS) Images
The MS image originally has four bands, including near infrared (NIR), red (R), green (G), and blue (B) bands, acquired at the spatial resolution of 2.8 m/pixel. But the blue band provides with very faint reflectance variability and is not very discriminative for vegetation.
Hence, only the first three spectral bands (NIR, R, and G) were pan-sharpened to enhance their spatial resolution, using the pixel-level fusion based on the Brovey transform that performs better with three bands only. This resulted in a new multispectral image, the one used in this study, of 2411 2122 pixels, having the resolution of 70 cm/pixel in all the three bands (NIR, R, and G). II. CLASSIFICATION PROCEDURES AND FUSION SCHEME
The spectral information from the MS image is used to perform an unsupervised classification that leads to a segmentation of the space of study, and the textural information extracted from the

National Conference on Research Advances in Communication, Computation, Electrical Science and Structures (NCRACCESS-2015)
ISSN: 2348 – 8549 www.internationaljournalssrg.org Page 128
panchromatic image is used to perform a supervised classification of the different land-use types based on their structure. The
Figure 2. Land use mapping process
two results are then merged to obtain the optimal result combining both spatial and thematic information, merging border information from the spectrally-segmented image and the land-use type obtained from the texture-classified image. The following subsections explain the spectral and textural analysis along with the two procedures.
A. Spectral Analysis And Segmentation Basically, image segmentation divides an
image into spatially contiguous, disjunctive, and spectrally homogenous regions. In this work, we perform what is usually referred to as global segmentation, using an algorithm of unsupervised spectral classification, also known as clustering. But this may lead to spectrally homogenous clusters that are not necessarily spatially contiguous and may consequently result in the so called “salt and pepper
effect”. To alleviate this effect, we pre-processed the multispectral imagery with a Median filter having the dimensions of 9x9 pixels. Smaller the value of the standard deviation more is the “salt and pepper
effect” in the segmentation result, i.e., more errors within a region of thematically homogeneous class. On the other hand, larger filter size results in the so-called boundary effect .After several evaluation tests, the value of were found to be the optimal one.
The 3-value feature corresponding to the
radiometry in the three spectral bands [NIR, R, G] is used to describe each pixel spectrally. Fuzzy C-means clustering groups the pixels into a number of clusters using the Euclidean distance as the criterion for dissimilarity between the pixels. The clustering process is made to over-segment a test-image into a
number of clusters that is greater than the number of classes found therein. Hence the image segmented this way divides the regions with a single thematic class, i.e., land-use type, into two or more clusters, i.e., spectral classes.
1. Median filtering Median filtering is useful for reducing the
impulse noise and periodic patterns. To obtain the median of m x n numbers, the average number of comparisons is typically proportional to m x n assuming the original ordering is random. The fast algorithm we report here requires only approximately (2n + 10) comparisons.
A fast median filtering algorithm is developed which is based on storing the gray level histogram of the mn picture elements (pels) in the window, and updating it as the window moves. Algorithm steps:
Step I: Set up the gray level histogram of the first window and find the median. Also, make the count, ltmdn of the number of pels with gray level less than the median.
Step 2: Move to the next window by deleting the leftmost column of the (previous) window and adding one column to the right. The histogram is updated. So is the count ltmdn.
Now ltmdn stores the number of pels in the current window having gray levels less than the median of the previous window.
Step 3: Starting from the median of the previous window, we move up/down the histogram bins one at a time if the count ltmdn is not greaterthan number of pels in a window divided by 21 and update the count ltmdn until the median bin is reached.
Step 4: Stop if the end of the line is reached. Otherwise go to Step 2.
2. Fuzzy c-means clustering
A method for using fuzzy c-means (FCM)
clustering algorithm as a supervised classifier. Fuzzy sets provide useful concepts and tools to deal with the uncertainty inherent in the remote sensing spectral data. Partial membership allows one to efficiently take into account the class mixtures in a single pixel, as well as the derivation of spectral signatures within a class.
Let I={xi |i=1,…..,N} denote a spectral data
set of dimension N, where xi={xi |j=1,…..,p} is a
vector of the reflectance measurements of the pixel i. The vector I can be clustered into

National Conference on Research Advances in Communication, Computation, Electrical Science and Structures (NCRACCESS-2015)
ISSN: 2348 – 8549 www.internationaljournalssrg.org Page 129
U={Uik |i=1,….c;k = 1,…,N} c-partitions by minimizing an objective function:
J= uikmc
k=1Ni=1 ∥ xi − vk∥
2 Where vi ; i ∈ [1, c] are the class signatures.
The membership matrix U has the following properties:
U = {ui ∈ [0,1]│ uik
c
k=1
= 1,⩝ i; 0 < 𝑁,⩝ 𝑘}
The parameter m∈ [1,∞) is a weighting
exponent on each fuzzy membership. Minimization of the above objective function, J, calls for the membership values to be defined as
ui = Dik
Djk
2m−1
c
j=1
−1
,⩝ i, k
Where Dik = ∥ xi − vk∥ is the distance measure between the feature vector xi and the cluster center vk . Using this algorithm as a supervised classifier, the cluster centers are given an intial location from the sample data (vk
0), and are iteratively updated by
Vk=
uikmN
i=1 xk
uikmN
i=1
,⩝ i
The FCM algorithm is usually used as an unsupervised clustering technique, where no training data is provided. Here, it is used as a supervised classifier; in this sense, the algorithm can be non-iterative to reduce computation time, or iterative to improve accuracy. By defining the class centers a priori, the data are partially classified by calculating the membership values for each class, then the image data is classified by assigning classes through hardening the matrix U, i.e. assigning classes by highest membership. The process of the FCM algorithm can be summarized in the following steps:
1. Built the initial class centers(vk0) from
sample data. 2. Find membership values uik using
ui = Dik
Djk
2m−1
c
j=1
−1
,⩝ i, k
3. (non-iteratively) classify each pixel by hardening the matrix U according to the maximum membership criteria.
Vk=
uikmN
i=1 xk
uikmN
i=1
,⩝ i
4. (iteratively) Calculate the new class centers using , then repeat until the class movement is less than a small threshold Ɛ.
B. Textural Analysis And Classification
1. Texture descriptors Rotation-invariant texture features based on
Local Fourier Histograms (LFH) are used to perform textural analysis on the PAN image. This method is quite adapted to the kind of tree-crops that compose the different land-use types, mainly orchards and groves, which are not very contrasted in radiometry but rather well spatially organized. Indeed Fourier transform has a great ability in discriminating regular and periodic patterns like lines or grids of trees. Although, as it is just a method for extracting texture descriptors among others, any texture feature method could be used in the same framework instead of LFH-based, as long as it is relevant for the given application. Nevertheless, accuracy of the land-use classification was worse than with LFH-based features, with some high confusion, for example, between classes “vineyard” and “crop”, or “fallow” and “orchard 3”.
These LFH-based texture features are in fact extracted from the eight neighboring pixels around each image-pixel.
Digital numbers of these eight neighboring pixels lead to a 1-D sequence on which the Discrete Fourier Transform (DFT) is computed. The magnitudes of the first five DFT coefficients are used as texture signatures. Each of these signatures is later histogram med into 8 bins over a bigger neighborhood to form the 40-value vector that describes the texture of that image neighborhood. As experiments show that the LFH-based texture features extraction perform best with 32 grey levels, the PAN image was quantized to 32 levels before the feature extraction. This quantization does not decrease the process discrimination ability thanks to the nature of the land-use textures, which are distinguished due to the variations of organization of the grey levels rather than the variations of these grey levels themselves.
2. The neural network classifier and its training
Artificial neural networks have become valuable computational tools for tasks such as pattern recognition. The goal of this classifier is to enhance the ability of a neural network classifier with the concepts and tools those fuzzy logic providers. In this system, fuzzy membership values using from the FCM algorithm provide input to a multi-layer feed forward neural network classifier. Using fuzzy membership values as inputs to the network allows the classifier to function with a much smaller hidden layer than if raw data is used,

National Conference on Research Advances in Communication, Computation, Electrical Science and Structures (NCRACCESS-2015)
ISSN: 2348 – 8549 www.internationaljournalssrg.org Page 130
since the fuzzy membership values give partial classification. Introducing a neural network to the supervised FCM algorithm provides significant benefits to the operation of the classifier. The FCM algorithm provides a weighting exponent m to adjust the importance of memberships for certain features of the input vector. However, no straightforward technique is available for determining the value of this variable.
By contrast, a neural network can introduce automatic feature selection for the input data, making this weighting exponent unnecessary. Also, neural networks are distribution free and can define more complex and arbitrary decision boundaries, which makes possible better class separation by considering not just maximum class membership, but also membership values in other classes.
A feed-forward neural network with a single
hidden layer and perceptrons using continues activation functions are used in this classifier. The topology of this network is defined both by the dimension of the input vector and the number of classes defined. The input to the network is provided by the fuzzy membership for each of the features in the input vector at each of the defined classes, so the input layer is of size N x c for an N- dimensional vector with c defined classes. The output layer is chosen to provide binary encoding of the output, so it must be at least [log2 c] in size.
This algorithm can effectively classify an
image scene without depending upon an accurate statistical model of the classes, which is a significant advantage over the ML classifier as this model may not be available.
This algorithm can effectively classify an image scene without depending upon an accurate statistical model of the classes, which is a significant advantage over the ML classifier as this model may not be available. However, neglecting class covariance and relying only on absolute distance from center positions can produce inferior labeling if class positions are highly overlapping (closely intermingled). Furthermore, the iterative nature of this algorithm makes it much more computationally complex than maximum likelihood. The concept of fuzzy membership is a powerful tool however; so to build on this idea, two new methods are.
X(the set offeature vectors)
V(Library Signature)
yes
Figure 3. Flowchart of the supervised FCM algorithm presented next which improve this supervised fuzzy c-means (S-FCM) algorithm. III.RESULTS AND DISCUSSIONS
A given agricultural land-use may vary spectrally quite largely depending on the climate, weather conditions and many other factors. However, whatever is the climate and weather conditions, different land-uses remain spectrally dissimilar. Here multispectral image is processed to identify different spectral regions. In preprocessing, median filter is used to remove salt and pepper noise in MS image. FCM classifier classified the different spectral regions in the MS image.
Figure 4. Median filtered image
D = x − v
Find liner distances
𝐮
Calculate class
membership values
𝑉𝑡+1 𝑉𝑡 < 𝜀?
𝐯𝐨 ± 𝛔
Update class centers as
needed
STOP

National Conference on Research Advances in Communication, Computation, Electrical Science and Structures (NCRACCESS-2015)
ISSN: 2348 – 8549 www.internationaljournalssrg.org Page 131
Figure 5. Output FCM algorithm
Figure 6. Edge detected image
REFRENCES
[1]. Ahsan Ahmad Ursani, KidiyoKpalma, Camille C. D. Lelong, and Joseph Ronsin,” Fusion of Textural and Spectral
Information for Tree Crop and Other Agricultural Cover Mapping With Very-High Resolution Satellite Images”2012,
IEEE JOURNAL,VOL.,5,NO.1,FEBRAUARY 2012. [2].Ahsan Ahmad Ursani, Abdul WaheedUmrani, and Fahim Aziz Umrani,” Unsupervised Texture Segmentation:
Comparison of Texture Features”2010. [3].Feng Zhou, Ju-fuFeng, Qing-yum Shi,”Texture feature based
on local fourier transform”2001,Remote Sensing of
Environment 80(2002) 185-201.
[4].Giles Foody.M”Status of land cover classification accuracy
assesment”2001. [5].Karthikeyan.B,A.Sarkar,K.L.Majumder,”A segmentation
approach to classification of remote sensing imagery”,INT.J.REMOTE SENSING,1998,VOL.19,1695-1709. [6].Kotsiantis.S.B,”Supervised Machine Learning:A Review of Classification Techniques”2007 , Informatic 31(2007) 249-268. [7]. Russell Congalton.G,” A Review of Assessing the Accuracy of Classifications of Remotely Sensed Data”1991,REMOTE
SENS ENVIRON.37,35-46(1991). [8].Zuyuan Wang, RuediBoesch, Christian Ginzler,” Integration
of high resolution aerial images and airborne lidar data for forest delineation”2008.
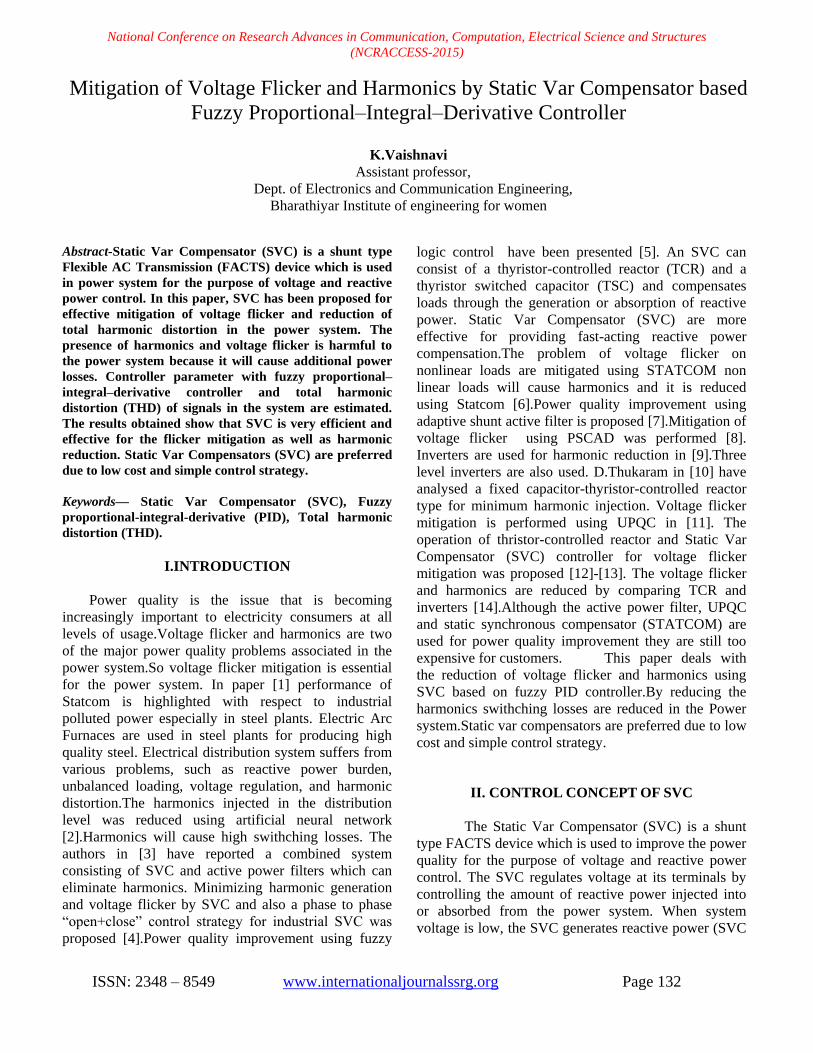
National Conference on Research Advances in Communication, Computation, Electrical Science and Structures (NCRACCESS-2015)
ISSN: 2348 – 8549 www.internationaljournalssrg.org Page 132
Abstract-Static Var Compensator (SVC) is a shunt type Flexible AC Transmission (FACTS) device which is used in power system for the purpose of voltage and reactive power control. In this paper, SVC has been proposed for effective mitigation of voltage flicker and reduction of total harmonic distortion in the power system. The presence of harmonics and voltage flicker is harmful to the power system because it will cause additional power losses. Controller parameter with fuzzy proportional–integral–derivative controller and total harmonic distortion (THD) of signals in the system are estimated. The results obtained show that SVC is very efficient and effective for the flicker mitigation as well as harmonic reduction. Static Var Compensators (SVC) are preferred due to low cost and simple control strategy. Keywords— Static Var Compensator (SVC), Fuzzy proportional-integral-derivative (PID), Total harmonic distortion (THD).
I.INTRODUCTION
Power quality is the issue that is becoming increasingly important to electricity consumers at all levels of usage.Voltage flicker and harmonics are two of the major power quality problems associated in the power system.So voltage flicker mitigation is essential for the power system. In paper [1] performance of Statcom is highlighted with respect to industrial polluted power especially in steel plants. Electric Arc Furnaces are used in steel plants for producing high quality steel. Electrical distribution system suffers from various problems, such as reactive power burden, unbalanced loading, voltage regulation, and harmonic distortion.The harmonics injected in the distribution level was reduced using artificial neural network [2].Harmonics will cause high swithching losses. The authors in [3] have reported a combined system consisting of SVC and active power filters which can eliminate harmonics. Minimizing harmonic generation and voltage flicker by SVC and also a phase to phase ―open+close‖ control strategy for industrial SVC was
proposed [4].Power quality improvement using fuzzy
logic control have been presented [5]. An SVC can consist of a thyristor-controlled reactor (TCR) and a thyristor switched capacitor (TSC) and compensates loads through the generation or absorption of reactive power. Static Var Compensator (SVC) are more effective for providing fast-acting reactive power compensation.The problem of voltage flicker on nonlinear loads are mitigated using STATCOM non linear loads will cause harmonics and it is reduced using Statcom [6].Power quality improvement using adaptive shunt active filter is proposed [7].Mitigation of voltage flicker using PSCAD was performed [8]. Inverters are used for harmonic reduction in [9].Three level inverters are also used. D.Thukaram in [10] have analysed a fixed capacitor-thyristor-controlled reactor type for minimum harmonic injection. Voltage flicker mitigation is performed using UPQC in [11]. The operation of thristor-controlled reactor and Static Var Compensator (SVC) controller for voltage flicker mitigation was proposed [12]-[13]. The voltage flicker and harmonics are reduced by comparing TCR and inverters [14].Although the active power filter, UPQC and static synchronous compensator (STATCOM) are used for power quality improvement they are still too expensive for customers. This paper deals with the reduction of voltage flicker and harmonics using SVC based on fuzzy PID controller.By reducing the harmonics swithching losses are reduced in the Power system.Static var compensators are preferred due to low cost and simple control strategy.
II. CONTROL CONCEPT OF SVC
The Static Var Compensator (SVC) is a shunt type FACTS device which is used to improve the power quality for the purpose of voltage and reactive power control. The SVC regulates voltage at its terminals by controlling the amount of reactive power injected into or absorbed from the power system. When system voltage is low, the SVC generates reactive power (SVC
Mitigation of Voltage Flicker and Harmonics by Static Var Compensator based Fuzzy Proportional–Integral–Derivative Controller
K.Vaishnavi
Assistant professor, Dept. of Electronics and Communication Engineering,
Bharathiyar Institute of engineering for women

National Conference on Research Advances in Communication, Computation, Electrical Science and Structures (NCRACCESS-2015)
ISSN: 2348 – 8549 www.internationaljournalssrg.org Page 133
capacitive). When system voltage is high, it absorbs reactive power (SVC inductive). The variation of reactive power is performed by switching three-phase capacitor banks and inductor banks connected on the secondary side of a coupling transformer. Each capacitor bank is switched on and off by three thyristor switches (Thyristor Switched Capacitor or TSC).
Reactors are either switched on-off (Thyristor Switched Reactor or TSR) or phase-controlled (Thyristor Controlled Reactor or TCR). The TSC branches are tuned with the series reactor to different dominant harmonic frequencies.Electronic rectifiers applied to electrolysis power supply and machines need large amount of reactive power. The use of AC arc furnace usually comes with heavy harmonics and large negative sequence current. Large amount of reactive power demand and reactive power variation result in the voltage fluctuation and flicker, which also reduces the efficiency.
Fig.1 Schematic diagram of an SVC
SVC system can not only supply sufficient reactive
power, but also eliminate the harmonics generated by rectifiers and prevent equipments from voltage fluctuation and flicker.
III.SYSTEM MODELLING
Consider the single line diagram of a system as shown in fig.2.It is widely known that the voltage fluctuations at the point of connection are mainly caused by a rapid change in the reactive power of the load. The TCR can quickly alter the inductive current of a device in a continuous way by changing the firing angle of the thyristor, connected in series with the
reactor, and thus adjust the reactive power as the system demands. Using a suitable controller for the control of the reactive power of the SVC, the voltage fluctuations can be decreased to an acceptable level. The control algorithm is essential for a proper and efficient operation of the TCR. Fig.2 Simplified representation of Single line diagram with SVC
A Static Var Compensator (SVC) is used to regulate voltage on a 735-kV distribution line. The network model involves a high-voltage network equivalent with its short-circuit reactance and resistance network. The 600-V load connected to bus B3 through a 35kV/600V transformer represents a plant absorbing continuously changing currents, similar to an arc furnace, thus producing voltage flicker. The variable load current magnitude is modulated at a frequency of 50 Hz so that its apparent power varies approximately between 6000 MVA and 100 MVA. This load variation will allow you to observe the ability of the SVC to mitigate voltage flicker. The SVC regulates bus B2 voltage by absorbing or generating reactive power. This reactive power transfer is done through the leakage reactance of the coupling transformer by generating a secondary voltage in phase with the primary voltage (network side). This voltage is provided by a voltage-sourced PWM inverter. When the secondary voltage is lower than the bus voltage, the SVC acts like an inductance absorbing reactive power. When the secondary voltage is higher than the bus voltage, the SVC acts like a capacitor generating reactive power.
IV.FUZZY LOGIC PID CONTROLLER
4.1. PID CONTROLLER
A PID controller responds to an error signal in a closed control loop and attempts to adjust the controlled quantity to achieve the desired system response. The controlled parameter can be any measurable system quantity such as error and change of error. The benefit of the PID controller is that it can be adjusted empirically by adjusting one or more gain values and observing the change in system response.

National Conference on Research Advances in Communication, Computation, Electrical Science and Structures (NCRACCESS-2015)
ISSN: 2348 – 8549 www.internationaljournalssrg.org Page 134
4.2. FUZZY LOGIC PID CONTROLLER
In FLC, basic control action is determined by a set of linguistic rules. These rules are determined by the system. Since the numerical variables are converted into linguistic variables, mathematical modeling of the system is not required in FC.A fuzzy logic controller has four main components as shown in Figure:
i).Fuzzification
ii).Inference engine
iii).Rule base
iv).Defuzzification Fuzzy logic is based on linguistic variables.The
first step in designing fuzzy inference mechanism is to identify effective input variables and output decision variables, and then qualify them with membership functions. Membership functions determine that how variables belong to a fuzzy set. This process is called fuzzification. After fuzzification, we should define rules based on linguistic variables and the physical dynamic of the system. Then fuzzy inference mechanism determines effective rules and based on these rules, decision variables are produced. Finally the fuzzy decision variables are converted to real numbers through the process of defuzzification.
In order to define fuzzy membership function (MF), designers choose many different shapes based on their preference and experience. There are generally four types of membership functions used:
i). Trapezoidal MF
ii).Triangular MF
iii).Gaussian MF
iv).Generalized bell MF
Fig.3 Schematic representation of Fuzzy Logic Controller.
Implementation of an FLC requires the choice of four key factors i) Number of fuzzy sets that constitute linguistic variables. ii) Mapping of the measurements onto the support sets. iii) Control protocol that determines the controller behaviour. iv) Shape of membership functions.
PID parameters fuzzy self-tuning is to find the fuzzy relationship between the three parameters of PID and "e" and"de", and according to the principle of fuzzy control, to modify the three parameters in order to meet different requirements for control parameters when "e" and "de" are different, and to make the control object a good dynamic and static performance. 4.3. ADJUSTING FUZZY MEMBERSHIP FUNCTIONS AND RULES
In order to improve the performance of FLC, the rules and membership functions are adjusted. The membership functions are adjusted by making the area of membership functions near ZE region narrower to produce finer control resolution. On the other hand, making the area far from ZE region wider gives faster control response. Also the performance can be improved by changing the severity of rules .An experiment to study the effect of rise time (Tr), maximum overshoot (Mp) and steady-state error (SSE) when varying KP, KI and KD was conducted. The results of the experiment were used to develop 25-rules for the FLC of KP, KI and KD are the output variables and from error and change of error are the input variables. Triangular membership functions are selected.
Fig.4 Block diagram of Fuzzy PID Controller

National Conference on Research Advances in Communication, Computation, Electrical Science and Structures (NCRACCESS-2015)
ISSN: 2348 – 8549 www.internationaljournalssrg.org Page 135
Fig.5aMembership Function for Input Variable Error, ‗e‘.
Fig .5b Membership Function for Input Variable Change in Error, ‗ce‘.
Fig .5c Membership Function for Output Variable Change in Control Signal, ‗u‘. Table:1 Rule Base for Fuzzy logic controller
V.SIMULATION RESULTS
Fig. 6 shows the voltage flicker in p.u. at the 35-kV voltage level without connecting SVC. The figure clearly shows the oscillations of the RMS voltage that
cause the appearance of flicker in the electric power system.
Fig.6 Voltage flicker without SVC
Fig.7 shows the harmonics generated due to nonlinear load consumption. Without connecting SVC, the THD obtained is 22.17%.
Fig.7 Total harmonic distortion without SVC.
The voltage and current waveforms at the 35-kV voltage level with a connected SVC in p.u. are shown in Fig. 8
Fig.8 Voltage and Current waveform.
The simulation of the realistic model with the SVC connected at the 35-kV voltage level was performed. Waveforms of the simulated signals of the

National Conference on Research Advances in Communication, Computation, Electrical Science and Structures (NCRACCESS-2015)
ISSN: 2348 – 8549 www.internationaljournalssrg.org Page 136
active and reactive power can be seen in Fig. 9 and Fig.10.
Fig.9 Active Power with SVC
Fig.10 Reactive Power with SVC.
Fig.11 shows the voltage flicker in p.u. at the 35-kV voltage level connecting SVC. It shows the oscillations of the RMS voltage that cause the appearance of flicker in the electric power system. By connecting fuzzy PID controller based SVC , voltage flicker reduces to 1.2p.u.
Fig.11 Voltage flicker with SVC
The result obtained by connecting SVC is shown in the Fig.12.The THD obtained by connecting SVC is 1.41%.
Fig.12 Total harmonic distortion with SVC.
Thus by comparing Fig.6 and Fig.11 we can see that by connecting SVC the voltage flicker is reduced to 1.2 p.u and by comparing Fig.7 and Fig.12 the THD is reduced to 1.41%.
TABLE.2 PERFORMANCE OF SVC.
FLICKER(p.u) THD (%)
WITHOUT SVC
22.17%
WITH SVC 1.41%
VI.CONCULSION
SVCs are preferred for varying loads due to low cost and simple control strategy. This paper demonstrates mitigation of voltage flicker and harmonic reduction with and without SVC using fuzzy PID contoller. When voltage is low SVC generate reactive power.The simulation results shows how the SVC device improve the power quality. With MATLAB simulations it is observed that SVC provides an effective reactive power control irrespective of load variation and reduce voltage flicker and harmonics.
REFERENCES
[1].P.M.Sarma, Dr.S.V.Jayaram Kumar,‖Electric Arc Furnace
Flicker Mitigation in a Steel Plant Using a Statcom ,‖
International Journal of Engineering Science and Innovative Technology (IJESIT) Volume 2, Issue 1, January 2013.
[2].G.R.Udupi, Deepak Balkrishna Kulkarni ―ANN-Based SVC Swithching at Distribution Level for Minimal-Injected Harmonics,‖IEEE Transactions on power delivery,Vol.25,no.3, July 2010

National Conference on Research Advances in Communication, Computation, Electrical Science and Structures (NCRACCESS-2015)
ISSN: 2348 – 8549 www.internationaljournalssrg.org Page 137
[3].A.Luo, Z.Shuai, W.Zhu, and Z.J.Shen,‖Combined system for
harmonic suppression and reactive power compensation ,‖IEEE
Trans.Ind.Electron.,vol.56, no.2, pp.418-428, Feb.2009 [4].Juanjuan Wang, Chuang fu, and Yao Zhang, ―SVC control
system based on instantaneous reactive power theory and fuzzy PID‖, IEEE Transactions on Industrial electronics, vol. 55, no. 4, April 2008.
[5].D. B. Kulkarni and G. R. Udupi, ―Harmonic minimizing fuzzy
logic controller for SVC used for fluctuating loads,‖ presented
at the National Power Systems Conf., Roorkee, India, 2006 [6].Cong Han ,ZhanoningYang,Bin Chen, Alex Q.Huang,Bin
Zhang, Mike Ingra and AtyEdris,‖Evaluation of Cascade Based
STATCOM for Arc Furance Flicker mitigation,‖ 14th IAS Annual Meeting,2005,pp.67-71
[7].L.H.Tey,P.L. So, and Y. C. Chu, ―Improvement of power quality
using adaptive shunt active filter,‖ IEEE Trans. Power Del., vol. 20, no. 2, pp. 1558–1568, Apr. 2005.
[8].C.Sharmela, G.Uma, M.R.Mohan and K.Karthikeyan, ‖Voltage Flicker Analysis and mitigation case study in Electric arc Furnace using PSCAD‖,IEEE International Conf.on Power
System Tech.,2004 [9].J. H. R Enslin and P. J. M. Heskes, ―Harmonic interaction
between a large number of distributed power inverters and the distribution network,‖ IEEETrans. Power Electron., vol. 19, no. 6, pp. 1586–1593, Nov. 2004.
[10].D.Thukaram, H.P.Khincha, and B.Ravikumar, ―Harmonic
minimization in the operation of static VAR compensators for unbalanced reactive power compensation,‖ presented at the Int. Conf. Power System Technology, Singapore, 2004.
[11].A.Elnady,W.El-Khattam and M.M.A.Salama, ‖Mitigation of
AC Arc Furnace Voltage Flicker using the unified power quality conditioner‖.IEEE power Engineering Society Winter
Meeting,Vol.2,2002, pp.735-739. [12].S. K. Jain, P. Agrawal, and H. O. Gupta, ―Fuzzy logic
controlled shunt active power filter for power quality improvement,‖ Proc. Inst. Electr.Eng.—Electr. Power Appl., vol. 149, no. 5, pp. 317–328, Sep. 2002
[13].G.E1-Saady,‖Adaptive static VAR controller for simultaneous elimination of voltage flicker and phase current imbalances due to arc furnaces loads,‖Elect.power Syst.Res.,vol.58,no.3,pp.133-140,Jul.2001.
[14].A. García-Cerrada, P.García-González, R.Collantes, T.Gómez, and J.Anzola, ―Comparison of thyristor-controlled reactors and voltage source inverters for compensation of flicker caused by arc furnaces,‖ IEEETrans. Power Del., vol. 15, no. 4, pp. 1225–
1231, Oct. 2000.

Clustering Based Moving Target Detection in Wireless Sensor Networks
Sowmiya.P1, Suganya.B2 Communication Systems
Bharathiyar Institute of Engineering for Women ([email protected]), ([email protected])
Abstract- Wireless sensor networks (WSNs) deployed for mission critical applications face the fundamental challenge of meeting stringent spatiotemporal performance requirements using nodes with limited sensing capacity. Although advance network planning and dense node deployment may initially achieve the required performance, they often fail to adapt to the unpredictability of physical reality. This paper explores efficient use of mobile sensors to address the limitations of static WSNs in target detection. We propose a data fusion model that enables static and mobile sensors to effectively collaborate in target detection. An optimal sensor movement scheduling algorithm is developed to minimize the total moving distance of sensors while achieving a set of spatiotemporal performance requirements including high detection probability, low system false alarm rate and bounded detection delay. The effectiveness of our approach is validated by extensive simulations based on real data traces collected by 23 sensor nodes.
Index Terms—Data fusion, algorithm/protocol design and analysis, wireless sensor networks.
I. INTRODUCTION
Deploying wireless sensor networks (WSNs) for mission critical applications (such as intruder detection and tracking) often faces the fundamental challenge of meeting stringent spatial and temporal performance requirements imposed by users. For instance, a surveillance application may require any intruder to be detected with a high probability (e.g., > 90%), a low false alarm rate (e.g., < 1%), and a bounded delay (e.g., 20s). Due to the limited capability and unreliable nature of low-power sensor nodes, over-provisioning of sensing coverage seems to be the only choice for a static sensor network to meet such stringent performance requirements. However, over-provisioning only works up to the point where the reality meets the original expectation about the characteristics of physical phenomena and environments. If a new on-demand task arise after deployment and its requirements exceed the statically planned network capability, the task could not be accomplished. For instance, in a battlefield monitoring scenario, sensor failures in a small region may lead to a perimeter breach and the sensor nodes
deployed in other regions become useless. To better cope with the unpredictability and variability of physical reality and improve the agility of sensor networks, mobile sensors can be introduced to dynamically reconfigure the sensor network capability in an on-demand manner. In a static-mobile hybrid sensor network, the mobile sensors can move close to targets and increase the signal-to- noise ratio and the fidelity of detection results beyond what can be achieved by static sensor nodes alone in many situations. Furthermore, efficient collaboration between mobile and static nodes could effectively change sensing densities on demand, potentially reducing the number of sensors needed comparing to all-static network deployments. However, several challenges must be addressed in order to take advantage of the mobility of WSNs in target detection. First, due to the higher design complexity and manufacturing cost, the number of mobile nodes available in a network is often limited.
Therefore, mobile sensors must effectively collaborate with static sensors to achieve the maximum utility. Second, mobile sensors are only capable of low-speed and short-distance movement in practice due to the high power consumption of locomotion..Therefore, the movement of mobile sensors must be efficiently scheduled in order to maximize the amount of target information gathered within a short moving distance. In this paper, we propose a data-fusion centric target detection model that features effective collaboration between static and mobile sensors. We derive an optimal sensor movement scheduling algorithm that minimizes the total moving distance of sensors under a set of spatiotemporal performance requirements including (1) bounded detection delay, (2) high target detection probability, and (3) low system false alarm rate.
Furthermore, we conduct extensive simulations based on real data traces collected by 23 sensors in the SensIT vehicle detection experiments . Our results show that a small number of mobile sensors can significantly boost the detection performance of a network. Moreover, our movement scheduling algorithm can achieve satisfactory performance in a range of realistic scenarios..

II. RELATED WORK
Recent work demonstrated that the sensing performance of WSNs can be improved by integrating mobility. Several projects proposed to eliminate coverage holes in a sensing field by relocating mobile sensors. Although such an approach improves the sensing coverage of a network deployment, it does not dynamically improve the network’s performance after targets of
interest appear. Complementary to these projects, we focus on online sensor collaboration and movement scheduling strategies that are used after the appearance of targets. In our recent work, we proposed a decision fusion based detection model in which each mobile sensor makes its own detection decision and locally controls its movement. In this paper, we adopt a value fusion based detection model that significantly simplifies the task of mobile sensors. Specifically, each mobile sensor in a detection process is only required to move a certain distance and send its measurements to its cluster head. Such a model is more suitable for mobile sensors with limited capability of signal processing and motion control. In contrast, a mobile sensor in the algorithm proposed in must be able to locally detect targets and adaptively control their movement. Moreover, this paper studies several important issues that are not addressed in such as optimal movement scheduling. Several recent studies analyzed the impact of mobility on detection delay and area coverage. These studies are based on random mobility model and do not address the issue of actively controlling the movement of sensors. We study efficient sensor collaboration and movement scheduling strategies that achieve specified target detection performance. Mobile sensors that can move reactively are used in networked robotic sensor architecture to improve the sampling density over a region. However, they did not focus on target detection under spatiotemporal performance constraints. Data fusion in target detection has been extensively studied. Network protocols that facilitate target detection and tracking have also been investigated. Complementary to these studies that deal with the mobility of targets, we focus on improving detection performance by exploiting the mobility of sensors.
III. PRELIMINARIES
A. Node deployment
The mobile nodes are designed and configured dynamically, designed to employ across the network, the nodes are set according to the X, Y, Z dimension, which the nodes have the direct transmission range to all other nodes. All the mobile nodes tend to have a unique id for its
identification process, since the mobile nodes communicates with other nodes through its own network id. If any mobile node opted out of the network then the particular node should surrender its network id to the head node.
B. Cluster head generation
The process of grouping the sensor nodes in a densely deployed large-scale sensor network is known as clustering. The intelligent way to combine and compress the data belonging to a single cluster is known as data aggregation in cluster based environment. There are some issues involved with the process of clustering in a wireless sensor network. First issue is, how many clusters should be formed that could optimize some performance parameter. Second could be how many nodes should be taken in to a single cluster. Third important issue is the selection procedure of cluster-head in a cluster. Another issue is that user can put some more powerful nodes, in terms of energy, in the network which can act as a cluster-head and other simple node work as cluster-member only.
Fig. 1 Cluster Head Generation
Nodes should be organized into clusters to track a mobile target. Initially sensor nodes randomly clustered and assumed to have some faulty/damaged nodes. It is randomly set after initialization. If a target is detected by a node after a time window, a target is detected by another node. It is assumed to be the same target. This assumption is made because the target does not carry any form of classification, nor can any different target be distinguished. Once the clusters are generated then for each cluster a cluster head will be created. It is done by using optimal node selection algorithm. We assume that the network is organized into clusters. Sensors send their energy measurements to the cluster head, which in turn compares the average of all measurements to a threshold η. If the average is greater than η
(referred to as the detection threshold), the cluster

head decides that a target is present. Otherwise, it decides there is no target.
C. Multi-sensor Fusion Model
This paper proposed a decision fusion based detection model in which each mobile sensor makes its own detection decision and locally controls its movement. This paper adopts a value fusion based detection model that significantly simplifies the task of mobile sensors. Specifically, each mobile sensor in a detection process is only required to move a certain distance and send its measurements to its cluster head. Such a model is more suitable for mobile sensors with limited capability of signal processing and motion control. Initially, all sensors periodically send the measurements to the cluster head that compares the average energy against a threshold.
Fig.3 Data Flow Diagram
We employ the following data-fusion model. Initially, all sensors periodically send the measurements to the cluster head that compares the average energy against a threshold λ1. Once a positive detection decision is made, the cluster head initiates the second phase of detection by sending mobile sensors a movement schedule S that specifies which sensors should move, the time instances to start moving and the distances to move. Mobile sensors then move toward the surveillance location according to the schedule.
D. Movement schedule
We present an optimal movement scheduling algorithm that enables sensors to gather the maximum amount of energy for a given number of moves. Once a positive detection decision is made, the cluster head initiates the second phase of detection by sending a movement schedule to a mobile sensors that specifies which sensors should move, the time instances to start moving and the distances to move.
Fig. 4 Two Examples of Sensor Movement Scheduling
Mobile and static sensors are represented by solid and void circles, respectively. When the maximum movement delay is 5 seconds, sensor x moves 5 m toward the target. When the maximum movement delay is 5 seconds, the sensors x, y and z move 2.5m towards the target. Mobile sensors then move toward the surveillance location according to the schedule.Suppose the optimal movement schedule has H moves and there is only one sensor i. Obviously, the measured energy always decreases with i’s distance to the target and increases with the sensing duration. Therefore, the optimal schedule for i is to move H steps consecutively from time zero, which allows it to sense at the closest location possible at any time instance. This is because sensors can move in parallel and hence optimizing the movement of each sensor individually maximizes the total amount of energy sensed by all sensors.
E. Two-phase detection model
The performance of detection is characterized by the probability of false alarm (PF) (or false alarm rate) and probability of detection (PD). PF is the probability that a target is regarded to be present when the target is actually absent. PD is the probability that a target is correctly detected. After a certain delay, all sensors send the cluster head the sum of their energy measurements and the
Sensor nodes
Probability of false rate (PF)
Cluster formation
Create head for each cluster
Two phase detection model
Movement schedule
Multi sensor fusion model
Probability of detection (PD)

final detection decision is then made by comparing against another threshold. A key advantage of the above two-phase detection model is the reduced total distance of moving as the mobile sensors move in a reactive manner. Moreover, this model facilitates the collaboration between static and mobile sensors. As the decision of the first phase is made based on the measurements of all sensors in a cluster, the static sensors help filter out false alarms that would trigger unnecessary movement of mobile sensors. In addition, the accuracy of the final detection decision is improved in the second phase because the signal to noise ratios (SNR) are increased as the mobile sensors move closer to the surveillance location.
IV. SIMULATION
A. Impact of the Number of Mobiles
To evaluate the impact of mobility on system detection performance, we plot four receiver operating characteristic (ROC) curves in Fig.4. ROC curves characterize a detection system’s
achievable trade-off between PD and PF. In Fig.3, Static refers to the deployment in which all sensors remain stationary. Total 6 sensors are deployed. We can see that the system detection performance increases significantly with the number of mobile sensors. In particular, when all 6 sensors are mobile, the improvement of detection probability is about 20-40%.
Fig.5 shows the detection probability when the number of sensors varies from 4 to 20. In each setting, the detection threshold is computed to maximize the system PD under a PF of 0.05. We can see that PD reaches about 81% when only four sensors are mobile. In contrast, PD is only about 42% if all sensors are static. When the number of sensors increases, the performance under different settings becomes similar because a near 100% PD can be achieved without moving sensors. Fig. 5 also shows that the use of mobile sensors can significantly reduce the density of sensors needed in a deployment. For example, 8mobile sensors achieve a similar detection performance as 20 static sensors.
B. Performance of Movement Scheduling
To distinguish from baseline algorithms, we refer to our two-phase detection algorithm as the mobility-assisted detector MD). We compare MD again two baseline algorithms. MD-random1 is a variant of MD that employs a random movement scheduling algorithm. At each scheduling step, a sensor is randomly chosen to move until the required detection performance is achieved. MD-random2 is another variant of MD that uses a node-based random scheduling strategy.
Fig.4 Receiver operating characteristic curves
Fig.5 PD vs. number of mobile sensors
Fig. 6 Number of moves vs. requested PD

A sensor is randomly chosen to move until it reaches the location of target or the required detection performance is achieved. Fig. 6 shows the average number of moves of 10 mobile sensors when the requested PD varies from 0.8 to 0.95. The PF is set to be 0.01. MD significantly outperforms the two baseline algorithms, which demonstrates the effectiveness of our optimal movement scheduling algorithm.
V. CONCLUSION
This paper explores the use of mobile sensors to address the limitation of static WSNs for target detection. In our approach, mobile sensors initially stationary are triggered to move toward possible target locations by a detection consensus arrived at by all sensors. The fidelity of final detection decision is then improved by a second-phase detection that fuses the measurements of both static and mobile sensors. We develop an optimal sensor movement scheduling algorithm that enables mobile sensors to gather the maximum amount of target energy under a given moving distance bound. The effectiveness of our approach is validated by extensive simulations based on real data traces.
REFERENCES
[1] Chu M, Haussecker H and Zhao F (2002) ,“Scalable Information Driven Sensor Querying and Routing for Ad Hoc Heterogeneous Sensor Networks,” J. High Performance Computing Applications, vol. 16, no. 3, pp. 293-313.
[2] Guojun Wang, Member, IEEE, Md Zakirul Alam Bhuiyan, Member, IEEE,Jiannong Cao, Senior Member, IEEE , and Jie Wu, Fellow, Member IEEE(2014)" Detecting Movements of a Target Using Face Tracking in Wireless Sensor Networks", IEEE Transactions On Parallel And Distributed Systems, Vol. 25, No. 4.
[3] He T, Vicaire P, Yan T, Luo L, Gu L, Zhou G, Stoleru R, Cao Q and Abdelzaher T (2006), “Achieving Real-Time Target Tracking Using Wireless Sensor Networks,” Proc. 12th IEEE Real- Time and Embedded Technology and Applications Symp. (RTAS), pp. 37-48.
[4] Kaltiokallio O, Bocca M, and Eriksson L.M (2010), “Distributed RSSI Processing for Intrusion Detection in Indoor Environments,” Proc. Ninth ACM/IEEE Int’l Conf. Information Processing in Sensor Networks (IPSN), pp. 404-405.
[5] Leong B, Mitra S and Liskov B (2005), “Path Vector Face Routing: Geographic Routing with Local Face Information” Proc. IEEE Int’l Conf. Network Protocols (ICNP), pp. 47-158.
[6] Liu K, Abu-Ghazaleh N, and Kang K.D(2006), “JiTS: Just-in-time Scheduling for Real Time Sensor Data Dissemination,” Proc. IEEE Pervasive Computing and Comm. (PerCom), pp. 42-46.
[7] Waelchli M, Scheidegger M, and Braun T (2006), “Intensity-Based Event Localization in Wireless Sensor Networks,” Proc. Conf. Int’l Federation for Information Processing Wireless On-Demand Network Systems and Services (IFIP WONS), pp. 41-49.
[8] Wang Y, Vuran M, and Goddard S(2011), “Analysis of Event Detection Delay in Wireless Sensor Networks,” Proc. IEEE INFOCOM, pp. 1296-1304.
[9] Zhang W and Cao G (2004), “Dynamic Convoy Tree-Based Collaboration for Target Tracking in Sensor Networks,” IEEE Trans. Wireless Comm., vol. 3, no. 5.
[10] Zhou Y, Li J and Wang D (2010), “Posterior Cramer-Rao Lower Bounds for Target Tracking in Sensor Networks with Quantized Range-Only Measurements,” IEEE Signal Processing Letters,vol.17, no. 2,pp.377-388.

National Conference on Research Advances in Communication, Computation, Electrical Science and Structures
(NCRACCESS-2015)
ISSN: 2348 – 8549 www.internationaljournalssrg.org Page 143
BIOMEDICAL SENSOR NETWORK FOR AEROBIC FITNESS AND ACTIVITY MONITORING
Shanthini 1,Bharathi.S2
1Assistant Professor,2 PG scholar Department of ECE
Bharathiyar Institute of Engineering for Women Deviyakurichi.
Abstract—This paper describes a prototype model for aerobic activity and fitness monitoring system based on IEEE 11073 family of standard for medical device communication. It identifies basic requirements for developing a biomedical sensor network having resource limited sensor nodes to acquire, retrieve and converse various physiological parameters while using short range wireless techniques. IEEE 11073-10441 defines the set of protocols for tele-health environment at application layer and rest of the communication infrastructure is covered by the medical grade ZigBee network. In healthcare, space ZigBee provides an industry-wide standard for exchange the data between a variety of therapeutic and non-therapeutic strategy and ZigBee enabled therapeutic devices are fully compatible with ISO/IEEE 11073 for point-of-care medical device communication. The proposed prototype model address design and maturity issues required to report any severe aerobic malfunctioning without compromising mobility and expediency of the patient.
Keywords:-Zigbee, ISO/IEEE 11073, Biomedical sensor Network.
I. INTRODUCTION
Technological advancements in the field of biosensors and wireless technologies has made possible the development of new applications in the area of wellbeing informatics and medical care giving. The idea of Biomedical Sensor Network (BSN) is derived from a thought of mixing of these technologies for consideration of physiological parameters and contribution the therapeutic aid to the person in need . A BSN consists of 5 to 10 insidious or non insidious sensor nodes acquiring physiological signals from the subject body and transmitting it to the network controller through wireless channel. All the sensor nodes in the network split the same medium with different passage characteristics and different Quality of Service (QoS) requirements. BSN is a new category of wireless networks which
offers opportunities to new services for monitoring health, fitness and wellness of individuals. It offer rapid feedback for capable and
Reliable patient monitoring, disease management and promotes self care [3]. Special design characteristics of sensor and their human centric application make such networks different from predictable wireless networks [4]. These characteristics pose different challenges for system design and etiquette plan. Monitoring physiological commotion has become increasingly important to prevent institutionalization of persistent diseases management. This model system can help in monitoring and managing aerobic diseases in cost effective manner [5]. The demographic ageing, recent life style, unhealthful diet, use of tobacco, corporal inactivity, intellectual stress, socio-economic and civilizing changes are major underlying determinants for cardiovascular diseases. The cardiovascular disease management contributes to 45 percent of total medical care cost in India. More than 20 million people are at potential risk for cardiac diseases [6]. The early detection of aerobic risk factors can help in saving a valuable life shimmering its socio-economic contact in many ways. Remaining paper is organized as follows. well-designed construction is described in section 2 followed by etiquette overview in the section 3. Section 4 presents domain information model and section 5 describes service model for cardiovascular fitness and movement monitoring. Communication model is discussed in section 6 and section 7 concludes the entire discussion.
II. FUNCTIONAL ARCHITECTURE
The purpose of this work is to nearby a formal BSN
model using Chipcon CC-2420 radio transceiver that operates in accordance with ZigBee communication standard and analyze traffic and concert issues [7]. This proposed model describes a basic BSN

National Conference on Research Advances in Communication, Computation, Electrical Science and Structures
(NCRACCESS-2015)
ISSN: 2348 – 8549 www.internationaljournalssrg.org Page 144
architecture (as shown in Figure-1) when different sensor nodes share the same medium with different packet rates and packet sizes.
Physiological signals acquired with the help of a range of sensors, as shown in Figure 1, help in supervision physical welfare and monitoring process. It is obligatory to have a few perceptive of the issue on which the measurements are agreed out to attain valid physiological information from a living human body. Human body is set of a mixture of systems considerately working to make physiological activities such as electrical, perfunctory, thermal, hydraulic, pneumatic, chemical etc, each of which communicates with external atmosphere as well as other internal systems of the body. Incorporated operations of these systems and their sub-systems make a man able to maintain life, learn to perform, obtain individuality and behavioral traits and even reproduce himself. Measurement of parameters reflecting operations of these systems using sensors can help in faster and quicker remedial or healing for a patient.
With increased awareness of human physiology engineers are able to develop instruments having ability in managing measurements from the body and make opinion on the basis of acquired parameters. Biomedical engineers should understand that they are subject to official, moral and ethical in their practice since they deal with peoples’ health, fitness and physical happiness.
Sensor Node Application
Threshold detection
Network Layer
Trend analysis and event detection
Sen
sing
Sensor Processing
Phy
siol
ogic
al
Sensor fusion and error handling
Physical Sensing
Controls sensor hardware
Physical Process/Sensor Acquisition of Physiological Parameters
Fig.2. BSN Sensing Operation Stack
Protocol stack for physiological sensing operation is illustrated in Figure 2 covering cross layer functionality. Physical layer takes care for the issues related to control of biomedical sensor device. Medium Access Control and DataLink Layer performs elementary dispensation after fusing information obtained from multiple sources and incorporate error handling mechanism into physical data. Network Layer is accountable for fashion analysis and event detection for acquired physiological information. Sensor node application layer defines applications associated with a particular medical parameter. Application layer cooperate with physical process or sensor through sensor device executive for acquirement and physical layer directly interacts with wireless channel for communication of acquired information. Elemetary statistics processing ability is integrated into the sensor

National Conference on Research Advances in Communication, Computation, Electrical Science and Structures
(NCRACCESS-2015)
ISSN: 2348 – 8549 www.internationaljournalssrg.org Page 145
knob to reduce communication charge and thrust aside irrelvent data.
Fig. 3 Biomedical Sensor Network Model
The proposed BSN traffic model, shown in Figure-3, pretend with the help of OMNeT++ judicious event simulation environment using Chipcon CC-2420 radio transceiver that operates in accord with IEEE 802.15.4/ZigBee communication customary and analyzes traffic and performance issues. This model describes a basic BSN architecture when special sensor nodes share the same medium with special packet rates and package sizes. Performance metrics of intra BSN communiqué model includes throughput, packet delay and energy consumption .
This proposed architecture is supported by five physiological sensors acquiring Electrocardiogram (ECG), Blood stress (BP), Blood Oxygen dissemination, Temperature and Accelerators and Gyroscopes for Body progress. This multi-parametric and multidimensional time series information is transmitted by each individual sensor node to the BSN coordinator . All recognition decisions are taken at this period with the help of advance Digital Signal Processors and other integrated submission software platforms. significant alarm signals and periodic diagnosis information is sent to medical professionals for further actions using extra-BSN communiqué link. This link is facilitated by existing public announcement network. However this effort is focused only for intra-BSN communication of physiological in sequence.
III. ETIQUETTE OVERVIEW
IEEE 11073-10441 defines a lightweight application
layer protocol for Personal Health Devices in the domain of cardiovascular activity and fitness monitoring .This standard establishes a normative definition of the communication between personal cardiovascular fitness and activity monitoring devices and managers (e.g. cell phones, personal computers, personal health appliances, set top boxes) in a manner that enables plug-and-play interoperability. Here interoperability is a key issue to growing the potential market for these devices and enabling people to be better informed participant in the management of their health.
The basic framework of this standard is based on IEEE 11073-20601, IEEE 11073-10201 and IEEE 11073-20101 standards. Communication between the BSN node (agent) and the BSN coordinator (manager) is defined by the application protocol in IEEE Std. 11073-20601.
The medical device encoding rules (MDER) used within this standard are fully described in the standard. It is based on an object oriented systems management paradigm. The overall system model is divided into three principal components: the domain information model (DIM), the service model, and the communication model.
IV. DOMAIN INFORMATION MODEL
Domain information model (DIM), as shown in
Figure 4, is a hierarchical model that describes a BSN node as a set of stuff. These objects signify the fundamentals that control behavior of the corporal process sensing mechanism and report the status of the BSN nodes to the BSN coordinator as and when required.
Cardiovascular
DIM attributes of
Subject Physiological and activity and
Body Environmental fitness Parameters monitoring device (MDS)
Fig. 4. Domain Information Model
Some of the central physical parameters covered

National Conference on Research Advances in Communication, Computation, Electrical Science and Structures
(NCRACCESS-2015)
ISSN: 2348 – 8549 www.internationaljournalssrg.org Page 146
under IEEE 11073-10441 are heart rate, breathing rate, altitude, latitude, longitude, intensity of activity, stride length, session duration etc. These attributes are represented in five different formats given as therapeutic device system (MDS), numeric, real time sampled arrays (RTSA), scanner and persistent metric stores (PM-Stores) DIM is described with the facilitate of Abstract Syntax Notation (ASN) and the data formats described in DIM can also be use by other platforms for feature mining at latter stages.
V. SERVICE MODEL
Service model defines theoretical machinery for records exchange. This replica maps messages exchanged between sensor nodes and BSN coordinator. Protocol messages are defined as ASN.1 details. Message formats defined with in IEEE 11073-20601 can coexist with messages defined in other standard application profiles defined in the ISO/IEEE 11073 series of standards.
VI. COMMUNIQUE MODEL
The communiqué model for IEEE 11073-10441 supports point to point statement among sensor nodes and BSN coordinator in star topology. For each logical position to position communication the energetic system activities is defined under IEEE 11073-20601.
Aerobic sturdiness and activity scrutinize directly
use the attributes and measures for communication defined in this customary except the nomenclature Communication model describes Association procedure, Configuring procedure, Operating procedure and Time harmonization.
A BSN node starts the progression of communiqué by issuing an alliance request to the BSN coordinator and will enter into the association state. Coordinator will respond to the request on the basis of configuration ID of the node. Configuration information is validated by the coordinator before entering into the operating state.
After the conduction is over the association is accomplished and both the BSN node and the BSN controller return back to the unassociated state.
Sensor Node Application
Threshold signals (Defined by IEEE 11073-20601 Standard)
Network Layer
Network protocols and packet
routing Protocols
Com
mun
icat
ion
Medium Access Control Channel access, frame management, error control Protocols
Physical Communication
Controls communication hardware, channel coding
Physical Process/Sensor Communication hardware to interact with physical medium
Fig. 5. Communication Protocol Stack
Communiqué protocol heap is illustrated in Figure-5 that describes association, configuration, transmission and time synchronization for communication model of aerobic bustle and fitness monitoring system.
The appliance layer is covered by IEEE 11073-20601 and bottom layers are described under ZigBee standard [19] for small assortment wireless communiqué. VII. CONCLUSION
All though last decade we discussed a lot about the pros and cons of using wireless communiqué devices and their impact on human body. RF authority used for

National Conference on Research Advances in Communication, Computation, Electrical Science and Structures
(NCRACCESS-2015)
ISSN: 2348 – 8549 www.internationaljournalssrg.org Page 147
transmission of in sequence certainly have some health related issue but as the perceived value related to special communication and amusement is increasing, personal area networks (PANs) are gaining popularity and even ready to provide healthcare monitoring solutions. Currently, there are intensive activities worldwide on applying Information and Communication Technologies in a more active and direct way to support medical and healthcare service.
BSN solutions are now ready to enter into the harsher world of commercial applications from the squashy academic research environment. It is expected that IEEE standards like carcass Area Network (IEEE 802.15.6), ZigBee (IEEE 802.15.4) and Aerobic Activity and Fitness Monitor (IEEE 11073-10441) will surely lead to the development of expenditure efficient private health devices for millions of people. REFERENCES [1] G.-Z. Yang, “Body Sensor Networks.” Springer, New York,
NY, USA, 2006. [2] K. Sohrabi, D. Minoli and T. Znati, “Wireless Sensor
Networks,” Wiley, Hobuken, New Jersy, USA, 2007. [3] B. Lo and G. Z. Yang, “Key technical challenges and current
implementations of body sensor networks,” in Proceedings of the
2nd International Workshop on Body Sensor Networks (BSN '05), pp. 1–5, April 2005. [4] X. Hu, J. Wang, Q. Yu, W. Liu and J. Qin, “A Wireless Sensor
Network Based on ZigBee for Telemedicine Monitoring System,”
in Proceedings of International Conference on Bioinformatics and Biomedical Engineering (ICBBE-08), pp-1367-1370, Shanghai, China, May 2008. [5]A. Astrin, “Closing Report for the TG6 Session in March 2010.”
IEEE P802.15 Working Group for Wireless Personal Area Networks (WPANs), IEEE P802.15-10-0217-00-0006, March-2010. [6]The World Health Report 2007: “Prevention of
Cardiovascular Disease”. Geneva, World Health Organization,
2007. [7]H. Ren, M. Meng and X. Chen, “Physiological Information
Acquisition through Wireless Biomedical Sensor Network,” in
Proceedings of IEEE international conference on Information
Acquisition,pp-483-488, Hong Kong, China, June-July 2008. [8]W. J. Tompkins, “Biomedical Digital Signal Processing,” PHI,
New Delhi, India, 2006. [9]W. Lars and S. Sana, “Architecture concept of a wireless body
area sensor network for health monitoring of elderly people,” in
Proceedingsof the 4th IEEE Consumer Communications and Networking Conference (CCNC '07), Las Vegas, Nev, USA, January 2007. [10]L. Cromwell, F.J. Weibell, E.A. Pfeiffer, “Biomedical
Instrumentation and Measurements.” Pearson Education
Pubication, New Delhi, India, 2004.

National Conference on Research Advances in Communication, Computation, Electrical Science and Structures (NCRACCESS-2015)
ISSN: 2348 – 8549 www.internationaljournalssrg.org Page 148
A NOVEL EXPLICIT PULSED DUAL EDGE TRIGGERED SENSE AMPLIFIER FLIP FLOP BY USING POWER GATING TECHNIQUES
V.Saranya
Assistant Professor, Department of ECE, Bharathiyar Institute of Engineering for Women Abstract:
An explicit-pulsed dual-edge triggered sense-amplifier flip-flops (DET-SAFF).In this dual edge triggered sense amplifier flip flop is used for low power consumption and high performance application. By incorporating the dual-edge triggering mechanism, the dual-edge triggered sense-amplifier flip-flop (DET-SAFF) is able to achieve low-power consumption that has minimum delay. power gating with clocked storage element technique will be utilized to reduce leakage power and improve the performance of the systems. It can be used in various applications like digital VLSI clocking systems, buffers, registers, microprocessor etc. Keywords: Power Gating, high Performance, low power, delay, Dual edge triggered, sense amplifier flip flop.
I.INTRODUCTION
In many digital very large scale integration design, which consist of clock distributed network and timing elements, is one of the most power consumption. Flip flops are critical timing elements in digital circuits which have large impact on circuit speed and power consumption. Dual edge triggered is very important technique is to reduce the power consumption in the clock distributed network. In this dual edge triggering is to introduce the power gating. In this power gating with clocked storage element technique will be utilized to reduce leakage power and improve the performance of the systems. When technology scales down, total power dissipation will decrease and at the same time delay varies depends upon supply voltage, threshold voltage, oxide thickness. II.DUAL EDGE TRIGGERED FLIP FLOP
The dual edge triggered flip flops have two stages. These are pulse generator stage and latching stage. The clock pulse is given to the input of the pulse generator. It produces the triggering pulse signal. Latching stage is generating the output pulse signal.
Fig 1.General Block Diagram
Fig 2.Power Gating in DETFF
In this dual edge triggered flip flop used power gating. In this power gating in DET-FF in1 and in2 has falling we get „0‟ output. In4 have falling we get „1‟as
the output. If the clock as the positive (clk==1) edge clock. The power gating styles adds a header and Footer of a MOS transistor. In the header we add PMOS and footer we add NMOS transistor of the circuit. The enable signal needs only rising edge of the clock. III.CLOCK GATED SENSE AMPLIFIER FLIP FLOP IN POWER GATING
The proposed clock gated sense amplifier flip flop have three stages. These are pulse generator stage,

National Conference on Research Advances in Communication, Computation, Electrical Science and Structures (NCRACCESS-2015)
ISSN: 2348 – 8549 www.internationaljournalssrg.org Page 149
sensing stage and latching stage. Pulsed generator stage as produce the triggering pulse. The sensing stage is to
sense the triggering pulse of the signal. The latching stage is to produce the output signal.
Fig3. General scheme of CGSAFF
Fig 4. Power Gating in CGSAFF In order to compare the previous and current
input values, X and Y these are the differential inputs. in1, in2, in3, and in4 these are the buffered output. out1, out2, out3 and out4 these are the control signals. If in2 and in4 is different from the output out 1 and out4, X will be pulled up to high and Y pulled down to low.CL as known as the gated clock. At the rising edge of the clock, CL as goes to high and delayed signal CLK3 as goes to low. Therefore transistor and transmission gates are turned on, pulse signal as goes to high. After a short period, transparent window is closed as CLK1 goes to low and CLK 3 as pulled up to high.
At the falling edge of the clock, CL as pull down to low and delayed signal CLK3 is high. Once the CLK3 is low, the sampling window is shut down. In the evaluation phase ,in1 is low, SB will be set to high, and if in2 is high , RB will be set to
high.therefore ,the conditional precharging technique is applied in the sensing stage of the CG-SAFF.two input controlled pmos transistors are embedded in the pre charging paths of the nodes SB and RB. To optain the differential buffered output as to reduce the loading capacitance.By using this latch stage we know the output signal.the clocking stage as used to improve the performance of the CG-SAFF.The generated PULS signal is more heavily loaded than that of DET-SAFF, a modified Nikolic‟s latch is used. It does not require any clock signal and provides the most stable operation. The inner holding topology is modified to obtain buffered differential outputs, Q1 and QB1, with reduced load capacitances. In the clocking stage, Q1 and QB1 are used to generate X and Y instead of using Q and QB. This helps to improve the performance of CG-SAFF significantly.
IV.SIMULATION RESULTS:
Fig 5. Output for DETFF
Fig 5 shows the output of the dual edge triggered flip flop. In this technique generate 0.626mW Power and 210.7µm2 Layout area
Fig 6. Output for CGSAFF

National Conference on Research Advances in Communication, Computation, Electrical Science and Structures (NCRACCESS-2015)
ISSN: 2348 – 8549 www.internationaljournalssrg.org Page 150
Fig 6 shows the output of the Clock Gated Sense Amplifier flip flop. In this technique generate 0.387µW Power and 471.7µm2 Layout area IV.PERFORMANCE COMPARISON
Table 1 show the comparison between the DETFF and CGSAFF. Here analyze different design in the view of Total layout area and Power consumption.
Design parameter DETFF CGSAFF AREA 210.7µm2 471.7µm2
POWER 0.626mW 0.387µW Table 1: Performance Comparison
CONCLUSION
This paper presents clock gated sense amplifier flip flops in dual edge triggered sense amplifier flip flops for low power and high performance applications. In this dual edge triggered sense amplifier flip flops have to achieve power reduction by incorporating dual edge triggering and conditional pre charging. Clock gated sense amplifier flip flops superior in power saving and reduce the latency. REFERENCES 1. Peiyi Zhao, Jason McNeely, Pradeep Golconda, Magdy A.
Bayoumi, Robert A.Barcenas, And Weidong Kuang, (March 2007), “Low-Power Clock Branch Sharing Double-Edge Triggered Flip-Flop” IEEE Transactions on Very Large Scale Integration (VLSI) systems.vol.15,no.3.
2. Myint Wai Phyu, Kangkang Fu, Wang Ling Goh, and Kait-Seng Yeo, (Jan 2011), “Power-Efficient Explicit-Pulsed Dual-Edge Triggered Sense-Amplifier Flip Flops” IEEE Transactions on Very Large Scale Integration (VLSI) systems.vol.19,no1.
3. Ko.U and Balsara.P,(Feb.2000),“High-Performance Energy-Efficient D-Flip-Flop Circuits”, IEEE Transactions on Very Large Scale Integration (VLSI) systems,vol.8,no.1,pp.94-98.
4. Nikolic.B, Oklobzija.V.G, Stajanovic.V, Jia.W, Chiu.J.K, and Leung.M.M, (June.2000), “Improved Sense-Amplifier-Based Flip-Flop: Design and Measurements,” IEEE J Solid- State Circuits, vol 35, no 6, pp.876-883.
5. Zhao.P, Darwish.T, and Bayoumi.M, (May 2004) “High-Performance and Low Power Conditional Discharge Flip-Flop,” IEEE Transactions on Very Large Scale Integration (VLSI) Systems, vol 12, no 5, pp.477-484.

National Conference on Research Advances in Communication, Computation, Electrical Science and Structures (NCRACCESS-2015)
ISSN: 2348 – 8549 www.internationaljournalssrg.org Page 151
PRIOR BOOKING OF PARKING RESERVATION SLOT USING UART
L.Keerthana, M.E.,
Bharathiyar Institute of Engineering For Women, Deviyakurichi.
Abstract— the project proposes the enhancement of protection system to solve the problem of unnecessary time consumption in finding parking spot in commercial car park areas. A parking reservation system is developed in such a way that users book their parking spots through short message services (SMS). The SMS sent will be processed by a wireless communication instrumentation device called micro-RTU (Remote Terminal Unit). This micro-RTU will reply the confirmation of booking by giving the details of reservation like password and lot number. The password will be used to enter the parking area and valid for a certain period of time. The system is fully automated with the use of the microcontroller. This microcontroller is capable in storing information of empty parking spaces; provide passwords as well as allowing or denying access to the parking area. A prototype of a car park system has been designed to demonstrate the capability of the proposed work. The demonstration has proven the capability of the system to reserve the parking, gain entry to the parking area and hence eliminates the hassle of searching empty parking lots. Index Terms—SMS, RTU, IR Pair, GSM, Smart Card Reader.
I. INTRODUCTION
The major problems faced by the public are waiting for long time to park their vehicle in particular area. Now-a-days there are lot of issue in parking the vehicles. This project is designed such
that it solves these problems using Smartcard Reader. Smart card system can produce the detailed information about the user and it can be used here for locating the vehicle. If the authentication is checked then the user can park their vehicle in an allotted area.
Most of the existing car parks do not have a systematic system. Most of them are manually managed and a little inefficient. The problem that always occurs at the car park is time being wasted in searching for the available parking spaces. Users will keep on circling the parking area until they found an empty parking spot. This problem usually Occurs in urban areas, where number of vehicles is higher as compared to the availability of parking spaces. These ineffective conditions happened because of the lack of Implementation in technologies which are available in the market today.
Various systems have been done to ensure smoothness of traffic in car park areas. From manual implementations used in the old systems, they have evolved into fully automated, computerized systems. Car park entrances are controlled by barrier gates whereby parking tickets are used extensively for access purpose. With the growth of technology, these systems have been simplified in many ways. As proposed by, RFID technology could be utilized for entering and exiting parking areas. Using this approach, queuing time for getting the entrance ticket as well as payment upon exiting could be completely eliminated. However this method does not solve the problem of users having to search for available parking lots. One of

National Conference on Research Advances in Communication, Computation, Electrical Science and Structures (NCRACCESS-2015)
ISSN: 2348 – 8549 www.internationaljournalssrg.org Page 152
the ways to address this issue is by displaying the number of available parking spaces at each floor of the parking area using the LCD display. Another way is by mounting indication lights on top of each parking lot to inform the users on parking availability. The drawbacks of these methods are that although the searching time is reduced, users will still need to circle around to look for the empty spaces.
Another technology in smart parking system is that the users are actually guided to the empty parking spaces by the arrow indicators located at the ceiling. The users need to make the parking reservation first via online and will receive the confirmation code through SMS. The proposed work aims to cater for a larger number of prospective users.
II. RELATED WORK
Recent increase in the growth of automotive industry coupled with the perpetual demand of commuters urged the need for better and smarter parking mechanisms. Most of the existing parking management systems rarely address the issues of parking space management, vehicle guidance, parking lot reservation etc.
There has been a considerable amount of reduction in transaction costs and decrease in stock shortage with the use of Radio Frequency Identification (RFID) technology in automation. Most of the RFID networks include a wide range of automation technologies. These technologies are RFID readers, RFID writers, RFID barcode scanners, RFID smart sensors and RFID controllers. In this study, a solution has been provided for the problems encountered in parking-lot management systems via RFID technology. RFID readers, RFID labels, computers, barriers and software are used as for the main components of the RFID technology
As for the hardware requirements, by the utilization of RFID readers, barriers and labels, parking-lot check-in and check-out controls have been achieved. In that way, as an alternative to personnel-controlled traditional parking-lot operations, an unmanned, atomized vehicle control and identification system has been developed. Necessary precautions have been taken programmatically just in case of a parking-lot's running out of parking space problem during the process of this application. That way vehicles that are about to check-in will not be let in, thus, there will not be any time-loss to look for parking space. Another problem is the application's disconnection to the central database during its operation. This is basically the result of the internet infrastructure breakdown. To avoid such a problem, necessary precautions were taken to run the database on both a local and a remote server simultaneously.
One bit can be stored for each ECG sample value. Furthermore, the security in this algorithm relies on the algorithm itself, it does not use a user defined key. Finally, this algorithm is based on normal ECG signal in which QRS complex can be detected. However, for abnormal signal in which QRS complex cannot be detected, the algorithm will not perform well.
III. METHODOLOGY This paper is about car parking system using SMS. Initially we register and buy a smart card for parking car in required areas. Based on codes, we can park our car like (12- for user 1, 34- for user 2, 56- for user 3) and here the GSM module is used for this communication. The SMS sent will be processed by a wireless communication instrumentation device.
This device will reply the confirmation of booking by giving the details of reservation like password and lot number. The password will be used to enter the parking area and valid for a certain period of time. Before we leave our home in prior to

National Conference on Research Advances in Communication, Computation, Electrical Science and Structures (NCRACCESS-2015)
ISSN: 2348 – 8549 www.internationaljournalssrg.org Page 153
2 hours, send an SMS to GSM to verify the slot vacancy.
We should check for availability of slots through SMS with the microcontroller. It sends the reply message with allotted respective slot number along with user number. After reaching the place on scratching the smart card, the authentication process starts and after verification, the gate opens.
Once the user parks the car in his allotted slot. The slot represented by LED stops glowing indicating the presence of car. After leaving the slot the LED starts glowing indicating the absence of car it means slot is free. The block diagram which is used for parking vehicle conveniently in busy areas is shown. It can be used to prevent time for the user to park the vehicle.
GSM TECHNOLOGY
GSM was destined to employ digital
rather than analog technology and operate in the 900 MHZ frequency band. GSM divides up the radio spectrum bandwidth by using a combination of TDMA/FDMA schemes on its 25 MHZ wide frequency spectrum, dividing it into 124 carrier frequencies (spaced 200 KHZ apart).
INTERFACING GSM WITH MICROCONTROLLER
The user request for the slot to GSM module, the GSM module communicates with the microcontroller through MAX 232. The GSM module interface with microcontroller through the PIN3, PIN4 of PORTB.
Fig. 1 Block Diagram- Smart Parking
Reservation using SMS SMART CARD READER AND IR PAIR
SR90 is an intelligent Smart Card Reader and is designed to Read, Write and Authenticate contact cards. The microprocessor used is CMOS, 8bit RISC and the card plug is of Barium Copper with a life expectancy of > 300,000 insertions. The operating power for the reader is drawn from serial port and no external power pack is required.
For Authentication, user uses the Smartcard
to card reader. The Smartcard Reader is interface with microcontroller through the PIN10, PIN11 of PORTD.
The purpose of using IR pair here is to
indicate the availability of car in the slot. Once the IR pair start sensing it indicate the car is available, if it stop sensing it indicate the vacancy of slot. The

National Conference on Research Advances in Communication, Computation, Electrical Science and Structures (NCRACCESS-2015)
ISSN: 2348 – 8549 www.internationaljournalssrg.org Page 154
IR pair interface with microcontroller through the PIN12, PIN13, PIN14 of PORTD.
Fig. 2 Interfacing Of GSM LED (LIGHT EMITTING DIODE)
The main function of LED is to emit light when an electric current passes through them. LED is an p-n junction diode which emits light when forward biased by a phenomenon called electroluminescence.
INTERFACING LED WITH MICROCONTROLLER
The purpose of using LED is to indicate the vacancy of slot in parking area. If the LED is in glow condition it indicate that slot is vacant, else there is no slot available. The LED is interface with the microcontroller through the PIN0, PIN1, PIN2, and PIN3 of PORTB.
Fig. 3 Interfacing Of LED
LCD (LIQUID CRYSTAL DISPLAY)
A Liquid Crystal Display is a flat panel display, electronic visual display, video display that uses the light modulating properties of liquid crystals (LCs). It is an electronically modulated optical device made up of any number of segments filled with liquid crystals and arrayed in front of a light source (backlight) or reflector to produce images in color or monochrome. The most flexible ones use an array of small pixels.
INTERFACING LCD WITH MICROCONTROLLER
Here the LCD display is used to display the status of slot to the user. Once the slot is allocated for the user it will display in LCD. The LCD display is interface with the microcontroller through the PIN23, PIN24, PIN25, PIN26, PIN27, PIN28 of PORTA, PORTC.
Fig. 4 Interfacing Of LCD
PURPOSE OF LCD
At normal condition, the LCD display has been programmed to display the given message.

National Conference on Research Advances in Communication, Computation, Electrical Science and Structures (NCRACCESS-2015)
ISSN: 2348 – 8549 www.internationaljournalssrg.org Page 155
This display is mounted at the entrance to the parking area.
Fig. 5 LCD Display In Active Mode
If the users enter the parking area within the valid reservation time limit, they should manage to proceed to the next step. If not, they have to do the reservation again.
By assuming that the successful user was using this system, after the user has pressed the start button, the LCD will show the display
Fig. 6 LCD Displaying Respective Slot For USER 1
LCD Displaying respective slot. The LCD
will display the slot to the user after authentication. The password is the access code provided in the confirmation message sent by the microcontroller that should be received by the user.
Fig. 7 LCD Displaying Respective Slot For USER
2 For example, „User 1‟ has reserved a
parking lot and the user manage to come within the
validity time, then the user has to scratch the card such that it verifies the one given in the reservation message.
Fig. 8 LCD Displaying Respective Slot For USER
1 If the authentication is correct, the main controller will send a signal to activate the entrance barrier gate to allow the access to the user‟s
reserved parking lot. The LCD panel will also show the parking
slot number in the display to guide the user to the user‟s reserved parking slot.
Fig. 9 LCD Displaying Status Of Slot
In the event that the authentication has
failed due to low balance in user‟s account or
expired reservation session, the LCD will display “No slot available”.
In case of low balance it will display “Your
balance is too low!!! Please Recharge” and the
system will not allow the user to access the parking slot area. This function is important as it prevents unreserved user to enter the parking slot and to enhance safety in that area.

National Conference on Research Advances in Communication, Computation, Electrical Science and Structures (NCRACCESS-2015)
ISSN: 2348 – 8549 www.internationaljournalssrg.org Page 156
Fig. 10 LCD Display In Warning Mode DC MOTOR DRIVER (L293D) DESCRIPTION
Table. 1 Logic input for motor driver
The Device is a monolithic integrated high voltage, high current four channel driver designed to accept standard DTL or TTL logic levels and drive inductive loads (such as relays solenoids, DC and stepper motors) and switching power transistors.
To simplify use as two bridges each pair of channels is equipped with an enable input. A separate supply input is provided for the logic, allowing operation at a lower voltage and internal clamp diodes are included.
This device is suitable for use in switching applications at frequencies up to 5 kHz. The L293D is assembled in a 16 lead plastic package which has 4 center pins connected together and used for heat sinking.
INTERFACING DC MOTOR WITH MOTOR DRIVER(L293D)
DC motor here used for opening and closing of gate. The motor is connected to microcontroller through an Interface (L293D). This interface is used to match and maintain the voltage
for motor. The DC Motor interface with microcontroller through the PIN16, PIN17, PIN30 of PORTD, PORTE.
Fig. 11 Interfacing DC Motor with Motor Driver (L293D)
If the same logic input is given to the input pins the motor stops, and if the different logic input is given to the input pins the motor rotates in different direction.
IV. RESULT
Thus this gives the prevention of waiting
time for the user to park the vehicle and it develop a
Parking system that is able to:
1. Avoidance of waiting time
2. Parking through Short Message
Service
3. Security in this system
V. CONCLUSION
In this paper a “Prior Booking Of Parking Reservation Slot Using UART” , aim at reducing the waiting duration of vehicles and making less chaotic. The objectives of this project have been
INPUTS FUNCTION DESCRIPTION 0 0 Ideal position
0 1 Rotates in clock wise direction 1 0 Rotates in anti-clock wise direction

National Conference on Research Advances in Communication, Computation, Electrical Science and Structures (NCRACCESS-2015)
ISSN: 2348 – 8549 www.internationaljournalssrg.org Page 157
achieved. Searching of available parking lots as been completely eliminated by reserving the slot beforehand via the SMS system. The microcontroller has made it become a smart system; whereby the whole processes of reservation and access system are fully automatic. Additionally, the security feature of the system is enhanced with the password requirements upon entrance to the parking lot. The designed system could be applied everywhere due to its ease of usage and effectiveness.
REFERENCES
[1] Pala Z., Inanc N., “Smart Parking Applications Using RFID Technology”, 1st Annual Eurasia RFID Conference, September 2007, Turkey. [2] QuickPark Official Website, http://www.quickpark.ie [3]ParkWhiz Official Website, http://www.parkwhiz.com [4] SIPARK PMA Press Release, Siemens Corporate Website,http://w1.siemens.com/press/en/pr_cc/2007/06_jun/is05076241e_1451454.htm [5] Communications and Multimedia Selected Facts and Figures 2008, Malaysian Communications and Multimedia Commission, Cyberjaya, 2008, ISSN 1675-6223, pp 15-38. [6] Specialist System Engineering (SSE), Official Website, http://www.sse.co.za [7] Friedhelm Hillebrand, ed.: GSM and UMTS, The Creation of Global Mobile Communications, John Wiley & Sons, 2002. [8] Clint Smith, Daniel Collins, 3G Wireless Networks, McGraw-Hill Telecommunication Series, September 2001, pp. 136. [9] ETSI TS 100 929. Digital Cellular Telecommunication System (Phase 2); Security relatednetwork functions. European Telecommunications Standards Institute., November, 1999. [10] ETSI EN 301 344. Digital cellular telecommunications system (Phase 2+); General Packet Radio Service (GPRS); Service description; Stage 2. European Telecommunications Standards Institute., September, 2000. [11] Jörg Eberspächer and Hans-Jörg Vögel. GSM switching, services and Protocols. John Wiley and Sons, 1999. [12] Garg, Vijay K. Principles and applications of GSM. Upper Saddle River (NJ) Prentice Hall PTR, 1999. [13] Tanenbaum, Andrew S. Computer networks. Upper Saddle River (NJ) Prentice-Hall 1996. [14] Hannu H. Kari. http://www.cs.hut.fi/ hhk/GPRS/. [15] Klaus Vedder GSM: Security, Services, and SIM. State of the art in Applied Cryptography. Course on Computer Security and Industrial Cryptography. Leuven, Belgium, June 3-6, 1997.
[16] Fred Piper and Michael Walker. Cryptographic Solutions for Voice Telephony and GSM. Network Security. December 1998.

National Conference on Research Advances in Communication, Computation, Electrical Science and Structures (NCRACCESS-2015)
ISSN: 2348 – 8549 www.internationaljournalssrg.org Page 158
FACE RECOGNITION USING PROCESSED HISTOGRAM AND PHASE-ONLY CORRELATION (POC)
*Kavitha.R*
Department of Electronics and Communication Engineering Mahendra Engineering College
Abstract
This paper proposes an automatic face
recognition technique using mutual combination of bin-based histogram processing and Phase-Only Correlation (POC) - based techniques to obtain effective recognition accuracy. The first phase preprocesses the faces with bin-based histogram approach and extracts the preliminary results which are rotation invariant in nature. The second phase verifies the face patterns with POC based matching technique in order to obtain the exact results which are the same not only distribution-wise but also content wise.
Time effective preprocessing by bin-based histogram approach filters out the mismatches and helps in reduction of the overall complexity of POC. The empirical results obtained on ORL database shows the recognition accuracy of 99.5%, which is very promising and is comparable with any other face recognition scheme. Keywords: Histogram, Phase-Only Correlation, POC, Face Recognition.
1. INTRODUCTION
Over the last 20 years, human face recognition has been studied and investigated enormously; a survey can be explored in [1]. Commercial face recognition applications have been popular in the fields of access control, security and surveillance systems, biometrics and law enforcement etc due to the availability of cheap and robust hardware equipment. The task of face recognition still poses different challenges like change in illumination, pose, and rotated faces despite success in some commercial systems. Recognizing objects from large image databases, histogram based methods have proved simplicity and usefulness in last decade. Initially, this idea was based on color histograms
that were launched by Swain and Ballard [2]. Following this idea numerous developments were made by different people, exploiting this idea, such as texture histograms for 2D object recognition suggested by Gimelfarb and Jain [3], shape-index histograms for range image recognition proposed by Dorai and Jain [4] and relational histograms used by Huet and Hancock [5] for line-pattern recognition. Similarly, one dimensional (ID) and two dimensional (2D) histograms are also proposed with diverse variations like ID shape index histogram, 2D maximum and minimum curvature histogram, 2D mean and Gaussian curvature histogram and 2D shape index and curvedness histogram in [6]. Another category known as energy histogram counts the occurrence of the DCT (Discrete Cosine Transform) coefficients in the corresponding bins rather than counting pixel color. Popularity of this approach is its low computational cost. The algorithm of energy histogram for image retrieval has been suggested in [7]. Similarly, overlapping energy histogram measures the distribution of DCT coefficients of an image. Its performance is elaborated and analyzed in [8].Closest distance between histograms of different face images can be used for recognition purposes. Different distance measures may affect the recognition rate [5]. Euclidean distance can be used as it produces stable and satisfactory results [6]. In the proposed system, bin based histogram is used for processing. Frequency of every bin is calculated and mean of consecutive nine frequencies is then computed for every face image that is later on used for testing. Computed mean vectors are used for calculating the absolute differences among the mean of trained images and the test image. Finally the minimum difference found identifies

National Conference on Research Advances in Communication, Computation, Electrical Science and Structures (NCRACCESS-2015)
ISSN: 2348 – 8549 www.internationaljournalssrg.org Page 159
the matched class with test image. Due to the fast computing time this approach is followed for training of suggested system. For verification purposes, correlation based scheme is suggested i.e. whether the testing image is face object or other than face object. Simple correlation techniques can be applied as well. But selecting Phase- Only Correlation (POC) for proposed system is due to its attractive properties such as achievement of translation and rotation invariance. Similarly, POC is not influenced by change in brightness and it is highly robust against noise. Since these properties of Phase-Only Correlation (POC) matter a lot in case of face images that is why Phase-Only Correlation (POC) is preferred over other ordinary correlation techniques. This paper is organized as follows: Section 2 discusses the processing done on histogram which is rotation invariant in nature. Section 3 focuses on Phase-Only Correlation (POC) i.e. used in proposed technique for verification purposes. Section 4 discusses the proposed technique with training and testing time algorithms. Section 5 discusses the percentages of recognition accuracy and timing comparisons among various techniques. Finally conclusion and future work is discussed in section 6.
2. HISTOGRAM PROCESSING
Histogram is defined as the frequency of each gray level present in the image. Number of bins in the histogram is specified by the image type which means histogram of binary image will be using two bins. In Figure 1, two binary images are shown giving a look of checkerboard in which black boxes represent binary 0 and white boxes represents binary 1. Two images seem to be the same but are different in sizes i.e. Figure 1 (a) is 11 x 10 while (b) is 10 x 11 and having different I's and 0's at different locations. But interesting point in both the images is that the frequency of bin 0 and bin 1 is the same in both the images which reflects that histogram of two different images in Figure 1 (a) and (b) are
same.
(a) (b) Figure 1: Analogous checkerboard Images Histogram of grayscale image will be using 256 bins. Figure 2 shows the sample histogram of the input image. The peak at each bin shows the frequency of that particular bin.
Figure 2: Histogram of an Image Histogram of face images used for training is unique, but it is possible that any real life test image's histogram will match any one of trained image's histogram most of the time. As such for catering to this issue, mean of consecutive nine frequencies of bins is computed and is stored for comparisons so that finer discrimination is made between trained and test image's histogram by considering chunk of nine bins. For clarity, the rectangular border around every nine peaks is also depicted in Figure 2. Furthermore, the set of computed mean values are used for calculating

National Conference on Research Advances in Communication, Computation, Electrical Science and Structures (NCRACCESS-2015)
ISSN: 2348 – 8549 www.internationaljournalssrg.org Page 160
absolute differences between the corresponding means of trained images and testing image. Finally the minimum difference found out of test image with checking all trained images values is considered to be the matched image. The above philosophy is blind but rotation invariant in nature and is considered to be a global approach for face recognition. In worst case scenario two altogether different images may have almost same histograms, so this ambiguity is further verified using Phase-Only Correlation discussed in next section.
3. PHASE-ONLY CORRELATION (POC)
Phase-Only Correlation function is defined
as 2D inverse Fourier transform for the cross-phase spectrum of two images [9]. Consider two images of size N1 X N2 as f (nl, n2) and g (n1, n2). Let F (k1, k2)and G (k1, k2)be their 2D discrete Fourier transforms, then their cross-phase spectrum or normalized cross spectrum RFG is defined as the conjugate of G(kI, k2) multiplied by F(k1, k2) divided by its absolute value as follows.
When 2D Inverse Fourier Transform (2DIFT) is applied on (1), the POC function is generated as follows.
The POC function in equation (2) holds
some interesting properties that can be used for face recognition applications. One of the most
remarkable property of POC function, shown in Figure 3 is that when two images are similar in nature, their POC function r(n1, n2) gives a distinct sharp peak. When the two images are dissimilar, the top most peak drops significantly, shown in Figure 4 [9]. The height of the top peak is the good measure to judge the similarity between the two images. Thus the POC function exhibits much higher discrimination capability than ordinary correlation function.
Figure 3: Examples of POC Function - Distinct sharp peak at centre for same image types
Figure 4: Example of POC Function - No distinct peak for two different images.

National Conference on Research Advances in Communication, Computation, Electrical Science and Structures (NCRACCESS-2015)
ISSN: 2348 – 8549 www.internationaljournalssrg.org Page 161
Another important property of POC function is that by making use of shift property of Fourier Transform, POC function easily achieves shift invariance in 2D. Letf2 (x, y) be a shifted version of image (x, y) so that f2 (x, y)= f1 (x- x0, y-yo), then by shift property of Fourier Transform:
The translational offsets (x0, yo) can be recovered by locating the impulse (peak) associated with the phase correlation of two images.
Equation (3) implies that the correlation peak is shifted by (xo, yo) and the value of peak is invariant with respect to the positional image translation. Image shift (x0, yo) can be estimated by detecting the location of corresponding peak. Similarly, POC function is highly robust against variance in brightness and presence of noise [9].
4. PROPOSED TECHNIQUE
For achieving the perfection in accuracy of proposed system, the merger of histogram and Phase-Only Correlation (POC) techniques is used in implementation of suggested system. For training, grayscale images with 256 bins are used. Firstly, frequency of every bin is computed and stored in vectors for further processing. Secondly, mean of consecutive nine frequencies from the stored vectors is calculated and are stored in another vectors for later use in testing phase. This mean vector is used for calculating the absolute differences among the mean of trained images and the test image. Finally the minimum difference found identifies the matched class with test image.
Similarly, the preliminary steps of testing are the same as training. Further more the POC
values between test image and images of predicted class are computed for match/mismatch on the basis of trained cutoff value.
The proposed algorithms used for training and testing are shown in Figure 5 and 6 respectively.
Figure 5: Training Algorithm
Figure 6: Testing Algorithm
5. RESULTS AND DISCUSSION The above system is trained and tested using
MATLAB 7.0 and is executed on Pentium- IV,

National Conference on Research Advances in Communication, Computation, Electrical Science and Structures (NCRACCESS-2015)
ISSN: 2348 – 8549 www.internationaljournalssrg.org Page 162
3.20 GHz processor with 512MB of memory. For checking the correctness of proposed technique ORL (Olivetti Research Laboratory) database was used, which consists of 40 subjects with 10 images per subject, total of 40 X 10 = 400 images. Out of 400 images, 200 images were used for training and remaining 200 used for testing purposes. The total training time for 200 images was found to be 1.625 seconds. The total testing time was found to be 22.715 seconds for remaining 200 images. Processed Histogram & Phase-Only Correlation (PH-POC) system is compared with other existing face recognition techniques such Principal Component Analysis (PCA) [10], Sub Holistic-Principal Component Analysis (SH-PCA) [11], Low Resolution-Single Neural Network (LRS-NN) [12], Hybrid-Sub Holistic & Holistic-Technique (H-SHHT) with single Holon, Hybrid-Sub Holistic & Holistic- Technique (H-SHH-T) with five Holon [11]. Figure 7 shows the comparison among different face recognition techniques in which the curve for proposed technique i.e. PH-POC is at the top of all other curves of various techniques that exist in literature while increasing the number of ORL classes.
Figure 7: Comparison of Face Recognition Techniques.
Table 1 shows the comparison of training time among different techniques. Training time of proposed technique i.e. PH-POC is very fast in comparison with others. This makes it suitable for real life applications where
initially huge organizations are having large database of images that needs to be trained.
Table 1: Training Time Comparison of Face Recognition Techniques. Table 2 shows the comparison of testing time among different face recognition techniques. Testing time of PH-POC is relatively more as POC technique is used for getting better results during recognition and further verification.
Table 2: Testing Time Comparison of Face Recognition Techniques
6. CONCLUSION
Face recognition is one of the most challenging tasks for machine recognition. Although humans seem to recognize faces in muddled scenes with relative ease, machine recognition is much more daunting task. In this proposed technique, we have proposed a very simple yet highly reliable face recognition technique called Processed Histogram and POC approach. The main goal was to devise time inexpensive and more accurate system. Separate processing on histogram works fine and produces the results with the same accuracy found in our system. But POC gives us the strong verification result that filters out objects

National Conference on Research Advances in Communication, Computation, Electrical Science and Structures (NCRACCESS-2015)
ISSN: 2348 – 8549 www.internationaljournalssrg.org Page 163
other than faces. In future, the proposed algorithm can be applied on different databases and colored histogram based approaches can also be suggested. REFERENCES [1] R. Chellapa, C.Wilson, and S. Sirohey, "Human and machine recognition of faces: a survey", Proceedings ofthe IEEE, 83(5):705-741, 1995. [2] M. J. Swain and D. H. Ballard, "Indexing via color histogram", In Proceedings of third international conference on Computer Vision (ICCV), pages 390- 393, Osaka, Japan, 1990. [3] G. L. Gimel'farb and A. K. Jain, "on retrieving textured images from an image database", Pattern Recognition, 29(9):1461-1483, 1996. [4] C. Dorai and A. K. Jain, Cosmos, "a representation scheme for free form surfaces", IEEE Transactions on Pattern Analysis and Machine Intelligence (PAMI), 19(10):1115-1130, October 1997. [5] B. Huet and E. R. Hancock, "Line pattern retrieval using relational histograms", IEEE Transactions on Pattern Analysis and Machine Intelligence (PAMI), 21(12):1363-1370, December 1999. [6] Yang Li, Edwin R. Hancock, "Face Recognition using Shading-based Curvature Attributes", IEEE Proceedings ofthe 17th International Conference on Pattern Recognition (ICPR'04) 1051-4651/04 [7] J. A. Lay and L. Guan, "Image Retrieval Based on Energy Histograms of the Low Frequency DCT Coefficients", IEEE International Conference on Acoustics, Speech and Signal Processing, Vol. 6, pp. 3009-3012, 1999. [8] R. Tjahyadi, W. Q. Liu, S. An, and S. Venkatesh. "Face recognition via the overlapping energy histogram", In Proceedings of the International Joint Conference on Artificial Intelligence (IJCAI200 7), 2007. [9] Koichi Ito, Hiroshi Nakajima, Koji Kobayashi, Takafumi Aoki, Tatsuo Higuchi, "A Fingerprint Matching Algorithm Using Phase-Only Correlation", IEICE Trans, Fundamentals, vol. E87- A, No. 3, March 2004. [10] Matthew Turk and Alex Pentland, "Eigenfaces for Face Recognition", Journal of Cognitive Neuroscience, vol 3, No.1, page 71-86, 1991. [11] Khan,M,M., Javed, M, Y., Anjum, M, A., "Face Recognition using Sub-Holistic PCA", Information and communication technologies, ICICT Pakistan, pp.152-157, August 2005. [12] Jahan Zeb, M. Y. Javed, Usman Qayyum, "Low Resolution Single Neural Network based Face Recognition", 4th International conference on computer vision, image and signal processing (CISP'07), Czech Republic, Prague, 27-29th July, 2007.

National Conference on Research Advances in Communication, Computation, Electrical Science and Structures (NCRACCESS-2015)
ISSN: 2348 – 8549 www.internationaljournalssrg.org Page 164
A comparative study on OFDM-PAPR Reduction techniques
R.S. Suriavel Rao Dr.P.Malathi G.Venkatesh Parthiban Asst. Professor Professor PG Scholar ABSTRACT- Wireless Communication is one of the important aspects of life. With the advancement in communication and its growing demands, the growth in the communication field has been rapid. Signals, which were initially transmitted in the analog domain, are being sent more in the digital domain these days. For better transmission, even single – carrier waves are being replaced by multi –carriers. Multi – carrier systems like CDMA and OFDM are now – a – days being implemented commonly. In the OFDM system, sub – carriers are placed orthogonally which are used to carry the data from the transmitter end to the receiver end. Guard band in this system eliminates the problem of ISI and noise is minimized by larger number of sub – carriers. But the large Peak– to – Average Power Ratio of these signal have some undesirable effects on the system. OFDMA provides high spectral efficiency in communication systems. But Peak to Average Power Ratio (PAPR) is one of the major drawbacks in OFDM communication which leads to power inefficiency in transmitter. Crest Factor Reduction technique is that in which sub carrier signals which has high crest are minimized are reduced by this method. This leads to better efficiency in OFDM communication. A survey is done to compare the reduction techniques for different applications.
I.INTRODUCTION Orthogonal frequency division
multiplexing (OFDM) technology is one of the most attractive candidates for fourth generation (4G) wireless communication. It effectively improves the bandwidth efficiency system capacity also increases which provides a reliable transmission. OFDM uses the principles of Frequency Division Multiplexing (FDM) which allows an improved spectral efficiency. OFDM’s basic principle is to split a high-rate data stream into a number of lower rate
streams that are transmitted simultaneously over a number of subcarriers. The subcarriers get overlapped with the other. Inter symbol interference (ISI) is eliminated almost completely by introducing a guard time in every OFDM symbol. OFDM faces several challenges. The key challenges are ISI due to multipath-use guard interval, large peak to average power ratio due to non-linearity’s of
amplifier; phase noise problems, need frequency offset correction in the receiver. Peak-to-average power (PAPR) ratio which distorts the signal if the transmitter contains nonlinear components such as power amplifiers (PAs).
II.OFDM
Orthogonal Frequency Division Multiplexing is a special form of multicarrier modulation which is particularly suited for transmission over a dispersive channel. The Sub-carriers are orthogonal to each other, that is, one sub-carrier is independent of the other sub-carrier. It is done by placing the carrier exactly at the nulls in the modulation spectra of each other.
Fig.1. OFDM Block Diagram
III. PEAK TO AVERAGE POWER RATIO
OFDM is one of the many multicarrier modulation techniques, that

National Conference on Research Advances in Communication, Computation, Electrical Science and Structures (NCRACCESS-2015)
ISSN: 2348 – 8549 www.internationaljournalssrg.org Page 165
provides maximum spectral efficiency, less implementation complexity, less vulnerable to echoes and non – linear distortion. As OFDM systems have these advantages of the OFDM system, it is used in various communication systems. But the drawback of this system is while implementing this system is the high peak – to – average power ratio of this system. The PAPR increases the complexity of the analog – to – digital and digital – to – analog converter and reduces the efficiency of the radio – frequency (RF) power amplifier. This leads to the prevention of spectral growth. Thus in communication system, it is observed that all the potential benefits of multi carrier transmission can be out - weighed by a high PAPR value.
III.CREST FACTOR REDUCTION TECHNIQUES
Crest Factor Reduction technique is used to optimize or minimize the signals that are transmitted communication spectrum. It helps in reducing the Peak to Average Power so that it can be implemented in Orthogonal Frequency Division Multiple Access (OFDMA) systems. The Peak to Average Power Ratio is measured by Crest Factor
CF=10log10(max (𝑥2)
𝐸[𝑥2] )
CLIPPING METHOD
One of the simple and effective PAPR reduction techniques is clipping, that cancels the signal components that exceed some unchanging amplitude called clip level. But also, clipping yields distortion power, which is called clipping noise, and expands the transmitted signal spectrum, which causes interfering. Clipping is nonlinear process and causes in-band noise distortion, which causes degradation in the performance of bit BER and out-of-band noise, which decreases the
spectral efficiency. Clipping technique is effective in removing components of the expanded spectrum. Though filtering decreases the spectrum growth, clipping followed by filtering reduces the out-of-band radiation, but causes some peak re-growth, in which the peak signal exceeds in the clip level. The iterative clipping and filtering technique reduces the PAPR without spectrum expansion. But the iterative signal takes long time and it will increase the computational complexity of an OFDM transmitter. But without interpolating before clipping causes it out-of-band. To eliminate out-of band, signal should be clipped after interpolation. But also this causes significant peak re-growth. So, this can use iterative clipping and frequency domain filtering to avoid peak re-growth..
SELECTED MAPPING
In this a set of sufficiently different data blocks representing the information same as the original data blocks are selected. Data blocks with less PAPR value are selected so that it makes suitable for transmission.
BLOCK CODING
The method is that designed block codes minimize the PAPR, which give error correction capability. A k bit data block is encoded by a (n, k) block code with a generator matrix “G” in the transmitter of the system. The phase rotator vector b to produce the encoded output x=a.G+b (mod 2).After that generator matrix “G‟ and the phase rotator vector “b‟ are
produced; which are used mapping between these symbols combination and input data vector „a‟. The converse functions of the transmitter are executed in the receiver system. The parity check matrix “H‟ is achieved from the
generator matrix “G‟, with an exception that the
effect of the phase rotator vector b is removed before calculations of syndromes.

National Conference on Research Advances in Communication, Computation, Electrical Science and Structures (NCRACCESS-2015)
ISSN: 2348 – 8549 www.internationaljournalssrg.org Page 166
TONE RESERVATION
The main idea of this method is to keep a small set of tones for Peak to Average Power Ratio reduction. originating as a convex problem and this problem can be solved accurately. Tone reservation method is that adding a data block and time domain signal. The data block depends on time domain signal to the original multicarrier signal to minimize the high peak. This time domain signal is calculated simply at the transmitter of system and stripped off at the receiver. PAPR reduction depends on some factors such as location of the reserved tones, number of reserved tones, , allowed power on reserved tones and amount of complexity. This method explains an additive scheme for minimizing PAPR in the multicarrier communication system. This shows that reserving a small fraction of tones leads to large minimization in PAPR ever using with simple algorithm at the transmitter of the system without any additional complexity at the receiver end. Now, M is the small number of tones, reserving tones for PAPR reduction may present a non–negligible fraction of the available bandwidth and resulting in a reduction in data rate. The advantage of Tone Reservation method is that it is less complex, no additional operation and no side information is required at the receiver of the system.
TONE INJECTION
Tone Injection (TI) method has been proposed by Muller, S.H., and Huber, J.B. This TI method is based on general additive method for Peak to Average Power Ratio reduction. Using an additive method PAPR reduction of multicarrier signal without any data rate loss can be achieved. Tone Injection uses a set of equivalent constellation points for an original constellation points to reduce PAPR. The idea of this method is to increase the
constellation size. After that each point in the original basic constellation can be mapped into several equivalent points in the extended constellation, as all information elements can be mapped into several equivalent constellation points. This extra freedom can be utilized for PAPR reduction. The main dis-advantages of this method are; in receiver side information for decoding signal is required, and cause extra IFFT operation which is more complex.
INTERLEAVING
The notion that highly correlated data structures have large PAPR can be minimized, if the correlation pattern which is long is broken down. The basic idea in adaptive interleaving is to set up an initial terminating threshold. Peak to Average Power Ratio value goes below the threshold rather than seeking each interleaved sequences. The minimum threshold looks for all interleaved sequences compel the adaptive interleaving. The main important of the scheme is that it is less complex than the PTS technique but obtains comparable result. Interleaving method does not give the better result for PAPR reduction.
PARTIAL TRANSMIT SEQUENCE
In partial transmit sequence approach, the input data block is partitioned into disjoint sub-blocks. There are two partition methods for PTS Scheme.
• Adjacent
• Pseudo-random
Among them, pseudo-random partitioned PTS scheme can obtain the best PAPR performance. The sub-carriers in each sub-block are weighted by phase factor rotations. The time domain data is generated by the rotation factor using which it selects signal having lowest PAPR. At the

National Conference on Research Advances in Communication, Computation, Electrical Science and Structures (NCRACCESS-2015)
ISSN: 2348 – 8549 www.internationaljournalssrg.org Page 167
receiver, the original data are recovered by applying inverse phase factor rotations.
COMPARISON OF PAPR REDUCTION TECHNIQUES
The PAPR reduction technique should be chosen based on the various system requirements.
Reduction Techniques
Parameters Operation required at Transmitter and Receiver
Decrease distortion
Power raise
Defeat data rate
Clipping No No No Tx-Clipping Rx-None
Selective Mapping
Yes No Yes Tx-M time IDFT operation Rx-Side information extraction, inverse SLM
Block Coding
Yes No Yes Tx-Coding or table searching Rx-Decoding or table searching
Partial Transmit Sequence
Yes No Yes Tx-M times IDFT operation Rx-Side information spectrum, inverse PTS
Interleaving Yes No Yes Tx-M times IDFT operation, M-1 times interleaving Rx-Side information extraction, de interleaving
Tone reservation
Yes Yes Yes Tx- Datablock and time domain signal added Rx- With time domain signal, high peak is stripped off
Tone injection
Yes Yes No Tx-constellation Rx-Side information extraction for decoding
CONCLUSION
Several PAPR reduction techniques are described and compared to select the best technique based on the application and performance of the system. Selective mapping technique seems to be best in the reduction techniques used as it decreases the distortion of the signal without defeating the data rate in the available power. SLM can be used for different OFDM systems with different number of subcarriers. It suits particularly for OFDM system with large number of sub-carriers (more than 128). PAPR reduction techniques will focus on distortion less transmission so that the system performance increases and low data rate for the efficient use of channel.
REFERENCES
[1] S. K. Lee, Y. C. Liu, H. L. Chiu and Y. C. Tsai, “Fountain Codes With PAPR Constraint for Multicast Communications, ”IEEE Trans. Broadcast., vol. 57, no. 2,
pp.319-325, June, 2011
[2] J. C. Chen, “Partial transmit sequences for PAPR
reduction of OFDM signals with stochastic optimization techniques,” IEEE Trans. Consumer Electr., vol. 56, no. 3,
pp. 1229-1234, 2010.
[3] L. Wang, C. Tellambura, “An overview of peak-to-average power ratio reduction techniques for OFDM systems”, in IEEE International Symposium on Signal
Processing and Information Technology, pp. 840-845, 2006
[4] T. Jiang, Y. Wu, “An overview: peak-to-average power ratio reduction techniques for OFDM signals”, IEEE
Trans.Broadcast., vol. 54, n. 2, pp. 257-268, June 2008.
[5] A. Ghassemi and T. A. Gulliver, “PAPR reduction of
OFDM using PTSand error-correcting code subblocking,”IEEE Trans. Wireless Commun.,vol. 9, no. 3,
pp. 980–989, Mar. 2010.

National Conference on Research Advances in Communication, Computation, Electrical Science and Structures (NCRACCESS-2015)
ISSN: 2348 – 8549 www.internationaljournalssrg.org Page 168
[6] H. Li, T. Jiang, and Y. Zhou, “An improved tone
reservation schemewith fast convergence for PAPR reduction in OFDM systems,” IEEETransactions on
Broadcasting, vol. 57, no. 4, pp. 902-906, Dec. 2011.
[7] J.-C. Chen, M.-H.Chiu, Y.-S.Yang, and C.-P. Li, “A
suboptimal tonereservation algorithm based on cross-entropy method for PAPR reductionin OFDM systems,”
IEEE Transactions on Broadcasting, vol. 57, no. 3,pp. 752-756, Sep. 2011
[8] R. J. Baxley and G. T. Zhou, “Comparing selected
mapping and partialtransmit sequence for PAR reduction,”
IEEE Trans. Broadcast., vol. 53,no. 4, pp. 797–803, Dec. 2007.
[9] G. T. Zhou and L. Peng, “Optimality condition for
selected mapping inOFDM,”IEEE Trans. Signal Process.,
vol. 54, no. 8, pp. 3159–3165,Aug. 2006
[10] S. Lu, D. Qu, and Y. He, “Sliding window tone
reservation techniquefor the peak-to-average power ratio reduction of FBMC-OQAM signals,”IEEE Wireless
Commun. Lett., vol. 1, no. 4, pp. 268–271, Aug.2012.

An Efficient Architecture For Data Encoded With Error Correcting Using T-Algorithm Technique
R.Shyamala
M.E APPLIED ELECTRONICS J.J College of Engineering and Technology
Trichy,Tamilnadu,India [email protected]
Abstract— Error Correcting code is used to matching the data protected to reduce latency and complexity. Based on the fact that the codeword of an error correction code is usually represented in a systematic form consisting of raw data and parity information generated by encoding, the proposed architecture parallelizes the comparison of the data and that of parity information. To further reduce the latency and complexity,in addition,a new butterfly formed –weight accumulator(BWA) is proposed for the efficient computation of the Hamming distance.Grounded on the BWA,the proposed architecture examines whether the incoming data matches the stored data if a certain number of erroneous bits are corrected. Finally,T-algorithm is used to improve the encoding and decoding performance. Keywords— Data comparison, Error- correcting codes(ECC), Hamming distance,systematic codes,tag matching
I.INTRODUCTION
When digital data is transmitted or stored in nonvolatile memory, it is crucial to have a mechanism that can detect and correct a certain number of errors. Error correction code (ECC) encodes data in such a way that a decoder can identify and correct errors in the data. Typically, data strings are encoded by adding a number of redundant bits to them. When the original data is reconstructed, a decoder examines the encoded message to check for any errors. The combination of a simple decoder and reduced decoding time makes DS codes an attractive option for memory protection. Among the ECC codes that meet the requirements of higher error correction capability and low decoding complexity, cyclic block codes have been identified. Data comparison is widely used in computing systems to perform many operations such as the tag matching in a cache memory and the virtual-to-physical address translation in a translation lookaside buffer (TLB). Because of such prevalence, it is important to implement the comparison circuit with low hardware complexity. Besides, the data comparison usually resides in the critical path of the components that are devised to increase the system performance, e.g., caches and TLBs, whose outputs determine the flow of the succeeding operations in a pipeline. The circuit, therefore, must be designed to have as low latency as possible, or the components
will be disqualified from serving as accelerators and the overall performance of the whole system would be severely deteriorated. As recent computers employ error-correcting codes (ECCs) to protect data and improve reliability, complicated decoding procedure, which must precede the data comparison, elongates the critical path and exacerbates the complexity overhead. Thus, it becomes much harder to meet the above design constraints. The most recent solution for the matching problem is the direct compare method [6], which encodes the incoming data and then compares it with the retrieved data that has been encoded as well. Therefore, the method eliminates the complex decoding from the critical path. In performing the comparison, the method does not examine whether the retrieved data is exactly the same as the incoming data. Instead, it checks if the retrieved data resides in the error correctable range of the codeword corresponding to the incoming data. As the checking necessitates an additional circuit to compute the Hamming distance, i.e., the number of different bits between the two codewords, the saturate adder (SA) was presented in [6] as a basic building block for calculating the Hamming distance.However, [6] did not consider an important fact that may improve the effectiveness further, a practical ECC codeword is usually represented in a systematic form in which the data and parity parts are completely separated from each other [7]. In addition, as the SA always forces its output not to be greater than the number of detectable errors by more than one, it contributes to the increase of the entire circuit complexity. In this brief, we renovate the SA-based direct compare architecture to reduce the latency and hardware complexity by resolving the aforementioned drawbacks. More specifically, we consider the characteristics of systematic codes in designing the proposed architecture and propose a low-complexity processing element that computes the Hamming distance faster. Therefore, the latency and the hardware complexity are decreased considerably even compared with the SAbased architecture. The rest of this brief is organized as follows. Section II reviews previous works. The proposed architecture is explained in Section III, and evaluated in Section IV. Finally, concluding remarks are made in Section V.

II PREVIOUS WORK A. Decode-and-Compare Architecture Let us consider a cache memory where a k-bit tag is stored in the form of an n-bit codeword after being encoded by a (n, k) code. The n-bit retrieved codeword should first be decoded to extract the original k-bit tag. The extracted k-bit tag is then compared with the k-bit tag field of an incoming address to determine whether the tags are matched or not. As the retrieved codeword should go through the decoder before being compared with the incoming tag, the critical path is too long to be employed in a practical cache system designed for high-speed access. Since the decoder is one of the most complicated processing elements, in addition, the complexity overhead is not negligible. B. Encode-and-Compare Architecture Note that decoding is usually more complex and takes more time than encoding as it encompasses a series of error detection or syndrome calculation, and error correction [7]. The implementation results in [8] support the claim. To resolve the drawbacks of the decode-and-compare architecture, therefore, the decoding of a retrieved codeword is replaced with the encoding of an incoming tag in the encode-and-compare architecture More precisely, a k-bit incoming tag is first encoded to the corresponding n-bit codeword X and compared with an n-bit retrieved codeword Y as shown in Fig. 1(b). The comparison is to examine how many bits the two codewords differ, not to check if the two codewords are exactly equal to each other. For this, we compute the Hamming distance d between the two codewords and classify the cases according to the range of d. Let tmax and rmax denote the numbers of maximally correctable and detectable errors, respectively. The cases are summarized as follows. If d = 0, X matches Y exactly. If 0 < d ≤ tmax, X will match Y provided at most tmax errors in Y are corrected. If tmax < d ≤ rmax, Y has detectable but uncorrectable errors.In this case, the cache may issue a system fault so as to make the central processing unit take a proper action. If rmax < d, X does not match Y . Assuming that the incoming address has no errors, we can regard the two tags as matched if d is in either the first or the second ranges. In this way, while maintaining the error-correcting capability, the architecture can remove the decoder from its critical path at the cost of an encoder being newly introduced. Note that the encoder is, in general, much simpler than the decoder, and thus the encoding cost is significantly less than the decoding cost. Since the above method needs to compute the Hamming distance, [6] presented a circuit dedicated for the computation of bits in X and Y so as to generate a vector representing the bitwise difference of the two codewords. The following half adders (HAs) are used to count the number of 1’s in two adjacent bits in the vector. The
numbers of 1’s are accumulated by passing through the following SA tree
III. PROPOSED WORK
ENCODER
ARCHITECTURE
DECODER ARCHITECTURE
DECISION UNIT
BWA ARCHITECTURE
KEY GENERATION
PROCESS
HAMMING DISTANCE
Figure 3.1.block diagram
This section presents a new architecture that can reduce the latency and complexity of the data comparison by using the characteristics of to reduce the latency and complexity further. A. Datapath Design for Systematic Codes In the SA-based architecture [6], the comparison of two codeword is invoked after the incoming tag is encoded. Therefore, the critical path consists of a series of the encoding

and the n-bit comparison practice, the ECC codeword is of a systematic form in which the data and parity parts are completely separated . As the data part of a systematic codeword is exactly the same as the incoming tag field, it is immediately available for comparison while the parity part becomes available only after the encoding is completed. Grounded on this fact, the comparison of the k-bit tags can be started before the remaining (n–k)-bit comparison of the parity bits. In the proposed architecture, therefore, the encoding process to generate the parity bits from the incoming tag is performed in parallel with thetag comparison, reducing the overa latency . B. Architecture for Computing the Hamming Distance The proposed architecture grounded on the datapath design . It contains multiple butterfly-formed weight accumulators (BWAs) proposed to improve the latency and complexity of the Hamming distance computation. The basic function of the BWA is to count the number of 1’s among its input bits. It consists of multiple stages. is associated with a weight. The HAs in a stage are connected in a butterfly form so as to accumulate the carry bits and the sum bits of the upper stage separately. In other words, both inputs of a HA in a stage, except the first stage, are either carry bits or sum bits computed in the upper stage. This connection method leads to a property that if an output bit of a HA is set, the number of 1’s among the bits in the paths reaching the HA is equal to the weight of the output bit. If the carry bit of the gray-colored HA is set, the number of 1’s among the associated input bits,
i.e., A, B, C and D is 2. Each XOR stage generates the bitwise difference vector for either data bits or parity bits, and the following processing elements count the number of 1’s in the
vector, i.e., the Hamming distance. In the interconnection, such outputs are fed into their associated processing elements at the second level. The output of the OR-gate tree is connected to the subsequent OR-gate tree at the second level, and the remaining weight bits are connected to the second level BWAs according to their weights. More precisely, the bits of weight w are connected to the BWA responsible for w-weight inputs. Each BWA at the second level is associated with a weight of a power of two that is less than or equal to Pmax, where Pmax is the largest power of two that is not greater than rmax + 1. As the weight bits associated with the fourth range are all ORed in the revised BWAs, there is no need to deal with the powers of two that are larger than Pmax the decision unit finally determines if the incoming tag matches the retrieved codeword by considering the four ranges of the Hamming distance. The decision unit is in fact a combinational logic of which functionality is specified by a truth table that takes the outputs of the preceding circuits as inputs. C. General Expressions for the Complexity and the Latency The complexity as well as the latency of combinational circuits heavily depends on the algorithm employed. In addition, as the complexity and the latency are usually conflicting with each other, is unfortunately hard to derive an analytical and fully deterministic equation that shows the relationship between the number of gates and the latency for
the proposed architecture and also for the conventional SA-based architecture.The proposed architecture is effective in reducing the latency as well as the hardware complexity even with considering the practical factors. Note that the effectiveness of the proposed architecture over the SA-based one in shortening the latency gets larger as the size of a codeword increases. The latencies of the SA-based architecture and the proposed one are dominated by SAs and HAs, respectively. As the bit width doubles, at least one more stage of SAs or HAs needs to be added. Since the critical path of a HA consists of only one gate while that of a SA has several gates, the proposed architecture achieves lower latency than its SA-based counterpart, especially for long codewords.The power consumption level and path delay for modified architecture to be low.The architecture Complexity also will be reduced.The encoding of a retrieved code-word is replaced with the encoding of an incoming tag in the encode-and-compare architecture.The proposed method consumes low latency. And the circuit delay time level to be less.The architecture performance to be high.To reduce the circuit complexity and
optimize the no of logical blocks also.
IV.SIMULATION RESULT The below waveform is the simulation output of data encoder.
Figure 4.1.simulation output

V.CONCLUSION
To reduce the latency and hardware complexity, a new architecture has been presented for matching the data protected with an ECC. The proposed architecture examines whether the incoming data matches the stored data if a certain number of erroneous bits are corrected. To reduce the latency, the comparison of the data is parallelized with the encoding process that generates the parity information. The parallel operations are enabled based on the fact that the systematic codeword has separate fields for the data and parity. In addition, an efficient processing architecture has been presented to further minimize the latency and complexity. As the proposed architecture is effective in reducing the latency as well as the complexity considerably, it can be regarded as a promising solution for the comparison of ECC-protected data. Though this brief focuses only on the tag match of a cache memory, the proposed method is applicable to diverse applications that need such comparison. REFERENCES [1] J. Chang, M. Huang, J. Shoemaker, J. Benoit, S.-L. Chen, W. Chen, S. Chiu, R. Ganesan, G. Leong, V. Lukka, S. Rusu, and D. Srivastava, “The 65-nm 16-MB shared on-die L3 cache for the dual-core Intel xeon processor 7100 series,” IEEE J. Solid-State Circuits, vol. 42, no. 4, pp. 846–852, Apr. 2007. [2] J. D. Warnock, Y.-H. Chan, S. M. Carey, H. Wen, P. J. Meaney, G. Gerwig, H. H. Smith, Y. H. Chan, J. Davis, P. Bunce, A. Pelella, D. Rodko, P. Patel, T. Strach, D. Malone, F. Malgioglio, J. Neves, D. L. Rude, and W. V. Huott “Circuit and physical
design implementation of the microprocessor chip for the zEnterprise system,” IEEE J. Solid-State Circuits, vol. 47, no. 1, pp. 151–163, Jan. 2012. [3] H. Ando, Y. Yoshida, A. Inoue, I. Sugiyama, T. Asakawa, K. Morita, T. Muta, and T. Motokurumada, S. Okada, H. Yamashita, and Y. Satsukawa, “A 1.3 GHz fifth generation
SPARC64 microprocessor,” in IEEE ISSCC. Dig. Tech. Papers, Feb. 2003, pp. 246–247. [4] M. Tremblay and S. Chaudhry, “A third-generation 65nm 16-core 32-thread plus 32-scout-thread CMT SPARC processor,” in ISSCC. Dig. Tech. Papers, Feb. 2008, pp. 82–
83. [5] AMD Inc. (2010). Family 10h AMD Opteron Processor Product Data Sheet, Sunnyvale, CA, USA [Online]. Available: http://support.amd.com/us/Processor_TechDocs/40036.pdf [6] W. Wu, D. Somasekhar, and S.-L. Lu, “Direct compare of
information coded with error-correcting codes,” IEEE Trans. Very Large Scale Integr. (VLSI) Syst., vol. 20, no. 11, pp. 2147–2151, Nov. 2012.
[7] S. Lin and D. J. Costello, Error Control Coding: Fundamentals and Applications, 2nd ed. Englewood Cliffs, NJ, USA: Prentice-Hall, 2004. [8] Y. Lee, H. Yoo, and I.-C. Park, “6.4Gb/s multi-threaded BCH encoder and decoder for multi-channel SSD controllers,” in ISSCC Dig. Tech. Papers, 2012, pp.

A Low Power And Delay Efficient DA-based Reconfigurable FIR Filter
K.Ragavi, M.E Applied Electronics, J.J college of Engineering and technology,Trichy, Tamilnadu, India,[email protected]
Abstract—This paper propose high-speed, low-power, low delay architecture of a reconfigurable finite impulse response(FIR) filterwhich serves as a major components of field programmable gate array. Distributed arithmetic (DA) approaches used to an efficient pipelined architecture for high speed finite-impulse response (FIR) filters whose filter coefficients changes during runtime. The RAM and RAM based look up tables are used to implement the ASIC and FPGA. The look up tables for DA-based comutations are used to systolic decomposition scheme for flexible to perform the filtering process and used to area time tradeoff. This method used to reduce the memory size and increase the adder complexity, and increase the carry propagation timing, so the efficient DA-based realization of FIR filters are used to flexible linear systolic design is implemented on a Xilinx Virtex-5(XC5VSX95T-1FF1136 ) FPGA using a hybrid adder architecture for increase the performance levels in fpga. A distributed RAM-based design also proposed for the field-programmable-gate-array implementation of the reconfigurable fir filter, which supports up to 95MHz input sampling frequency and offers 50% and 17% less the number of slices than the systolic structure and the BEC-based structure. Keywords- finite-impulse response (FIR), distributed architecture, hybrid adder architecture, BEC, systolic architecture
I.INTRODUCTION
The finite impulse response (FIR) filter is one of the most fundamental components in digital signal processing. Its block schematic is shown in Fig. 1. Due to the high amount of multiply-accumulate (MAC) operations, the computational power of many real-time applications can only by realized by using the parallel nature of of application specific integrated circuits (ASICs) like field programmable gate arrays (FPGAs).To reduce the performance gap between ASICs and FPGAs, digital filters were one of the driving forces to push embedded multipliers or DSP blocks into the FPGA fabric. The price for those fixed coarse-grained blocks are their inflexibility and limited quantity. However, in many applications like for digital filters, the multiplications have to be performed only with constants that may be only reconfigured from time to time which can be used to reduce the complexity. Examples are multi-stage filters for decimation or interpolation like polyphase FIR filters [1] or frequency variable filters as needed in telecommunications,
digital audio, medical, and radar. The fir filters are used to increase the speed, and used to less power.
fig 1: FIR filter
As field programmable gate array (FPGA) technology has steadily improved. The fpga become alternative have other technology implementations are very high speed in FIR filter in digital signal processing. The systolic decomposition technique is suggested by P.K.Meher et al[5]. I n this paper this method is used to many applications. (i.e) Real time vision processing system, All type of analog system, Hearing aid, All type of digital and image processing system. The DA-based implementation of Fir filter is reduce the memory requirement it means it reduce the number of slices or number of look up tables, and reduce the area, increase the performance level of carry selection timing, propagation timing, adding and multiplication timing[4]. The look up table is used to digital to analog convertor, multichannel fir filters, reconfigurable fir filter etc.In this paper reduce the delay unit increase the speed, reduce the delay, increase the power consumption. In this next section, we discuss about design flow in section II, proposed reconfigurable DA-based FIR filter in section III, and simulation output in section IV and conclude the paper.
III. DESIGN FLOW
Design flow is described below, first given the input bit sample to the delay unit. This delay unt is used to reduce the delay in the performance timing for FIR filter. The error bit sample also given the input. Because the real time images or signals don’t have a noise. But we implement the signals so we add the error bit also. Then the two inputs are given to the

PPG(partial product generation) block. It perform by the multiplication process for increasing the speed. And ppg unit output is sequentially given to the hybrid adder architecture block. This unit perform the adding and multiplication process very fasly and reduce the delay timing and increase the speed. Then hybrid adder output is directly given to the LSB and MSB add unit.This unit is act as a BEC unit and performing the operations. Finally got a output low-delay, high-speed, high power consumption.
CHAPTER 2
INPUT BIT SAMPLES
DELAY CIRCUIT
ERROR BIT SAMPLES
PARTIAL PRODUCT GENERATION BLOCK
DELAY UNIT HYBRID ADDER ARCHITECTURE
LSB AND MSB ADD UNIT
FINAL OUTPUT SAMPLES
figure 2: Design Flow
A. PARTIAL PRODUCT GENERATION The partial product generation unit is perform the multiplication and adding process. It reduce the timing for performance.This unit is increase the speed in fir filter,
figure 3: PPG unit
B. HYBRID ADDER ARCHITECTURE
The hybrid adder architecture is a combination of carry look ahead adder and carry save adder. It perform very fastly. So increase the timing and reduce the delay. Because it reduce the carry propagation timing. The hybrid adder architecture is generate the weighted bits for the LMS adaptive filter for finite filtering process.
figure 4: hybrid adder architecture
C. LSB AND MSB ADD UNIT
Hybrid adder output is given to the lsb ans msb add unit. It add the first and last bit only. It is used to BEC operation for performance. It reduce the performance timing and improve the efficiency.

III. PROPOSED RECONFIGURABLE DA-BASED FIR FILTER
In proposed method of reconfigurable DA-based FIR filter is used the shift add architecture. So take some time for propagation timing. Need more time for performance because more timing has carry selection and propagation.
INPUT BIT PRE-
PROCESSING
PARTIAL
PRODUCT
GENERATOR
DELAY -
ADDER
UNIT
ERROR BIT
HYBRID –
ADDER
BLOCK
figure 5: block diagram for proposed method
The proposed structure of the DA-based FIR filter used for ASIC implementation . The input samples {x(n)}arriving at every sampling instant are fed to a serial-in–parallel out shift register (SIPOSR) of size N. The SIPOSR decomposes the N recent most samples to P vectors bp of length M for product generators (RPPGs) to calculate the partial products according to partial product propagation.. The structure of the proposed RPPG is depicted in for M = 2. For high-throughput implementation, the RPPG generates L partial products corresponding to L bit slices in parallel using the LUT composed of a single register bank of 2M − 1 registers and L number of 2M : 1 MUXes. In the proposed structure, we reduce the storage consumption by sharing each LUT across L bit slices. The register array is preferred for this purpose rather than memory-based LUT in order to access the LUT contents simultaneously. In addition, the contents in the register-based LUT can be updated in parallelin fewer cycles than the memory-based LUT to implement desired FIR filter. The width of each register in the LUT is (W + _log2M_) bits, where W is the word length of the filter coefficient. The input of the MUX es are 0, h(2p), h(2p + 1), and h(2p) + h(2p + 1); and the two-bit digit bl, p is fed to MUX l for 0 ≤ l ≤ L − 1 as
a control word. We can find that MUX l provides the partial product Sl, p for 0 ≤ l ≤ L − 1. The proposed reconfigurable FIR filter may be also implemented as part for the complete system on FPGA. Therefore, here we propose a reconfigurable DA-based FIR filter for FPGA implementation. The architecture suggested in Section III for high-throughput implementation of DA-based FIR filter is not suitable for FPGA implementation. The structure in involves N(2M − 1)/M number of registers for the implementation of LUTs for FIR filter of length N. However, registers are scarce resource in FPGA since each LUT in many FPGA devices contains only two bits of registers. Therefore, the LUTs are required to be implemented by distributed RAM (DRAM) for FPGA implementation. However, unlike the case of the RPPG. The multiple number of partial inner products Sl,p cannot be retrieved from the DRAM simultaneously since only one LUT value can be read from the DRAM per cycle. Moreover, if L is the bit width of input, the duration of the sample period of the design is L times the operating clock period, which may not be suitable for the application requiring high throughput. Using a DRAM to implement LUT for each bit slice will lead to very high resource consumption. Thus, we decompose the partial inner-product generator into Q parallel sections and each section has R time-multiplexed operations corresponding to R bit slices.
figure 6: proposed structure of DA-based fir filter
IV. SIMULATION RESULT

Simulation output fig 7, given the inputs 16 bit data and clock signal and error bit finally get a weighted output.
t
figure 7: simulation output for DA-based distributed FIR filter
TABEL I
PERFORMANCE COMPARISON TABLE OF IMPLEMENTATION FOR DA-BASED FIR
FILTER
DELAY(ns) 3.73 1.06
SPEED(MHz) 425 575
POWER(Mw) 2 3.7
V. CONCLUSION In this paper, the reconfigurable FIR filter architecture
DA-based primitive which can be mapped to all modernFPGA’s of Xilinx. DA-based distributed arithmetic approaches in FIR filter are derived by area-delay-power efficient implementations. We have suggested efficient pipelined architecture DA-based adaptive filter to support the high speed, low delay, high power consumption. The proposed design does not use LUT and use half number of gate components. Use the hybrid adder architecture reduce the carry propagation timing so increase the speed. The proposed
reconfigurable FIR filter architecture whwn successfully implemented on xilnx vertex-5 FPGA device yield high speed, reduce the delay, and increase the power consumption.
REFERENCES
[1] T. Hentschel, M. Henker, and G. Fettweis, “The digital front-end of software radio terminals,” IEEE Pers. Commun. Mag., vol. 6, no. 4, pp. 40–46, Aug. 1999. [2] K.-H. Chen and T.-D. Chiueh, “A low-power digit-based reconfigurable FIR filter,” IEEE Trans. Circuits Syst. II, Exp. Briefs, vol. 53, no. 8, pp. 617–621, Aug. 2006. [3] L. Ming and Y. Chao, “The multiplexed structure of multi-channel FIR filter and its resources evaluation,” in Proc. Int. Conf. CDCIEM, Mar. 2012, pp. 764–768. [4] P. K. Meher, “Hardware-efficient systolization of DA-based calculation of finite digital convolution,” IEEE Trans. Circuits Syst. II, Exp. Briefs, vol. 53, no. 8, pp. 707–711, Aug. 2006. [5] P. K. Meher, S. Chandrasekaran, and A. Amira, “FPGA realization of FIR filters by efficient and flexible systolization using distributed arithmetic,” IEEE Trans. Signal Process., vol. 56, no. 7, pp. 3009–3017, Jul. 2008. [6] M. Kumm, K. Moller, and P. Zipf, “Dynamically reconfigurable FIR filter architectures with fast reconfiguration,” in Proc. 8th Int. Workshop ReCoSoC, Jul. 2013, pp. 1–8. [7] E. Ozalevli, W. Huang, P. E. Hasler, and D. V. Anderson, “A reconfigurable mixed-signal VLSI implementation of distributed arithmetic used for finite-impulse response filtering,” IEEE Trans. Circuits Syst. I, Reg. Papers, vol. 55, no. 2, pp. 510–521, Mar. 2008. [8] D. J. Allred, H. Yoo, V. Krishnan, W. Huang, and D. V. Anderson, “LMS adaptive filters using distributed arithmetic for high throughput,” IEEE Trans. Circuits Syst. I, Reg. Papers, vol. 52, no. 7, pp. 1327–1337, Jul. 2005. [9] P. K. Meher and S. Y. Park, “High-throughput pipelined realization of adaptive FIR filter based on distributed arithmetic,” in Proc. IEEE/IFIP 19th Int. Conf. VLSI-SOC, Oct. 2011, pp. 428–433. [10] LogiCORE IP FIR Compiler v5.0, Xilinx, Inc., San Jose, CA, USA, 2010.

National Conference on Research Advances in Communication, Computation, Electrical Science and Structures (NCRACCESS-2015)
ISSN: 2348 – 8549 www.internationaljournalssrg.org Page 177
Double Integral Image Architecture of Guided Filter for Full HD Video
M.Muthuselvi1, Mr.V.Suresh2
1PG Student, VLSI Design, Department of ECE 2Assistant Professor, Department of ECE
Maha Barathi Engineering College- Chinnasalem , Tamilnadu, India.
ABSTRACT--Guided filter is recently proposed in filtering technique which is widely used in image and video processing for various applications. In this paper to increase throughput, VLSI design of double integral image architecture of guided filter is proposed. Instead of using convolution multiplication process in guided filter, the folding transformation is proposed here to reduce the number of functional elements. Because of the reduction in functional elements, the gate count will be reduced. So the area of the architecture is reduced and the efficiency will be increased up to 50%.
I. INTRODUCTION Image processing is any form of signal processing for which the input is an image, such as a photograph or video frame; the output of image processing may be either an image or a set of characteristics or parameters related to the image. Most image-processing techniques involve treating the image as a two-dimensional signal and applying standard signal processing techniques to it. Digital image processing is the use of computer algorithms to perform image processing on digital images. As a subcategory or field of digital signal processing, digital image processing has many advantages over analog image processing. It allows a much wider range of algorithms to be applied to the input data and can avoid problems such as the build-up of noise and signal distortion during processing.
FPGA based hardware accelerators have become more and more important for bioinformatics applications. These applications use wide range of algorithms, including searches in large databases, sequence alignment, statistical analysis and image processing. A part of these algorithms can be efficiently accelerated using FPGA devices.
Biological and biomedical experiments like microarray experiments, high-content screening (HCS) or cellular microscopy result in large amount of image data. These data have to be processed to evaluate the experiments. There are different applications available for this purpose, for example the Cell Profiler, which can process and analyze cellular microscopy images. The final goal would be an FPGA based hardware accelerator for (biomedical) image processing purposes. This would include several reconfigurable execution units, which would enable the parallel processing of the data.
This project introduces a reconfigurable test system and two basic image processing functions implemented with FPGA. These functions are a 3 x 3 median filter and a 3 x 3 sobel filter, which can process 8 bit grayscale images. Advanced RISC microprocessors can solve complex computing tasks through a programming paradigm, based on fixed hardware resources. For most computing tasks it is cheaper and faster to develop a program in general-purpose processors (GPPs) specifically to solve them. These costs involve three parts:
a) Hardware costs: GPPs are larger and more complex than necessary for the execution of a specific task. Developing application-specific processors for highly specialized algorithms is warranted only for large-volume applications that may require high power efficiency at expense of great hardware design cost;
b) Design costs: functional units that may be rarely used in a given application may be present in GPPs, and may consume substantial part of the design effort;
c) Energy costs: too much power is spent with functional units or blocks not used during a large fraction of the processing time. For specific applications or demanding requirements in terms of power, speed or costs, one may rely on either dedicated processors or

National Conference on Research Advances in Communication, Computation, Electrical Science and Structures (NCRACCESS-2015)
ISSN: 2348 – 8549 www.internationaljournalssrg.org Page 178
reused core processors, which may be well suited to the application or optimized for a given set of performance.
In a pure hardware model, a given algorithm is converted into a single hardware description, which is loaded into the FPGA. There is no relevant contribution of this model to reconfigurable architectures, since the configuration is fixed at design time.
a) Statically reconfigurable design (SRD): The circuit has several configurations (N) and the reconfiguration occurs only at the end of each processing task. This can be classified as runtime reconfiguration, depending on the granularity of the tasks performed between two successive reconfigurations. In this way, the programmable devices are better used and the circuit can be partitioned, aiming for resources reusability.
b) Dynamically reconfigurable design (DRD): The circuit also has N configurations, but the reconfiguration takes place at runtime. This kind of design uses more efficiently the reconfigurable architectures. The timing overhead associated to this RTR procedure has to be well characterized within the domain of the possible set of runtime configurations.
The overall performance wills be determined by the overhead-to-computing ratio. The implementation may use partially programmable devices or a set of conventional programmable devices. The resultant architecture is called DRA .The image data, as well as all constants and coefficients used in the following design concept, are integer numbers. As discussed in Section VI, there is no need to implement floating-point computation. With the aid of the presented design concept, the Guided filter can be realized as a highly parallelized pipeline structure giving great importance to the effective re-source utilization.
Fig. 1 Order of the functional units of the Guided filter.
The design concept for the implementation of the Guided filter is subdivided into three functional blocks. The block-based design approach reduces design complexity and simplifies validation. Fig.1.1 presents these units and their order in the concept. The input data marked by “Data_in” are read line by line and arranged
for further processing in the register matrix. The second unit is the photometric filter which weights the input data according to the intensity of the processed pixels. The filtering is completed by the geometric filter, and the filtered data are marked by “Data_out.”
This paper is structured as given by. A review and related work in section II. Design of hardware architecture in section III. Next, in section IV simulation and output result will be discussed. Finally, a conclusion is in last section V.
II. RELATED WORK A. A Programmable Image Processing System
Using FFGA [1] A median filter is a non-linear digital filter
which is able to preserve sharp signal changes and is very effective in removing impulse noise (or salt and pepper noise). An impulse noise has a gray level with higher or lower value that is different from the neighborhood point. Linear filters don‟t have ability to
remove this type of noise without affecting the distinguishing characteristics of the signal. Median filters have remarkable advantages over linear filters for this particular type of noise. Therefore median filter is very widely used in digital signal and image/video processing applications. Here, they proposed a flexible architecture, PIPS, for the integration of these programmable hardware and digital signal processors (DSP) to handle bit-level as well as arithmetic operations found in many image processing applications. B. A Hierarchical And Parallel Soc Architecture
For Vision Processor [2] A hierarchical and parallel SoC (System on Chip)
architecture for vision processor. The vision computing is divided into 3 task level parallel computing modules, which are vision decision, feature reorganization (or pattern generation), feature extraction. In the proposed

National Conference on Research Advances in Communication, Computation, Electrical Science and Structures (NCRACCESS-2015)
ISSN: 2348 – 8549 www.internationaljournalssrg.org Page 179
architecture, there are two separately buses to integrate the 3 computing modules, and also the new interrupt for RISC processor to implement the synchronization between the hardware modules and software.
C. A Fully Parallel 1-Mb Cam LSI For Real-Time
Pixel-Parallel Image Processing [3] Real-time image-processing applications are
carried out with highly parallel system that exploits parallelism. A content addressable memory (CAM), or an associative processor, that can perform various types of parallel processing with words as the basic unit is a promising component for creating such a system because of its suitability for LSI implementation. Conventional CAM LSI's, however, have neither efficient function nor enough capacity for pixel-parallel processing. This paper describes a fully parallel 1-Mb CAM LSI. It has advanced functions for processing various pixel-parallel algorithms, such as mathematical morphology and discrete-time cellular neural networks. D. Guided Image Filtering [4]
A novel explicit image filter called guided filter. Derived from a local linear model, the guided filter computes the filtering output by considering the content of a guidance image, which can be the input image itself or another different image. The guided filter can be used as an edge-preserving smoothing operator like the popular bilateral filter, but it has better behaviors near edges. The guided filter is also a more generic concept beyond smoothing: It can transfer the structures of the guidance image to the filtering output, enabling new filtering applications like dehazing and guided feathering. Experiments show that the guided filter is both effective and efficient in a great variety of computer vision and computer graphics applications, including edge-aware smoothing, detail enhancement, HDR compression, image matting/feathering, dehazing, joint up sampling, etc.
E. Hierarchical Joint Bilateral Filtering For Depth Post-Processing [5]
Various 3D applications require accurate and smooth depth map, and post-processing is necessary for depth map directly generated by different correspondence algorithms. A hierarchical joint bilateral
filtering method is proposed to improve the coarse depth map. By first carrying out depth confidence measuring, pixels are put into different categories according to their matching confidence. Then the initial coarse depth map is down-sampled together with the corresponding confidence map. Depth map is progressively fixed during multistep up sampling. Different from many filtering approaches, confident matches are propagated to unconfident regions by suppressing outliers in a hierarchical structure. Experiment results present that the proposed method can achieve significant improvement of initial depth map with low computational complexity.
F. A Novel Object Recognition Method Based On
Improved Edge Tracing For Binary Images [6] Edge tracing process is one of the basic topics in image processing. The aim of the process is to evaluate image information and reduce it to adequate contour line by eliminating the unnecessary information that takes time for recognition process. It has always been an interesting research field because of possessing very important information about geometrical features of objects. The task of edge tracing plays an important role in object recognition. This project can explain it as follows: The human seeing system looks at any object firstly during the recognition period and runs an eye over the contour points of it. After tracing contour points, geometrical information of objects is obtained. This information is transformed to electrical signals and transmitted to brain and recognition process comes to an end. When apply this approach to the artificial seeing systems, it is essential to trace edges of objects effectively to reach a successful recognition novel object recognition method based on an improved edge tracing method for binary images. The most important difference between NORMBI and traditional methods is to obtain geometrical shapes information and edge points of objects simultaneously by scanning image matrix once. It means to improve speed factor that has a vital important for object recognition.

National Conference on Research Advances in Communication, Computation, Electrical Science and Structures (NCRACCESS-2015)
ISSN: 2348 – 8549 www.internationaljournalssrg.org Page 180
III. DESIGN OF HARDWARE
ARCHITECTURE
The design consists of six integral image engines (IIEs), one coefficient kernel engine, and one output kernel engine. The IIE is extended from the histogram calculation engine proposed. However, the novelties of this paper are not at the IIE, but the design of coefficient (ak , bk ) and output (qi ) kernel
engine, and the double integral image architecture for the guided image filter. For the hardware implementation, the operating frequency is 100 MHz, and the input video format is full-HD (1920×1080), 30
frame/s. Since the implementation in the paper is a prototype of the proposed guided filter architecture, an IO wrapper is needed between the ASIC design and bus. The specification of the IO wrapper depends on the parameters of guided filter and the type of bus that are chosen by the user. The proposed scalable architecture can be also applied to different specifications of guided filter by modifying the hardware parameters. If a specific application of different parameter is needed, the reader can use the proposed architecture for guided filter to implement customized IP depending on their requirements.
Fig .2. Proposed architecture of guided filter with double integral image
A. Integral Image Engine
The concept of the IIE is as shown in Fig. 4. This engine uses pixel values (e.g., IS, IQ ) as input and
calculates the sum of window of it (
i∈wk Ii ). As the
integral histogram architec- ture proposed by Tseng et al. [6], the usage of on-chip memory can be effectively reduced by the runtime updating method (RUM), stripe-
based method (SBM), and sliding origin method (SOM). We modify the architecture from the proposed method in to calculate the integral image. By the stripe-based method, the amount of processing data at each time is reduced to a stripe from a whole frame.

National Conference on Research Advances in Communication, Computation, Electrical Science and Structures (NCRACCESS-2015)
ISSN: 2348 – 8549 www.internationaljournalssrg.org Page 181
B. Coefficient Kernel Engine
In this section, the reformation of a guided filter formula for hardware design is proposed. Using the reformed formula, the architecture of ak and bk engine
avoids the error propagation in decimal computation brought by truncation in each division operation. The only fraction part resulted from the final division, and the choice of number of bits in the fraction part will be discussed in Section III-B3. Compared with the brute force calculation of the original formula (3), the times of division is reduced from 4 to 1. Three divisions in average operations are replaced by two multiplications, which effectively reduces the circuit complexity and calculation error. In the reformed formula (7), there are two multiplications that need the area (|w|) of window (wk) as input. For handling the boundary conditions,
an area counter is needed for different windows, since the window area changes at stripe boundary.
IV. SIMULATION AND OUTPUT
A. Simulation Output
Fig. 3 MODELSIM Output
The MODELSIM simulation output as shown in Fig.3. If given an input can set as for clock value „1‟,
reset value „1‟ and input data (data_in) values are set and
simulate. This clock value again set to „0‟ and simulate.
If the reset value as set „0‟ and simulation is break.
B. MATLAB Output
The MATLAB load the input guided image and simulate the MODELSIM of simulation can run. Then MATLAB program of input image, guided image, bilateral filter. Input image of noise shown in the fig. 4.
Fig.4 Input Image
Fig. 5 Guided Image
Guided filter can be eliminate noise of the input image and shown in the Fig.5

National Conference on Research Advances in Communication, Computation, Electrical Science and Structures (NCRACCESS-2015)
ISSN: 2348 – 8549 www.internationaljournalssrg.org Page 182
V. CONCLUSION
This project has proposed a VLSI architecture design for guided filter. To achieve the computation demand of guided filtering in full HD video, double integral image architecture design for folding transformation is proposed. The hardware efficiency, architecture is also the best compared to other previous works. Future work use folding transform to reduce hardware complex, area to reduce by time multiplexing operation and increased computation time. The proposed guided filter design using TSMC 90-nm technology. Moreover, the guided filter performs in many applications. These modifications are implementing to the FPGA kit.
REFERENCES
[1]. Chieh-Chi Kao, Jui-Hsin Lai, Member, IEEE, and Shao-Yi Chien, Member, IEEE “VLSI Architecture Design of Guided Filter for 30 Frames/s Full-HD Video” IEEE transactions on circuits and systems for video technology, vol. 24, no. 3, march 2014.
[2]. Kaiming He, Jian Sun “Guided Image Filtering,", in. proc, Pattern Analysis And Machine Intelligence, Sep 2013.
[3]. M.de - frutos - lopez , H.Medina-chanca “Perceptually-aware bilateral filter for quality improvement in low it rate video coding,” in proc. IEEE PCS.2012.
[4]. J. Won Lee, R.-H. Park, and S. Chang, “Noise reduction and adaptive contrast enhancement for local tone mapping,” IEEE Trans. Consume. Electron. May 2012.
[5]. Y. Cao, S. Fang, and F. Wang, “Single image multi-focusing based on local blur estimation,” in Proc. 6th ICIG, 2011
[6]. Y. Ding, J. Xiao, and J. Yu, “Importance filtering for image retargeting,”in Proc. IEEE Conf. CVPR , 2011, pp. 89–96.
[7]. Rhemann, A. Hosni, M. Bleyer, C. Rother, and M. Gelautz, “Fastcost volume filtering for visual correspondence and
beyond,” in Proc.IEEE Conf. CVPR, 2011, pp. 3017–3024.
[8]. S.-K. Han, “An architecture for high-throughput and improved-quality stereo vision processor,” Master‟s Thesis, Dept. Electr. Eng., Univ. of Maryland, College Park, MD, USA, 2010.
[9]. O.Gangwal, E. Coezijn, and R.-P. Berretty, “Real-time
implementation of depth map post-processing for 3D-TV
on a programmable DSP(TriMedia),” in Proc. Dig. Tech. Papers ICCE, 2009.
[10]. Z. Farbman, R. Fattal, D. Lischinski, and R. Szeliski,
“Edge-preserving decompositions for multiscale tone and detail manipulation,” ACM Trans. Graph., vol. 27, no. 3, pp. 67:1–67:10, Aug. 2008.
[11]. Durand and J. Dorsey, “Fast bilateral filtering for the
display of high dynamic-range images,” ACM Trans. Graph., vol. 21, no. 3, pp. 257–266,Jul. 2002

National Conference on Research Advances in Communication, Computation, Electrical Science and Structures (NCRACCESS-2015)
ISSN: 2348 – 8549 www.internationaljournalssrg.org Page 183
Shadow Detection and Reconstruction in High-Resolution Satellite Images via Morphological Filtering and Example-Based Learning
Ms.S.Thirumalaikani PG Scholar, Applied Electronics
Sardar Raja college of Engineering Alangulam, India
Mr.B.karthik Asst.Professor, ECE department
Sardar Raja college of Engineering Alangulam, India
ABSTRACT— Shadow detection algorithm based on morphological filtering and a novel shadow reconstruction algorithm based on the example learning method. In the shadow detection stage, an initial shadow mask is generated by the thresholding method, and then, the noise and wrong shadow regions are removed by the morphological filtering method. The shadow reconstruction stage consists of two phases the example-based learning phase and the inference phase. During the example-based learning phase, the shadow and the corresponding non-shadow pixels are first manually sampled from the study scene, and then, these samples form a shadow library and a non-shadow library, which are correlated by a Markov Random Field (MRF).During the inference phase, the underlying land cover pixels are reconstructed from the corresponding shadow pixels by adopting the Bayesian belief propagation algorithm to solve the MRF.
Keywords— shadow detection,morphological filtering,shadow reconstruction.markov random field,bayesian belief propagation.
I. INTRODUCTION
Shadows occur when objects occlude direct light from a source of illumination, which is usually the sun. According to the principle of formation, shadows can be divided into cast shadow and self-shadow. Cast shadow is formulated by the projection of objects in the direction of the light source; self shadow refers to the part of the object that is not illuminated. For a cast shadow, the part of it where direct light is completely blocked by an object is termed the umbra, while the part where direct light is partially blocked is termed the penumbra. Because of the existence of a penumbra, there will not be a definite boundary between shadowed and non-shadowed areas. At present, most of the VHSR satellite sensors are designed with orbit type of sun synchronous and equatorial crossing time earlier in a day; this is because the atmosphere is generally clearer in the morning than later in the day. For example, the
equatorial crossing times of QB, IKONOS, and WV-2 are 10:00 A.M., 10:30 A.M., and 10:30 A.M., respectively. This means that the solar elevation will never be high, irrespective of latitude and season. Thus, the problem of shadowing is particularly significant in high-resolution satellite images, and this will cause false image colors and further hinder the application of VHSR images, such as the generation of a classification map. Accordingly, we propose a new method of detecting and reconstructing shadows in VHSR satellite images. Because self-shadows usually have higher brightness than cast shadows, this paper focuses only on the cast shadows, as is the case in previous literature dealing with shadows of VHSR satellite images. With the variation of acquisition conditions and the height of erected objects, the penumbra cannot sometimes be neglected, particularly when the brightness of the surrounding shadowed areas is intense. The penumbra effect will be handled by shadow edge compensation in the proposed shadow detection algorithm.
Fig. No: 1. Shadows Representation
II. EXISTING METHODS
Regarding shadow detection in VHSR images, two main approaches are reported in the previous literature, namely, the model-based and the

National Conference on Research Advances in Communication, Computation, Electrical Science and Structures (NCRACCESS-2015)
ISSN: 2348 – 8549 www.internationaljournalssrg.org Page 184
property-based. The former requires prior knowledge of scene or sensors, including, but not limited to, distribution of scene radiance and acquisition parameters like sun azimuth, sensor/camera localization, date, and the time of day of acquisition. Based on the prior information, the model-based approaches obtain good performance in detecting a particular type of objects like buildings and vehicles. These approaches are not general enough to deal with the great diversity of geometric structures which usually exist in VHSR satellite images of urban areas. The property-based approaches make use of certain shadow properties in images, such as brightness, spectral characteristics, and geometry. Because of their simplicity both in principle and implementation, the property-based approaches have been widely used in literature; they generally include four (usually interrelated) categories:
1) Thresholding-based. 2) Color-transformation-based. 3) Region-growing-based. 4) Classification-based. In the Thresholding-based methods, the shadow and non-shadow pixels are determined according to a predefined threshold level, which usually can be set according to the bimodal distribution of image histogram, such as the method in. In the color-transformation-based methods, the Red–Green–Blue (RGB) color image is first transformed to a 3-D space, such as hue–intensity–saturation, Hue–
Saturation–Value (HSV), and YCbCr models; then, a new image is derived according to specific spectral properties of shadows in new space, such as shadow areas having lower intensity, higher hue values, and higher saturation; finally, shadows are detected by thresholding the derived new image. The proposed shadow detection method in first transformed the RGB image into HSV space and then derived a Normalized Saturation–Value Difference Index (NSVDI) to identify shadows via thresholding. Several photometric invariant color models for shadow detection were compared in. In the region-growing-based methods, the seed points are first selected, and then, each of the pixels is assigned to a segment according to their distance from those regions to which they could potentially be assigned. For example, the shadow detection method first transformed the RGB image into c1c2c3 color space, and then, the region growing process was applied to the c3 component. The classification methods can also be employed for
shadow detection because of the commonly possessed properties in shadowed areas, such as their lower intensity. Classification method for shadow detection, in which a binary classification procedure was implemented in a supervised manner to derive a shadow-versus-non-shadow mask. In order to reconstruct the detected shadowed areas, three algorithms were introduced namely, the gamma correction method, the linear-correlation method, and the histogram matching method. The gamma correction method considered the shadow as a multiplicative source that corrupts the brightness of the underlying pixels and then built the relationship between shadow and non-shadow pixels with a power function. In the linear-correlation method, the shadow was modeled as a combination of additive and multiplicative noise, and then, the non-shadow pixels to the first order were restored by a linear function. In the histogram-matching method, the histogram of the shadowed region was matched to that of the non-shadow area of the same class in a window. In these algorithms, the parameters were first calibrated before shadow removal by extracting training data sets from the image. The limitations in these algorithms are that the estimated parameters can only be applied in a local region and that the shadows in the training phase and in the estimation phase should be captured under the same condition. In linear regression method to bridge non-shadow and shadow areas for each class in each band. Recently, another linear-regression-based method for shadow reconstruction, which assumed that both shadow and non-shadow pixels of each class follow a Gaussian distribution and then solved the linear regression parameters by the parametric estimation method. The problem with these linear regression methods is that they lost local variability for each class due to the implementation in a global manner. Clearly, all the aforementioned methods for shadow reconstruction are based on classification and thus need to determine the class of the shadowed areas before reconstruction. In the algorithm, the first step was to collect ground-truth region pairs for all classes, i.e., non-shadow classes and their shadow counterparts; then, these ground-truths regions were utilized for supervised classification in shadow and non-shadow classes separately. In the shadow reconstruction method proposed in this paper, a similar ground-truth collection procedure will be adopted but without the classification step. In this paper, we propose an alternative shadow detection algorithm based on thresholding and morphological filtering, together with an alternative shadow reconstruction

National Conference on Research Advances in Communication, Computation, Electrical Science and Structures (NCRACCESS-2015)
ISSN: 2348 – 8549 www.internationaljournalssrg.org Page 185
algorithm based on the example learning method and Markov Random Field (MRF). During the shadow detection procedure, the bimodal distributions of pixel values in the near-infrared (NIR) band and the panchromatic band are adopted for thresholding. During the shadow reconstruction procedure, we model the relationship between non-shadow and the corresponding shadow pixels and between neighboring non shadow pixels by employing MRF.
II. PROPOSED METHOD
The flowchart in Fig. No. 2 shows the
principal steps of the proposed methodology. The whole procedure includes shadow detection and shadow reconstruction stages by executing on a Multispectral (MS) satellite image of an urban area scene. The main contribution of this paper in the shadow detection stage is that we combine thresholding and morphological filtering techniques by considering the spectral characteristics of different land-cover types. The shadow detection stage consists of three main steps: thresholding, morphological filtering, and edge compensation. First, a preliminary shadow mask is derived by the thresholding method according to the spectral characteristics of the MS image. Then, this shadow mask is elaborated by morphological operations to filter noise and the wrong shadow areas. Finally, the shadow edges are compensated considering the effects of penumbra and the surrounding conditions of shadows on VHSR images. The shadow reconstruction stage includes two main steps: example-based training and shadow reconstruction via Bayesian belief propagation (BBP). Before the training step, the non-shadow and shadow samples are first Collected from the same image scene manually by visual judgment. Then, the training samples formulate a non-shadow library and a shadow library, which are correlated by an MRF. With the trained non-shadow and shadow libraries, the underlying non-shadow pixels can be reconstructed from the corresponding shadow pixels according to the derived shadow mask in the shadow detection stage.
A. Morphological Filtering For Shadow Detection
The NIR spectrum has higher reflectivity than visual spectrum for many urban land-cover types; the digital number (DN) values of urban VHSR images are higher in the NIR band than in other bands. For shadow areas, the DN values in an NIR band drop in a higher degree because of the occlusion of direct
sunlight. The DN ratio of light shadow and sunlight is lower in NIR band than in RGB bands. The threshold level can then be determined by the bimodal histogram splitting method. The threshold level T is set to the mean of the two peaks in the NIR histogram, which was found by experiments to give consistently accurate threshold levels in separating the shadow from the non-shadow regions. The shadow mask is then derived by the following formula:
(1)
Shadow mask derived from the thresholding method with black indicating shadow pixels and white indicating non-shadow pixels. From this that there are two problems: 1) the existence of many small discontinuous shadow regions caused by the salt and- pepper noise in VHSR images and 2) the wrong shadow regions caused by the low DNs of some objects both in the NIR and the panchromatic bands, particularly roads. In order to keep the shape of the detected shadow regions and to remove the noise, we adopt the morphological image processing method to enhance the detected shadow mask MT derived from the thresholding method. Moreover, the morphological operations can also remove the wrong shadow regions with appropriate prior information.
Mathematical morphology is a set- and lattice-theoretic methodology for image analysis, which aims erations are generated, namely, opening (erosion followed by dilation) and closing (dilation followed by erosion), which keep the general shape of objects but possess different smoothing effects. Specifically, the opening removes small protrusions and thin connections, whereas the closing fills in small holes.
B. Shadow Edge Compensation
The width of the penumbra varies with the
changes in the elevation angle of the sun and the height of the objects. For simplicity, the penumbra effect is tackled by compensating one pixel at the shadow edges. However, for shadow areas whose surroundings are high-brightness areas, their shadow edges are strongly affected, and therefore, the penumbra width needs to be extended in this case. Compensate these shadow edges by conducting the following steps: growing both high-brightness areas and shadow areas along back-light and to-light directions, respectively, by a dilation operation, and taking their intersecting regions as the compensated

National Conference on Research Advances in Communication, Computation, Electrical Science and Structures (NCRACCESS-2015)
ISSN: 2348 – 8549 www.internationaljournalssrg.org Page 186
shadow edge regions.
Fig. No: 2. Flowchart of the proposed method.
C. Markov Random Field
Markov random field (MRF), Markov network or undirected graphical model is a set of random variables having a markov property described by an undirected graph. MRFs are used for image restoration, image completion, segmentation, image registration, texture synthesis, super-resolution, stereo matching and information retrieval.
• Pairwise Markov property: Any two non-adjacent variables are conditionally independent given all other variables.
• Local Markov property: A variable is conditionally independent of all other variables given its neighbors.
• Global Markov property: Any two subsets of variables are conditionally independent given a separating subset.
For each shadow and the underlying non-shadow pixels, they are assigned to one node of a Markov network; each node is statistically independent from other nodes except its direct neighbors. For a VHSR image with B-bands, a shadow pixel vector (PV) is denoted as Vs∈ RB (i.e., the pixel values on all bands) and the underlying non-shadow PV as Vn∈ RB. Connect each non-shadow PV both to its corresponding shadow PV and to its spatial neighbors, as the example with four pixels shown in Fig. no. 3. Each non-shadow PV Vn (i, j) is related to its corresponding shadow PV Vs (i, j) and its neighbors Vn(i + 1, j), Vn (i, j + 1), Vn (i − 1, j), and Vn(i, j − 1).
Fig. No: 3. MRF model for shadow and non-shadow pixels
D. Bayesian Belief Propagation
Belief propagation, also known as sum-product message passing algorithm for performing inference on graphical models, such as Bayesian networks and Markov random fields. Given the shadow region Rs = [Vs(1, 1), Vs(1, 2),…, Vs(I, J)], we seek to estimate the underlying non-shadow region Rn = [Vn(1, 1), Vn(1, 2), . . . ,Vn(I, J)], where I and J are the maximum indices of rows and columns, respectively. We can rewrite the joint probability P (Rs, Rn),
P (Rs, Rn) = P [Vs (1, 1), Vs (1, 2), . . . , Vs (I, J), Vn(1, 1), Vn (1, 2), . . . , Vn (I, J)] (2) BBP method efficiently find a local maximum of the posterior probability for the non-shadow PVs, given the shadow PVs. BBP is a message-passing algorithm for performing inference on the MRF. The
TRAINING IMAGE
RECONSTRUCTED IMAGE
MASKING
FILTERING
EDGE COMPENSATION
BAYESIAN BELIEF PROPAGATION
ORIGINAL IMAGE

National Conference on Research Advances in Communication, Computation, Electrical Science and Structures (NCRACCESS-2015)
ISSN: 2348 – 8549 www.internationaljournalssrg.org Page 187
advantage of BBP is that it accumulates local computation to avoid the global computation by recursively updating the local messages between adjacent unknown or known nodes.
I. SIMULATION RESULTS
Original image is taken from the WorldView-2 database. This image will be given us the input. The input image is resized from the original size of the image. This is done to reduce the computational complexity. Resized image will be converted into gray scale image. The further processes are done on gray scale. In this stage gray scale image will be analyzed and unwanted noise removed from the gray scale image using median filter.
Fig.No:4. Illustration of high resolution
satellite image
(a) (b)
(c) (d)
Fig.No:5. (a) Original image with shadows. (b) Gray scale image. (c) Detected shadow region using morphological filtering. (d) Reconstructed image using Bayesian belief propagation.
Then shadows region will be identified using morphological filter. After removing the shadows the image will be reconstructed.
II. CONCLUSION
This project is a solution to detect the shadows and reconstruct the original image which consists of shadow detection algorithm and shadow reconstruction algorithm. Morphological filtering was used in shadow detection. Example based learning method was used in shadow reconstruction algorithm. In the detection stage, an initial shadow mask was generated by the thresholding method, then the noise and wrong shadow regions were removed. The reconstruction phase consists of two stages namely example-based learning phase and inference phase. In example-based learning phase, the shadow and the non-shadow pixels are first manually sampled from the study scene and grouped into separate libraries which are correlated by Markov Random Field (MRF). In the Inference phase, the underlying land cover pixels are reconstructed from the corresponding shadow pixels by adopting the Bayesian belief propagation algorithm to solve the MRF. Images from Quick Bird and WorldView-2 databases were considered for the project.
REFERENCES
[1] A.Katartzis and H. Sahli, “A stochastic framework for the identification of building rooftops using a single remote sensing image,” IEEE Trans. Geosci. Remote Sens., vol. 46, no. 1, pp. 259–271, Jan. 2008.
[2] F. Yamazaki, W. Liu, and M. Takasaki, “Characteristics of shadow and removal of its effects for remote sensing imagery,” in Proc. IEEE IGARSS, Jul. 2009, vol. 4, pp. 426–429.
[3] L.Lorenzi, F. Melgani, and G. Mercier, “A complete processing chain for shadow detection and reconstruction in VHR images,” IEEE Trans. Geosci. Remote Sens., vol. 50, no. 9, pp. 3440–3452, Sep. 2012.
[4] M. Mokhtarzade and M. J. V. Zoej, “Road detection from high-resolution satellite images using artificial neural networks,” Int. J. Appl. Earth Observ. Geoinf., vol. 9, no. 1, pp. 32–40, Feb. 2007.
[5] P.M Dare “Shadow analysis in high-resolution satellite imagery of urban areas,” Photogramm. Eng. Remote Sens., vol. 71, no. 2, pp.169–177, Feb. 2005.
[6] P. Sarabandi, F. Yamazaki, M. Matsuoka, and A. Kiremidjian, “Shadow detection and radiometric restoration in satellite high resolution images,” in Proc. IEEE IGARSS, Sep. 2004, vol. 6, pp. 3744–3747.
[7] V. Tsai, “A comparative study on shadow compensation of color aerial images in invariant color models,” IEEE Trans. Geosci. Remote Sens., vol. 44, no. 6, pp. 1661–1671, Jun. 2006.

National Conference on Research Advances in Communication, Computation, Electrical Science and Structures (NCRACCESS-2015)
ISSN: 2348 – 8549 www.internationaljournalssrg.org Page 188
[8] V. Aaévalo, J. González, and G. Ambrosio, “Shadow detection in colour high-resolution satellite images,”
Int. J. Remote Sens., vol. 29, no. 7, pp. 1945–1963, Apr. 2008.
[9] W.T Freeman, T. R. Jones, and E. C. Pasztor, “Example-based super resolution,” IEEE Comput. Graph. Appl., vol. 22, no. 2, pp. 56–65, Mar./Apr. 2002.
[10] W.T Freeman, E. C. Pasztor, and O. T. Carmichael, “Learning low-level vision,” Int. J. Comput. Vis., vol. 40, no. 1, pp. 25–47, Oct. 2000.

National Conference on Research Advances in Communication, Computation, Electrical Science and Structures (NCRACCESS-2015)
ISSN: 2348 – 8549 www.internationaljournalssrg.org Page 189
SOFT CHANNEL ESTIMATION AND SOFT DATA DETECTION FOR MIMO OFDM USING MD- GSIR
C.Divya- Assistant Professor, Department of ECE, Bharathiyar Institute of Engineering for Women
Abstract—a graph-based receiver is presented that iteratively performs soft channel estimation and soft data detection. Re- liability information of data symbols is utilized to improve channel estimation, and in turn, soft channel estimates refine data symbol estimates. The proposed multi-dimensional factor graph introduces transfer nodes that exploit correlation of adjacent channel coefficients in an arbitrary number of dimensions (e.g. Time, frequency, and spatial domain). This establishes a simple and flexible receiver structure that facilitates soft channel estimation and data detection in multi-dimensional dispersive channels, and supports arbitrary modulation and channel coding schemes. Simulation results demonstrate that the proposed multi- dimensional graph-based receiver outperforms iterative and non- iterative state-of-the-art receivers.
I. INTRODUCTION
Multiple-input multiple-output (MIMO) transmission in conjunction with orthogonal frequency-division multiplexing (OFDM) is considered a key technology for emerging wireless radio systems such as 3GPP long term evolution (LTE). To facilitate coherent detection, knowledge of the channel response is required at the receiver end. The most common method to provide the receiver with channel state information (CSI), is to embed training symbols, known at the receiver, within the transmitted signal stream. To reconstruct the OFDM channel impulse response at the positions of the unknown data symbols, two-dimensional interpolation and filtering over time (OFDM symbols) and frequency (subcarriers) is often adopted . With the growing popularity of MIMO transmission, channel
estimators operating not only over time and/or frequency, but also the spatial domain emerged While MIMO-OFDM promises substantial diversity and/or capacity gains the required training overhead grows in proportion to the number of transmit. Iterative receivers utilizing the turbo principle that jointly carry out channel estimation and data detection are a potential enabler to reduce the required training overhead for MIMO-OFDM.
The MD-GSIR performance is compared to non-iterative and iterative state of- the-art algorithms, namely to a non-iterative symbol-wise ML detector in combination with a 2D Wiener filter, and an iterative a posteriori probability (APP) detector with EM based channel estimation. The presented simulation results provide a comprehensive overview of the achievable performance of advanced MIMO-OFDM receivers operating in various channel conditions, with different modulation formats and code rates. The remainder of this paper is organized as follows: Section II defines the system and channel model. The MDGSIR and the transfer nodes are introduced in Section III. A convergence analysis of MD-GSIR based on EXIT charts as well as numerical results for two different channel models are presented in Section IV. Finally, Section V draws the conclusions. Throughout the paper, we adopt the following notation conventions: (·)∗ denotes the conjugate complex, P(x) and p(x) are the probability and the probability density function (pdf) of a random variable x, respectively. The expectation operator is given by E{·}.

National Conference on Research Advances in Communication, Computation, Electrical Science and Structures (NCRACCESS-2015)
ISSN: 2348 – 8549 www.internationaljournalssrg.org Page 190
II. MD-GSIR: MULTI-DIMENSIONAL GRAPH-BASED SOFT ITERATIVE RECEIVER
Factor graphs are powerful graphical tools that have been applied to a large variety of problems in digital communications [22], [23]. Generally, a factor graph is a bipartite graph, i.e., the nodes of a graph are partitioned into two disjoint sets U and V such that every edge connects a node u ∈ U with a node of v ∈ V. An exchange of information between
Fig. 1. Training grid with a periodic spacing between adjacent training symbols of Df in frequency and Dt in time.
Fig. 2. Message exchange between the GSIR receiver and the channel decoder nodes of the same set is forbidden. Message exchange between these sets is facilitated, e.g., according
to the sum-product algorithm [22]. The following sections explain the proposed multidimensional graph-based soft iterative receiver (MD-GSIR) in detail. The general factor graph structure of MIMO-OFDM and the generation of soft channel estimates are introduced in Section III-A and III-B. Section III-C derives the transfer nodes that leverage multi-dimensional channel estimation. The information exchange at coefficient nodes and soft data detection are presented in Section III-A and III-C. Finally, the message scheduling achieving best performance is detailed in Section III-F.
A. Receiver Structure and Associated Factor Graph
Bit-interleaved coded modulation (BICM) is considered. After OFDM demodulation, the MD-GSIR jointly estimates the channel coefficients and data symbols as illustrated in Fig. 2. The log-likelihood ratios (LLRs) of the data bits are passed to the deinterleaved and descrambler. The channel decoder processes the deinterleaved and descrambled LLRs and feeds back extrinsic information of the decoded data symbols. One global iteration comprises one MD-GSIR and one Turbo decoding iteration. After interleaving and scrambling, the MDGSIR uses the extrinsic information as a priori information in subsequent iterations. The objective of MD-GSIR is to perform joint channel estimation and data detection, which involves the estimation of two types of variables, namely data bits bm,ν[l, k] and channel coefficients hn,m[l, k].
For MD-GSIR the variance of the channel coefficients is therefore increased by a factor ¦Â>1. The message sent from a coefficient node to a transfer node therefore yields p(hn,m) ∼ CN (μh,n,m, βσ
2) The value of β = 1.02 is found
by empirical measures and attains good performance for all studied cases.

National Conference on Research Advances in Communication, Computation, Electrical Science and Structures (NCRACCESS-2015)
ISSN: 2348 – 8549 www.internationaljournalssrg.org Page 191
Fig.3. Message exchange at a coefficient node.
For an azimuth angle of φ = 0◦, ωs = 1 and the calculation of the variance in spatial domain can further be simplified as
(1)
Apart from the uniform distribution, typical distributions of the azimuth angle of departure are the von Mises distribution or the Laplacian distribution [38]. Given identical distributions, the rule to calculate the variance is independent of the domain, as can be seen from (13), (17), and (24). In case that fading is present in one domain only, the same uncoded BER and/or mean squared error (MSE) performance is achieved, independent in which domain the fading occurs.
B. Information Exchange at Coefficient Nodes
In general, a message generated at a node of a factor graph needs to consider all adjacent nodes, except the node for which the message is generated, so to ensure that only extrinsic messages are exchanged. For a node that is connected to N other nodes, N.1 incoming messages have to be processed in order to generate one outgoing message. For the MD-GSIR, a coefficient node is connected to two transfer nodes in each domain (time, frequency or space) and one symbol node, as illustrated in the left part of Fig. 5. Suppose a channel
coefficient receives the messages pj(h) ~CN(µ j,σ
2j), jϵ {1, . . .,N} from N adjacent
transfer nodes. The product of Gaussian pdfs results in a complex valued normal distribution
(2)
with mean and variance
(3)
The exchange of extrinsic messages is depicted in the right part of Fig. 5. The combined message, denoted by p(hi n,m) ∼ CN μi,n,m[l, k], σ2 i,n,m[l, k] is subsequently sent to an observation node.
C. Message Exchange Scheduling
The structure of the underlying factor graph is a trade-off between complexity and performance. It is well known that short cycles deteriorate the performance of the sum-product algorithm. Short cycles occur when a message, which leaves a node, ’travels’ only a few nodes
until it is send back to its origin. Strategies have been developed that merge several nodes in order to prevent short cycles in the message exchange. This inherently involves higher computational complexity w.r.t. the message generation. The presented symbol-wise factor graph structure exhibits a low computational complexity. Hence, message scheduling plays an important role to achieve a good performance. For a factor graph with cycles, message scheduling should ensure that the message a node receives contains as few information of the node itself. Related to MD-GSIR, this means that messages of different domains should be exchanged successively, e.g., messages are exchanged in the time domain first, afterwards

National Conference on Research Advances in Communication, Computation, Electrical Science and Structures (NCRACCESS-2015)
ISSN: 2348 – 8549 www.internationaljournalssrg.org Page 192
messages are exchanged in the frequency domain, or vice versa. The underlying principle is dubbed “two-way schedule” in [41]. A
message is sent from a coefficient node to a transfer node and from there to the next coefficient node in the same domain; thus producing a burst that traverses in the direction of the desired domain. If the last coefficient node of the selected domain is reached, messages are propagated in the reversed direction. The two-way schedule is finished when the coefficient node that started the message exchange receives a message. The schedule hereby ensures that incoming messages are the combination of the maximum number of outgoing messages of one domain. An alternative scheduling is given by the “flooding”
schedule [41], which distributes the messages simultaneously in all domains. However, messages arriving at a node may contain intrinsic information with this schedule, which leads to a degradation w.r.t. performance. The scheduling also determines which domain exchanges its information first. During initialization, all messages are set to zero mean and a large variance, except for the training symbols where the mean value is known and the variance is determined by AWGN.
III. NUMERICAL RESULTS
Fig plots BER results for 8×8 MIMO with QAM modulation
IV. CONCLUSION
A novel soft iterative channel estimation and data detection scheme for MIMO-OFDM over multi-selective
channels is presented in this paper. Messages representing estimates of the channel coefficients and data symbols are efficiently generated according to the sum-product algorithm and distributed throughout the factor graph via transfer nodes. Closed-form derivations for the transfer nodes in time, frequency and space are presented, which are able to accurately model the fading process of a mobile radio channel in three dimensions. Reliability information of both data symbols and channel estimates are used to iteratively refine each other. Simulation results show that a gain of 3 dB with each additional domain can be achieved for triply-selective channel model dispersion parameters in all domains.
REFERENCES
1. J.-W. Choi and Y.-H. Lee, “Complexity-reduced channel estimation in spatially correlated MIMO-OFDM systems,” IEICE Trans. Commun., vol. E90-B, no. 9, pp. 2609–2612, Sep. 2007.
2. F. R. Kschischang, B. J. Frey, and H.-A. Loeliger, “Factor graphs and the sum-product algorithm,” IEEE Trans. Inf. Theory, vol. 47, no. 2, pp.498–519, Feb. 2001.
3. H.-A. Loeliger, J. Dauwels, J. Hu, S. Korl, L. Ping, and F. R. Kschischang, “The factor graph approach to model-based signal processing,”Proc. IEEE, vol. 95, no. 6, pp. 1295–1322, June 2007.
4. I. E. Telatar, “Capacity of multi-antenna Gaussian channels,” EuropeaTrans. Telecommun. (ETT), vol. 10, no. 6, pp. 585–595, Nov./Dec. 1999
5. T. Wo, C. Liu, and P. A. Hoeher, “Graph-based iterative Gaussian detection with soft channel estimation for MIMO systems,” in Proc. 2008 Int. ITG-Conf. Source Channel Coding.
6. T. Wo, J. C. Fricke, and P. A. Hoeher, “A graph-based iterative Gaussian detector for frequency-selective MIMO channels,” in Proc. 2006 IEEE Inf. Theory Workshop, pp. 581–585.
7. Y. Zhu, D. Guo, and M. L. Honig, “A message-passing approach forjoint channel estimation, interference mitigation and decoding,” IEEE Trans. Wireless Commun., vol. 8, no. 12, pp. 6008–6018, Dec. 2009.
-4 -2 0 2 4 6 8 10 12 14 16
10-0.3
10-0.2
Eb/No in dB
BER
16 QAM modulation in an AWGN channel
3D
2D

Embedded System for Sea Buoy Location and Tracking
l.Keerthana1 – Assistant Professor/ECE,
K.apsara2, S.Nithya3, R.Radhai4 and A.Rajeswari5 – Final Year ECE –, Bharathiyar Institute of Engineering for Women, Deviyakurichi, Salem.
Abstract— underwater acoustic communication technology is an effective mean of development and study of the sea. It is mainly used in marine environment 3D monitoring, underwater multimedia communication, subsurface mobile carrier navigation and positioning, detection of marine resources, remote control of submarine topography mapping and data acquisition, etc. The sea buoy is an vital part of underwater acoustic communication system. It is of obvious significance to track and discover it. This paper defines the claim of the monitoring service of GPRS / GPS module at sea buoy. It can accomplish real-time location of underwater acoustic communication devices and route tracking to avoid the loss of the device, as well as support to repossess the lost device.
Keywords—underwater acoustic communication, sea buoy, track and locate, GPRS GPS
I. INTRODUCTION
The essential difference between underwater acoustic communication and wireless communication is the different physical characteristics of their propagation mediums. Due to the characteristics of high consume of the radio in the water, it is unrealistic to use the land fairly mature wireless communication technology in underwater communication. Underwater cable less communication has been the obstacle of “sea, land and air” three-dimensional interconnection for a long time. So a lot of maturity program of the wireless communication cannot be directly applied in the underwater acoustic communication. Establishing the oceanographic survey platform to obtain cumulative data analysis will help to study the channel’s regularity. What’s more, it can provide a relatively convenient environment to verify the feasibility of the simulation results in a real environment and facilitate the research work carried out smoothly.
The sea buoy system, as a carrying platform of launch, acquisition and GPS and other equipments, connects with the control center via the wireless network to transmit data and receive instructions from the control center. The buoys equipment communicates with each other through the underwater acoustic channel. The platform is convenient for experiments carried on the sea, and enables remote monitoring and management.
The control center is mainly responsible for the buoy system GPS information data receiving, extraction, processing. It also reads and writes data records to the database, transmits data information to the javascript server, and receives feedback information, and finally processes and displays the information. Javascript server plays a role in receiving terminal data and communicate with Baidu Maps API service to achieve related functions. Oracle database provides data services. Sea buoy as an important part of the maritime communication system, has an important place in the underwater acoustic communication. So it is important to track and locate it.
II. THE DESIGN OF THE LOCATOR
GPS is currently the most widely used positioning system and the technical is also very mature. Due to the special circumstances of the marine environment, wired communication by a large degree of restrictions, is obviously unrealistic. With the consideration of the wide coverage of the GSM network and the even signal, the GPS satellite
ARM71DIMI
CORTEX-
M3(LPC1768)
POWER
SUPPLY
GPS/GSM
MODULE
AIR PRESSURE
TEMPERATURE
SENSOR
HUMIDITY
SENSOR
MAX232/USB/
LAN
MONITORING
PC USING
LABVIEW/MA
TLAB
LINUX_OS
MOBILE

positioning and GPRS data transmission function perfectly integration will be a good design. The paper will discuss the application of highly integrated GPRS / GPS tracking locator in sea buoy tracking and positioning. The design of the locator includes both hardware and software design. A. Hardware design
We use the GSM and GPS chip as the design module. The module can be widely used in a variety of positioning fields with its expansion application as remote positioning terminal. GSM baseband chip is a highly integrated chip PMB7880 of Infineon. It has an advantage of low price and small size[1]. GPS positioning chips is the third cohort satellite positioning receive chip SiRF star III of SiRF[2]. can simultaneously track 20 satellite channels, high positioning accuracy, high sensitivity and fast positioning. Figure 2 shows the modular structure and framework diagram.
(a) Modular Structure
(b) Modular Framework
Fig. 2. The Module Diagram
The terminal product is function expansion based on the module, such as adding SIM card , antenna, speaker and so on. The locator’s block diagram is shown below:
(a) Design framework
(b) Module Appearance
(c) Locator Appearance Fig. 3. The Locator Design and Physical Map B. Software design
The module will call Baidu Maps API method through the Javascript technology[3] to achieve the following map service functions: real-time monitoring, track playback, electronic fences, map labels, and other functions. Javascript and Oracle[4] connect through OLEDB. We can get history records, latitude and longitude information extracted from the records and playback track through connection between javascrip and the database. Since the received data of the GPS receiver contains a variety of data and in fact we are concerned on

The $GPRMC beginning data block [5], we have to process it into the information which is easily understood and convenient to be displayed.
The locator will register mobile network, connect GPRS, open GPS positioning, open analog serial to analyze GPS data and lit indicator after start. It will turn off GPS and GPRS in a power-saving mode when there is no data request.
The terminal locator uses GPRS of SMS to communicate with the server. GPRS communication is essentially based on TCP/IP protocol TCP for data transmission. It uses request / response synchronous communication model. When using SMS, SMS encodes with binary PDU. Figure 4 shows the structure of the protocol stack.
2. Track playback: It’s convenient for users to query trajectory of the terminal equipment within a certain dated of time. You just need to select the incurable name or IMEI number, set the starting and ending time and playback speed, and then can choose to play (Track playback time can not be setted more than 7 * 24 hours).
Fig. 4. The Mobile Positioning Communication Protocol Stack Structure
III. EXPERIMENT RESULT
The control center can view the real-time location information of the monitored equipment, and display on map of Baidu. The locator’s major functions are as
follows: 1. Real-time monitoring: real-time display of actual
position information of online terminals without refresh the page.
Real-time Monitoring
Track Playback
3. Electronic fence: According to the users’ needs to
set an arbitrary polygon and polygon set for the security of the terminal. If the incurable location is out of the range, it will send alarm information to the host.
Electronic Fences

4. Map labels: Users can make text label on the
position they interested. The text annotation can be saved or deleted.
IV. CONCLUSION
GPS satellite positioning and GPRS data transmission functions perfectly integrated locator used for tracking and positioning of the buoys can facilitate the research work, and furthermore it reduces the expensive the possibility of underwater acoustic communications equipments’ accident lost or stolen.
ACKNOWLEDGMENT This work was supported by the Fundamental
Research Funds for the Central Universities (2011121050, 2012121028), the National Natural Science Foundation of China (61001142,61071150) and the Science Technology Project of Xiamen Government (3502Z20123011)
Map Label
REFERENCES [1] Zhang Xingwei, “Single-chip mobile phone circuit principle and
repair”, Beijing: Publishing House of Electronics Industry, 2009 [2] “SiRF Star III GPS Module User’s Manual ver 1.02” [3] Tom Negrino, Dori Smith write, “The JavaScript Basic Course”,
Beijing: People's Post and Telecommunications Press, 2009 [4] Shan De-hua, “The oracle database and applications”, Beijing:
Science Press, 2011 [5] Lu Hai-tao, Hou Tong-pu, Li Jian, “Embedded automobile
positioning system terminal development based on GPS and GPRS”, Computer & Digital Engineering, Vol.38, No.6,
pp.150-154&174,2010.

National Conference on Research Advances in Communication, Computation, Electrical Science and Structures (NCRACCESS-2015)
ISSN: 2348 – 8549 www.internationaljournalssrg.org Page 197
WSN-Based Smart Sensors and Actuator for Power Management in Intelligent Buildings
Guided By
P.SUDHA AP/ECE Abstract- The devise and improvement of a well-dressed monitoring and scheming system for household electrical appliances in real time has been reported in this paper. The system principally monitor electrical parameters of household appliances such as electrical energy and current and consequently calculates the power inspired. The innovation of this structure is the execution of the controlling system of appliances in different ways. The residential system is a discounted and flexible in function and thus can save electrical energy price of the customers. The sample has been widely experienced in real-life situations and investigational outcome are very encouraging.
I. INTRODUCTION:
IT is foreseen that examine and individual care wireless mechatronic systems will become more and more everywhere at home in the close to future and will be very useful in assistive healthcare mainly for the old and disabled inhabitants. Wireless mechatronic systems consist of frequent spatially scattered sensors with limited data set and processing capability to monitor the environmental position. Wireless sensor networks (WSNs) have become gradually more important because of their ability to monitor and control situational information for various quick services. Due to those advantages, WSNs has been applied in many fields, such as the military, industry, environmental monitoring, and healthcare.
II.METHODOLOGY: This system consists of a home set of connections unit and a gateway. The interior division of the spreading out is the
Batch Members
A.Elakkiya V.Elakkiya R.Ragapriya A.Seema Bharathi interoperability of different networks in the home environment. Less substance is given to the home mechanization.
In this section, we briefly discuss the presented works about neat home systems based on the wireless communication technology. planned a Home Energy Management System (HEMS) using the ZigBee technology to cut the standby power. The suggested system consists of an automatic standby power cutoff outlet, a ZigBee hub and a server. The power outlet with a ZigBee module cuts off the ac power when the energy consumption of the device connected to the power outlet is lower a fixed value. The central hub collects information from the power channels and controls these power channels through the ZigBee part. The central hub sends the present state information to a server and then a user can monitor or control the present energy usage using the HEMS user edge. This facility may create some discomfort for the users. For example, if the users may want low strength of light, for some situation but the system will slash the power off leading to shadows. The above mentioned home monitoring and controlling systems have limitations with respect to true home

National Conference on Research Advances in Communication, Computation, Electrical Science and Structures (NCRACCESS-2015)
ISSN: 2348 – 8549 www.internationaljournalssrg.org Page 198
automation such as: 1) energy using up control mechanism is imperfect to only certain devices like light illuminations, whereas several household appliances can be prohibited; 2) energy control is based on fixed threshold power utilization, which may not be related to different consumers; 3) controlling the home appliances through network executive functions, in perform resident supplies may vary according to their behavior but not with system uniqueness. Not a single system has taken into concern of changeable duty of electrical energy, which is extreme during day and night.. In this paper, a low-cost, supple, and instantaneous smart power management system, which can easily incorporate and operate with the home monitoring systems such as [22] is presented.
III. SYSTEM DESCRIPTION
The system has been intended for capacity of electrical parameters of household appliances. Important functions to the system are the ease of modeling, system, and use. From the user peak of sight, electrical power consumption of a range of appliances in a house along with supply voltage and current is the input parameter. Fig. 1 shows the functinal report of the industrial system to monitor electrical parameters and control appliances based on the consumer requirements. The measurement of electrical parameters of home appliances is through by interfacing with fabricated sensing modules. The information of the plan and increase of the sensing modules are provided in the following sections. The output signals from the sensors are integrated and connected to XBee module for transmitting electrical parameters data wirelessly. The XBee modules are interfaced with various sensing procedure and interrelated in the form of mesh topology to have reliable data response at a centralized ZigBee controller. The highest distance between the nearby ZigBee nodes is less than 10 m, and through hopping technique of the mesh topology, reliable sensor mixture data has been performed. The ZigBee manager has been connected through the USBcable of the mass computer, which stores the data into a database of processor system. The composed sensor mixture data have been sent to an internet inhabited gateway for remote monitoring and controlling the home atmosphere. By analyzing the power from the system, energy consumption can be controlled. An electricity excise plan has been set up to run various appliances at peak and off-peak tariff rates. The appliances are controlled either mechanically or physically (local/remotely). The
smart power metering circuit is joined to mains 240 V/50 Hz supply. Fig. 2 shows different appliances connected to the developed smart sensing system. Fig. 3(a) and(b) shows the fabricated smart sensing measurement system.
A. Measurement of Electrical Parameters
1) Voltage Measurement:
The voltage transformer used in our document is the 44 127 voltage step-down transformer man-made by MYRRA [23]. The striking features include two bobbins compartments as well as self-extinguishing plastics and very light power (100 g). The step-down voltage transformer is used to adapt input supply of 230–240 V to 10 VRMS ac signal. The secondary voltage is rectified and passed through the filter capacitor to get a dc electrical energy. The details are shown in Fig. 3(a). The available dc electrical energy is reduced by a possible separator to bring it within the measured level of 3.3 V of the ZigBee. This output pointer is then fed to analog put in channel of ZigBee ending device. The acquired voltage signal is directly comparative to the enter supply voltage. A voltage control device is related to the rectified output of voltage transformer to obtain the specific voltage supply of 3.3 V for the operation of ZigBee and prepared speaker. The scaling of the signal is obtained from the input versus output voltage graph as shown in Fig. 4. The concrete voltage is thus obtained as follows. 2) Current Measurement: For sensing current, we used ASM010 current transformer affected by Talema [24]. The main facial appearance of this sensor include fully encapsulated PCB increasing and compact size. The circuit design draft for current measurement is shown in Fig. 3(a). In this current sensor, the voltage is measured crosswise the encumber resistor of 50 Ω. The necessary filtering and magnification is required to bring the voltage with the necessary measurement level of ZigBee. The scaling factors for current measurement for two different ranges of currents are shown in Fig. 5. Two different current Transformers are used for two different ranges: 0–1 A and 1–10 A, correspondingly. 3) Power Measurement: In order to calculate power of a single-phase ac path, the product of route mean square (RMS) voltage and RMS current must be multiplied by the power feature as given in (3). Power factor is the

National Conference on Research Advances in Communication, Computation, Electrical Science and Structures (NCRACCESS-2015)
ISSN: 2348 – 8549 www.internationaljournalssrg.org Page 199
cosine of the stage position of voltage and current waveforms as shown in the Fig. 6 for an model situation. The output signal of the current transformer Completely depends on the nature of the coupled appliances whether the connected load is only resistive, capacitive, or inductive. In most of the home appliances, the output waveforms are not pure sinusoidal as shown in the following graphs for different loading circumstances. From the graphs, it is inferred that zero-crossing determination is difficult to measure for some of the appliances and removal of noise is not trivial. Moreover, it is not essential for this application to measure power with nil error. Hence, in our paper, instead of measuring power factor, we have introduced improvement factor to normalize the received power with respect to the real power based on the scaling factors of the voltage and current measured. The term correction factor is introduced to calculate power exactly by the system. The correction factor is the ratio of actual power to the measured power. Correction factor is compulsory for the power measurement for some loads. This correction factor can be obtained by plotting graph for calculated power against the actual power. Thus, the power is calculated in computer using C pointed programming after getting voltage outputs from corresponding current and voltage sensors. The prototype has been tested and results achieved for many household electrical appliances are shown in the following section. Table I shows the percentage error for all measured parameters with the corresponding references. It is seen that the maximum error is less than 5% for the domestic appliances. From the low percentage error of power, it has been decided that power can be calculated without allowing for power factor. B. Control of Home Appliances The current paper is original in terms of other reported journalism due to its control features.
1) Smart Power Metering System integrated With Traic:
For switching on/off of the electrical appliances, we have used a triac-BT138 .This enables the consumer for flexibility in controlling the devices: The users (inhabitants) have the options of switching the device on/off in three different ways.
1) Automatic control: Based on the electricity tariff conditions, the appliance can be synchronized with the help of smart software. This enables the user to have more cost saving by auto change off the appliances through the electricity peak hours. The electricity tariff is procured from the website of the power supply company and is restructured at regular intervals.
2) Manual control
An on/off switch is provided to directly get involved with the device. This feature enables the user to have more flexibility by having physical control on the appliance usage without following mechanical control. Also, with the help of the software developed for monitoring and controlling user limit, user can control the device for its correct use. This feature has the higher priority to bypass the usual control.
3) Remote control: The smart power monitoring and controlling
software system has the element of interacting with the appliances remotely through internet (website). This enables user to have flexible control mechanism remotely through a secured internet web connection. This sometimes is a huge help to the user who has the habit of maintenance the appliances ON while away from house. The user can monitor the condition of all appliances and do the needful. Thus, the user has the flexibility in controlling the electrical appliances through the developed prototype.
B. Residential IP Gateway: Transmission Over IP
In order to transmit real-time sensed data over the internet from the collected processor system, the ZigBee packet information is to be transformed to the Internet Protocol Version 6(IPv6). The key factor in the data transformation from Zig-Bee packet is the address translation. This was implemented at the application gateway, a course for determining the spring or objective address of a packet that encapsulates a ZigBee packets’ payload. The corresponding application gateway program performs the address conversion machine for ZigBee to address non-ZigBee nodes. ZigBee is based upon the IEEE 802.14.5 protocol, which uses a 64-bit address for each node on a individual area network (PAN) and 16 bits to identify the PAN ID. IPv6 uses 128 bits to address a node on the network, of which 48 bits characterize the network, 16 bits

National Conference on Research Advances in Communication, Computation, Electrical Science and Structures (NCRACCESS-2015)
ISSN: 2348 – 8549 www.internationaljournalssrg.org Page 200
represent the local network (PAN ID), and 64 bits represent the host id (sensor node). Therefore, the node address for the IEEE 802.15.4 can be placed in an IPv6 address, and the PAN ID can be used to identify the ZigBee network in an IPv6 address. Fig.
C. Storage of Data
The ZigBee packets formed at the gateway summarize sample data to be sent to windows based internet server. An application on the server receives packets on an random port and stores the relevant information in the background of MySQL database in the computer. The database table store information such as source address, time, source control, and intelligence data. Rows are added to this table for each packet received. This allows samples to be sorted by time, sensor knob, and sensor channel. In the present system, programs for address, packet transformations, and data transmission are written using “C” programming words, programs for packet function and data storage are written using “C#,” and
Web interface is developed using PHP draft and Java Scripts. CONCLUSION AND FUTURE WORK A smart power monitoring and control system has been designed and developed toward the implementation of an intelligent structure. The developed system efficiently monitors and controls the electrical appliance usages at an mature home.8 shows the address transformation of ZigBee and IPv6 packet. The software used on the internet gateway to transmit data internationally is the Linux-Open WRT [25]. This is basically router firmware software providing the networking preparation to participate in many types of internetworks. In order to slightly monitor and control the household appliances the housing internet gateway uses the Open software to link to the internetworking protocol. These networks are fixed into internet routers and gateways for spreading data globally. The sensed data is forwarded through a tunneling and tapping (tun/tap) device driver software. The tun/tap acts as virtual network device software for bridging and map-reading functionalities (layer 2 and layer 3) of Internet Protocol (IPv6). REFERENCES [1] X. P. Liu, W. Gueaieb, S. C. Mukhopadhyay, W. Warwick, and Z. Yin, “Guest editorial introduction to the focused section on wireless mechatronics,” IEEE /ASME Trans. Mechatronics, vol. 17, no. 3, pp. 397–403,Jun. 2012. [2] D. S. Ghataoura, J. E. Mitchell, and G. E.Matich, “Networking and application interface technology for
wireless sensor network surveillance and monitoring,” IEEE Commun. Mag., vol. 49, no. 10, pp. 90–97, Oct. 2011. [3] P. Cheong, K.-F. Chang, Y.-H. Lai, S.-K. Ho, I.-K. Sou, and K.-W. Tam, “A zigbee-based wireless sensor network node for ultraviolet detection of flame,” IEEE Trans. Ind. Electron., vol. 58, no. 11, pp. 5271–5277, Nov. 2011. [4] J. Misic and V. B. Misic, “Bridge performance in a multitier wireless network for healthcare monitoring,” IEEE Wireless Commun., vol. 17, no. 1, pp. 90–95, Feb. 2010. [5] M. Erol-Kantarci and H. T. Mouftah, “Wireless sensor networks for costefficient residential energy management in the smart grid,” IEEE Trans. Smart Grid, vol. 2, no. 2, pp. 314–325, Jun. 2011.

National Conference on Research Advances in Communication, Computation, Electrical Science and Structures (NCRACCESS-2015)
ISSN: 2348 – 8549 www.internationaljournalssrg.org Page 201
GREEN HOUSE MONITORING AND CONTROL SYSTEM USING WIRELESS SENSOR NETWORKS
Ms.G.Yasotha
S.Jayabharathi T.Smrithilaya S.Meena G.Suvitha
Bharathiyar Institute Of Engineering For Women
Abstract— Greenhouse helps to monitoring and controlling of various parameters, such as to cultivate quality conscience crops without slaying resources. The electrical wiring for the sensors, deployed inside the Greenhouse is not possible. Hence the need for an automated system employing wireless communication and remote sensing is imperative. These paper proposed a Wireless Sensor Network (WSN) based embedded system and deals with the implementation of ZigBee network (over IEEE 802.15.4) for remote controlling the Greenhouse parameters. These detailed information’s regarding establishment of ZigBee network in Star topology as well as in Mesh Topology, inside the Greenhouse is illustrated here. It also demonstrates the real time monitoring of parameters such as humidity, temperature, as well as the total power consumption of the system, with the help of the PC based GUI application developed on Java platform.
Keywords - Green House, Real time monitoring, WSN, Embedded system, ZigBee (IEEE 802.15.4), Topology, GUI.
I. INTRODUCTION
Due to the research and development in the field of automation, it has facilitated development in wireless communication. Automation along with the use of Wireless Sensor Networks (WSNs) have superseded the traditional manual control systems hence gaining popularity in industrial, domestic as well as in agricultural sector. This has led to an integrated way leading to new solutions, better performance and an absolute system . In the field of automation WSNs have revolutionized the design of emerging embedded systems in terms of various factors
viz. scalability, mobility, power consumption etc.
1.1 characteristics of WSNs are:
• Can store and gather limited power
• Ability to withstand callous environmental condition
• Capability to cope with node failures
• Mobility of nodes is possible
• Dynamic network topology
• Heterogeneity of nodes
• Large scale deployment
• Unattended operation and self governing ability
• Node capacity is scalable, limited by band since environmental diversity exists and there are changes in the ecological conditions from region to region, there is a variety in the cultivation of crops. Bluetooth (over IEEE 802.15.1), UWB A wireless sensor network (WSN) is a system consisting of a collection of nodes and a base station. A node is collected by a local memory, sensors, processor, radio and battery and a base station is accountable for receiving and processing data collected by the nodes. They will perform collaborative activities due to limited resources like battery, processor and memory. Nowadays, the applications of WSNs are many and varied from the applications in agriculture are still incipient.

National Conference on Research Advances in Communication, Computation, Electrical Science and Structures (NCRACCESS-2015)
ISSN: 2348 – 8549 www.internationaljournalssrg.org Page 202
One interesting WSN application is in greenhouses, where the crop conditions such as climate and soil do not depend on natural agents. Sensors and actuators are used to control and monitoring the environmental parameters (over IEEE 802.15.3), ZigBee (over IEEE 802.15.4) and Wi-Fi (over IEEE 802.11a/b/g), it is found that ZigBee is an efficient protocol in field of automation. Being a controlling and a monitoring system our proposed model is implemented with ZigBee protocol. It consists of two modules i.e. one is user side module in which the transceiver is connected to the user PC to control the various green house appliances remotely and the other is green house side module to which sensors are interfaced. It monitors all the parameters, fetches the real time sensed value and depicts the same on LCD display.
This paper is organized as follows; it give details regarding the ZigBee protocol and its super frame structure.
2. METHODOLOGY
2.1PIC Micro Controller
Programmable Interface Controllers are electronic circuits that can be programmed to carry out a vast range of tasks. These can be programmed to be timers or to control a production line and much more. These are found in most electronic devices such as computer control
Programmable Interface Controllers are electronic circuits that can be programmed to carry out a vast range of tasks. These can be programmed to be timers or to control a production line and much more. These are found in most electronic devices such as computer control in the GENIE range of programmable microcontrollers. These are to be programmed and simulated by Circuit Wizard software PIC Microcontrollers are relatively cheap and can be bought as pre-
built circuits or as kits that can be assembled by the user.
We will need a computer to run software, like Circuit Wizard, allowing you to program a PIC microcontroller circuit. As the fairly cheap, low specification computer should run the software with ease. Thus computer will need a serial port or an USB port. This is used to connect the computer to the microcontroller circuit.
2.2 ZIGBEE
ZigBee is a specification for a suite of high-level communication protocols used to create personal area networks built from, low-power digital radios. ZigBee is based an IEEE 802.15.4 standards. Though its low power consumption limits transmission distances to 10–100 meters line-of-sight, depends on power output and environmental proprties, ZigBee devices can transmit data over long distances by passing data through a mesh network of intermediate devices to reach more distant ones. Since ZigBee is typically used in low data rate applications that require long battery life and secure networking (ZigBee networks are secured by 128 bit symmetric encryption keys).The ZigBee has a defined rate of 250kbit/s, best suited for the intermittent data transmissions from a sensor or input devices. Applications includes wireless, light switches, electrical meters with in traffic management systems, home-displays and other consumer and industrial equipment that requires short-range low-rate wireless data transfer. These technology defined by the ZigBee specification is intended to be simpler and less expensive than other wireless personal area networks(WPANs),like Bluetooth or Wi-Fi.
ZigBee protocols are intended for embedded applications requiring low power consumption and tolerating low data rates. Thus resulting network will use very small amounts of power — individual devices must

National Conference on Research Advances in Communication, Computation, Electrical Science and Structures (NCRACCESS-2015)
ISSN: 2348 – 8549 www.internationaljournalssrg.org Page 203
have a battery life of at least two years to pass ZigBee certification.
Typical application areas include:
Home Entertainment and Control — Home automation like in QIVICON,[7] smart lighting,[8] advanced safety, temperature control, security, music and movies.
Wireless sensor network starting with individual sensors like Telosb/Tmote and Iris from Mesick
• Embedded
• Industrial control sensing
• Medical data collection
• Smoke and intruder warning
Building automation.
2.3 LDR
LDRs or Light Dependent Resistors are very useful especially in light/dark sensor circuits. Normally the resistances of an LDR is very high, sometimes high as 1000 000 ohms, but when these are illuminated with light resistance drops dramatically.
The animation opposite showed that when the torch is turned on, the resistance of the LDR falls, allowing current to pass through it.
A machine made electrode based system made out of polymer is what makes up the capacitance for this sensor. This protects the sensor from user front panel (interface). Circuit wizard software has been used to display, the range of a ORPIi2, LDR .When a light level of 1000lux (bright light) is directed towards it, the resistance is 400R (ohms).When a light level of 10lux (very low light) is directed towards it, the resistance has risen dramatically (10430000 ohms), high, sometimes high as 1000 000 ohms, but when
this are illuminated with light resistance drops dramatically.
The animation opposite showed that when the torch is turned on, the resistance of the LDR falls, allowing current to pass through it.
A machine made electrode based system made out of polymer is what makes up the capacitance for the sensor. This protects the sensor from the user front panel (interface). Circuit wizard software has been used to display, the range of a ORPIi2, LDR .When a light level of 1000lux (bright light) is directed towards it, the resistance is 400R (ohms).When a light level of 10lux (very low light) is directed towards it, the resistance has risen dramatically (10430000 ohms).
2.4 HUMIDITY SENSOR
A humidity sensor is a device that measures the relative humidity in a given area. A humidity sensor can be used to both indoors and outdoors. Humidity sensors are made available in both analog and digital forms.
Analog humidity sensor gauges the humidity of the air by relatively using a capacitor-based systems. The sensor is made out of a film usually made of either glass or ceramics. These insulator material which absorbs the water is made out of a polymer

National Conference on Research Advances in Communication, Computation, Electrical Science and Structures (NCRACCESS-2015)
ISSN: 2348 – 8549 www.internationaljournalssrg.org Page 204
which takes in and releases water based on the relative humidity of the given area. Thus changes the level of charge in the capacitor of the on board electrical circuit.
2.4.1 WORKING OF HUMIDITY SENSOR
A digital humidity sensor works via two micro sensors that are calibrated to the relative humidity of the given areas. These are then converted into the digital format via an analog to digital conversion process which is done by a chip located in the same circuit.
A machine made electrode based system made out of polymer is what makes up the capacitance for the sensor. Thus protects the sensor from user front panel (interface).
2.5 PUMP
A pump is a device that moves fluids (liquids or gases), or sometimes slurries, by the mechanical action. Pumps can be classified as three major groups according to the method they use to move the fluid: direct lift, gravity pumps and displacement.
. Pumps operate by some mechanism (typically reciprocating or rotary), and consume energy to carry out mechanical work
by moving the fluid. Pumps operate through many energy sources, include physical operation, electricity, engines, or wind power, come in several sizes, from minute for use in medical applications to large industrial pumps.
Mechanical pumps serve in a wide range of applications such as pumping water from aquarium filtering, pond filtering, wells and aeration in car industry for water-cooling and fuel injection, from the energy industry for pumping oil and natural gas or for operating cooling towers. In the medical industry, pumps are also used for biochemical processes in developing and manufacturing medicine as artificial replacements for body parts, in particular these artificial heart and penile prosthesis.
In biology, different types of chemical and bio-mechanical pumps have evolved, and biomimicry is frequently used in developing new types of mechanical pumps.
2.6 TEMPERATURE SENSOR:
The most basic definition of temperature sensor devices is that they are tools specially designed to measure the hotness or coolness of an object. However, the sensors are actually measuring the atomic activity and movement of an object. When the temperature sensing devices read an object with zero atomic activity, then temperature point is considered as absolute zero. When the substance is heated, it usually moves through several phases: solid to liquid and from liquid to gas until the atomic activity begins increasing.
There are four major measurement scales that are broken down and categorized into different degree units. These represent the method temperature sensing devices use to measure the molecular activity of an object.

National Conference on Research Advances in Communication, Computation, Electrical Science and Structures (NCRACCESS-2015)
ISSN: 2348 – 8549 www.internationaljournalssrg.org Page 205
Using the metric Celsius scale at a point of reference, so the measuring scale begins at zero. Freezing water would be measure zero while boiling water measures one hundred. The Fahrenheit scale also starts with the zero measurement as the coldest object (freezing water) going from 32 degrees to boiling water measuring 212 degrees. Temperature reading strategy recognize absolute zero measurements as near -460 degrees Fahrenheit. The absolute scale by means of Fahrenhiet temperature sensing is also called the Rankin scale.
3. CONCLUSION
The 802.15.4 viz. ZigBee is an efficient wireless protocol in terms of power consumption, scalability and it also provides a suitable data rate for controlling and monitoring purpose. Hence, we can say that the advent of 802.15.4 revolutionized the automation industry. This paper describes a Wireless Sensor Network (WSN) based embedded system built using the ZigBee technology and stress on hardware implementation of sensor and actuator nodes. It also describes the network establishment using ZigBee protocol. A GUI application developed on the Java platform helps to controlling of various appliances remotely in order to stabilize the green house parameters. Hence our proposed system provides real time monitoring of various green house parameters along with the remote control of appliances using GUI based application as well as providing amount of power consumed. To control and monitor the environmental factors , sensors and actuator are essential This paper presents a proposal of greenhouse manage using WSN, its advantages, challenges and potential applications.
REFERENCE
1. R. Makwana, J. Baviskar, N. Panchal and D. Karia,
”Wireless BasedLoad Control and Power Monitoring
System”,Proccedings of International Conference on
Energy Efficient Technologies for Sustainability (ICEETS),Nagarcoil,India, pp.1207-1211,April 2013.
[2] S. Palanisamy, S. Senthil Kumar, and J. Lakshmi Narayanan,”Secured Wireless Communication for Industrial Automation and Control”,Proceedings of 3rd International Conference on Electronics Computer Technology (ICECT), vol. 5, pp. 168-171, April 2011.
[3] J. S. Lee, Y. W. Su, and C. C. Shen,”A Comparative Study of Wireless Protocols: Bluetooth, UWB, ZigBee, and Wi-Fi”, Proceedings of the 33rd Annual Conference of the IEEE Industrial Electronics Society (IECON). [4] R Aquino-Santos and A Gonzlez-Potes, ”Monitoring Physical Variables in Greenhouse Environments”, Available at :www.istec.or.

National Conference on Research Advances in Communication, Computation, Electrical Science and Structures (NCRACCESS-2015)
ISSN: 2348 – 8549 www.internationaljournalssrg.org Page 206
PASSENGER BUS ALERT SYSTEM FOR EASY NAVIGATION OF BLIND PEOPLE
C.Dhivya1-AP/ECE A.Ambiga2, M.Nagalakshmi3, R.S.Tamilarasi4, A.sridharanidevi5- Final Ece
Bharathiyar Institute of Engineering for women, Deviyakurichi, Salem.
Abstract: Talking the microcontroller which generates the bus numbers matching to the location provided by the blind. These bus numbers are altered into acoustic output using the voice synthesizer APR 9600. The ZigBee transceiver in the bus sends the bus number to the transceiver with the blind and the bus number is announced to the blind throughout the earpiece. The blind takes the accurate bus parked in front of him and when the end is reached it is announced by means of the GPS-634R which is joined with the organizer and voice synthesizer which produces the acoustic output. This plan is also designed at selection the leader people for self-determining navigation.
Keywords: Wireless sensor networks, Speech detection System, Voice Synthesizer, GPS, Zigbee.
I. INTRODUCTION
Out the 6.7 billion people that crowd the world, 161 million are visually impaired. Each visually impaired entity faces special challenges based on their exact level of vision. With the rise of different support-based organizations, more visually impaired group have been given the chance to education and many additional means. But unmoving the issues of direction-finding for the blind are very complex and difficult for the most part when they walked down in street and also navigate to far-away places by public transfer system. For a visually impaired person, doing things such as reading travel signals and street signs can be extremely demanding if not it is not possible to do. Guide dogs and walking canes allow for a more self-determining means of travelling, but they are limited in different environments. RFID is feasible and cost valuable but it
is more suitable for. A system with an improved walking cane, a pair of better glasses and identifiable items tagged with semacode /data matrix tags is used for outdoor navigation of blind people. If a man has to take the bus, he walks along the roadway and his walking cane recognizes a tag. But the image worth of the web camera is basically poor. Tag recognition in darkness or in bad lightning conditions power be a problem. To overcome the drawbacks of at present existing assistive devices, we propose a Wireless sensor network system with Zigbee for blind detection by the bus and embedded system for providing the bus number and [mally GPS for destination suggestion. Wireless sensor network (WSNs) consists of sensors that always monitors the environmental conditions and send their data to the main system [51. ZigBee is an embedded device for use in a WSN which is small in size. These nodes have doling out and computational facility and usually consist of an RF transceiver, recall, on board sensors/actuators and a power supply. ZigBee have CC2420 which is a accurate single-chip 2.4 GHz IEEE 802.15.4 accommodating RF (Radio Frequency) transceiver planned for low-power and low-voltage wireless applications so we can send or receive useful information during using this chip. The number of the bus parked in front of the roller blind is send to the ZigBee in the blind system. Another function of ZigBee is identification of blind in the bus location. If both the numbers equivalent the buzzer in the bus element sound the alarm and indicates the driver that there is blind in the bus station. The software part is Embedded C with MPLAB IDE (Operating System) for encoding the controller. MPLAB IDE runs as a 32-bit application on

National Conference on Research Advances in Communication, Computation, Electrical Science and Structures (NCRACCESS-2015)
ISSN: 2348 – 8549 www.internationaljournalssrg.org Page 207
MS Windows, is simple to use and includes a host of free software apparatus for fast application move ahead and super-charged debugging. MPLAB IDE also serves as a single, combined graphical user edge for additional Microchip and third party software and hardware development apparatus.
II. MATERIALS AND METHODS
A. Voice Recognition Unit
Words recognition system is used to help the blind to know the particular buses for a given position. When the blind speaks through the microphone, the speech recognition system investigate the input which is then processed by the microcontroller, and then produces the required productivity in the acoustic format which is heard by the user through the earphones. The speech recognition system here we use is HM2007.It is a single chip voice recognition LSI circuit with on the chip voice psychoanalysis, recognition process and system manage functions. It may consist of microphone, upright, RAM and some other system. The word length select pin is used to control the length of word we are provided that as input. When the pin WLEN is set far above the ground, 1.92 sec is preferred. In this way only 20 words can be recognized. DEN pin is used to allow the data. When the recognition process is full the chip will place its response on the data bus DO -D7 and which can be latched on to the microcontroller by this pin. When the device is ready for the voice input in instruction or recognition mode, a low signal is sent by the RDY pin. If the chip is eventful then a high indicate is sent. When the coming up control input pin is set Low, the chip will enter the waiting state and do not agree to the voice input until the pin is set to High. There are two modes of operation. Through the power on the chip will create its initialization process. If the wait pin is Low the chip will do the memory confirm and if the pin is H then the chip skips the memory check. After the initialization recognition is complete. Ready pin is set low to allow
the voice to be recognized. Once the voice put in is detected the prepared pin is set high and recognition begins. We should train the word sample before the beginning of the recognition process. After the process is finished the result will appear on the D-bus with the establishment of DEN pin. To train or clear a voice pattern, we must select the word number to process first. The number of word is collected of two digits.
The digits are entered one digit at a time through keypad. When number key is pushed, the number of key will be echoed to the D-bus. When the word number is entered press the purpose key to choose the operation function. If the function key CLR is pressed the word pattern is vacant. If the function key TRN is pressed training process begins. To clear the entire patterns key 99 is entered and clear is pressed.
B. Voice Synthesizer System
APR9600 device offers true single-chip voice soundtrack, non-volatile storage and playback ability for 40 to 60 seconds. The voice synthesizer is used to produce speech signal output of the bus number and the current end of the blind people. The voice synthesizer is linked to the microcontroller. Micro controller accepts input from voice recognition system and GPS. The device supports both random and sequential access of multiple communications. Each memory cell can store 256 voltage levels This technology enables the APR9600 device to reproduce voice signals in their normal form. It eliminates the need for encoding and compression, which often introduce deformation. Storage is accomplished throughout a bus unit consists of a ZigBee transceiver with a microcontroller which helps to find the availability of blind in the bus location and displays it. The blind unit is a mobile unit accepted by the blind people which consists of ZigBee unit for identifying the bus parked in front of them, Speech recognition system for identifying the location provided as voice input by the user and the microcontroller for analyzing the input and providing the related bus

National Conference on Research Advances in Communication, Computation, Electrical Science and Structures (NCRACCESS-2015)
ISSN: 2348 – 8549 www.internationaljournalssrg.org Page 208
number of the location specified by the blind as audio output through voice synthesizer. Input is given through microphone and productivity is heard by the blind throughout the earpiece
Fig: functional block diagram of bus unit.
Fig: functional block illustration of blind part.
Combination of the Sample and Hold circuit and the Analog Write Read circuit. These circuits are clocked by either the Internal Oscillator or an peripheral clock source. When playback is desired the earlier stored recording is retrieved from memory, low pass filtered and amplified. The signal can be heard by connecting a speaker to the SP+ and SP- pins. Random access mode supports 2, 4, or 8 messages segments of fixed period. Record or playback can be made randomly in any of the special messages. The length of each message segment is the total recording length vacant (as defined by the selected sampling rate) divided by the total number of segments enabled. The bus number and the target which is recorded are played back in this mode. On power up, the device is ready to record or play back, in any of the enabled communication segments. To record, ICE must be set low to enable the device and IRE must be set low to enable soundtrack. We recording by applying a low level on the message create pin that represents the message segment we intend to use. To playback, I CE must be set low to allow the device and IRE must be set high to stop recording & enable playback. You initiate play- back by applying a high to low edge on the message trigger pin that representing the message segment you intend to playback. Playback will continue pending the end of the message is reached. If a high to low edge occurs on the message trigger pin in playback, playback of the current message stops directly. The IBusy pin when low indicates to the host processor that the device is busy and that no instructions can be currently received. When this pin is high the device is ready to accept and implement commands from the host. The IStrobe pin pulses low each time a memory segment is used. Including pulses on this pin enables the host processor to correctly determine how much recording time once used, and how much soundtrack time remains. The APR 9600 has a total of eighty memory segments. The IM7 _END pin is used as an indicator that the device has stopped up its current record or playback function. During recording a low going pulse indicates that all memory has been used.
Zigbee
Level converter
RS232
Micro
controller
PIC16F887
7
Display
power
supply 5v
Power supply
zigbee level converter
RS232
micro
controller
PIC16F887
Voice
synthesizer
ARP9600
microphone
(input from
user)
speech
recognition
system HS2007
headset
(output
from
user)
GPS634R

National Conference on Research Advances in Communication, Computation, Electrical Science and Structures (NCRACCESS-2015)
ISSN: 2348 – 8549 www.internationaljournalssrg.org Page 209
During playback a low pulse indicate that the last message has played.
III. RESULTS AND DISCUSSION
When the personality reaches the bus location, he can find the buses that pass throughout a exacting location PIC is a family of Harvard architecture microcontrollers through by Microchip Technology, derived from the PIC16F887 originally developed by common Instrument's Microelectronics allotment. The given name PIC originally referred to "Peripheral Interface Controller". In our technique two controllers are used. One in the bus unit and other in the blind unit. Microcontroller is associated to the level converter, speech recognition system, GPS and voice synthesizer. LCD display is connected to the output of organizer in bus unit. The coding is done using embedded C language and Hi-tech C compiler. The output of the microcontroller is connected to the voice synthesizer in blind unit. The output of speech recognition system, GPS and level converter is linked to the input ports of microcontroller.
D. Finding the destination
The Global Positioning System (GPS) is a space based radio navigation system that provides reliable positioning, direction-finding, and timing services to national users on a nonstop worldwide basis. GPS receiver will provide location and time. It receives the opportunity and longitude standards from the satellite. GPS based blind man device by means of user input interfacing (voice based) intellectually finds the current location and gives the prepared to the blind man if it was his destination area. The system designed consists of a GPS receiver and a voice circuit which is interfaced to the microcontroller [121. The microcontroller is programmed in such a way that depending on the satellite information of location the predefined location name will be announced. Three satellites are sufficient to answer for location, since
space has three sizes. However a very small clock error multiply by the very large speed of light the speed at which satellite signals circulate results in a large positional mistake. The receiver uses a fourth satellite to solve for x, y, z, and t which is used to accurate the receiver's clock.
Microcontroller is the heart of the device. It stores the data of the current spot which it receives from the GPS system, so that it can create use of the data stored to compare with the end place of the user. By this it can trace out the distance from the end and make an alarm to alert the user in advance. This device is designed to give a voice based announcement for the user, i.e., the user gets the tone which pronounces his destination location. GPS-634R is a highly integrated smart GPS module with a clay GPS area antenna. The antenna is linked to the unit via an LNA. It is capable of receiving signals from up to 65 GPS satellites and transferring them into the exact position and timing information that can be read over both UART port and RS232 serial port.
E. Transmission Unit
ZigBee is wireless technology developed by IEEE 802.15.4 - 2003 standard for low cost, low power, wireless sensor networks that is used for Low-Rate Wireless Personal Area Network (LR- WPANs). The standard takes full benefit of IEEE 802.15.4 physical radio specification that requires a low data rate, long battery life and safe networking. ZigBee is present with the blind people and in the bus which is the used instead of RFID [21. The ZigBee with the blind recognizes the bus which is few meter distance away from blind and gives suggestion to the blind who is carrying it. The intimation is given through the headphones. The ZigBee in bus receives the signal from blind people and stops in bus station. If the blind gets the bus, he gets into bus or else he waits for the bus which he desires to get into to reach his end. The advantage over of ZigBee over RFID is that it is less

National Conference on Research Advances in Communication, Computation, Electrical Science and Structures (NCRACCESS-2015)
ISSN: 2348 – 8549 www.internationaljournalssrg.org Page 210
cost than RFID tag and RFID reader [31. Secondly, it has two-way communication that is to send and receive signal at higher speed without nosy other signals like radio waves.
With the help of voice detection system and voice synthesizer. When the bus approaches the bus place, there is a warning in the bus by the beep sound of a buzzer that there is a blind person available in the bus station. This is achieved with the help of ZigBee unit both in the bus unit and blind unit. Finally after the bus reaches the place the bus number is announced to the blind during headphones. There are currently available systems for the outdoor path-finding but they will not assist in travelling to new areas. Some systems use PDA which is not so financial and cannot be afforded by all. In most of the systems RFID tags are used which are required in 1000s of numbers for tracking of route. Also it provides only one way communication. The system we use is a mobile unit, weightless and cheaply possible.
IV. CONCLUSION
Primarily, the blind person in the bus station is identified with RF communication. The blind informs the spot he needs through the microphone which is given to the voice detection system which produces the output of bus numbers in the voice synthesizer unit which is heard in earphones. Then this location is transmitted to the transceiver in the bus. If the names in the transceiver in the bus matches with that of the name send by the blind, then there is an alarm in the bus unit alerting the presence of blind and a voice to the user's headset that the exacting bus has arrived. With the help of GPS tracker attached with audio output the target chosen by the blind is intimated when the bus reaches the correct location. PDA's can be used for GPS tracking but it is not cost effective.
REFERENCE
[1] Baudoin,G., Sayah,J., Venard, O. and EI Hassan, B. (2005) , 'Simulation using OMNet++ of the RAMPE system an Interactive Auditive Machine helping blinds in Public Transports', EUROCON, Belgrade,pp.1-5.
[2] Bolivar Torres, Qing Pang, (2010), 'Integration of an RFID reader to a Wireless sensor network and its use to Identify an individual carrying RFID tag', International Journal of ad hoc. sensor & ubiquitous computing ,voU, no.4,pp.1-15.
[3] Brendan D Perry, Sean Morris and Stephanie Carcieri, (2009), 'RFID Technology to Aid in Navigation and Organization for the Blind and Partially Sighted', pp. 1-52.
[4] Herve Guyennet, Kamal Beydoun and Violeta Felea,( 2011), 'Wireless sensor network system helping navigation of the visually impaired', IEEE international conference on Information and Communication Technologies: from Theory to Applications, version 1, pp. 1-5.
[5] Hyn Kwan Lee , Ki Hwan Eom , Min Chul Kim and Trung Pham Quoc, (2010), 'Wireless Sensor Network Apply for the Blind U-bus System', International Journal of u- and e service, Science and Technology,VoI.3,No.3,pp.l3-24.
[6] Jack Loomis,M. and Roberta Klatzky,L.(2008), 'Navigation System for Blind', Massachusetts Institute of Technology, Vol 7, No.2, pp.193-203.
[7] Jain.P.C , Vijaygopalan.K.P. (2010), 'RFID and Wireless Sensor Networks', Proceedings of ASCNT, CDAC, Noida, India, pp. 1 - 11.
[8] Loc Ho ,Melody Moh, Teng-Sheng Moh and Zachary Walker (2007) ,'A Prototype on RFID and Sensor Networks for Elder Health Care', Taylor & Francis Group, LLC,pp.314- 317.
[9] Oyarzun, C.A and Sanchez, J.H. (2008), 'Mobile audio assistance in bus transportation for the blind', Department of Computer Science, University of Chile, pp.279-286.
[10] Ravi Mishra and Sornnath Koley, (2012),'Voice Operated Outdoor Navigation System For Visually Impaired Persons', International Journal of Engineering and Technology,Vol 3, Issue 2,pp.l53-157.
[11] Riaz Ahamed, S.S (2009), 'The Role of ZigBee Technology In Future Data Communication System', Journal of Theoretical and Applied Information Technology, India,pp.129-134.

National Conference on Research Advances in Communication, Computation, Electrical Science and Structures (NCRACCESS-2015)
ISSN: 2348 – 8549 www.internationaljournalssrg.org Page 211
ELECTRIC VEHICLE CHARGING METHOD FOR SMART HOMES/BUILDINGS USING PHOTOVOLTAIC SYSTEM
K.B.Sethupathy1-Assistant Professor ECE
R.baby2, G.Janani3, M.Abirami4, K.Seethalakshmi5, Final Year Ece. Bharathiyar Institute of Engineering for Women.
Abstract —Due to the bigger penetration of electric vehicles (EVs) and photovoltaic (PV) systems, extra application for home/building energy management system (EMS) is essential to determine when and how much to charge an electric vehicle in an personality home/building. This paper presents a smart EV charging method for smart home/building with a PV system. The paper consists of two parts: EV charging scheduling algorithm for smart homes/buildings and execution of sample appliance for home/building EMS. The proposed EV charging algorithm is considered to establish the optimal schedules of EV charging based on predicted PV output and electrical energy using up. The implemented prototype application for home/building EMS can provide EV charging schedules according to consumer preference. Mathematical results are provided to exhibit the effectiveness of the proposed smart EV charging method.
I.INTRODUCTION
Increases in petroleum price and ecological concern have lead to alteration in the composition of power systems. One of the important changes is the rising use of new energy resources such as renewable energy resources, electric vehicles (EVs), and high-capacity. If EVs can be deployed at short price, they can be used to improve the energy effectiveness and renewable energy diffusion. Most of these studies focus on the EV considering other electricity utilization and production property such as photovoltaic (PV) systems.
Smart EV charging is one of crucial technologies used for home energy management systems (HEMS) as well as in construction energy management systems (BEMS). In this paper, a smart electric vehicle charging algorithm has been developed and implemented for smart homes/buildings with a PV system. The proposed algorithm can be divided into two stages: prediction and scheduling. In the prediction stage, the PV output and electricity utilization are forecasted using a time series model with climate sensitivity. In the scheduling stage, the EV charging schedule is determined based on the result of the first stage as well as EV and electricity fee information. The proposed method for scheduling EV charging can be applied as part of HEMS or BEMS application.
II. BACKGROUND
In this section, EMSs for smart homes/buildings and EVs are briefly described.
A. Energy Management Systems for Smart Home/Building
Globally, the importance in smart grids has been rising. One of the key descriptions of smart grids is enhanced energy effectiveness and manageability of available resources. In exacting, EMSs can play a vital role in monitoring and overprotective home/building
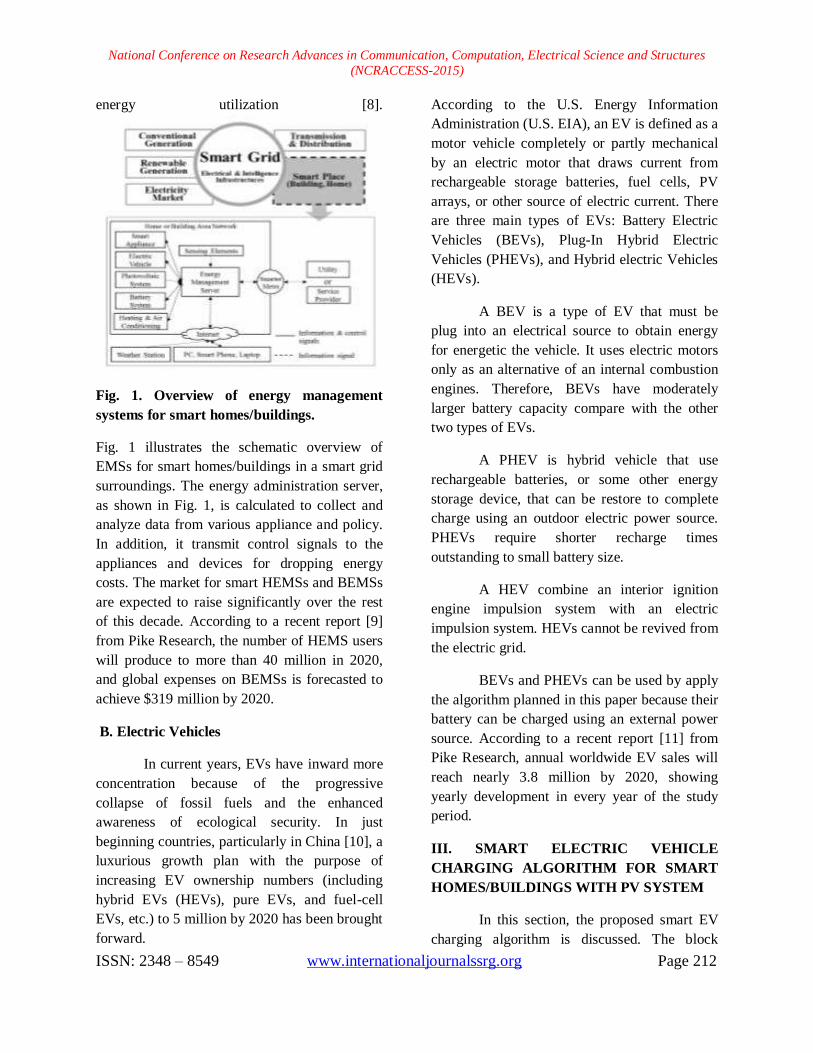
National Conference on Research Advances in Communication, Computation, Electrical Science and Structures (NCRACCESS-2015)
ISSN: 2348 – 8549 www.internationaljournalssrg.org Page 212
energy utilization [8].
Fig. 1. Overview of energy management systems for smart homes/buildings.
Fig. 1 illustrates the schematic overview of EMSs for smart homes/buildings in a smart grid surroundings. The energy administration server, as shown in Fig. 1, is calculated to collect and analyze data from various appliance and policy. In addition, it transmit control signals to the appliances and devices for dropping energy costs. The market for smart HEMSs and BEMSs are expected to raise significantly over the rest of this decade. According to a recent report [9] from Pike Research, the number of HEMS users will produce to more than 40 million in 2020, and global expenses on BEMSs is forecasted to achieve $319 million by 2020.
B. Electric Vehicles
In current years, EVs have inward more concentration because of the progressive collapse of fossil fuels and the enhanced awareness of ecological security. In just beginning countries, particularly in China [10], a luxurious growth plan with the purpose of increasing EV ownership numbers (including hybrid EVs (HEVs), pure EVs, and fuel-cell EVs, etc.) to 5 million by 2020 has been brought forward.
According to the U.S. Energy Information Administration (U.S. EIA), an EV is defined as a motor vehicle completely or partly mechanical by an electric motor that draws current from rechargeable storage batteries, fuel cells, PV arrays, or other source of electric current. There are three main types of EVs: Battery Electric Vehicles (BEVs), Plug-In Hybrid Electric Vehicles (PHEVs), and Hybrid electric Vehicles (HEVs).
A BEV is a type of EV that must be plug into an electrical source to obtain energy for energetic the vehicle. It uses electric motors only as an alternative of an internal combustion engines. Therefore, BEVs have moderately larger battery capacity compare with the other two types of EVs.
A PHEV is hybrid vehicle that use rechargeable batteries, or some other energy storage device, that can be restore to complete charge using an outdoor electric power source. PHEVs require shorter recharge times outstanding to small battery size.
A HEV combine an interior ignition engine impulsion system with an electric impulsion system. HEVs cannot be revived from the electric grid.
BEVs and PHEVs can be used by apply the algorithm planned in this paper because their battery can be charged using an external power source. According to a recent report [11] from Pike Research, annual worldwide EV sales will reach nearly 3.8 million by 2020, showing yearly development in every year of the study period.
III. SMART ELECTRIC VEHICLE CHARGING ALGORITHM FOR SMART HOMES/BUILDINGS WITH PV SYSTEM
In this section, the proposed smart EV charging algorithm is discussed. The block

National Conference on Research Advances in Communication, Computation, Electrical Science and Structures (NCRACCESS-2015)
ISSN: 2348 – 8549 www.internationaljournalssrg.org Page 213
diagram of the two-stage smart EV charging algorithm is shown in Fig. 2, and a more detailed description is provided in the following subsections.
A. Prediction Model with Weather Adjustment for PV Output and Electricity Consumption
Predictions of PV output and electricity conservation are required for dropping electricity costs of smart homes/buildings with a PV system. The future algorithm is designed to use a time series model with weather adjustment for the predicting PV output and electricity using up. The prediction procedure is as follows:
Step1. Data Selection: Historical data collected from the most recent qualify days are selected. Unlike PV output, the electricity consumption typically varies by the day-type (i.e., weekend or weekday). For growing the accuracy of the electricity demand forecast, historical electricity consumption data should be selected from relevant past data based on the day type of a predicted day [12].
Step2. Prediction: Using the data certain in Step 1, the PV output and electricity consumption are estimated.
Step3. Weather Adjustment: The pre-forecast value is in step using the weather sensitivity coefficient, which is calculated as the ratio of the forecast and actual value for the pre-scheduled
period before the start of the scheduled period.
Fig. 2. Overview of proposed smart electric vehicle charging algorithm.
Fig. 3. Time line of proposed prediction algorithm.
The time line of the future prediction algorithm is illustrated in Fig. 3, where the total period is divided into two sub-periods: pre-scheduled period and scheduled period. B. Optimization Model for Smart Electric Vehicle Charging
The purpose of solving the electric vehicle charging scheduling problem is to determine the best charging time and amount of charge for each time step in order to decrease the Electricity costs, while agreeable the constraints of the charging level and rate, battery capacity, and user expediency.

National Conference on Research Advances in Communication, Computation, Electrical Science and Structures (NCRACCESS-2015)
ISSN: 2348 – 8549 www.internationaljournalssrg.org Page 214
IV. IMPLEMENTATION OF SMART ELECTRIC VEHICLE CHARGING METHOD FOR SMART HOMES/BUILDINGS WITH PV SYSTEM
This section describes an implemented prototype EMS application for smart EV charging in smart homes/buildings with a PV system. The flowchart of the proposed smart electric vehicle charging algorithm is shown in fig .4.
Fig. 4. Flowchart of proposed smart electric vehicle charging algorithm.
The proposed HEMS or BEMS application in this research is composed of five components: input data module, data gathering module, prediction module, optimization module, and reporting module. Input data module: This module is designed to obtain user-defined data such as electric vehicle information (initial SOC, target SOC and departure time), scheduled time duration, and day-type of scheduling day. All input data can be imported from files in a spreadsheet file. Data gathering module: This module involves selecting the electricity tariff, historical electricity consumption and PV output data that satisfy user-defined criteria.
∙ Prediction module: This module is designed to forecast the hourly electricity consumption and PV output over the scheduled duration using the exponential smoothing model with the weather adjustment. ∙ Optimization module: This module involves formulating an optimization problem for smart EV charging using MILP and determining smart EV charging schedule. ∙ Reporting module: In this module, all output data can be exported to a spreadsheet file.
Fig. 5. Overview of proposed prototype EMS application for smart homes/buildings with PV system.(a)

National Conference on Research Advances in Communication, Computation, Electrical Science and Structures (NCRACCESS-2015)
ISSN: 2348 – 8549 www.internationaljournalssrg.org Page 215
(b) Fig. 6. User interface screenshots of the implemented prototype EMS application for smart homes/buildings with PV system. V. NUMERICAL RESULTS
In this section, the numerical results are presented. For smart EV charging scheduling, a commercial building with a 50-kW PV panel system was considered in this study. For generating 50-kW PV data, data from the 3-kW PV panels installed in a school were used and converted. Fig. 7 shows the PV systems installed on the roof of the school building. In addition, for determining the electricity consumption of a commercial building, business building data were obtained from a utility company in Korea. In this case study, 12 electric cars were used. The EVs were divided into three groups depending on their initial SOC. Table 1 summarize the details of the electric cars used in this case study.
The EVs used here were identical except for the initial SOC. The greatest and least charging rates of the EV charger used in the case study are 1 kW and 7.7 kW, respectively.
Fig. 7. PV systems installed on the roof of the school building
Fig. 8. Results of net consumption forecast.

National Conference on Research Advances in Communication, Computation, Electrical Science and Structures (NCRACCESS-2015)
ISSN: 2348 – 8549 www.internationaljournalssrg.org Page 216
Fig. 9. Change in SOC of electric vehicle during scheduled period
Fig.10.The comparison of different charging patterns for single EV. TABLE I THE CHARGING COST OF DIFFERENT CHARGING PATTERNS IN DIFFERENT CASES
VI. CONCLUSION AND FUTURE WORK
The EMS application is required to determine optimal EV charging scheduling for smart homes/buildings with a PV system. In this paper, a cost-effective EV charging method is proposed and implemented for smart homes/buildings with a PV system. The proposed smart EV charging algorithm for smart homes/buildings consists of two stages: prediction of PV output and electricity consumption, and EV charging scheduling. Numerical results are presented to demonstrate the effectiveness of the proposed method. Further work is required for considering the effects of PV output and electricity consumption foretell error, and vehicle-to-grid on the performance of the proposed method. REFERENCES [1] S. Han, S. Han, and K. Sezaki, “Estimation of achievable power capacity from plug-in electric vehicles for V2G frequency regulation: case studies for market participation,” IEEE Trans. Smart Grid, vol. 2, no. 4, pp. 632-641, Dec. 2011. [2] C.-K. Wen, J.-C. Chen, J.-H. Teng, and P. Ting, “Decentralized plug-in electric vehicle charging selection algorithm in power systems,” IEEE Trans. Smart Grid, vol. 3, no. 4, pp. 1779-1798, Dec. 2012. [3] N. Kushiro, S. Suzuki, M. Nakata, H. Takahara, and M. Inoue, “Integrated residential gateway controller for home energy management system,” IEEE Trans. Consumer Electron., vol. 49, no. 3, pp. 629-636,Aug. 2003. [4] D.-M. Han and J.-H. Lim, “Design and implementation of smart home energy management systems based on zigbee,” IEEE Trans. On Consumer Electron., vol. 56, no. 3, pp. 1417-1425, Aug. 2010. [5] Y.-S. Son, T. Pulkkinen, K.-D. Moon, and C. Kim, “Home energy management system based on power line communication,” IEEE Trans. on Consumer Electron., vol. 56, no. 3, pp. 1380-1386, Aug. 2010. [6] J. Han, C.-S. Choi, and I. Lee, “More efficient home energy management system based on zigbee communication and infrared remote controls,” IEEE Trans. on Consumer Electron., vol. 51, no. 1, pp. 85-89, Feb. 2011. [7] Y.-M. Wi. J.-U. Lee, and S.-K. Joo, “Smart electric vehicle charging for smart home/building with a photovoltaic system,” Int. Conf. Consumer Electron. 2013, Jan. 2013.

National Conference on Research Advances in Communication, Computation, Electrical Science and Structures (NCRACCESS-2015)
ISSN: 2348 – 8549 www.internationaljournalssrg.org Page 217
[8] S. Aman, Y. Simmhan, and V.-K. Prasanna, “Energy management systems: state of the art and emerging trends,” IEEE Commun. Mag., vol. 51, no. 1, pp. 114-119, Jan. 2013. [9] N. Strother and B. Gohn, “Home energy management,”
Pike Research Report, 2012 [10] Z. Liu, F. Wen, and G. Ledwich, “Optimal planning of electric-vehicle charging stations in distribution systems,” IEEE Trans. Power Del., vol. 28, no. 1, pp. 102–110, Jan. 2013. [11] D. Hurst and J. Gartner, “Electric vehicle market forecasts,” Pike Research Report, 2012 [12] Y.-M. Wi, S.-K. Joo, and K.-B. Song, “Holiday load forecasting using fuzzy polynomial regression with weather feature selection and adjustment,” IEEE Trans. Power Syst., vol. 27, no. 2, pp. 596-603, May 2012.

A High-Performance and Fast Cryptography FPGA Architecture Implementation Using Blowfish Algorithm
M.r K.B.Sethupathy K.Priya
Assistant Professor PG Scholar Bharathiyar institute of engineering for
women, Deviyakurichi, Tamil Nadu Knowledge institute of technolog,
kakapalayam, Tamil Nadu
ABSTRACT
In VLSI technique Blowfish algorithm plays a vital role in reducing the number of
bit required for implementation. It is a Feistel network, iterating a simple encryption
function 16 times. The block size is 64 bits, and the key length is up to 448 bits. It is a
variable-length key block cipher. It is suitable for applications where the key does not
change often, like a communications link or an automatic file encryptor. It is significantly
faster than DES when implemented on 32-bit microprocessors with large data caches, such
as the Pentium and the microblaze. This article describes the core implementation of an Blowfish in Field Programmable
Gate Array - FPGA. The core was implemented in both Xilinx Spartan-3 and Xilinx Virtex-5
FPGAs. The implementation was very efficient, achieving more than 318MHz on a Xilinx
Spartan-3, representing at 50% faster than other reported works. The implementation can
achieve more than 800MHz on a Xilinx Virtex-5. The main goal of this work was the
implementation of a fast and modular BLOWFISH algorithm, and can find a wide range of
applications. A pipelined hardware was implemented and it was compared with non-pipelined
version, as a result was achieved an increase in the efficiency.
I. INTRODUCTION As the Internet and other forms of
Cryptography is the art of electronic communication become more
protecting information by transforming it prevalent, electronic security is becoming
(encrypting it) into an unreadable format, increasingly important. Cryptography is
called cipher text. Only those who possess a used to protect e-mail messages, credit card
secret key can decipher (or decrypt) the information, and corporate data. One of the
message into plain text. Encrypted messages most popular cryptography systems used on
can sometimes be broken by cryptanalysis, the Internet is Pretty Good Privacy because
also called code breaking, although modern it's effective and free.
cryptography techniques are virtually
unbreakable.

Cryptography systems can be
broadly classified into symmetric-key
systems that use a single key that both the
sender and recipient have, and public-key
systems that use two keys, a public key
known to everyone and a private key that
only the recipient of messages uses. Need for Cryptography
Security often requires that data be
kept safe from unauthorized access. And
the best line of defense is physical security
placing the machine to be protected behind
physical walls. However, physical security
is not always an option due to cost and/or
efficiency considerations. Instead, most
computers are interconnected with each
other openly, thereby exposing them and
the communication channels that they use.
This problem can be broken down into five
requirements that must be addressed AES Algorithm
The AES encryption and decryption
processes for a 128-bit plain text block are
shown in Figure 1.3(a). The AES algorithm
specifies three encryption modes: 128-bit,
192-bit, and 256-bit. Each cipher mode has
a corresponding number of rounds Nr based
on key length of Nk words. The state block
size, termed Nb, is constant for all
encryption modes. This 128-bit block is
termed the state. Each state is comprised of
4 words. A word is subsequently defined as
4 bytes. Table shows the possible key/state
block/round combinations.
Figure.1.3(a) Basic concept of
AES algorithm.
The state block size, termed Nb, is
constant for all encryption modes. This
128-bit block is termed the state. Each state
is comprised of 4 words. A word is
subsequently defined as 4 bytes. Table
shows the possible key/state block/round
combinations.
II. RELATED WORK
Modern embedded systems need data
security more than ever before. Our PDAs
store personal e-mail and contact lists. GPS
receivers and soon, cell phones keep logs of
our movements and our automobiles record
our driving habits. On top of that, users
demand products that can be reprogrammed
during normal use, enabling them to
eliminate bugs and add new features as
firmware upgrades become available Data
security helps keep private data private.
Secure data transmissions prevent contact
lists and personal e-mail from being read by

someone other than the intended recipient,
keep firmware upgrades out of devices they
don’t belong in, and verify that the sender
of a piece of information is who he says he
is. The sensibility of data security is even
mandated by law in certain applications: in
the U.S. electronic devices cannot exchange
personal medical data without encrypting it
first, and electronic engine controllers must
not permit tampering with the data tables
used to control engine emissions and
performance. Data security techniques have
a reputation for being computationally
intensive, mysterious, and fraught with
intellectual property concerns. While some
of this is true, straightforward public
domain techniques that are both robust and
lightweight do exist. One such technique is
called Blowfish algorithm, is perfect for use
in embedded systems.
Figure 2.1: Basic Process of cryptography III. OUR CONTRIBUTION
Blowfish is a keyed, symmetric
block cipher, designed in 1993 by Bruce
Schneier and included in a large number of
cipher suites and encryption products.
Blowfish provides a good encryption rate in
software and no effective cryptanalysis of it
has been found to date. However, the
Advanced Encryption Standard now receives
more attention. Schneier designed Blowfish
as a general-purpose algorithm, intended as
an alternative to the ageing DES and free of
the problems and constraints associated with
other algorithms. At the time Blowfish was
released, many other designs were
proprietary, encumbered by patents or were
commercial/government secrets.
Blowfish is a symmetric encryption
algorithm, meaning that it uses the same
secret key to both encrypt and decrypt
messages. Blowfish is also a block cipher,
meaning that it divides a message up into
fixed length blocks during encryption and
decryption. The block length for Blowfish is
64 bits, messages that are not a multiple of
eight bytes in size must be padded. Blowfish
is public domain, and was designed by Bruce
Schneier expressly for use in performance
constrained environments such as embedded
systems. It has been extensively analyzed and
deemed reasonably secure by the
cryptographic community.
Blowfish has a 64-bit block size and
a variable key length from 32 bits up to 448
bits. It is a 16-round Feistel cipher and uses
large key-dependent S-boxes. In structure it
resembles CAST-128, which uses fixed S-
boxes. The diagram to the left shows the

action of Blowfish. Each line represents 32
bits. The algorithm keeps two sub key
arrays: the 18-entry P-array and four 256-
entry S-boxes. The S-boxes accept 8-bit
input and produce 32-bit output. One entry
of the P-array is used every round, and after
the final round, each half of the data block
is XORed with one of the two remaining
unused P-entries.
Figure 2.3(a): Blowfish algorithm IV. IMPLEMENTATION
Blowfish requires about 5KB of
memory. A careful implementation on a 32-
bit processor can encrypt or decrypt a 64-
bit message in approximately 12 clock
cycles.Not-so-careful implementations, like
Kocher, don’t increase that time by much.
Longer messages increase computation
time in a linear fashion, for example, a 128-
bit message takes about (2 x 12) clocks.
Blowfish works with keys up to 448 bits in
length.
A graphical representation of the
Blowfish algorithm appears in Figure
2.3(a). In this description, a 64-bit plaintext
message is first divided into 32 bits. The
“left” 32 bits are XORed with the first element of a P-array to create a value I’ll
call P’, run through a transformation
function called F, then XORed with the “right” 32 bits of the message to produce a
new value I’ll call F’. F’ then replaces the
“left” half of the message and P’ replaces
the “right” half, and the process is repeated 15 more times with successive members of
the P-array. The resulting P’ and F’ are then XORed with the last two entries in the P-
array (entries 17 and 18), and recombined to
produce the 64-bit cipher text. A graphical
representation of F appears in Figure 2.3(b)
The function divides a 32-bit input into four
bytes and uses those as indices into an S-
array. The lookup results are then added and
XORed together to produce the output.
Because Blowfish is a symmetric algorithm,
the same procedure is used for decryption as
well as encryption. The only difference is that
the input to the encryption is plaintext; for
decryption, the input is cipher text. The P-
array and S-array values used by Blowfish
are pre-computed based on the user’s key. In

effect, the user’s key is transformed into the P-array and S-array; the key itself may be
discarded after the transformation. The P-
array and S-array need not be recomputed (as long as the key doesn’t change), but
must remain secret. I’ll refer you to the source code for computing the P and S
arrays and only briefly summarize the
procedure as follows: • P is an array of eighteen 32-bit integers. • S is a two-dimensional array of 32-bit integer of dimension 4x256. • Both arrays are initialized with constants, which happen to be the hexadecimal digits of π(a pretty decent random number source). • The key is divided up into 32- bit blocks
and XORed with the initial elements of the
P and S arrays. The results are written back
into the array. • A message of all zeros is encrypted; the results of the encryption are written back to
the P and S arrays. The P and S arrays are
now ready for use. V. CONCLUSION AND FUTURE WORKS
In this paper we have worked to
facilitate the blowfish algorithm efforts. A
graphical representation of the Blowfish
algorithm appears in Figure. In this description, a 64-bit plaintext message is
first divided into 32 bits. The “left” 32 bits are XORed with the first element of a P-
array to create a value I’ll call P’, run through a transformation function called F,
then XORed with the “right” 32 bits of the
message to produce a new value I’ll call F’.
F’ then replaces the “left” half of the
message and P’ replaces the “right” half, and
the process is repeated 15 more times with successive members of the P-array. The
resulting P’ and F’ are then XORed with the last two entries in the P-array (entries 17 and
18), and recombined to produce the 64-bit
cipher text. A graphical representation of F
appears in Figure 2.3(b) The function divides
a 32-bit input into four bytes and uses those
as indices into an S-array. The lookup results
are then added and XORed together to
produce the output. Because Blowfish is a
symmetric algorithm, the same procedure is
used for decryption as well as encryption.
The only difference is that the input to the
encryption is plaintext; for decryption, the
input is cipher text. The P- array and S-array values used by Blowfish
are pre-computed based on the user’s key. In
effect, the user’s key is transformed into the P-array and S-array; the key itself may be
discarded after the transformation. REFERENCES
1) Karri, R. and Mishra, “Minimizing
the secure wireless session energy,”
Journal of Mobile Network and
Applications (MONET) 8, 2 (April),
pp. 177-185.
2) Diaa Salama Abdul. Elminaam,
Hatem Mohamed Abdul Kader and
Mohie Mohamed Hadhoud3,
“Performance Evaluation of
Symmetric Encryption Algorithms,”
in IJCSNS International Journal of
Computer Science and Network
Security, vol.8 No.12, December
2008, pp. 280-286.
3) Prasithsangaree .P and
Krishnamurth
y
.P, “Analysis of

Energy Consumption of RC4 and
AES Algorithms in Wireless LANs,”
Globecom 2003, pp. 1445 – 1449. 4) Nadeem, A. and Javed, M.Y., "A
Performance Comparison of Data
Encryption Algorithms," IEEE
Information and Communication
Technologies, 2005. ICICT 2005.
First International Conference,
February, 2006, pp. 84- 89. 5) Wander, N. Gura, H. Eberle, V.
Gupta, and S. Chang, .Energy
analysis for public-key
cryptography for wireless sensor
networks,. In IEEE PerCom'05,
Pisa, Italy, Mar. 2005. 6) Bruce Schneier. Applied
Cryptography: Protocols,
Algorithms, and Source Code in C.
John Wiley & Sons, 2nd edition,
1995.