Embed Size (px)
Citation preview
Automatic Sea Floor Characterizationbased on Underwater Acoustic Image Processing
CRISTIAN MOLDER, MIRCEA BOSCOIANU, MIHAI I. STANCIU, IULIAN C. VIZITIUMilitary Technical Academy
Department of Electronics and InformaticsGeorge Cosbuc street 81-83, Bucharest
[email protected] http://www.mta.ro
Abstract: Automatic sea floor characterization is mainly based on the signal or image processing of the dataacquired using an active acoustic system called sediment sonar. Each processing method suits a specific type ofsonar, such as the monobeam, the multibeam, or the side-scan sonar. Most types of sonar offer a two dimensionalview of the sea floor surface. Therefore, a high resolution image results which can be further analyzed. Theinconvenient is that the sonar cannot view inside of the sea floor for a deeper analysis. Therefore, lower frequencyacoustic systems are used for in-depth sea floor penetration (boomer, sparker, airguns or sub-bottom profilers). Inthis case, a mono dimensional signal results. Previous studies on the low-frequency systems are mainly based onthe visual inspection by a geological human expert. To automatize this process, we propose the use of feature setsbased on the transposed expert fuzzy reasoning. Two features are extracted, the first based on the sea floor contourand the second based on the sub-bottom sediment texture.
Key–Words: Sedimentology, Underwater Acoustics, Pattern Recognition, Image Processing, Textures, Wavelets
1 IntroductionSea floor acoustics are based on the emission of amodulated or a bandwidth low-frequency signal (usu-ally in the 0.5 - 100 kHz band) followed by the anal-ysis of the received signal from the sea floor. Theresponse is influenced by the interaction between theacoustic wave and the sedimentary structure. Someauthors tried to model these interactions dependingon the particle size and spatial arrangement, the layerpressure, or the saturation percentage [29, 10, 15].Unfortunately, these models cannot include all the in-teractions that occur in the geological structure com-plexity [14, 6].
Nowadays, most of the monodimensional low-frequency sub-bottom seismic recordings using a spe-cialized sonar are interpreted by a human geologicalexpert by reading from a display or a printed paper[27]. Therefore, an automatic algorithm was createdwith the purpose to eliminate the human expertise bytransposing his fuzzy reasoning into new features.
Following discussions with geological experts,the two main visual characteristics observed by a dataanalyzer are the geometric shape of the sea bottom(horizons) and the sub-bottom aspect of the sedimentstructures. Using this information, two feature setscan be obtained. The next section presents the visualcharacteristics of the main sediment classes based on
human expert fuzzy reasoning. The two proposed fea-ture sets are explained in the second part of the paper.The last section contains experimental results, conclu-sion and further work.
2 Human expert fuzzy reasoningIn the sea, uncountable sedimentary level configura-tions can be observed. The acoustic response is basedon the interaction between the incident wave and thesediment geological characteristics (particle shapesand sizes, layer structure). The response is also clearerwhen the difference of impedance between two layersis bigger.
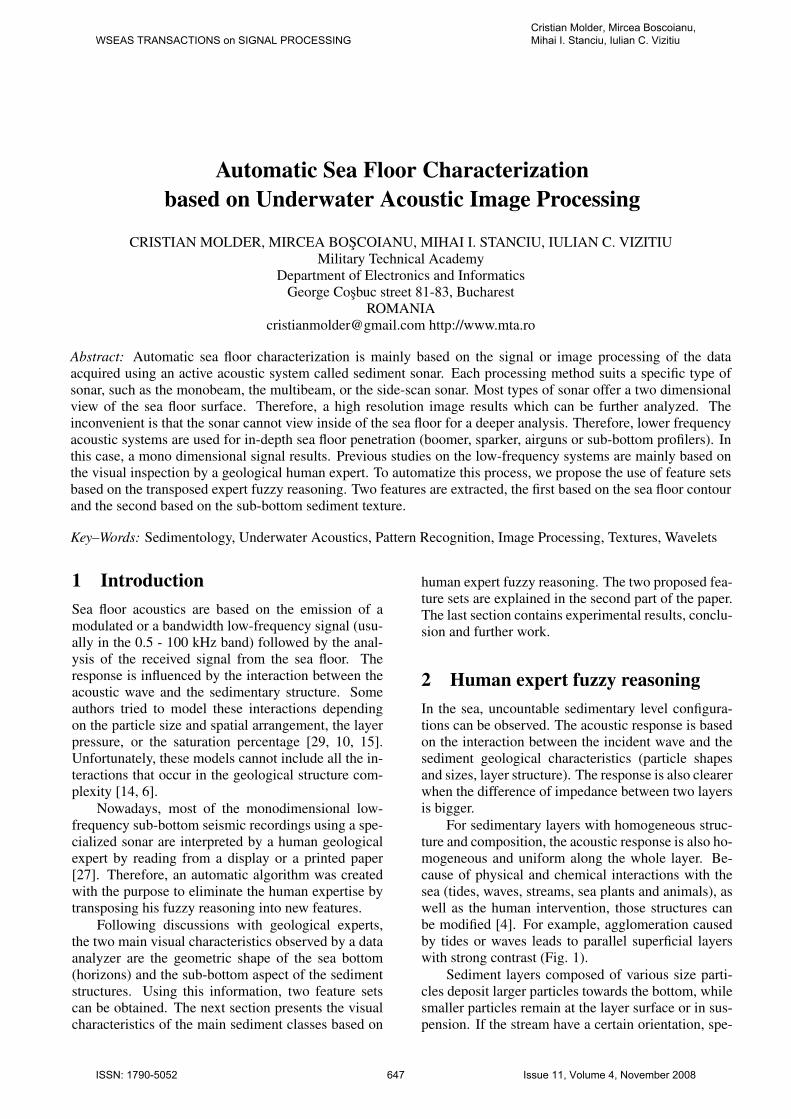
For sedimentary layers with homogeneous struc-ture and composition, the acoustic response is also ho-mogeneous and uniform along the whole layer. Be-cause of physical and chemical interactions with thesea (tides, waves, streams, sea plants and animals), aswell as the human intervention, those structures canbe modified [4]. For example, agglomeration causedby tides or waves leads to parallel superficial layerswith strong contrast (Fig. 1).
Sediment layers composed of various size parti-cles deposit larger particles towards the bottom, whilesmaller particles remain at the layer surface or in sus-pension. If the stream have a certain orientation, spe-
WSEAS TRANSACTIONS on SIGNAL PROCESSINGCristian Molder, Mircea Boscoianu, Mihai I. Stanciu, Iulian C. Vizitiu
ISSN: 1790-5052 647 Issue 11, Volume 4, November 2008
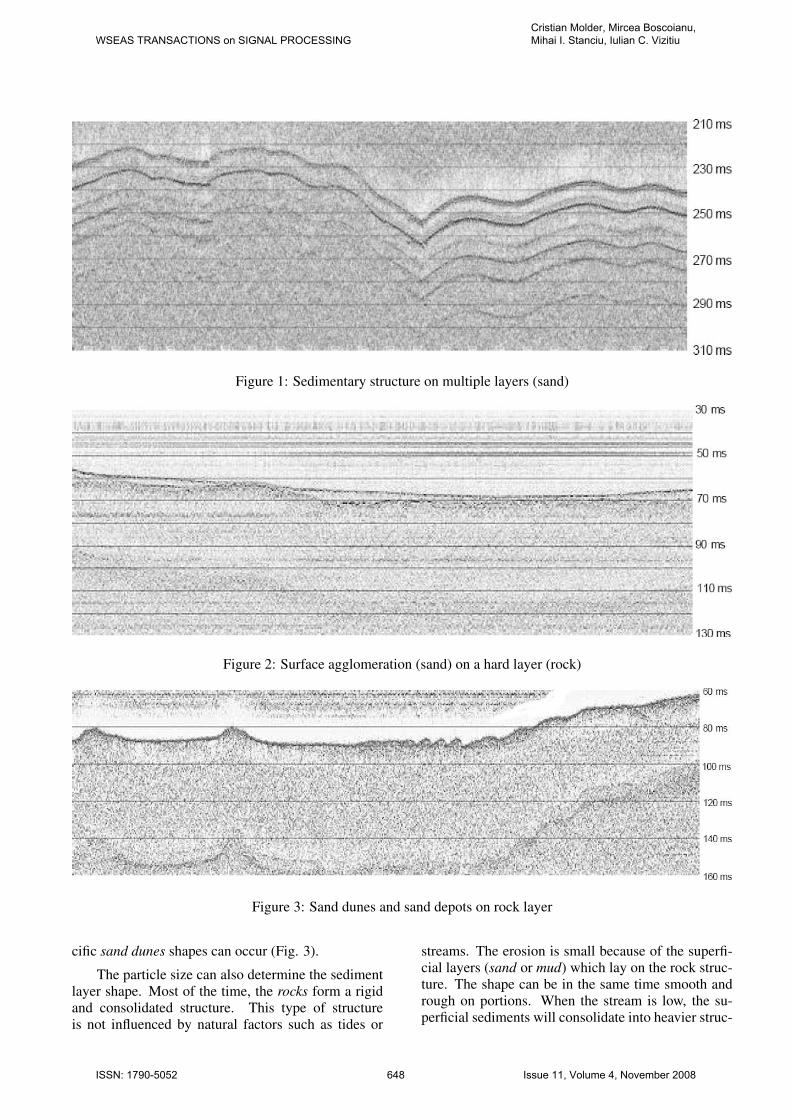
Figure 1: Sedimentary structure on multiple layers (sand)
Figure 2: Surface agglomeration (sand) on a hard layer (rock)
Figure 3: Sand dunes and sand depots on rock layer
cific sand dunes shapes can occur (Fig. 3).
The particle size can also determine the sedimentlayer shape. Most of the time, the rocks form a rigidand consolidated structure. This type of structureis not influenced by natural factors such as tides or
streams. The erosion is small because of the superfi-cial layers (sand or mud) which lay on the rock struc-ture. The shape can be in the same time smooth andrough on portions. When the stream is low, the su-perficial sediments will consolidate into heavier struc-
WSEAS TRANSACTIONS on SIGNAL PROCESSINGCristian Molder, Mircea Boscoianu, Mihai I. Stanciu, Iulian C. Vizitiu
ISSN: 1790-5052 648 Issue 11, Volume 4, November 2008
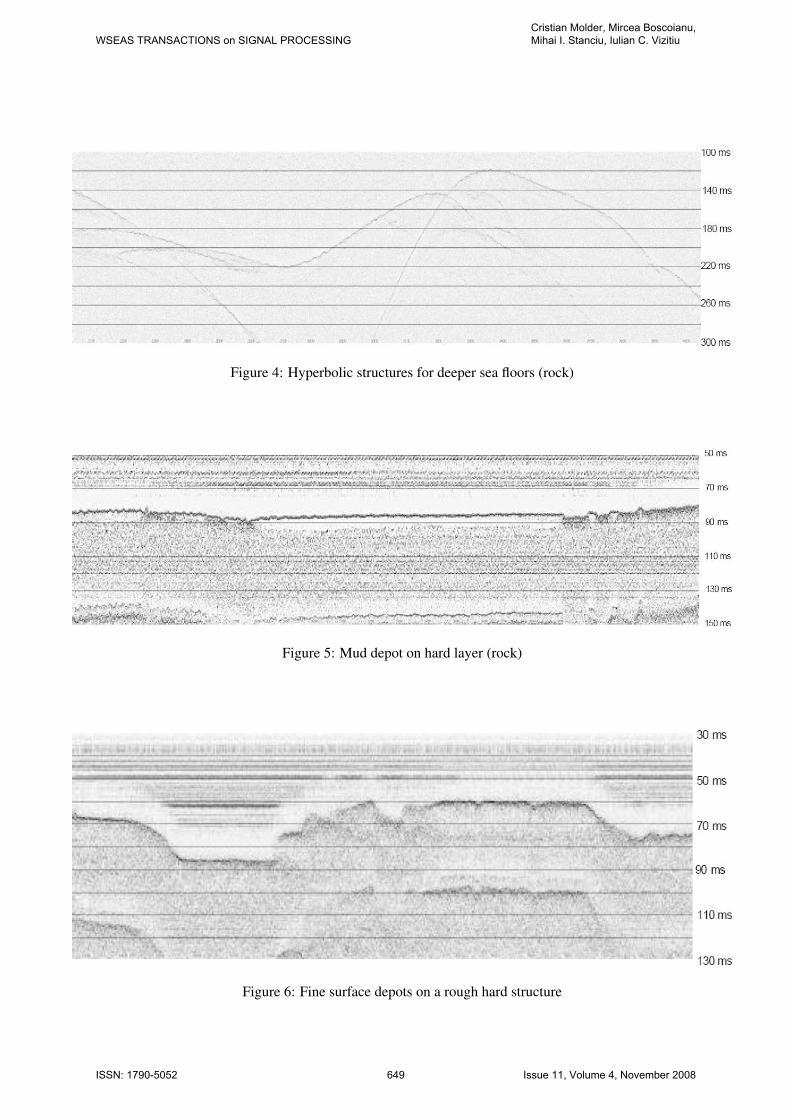
Figure 4: Hyperbolic structures for deeper sea floors (rock)
Figure 5: Mud depot on hard layer (rock)
Figure 6: Fine surface depots on a rough hard structure
WSEAS TRANSACTIONS on SIGNAL PROCESSINGCristian Molder, Mircea Boscoianu, Mihai I. Stanciu, Iulian C. Vizitiu
ISSN: 1790-5052 649 Issue 11, Volume 4, November 2008
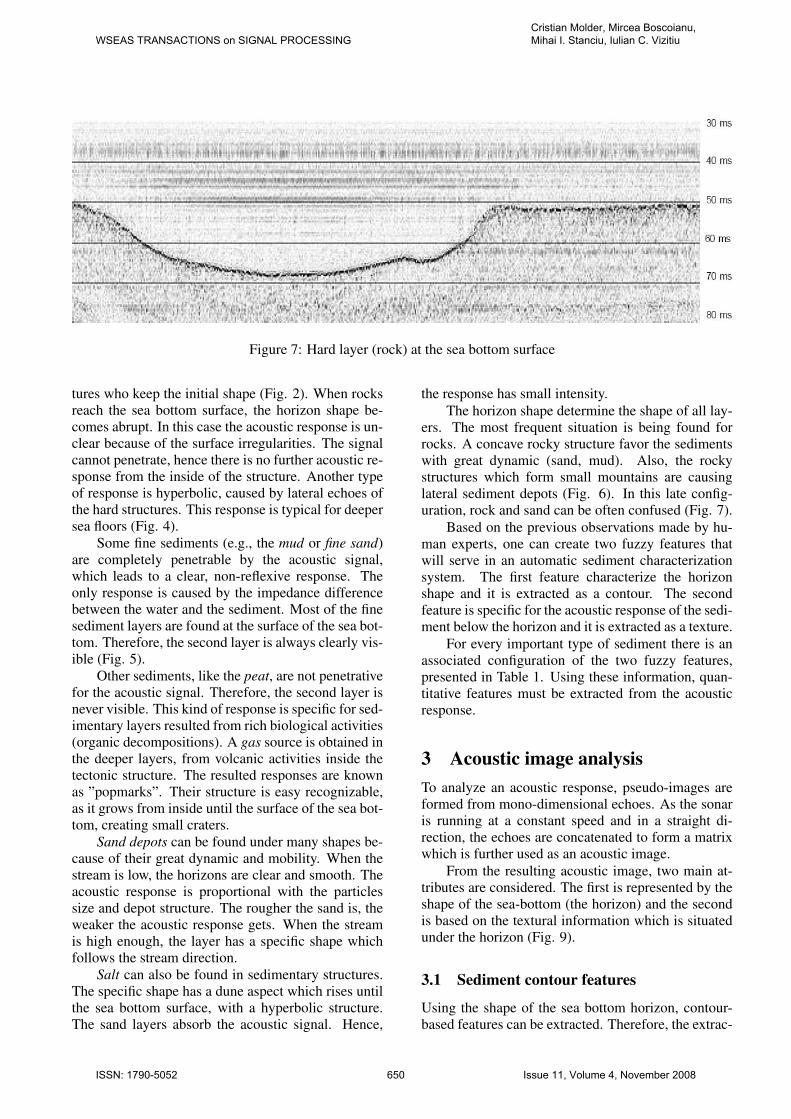
Figure 7: Hard layer (rock) at the sea bottom surface
tures who keep the initial shape (Fig. 2). When rocksreach the sea bottom surface, the horizon shape be-comes abrupt. In this case the acoustic response is un-clear because of the surface irregularities. The signalcannot penetrate, hence there is no further acoustic re-sponse from the inside of the structure. Another typeof response is hyperbolic, caused by lateral echoes ofthe hard structures. This response is typical for deepersea floors (Fig. 4).
Some fine sediments (e.g., the mud or fine sand)are completely penetrable by the acoustic signal,which leads to a clear, non-reflexive response. Theonly response is caused by the impedance differencebetween the water and the sediment. Most of the finesediment layers are found at the surface of the sea bot-tom. Therefore, the second layer is always clearly vis-ible (Fig. 5).
Other sediments, like the peat, are not penetrativefor the acoustic signal. Therefore, the second layer isnever visible. This kind of response is specific for sed-imentary layers resulted from rich biological activities(organic decompositions). A gas source is obtained inthe deeper layers, from volcanic activities inside thetectonic structure. The resulted responses are knownas ”popmarks”. Their structure is easy recognizable,as it grows from inside until the surface of the sea bot-tom, creating small craters.
Sand depots can be found under many shapes be-cause of their great dynamic and mobility. When thestream is low, the horizons are clear and smooth. Theacoustic response is proportional with the particlessize and depot structure. The rougher the sand is, theweaker the acoustic response gets. When the streamis high enough, the layer has a specific shape whichfollows the stream direction.
Salt can also be found in sedimentary structures.The specific shape has a dune aspect which rises untilthe sea bottom surface, with a hyperbolic structure.The sand layers absorb the acoustic signal. Hence,
the response has small intensity.The horizon shape determine the shape of all lay-
ers. The most frequent situation is being found forrocks. A concave rocky structure favor the sedimentswith great dynamic (sand, mud). Also, the rockystructures which form small mountains are causinglateral sediment depots (Fig. 6). In this late config-uration, rock and sand can be often confused (Fig. 7).
Based on the previous observations made by hu-man experts, one can create two fuzzy features thatwill serve in an automatic sediment characterizationsystem. The first feature characterize the horizonshape and it is extracted as a contour. The secondfeature is specific for the acoustic response of the sedi-ment below the horizon and it is extracted as a texture.
For every important type of sediment there is anassociated configuration of the two fuzzy features,presented in Table 1. Using these information, quan-titative features must be extracted from the acousticresponse.
3 Acoustic image analysisTo analyze an acoustic response, pseudo-images areformed from mono-dimensional echoes. As the sonaris running at a constant speed and in a straight di-rection, the echoes are concatenated to form a matrixwhich is further used as an acoustic image.
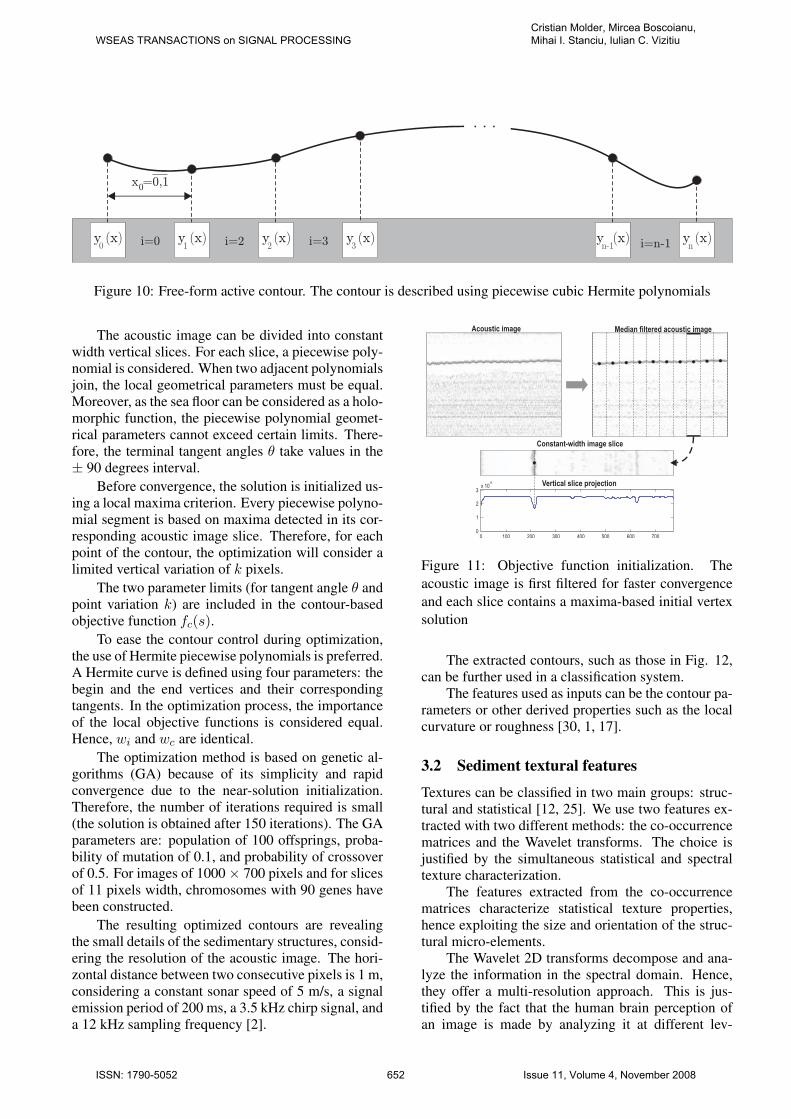
From the resulting acoustic image, two main at-tributes are considered. The first is represented by theshape of the sea-bottom (the horizon) and the secondis based on the textural information which is situatedunder the horizon (Fig. 9).
3.1 Sediment contour features
Using the shape of the sea bottom horizon, contour-based features can be extracted. Therefore, the extrac-
WSEAS TRANSACTIONS on SIGNAL PROCESSINGCristian Molder, Mircea Boscoianu, Mihai I. Stanciu, Iulian C. Vizitiu
ISSN: 1790-5052 650 Issue 11, Volume 4, November 2008
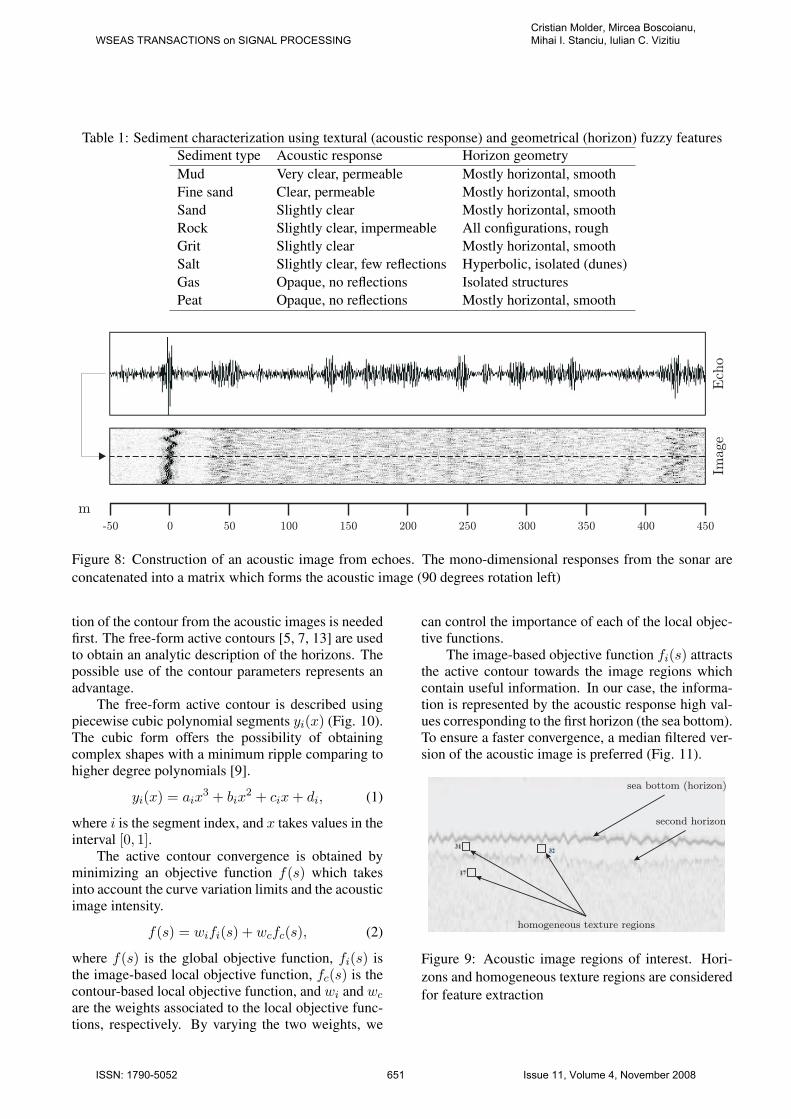
Table 1: Sediment characterization using textural (acoustic response) and geometrical (horizon) fuzzy featuresSediment type Acoustic response Horizon geometryMud Very clear, permeable Mostly horizontal, smoothFine sand Clear, permeable Mostly horizontal, smoothSand Slightly clear Mostly horizontal, smoothRock Slightly clear, impermeable All configurations, roughGrit Slightly clear Mostly horizontal, smoothSalt Slightly clear, few reflections Hyperbolic, isolated (dunes)Gas Opaque, no reflections Isolated structuresPeat Opaque, no reflections Mostly horizontal, smooth
m-50 0 50 100 150 200 250 300 350 400 450
Imag
eE
cho
Figure 8: Construction of an acoustic image from echoes. The mono-dimensional responses from the sonar areconcatenated into a matrix which forms the acoustic image (90 degrees rotation left)
tion of the contour from the acoustic images is neededfirst. The free-form active contours [5, 7, 13] are usedto obtain an analytic description of the horizons. Thepossible use of the contour parameters represents anadvantage.
The free-form active contour is described usingpiecewise cubic polynomial segments yi(x) (Fig. 10).The cubic form offers the possibility of obtainingcomplex shapes with a minimum ripple comparing tohigher degree polynomials [9].
yi(x) = aix3 + bix
2 + cix+ di, (1)
where i is the segment index, and x takes values in theinterval [0, 1].
The active contour convergence is obtained byminimizing an objective function f(s) which takesinto account the curve variation limits and the acousticimage intensity.
f(s) = wifi(s) + wcfc(s), (2)
where f(s) is the global objective function, fi(s) isthe image-based local objective function, fc(s) is thecontour-based local objective function, and wi and wc
are the weights associated to the local objective func-tions, respectively. By varying the two weights, we
can control the importance of each of the local objec-tive functions.
The image-based objective function fi(s) attractsthe active contour towards the image regions whichcontain useful information. In our case, the informa-tion is represented by the acoustic response high val-ues corresponding to the first horizon (the sea bottom).To ensure a faster convergence, a median filtered ver-sion of the acoustic image is preferred (Fig. 11).
sea bottom (horizon)
second horizon
homogeneous texture regions
Figure 9: Acoustic image regions of interest. Hori-zons and homogeneous texture regions are consideredfor feature extraction
WSEAS TRANSACTIONS on SIGNAL PROCESSINGCristian Molder, Mircea Boscoianu, Mihai I. Stanciu, Iulian C. Vizitiu
ISSN: 1790-5052 651 Issue 11, Volume 4, November 2008
y (x)0
y (x)1
y (x)2
y (x)3
y (x)n
y (x)n-1i=0 i=2 i=3
x =0,10
i=n-1
Figure 10: Free-form active contour. The contour is described using piecewise cubic Hermite polynomials
The acoustic image can be divided into constantwidth vertical slices. For each slice, a piecewise poly-nomial is considered. When two adjacent polynomialsjoin, the local geometrical parameters must be equal.Moreover, as the sea floor can be considered as a holo-morphic function, the piecewise polynomial geomet-rical parameters cannot exceed certain limits. There-fore, the terminal tangent angles θ take values in the± 90 degrees interval.
Before convergence, the solution is initialized us-ing a local maxima criterion. Every piecewise polyno-mial segment is based on maxima detected in its cor-responding acoustic image slice. Therefore, for eachpoint of the contour, the optimization will consider alimited vertical variation of k pixels.
The two parameter limits (for tangent angle θ andpoint variation k) are included in the contour-basedobjective function fc(s).
To ease the contour control during optimization,the use of Hermite piecewise polynomials is preferred.A Hermite curve is defined using four parameters: thebegin and the end vertices and their correspondingtangents. In the optimization process, the importanceof the local objective functions is considered equal.Hence, wi and wc are identical.
The optimization method is based on genetic al-gorithms (GA) because of its simplicity and rapidconvergence due to the near-solution initialization.Therefore, the number of iterations required is small(the solution is obtained after 150 iterations). The GAparameters are: population of 100 offsprings, proba-bility of mutation of 0.1, and probability of crossoverof 0.5. For images of 1000 × 700 pixels and for slicesof 11 pixels width, chromosomes with 90 genes havebeen constructed.
The resulting optimized contours are revealingthe small details of the sedimentary structures, consid-ering the resolution of the acoustic image. The hori-zontal distance between two consecutive pixels is 1 m,considering a constant sonar speed of 5 m/s, a signalemission period of 200 ms, a 3.5 kHz chirp signal, anda 12 kHz sampling frequency [2].
Figure 11: Objective function initialization. Theacoustic image is first filtered for faster convergenceand each slice contains a maxima-based initial vertexsolution
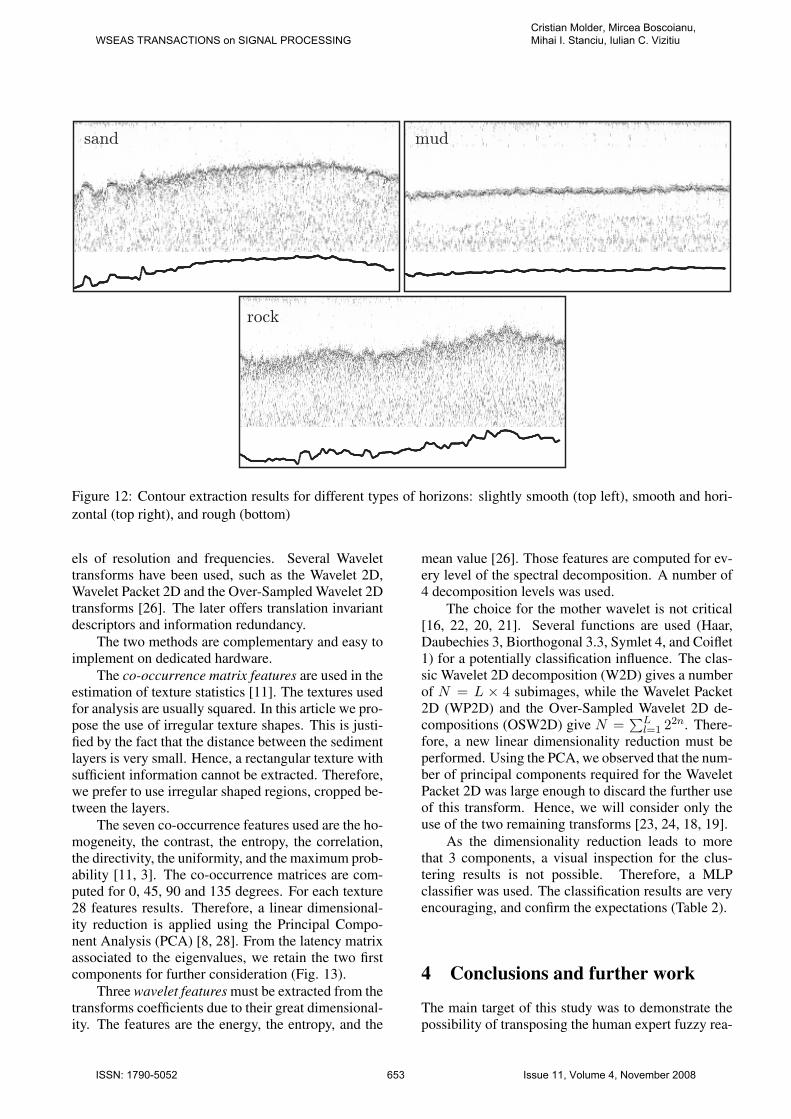
The extracted contours, such as those in Fig. 12,can be further used in a classification system.
The features used as inputs can be the contour pa-rameters or other derived properties such as the localcurvature or roughness [30, 1, 17].
3.2 Sediment textural features
Textures can be classified in two main groups: struc-tural and statistical [12, 25]. We use two features ex-tracted with two different methods: the co-occurrencematrices and the Wavelet transforms. The choice isjustified by the simultaneous statistical and spectraltexture characterization.
The features extracted from the co-occurrencematrices characterize statistical texture properties,hence exploiting the size and orientation of the struc-tural micro-elements.
The Wavelet 2D transforms decompose and ana-lyze the information in the spectral domain. Hence,they offer a multi-resolution approach. This is jus-tified by the fact that the human brain perception ofan image is made by analyzing it at different lev-
WSEAS TRANSACTIONS on SIGNAL PROCESSINGCristian Molder, Mircea Boscoianu, Mihai I. Stanciu, Iulian C. Vizitiu
ISSN: 1790-5052 652 Issue 11, Volume 4, November 2008
sand
rock
mud
Figure 12: Contour extraction results for different types of horizons: slightly smooth (top left), smooth and hori-zontal (top right), and rough (bottom)
els of resolution and frequencies. Several Wavelettransforms have been used, such as the Wavelet 2D,Wavelet Packet 2D and the Over-Sampled Wavelet 2Dtransforms [26]. The later offers translation invariantdescriptors and information redundancy.
The two methods are complementary and easy toimplement on dedicated hardware.
The co-occurrence matrix features are used in theestimation of texture statistics [11]. The textures usedfor analysis are usually squared. In this article we pro-pose the use of irregular texture shapes. This is justi-fied by the fact that the distance between the sedimentlayers is very small. Hence, a rectangular texture withsufficient information cannot be extracted. Therefore,we prefer to use irregular shaped regions, cropped be-tween the layers.
The seven co-occurrence features used are the ho-mogeneity, the contrast, the entropy, the correlation,the directivity, the uniformity, and the maximum prob-ability [11, 3]. The co-occurrence matrices are com-puted for 0, 45, 90 and 135 degrees. For each texture28 features results. Therefore, a linear dimensional-ity reduction is applied using the Principal Compo-nent Analysis (PCA) [8, 28]. From the latency matrixassociated to the eigenvalues, we retain the two firstcomponents for further consideration (Fig. 13).
Three wavelet features must be extracted from thetransforms coefficients due to their great dimensional-ity. The features are the energy, the entropy, and the
mean value [26]. Those features are computed for ev-ery level of the spectral decomposition. A number of4 decomposition levels was used.
The choice for the mother wavelet is not critical[16, 22, 20, 21]. Several functions are used (Haar,Daubechies 3, Biorthogonal 3.3, Symlet 4, and Coiflet1) for a potentially classification influence. The clas-sic Wavelet 2D decomposition (W2D) gives a numberof N = L × 4 subimages, while the Wavelet Packet2D (WP2D) and the Over-Sampled Wavelet 2D de-compositions (OSW2D) give N =
∑Ll=1 22n. There-
fore, a new linear dimensionality reduction must beperformed. Using the PCA, we observed that the num-ber of principal components required for the WaveletPacket 2D was large enough to discard the further useof this transform. Hence, we will consider only theuse of the two remaining transforms [23, 24, 18, 19].
As the dimensionality reduction leads to morethat 3 components, a visual inspection for the clus-tering results is not possible. Therefore, a MLPclassifier was used. The classification results are veryencouraging, and confirm the expectations (Table 2).
4 Conclusions and further work
The main target of this study was to demonstrate thepossibility of transposing the human expert fuzzy rea-
WSEAS TRANSACTIONS on SIGNAL PROCESSINGCristian Molder, Mircea Boscoianu, Mihai I. Stanciu, Iulian C. Vizitiu
ISSN: 1790-5052 653 Issue 11, Volume 4, November 2008
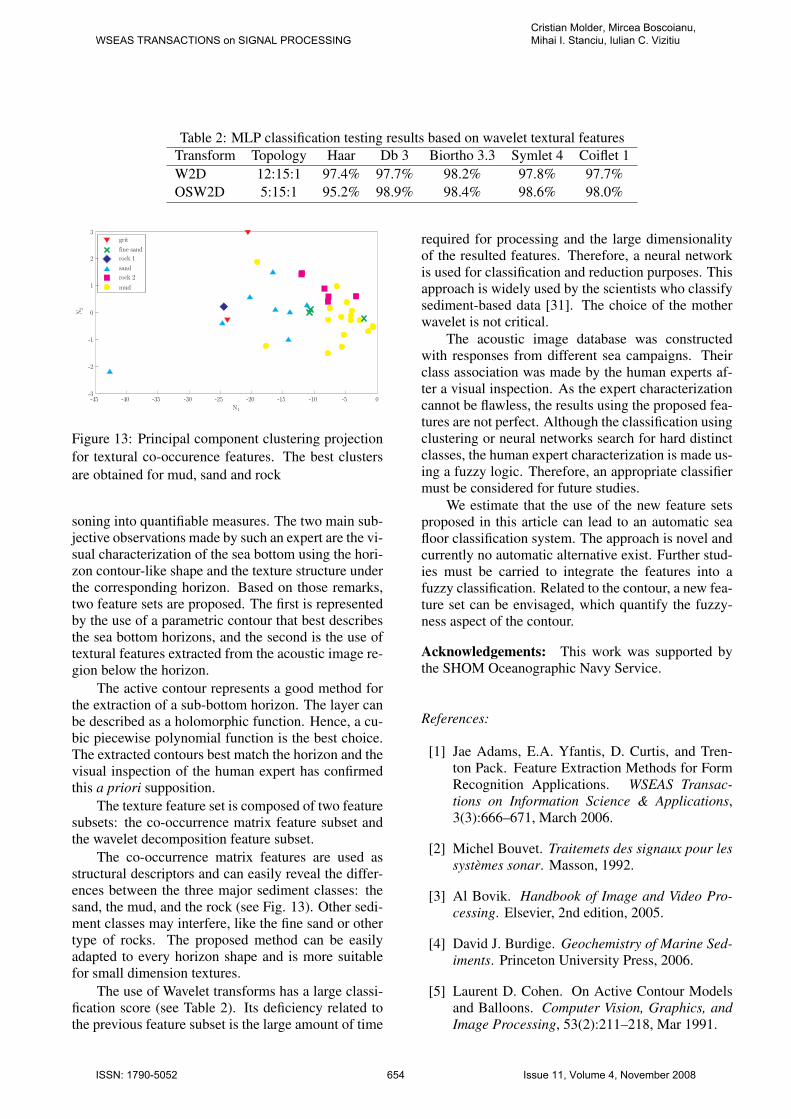
Table 2: MLP classification testing results based on wavelet textural featuresTransform Topology Haar Db 3 Biortho 3.3 Symlet 4 Coiflet 1W2D 12:15:1 97.4% 97.7% 98.2% 97.8% 97.7%OSW2D 5:15:1 95.2% 98.9% 98.4% 98.6% 98.0%
grit
fine sand
rock 1
sand
rock 2
mud
N 2
N1
-45 -40 -35 -30 -25 -20 -15 -10 -5 0-3
-2
-1
0
1
2
3
Figure 13: Principal component clustering projectionfor textural co-occurence features. The best clustersare obtained for mud, sand and rock
soning into quantifiable measures. The two main sub-jective observations made by such an expert are the vi-sual characterization of the sea bottom using the hori-zon contour-like shape and the texture structure underthe corresponding horizon. Based on those remarks,two feature sets are proposed. The first is representedby the use of a parametric contour that best describesthe sea bottom horizons, and the second is the use oftextural features extracted from the acoustic image re-gion below the horizon.
The active contour represents a good method forthe extraction of a sub-bottom horizon. The layer canbe described as a holomorphic function. Hence, a cu-bic piecewise polynomial function is the best choice.The extracted contours best match the horizon and thevisual inspection of the human expert has confirmedthis a priori supposition.
The texture feature set is composed of two featuresubsets: the co-occurrence matrix feature subset andthe wavelet decomposition feature subset.
The co-occurrence matrix features are used asstructural descriptors and can easily reveal the differ-ences between the three major sediment classes: thesand, the mud, and the rock (see Fig. 13). Other sedi-ment classes may interfere, like the fine sand or othertype of rocks. The proposed method can be easilyadapted to every horizon shape and is more suitablefor small dimension textures.
The use of Wavelet transforms has a large classi-fication score (see Table 2). Its deficiency related tothe previous feature subset is the large amount of time
required for processing and the large dimensionalityof the resulted features. Therefore, a neural networkis used for classification and reduction purposes. Thisapproach is widely used by the scientists who classifysediment-based data [31]. The choice of the motherwavelet is not critical.
The acoustic image database was constructedwith responses from different sea campaigns. Theirclass association was made by the human experts af-ter a visual inspection. As the expert characterizationcannot be flawless, the results using the proposed fea-tures are not perfect. Although the classification usingclustering or neural networks search for hard distinctclasses, the human expert characterization is made us-ing a fuzzy logic. Therefore, an appropriate classifiermust be considered for future studies.
We estimate that the use of the new feature setsproposed in this article can lead to an automatic seafloor classification system. The approach is novel andcurrently no automatic alternative exist. Further stud-ies must be carried to integrate the features into afuzzy classification. Related to the contour, a new fea-ture set can be envisaged, which quantify the fuzzy-ness aspect of the contour.
Acknowledgements: This work was supported bythe SHOM Oceanographic Navy Service.
References:
[1] Jae Adams, E.A. Yfantis, D. Curtis, and Tren-ton Pack. Feature Extraction Methods for FormRecognition Applications. WSEAS Transac-tions on Information Science & Applications,3(3):666–671, March 2006.
[2] Michel Bouvet. Traitemets des signaux pour lessystemes sonar. Masson, 1992.
[3] Al Bovik. Handbook of Image and Video Pro-cessing. Elsevier, 2nd edition, 2005.
[4] David J. Burdige. Geochemistry of Marine Sed-iments. Princeton University Press, 2006.
[5] Laurent D. Cohen. On Active Contour Modelsand Balloons. Computer Vision, Graphics, andImage Processing, 53(2):211–218, Mar 1991.
WSEAS TRANSACTIONS on SIGNAL PROCESSINGCristian Molder, Mircea Boscoianu, Mihai I. Stanciu, Iulian C. Vizitiu
ISSN: 1790-5052 654 Issue 11, Volume 4, November 2008
[6] I. Cojan and M. Renard. Sedimentologie.Dunod, 1999.
[7] T. F. Cootes, C. J. Taylor, D. H. Cooper, andJ. Graham. Active Shape Models - Their Train-ing and Application. Computer Vision and Im-age Understanding, 61(1):38–59, Jan 1995.
[8] R. O. Duda, P. E. Hart, and D. G. Stork. PatternClassification. John Wiley & Sons, Inc., secondedition, 2001.
[9] James D. Foley, Andrie van Dam, Steven K.Feiner, and John F. Hughes. Computer Graph-ics. Principles and Practice. Addison Wesley,2nd edition, 1997.
[10] Cedric Gervaise, Nicolas Grangier, and An-dre Quinquis. Caracterisation de la litholo-gie sedimentaire par le coefficient d’attenuation.In 5eme Journees d’Etude d’Acoustique Sous-Marine, Brest, France, Nov 2000.
[11] Rafael C. Gonzales and Richard C. Woods. Digi-tal Image Processing. Prentice Hall, 3rd edition,2008.
[12] Robert M. Haralick. Statistical and StructuralAproaches to Texture. Proceedings of the IEEE,67(5):786–804, May 1979.
[13] Michael Kass, Andrew Witkin, and Demetri Ter-zopoulos. Snakes: Active Contour Models. In-ternational Journal of Computer Vision, 1:321–331, 1987.
[14] Xavier Lurton. An Introduction to UnderwaterAcoustics. Springer, 2002.
[15] Claire-Sophie Maroni. Determination automa-tique de la stratification des fonds sous-marins al’aide d’un sondeur de sediments. Ph.D. Thesis,Universite Bretagne Occidentale, Brest, France,1997.
[16] Aleksandra Mojsilovic, Miodrag V. Popovic,and Dejan M. Rackov. On the Selection of anOptimal Wavelet Basis for Texture Characteri-zation. IEEE Transactions on Image Processing,9(12):2043–2050, Dec 2000.
[17] Cristian Molder. Aide a l’interpretationdes donnees sedimentologiques. Analyse del’information de retrodiffusion entre deuxcouches par traitement d’images. M.Sc. Thesis,Universite de Brest, Brest, Jun 2001.
[18] Cristian Molder. Proprietes acoustiques du sous-sol marin mesurees a l’aide d’un sondeur desediments. Research report 01/RC/A/11.01, EN-SIETA, Brest, France, 2001.
[19] Cristian Molder. Proprietes acoustiques du sous-sol marin mesurees a l’aide d’un sondeur desediments. Research report 02/RC/A/02.02, EN-SIETA, Brest, France, 2002.
[20] Cristian Molder. Proprietes acoustiques du sous-sol marin mesurees a l’aide d’un sondeur desediments. Research report 03/RC/A/05.02, EN-SIETA, Brest, France, 2002.
[21] Cristian Molder. Proprietes acoustiques du sous-sol marin mesurees a l’aide d’un sondeur desediments. Research report 04/RC/A/10.08, EN-SIETA, Brest, France, 2002.
[22] Cristian Molder. Contributions to PatternRecognition and Classification. Ph. D. The-sis, Military Technical Academy, Bucharest, Jun2008.
[23] Cristian Molder, Helene Thomas, and AndreQuinquis. Texture analysis and marine sedi-ment characterization from acoustical data. InProceedings of the 32nd International Scien-tific Symposium of the Defense Research Agency,volume 4, pages 237–244, Apr 2001.
[24] Cristian Molder, Helene Thomas, and AndreQuinquis. Classification des signaux marins paranalyse des textures. In Proceedings of the 13thReconnaissance de Formes et Intelligence Arti-ficielle Conference (RFIA), Angers, France, vol-ume 3, pages 799–808, Jan 2002.
[25] Maria Petrou and Pedro Garcia Sevilla. Dealingwith Texture. John Wiley & Sons, 2006.
[26] P. Scheunders, S. Lievens, G. Van de Wouwer,P. Vautrot, and D. Van Dyck. Wavelet-basedTexture Analysis. International Journal Com-puter Science and Information management,1:22–34, 1998.
[27] Charles H. Sherman and John L. Butler. Trans-ducers and Arrays for Underwater Sound.Springer, 2007.
[28] Mihran Tuceryan and Anil K. Jain. The Hand-book of Pattern Recognition and Computer Vi-sion, chapter Texture Analysis, pages 207–248.World Scientific Publishing Co., 2nd edition,1998.
WSEAS TRANSACTIONS on SIGNAL PROCESSINGCristian Molder, Mircea Boscoianu, Mihai I. Stanciu, Iulian C. Vizitiu
ISSN: 1790-5052 655 Issue 11, Volume 4, November 2008

[29] S. Unterseh. Cartographie et caracterisation dufond par sondeur multifaisceaux. Ph.D. The-sis, Institut National Polytechnique de Lorraine,Nancy, France, 1999.
[30] Constantin-Iulian Vizitiu, Doru Munteanu, andCristian Molder. A New Version of Flusser Mo-ment Set for Pattern Feature Extraction. WSEASTransactions on Information Science & Applica-tions, 5(4):396–406, April 2008.
[31] Yu-Ming Wang, Seydou Traore, and TienfuanKerh. Monitoring Event-Based Suspended Sed-iment Concentration by Artificial Neural Net-work Models. WSEAS Transactions on Comput-ers, 7(5):559–568, May 2008.
WSEAS TRANSACTIONS on SIGNAL PROCESSINGCristian Molder, Mircea Boscoianu, Mihai I. Stanciu, Iulian C. Vizitiu
ISSN: 1790-5052 656 Issue 11, Volume 4, November 2008