Embed Size (px)
Citation preview

1
Autonomic cardiac control during the cold pressor test
in normal subjects
Running title: Cardiac autonomic modulation during cold pressor test.
Key words :
Heart rate variability; spectral analysis; detrended fluctuation analysis; fractal; cold pressor
test
Authors.
Laurent MOUROT1, Malika BOUHADDI1, 2, Alain BOUSSUGES3, Jacques REGNARD1, 2
1 - Université de Franche Comté, EA 3920 and IFR133, Physiologie, Faculté de Médecine, Besançon, France
2 - Centre Hospitalier Universitaire, Explorations fonctionnelles - Physiologie, Besançon, France
3 - Université de la Méditerranée, EA 3280, Physiopathologie et action thérapeutique des gaz sous pression,
Marseille, France and Institut de Médecine Navale du Service de Santé des Armées, Toulon, France
Address of correspondence: MOUROT Laurent Telephone: +33 3.81.66.56.54 Telefax: +33 3.81.66.56.14 e-mail: [email protected]
Laboratoire de Physiologie Faculté de Médecine et de Pharmacie F-25030 Besançon Cedex FRANCE
2
Abstract (186 words)
The cold pressor test (CPT) triggers in healthy subjects a vascular sympathetic activation and
an increase in blood pressure. The heart rate (HR) response to this test is less well defined,
with a high inter- individual variability. We used traditional spectral analysis together with the
non- linear detrended fluctuation analysis to study the autonomic control of HR during a 3-min
CPT. 39 healthy young subjects (23.7 ± 3.2 years, height 180.4 ± 4.7 cm and weight 73.3 ±
6.4 kg) were divided into two groups according to their HR responses to CPT. Twenty
subjects have a sustained increase in HR throughout the test with reciprocal autonomic
interaction, i.e. increase in sympathetic activity and decrease vagal outflow. In the 19
remainders, HR decreased after an initial increase, with indication of involvement of both
sympathetic and vagal outflow. Baseline evaluation of the subjects revealed no difference
between the two groups. A higher sympathetic activity at the skin level during CPT was
nevertheless present in the group with decreased HR. Further studies are needed to explain
why healthy subjects react differently to the CPT and if this has potential clinical
implications.
3
Introduction
The cold pressor test (CPT) is typically performed by immersing a subject’s hand into ice
water (1-5 C°) for a short period of time (1-6 minutes) while measuring blood pressure (BP)
and heart rate (HR). In normal subjects, a vascular sympathetic response increased peripheral
resistances and a sustained increased BP is observed (Victor et al. 1987, Fagius et al. 1989,
Weise et al. 1993, Stancak et al. 1996, Sendowski et al. 2000, Cui et al. 2002).
The HR response is less well defined, more variable on an individual basis (Jauregui-Renaud
et al. 2001, Glenn & Ditto 2004) and not homogeneous for the entire CPT period. Two major
patterns could be distinguished with either an increased (LeBlanc et al. 1975, Shibahara et al.
1996, Jauregui-Renaud et al. 2001, Dishman et al. 2003) or an unchanged HR (Weise et al.
1993, Sendowski et al. 1997, Cui et al. 2002, Fu et al. 2002). The latter response appeared
less to be a “true” unchanged HR than a biphasic alteration, with an initial increase followed
by a slow decrease that could return toward the control values (Victor et al. 1987, Stancak et
al. 1996, Sendowski et al. 1997, Cui et al. 2002). Contrary to the vascular control, the
autonomic HR control needs to be precise during CPT. Initially, a decrease in cardiac vagal
outflow was accepted together with the sympathetic involvement (Frey et al. 1980a, Dishman
et al. 2003, Tulppo et al. 2005, Wirch et al. 2006). However, these changes were not always
found. An increase in vagal activity (Frey et al. 1980b, Shibahara et al. 1996, Sendowski et
al. 1997, Glenn & Ditto 2004) induced by baroreceptor activity stimulation has also been
hypothesized. This vagal stimulation should occur concomitantly to the persistent sympathetic
involvement leading to cardiac autonomic co-activation (Weise et al. 1993). However, to our
knowledge, this was not verified, mainly because in these previous reports the cardiac
autonomic control was studied by spectral analysis of heart rate variability (HRV). However,
this method may not offer a proper assessment of the HR dynamics during CPT because of
limitations inherent in its stationary hypothesis (Task Force 1996).
4
New analysis techniques, such as analysis of fractal scaling exponents by detrended
fluctuation analysis (DFA), have been developed to probe features in HRV that are not
detectable by traditional analysis method. With DFA, the short-term (from 4 to 11 beats)
fractal organization in human HRV is expressed as a scaling exponent named α1. Changes in
α1 allowed highlighting cardiac autonomic co-activation or reciprocal changes in vagal /
sympathetic activity (Tulppo et al. 2001a, Tulppo et al. 2005). Therefore, DFA may help to
describe the cardiac autonomic status during CPT.
The aim of the present research was to study the autonomic control of HR during CPT. For
that purpose, subjects were divided into two groups according to their HR response, and their
autonomic control profiles were studied by means of linear and non- linear HRV analysis. We
hypothesized that in the group with sustained increased HR, α1 would increased, suggesting a
decrease in cardiac vagal outflow together with sympathetic activation, while in the group
with an increase followed by a decrease in HR, α1 would decrease suggesting cardiac
autonomic co-activation. Differences in baseline autonomic characteristics were suspected to
explain these two HR responses.
Methods
Subjects
Forty male students (age 23.6 ± 3.2 years mean ± SD; height 180.4 ± 4.6 cm; and weight 73.4
± 6.4 kg) voluntarily participated in the study. That was the first time that they have to
perform a cold pressor test. Their medical history and a medical examination were used to
discard subjects with cardiovascular, pulmonary, or metabolic diseases. The subjects were
normotensive and none was taking any medication. The study protocol complied with the
Helsinki declaration for human experimentation. The subjects were informed of the
5
organization and details of the study and signed an informed consent form, which was
approved by our local ethics committee.
Testing protocol
The subjects were instructed to fast for at least 3 h before testing, and were asked to refrain
from ingesting beverages containing caffeine and alcohol and not to exercise during the 24 h
preceding each test. They were studied in the supine position in a quiet, dimly lighted room
(ambient temperature, 26°C to 27°C). Before each test, the subjects, wearing short pants and
T-shirts, rested 20 min to ensure hemodynamic stabilization. Then, baseline measurements
started for 10 min. Subsequently, the subject immersed its left hand to the wrist into a 0-1°C
water bath for a period of 3 minutes, followed by removal of the hand from the bath and
continuation of recording for another 5 minutes.
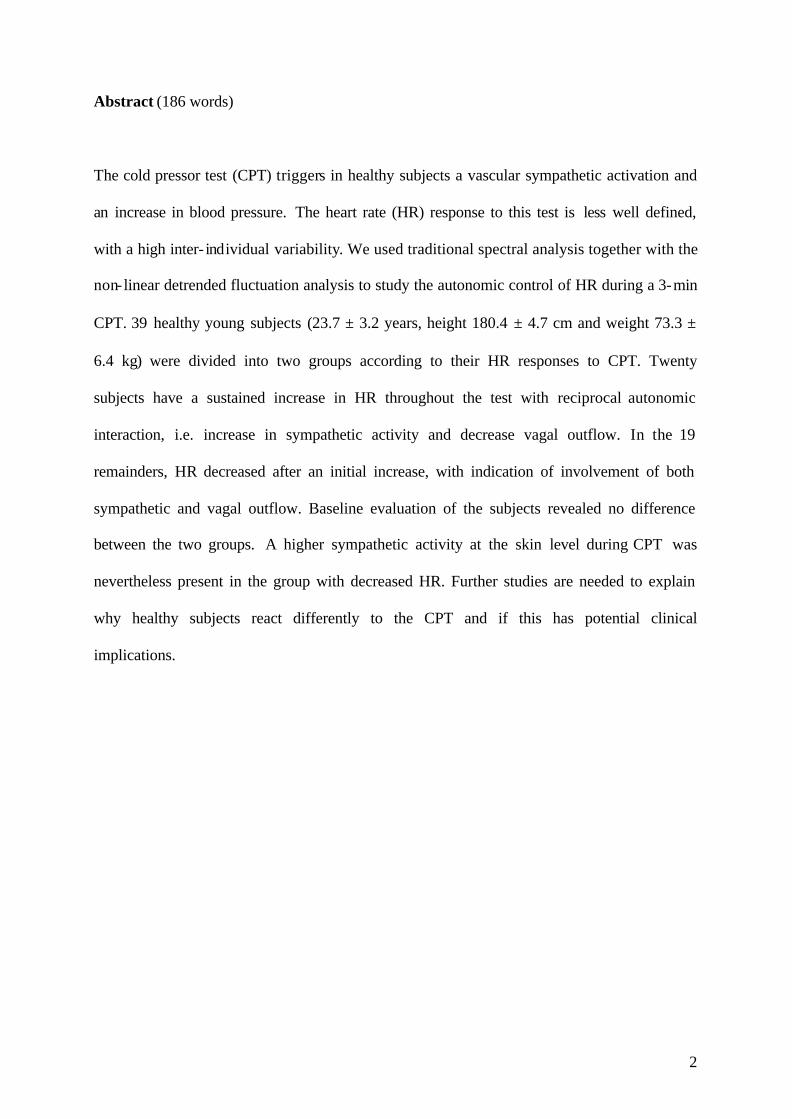
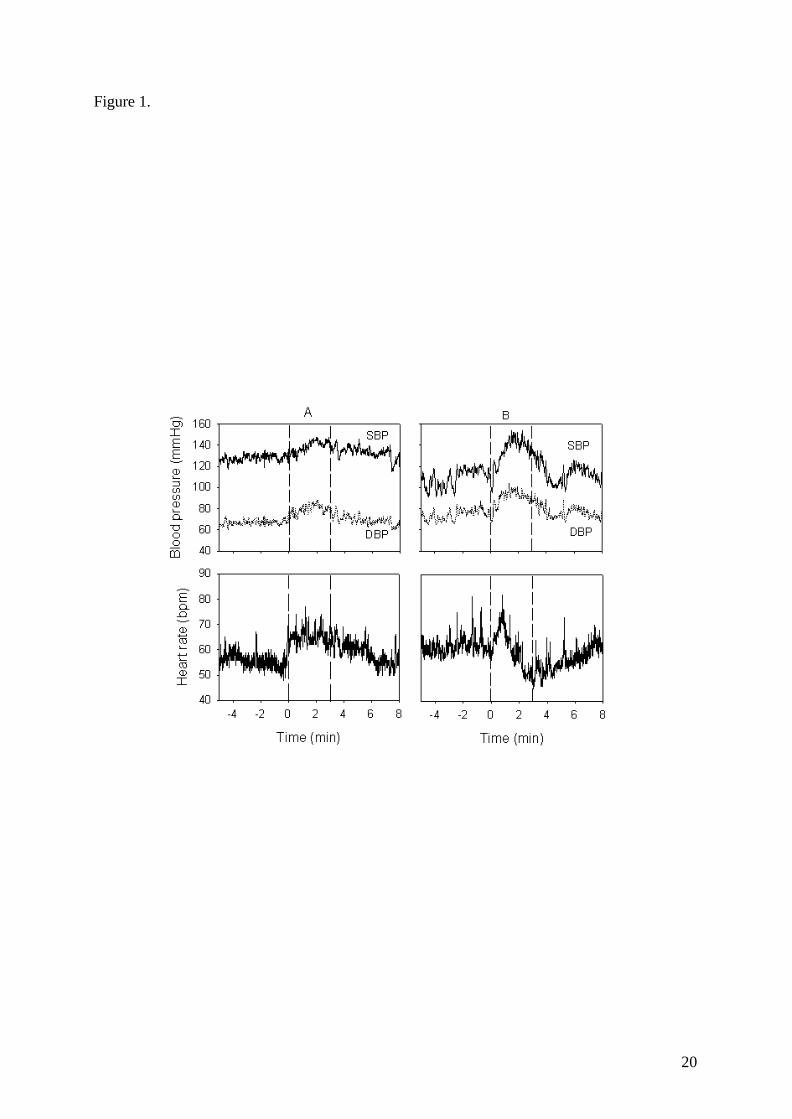
The HR changes during the first part of the CPT test were roughly the same whatever the
subjects. During the first minute, HR continuously rose until an initial peak. According to the
HR changes after this peak, the subjects were divided into two groups. One group (CPTi) was
constituted with subjects that further increased or maintained their HR during the second and
third minutes of the test. The second group (CPTd) was constituted with subjects that
decreased their HR by more than 5 beats per minute (mean over 10 sec). To properly describe
these HR alterations, times of maximal HR, time of minimal values after this maximal, and
the corresponding HR values (mean over 10 sec) were considered. If HR decreased less than 5
beats, the HR was considered to be maintained (Figure 1).

6
Hemodynamic measurements
Beat-to-beat BP was measured continuously using the Finometer® (Finapres Medical
System, Amsterdam, The Netherlands). This device measures arterial pressure through a cuff
wrapped around the middle phalanx of the middle finger. It has been demonstrated that
finger BP recordings can accurately reproduce the beat-to-beat changes in intra-arterial
blood pressure induced by a cold pressor stimulus (Parati et al. 1989). Arterial pulse pressure
(PP, mmHg) was calculated from systolic (SBP) minus diastolic (DBP) blood pressure. The
arterial pressure signal was analyzed using the Beatscope Software (TNO-TPD, Biomedical
Instrumentation). Heart rate (HR) was derived from the beat to beat arterial pressure wave.
Stroke volume (SV) was analysed by the Modelflow (Bogert & van Lieshout 2005). Cardiac
output (CO) was calculated as the product of HR and SV and total peripheral resistance
(TPR) by dividing mean arterial pressure (MAP) by CO.
To study heart rate variability (HRV), R-R intervals were obtained from a standard ECG.
Cardiovascular autonomic nervous activity evaluation
Firstly, baseline autonomic nervous profile of the subjects were evaluated thanks to heart rate
(HRV) and blood pressure (BPV) variability analyses performed on a time series of 256
cycles selected during the baseline period, according to standard recommendations (Task
Force 1996). The corresponding hemodynamic data are presented in Table 1. Secondly, HRV
analysis was performed on a one minute- length basis to evaluate the cardiac autonomic
nervous response to the CPT. Three different minutes were chosen for this evaluation: during
the baseline period (corresponding hemodynamic data presented in Table 2), and during the
second and third minute of CPT. Since maximal discomfort occur in the first minute of cold
stimulus, the first minute was not addressed in the present study (Hilz et al. 2002).
7
All the R-R intervals, SBP and DBP values used for analyses were edited initially by visual
inspection to exclude all the undesirable beats (i.e., to ensure that each analysis for the
segment was free of movement artifact and/or sharp transient in the signal due to premature
beats) which accounted for less than 1% in every subjects.
Spectrum analysis was performed with the coarse graining spectral analysis (CGSA) method
(Yamamoto & Hughson 1991) that separates and permits simultaneous quantification of the
contribution of the harmonic and fractal components of the total spectral power (TP), even
when the data length is short (Yamamoto & Hughson 1991). From the harmonic component
(HP) the integrated powers (ms²) in the low- (LF: 0.04-0.15 Hz) and high- frequencies (HF:
0.15-0.50 Hz) were computed (Yamamoto & Hughson 1991). The very low frequencies (0-
0.04 Hz) were not addressed in the present study. With HRV, the HF power normalized to the
total spectral power (HFnu) was used as an indicator of parasympathetic activity. Despite
controversial results, the LF/HF ratio is often used as an indicator of sympathetic activity
(Yamamoto & Hughson 1991) and was used with this meaning.
The heart beat times series exhibits pattern of non linear process and is non-stationary during
CPT. To better delineate the cardiac autonomic control, we used the DFA method to quantify
the fractal- like scaling properties of the R-R interval data (Peng et al. 1995). The algorithm
computes R-R intervals fluctuations in several windows of different sizes and finally creates a
log–log curve, the slope of which defines the scaling exponent α1. This short-term scaling
exponent was computed for small (four to 11 beats) time scales. Details of DFA have been
described previously (Peng et al. 1995, Tulppo et al. 2001a, Tulppo et al. 2001b, Tulppo et al.
2005).
8
Spontaneous Baroreflex sensitivity
Sequences of three or more beats in which the SBP and the following R-R interval changed
in the same direction (either increasing or decreasing), which reflect the HR response to
spontaneous variations in BP, were considered as spontaneous baroreflex (SBR) sequences.
A linear regression was calculated for each of these sequences, and an average regression
slope was calculated for all such sequences detected during each chosen recording epoch.
This slope is considered as depicting the sensitivity of the cardiac SBR (ms.mmHg-1)
(Bahjaoui-Bouhaddi et al. 2000).
Temperature
Subjects’ skin temperatures of the two hands (middle of the third metacarpus of the palmar
side) were measured continuously by means of thermistor surface contact probes [series 400,
type 409B, Yellow Springs Instrument (YSI); accuracy ± 0.1°C] fixed on the skin with thin,
air-permeable, adhesive surgical tape. The probes were applied on the cent re of the palmar
surface.
Statistical methods
Standard statistical methods were used for the calculation of mean ± SD. Two comparisons
were performed. The baseline characteristics, the time of maximal and minimal HR (and the
corresponding values) of the subjects of the two groups were compared thanks to an
unpaired t-test. Finally, the responses to the cold pressor test within each group were
evaluated with a one-way ANOVA with repeated measures. When appropriate, post-hoc t-
tests for paired data with Bonferroni correction were performed. Statistical significance was
9
accepted at the p<0.05 level. Statistical analyses were performed using SigmaStat® software
(SPSS Inc, Chicago, USA).
Results
Cold pressor test and measurements were successfully performed in all but one subject, which
was removed from the results presented here. In this subject, beat-by beat blood pressure
could not reliably be evaluated during the entire test’s duration. Without this subject, the
characteristics of the subjects were age 23.7 ± 3.2 years, height 180.4 ± 4.7 cm and weight
73.3 ± 6.4 kg. Based on the HR response to the CPT, 20 subjects formed the CPTi group and
19 were assigned to the CPTd group.
Baseline characteristics of the two groups.
Anthropometric and hemodynamic data and indexes derived from analyses of HRV and BPV
are given in Table 1. At baseline, no significant differences were found between CPTi and
CPTd.
Hemodynamic responses during the CPT (Table 2)
For the two groups, significant increases in BP and TPR were observed during the second and
third minutes of CPT. For the CPTi group, the increases between baseline and the third
minute were 14.7 ± 10.4 %, 19.1 ± 14.6 %, and 16.7 ± 23.9 %, for SBP, DBP and TPR,
respectively. For the CPTd group, the increases were 12.5 ± 7.7 %, 15.0 ± 10.2 %, and 17.8 ±
17.0 %, for SBP, DBP and TPR, respectively (Table 2). PP also increased, but the increases
reached the significant level only for the third minute (9.6 ± 10.4 % for CPTi and 9.5 ± 10.7
% for CPTd).
10
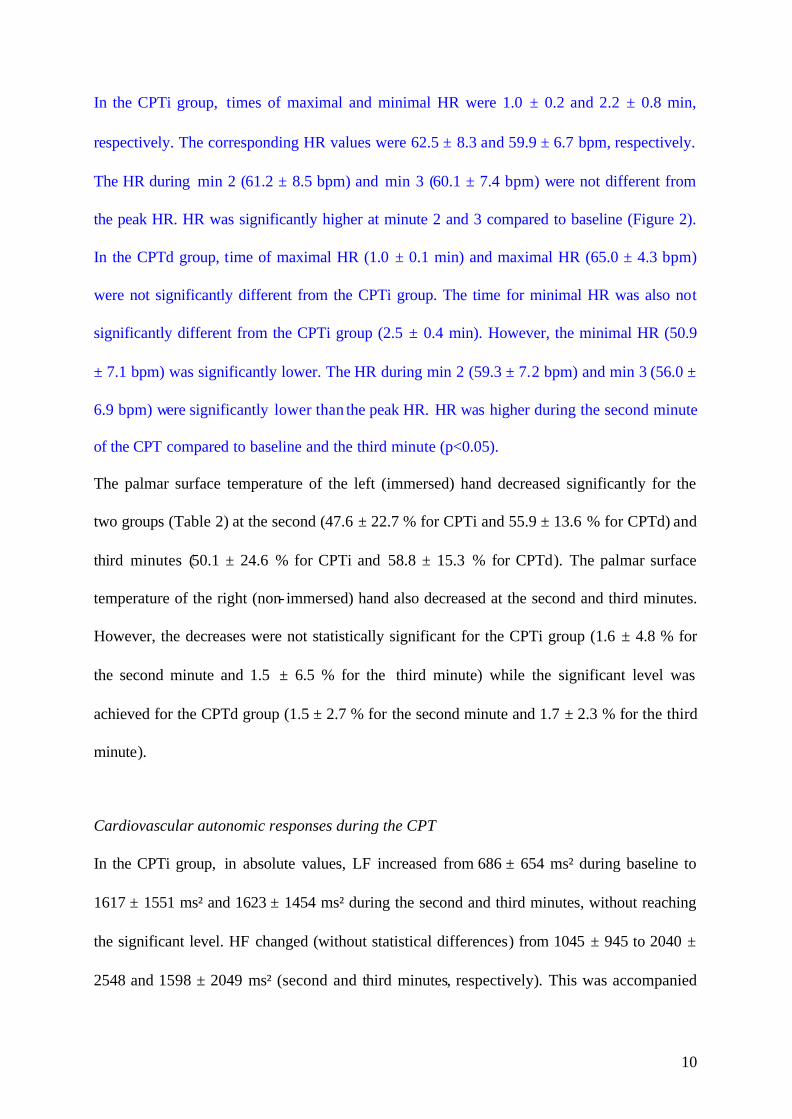
In the CPTi group, times of maximal and minimal HR were 1.0 ± 0.2 and 2.2 ± 0.8 min,
respectively. The corresponding HR values were 62.5 ± 8.3 and 59.9 ± 6.7 bpm, respectively.
The HR during min 2 (61.2 ± 8.5 bpm) and min 3 (60.1 ± 7.4 bpm) were not different from
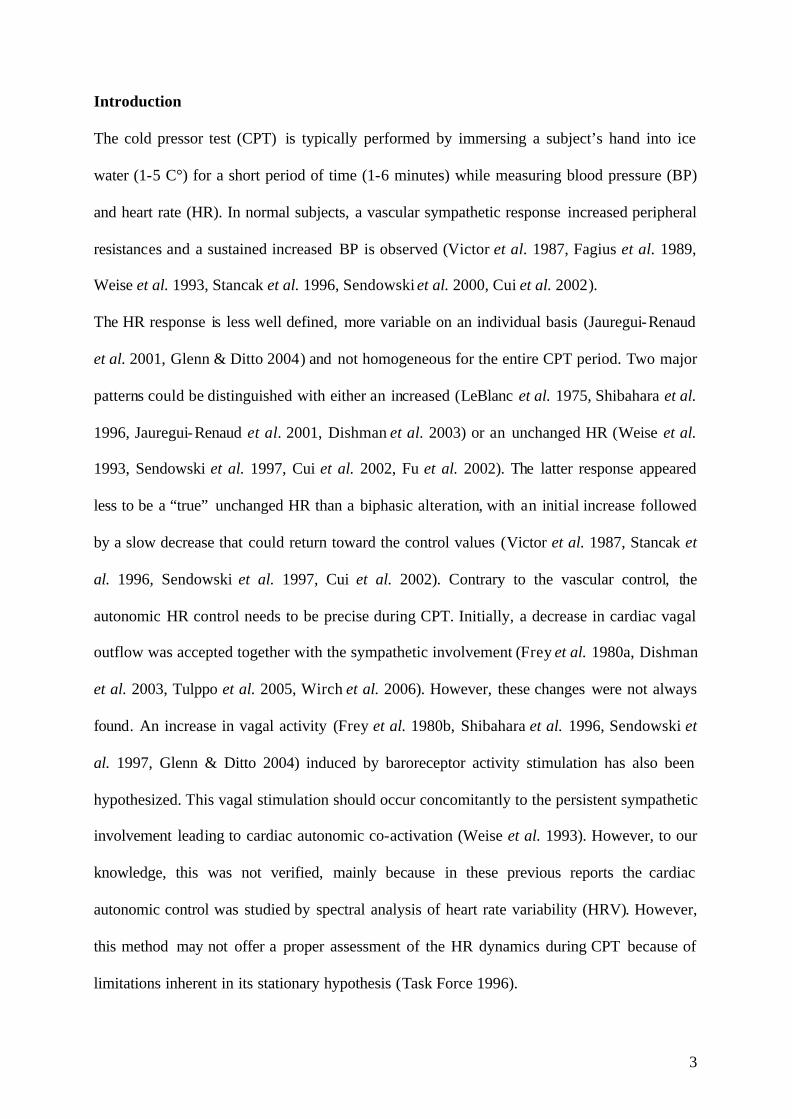
the peak HR. HR was significantly higher at minute 2 and 3 compared to baseline (Figure 2).
In the CPTd group, time of maximal HR (1.0 ± 0.1 min) and maximal HR (65.0 ± 4.3 bpm)
were not significantly different from the CPTi group. The time for minimal HR was also not
significantly different from the CPTi group (2.5 ± 0.4 min). However, the minimal HR (50.9
± 7.1 bpm) was significantly lower. The HR during min 2 (59.3 ± 7.2 bpm) and min 3 (56.0 ±
6.9 bpm) were significantly lower than the peak HR. HR was higher during the second minute
of the CPT compared to baseline and the third minute (p<0.05).
The palmar surface temperature of the left (immersed) hand decreased significantly for the
two groups (Table 2) at the second (47.6 ± 22.7 % for CPTi and 55.9 ± 13.6 % for CPTd) and
third minutes (50.1 ± 24.6 % for CPTi and 58.8 ± 15.3 % for CPTd). The palmar surface
temperature of the right (non- immersed) hand also decreased at the second and third minutes.
However, the decreases were not statistically significant for the CPTi group (1.6 ± 4.8 % for
the second minute and 1.5 ± 6.5 % for the third minute) while the significant level was
achieved for the CPTd group (1.5 ± 2.7 % for the second minute and 1.7 ± 2.3 % for the third
minute).
Cardiovascular autonomic responses during the CPT
In the CPTi group, in absolute values, LF increased from 686 ± 654 ms² during baseline to
1617 ± 1551 ms² and 1623 ± 1454 ms² during the second and third minutes, without reaching
the significant level. HF changed (without statistical differences) from 1045 ± 945 to 2040 ±
2548 and 1598 ± 2049 ms² (second and third minutes, respectively). This was accompanied

11
by a significant decrease in HFnu and by a significant increase in the LF/HF ratio and the
scaling exponent α1 (Figure 2). The slope of SBR changed from 25.1 ± 9.3 to 24.0 ± 13.5 and
28.9 ± 19.7 ms.mmHg-1 at the second and third minutes (no significant differences).
In the CPTd group, LF increased (no significant difference) from 701 ± 654 ms² during
baseline to 1155 ± 915 ms² and 1033 ± 792 ms² during the second and third minutes. HF
significantly increased from 720 ± 732 to 1530 ± 1441 and 1630 ± 2657 ms² at the second and
third minutes. This was accompanied by a trend for an increase in HFnu and for decrease in
the LF/HF ratio, but without reaching the significant level (Figure 2). Contrary to the changes
observer in the CPTi group, the scaling exponent α1 decreased significantly during minute 2
and further during minute 3 (Figure 2). The slope of SBR changed from 25.2 ± 5.8 to 23.1 ±
8.8 and 21.2 ± 11.9 ms.mmHg-1 at the second and third minutes (no significant differences).
Discussion
In healthy human subjects, CPT triggers an increase in BP (Victor et al. 1987, Fagius et al.
1989, Stancak et al. 1996, Jauregui-Renaud et al. 2001, Cui et al. 2002). This may be due to
an increased CO during the initial period of the test with little increase in muscle sympathetic
nerve activity, while an increase in this activity heightens peripheral resistances in the later
period (Victor et al. 1987, Yamamoto et al. 1992). PP also increases, mainly at the end of the
test (Stancak et al. 1996). The results of the present study are in accordance with these
observations, whatever the group concerned (Table 2).
The increased CO is mainly due to changes in HR since SV appears unaltered (Dishman et al.
2003). A maintained HR elevation was found throughout CPT compared to baseline (LeBlanc
et al. 1975, Shibahara et al. 1996, Jauregui-Renaud et al. 2001). However, a lot of studies also
reported a marked increase in HR followed by a slow decrease (Victor et al. 1987, Stancak et
12
al. 1996, Sendowski et al. 1997, Cui et al. 2002). This bi-phasic pattern was observed in
about half of the tested subjects in the present study. The decrease in HR is difficult to explain
since the CPT was initially thought to induce a general sympathetic activation with no change
or a decrease in vagal outflow (Frey et al. 1980a, Dishman et al. 2003, Tulppo et al. 2005,
Wirch et al. 2006). That was the aim of this study to precise the autonomic control of HR
during CPT.
Non-invasive evaluation of the autonomic control of heart rate in real- life conditions is
possible by means of HRV analysis (Task Force 1996). However, the results of studies using
this technique during CPT are inconsistent (Weise et al. 1993, Jauregui-Renaud et al. 2001,
Dishman et al. 2003, Glenn & Ditto 2004, Tulppo et al. 2005, Wirch et al. 2006). These
results, obtained at a group level, may be explained by the fact that both HR and the changes
in HRV indexes appeared highly variable on an individual basis (Jauregui-Renaud et al. 2001,
Glenn & Ditto 2004). The subjects of the present study were divided in two groups, according
to their HR responses to CPT. For both groups, maximal HR was observed at the beginning
the CPT test (Victor et al. 1987), while minimal HR was observed later, during the latest
minute. Thus, in the two groups the temporal HR changes during the test were roughly
identical. However, the magnitude of HR changes was different since after this initial increase
only minimal HR changes were observed in the CPTi group while HR progressively
decreased in the CPTd. In the CPTi group, the spectral analysis results indicated a persistent
decreased cardiac vagal outflow (HFnu) and increased sympathetic activity (LF/HF ratio). In
the CPTd group, the spectral analysis revealed opposite changes in cardiac autonomic
regulation. The changes in spectral analysis indexes likely correctly depicted the cardiac
autonomic control, because they were in accordance with the HR alteration. They also were in
accordance with previous studies with similar changes in HR.
13
A number of studies dealing with HRV have shown that R-R intervals exhibit patterns
suggestive of non- linear processes. Parameters arising from non- linear methods have
therefore been identified. The short-term scaling exponent (α1) of the detrended fluctuation
analysis (DFA), computed for small (four to 11 beats) time scales, is one such parameter
(Peng et al. 1995).
Tulppo and colleagues observed that α1 increased during CPT. In their study, HR, muscle
sympathetic nerve activity and LF/HF ratio increased while the HF index of HRV spectral
analysis decreased, suggesting a generalized cardiovascular sympathetic involvement (Tulppo
et al. 2005). Tulppo and colleagues suggested that when physiological changes in autonomic
regulation occurred with reciprocal interplay, the fractal correlation of HR dynamics
increased (Tulppo et al. 2001a, Tulppo et al. 2005). The results concerning the CTPi group
were in accordance with these results. On the other hand, α1 decreased when both the
sympathetic and vagal activity increased (Tulppo et al. 2005). Such a co-activation was
suspected but not verify during CPT (Weise et al. 1993). We observed tha t α1 decreased in
the CPTd group. In healthy subjects, the result of cardiac autonomic co-activation is a
decreased HR (Levy 1971, Tulppo et al. 2005), which is consistent with our results. The
enhancement of vagal outflow during CPT is likely a baroreflex correction to the sustained
blood pressure increase in the latter part of the CPT. Indeed, the CPT shifts the baroreflex
curve expressing the relationship between heart rate and systolic blood pressure to high blood
pressures but does not alter its sensitivity (Cui et al. 2002). The baroreflex is thus capable of
appropriately modulating HR during CPT.
It is unclear why subjects react to CPT with reciprocal changes in cardiac autonomic control
while other increased the activity of the two branch of the cardiac autonomic nervous system.
A distinct baseline autonomic nervous activity (e.g., enhanced sensitivity of the baroreflex,
higher vagal outflow) was suspected in the CPTd group. However, no statistical differences
14
were found in the baseline hemodynamic and autonomic characteristics (Table 1) and thus we
could not confirm our hypothesis. A significant decrease in the palmar surface temperature of
the non- immersed hand during the test was found only in the CPTd group. This suggests a
higher sympathetic tone to the skin in this group (Kistler et al. 1998). A different involvement
of the pain receptors could be argued since the sensation of pain has been suggested to play a
major role in HR regulation during CPT (Victor et al. 1987). However, this was not evaluated
in the present study.
Limitations
We did not impose the breathing pattern. The subjects spontaneously adapted their tidal
volume and breathing frequency but they were encouraged not changing the ir breathing
pattern. Despite reported controversial results, it has been shown that the amplitude of
respiratory-related heart rate oscillations increases at a given respiratory rate as the tidal
volume increases (Saul et al. 1989). During a cold pressor test, tidal volume and minute
ventilation usually increases (Wirch et al. 2006). In the present study, the respiratory-related
heart rate oscillations did not change (CPTd) or decreased during CPT, i.e. were opposite to
what would be expected from the changes observed in the ventilatory pattern (Saul et al.
1989), so the effect of ventilation was considered minimal. Nevertheless, we can not rule out
a potential flaw due to ventilation in our results.
Implications
CPT has been used for the diagnosis of cardiovascular reactivity in normotensive and
hypertensive subjects and the responses to CPT may help to identify normotensive candidates
at future risk of suffering from hypertensive disease. Most of the time, the pressor response is
based on the BP changes, with little or no attention on the HR alteration. In the present study,
15
the mean changes in BP were similar in the two groups. However, half of the subjects reacted
with sign of cardiac autonomic co-activation that decrease α1. Fractal organization is flexible,
and breakdown of this scale- invariance (self-similarity) may lead to a more rigid and less
adaptable system. A decrease in α1 has indeed been observed in various disease states or with
advancing age, and appeared as the most potent HRV indicator of a facilitated spontaneous
onset of fibrillation (Vikman et al. 1999). A breakdown in the short-term fractal organization
in human HR dynamics during CPT could have potential clinical implication, but this had to
be verified with further studies.
Conclusion
In the present study, we used both linear and non-linear method of heart rate variability
analysis to study the autonomic control of heart rate during the cold pressor test (CPT). It was
found that in half of the tested subjects, reciprocal changes in cardiac autonomic regulation
induced a sustained increased in HR. In the other subjects, CPT induced a decrease in HR
after an initial increase, likely due to the co-activation of vagal and sympathetic outflow at the
heart level which was highlighted by a change in HR dynamics from fractal toward more
random HR organization.

16
References
BAHJAOUI-BOUHADDI M, CAPPELLE S, HENRIET MT, DUMOULIN G, WOLF JP ,REGNARD J: Graded vascular autonomic control versus discontinuous cardiac control during gradual upright tilt. J Auton Nerv Syst 79: 149-155, 2000.
BOGERT LW ,VAN LIESHOUT JJ: Non- invasive pulsatile arterial pressure and stroke volume changes from the human finger. Exp Physiol 90: 437-446, 2005.
CUI J, WILSON TE ,CRANDALL CG: Baroreflex modulation of muscle sympathetic nerve activity during cold pressor test in humans. Am J Physiol Heart Circ Physiol 282: H1717-1723, 2002.
DISHMAN RK, NAKAMURA Y, JACKSON EM ,RAY CA: Blood pressure and muscle sympathetic nerve activity during cold pressor stress: fitness and gender. Psychophysiology 40: 370-380, 2003.
FAGIUS J, KARHUVAARA S ,SUNDLOF G: The cold pressor test: effects on sympathetic nerve activity in human muscle and skin nerve fascicles. Acta Physiol Scand 137: 325-334, 1989.
FREY MA, SELM EA ,WALTHER JW, JR.: Reflex cardiovascular responses to cold exposure of the face or foot. Jpn Heart J 21: 665-679, 1980a.
FREY MA, SIERVOGEL RM, SELM EA ,KEZDI P: Cardiovascular response to cooling of limbs determined by noninvasive methods. Eur J Appl Physiol Occup Physiol 44: 67-75, 1980b.
FU Q, LEVINE BD, PAWELCZYK JA, ERTL AC, DIEDRICH A, COX JF, ZUCKERMAN JH, RAY CA, SMITH ML, IWASE S, SAITO M, SUGIYAMA Y, MANO T, ZHANG R, IWASAKI K, LANE LD, BUCKEY JC, JR., COOKE WH, ROBERTSON RM, BAISCH FJ, BLOMQVIST CG, ECKBERG DL, ROBERTSON D ,BIAGGIONI I: Cardiovascular and sympathetic neural responses to handgrip and cold pressor stimuli in humans before, during and after spaceflight. J Physiol 544: 653-664, 2002.
GLENN D ,DITTO B: Vagal tone biofeedback: respiratory and non-respiratory mediated modulations of vagal tone challenged by cold pressor test. MacGill J Medicine 7, 2004.
HILZ MJ, AXELROD FB, BRAESKE K ,STEMPER B: Cold pressor test demonstrates residual sympathetic cardiovascular activation in familial dysautonomia. Journal of the Neurological Sciences 196: 81-89, 2002.
JAUREGUI-RENAUD K, HERMOSILLO AG, MARQUEZ MF, RAMOS-AGUILAR F, HERNANDEZ-GORIBAR M ,CARDENAS M: Repeatability of heart rate variability during simple cardiovascular reflex tests on healthy subjects. Arch Med Res 32: 21-26, 2001.
KISTLER A, MARIAUZOULS C ,VON BERLEPSCH K: Fingertip temperature as an indicator for sympathetic responses. Int J Psychophysiol 29: 35-41, 1998.
LEBLANC J, DULAC S, COTE J ,GIRARD B: Autonomic nervous system and adaptation to cold in man. J Appl Physiol 39: 181-186, 1975.
LEVY MN: Sympathetic-parasympathetic interactions in the heart. Circ Res 29: 437-445, 1971.
PARATI G, CASADEI R, GROPPELLI A, DI RIENZO M ,MANCIA G: Comparison of finger and intra-arterial blood pressure monitoring at rest and during laboratory testing. Hypertension 13: 647-655, 1989.
17
PENG CK, HAVLIN S, STANLEY HE ,GOLDBERGER AL: Quantification of scaling exponents and crossover phenomena in nonstationary heartbeat time series. Chaos 5: 82-87, 1995.
SAUL JP, BERGER RD, CHEN MH ,COHEN RJ: Transfer function analysis of autonomic regulation. II. Respiratory sinus arrhythmia. Am J Physiol 256: H153-161, 1989.
SENDOWSKI I, SAVOUREY G, BESNARD Y ,BITTEL J: Cold induced vasodilatation and cardiovascular responses in humans during cold water immersion of various upper limb areas. Eur J Appl Physiol Occup Physiol 75: 471-477, 1997.
SENDOWSKI I, SAVOUREY G, LAUNAY JC, BESNARD Y, COTTET-EMARD JM, PEQUIGNOT JM ,BITTEL J: Sympathetic stimulation induced by hand cooling alters cold-induced vasodilatation in humans. Eur J Appl Physiol 81: 303-309, 2000.
SHIBAHARA N, MATSUDA H, UMENO K, SHIMADA Y, ITOH T ,TERASAWA K: The responses of skin blood flow, mean arterial pressure and R-R interval induced by cold stimulation with cold wind and ice water. J Auton Nerv Syst 61: 109-115, 1996.
STANCAK A, JR., YAMAMOTOVA A, KULLS IP ,SEKYRA IV: Cardiovascular adjustments and pain during repeated cold pressor test. Clin Auton Res 6: 83-89, 1996.
Task Force of the European Society of Cardiology and the North American Society of Pacing and Electrophysiology. Heart rate variability: standards of measurement, physiological interpretation and clinical use. Circulation 93: 1043-1065, 1996.
TULPPO MP, HUGHSON RL, MAKIKALLIO TH, AIRAKSINEN KE, SEPPANEN T ,HUIKURI HV: Effects of exercise and passive head-up tilt on fractal and complexity properties of heart rate dynamics. Am J Physiol Heart Circ Physiol 280: H1081-1087, 2001a.
TULPPO MP, KIVINIEMI AM, HAUTALA AJ, KALLIO M, SEPPANEN T, MAKIKALLIO TH ,HUIKURI HV: Physiological background of the loss of fractal heart rate dynamics. Circulation 112: 314-319, 2005.
TULPPO MP, MAKIKALLIO TH, SEPPANEN T, SHOEMAKER K, TUTUNGI E, HUGHSON RL ,HUIKURI HV: Effects of pharmacological adrenergic and vagal modulation on fractal heart rate dynamics. Clin Physiol 21: 515-523, 2001b.
VICTOR RG, LEIMBACH WN, JR., SEALS DR, WALLIN BG ,MARK AL: Effects of the cold pressor test on muscle sympathetic nerve activity in humans. Hypertension 9: 429-436, 1987.
VIKMAN S, MAKIKALLIO TH, YLI-MAYRY S, PIKKUJAMSA S, KOIVISTO AM, REINIKAINEN P, AIRAKSINEN KE ,HUIKURI HV: Altered complexity and correlation properties of R-R interval dynamics before the spontaneous onset of paroxysmal atrial fibrillation. Circulation 100: 2079-2084, 1999.
WEISE F, LAUDE D, GIRARD A, ZITOUN P, SICHE JP ,ELGHOZI JL: Effects of the cold pressor test on short-term fluctuations of finger arterial blood pressure and heart rate in normal subjects. Clin Auton Res 3: 303-310, 1993.
WIRCH JL, WOLFE LA, WEISSGERBER TL ,DAVIES GA: Cold pressor test protocol to evaluate cardiac autonomic function. Appl Physiol Nutr Metab 31: 235-243, 2006.
YAMAMOTO K, IWASE S ,MANO T: Responses of muscle sympathetic nerve activity and cardiac output to the cold pressor test. Jpn J Physiol 42: 239-252, 1992.
YAMAMOTO Y ,HUGHSON RL: Coarse-graining spectral analysis: new method for studying heart rate variability. J Appl Physiol 71: 1143-1150, 1991.

18
Acknowledgments
The authors wish to thank the subjects for their time and cooperation.
This work was funded by grants from the French Ministry of National Education, of Research
and of Technology (UPRES EA3920).
19
Figures and Legends
Figure 1. Changes in blood pressure and heart rate in a representative subject of the CPTi (A)
and CPTd (B) groups.
Figure 2. Changes in heart rate (HR), in normalized high frequency (HFnu) and low- to high
frequency ratio (LF/HF) of heart rate variability and in short-term fractal scaling exponent
(α1), measured at baseline and during the second and third minute of cold hand immersion in
the group with increased (CPTi) or decreased (CPTd) HR response to the cold pressor test
(CPT).
20
Figure 1.

21
Figure 2.

22
Table 1. Anthropometric and baseline hemodynamic and autonomic status of the subjects.
CPTi CPTd
n = 20 19
Age years 23.0 ± 3.4 24.4 ± 3.0
Height cm 179.9 ± 4.6 180.9 ± 4.9 Anthropometric data
Weight kg 73.3 ± 7.7 73.3 ± 4.9
HR bpm 53.3 ± 6.9 54.2 ± 7.2
SBP mmHg 126.1 ± 10.2 126.5 ± 7.2
DBP mmHg 70.3 ± 5.5 70.2 ± 5.3
PP mmHg 55.8 ± 8.9 56.3 ± 6.8
SV mL 101.1 ± 13.9 99.6 ± 11.9
CO L.min-1 5.4 ± 0.9 5.4 ± 1.1
Hemodynamic data
TPR (PRU) 1.02 ± 0.23 1.03 ± 0.18
Total Power ms² 5027 ± 3902 4450 ± 3968
LF ms² 479 ± 547 407 ± 459
HF ms² 515 ± 552 677 ± 1302
HFnu n.u. 0.11 ± 0.10 0.13 ± 0.12
Linear HRV analysis
LF/HF 3.28 ± 5.93 2.48 ± 4.30
Total Power ms² 24.4 ± 19.6 20.0 ± 18.3
LF ms² 2.9 ± 1.8 2.6 ± 2.5 Linear BPV analysis
LFnu ms² 15.8 ± 18.9 19.0 ± 42.0
Baroreflex sensitivity ms.mmHg -1 24.6 ± 10.3 29.0 ± 9.8
Non linear HRV analysis α1 0.68 ± 0.21 0.73 ± 0.18
CPTi and CPTd = group of subjects with secondary increased or decreased heart rate after the
initial increased during the cold pressor test. HR = heart rate; SBP and DBP = systolic and
diastolic blood pressure; PP pulse pressure; SV = stoke volume; CO = cardiac output; TPR =

23
total peripheral resistances. LF = low frequency; HF = high frequency; nu = normalized units;
α1 = short-term fractal exponent.

24
Table 2. Hemodynamic changes during the cold pressor test.
One minute Baseline Second minute Third minute
SBP mmHg 125.8 ± 10.3 143.9 ± 20.6 * 145.0 ± 22.8 *
DBP mmHg 70.1 ± 5.5 84.0 ± 11.3 * 83.5 ± 11.9 *
PP mmHg 55.7 ± 9.3 59.9 ± 14.2 61.4 ± 14.7 *
SV mL 101.4 ± 13.8 94.4 ± 19.3 97.6 ± 15.6 *§
CO L.min-1 5.4 ± 0.9 5.7 ± 1.4 5.6 ± 1.0
TPR (PRU) 1.02 ± 0.21 1.18 ± 0.34 * 1.18 ± 0.29 *
T° left hand °C 33.0 ± 1.4 17.0 ± 7.2 * 16.2 ± 7.9 *
CPTi
n = 20
T° right hand °C 32.0 ± 1.1 31.5 ± 2.1 31.3 ± 2.4
Baseline Second minute Third minute
SBP mmHg 126.5 ± 7.5 140.9 ± 15.0 * 141.9 ± 13.7 *
DBP mmHg 71.6 ± 5.3 84.4 ± 6.3 * 82.0 ± 7.3 *
PP mmHg 54.9 ± 6.7 56.5 ± 11.4 59.9 ± 9.8 *§
SV mL 99.7 ± 10.9 93.7 ± 16.8 99.4 ± 14.7
CO L.min-1 5.5 ± 1.1 5.5 ± 1.0 5.5 ± 0.9
TPR (PRU) 1.03 ± 0.20 1.20 ± 0.20 * 1.19 ± 0.27 *
T° left hand °C 32.3 ± 1.2 14.3 ± 4.6 * 13.4 ± 5.1 *
CPTd
n = 19
T° right hand °C 31.7 ± 1.1 31.2 ± 1.3 * 31.1 ± 1.3 *
CPTi and CPTd = group of subjects with secondary increased or decreased heart rate after the
initial increased during the cold pressor test. SBP and DBP = systolic and diastolic blood
pressure; PP pulse pressure; SV = stoke volume; CO = cardiac output; TPR = total peripheral
resistances
* significantly different from baseline; § significantly from the second minute of the cold
pressor test at p< 0.05.