Embed Size (px)
Citation preview
Chinese Librarianship: an International Electronic Journal, 32. URL: http://www.iclc.us/cliej/cl32SM.pdf
1
Availability of Needed Information to Educational Administrators in
Pakistan: A Survey
Farzana Shafique
The Islamia University of Bahawalpur
PAKISTAN
Khalid Mahmood
University of the Punjab, Lahore
PAKISTAN
ABSTRACT: This study aimed at exploring the status of needed information and its
availability to educational administrators in Pakistan. To achieve these objectives,
literature reviews and a questionnaire survey were conducted. For this survey, the
educational administrators (i.e., principals of schools and colleges and
Registrars/Deans/Chairpersons in universities) were identified as the target
population and were selected through cluster sampling. The respondents were from
the Punjab Province and Islamabad Capital Territory (ICT). In total, 297 (99%)
responses were received and analyzed quantitatively. Recommendations and
conclusions were drawn in the light of the findings of this study. The study is the
first one of its type that attempted to probe the status of needed information and its
availability to educational administrators and planners in Pakistan. The findings of
the study can be useful to design information services and facilities for educational
administrators not only in Pakistan but also in other countries of the world with
similar conditions.
I. Introduction
Our society is undergoing profound and rapid changes as a result of the development of
information superhighways. These changes are evident in the economic, social, cultural and
political aspects of our society. The digital revolution in information and communication
technologies (ICT) has created the platform for a free flow of information, ideas and knowledge
Chinese Librarianship: an International Electronic Journal, 32. URL: http://www.iclc.us/cliej/cl32SM.pdf
2
across the globe. This revolution has made a profound impact on the way the world functions
and has transformed it to an evolving information society.
The concept of “education” is also changing from the formal and pre-defined curriculum in the
industrial society to the life-long learning in today‟s information society. Life-long learning
certainly reflects a new comprehension of the need for education in society. The "redefinition"
seems to be the conceptual answer to the increasingly complex needs and possibilities for
development and learning in the information society (Danish Technological Institute, 2003).
World Education Forum (2000) reaffirms education as the key to sustainable development, peace
and stability within and among countries, thus an indispensable means for effective participation
in the societies and economies of the twenty-first century, which are affected by rapid
globalization.
The role of educational administrators is very important in this information society. They provide
instrumental leadership and manage the day-to-day activities in schools, preschools, day care
centers, colleges, and universities. They set educational standards and goals and establish the
policies and procedures to achieve them. They also supervise managers, support staff, teachers,
counselors, librarians, coaches, and other employees. They develop academic programs, monitor
students‟ educational progress, train and motivate teachers and other staff, manage career
counseling and other student services, administer record-keeping, prepare budgets, and perform
many other duties. They also handle relations with parents, prospective and current students,
employers, and the community. In an organization, one administrator may handle all these
functions. In universities or large school systems, responsibilities are divided among many
administrators, each with a specific function (US, Bureau of Labor Statistics, 2008).
Information needs of educational administrators are different according to the level at which
information users are operating (national or regional) and the type of decisions they make
(planning and strategic, management and supervision, operational, recipients of programs etc.),
macro level (policy, planning, strategy development), intermediate level (management and
control), and micro level (operations and recipients of programs) (UNESCO, 2006). Thus, the
Chinese Librarianship: an International Electronic Journal, 32. URL: http://www.iclc.us/cliej/cl32SM.pdf
3
educational administrators can be divided in three broader categories regarding their information
needs and managerial responsibilities. These levels are as followed:
a. Macro Level: administrators at this level are responsible for strategic decisions concerning the
planning of the whole of the education system. The category of decisions at this level concerns
the general policy and attainable medium- or long-term objectives. More aggregated information
is required for setting the objectives on the national, regional or provincial level (Carrizo,
Sauvageot & Bella, 2003).
b. Intermediate Level: this level comprises decision-makers who are in charge of management
and control of the allocation of resources for an efficient and equitable distribution. This level
translates the general objectives into more technical and operational decisions. It, therefore,
requires more specific data to detect eventual malfunctions and to optimize the use of resources
(Carrizo, Sauvageot & Bella, 2003). The actual project/course manager requires more detailed
information on inputs, process and outputs of programs, detailed budgetary information, and
impact of the programs, etc. Educators would also require information on educational and
pedagogical issues (UNESCO, 2006).
c. Micro Level: corresponds to operational tasks, and to more daily activities, closer to the
institution (i.e. school, college or university department). The decision here has local and
immediate reach and hence will require more detailed information.
Thus, these three decision-making levels, which sometimes overlap each other at the
administrative levels, require distinct information. They are, however, linked because decisions
at the macro level would be relevant and efficient in as much as they are based on precise and
reliable information gathered from the lower levels. The information system should necessarily
integrate these complex relations between the different levels of decision-making to fulfill its
role efficiently (Carrizo, Sauvageot & Bella, 2003).
Chinese Librarianship: an International Electronic Journal, 32. URL: http://www.iclc.us/cliej/cl32SM.pdf
4
1. Uncovering Information Needs of Educational Administrators
Organizations, more than ever, are concerned about the successful planning and design of
computer-based information systems. The concern begins with the correct determination of the
critical information needs of top management and other members, and extends to the methods
and techniques that will transform these information needs into information systems.
Administrators are a distinct group of information users, whose information needs and
preferences are largely conditioned by the demands and context of their work. Their work is
open-ended because they have to tackle with a wide range of issues, but also in the sense that
many of the problems have no apparent closure in the short-term, their resolution having to
unfold over time (Auster & Choo, 1996).
At a planning forum, a few thoughtful policymakers and educational administrators stressed on
the need of research on issues related to the inputs and outcomes of education, the structure and
process of education, the core of teaching and learning, and the broader context in which
education operates. They believed that in order to be effective, research on governance, finance,
policymaking, and management must address the issues and questions that decision makers
really care about (US, Department of Education, n.d.).
McCracken and Gillespie (n.d.) have pointed out that research findings often fail to reach key
decision makers either in the proper form or in time to assist in decision making. Also little is
known about major problems, for which educational administrators need information, methods
of seeking information used by these decision makers, information normally used, or the criteria
employed in selecting information.
Keeping this reality in view, many studies were reviewed by the researchers to determine the
pattern of information needs of educational administrators. The general studies related to the
administrators/managers/executives helped the researchers in understanding the nature of their
responsibilities for which they need information whereas specific studies related to educational
administrators helped in understanding the different aspects of educational administrators‟
Chinese Librarianship: an International Electronic Journal, 32. URL: http://www.iclc.us/cliej/cl32SM.pdf
5
information needs. Consequently, these studies helped in determining the important variables for
questionnaire survey, designed for finding educational administrators‟ information needs for the
study underway. Management information is data converted to information, which allows
managers at all levels in all functions to make timely and effective decisions for planning,
directing, and controlling the activities for which they are responsible (Lucey, 1995).
S. M. de-Alwis and Higgins (2001) have reported the results of a study, which indicate that the
types of information considered very important for decision making include competitor trends,
followed by regional economic trends and that types of information considered important
include business news, followed by political, social, and supplier trends, regulatory information,
use of information technology, demographic trends, and new management methods. Sources
given a very high preference rating were personal contact for competitor trends and the use of
government publications for obtaining regulatory information. Respondents also preferred the
use of government publications for local economic information and the use of newspapers for
political trends and business news. According to the research findings reported by McCracken
and Gillespie (n.d.), local educational administrators generally perceived little need for
information in problem resolution. Most decision making was in the absence of an information
search.
2. Research on Information Needs of Educational Administrators in Pakistan
The role of information in decision making, administration and policy formulation or in national
and educational development is not fully appreciated in the developing world. It, therefore, plays
a minor role in the general flow of communication.
As it is evident from the above reviewed literature that many user groups are studied by the
researchers in the developed world but the situation in Pakistan is not hopeful. According to
Anwar (2007), very little interest has been shown for information needs‟ research in Pakistan by
both the academics and the practitioners. No study can be traced in the past, which tried to
explore the information needs and/or seeking behavior of educational administrators. In the field
Chinese Librarianship: an International Electronic Journal, 32. URL: http://www.iclc.us/cliej/cl32SM.pdf
6
of education, very few studies were conducted to assess the needs of educationists either for staff
development or for analyzing their training needs.
For example, Gul (2005) has assessed the needs of educational administrators at college level in
Punjab for designing a training model for the professional development of educational
administrators/principals. The study consisted of the following stages: (a) assessment of training
needs and problems of educational administrators; (b) designing a training model on the basis of
findings and literature; and; (c) validation of training model by Delphi Technique. The principal
researcher recently supervised two MLIS research theses at the Islamia University of
Bahawalpur. These two studies aimed at finding the information needs and seeking behavior of
college and school teachers as well as administrators within the city of Bahawalpur. Both the
studies highlighted the problem of scattered information and non-availability of a uniform
source/system of educational information (Khan, 2008; Iqbal, 2008).
II. Research Statement
It is a fact that educational administrators are the key planners of educational enterprise of a
country. Their role can be more effective if they are well-informed about the domain of their
work and if needed information is readily available to them. Developed countries have fully
realized this and have developed user-centered information centers, systems, and services after
closely studying the information needs and seeking behavior of educational administrators.
In Pakistan, however, no such efforts are made by the government authorities, academicians or
practitioners to study the information needs and seeking behavior of educational administrators
with a view to assisting in designing the user-centered services and systems. As a result,
educational administers often complain for the non-availability of needed and reliable
information.
The issues addressed in this study will hopefully lead the researchers to identify the state of
needed information and its availability to educational administrators in Pakistan.
Chinese Librarianship: an International Electronic Journal, 32. URL: http://www.iclc.us/cliej/cl32SM.pdf
7
III. Objectives of the Study
The objectives of the study are as follows:
To identify the degree of information needs and its availability to school, college and
university administrators in Punjab province and ICT.
To discover the administrative task for which they usually need information.
To furnish the recommendations based on the findings.
IV. Research Methodology
The current study is descriptive in nature and based on literature review, survey, and personal
visits. Detailed description of the research methodology is as follows:
1. The Survey
Keeping in view the objectives of the study, the educational administrators (i.e.,
registrar/deans/department heads in universities and principals of schools and colleges) were
identified as the target population for a survey in the form of a questionnaire. The respondents
were from the Punjab province and Islamabad Capital Territory (ICT). The choice of the Punjab
for the questionnaire survey is based on three main grounds: (1) The researchers are based in
Punjab and logistic support for the fieldwork was most conveniently available in this region; (2)
Circumstances in Baluchistan and NWFP provinces were not in favor of a field survey; (3) The
population of the province was estimated 86,084,000 in 2005 and is home to over half of the
population of Pakistan. About 50% of the educational institutes are situated within Punjab
province and ICT. Of the 71 public universities of Pakistan, 35 are in Punjab and ICT. Of the
227,791 public and private educational institutes, 110, 648 are in Punjab Province and ICT.
2. Sampling Procedure and Frame for Survey
Cluster sampling was used for the survey. It is a sampling technique used when "natural"
groupings are evident in a statistical population. With this technique, the total population is
divided into groups or clusters and a sample of the groups is selected. Then the required
information is collected from the elements within each selected group.
Chinese Librarianship: an International Electronic Journal, 32. URL: http://www.iclc.us/cliej/cl32SM.pdf
8
One version of the cluster sampling is area sampling or geographical cluster sampling. Because a
geographically dispersed population can be expensive to survey, greater economy than simple
random sampling can be achieved by treating several respondents within a local area as a cluster.
Cluster sampling is useful when it would be impossible or impractical to identify every person in
the sample (Wikipedia, 2009).
For the sampling purpose the Punjab province and ICT were divided into clusters and sub-
clusters and each district was designated as a primary cluster. Responses were attempted from
each district. Then, each district was divided into sub-clusters (i.e. Tehsils). Sub-clusters were
randomly selected. Elements (i.e. schools and colleges) were selected according to a defined
criterion. To get a reasonable response, 300 responses (in total) were targeted from the three
groups of respondents (i.e., schools, colleges, and universities).
This sampling technique was employed based on following grounds:
a) The available lists of schools and colleges, especially in the remote and far-flung areas, were
declared less reliable by the competent authorities (EDO & DEOs, etc.). This fact can also be
traced from the literature. According to Belt (September, 2007), “It‟s not unusual in Pakistan
to hear of public schools that receive no books, no supplies, and no subsidies from the
government. Thousands more are 'ghost schools' that exist only on paper, to line the pockets
of phantom teachers and administrators.” So, the researchers redesigned the sampling
procedure and switched from the simple random sampling to the handpicked sampling of the
elements from randomly selected sub clusters. On the other hand, all the public universities
were selected within Punjab province and ICT.
b) The targeted population are busy people and difficult to consult in large number without any
personal reference.
c) Schools and colleges were selected on the basis of their year of establishment. Oldest schools
and colleges from each district were selected purposively to reduce the chance of selecting
the ghost institutes (i.e. fake institutes which exist only in lists, not in reality or where no
proper staff and building is available) from the lists at random.
Chinese Librarianship: an International Electronic Journal, 32. URL: http://www.iclc.us/cliej/cl32SM.pdf
9
d) To reduce the sampling bias due to handpicked sampling, all the districts of Punjab province
were selected for the study and tehsils were further selected randomly.
V. Data Analysis and Discussion
The quantitative data were analyzed with the help of SPSS (version-15). This section presents
the analysis of responses.
1. Respondents’ Personal Profile
The respondents were asked different questions related to their particulars, such as gender, age,
academic qualification, professional experience, publications, etc.
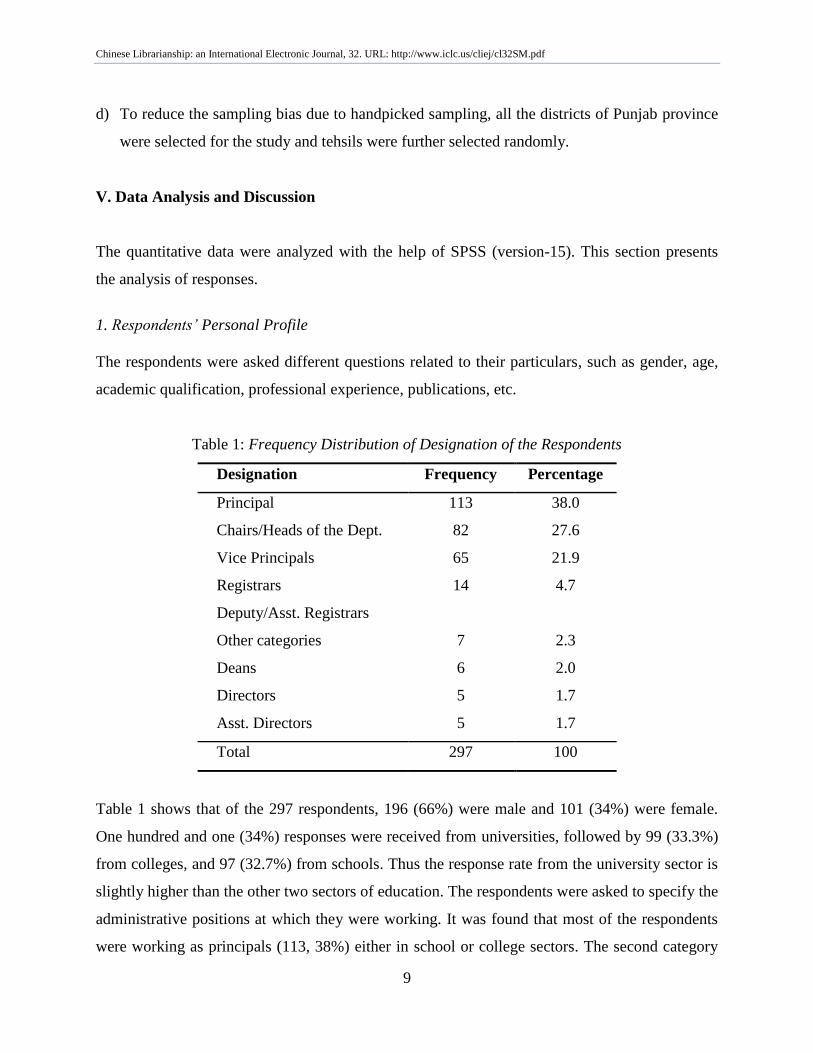
Table 1: Frequency Distribution of Designation of the Respondents
Designation Frequency Percentage
Principal 113 38.0
Chairs/Heads of the Dept. 82 27.6
Vice Principals 65 21.9
Registrars
Deputy/Asst. Registrars
14 4.7
Other categories 7 2.3
Deans 6 2.0
Directors 5 1.7
Asst. Directors 5 1.7
Total 297 100
Table 1 shows that of the 297 respondents, 196 (66%) were male and 101 (34%) were female.
One hundred and one (34%) responses were received from universities, followed by 99 (33.3%)
from colleges, and 97 (32.7%) from schools. Thus the response rate from the university sector is
slightly higher than the other two sectors of education. The respondents were asked to specify the
administrative positions at which they were working. It was found that most of the respondents
were working as principals (113, 38%) either in school or college sectors. The second category
Chinese Librarianship: an International Electronic Journal, 32. URL: http://www.iclc.us/cliej/cl32SM.pdf
10
of high response was of chairs/heads of the departments in higher education institutes (82,
27.6%). The third category was of school and college vice principals (65, 21.9%). Other
categories include registrars, deputy/assistant registrars (14, 4.7%), administrative officers (7,
2.3%), directors, assistant directors, and deans (5, 1.8%).
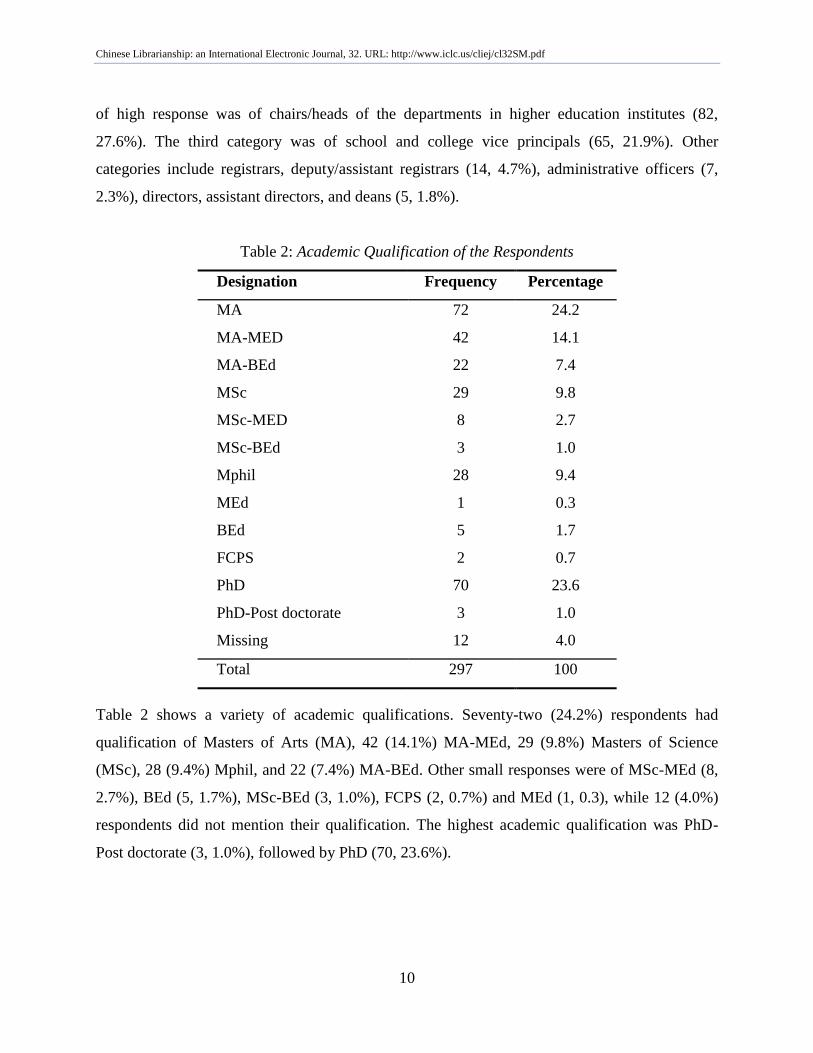
Table 2: Academic Qualification of the Respondents
Designation Frequency Percentage
MA 72 24.2
MA-MED 42 14.1
MA-BEd 22 7.4
MSc 29 9.8
MSc-MED 8 2.7
MSc-BEd 3 1.0
Mphil 28 9.4
MEd 1 0.3
BEd 5 1.7
FCPS 2 0.7
PhD 70 23.6
PhD-Post doctorate 3 1.0
Missing 12 4.0
Total 297 100
Table 2 shows a variety of academic qualifications. Seventy-two (24.2%) respondents had
qualification of Masters of Arts (MA), 42 (14.1%) MA-MEd, 29 (9.8%) Masters of Science
(MSc), 28 (9.4%) Mphil, and 22 (7.4%) MA-BEd. Other small responses were of MSc-MEd (8,
2.7%), BEd (5, 1.7%), MSc-BEd (3, 1.0%), FCPS (2, 0.7%) and MEd (1, 0.3), while 12 (4.0%)
respondents did not mention their qualification. The highest academic qualification was PhD-
Post doctorate (3, 1.0%), followed by PhD (70, 23.6%).
Chinese Librarianship: an International Electronic Journal, 32. URL: http://www.iclc.us/cliej/cl32SM.pdf
11
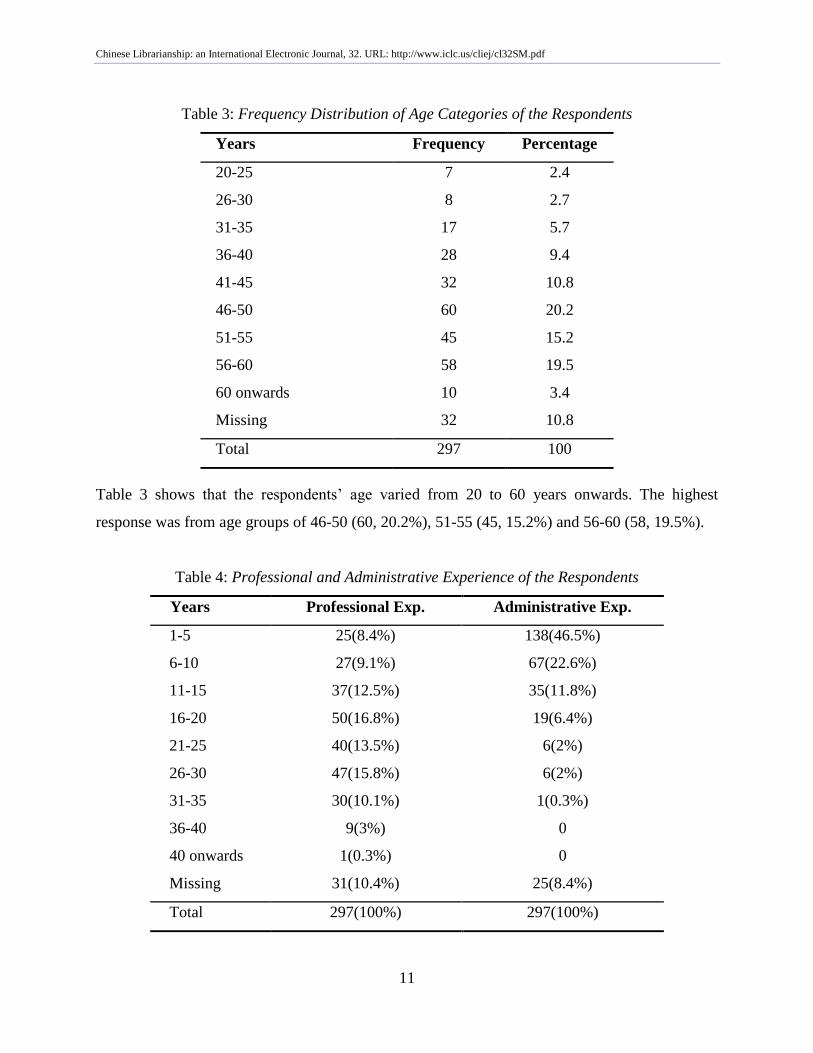
Table 3: Frequency Distribution of Age Categories of the Respondents
Years Frequency Percentage
20-25 7 2.4
26-30 8 2.7
31-35 17 5.7
36-40 28 9.4
41-45 32 10.8
46-50 60 20.2
51-55 45 15.2
56-60 58 19.5
60 onwards 10 3.4
Missing 32 10.8
Total 297 100
Table 3 shows that the respondents‟ age varied from 20 to 60 years onwards. The highest
response was from age groups of 46-50 (60, 20.2%), 51-55 (45, 15.2%) and 56-60 (58, 19.5%).
Table 4: Professional and Administrative Experience of the Respondents
Years Professional Exp. Administrative Exp.
1-5 25(8.4%) 138(46.5%)
6-10 27(9.1%) 67(22.6%)
11-15 37(12.5%) 35(11.8%)
16-20 50(16.8%) 19(6.4%)
21-25 40(13.5%) 6(2%)
26-30 47(15.8%) 6(2%)
31-35 30(10.1%) 1(0.3%)
36-40 9(3%) 0
40 onwards 1(0.3%) 0
Missing 31(10.4%) 25(8.4%)
Total 297(100%) 297(100%)
Chinese Librarianship: an International Electronic Journal, 32. URL: http://www.iclc.us/cliej/cl32SM.pdf
12
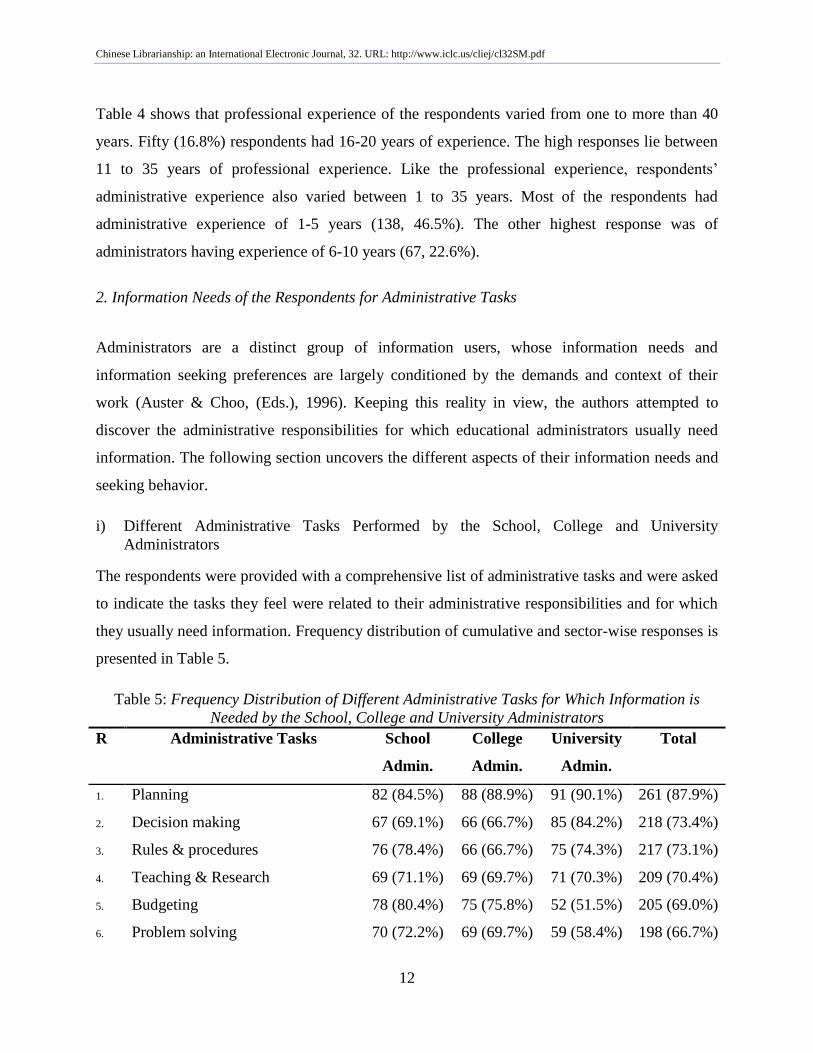
Table 4 shows that professional experience of the respondents varied from one to more than 40
years. Fifty (16.8%) respondents had 16-20 years of experience. The high responses lie between
11 to 35 years of professional experience. Like the professional experience, respondents‟
administrative experience also varied between 1 to 35 years. Most of the respondents had
administrative experience of 1-5 years (138, 46.5%). The other highest response was of
administrators having experience of 6-10 years (67, 22.6%).
2. Information Needs of the Respondents for Administrative Tasks
Administrators are a distinct group of information users, whose information needs and
information seeking preferences are largely conditioned by the demands and context of their
work (Auster & Choo, (Eds.), 1996). Keeping this reality in view, the authors attempted to
discover the administrative responsibilities for which educational administrators usually need
information. The following section uncovers the different aspects of their information needs and
seeking behavior.
i) Different Administrative Tasks Performed by the School, College and University
Administrators
The respondents were provided with a comprehensive list of administrative tasks and were asked
to indicate the tasks they feel were related to their administrative responsibilities and for which
they usually need information. Frequency distribution of cumulative and sector-wise responses is
presented in Table 5.
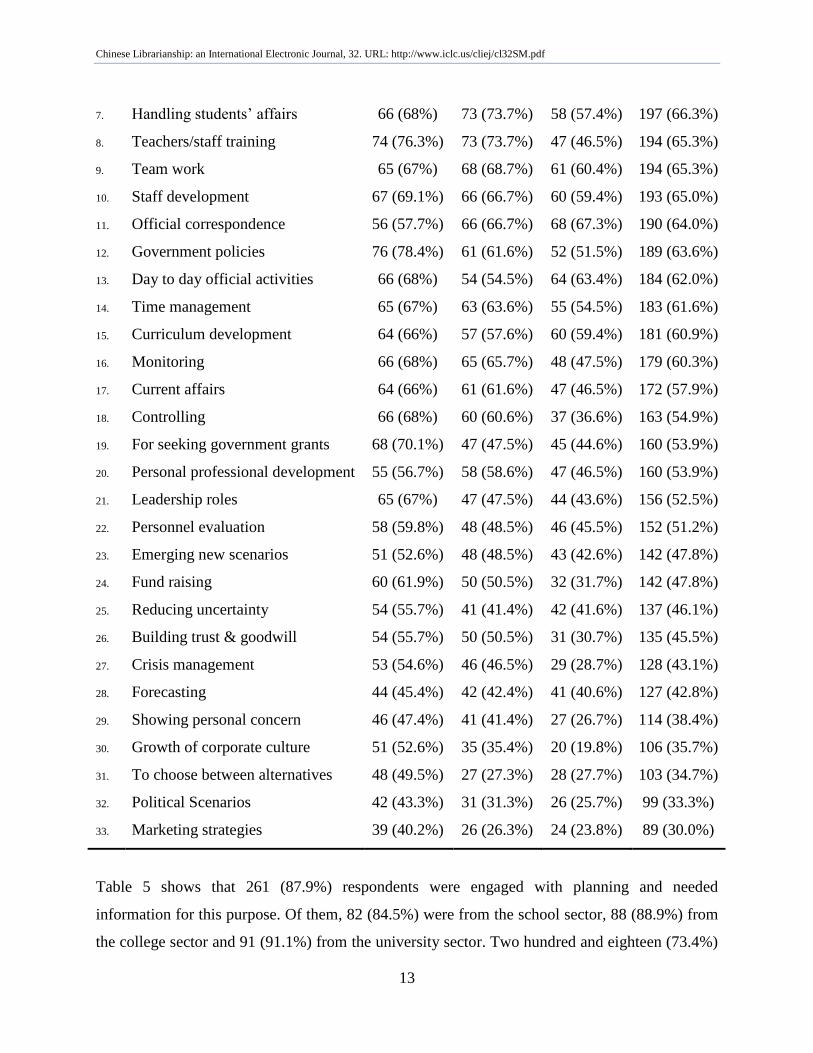
Table 5: Frequency Distribution of Different Administrative Tasks for Which Information is
Needed by the School, College and University Administrators
R Administrative Tasks School
Admin.
College
Admin.
University
Admin.
Total
1. Planning 82 (84.5%) 88 (88.9%) 91 (90.1%) 261 (87.9%)
2. Decision making 67 (69.1%) 66 (66.7%) 85 (84.2%) 218 (73.4%)
3. Rules & procedures 76 (78.4%) 66 (66.7%) 75 (74.3%) 217 (73.1%)
4. Teaching & Research 69 (71.1%) 69 (69.7%) 71 (70.3%) 209 (70.4%)
5. Budgeting 78 (80.4%) 75 (75.8%) 52 (51.5%) 205 (69.0%)
6. Problem solving 70 (72.2%) 69 (69.7%) 59 (58.4%) 198 (66.7%)
Chinese Librarianship: an International Electronic Journal, 32. URL: http://www.iclc.us/cliej/cl32SM.pdf
13
7. Handling students‟ affairs 66 (68%) 73 (73.7%) 58 (57.4%) 197 (66.3%)
8. Teachers/staff training 74 (76.3%) 73 (73.7%) 47 (46.5%) 194 (65.3%)
9. Team work 65 (67%) 68 (68.7%) 61 (60.4%) 194 (65.3%)
10. Staff development 67 (69.1%) 66 (66.7%) 60 (59.4%) 193 (65.0%)
11. Official correspondence 56 (57.7%) 66 (66.7%) 68 (67.3%) 190 (64.0%)
12. Government policies 76 (78.4%) 61 (61.6%) 52 (51.5%) 189 (63.6%)
13. Day to day official activities 66 (68%) 54 (54.5%) 64 (63.4%) 184 (62.0%)
14. Time management 65 (67%) 63 (63.6%) 55 (54.5%) 183 (61.6%)
15. Curriculum development 64 (66%) 57 (57.6%) 60 (59.4%) 181 (60.9%)
16. Monitoring 66 (68%) 65 (65.7%) 48 (47.5%) 179 (60.3%)
17. Current affairs 64 (66%) 61 (61.6%) 47 (46.5%) 172 (57.9%)
18. Controlling 66 (68%) 60 (60.6%) 37 (36.6%) 163 (54.9%)
19. For seeking government grants 68 (70.1%) 47 (47.5%) 45 (44.6%) 160 (53.9%)
20. Personal professional development 55 (56.7%) 58 (58.6%) 47 (46.5%) 160 (53.9%)
21. Leadership roles 65 (67%) 47 (47.5%) 44 (43.6%) 156 (52.5%)
22. Personnel evaluation 58 (59.8%) 48 (48.5%) 46 (45.5%) 152 (51.2%)
23. Emerging new scenarios 51 (52.6%) 48 (48.5%) 43 (42.6%) 142 (47.8%)
24. Fund raising 60 (61.9%) 50 (50.5%) 32 (31.7%) 142 (47.8%)
25. Reducing uncertainty 54 (55.7%) 41 (41.4%) 42 (41.6%) 137 (46.1%)
26. Building trust & goodwill 54 (55.7%) 50 (50.5%) 31 (30.7%) 135 (45.5%)
27. Crisis management 53 (54.6%) 46 (46.5%) 29 (28.7%) 128 (43.1%)
28. Forecasting 44 (45.4%) 42 (42.4%) 41 (40.6%) 127 (42.8%)
29. Showing personal concern 46 (47.4%) 41 (41.4%) 27 (26.7%) 114 (38.4%)
30. Growth of corporate culture 51 (52.6%) 35 (35.4%) 20 (19.8%) 106 (35.7%)
31. To choose between alternatives 48 (49.5%) 27 (27.3%) 28 (27.7%) 103 (34.7%)
32. Political Scenarios 42 (43.3%) 31 (31.3%) 26 (25.7%) 99 (33.3%)
33. Marketing strategies 39 (40.2%) 26 (26.3%) 24 (23.8%) 89 (30.0%)
Table 5 shows that 261 (87.9%) respondents were engaged with planning and needed
information for this purpose. Of them, 82 (84.5%) were from the school sector, 88 (88.9%) from
the college sector and 91 (91.1%) from the university sector. Two hundred and eighteen (73.4%)
Chinese Librarianship: an International Electronic Journal, 32. URL: http://www.iclc.us/cliej/cl32SM.pdf
14
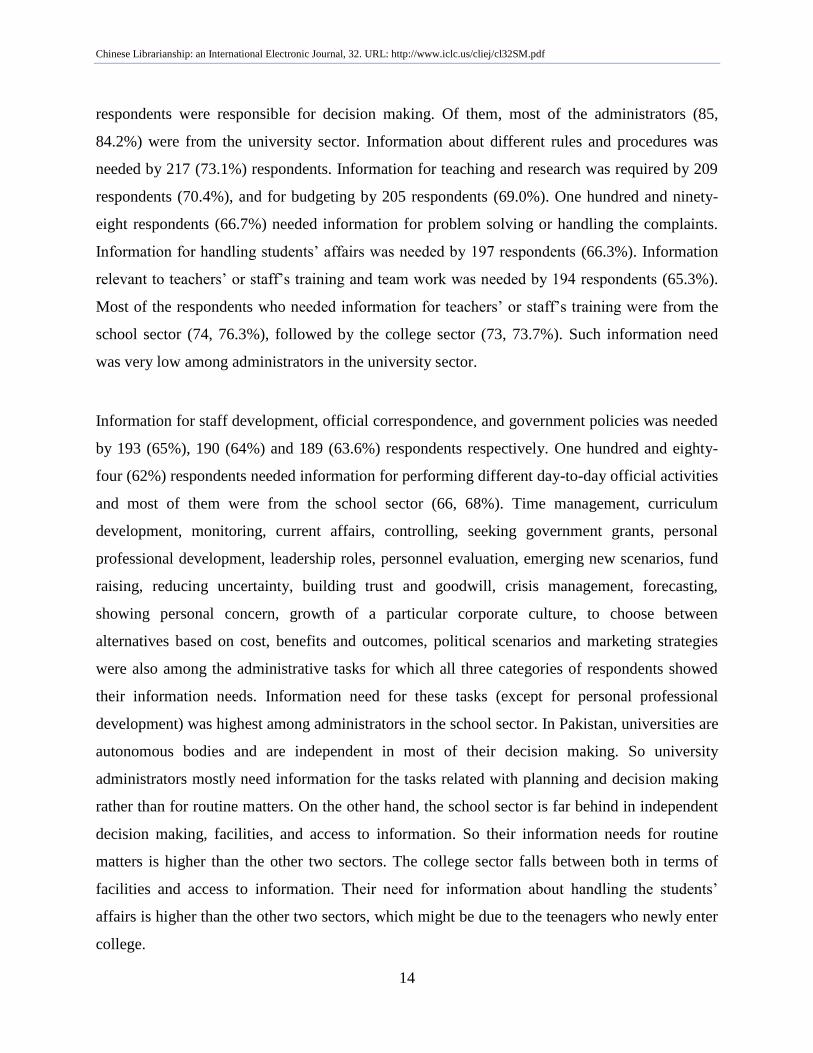
respondents were responsible for decision making. Of them, most of the administrators (85,
84.2%) were from the university sector. Information about different rules and procedures was
needed by 217 (73.1%) respondents. Information for teaching and research was required by 209
respondents (70.4%), and for budgeting by 205 respondents (69.0%). One hundred and ninety-
eight respondents (66.7%) needed information for problem solving or handling the complaints.
Information for handling students‟ affairs was needed by 197 respondents (66.3%). Information
relevant to teachers‟ or staff‟s training and team work was needed by 194 respondents (65.3%).
Most of the respondents who needed information for teachers‟ or staff‟s training were from the
school sector (74, 76.3%), followed by the college sector (73, 73.7%). Such information need
was very low among administrators in the university sector.
Information for staff development, official correspondence, and government policies was needed
by 193 (65%), 190 (64%) and 189 (63.6%) respondents respectively. One hundred and eighty-
four (62%) respondents needed information for performing different day-to-day official activities
and most of them were from the school sector (66, 68%). Time management, curriculum
development, monitoring, current affairs, controlling, seeking government grants, personal
professional development, leadership roles, personnel evaluation, emerging new scenarios, fund
raising, reducing uncertainty, building trust and goodwill, crisis management, forecasting,
showing personal concern, growth of a particular corporate culture, to choose between
alternatives based on cost, benefits and outcomes, political scenarios and marketing strategies
were also among the administrative tasks for which all three categories of respondents showed
their information needs. Information need for these tasks (except for personal professional
development) was highest among administrators in the school sector. In Pakistan, universities are
autonomous bodies and are independent in most of their decision making. So university
administrators mostly need information for the tasks related with planning and decision making
rather than for routine matters. On the other hand, the school sector is far behind in independent
decision making, facilities, and access to information. So their information needs for routine
matters is higher than the other two sectors. The college sector falls between both in terms of
facilities and access to information. Their need for information about handling the students‟
affairs is higher than the other two sectors, which might be due to the teenagers who newly enter
college.
Chinese Librarianship: an International Electronic Journal, 32. URL: http://www.iclc.us/cliej/cl32SM.pdf
15
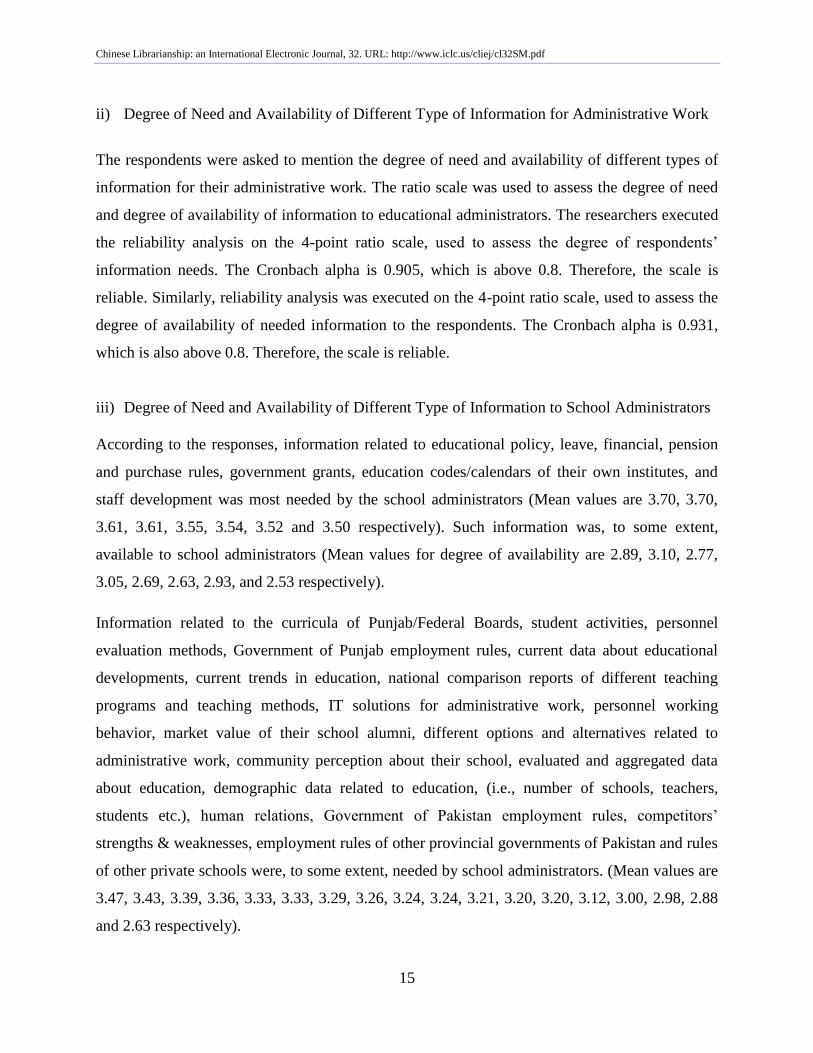
ii) Degree of Need and Availability of Different Type of Information for Administrative Work
The respondents were asked to mention the degree of need and availability of different types of
information for their administrative work. The ratio scale was used to assess the degree of need
and degree of availability of information to educational administrators. The researchers executed
the reliability analysis on the 4-point ratio scale, used to assess the degree of respondents‟
information needs. The Cronbach alpha is 0.905, which is above 0.8. Therefore, the scale is
reliable. Similarly, reliability analysis was executed on the 4-point ratio scale, used to assess the
degree of availability of needed information to the respondents. The Cronbach alpha is 0.931,
which is also above 0.8. Therefore, the scale is reliable.
iii) Degree of Need and Availability of Different Type of Information to School Administrators
According to the responses, information related to educational policy, leave, financial, pension
and purchase rules, government grants, education codes/calendars of their own institutes, and
staff development was most needed by the school administrators (Mean values are 3.70, 3.70,
3.61, 3.61, 3.55, 3.54, 3.52 and 3.50 respectively). Such information was, to some extent,
available to school administrators (Mean values for degree of availability are 2.89, 3.10, 2.77,
3.05, 2.69, 2.63, 2.93, and 2.53 respectively).
Information related to the curricula of Punjab/Federal Boards, student activities, personnel
evaluation methods, Government of Punjab employment rules, current data about educational
developments, current trends in education, national comparison reports of different teaching
programs and teaching methods, IT solutions for administrative work, personnel working
behavior, market value of their school alumni, different options and alternatives related to
administrative work, community perception about their school, evaluated and aggregated data
about education, demographic data related to education, (i.e., number of schools, teachers,
students etc.), human relations, Government of Pakistan employment rules, competitors‟
strengths & weaknesses, employment rules of other provincial governments of Pakistan and rules
of other private schools were, to some extent, needed by school administrators. (Mean values are
3.47, 3.43, 3.39, 3.36, 3.33, 3.33, 3.29, 3.26, 3.24, 3.24, 3.21, 3.20, 3.20, 3.12, 3.00, 2.98, 2.88
and 2.63 respectively).
Chinese Librarianship: an International Electronic Journal, 32. URL: http://www.iclc.us/cliej/cl32SM.pdf
16
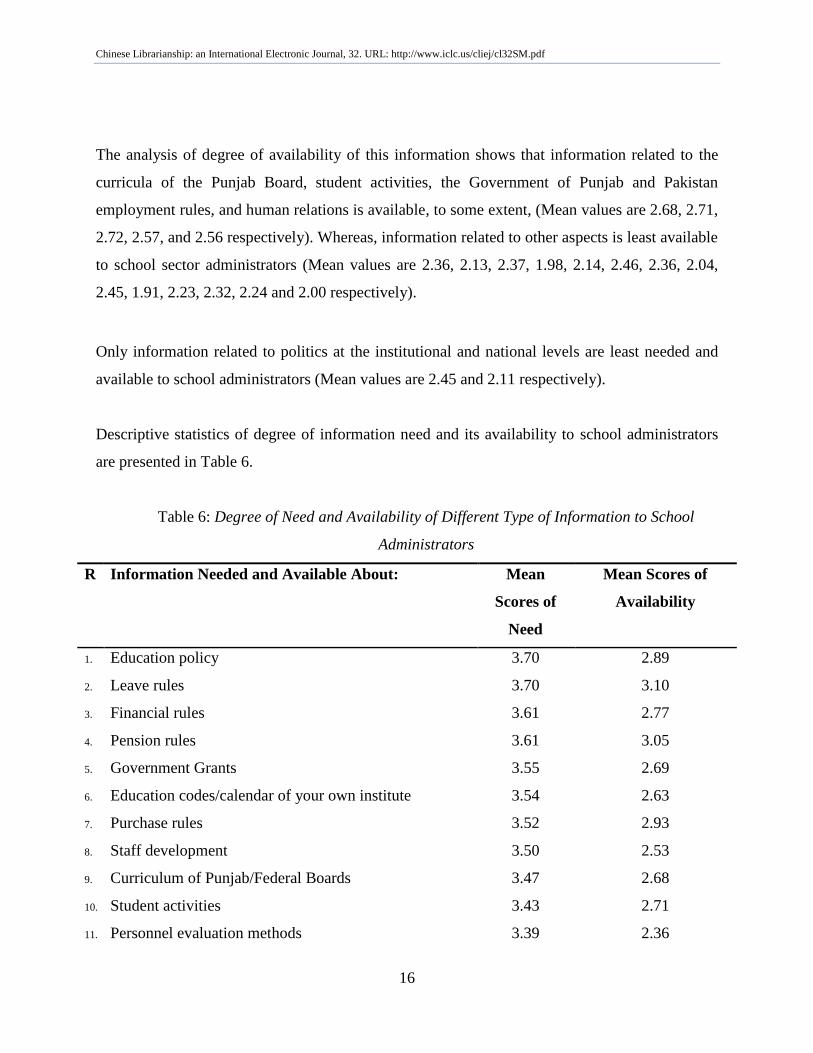
The analysis of degree of availability of this information shows that information related to the
curricula of the Punjab Board, student activities, the Government of Punjab and Pakistan
employment rules, and human relations is available, to some extent, (Mean values are 2.68, 2.71,
2.72, 2.57, and 2.56 respectively). Whereas, information related to other aspects is least available
to school sector administrators (Mean values are 2.36, 2.13, 2.37, 1.98, 2.14, 2.46, 2.36, 2.04,
2.45, 1.91, 2.23, 2.32, 2.24 and 2.00 respectively).
Only information related to politics at the institutional and national levels are least needed and
available to school administrators (Mean values are 2.45 and 2.11 respectively).
Descriptive statistics of degree of information need and its availability to school administrators
are presented in Table 6.
Table 6: Degree of Need and Availability of Different Type of Information to School
Administrators
R Information Needed and Available About: Mean
Scores of
Need
Mean Scores of
Availability
1. Education policy 3.70 2.89
2. Leave rules 3.70 3.10
3. Financial rules 3.61 2.77
4. Pension rules 3.61 3.05
5. Government Grants 3.55 2.69
6. Education codes/calendar of your own institute 3.54 2.63
7. Purchase rules 3.52 2.93
8. Staff development 3.50 2.53
9. Curriculum of Punjab/Federal Boards 3.47 2.68
10. Student activities 3.43 2.71
11. Personnel evaluation methods 3.39 2.36
Chinese Librarianship: an International Electronic Journal, 32. URL: http://www.iclc.us/cliej/cl32SM.pdf
17
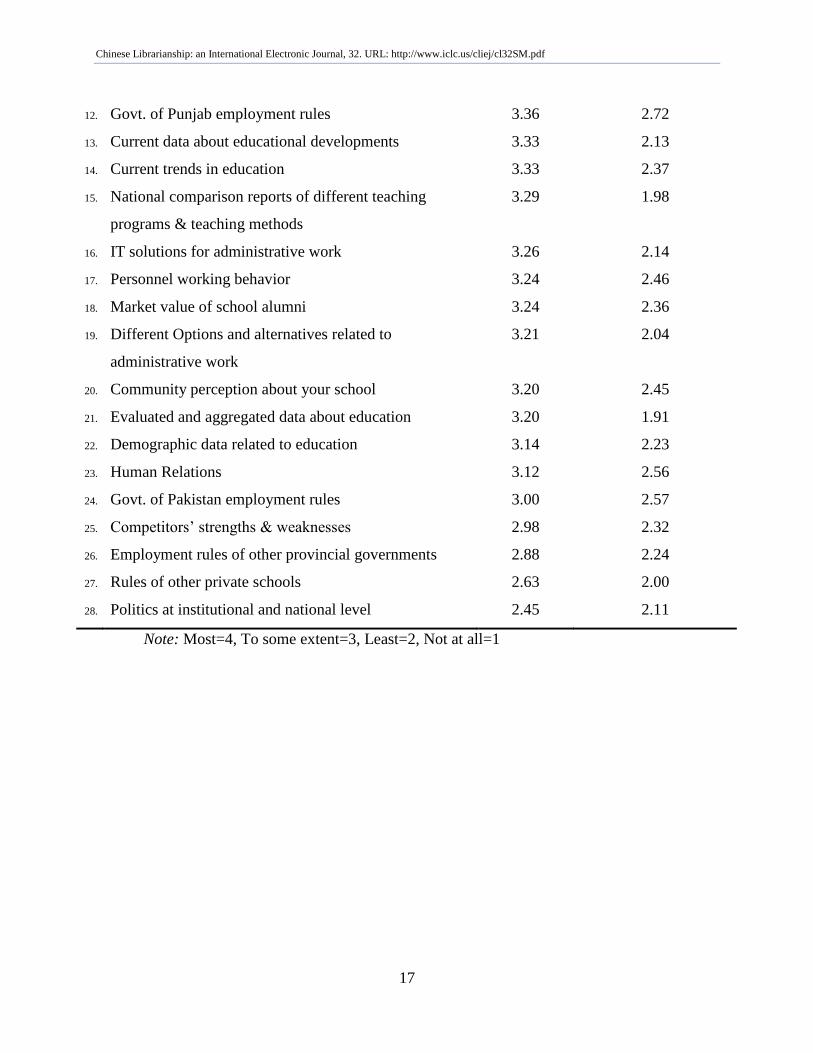
12. Govt. of Punjab employment rules 3.36 2.72
13. Current data about educational developments 3.33 2.13
14. Current trends in education 3.33 2.37
15. National comparison reports of different teaching
programs & teaching methods
3.29 1.98
16. IT solutions for administrative work 3.26 2.14
17. Personnel working behavior 3.24 2.46
18. Market value of school alumni 3.24 2.36
19. Different Options and alternatives related to
administrative work
3.21 2.04
20. Community perception about your school 3.20 2.45
21. Evaluated and aggregated data about education 3.20 1.91
22. Demographic data related to education 3.14 2.23
23. Human Relations 3.12 2.56
24. Govt. of Pakistan employment rules 3.00 2.57
25. Competitors‟ strengths & weaknesses 2.98 2.32
26. Employment rules of other provincial governments 2.88 2.24
27. Rules of other private schools 2.63 2.00
28. Politics at institutional and national level 2.45 2.11
Note: Most=4, To some extent=3, Least=2, Not at all=1
Chinese Librarianship: an International Electronic Journal, 32. URL: http://www.iclc.us/cliej/cl32SM.pdf
18
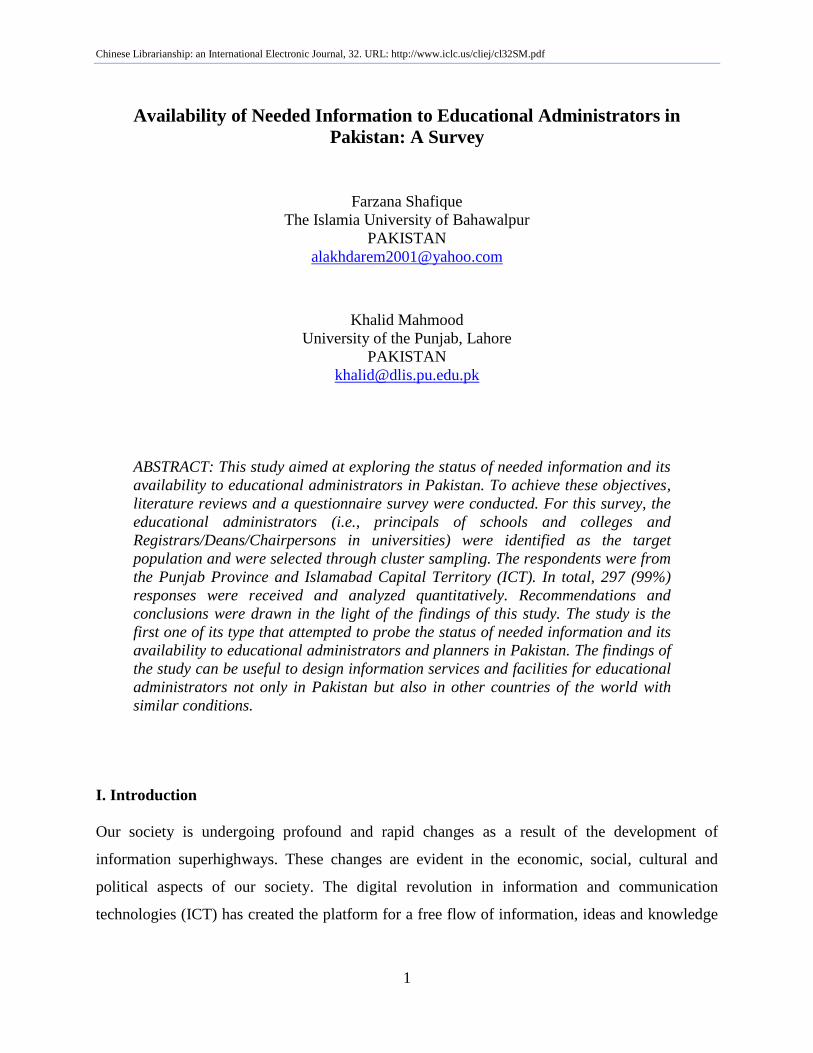
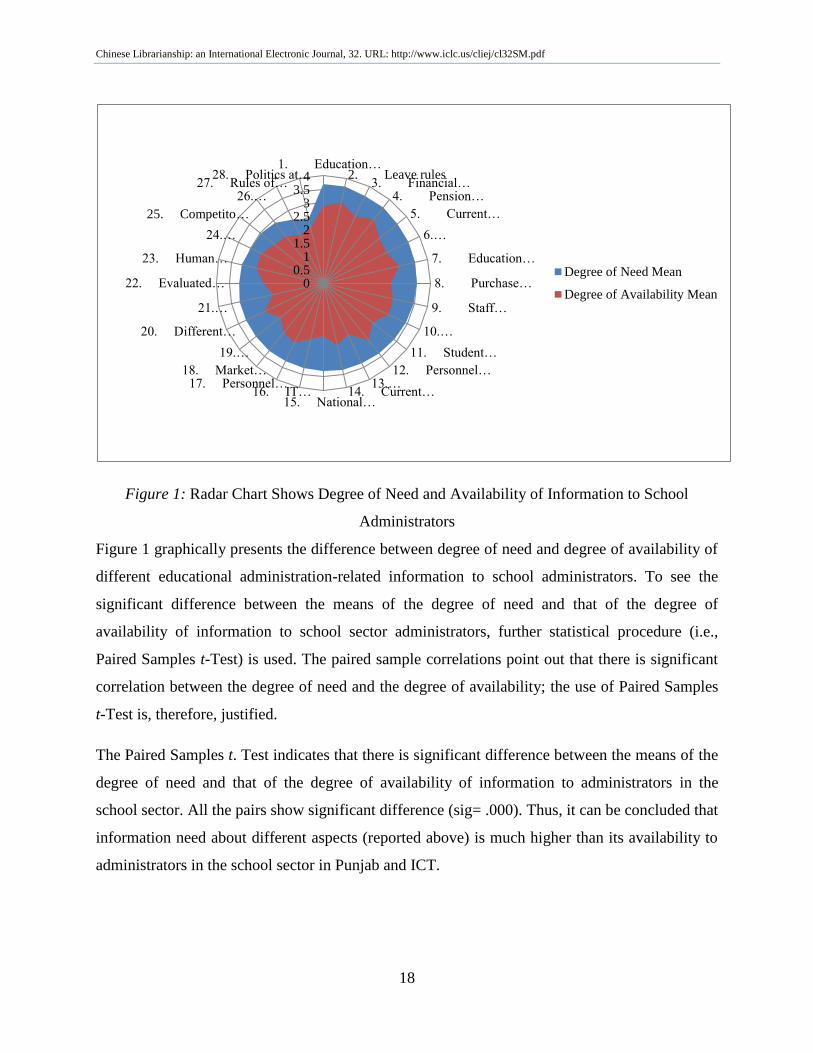
Figure 1: Radar Chart Shows Degree of Need and Availability of Information to School
Administrators
Figure 1 graphically presents the difference between degree of need and degree of availability of
different educational administration-related information to school administrators. To see the
significant difference between the means of the degree of need and that of the degree of
availability of information to school sector administrators, further statistical procedure (i.e.,
Paired Samples t-Test) is used. The paired sample correlations point out that there is significant
correlation between the degree of need and the degree of availability; the use of Paired Samples
t-Test is, therefore, justified.
The Paired Samples t. Test indicates that there is significant difference between the means of the
degree of need and that of the degree of availability of information to administrators in the
school sector. All the pairs show significant difference (sig= .000). Thus, it can be concluded that
information need about different aspects (reported above) is much higher than its availability to
administrators in the school sector in Punjab and ICT.
00.5
11.5
22.5
33.5
41. Education…
2. Leave rules3. Financial…
4. Pension…
5. Current…
6.…
7. Education…
8. Purchase…
9. Staff…
10.…
11. Student…
12. Personnel…13.…
14. Current…15. National…
16. IT…17. Personnel…
18. Market…
19.…
20. Different…
21.…
22. Evaluated…
23. Human…
24.…
25. Competito…
26.…27. Rules of…
28. Politics at…
Degree of Need Mean
Degree of Availability Mean
Chinese Librarianship: an International Electronic Journal, 32. URL: http://www.iclc.us/cliej/cl32SM.pdf
19
iv) Degree of Need and Availability of Different Type of Information to College Administrators
Analysis of data related to administrators in the college sector reveals that they mostly need
information about current trends in education, purchase rules, educational policy, staff
development, leave, pension, and financial rules, current data about educational developments,
personnel evaluation methods, student activities, and human relations (Mean values are 3.71,
3.69, 3.67, 3.64, 3.62, 3.61, 3.60, 3.60, and 3.52 respectively).
The status of availability of such information is not very encouraging for the college sector
administrators as well. Information related to current trends in education and current data about
educational developments was least available to them (Mean values are 2.36, and 2.10
respectively). While information related to purchase rules, education policy, staff development,
leave, pension, and financial rules, personnel evaluation methods, student activities, and human
relations was available, to some extent, to them (Mean values are 2.95, 3.05, 2.58, 2.96, 2.87,
2.88, 2.64, 2.66, and 2.63 respectively).
Information related to government grants, personnel working behavior, the Government of
Punjab employment rules, different options and alternatives related to administrative work,
market value of their college alumni, national comparison reports of different teaching programs
and teaching methods, education codes/calendar of their own college, research output of their
college and faculty members, information technology (IT) solutions for administrative work,
evaluated and aggregated data about education, ranking criteria of colleges, competitors‟
strengths and weaknesses, demographic data related to education, (i.e., number of colleges,
teachers, students etc.), community perception about their college, the Government of Pakistan
employment rules, curricula of other boards and universities, research output of other colleges
and faculty members, politics at institutional and national level, rules of other boards and
universities, employment rules of other provincial governments of Pakistan and education codes
of other colleges was, to some extent, needed by the college administrators (Mean values are
3.48, 3.46, 3.45, 3.43, 3.39, 3.38, 3.37, 3.37, 3.36, 3.29, 3.17, 3.16, 3.14, 3.06, 2.90, 2.86, 2.70,
2.61, 2.54, and 2.51 respectively).
Information related to government grants, personnel working behavior, the Government of
Punjab employment rules, education codes/calendar of their own college, and research output of
Chinese Librarianship: an International Electronic Journal, 32. URL: http://www.iclc.us/cliej/cl32SM.pdf
20
their own college and faculty members was, to some extent, available to them (Mean values are
2.63, 2.60, 2.67, 2.72, and 2.50 respectively).
On the other hand, information about different options and alternatives related to administrative
work, market value of their college alumni, national comparison reports of different teaching
programs and methods, IT solutions for administrative work, evaluated and aggregated data
about education, ranking criteria of colleges, competitors‟ strengths & weaknesses, demographic
data related to education, (i.e., number of colleges, teachers, students etc., community perception
about their college, the Government of Pakistan employment rules, curricula of other boards and
universities, research output of other colleges and faculty members, politics at institutional and
national level, rules of other boards and universities, employment rules of other provincial
governments of Pakistan and education codes of other colleges was least available to them
(Mean values are 2.21, 2.36, 2.00, 2.25, 1.98, 2.16, 2.45, 2.31, 2.39, 2.36, 2.35, 2.06, 2.34, 2.20,
1.87, and 1.74 respectively).
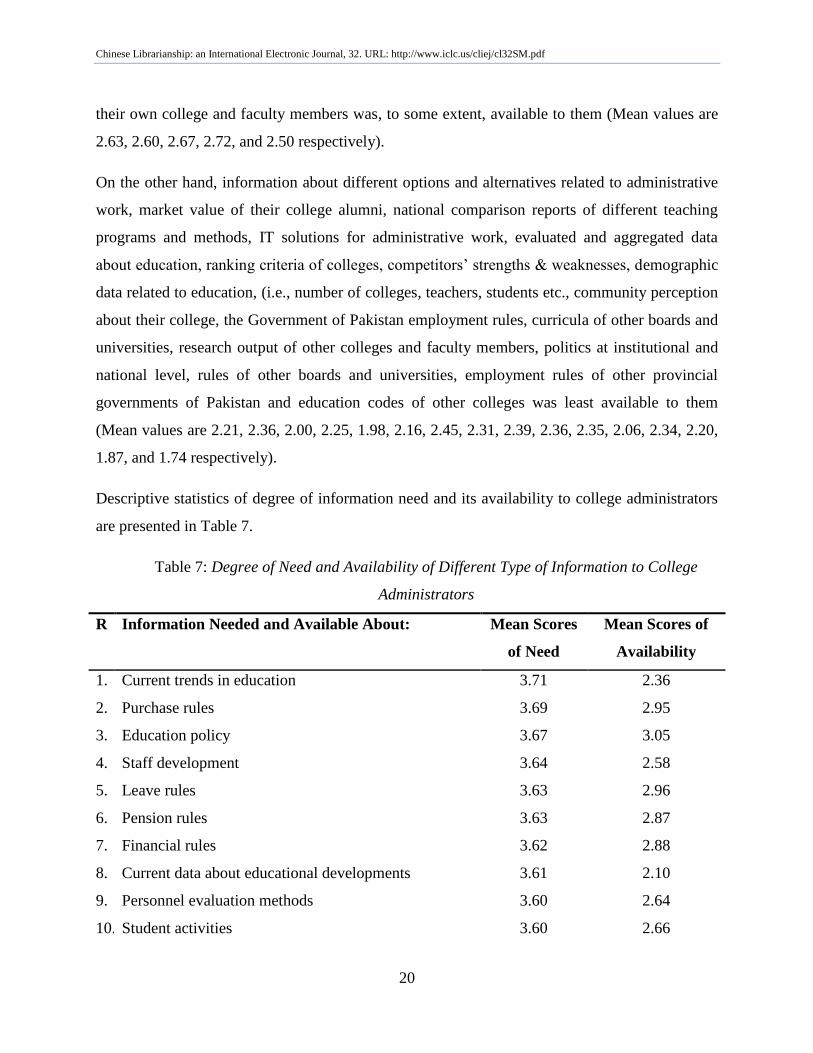
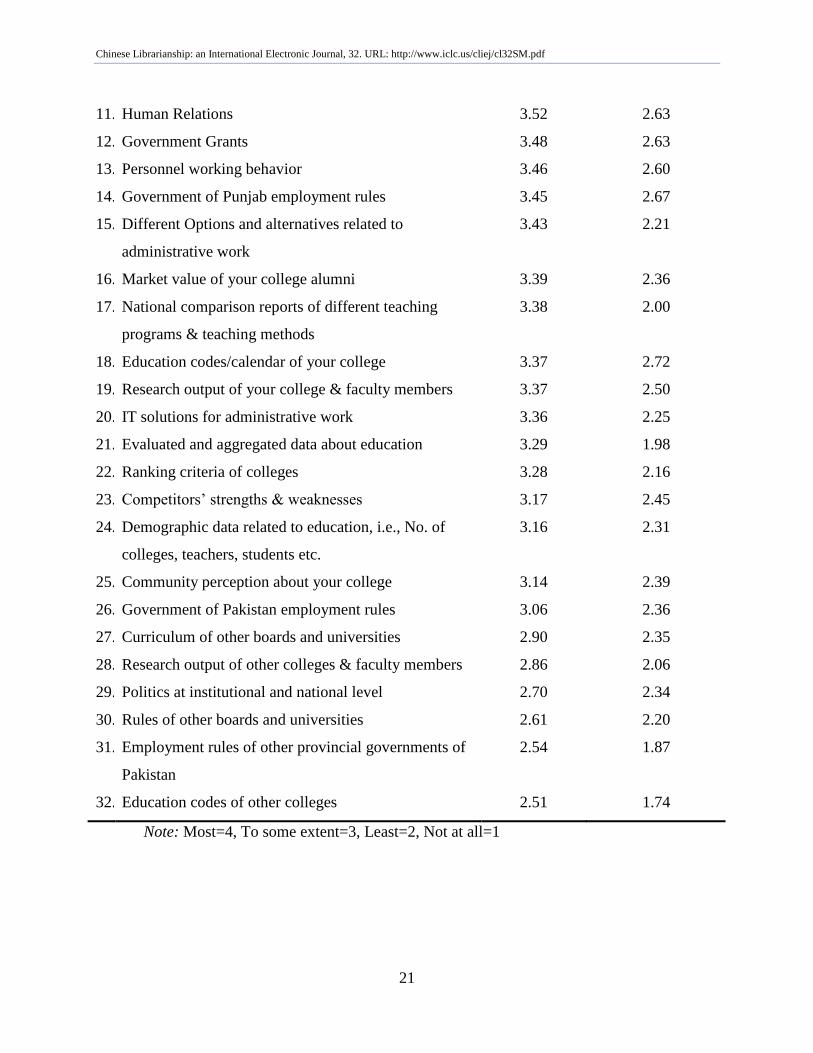
Descriptive statistics of degree of information need and its availability to college administrators
are presented in Table 7.
Table 7: Degree of Need and Availability of Different Type of Information to College
Administrators
R Information Needed and Available About: Mean Scores
of Need
Mean Scores of
Availability
1. Current trends in education 3.71 2.36
2. Purchase rules 3.69 2.95
3. Education policy 3.67 3.05
4. Staff development 3.64 2.58
5. Leave rules 3.63 2.96
6. Pension rules 3.63 2.87
7. Financial rules 3.62 2.88
8. Current data about educational developments 3.61 2.10
9. Personnel evaluation methods 3.60 2.64
10. Student activities 3.60 2.66
Chinese Librarianship: an International Electronic Journal, 32. URL: http://www.iclc.us/cliej/cl32SM.pdf
21
11. Human Relations 3.52 2.63
12. Government Grants 3.48 2.63
13. Personnel working behavior 3.46 2.60
14. Government of Punjab employment rules 3.45 2.67
15. Different Options and alternatives related to
administrative work
3.43 2.21
16. Market value of your college alumni 3.39 2.36
17. National comparison reports of different teaching
programs & teaching methods
3.38 2.00
18. Education codes/calendar of your college 3.37 2.72
19. Research output of your college & faculty members 3.37 2.50
20. IT solutions for administrative work 3.36 2.25
21. Evaluated and aggregated data about education 3.29 1.98
22. Ranking criteria of colleges 3.28 2.16
23. Competitors‟ strengths & weaknesses 3.17 2.45
24. Demographic data related to education, i.e., No. of
colleges, teachers, students etc.
3.16 2.31
25. Community perception about your college 3.14 2.39
26. Government of Pakistan employment rules 3.06 2.36
27. Curriculum of other boards and universities 2.90 2.35
28. Research output of other colleges & faculty members 2.86 2.06
29. Politics at institutional and national level 2.70 2.34
30. Rules of other boards and universities 2.61 2.20
31. Employment rules of other provincial governments of
Pakistan
2.54 1.87
32. Education codes of other colleges 2.51 1.74
Note: Most=4, To some extent=3, Least=2, Not at all=1
Chinese Librarianship: an International Electronic Journal, 32. URL: http://www.iclc.us/cliej/cl32SM.pdf
22
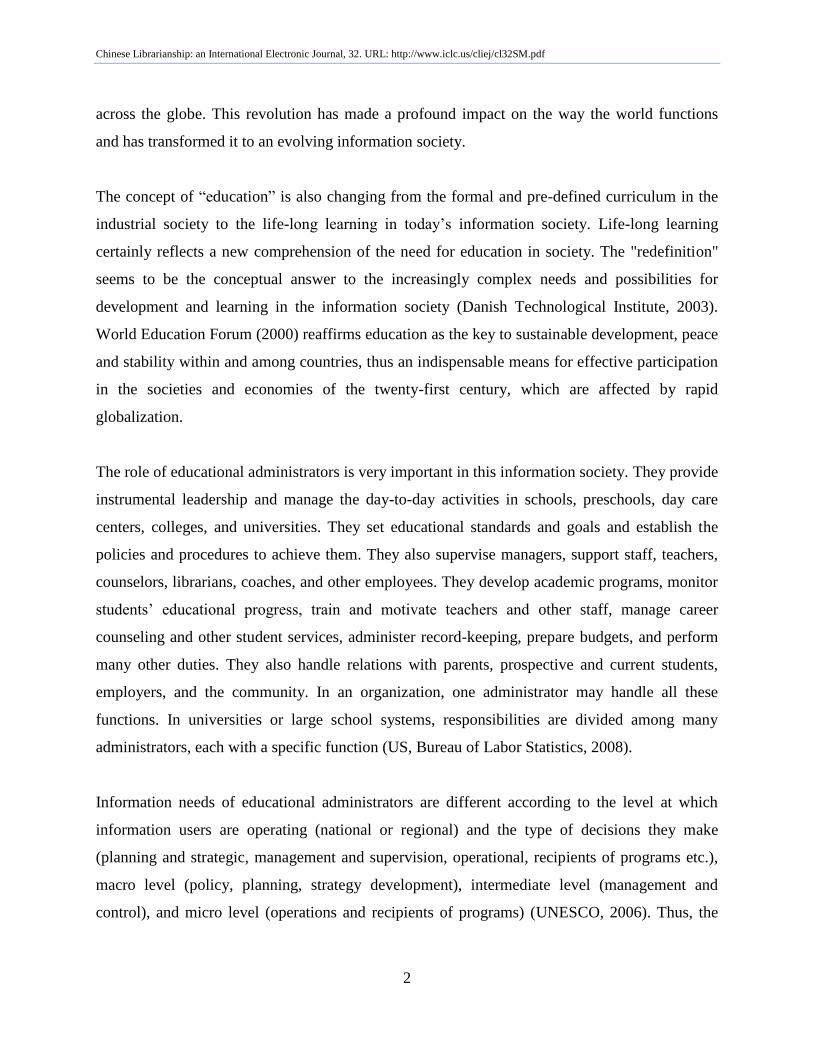
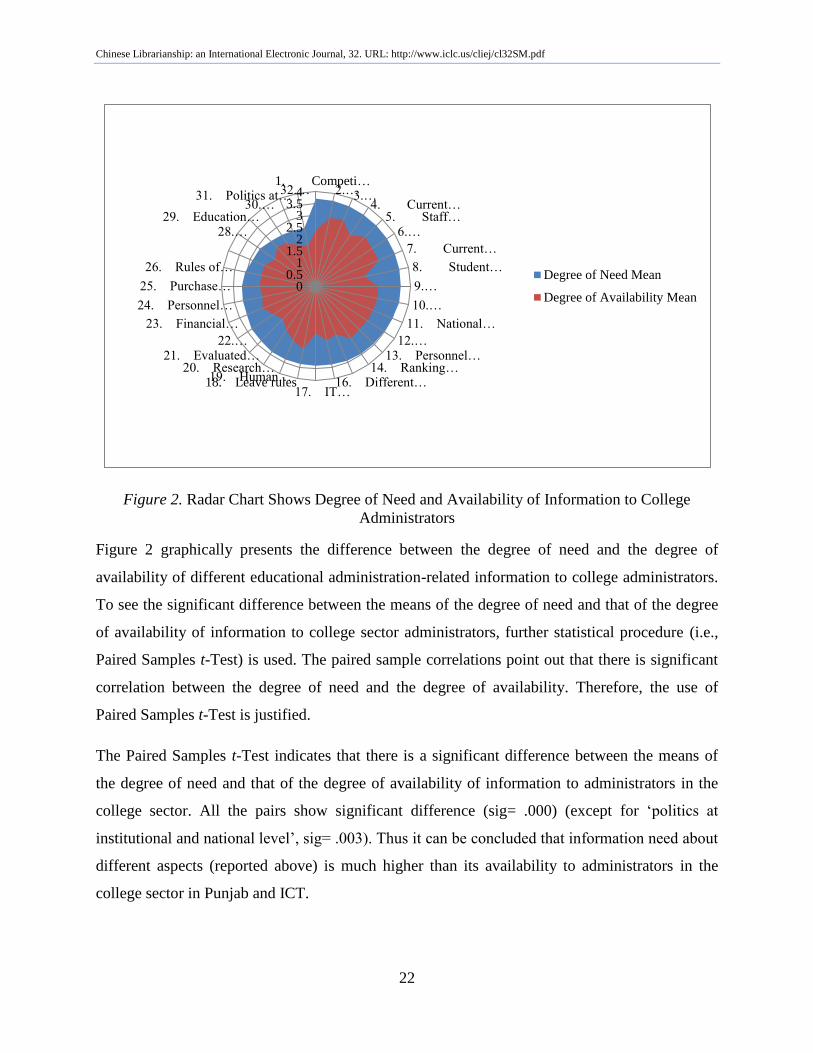
Figure 2. Radar Chart Shows Degree of Need and Availability of Information to College
Administrators
Figure 2 graphically presents the difference between the degree of need and the degree of
availability of different educational administration-related information to college administrators.
To see the significant difference between the means of the degree of need and that of the degree
of availability of information to college sector administrators, further statistical procedure (i.e.,
Paired Samples t-Test) is used. The paired sample correlations point out that there is significant
correlation between the degree of need and the degree of availability. Therefore, the use of
Paired Samples t-Test is justified.
The Paired Samples t-Test indicates that there is a significant difference between the means of
the degree of need and that of the degree of availability of information to administrators in the
college sector. All the pairs show significant difference (sig= .000) (except for „politics at
institutional and national level‟, sig= .003). Thus it can be concluded that information need about
different aspects (reported above) is much higher than its availability to administrators in the
college sector in Punjab and ICT.
00.5
11.5
22.5
33.5
41. Competi…
2.…3.…4. Current…
5. Staff…6.…
7. Current…
8. Student…
9.…
10.…
11. National…
12.…13. Personnel…
14. Ranking…16. Different…
17. IT…18. Leave rules19. Human…
20. Research…21. Evaluated…
22.…
23. Financial…
24. Personnel…
25. Purchase…
26. Rules of…
28.…29. Education…
30.…31. Politics at…32.…
Degree of Need Mean
Degree of Availability Mean
Chinese Librarianship: an International Electronic Journal, 32. URL: http://www.iclc.us/cliej/cl32SM.pdf
23
v) Degree of Need and Availability of Different Type of Information to University
Administrators
Information about competitors‟ strengths and weaknesses, education policy, research output of
their university/faculty members, current data about educational developments, staff
development, and government grants was most needed by university administrators (Mean
values are 3.96, 3.56, 3.56, 3.56, 3.53 and 3.51 respectively).
Information about competitors‟ strengths and weaknesses and current data about educational
developments was least available to them (Mean values are 2.28, 2.48 respectively), while
information related to education policy, research output of their university/faculty members, staff
development and government grants was, to some extent, available to them (Mean values are
3.02, 2.80, 2.52, and 2.75 respectively).
On the other hand, to a degree, they needed information about current trends in education,
student activities, education codes/calendar of their own university, demographic data related to
education, (i.e., number of universities, teachers, students etc.), national comparison reports of
different teaching programs and teaching methods, curriculum of other universities, personnel
evaluation methods, ranking criteria of universities, market value of their university alumni,
different options and alternatives related to administrative work, IT solutions for administrative
work, leave rules, human relations, research output of other universities/faculty members,
evaluated and aggregated data about education, community perception about their university,
financial rules, personnel working behavior, purchase rules, rules of other universities, pension
rules, the Government of Pakistan employment rules, education codes of other universities, and
Government of Punjab employment rules (Mean values are 3.45, 3.43, 3.38, 3.38, 3.37, 3.33,
3.32, 3.29, 3.29, 3.28, 3.24, 3.24, 3.22, 3.21, 3.20, 3.20, 3.15, 3.13, 3.11, 3.06, 2.93, 2.82, and
2.74 respectively).
The analysis of the degree of availability shows that information about current trends in
education, student activities, education codes/calendar of their own university, curricula of other
universities, ranking criteria of universities, leave rules, human relations, financial, purchase and
pension rules, rules of other universities, the Government of Pakistan and Punjab employment
Chinese Librarianship: an International Electronic Journal, 32. URL: http://www.iclc.us/cliej/cl32SM.pdf
24
rules was, to some extent, available to university administrators (Mean values are 2.62, 2.56,
3.20, 2.83, 2.66, 2.81, 2.68, 2.50, 2.71, 2.59, 2.67, 2.70 and 2.58 respectively).
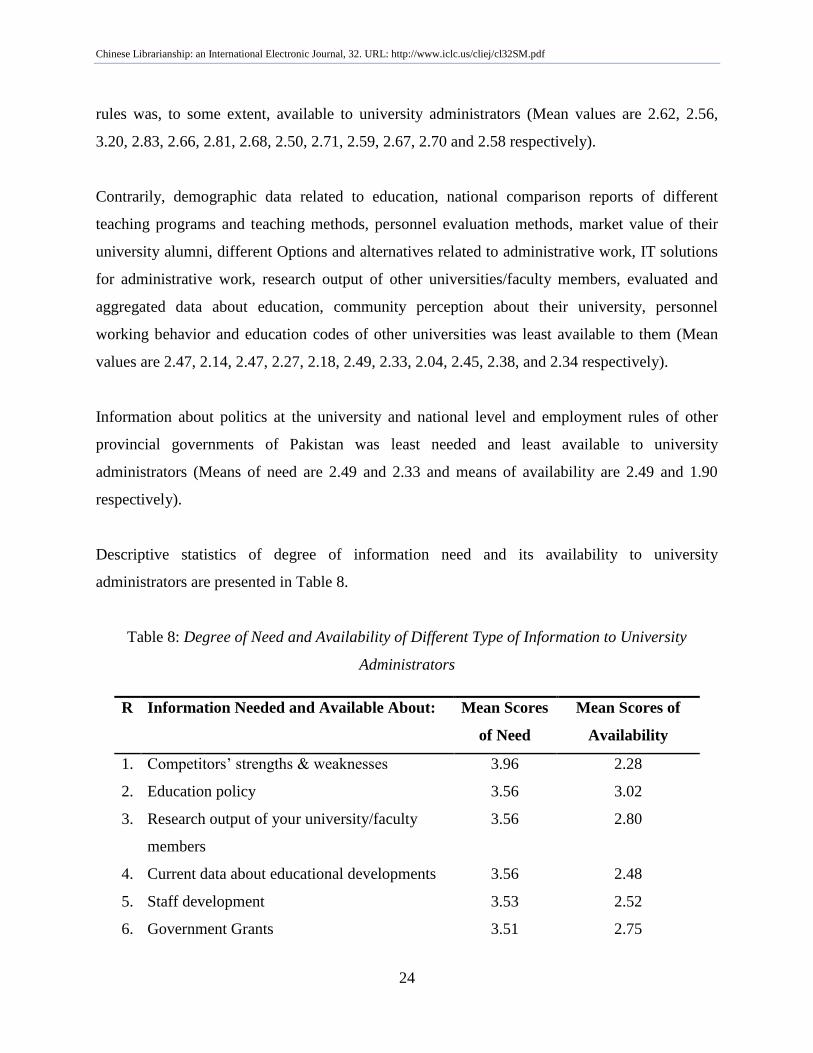
Contrarily, demographic data related to education, national comparison reports of different
teaching programs and teaching methods, personnel evaluation methods, market value of their
university alumni, different Options and alternatives related to administrative work, IT solutions
for administrative work, research output of other universities/faculty members, evaluated and
aggregated data about education, community perception about their university, personnel
working behavior and education codes of other universities was least available to them (Mean
values are 2.47, 2.14, 2.47, 2.27, 2.18, 2.49, 2.33, 2.04, 2.45, 2.38, and 2.34 respectively).
Information about politics at the university and national level and employment rules of other
provincial governments of Pakistan was least needed and least available to university
administrators (Means of need are 2.49 and 2.33 and means of availability are 2.49 and 1.90
respectively).
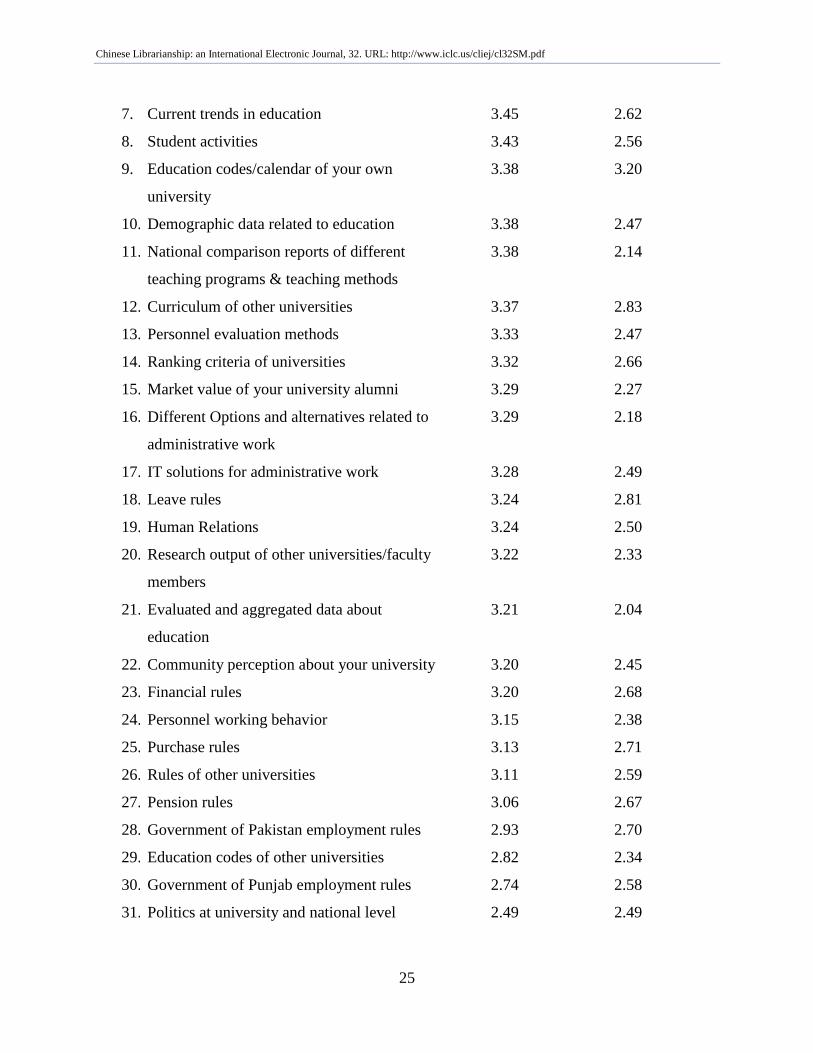
Descriptive statistics of degree of information need and its availability to university
administrators are presented in Table 8.
Table 8: Degree of Need and Availability of Different Type of Information to University
Administrators
R Information Needed and Available About: Mean Scores
of Need
Mean Scores of
Availability
1. Competitors‟ strengths & weaknesses 3.96 2.28
2. Education policy 3.56 3.02
3. Research output of your university/faculty
members
3.56 2.80
4. Current data about educational developments 3.56 2.48
5. Staff development 3.53 2.52
6. Government Grants 3.51 2.75
Chinese Librarianship: an International Electronic Journal, 32. URL: http://www.iclc.us/cliej/cl32SM.pdf
25
7. Current trends in education 3.45 2.62
8. Student activities 3.43 2.56
9. Education codes/calendar of your own
university
3.38 3.20
10. Demographic data related to education 3.38 2.47
11. National comparison reports of different
teaching programs & teaching methods
3.38 2.14
12. Curriculum of other universities 3.37 2.83
13. Personnel evaluation methods 3.33 2.47
14. Ranking criteria of universities 3.32 2.66
15. Market value of your university alumni 3.29 2.27
16. Different Options and alternatives related to
administrative work
3.29 2.18
17. IT solutions for administrative work 3.28 2.49
18. Leave rules 3.24 2.81
19. Human Relations 3.24 2.50
20. Research output of other universities/faculty
members
3.22 2.33
21. Evaluated and aggregated data about
education
3.21 2.04
22. Community perception about your university 3.20 2.45
23. Financial rules 3.20 2.68
24. Personnel working behavior 3.15 2.38
25. Purchase rules 3.13 2.71
26. Rules of other universities 3.11 2.59
27. Pension rules 3.06 2.67
28. Government of Pakistan employment rules 2.93 2.70
29. Education codes of other universities 2.82 2.34
30. Government of Punjab employment rules 2.74 2.58
31. Politics at university and national level 2.49 2.49
Chinese Librarianship: an International Electronic Journal, 32. URL: http://www.iclc.us/cliej/cl32SM.pdf
26
32. Employment rules of other provincial
governments of Pakistan
2.33 1.90
Note: Most=4, To some extent=3, Least=2, Not at all=1
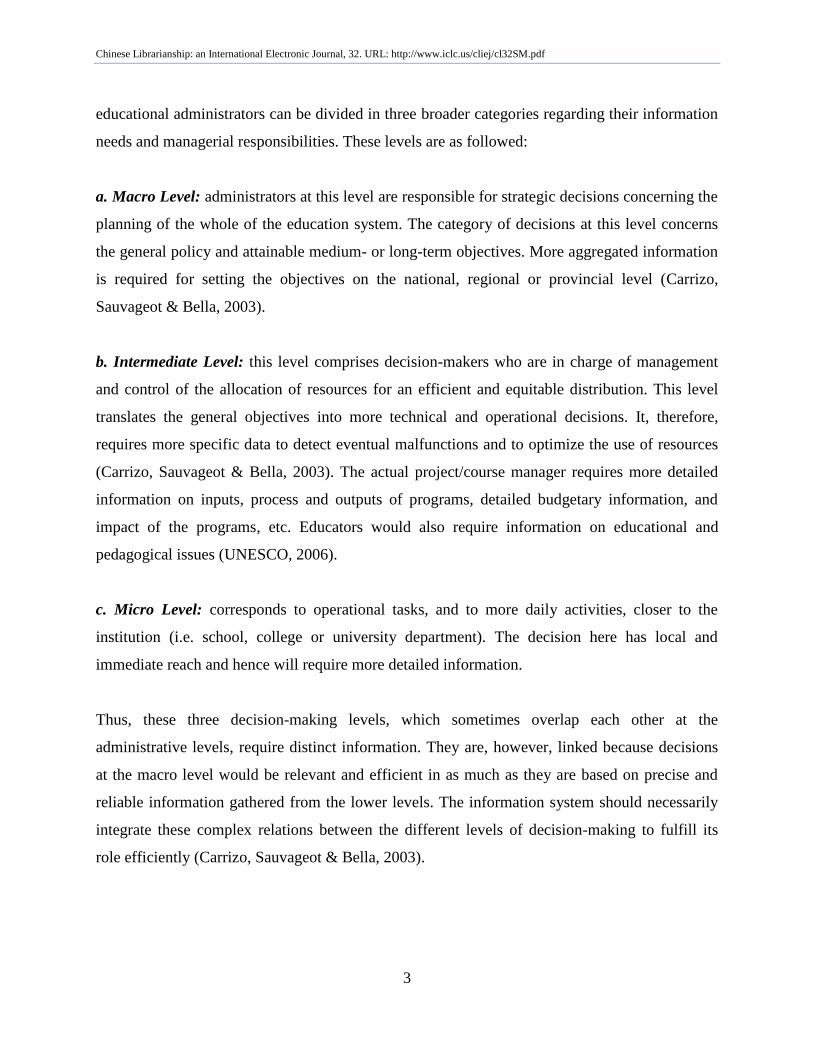
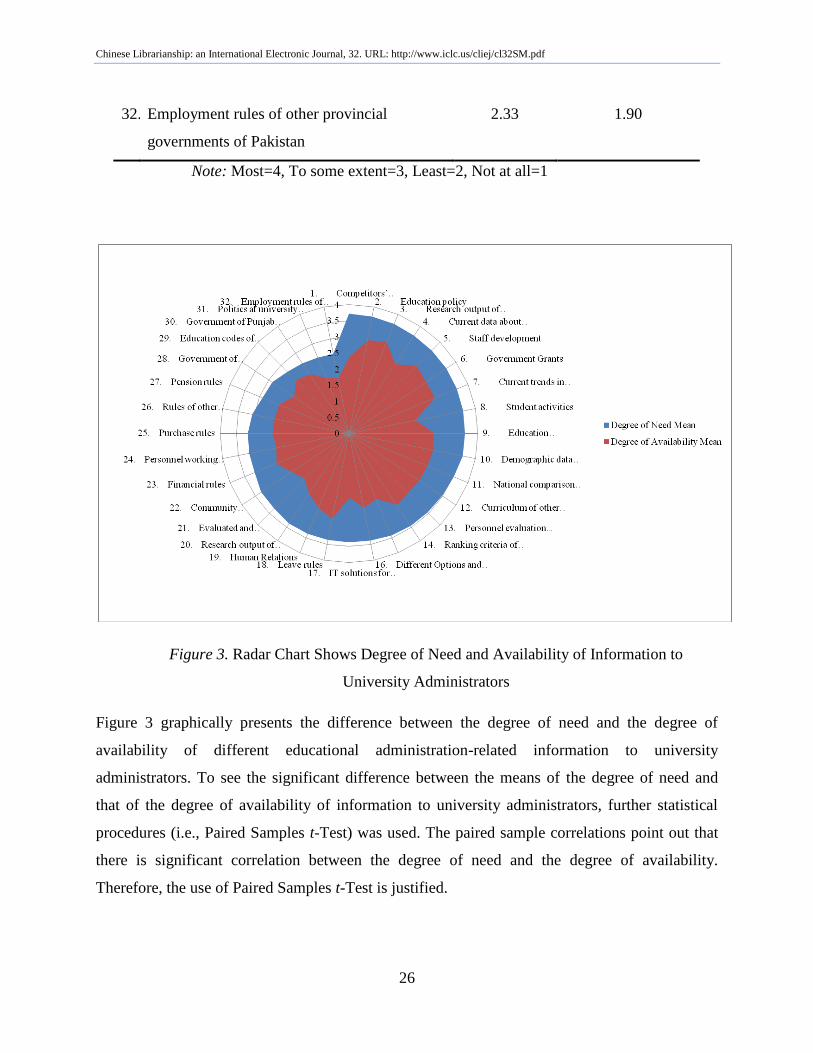
Figure 3. Radar Chart Shows Degree of Need and Availability of Information to
University Administrators
Figure 3 graphically presents the difference between the degree of need and the degree of
availability of different educational administration-related information to university
administrators. To see the significant difference between the means of the degree of need and
that of the degree of availability of information to university administrators, further statistical
procedures (i.e., Paired Samples t-Test) was used. The paired sample correlations point out that
there is significant correlation between the degree of need and the degree of availability.
Therefore, the use of Paired Samples t-Test is justified.
Chinese Librarianship: an International Electronic Journal, 32. URL: http://www.iclc.us/cliej/cl32SM.pdf
27
The Paired Samples t-Test indicates that there is significant difference between the means of
degree of need and that of the degree of availability of information to university administrators.
There is no significant difference between the means of degree of need and that of the degree of
availability of „Government of Punjab employment rules‟, sig= .138; and „Politics at institutional
and national level‟, sig= 1.000. All other pairs show significant difference at .000, except for
„Govt. of Pakistan employment rules‟, sig= .036; and Education codes/calendar of their own
university, sig= .049. Thus it can be concluded that information need about almost all the aspects
(except for „Govt. of Punjab employment rules‟ and „Politics at institutional and national level‟)
is much higher than its availability to university administrators in Punjab and ICT.
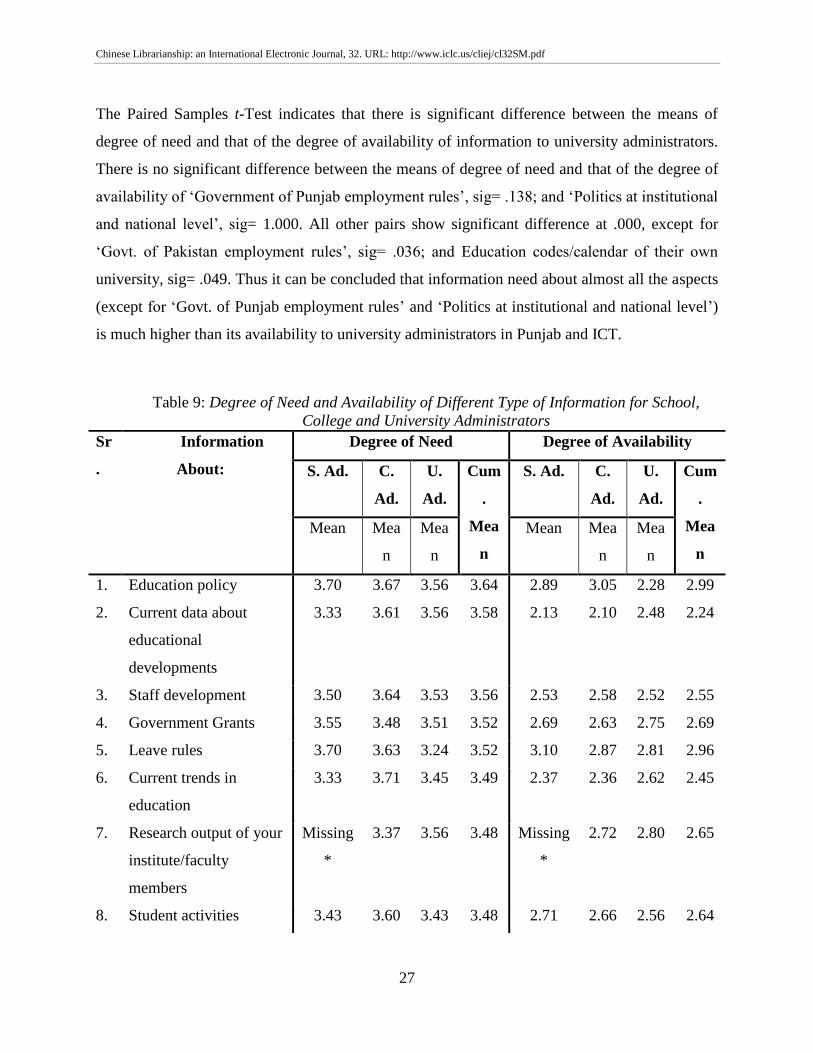
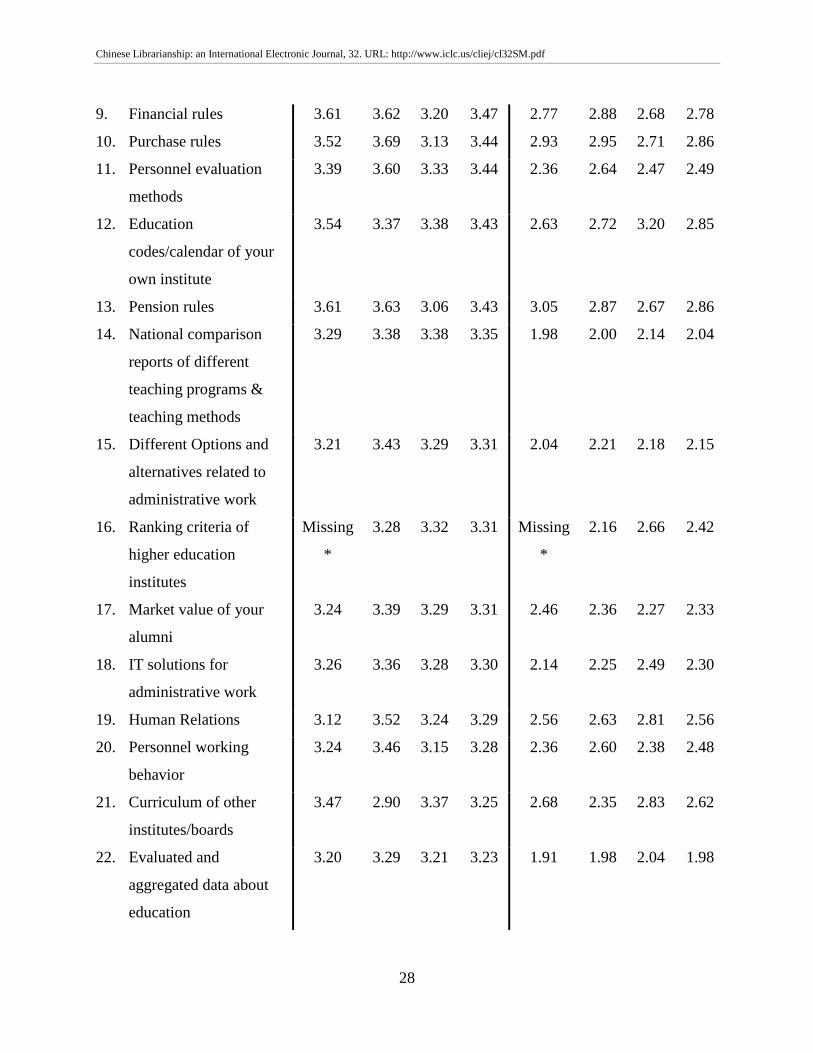
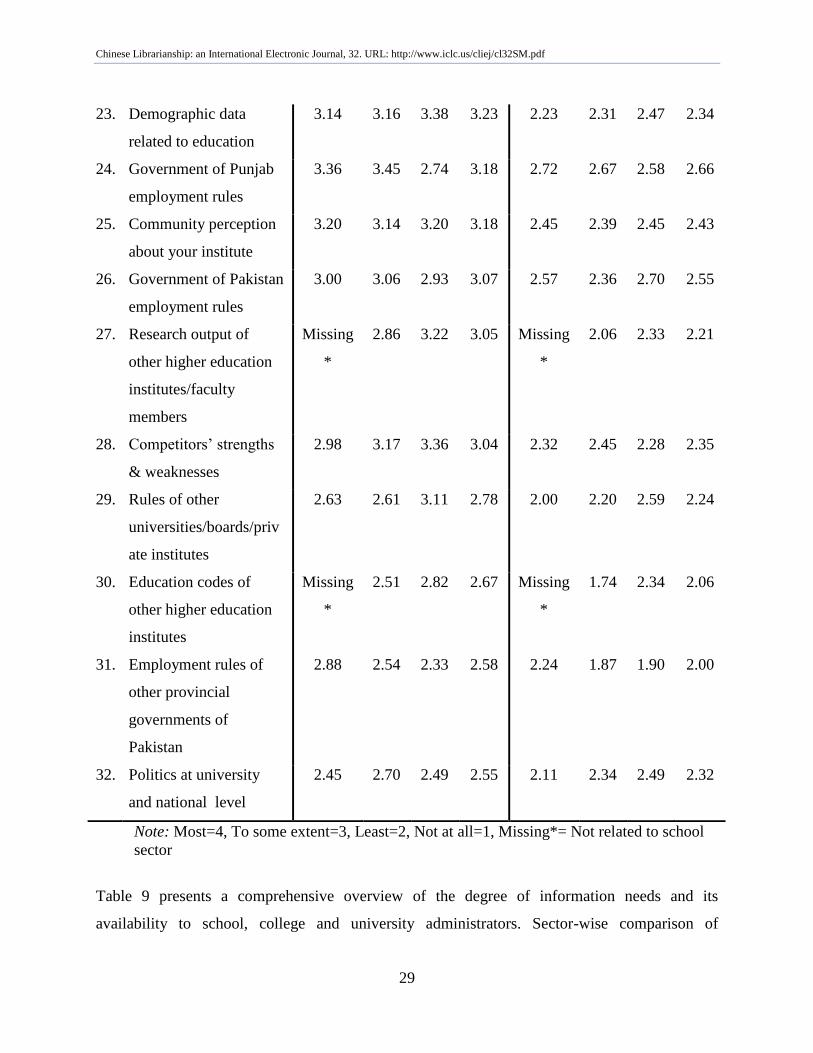
Table 9: Degree of Need and Availability of Different Type of Information for School,
College and University Administrators
Sr
.
Information
About:
Degree of Need Degree of Availability
S. Ad. C.
Ad.
U.
Ad.
Cum
.
Mea
n
S. Ad. C.
Ad.
U.
Ad.
Cum
.
Mea
n
Mean Mea
n
Mea
n
Mean Mea
n
Mea
n
1. Education policy 3.70 3.67 3.56 3.64 2.89 3.05 2.28 2.99
2. Current data about
educational
developments
3.33 3.61 3.56 3.58 2.13 2.10 2.48 2.24
3. Staff development 3.50 3.64 3.53 3.56 2.53 2.58 2.52 2.55
4. Government Grants 3.55 3.48 3.51 3.52 2.69 2.63 2.75 2.69
5. Leave rules 3.70 3.63 3.24 3.52 3.10 2.87 2.81 2.96
6. Current trends in
education
3.33 3.71 3.45 3.49 2.37 2.36 2.62 2.45
7. Research output of your
institute/faculty
members
Missing
*
3.37 3.56 3.48 Missing
*
2.72 2.80 2.65
8. Student activities 3.43 3.60 3.43 3.48 2.71 2.66 2.56 2.64
Chinese Librarianship: an International Electronic Journal, 32. URL: http://www.iclc.us/cliej/cl32SM.pdf
28
9. Financial rules 3.61 3.62 3.20 3.47 2.77 2.88 2.68 2.78
10. Purchase rules 3.52 3.69 3.13 3.44 2.93 2.95 2.71 2.86
11. Personnel evaluation
methods
3.39 3.60 3.33 3.44 2.36 2.64 2.47 2.49
12. Education
codes/calendar of your
own institute
3.54 3.37 3.38 3.43 2.63 2.72 3.20 2.85
13. Pension rules 3.61 3.63 3.06 3.43 3.05 2.87 2.67 2.86
14. National comparison
reports of different
teaching programs &
teaching methods
3.29 3.38 3.38 3.35 1.98 2.00 2.14 2.04
15. Different Options and
alternatives related to
administrative work
3.21 3.43 3.29 3.31 2.04 2.21 2.18 2.15
16. Ranking criteria of
higher education
institutes
Missing
*
3.28 3.32 3.31 Missing
*
2.16 2.66 2.42
17. Market value of your
alumni
3.24 3.39 3.29 3.31 2.46 2.36 2.27 2.33
18. IT solutions for
administrative work
3.26 3.36 3.28 3.30 2.14 2.25 2.49 2.30
19. Human Relations 3.12 3.52 3.24 3.29 2.56 2.63 2.81 2.56
20. Personnel working
behavior
3.24 3.46 3.15 3.28 2.36 2.60 2.38 2.48
21. Curriculum of other
institutes/boards
3.47 2.90 3.37 3.25 2.68 2.35 2.83 2.62
22. Evaluated and
aggregated data about
education
3.20 3.29 3.21 3.23 1.91 1.98 2.04 1.98
Chinese Librarianship: an International Electronic Journal, 32. URL: http://www.iclc.us/cliej/cl32SM.pdf
29
Note: Most=4, To some extent=3, Least=2, Not at all=1, Missing*= Not related to school
sector
Table 9 presents a comprehensive overview of the degree of information needs and its
availability to school, college and university administrators. Sector-wise comparison of
23. Demographic data
related to education
3.14 3.16 3.38 3.23 2.23 2.31 2.47 2.34
24. Government of Punjab
employment rules
3.36 3.45 2.74 3.18 2.72 2.67 2.58 2.66
25. Community perception
about your institute
3.20 3.14 3.20 3.18 2.45 2.39 2.45 2.43
26. Government of Pakistan
employment rules
3.00 3.06 2.93 3.07 2.57 2.36 2.70 2.55
27. Research output of
other higher education
institutes/faculty
members
Missing
*
2.86 3.22 3.05 Missing
*
2.06 2.33 2.21
28. Competitors‟ strengths
& weaknesses
2.98 3.17 3.36 3.04 2.32 2.45 2.28 2.35
29. Rules of other
universities/boards/priv
ate institutes
2.63 2.61 3.11 2.78 2.00 2.20 2.59 2.24
30. Education codes of
other higher education
institutes
Missing
*
2.51 2.82 2.67 Missing
*
1.74 2.34 2.06
31. Employment rules of
other provincial
governments of
Pakistan
2.88 2.54 2.33 2.58 2.24 1.87 1.90 2.00
32. Politics at university
and national level
2.45 2.70 2.49 2.55 2.11 2.34 2.49 2.32
Chinese Librarianship: an International Electronic Journal, 32. URL: http://www.iclc.us/cliej/cl32SM.pdf
30
information needs and seeking behavior of all three groups (with Paired Samples t-Test) do not
show major difference in their information needs and its availability, though university sector at
some points seemed better in the availability of needed information.
vi) Other Suggestions and Comments
A few respondents also provided their suggestions/comments in this regard (N= 85, 28.6%). A
qualitative analysis of the responses is as followed.
The respondents suggested that an efficient information system/service is strongly needed for
sound planning and decision making. They further pointed out that such a system/service would
boost the education sector of Pakistan up (n= 17).
They recommended that training should be provided not only to educational administrators but to
the teachers as well (n= 16). Educational administrators should be provided with not only up-to-
date information about rules, regulations, and methodologies for their implementation but with
action-oriented solutions as well. They also need information about the status of educational
policy and appraisal of its implication throughout the educational year, change in education
policy, curriculum, board and university decisions, and specific website links regarding the up-
coming training workshops and seminars (n= 6).
Training of educational administrators for administrative tasks was also strongly recommended
(n= 5). Moreover, they stressed that the suggestions of educational administrators working at the
micro level should be considered in the educational policy making process (n= 3), and special
attention is required in the school and college sector, particularly in rural and remote areas (n=
2), where quality IT facilities are required for timely availability of needed information.
Moreover, computer education policies for the colleges should also be revised according to the
contemporary requirements (n= 2). Free access to full-text information (both print and
electronic) should be provided for improving administrative skills (n= 2). Administrators need
up-to-date and accurate knowledge at the correct time for making correct decisions (n= 1). So
available data should be valid and reliable (n=1), and all the educational institutes should be
Chinese Librarianship: an International Electronic Journal, 32. URL: http://www.iclc.us/cliej/cl32SM.pdf
31
interconnected with each other (n= 1). One respondent recommended that a brief analysis of the
study should be communicated to the participants of the survey.
VI. Conclusion and Recommendations
Analysis of the data collected through the survey reveals that administrators‟ information needs
and preferences are largely conditioned by the demands and context of their work. They need
information for performing different administrative tasks. These tasks vary from long-term
planning to daily and routine tasks. The status of availability of needed information to all three
sectors is not encouraging, though the university sector seems slightly better in this regard. This
gap in availability of information is badly affecting the planning and decision-making process.
This finding is supported by the open-ended suggestions made by the respondents.
Based on the findings of the study, it is recommended that a valid, reliable, and efficient
information system/service be developed to assist educational administrators in all three tiers of
education (i.e. schools, colleges, and universities) in Pakistan. The educational administrators
should be informed on the real status and issues of education enterprise. It will enable them to
make realistic plans. Special attention should be given regarding the provision of better IT
services/facilities to the administrators in the school and college sectors, particularly those
working in remote areas. Special training programs should be developed and implemented to
helping them to search and retrieve information needed effectively.
References
Anwar, M. A. (2007). Research on information seeking and use in Pakistan. Pakistan Journal of
Library and Information Science, 8, 15-32.
Auster, E., & Choo, C. W. (Eds.). (1996). Managing information for the competitive edge. New
York: Neal-Schuman. Retrieved December 29, 2008, from: http://choo.ischool.utoronto.ca//FIS/MICE/
Chinese Librarianship: an International Electronic Journal, 32. URL: http://www.iclc.us/cliej/cl32SM.pdf
32
Belt, D. (2007). Struggle for the soul of Pakistan. National Geographic. Retrieved January 25,
2009, from: http://ngm.nationalgeographic.com/2007/09/pakistan/don-belt-text.html
Carrizo, L., Sauvageot, C., & Bella, N. (2003). Information tools for the preparation and
monitoring of education plans: Education policies and strategies-5. UNESCO: Paris.
Danish Technological Institute. (2003). Benchmarking education in the information society in
Europe and the US. Retrieved November 1, 2008 from:
http://www.eurosfaire.prd.fr/ist/documents/pdf/4-
Benchmarking_Education_in_the_Information_Society.pdf
de-Alwis, S. M., & Higgins, S. E. (2001). Information as a tool for management decision
making: A case study of Singapore. Information Research, 7(1). Retrieved January 01, 2009
from: http://informationr.net/ir/7-1/paper114.html
Gul, M. (2005). Assessing the needs of educational administrators at college level and
development of a model in Punjab. (Unpublished doctoral dissertation). University Institute of
Education and Research, University of Arid Agriculture, Rawalpindi, Pakistan.
Iqbal, Z. (2008). Information needs and seeking behavior of school teachers and administrators:
A survey of Bahawalpur City. (Unpublished Master‟s thesis). Department of Library and
Information Science, The Islamia University of Bahawalpur, Pakistan.
Khan, S. A. (2008). Information needs and seeking behavior of college teachers and
administrators: A survey of Bahawalpur City. (Unpublished master‟s thesis). Department of
Library and Information Science, The Islamia University of Bahawalpur, Pakistan.
Lucey, T. (1995). Management information systems (7th ed.). London: D. P. Publications.
McCracken, J. D., & Gillespie, W. B. (n.d.). Information needs of local administrators of
vocational education. Columbia: Ohio University.
Schwartz, R. (Ed.). (1997). Meeting the information needs of education policymakers:
Perspectives on education policy research. Washington, DC: U.S. Government Printing Office.
Retrieved June 3, 2009 from:
http://www.eric.ed.gov/ERICWebPortal/search/detailmini.jsp?_nfpb=true&_&ERICExtSearch_
SearchValue_0=ED409635&ERICExtSearch_SearchType_0=no&accno=ED409635
UNESCO. (2006). Developing sub-national Non-Formal Education Management Information
System (NFE-MIS). Retrieved December 29, 2008 from:
http://cms.unescobkk.org/fileadmin/user_upload/aims/NFE-
MIS_Jan2006/Information_needs.pdf
US Bureau of Labor Statistics. (2008). Occupational outlook handbook: Education
administrators. Retrieved March 02, 2008 from: http://www.bls.gov/oco/ocos007.htm
Verma, S. L. (1996). National information system in education: A comparative study. New
Delhi: Concept Publishing.
Chinese Librarianship: an International Electronic Journal, 32. URL: http://www.iclc.us/cliej/cl32SM.pdf
33
Wikipedia. (2009). Cluster sampling. Retrieved June 3, 2009 from:
http://en.wikipedia.org/wiki/Cluster_sampling
World Education Forum. (2000). Dakar framework for action. Retrieved June 3, 2009 from:
http://unesdoc.unesco.org/images/0012/001211/121147e.pdf
Authors:
Farzana Shafique, Lecturer, Department of Library & Information Science, The Islamia
University of Bahawalpur, Pakistan. Email: [email protected]
Khalid Mahmood, Professor, Department of Library & Information Science, University of the
Punjab, Lahore, Pakistan. Email: [email protected]
Submitted to CLIEJ on 3 November 2011.
Copyright © 2011 Farzana Shafique & Khalid Mahmood
Shafique, Farzana; & Mahmood, Khalid. (2011). Availability of need information to educational
administrators in Pakistan: A survey. Chinese Librarianship: an International Electronic
Journal, 31. URL: http://www.iclc.us/cliej/cl32SM.pdf