Embed Size (px)
Citation preview

Available online www.jsaer.com
Journal of Scientific and Engineering Research
84
Journal of Scientific and Engineering Research, 2016, 3(2):84-96
Research Article
ISSN: 2394-2630
CODEN(USA): JSERBR
Optical Studies of Hydroxypropyl Methylcellulose Thin Films Exposed to UV/Ozone
Nabawia A Abdel-Zaher1, Manal TH Moselhey
2, Osiris W Guirguis
3
1Textile Metrology Lab, National Institute for Standards, Giza, Egypt
2Al-Safwa High Institute of Engineering, Cairo, Egypt
3Biophysics Department, Faculty of Science, Cairo University, Giza, Egypt
Abstract Thin films of hydroxypropyl methylcellulose (HPMC) are prepared by solution casting technique and
exposed to UV/ozone for different exposure times. The effect of exposure on the optical properties such as: near
infrared (NIR), transmittance spectra in the spectral region 250–2500 nm of the films are studied. The changes
in the optical parameters including: The CIE tristimulus values, color parameters, absorption coefficient,
absorption edge, band tail width, optical band gap, extinction coefficient and color strength as well as refractive
index, dispersion parameters and optical dielectric constant are determined as a function of UV/ozone exposure
times. The results indicate that, the NIR spectra showed variations in the intensity, area, band width, and the
absorbance values of some bands. These variations mean that there are changes in the molecular configuration
as well as the bond vibration and structure of HPMC as the exposure time increases. It is also noticed from the
data that the variations in the values of band tail and optical band gap with increase the exposure time may be
due to HPMC-induced structural change in the system. In addition, it is recognized that exposure with
UV/ozone plays a role in microstructure and macrostructure change occurring in the polymer matrix.
Keywords HPMC – UV/ozone irradiation - NIR spectroscopy - Color parameters and optical dispersion
properties
Introduction
Biomaterials are a very useful element in improving human health according to their applications includes
diagnostics, therapeutic treatments and emerging regenerative medicine.
Polymers have a wide spectrum of physical, mechanical, and chemical properties. This wide spectrum supported
the extensive research, development, and applications of polymeric biomaterials [1-2].
Hydroxypropyl methylcellulose (HPMC) also commonly known as hypromellose is a cellulose derivative. It
belongs to the group of cellulose ether manufactured by chemical modification of native cellulose. HPMC is off-
white to beige as a powder or granular form. HPMC can be soluble in hot water and in mixed organic solvents
to form non-toxic solutions with excellent transparent film forming capabilities and resistant to oil and lipids [3-
4]. According to the physical and chemical properties of HPMC, many applications in the food, cosmetic, and
pharmaceutical industries are found. HPMC is a coating agent and film-former used as an inactive ingredient in
the pharmaceutical industry [5]. Most novel capsule materials are based on water-soluble cellulose derivates
such as methylcellulose and Hydroxypropyl methycellulose [5]. Also, due to its high viscosity, HPMC is used in
ophthalmic preparations as artificial tears for dry eyes [6]. In addition, HPMC is a material classified as a
Generally Recognized As Safe (GRAS), and is included in the Food and Drug Administration (FDA) Inactive
Ingredients Guide, as well as licensed to be used in medicine and as a food additive in the UK and Europe [7].
UV-irradiation can modify the surface properties of biopolymer film. Exposure to ultraviolet radiation may
cause surface and structural modifications polymeric films as results of photo-oxidation process [8-9]. Also,
exposure of the film surface to ozone (O3) gives rise to surface oxidization as a consequence of O3 formation-
decomposition combined reactions which is also carried out with UV irradiation. After ozone treatment,
degradation phenomenon may arise. This phenomenon is an unwanted one and can be controlled by adjusting

Guirguis OW et al Journal of Scientific and Engineering Research, 2016, 3(2):84-96
Journal of Scientific and Engineering Research
85
the exposure time. Vig (1985) reported that UV/ozone cleaning procedure is an effective method a variety of
contaminants from surfaces [10]. Also, Bolon and Kunz (1972) reported that UV light has the ability to
depolymerize a variety of thin films photoresist polymers [11]. They also recognized that enhanced cleaning
occurred in the presence of ozone when polymer surfaces are exposed the resulting decomposition products
were carbon dioxide and water [11].
In the present work, the effect of UV/ozone exposure with different exposure times (1, 2, 3 and 4 h) is
investigated by performing UV/VIS/NIR analysis on the band structure of HPMC thin films. Variations in the
group coordination in the near-infrared region are detected. In addition, the variations in color parameters,
refractive index and optical dispersion properties of the unexposed and exposed HPMC films are also
examined.
Materials and Methods:
Sample preparation:
Hydroxypropyl methyl cellulose (HPMC; Pharmacoat 606) with MW 133.4 kg/mol is supplied from Shin Etsu
Chemical Co., Japan. Solution-cast method is used to prepare thin transparent films of HPMC [12]. This method
depends on the dissolution weighted amount of HPMC in double distilled water. Complete dissolution is
obtained by using a magnetic stirrer for about 2 h at 50 oC. To form the films (0.01 cm thickness and 10 cm
diameter), the solution was cast onto stainless steel Petri dishes and kept at room temperature (≈ 25 oC) for 7
days until the water completely evaporated. After drying the prepared HPMC films are exposed to UV/ozone
with different exposure times (1, 2, 3 and 4 h) at a distance 20 cm from a high intensity low pressure mercury
lamp without outer envelope - LRF 02971, 220 Volt and 200 Watt, made in Poland and placed in a cubic box of
dimensions 60 x 60 x 60 cm. The samples are measured at room temperature as slabs of dimensions 1 x 4 cm.
UV/VIS/NIR spectroscopic measurements:
The optical transmittance spectra for the prepared HPMC films before and after exposure to UV/ozone are
recorded in the region from 250 to 2500 nm by using a Shimadzu UV/VIS/NIR Double Beam
Spectrophotometer (Japan) with standard illuminant C (1174.83) model V-530, band width 2.0 nm with
accuracy ±0.05% covers the range 200-2500 nm. From the obtained transmittance data, the tristimulus
transmittance values (xt , yt and zt) are calculated according to the CIE Colorimetric System and CIE 1931 2-
degree Standard Observer [13-14]. The CIE three dimensional (L*, U* and V*), color constants (a* and b*),
whiteness index (W), chroma (C*) and hue (H) are also performed [13-15]. The effect of exposure on the
absorption coefficient, absorption edge, band tail, optical band gap, extinction coefficient and color strength of
the prepared films have been determined. The transmittance values are also used for the determination of the
refractive index, dispersion parameters and optical dielectric constant as functions of UV/ozone exposure times.
The recorded data for each composite were an average of three measurements taken from three slabs from the
same film.
Results and Discussions:
NIR spectral analysis:
Fig. 1 and Table 1 illustrate the NIR transmittance spectra and the assignments of the most important bands in
the region from 900 to 2500 nm for unexposed and exposed HPMC films to UV/ozone for different times. As
shown from the figure, there is an observable decrease in the transmittance value for the whole spectrum of the
sample with increasing the exposure time up to 4 h. In addition, variations in the band positions and intensity of
the bands are observed which means that there are changes in the molecular configuration as the exposure time
increases [16-17]. Clear variations are observed in the band areas and band width of the exposed HPMC
samples compared with the unexposed one which reflect the variation in the elastic modulus of the films.

Guirguis OW et al Journal of Scientific and Engineering Research, 2016, 3(2):84-96
Journal of Scientific and Engineering Research
86
Figure 1: Variations in NIR transmittance spectra of unexposed and exposed HPMC films to UV/ozone with
different times.
Table 1: Positions and assignments of the NIR transmittance bands of unexposed and exposed
HPMC films to UV/ozone with different times.
Wavelength (nm)
Assignment
Chemical structure
UV/ozone exposure time (h)
Unexposed 1 2 3 4
2330 2330 2380 2370 2360 C-H deformation +
second overtone cellulose HC=CHCH2
- - 2210 2220 2220 C-H stretching +
C=O stretching
–CHO
2160 2110 - - - C-H stretching +
C=O stretching
–CHO
1970 1985 1985 1985 1990 O-H stretching +
O-H deformation H2O
1800 1860 1880 1870 1880 O-H stretching +
2(C-O) stretching Cellulose
1782 1790 1785 1787 1782 C-H stretching first overtone Cellulose
1700 1751 1775 1750 – C-H stretching first overtone CH2
1641 1640 1636 1635 1650 C–H stretching HC=CH
1376 1373 1370 1373 - C-H stretching 2-C-H
1119 1133 1123 1121 - C-H stretching C-H
1053 1050 1053 1054 - C-O stretching Cellulose
945 945 946 946 - O-H stretching +
O-H deformation
H2O
It is clear from Table 1 that, the band at 2330 nm for unexposed HPMC assigned to C-H deformation + second
overtone cellulose shifted towards higher wavelengths by UV/ozone exposure to 2 h and then returns towards its
original value with increasing the exposure times up to 4 h. The band at 2210 nm assigned to C-H stretching +
C=O stretching appeared for 1 h exposure time and shifted towards higher wavelengths with increasing the
exposure times up to 4 h. The band at 2160 assigned to C-H stretching + C=O stretching shifted towards lower
wavelengths for 1 h exposure time and then disappeared with increasing the exposure times up to 4 h. The bands
at 1970 nm assigned to O-H stretching + O-H deformation and 1880 nm assigned to O-H stretching + 2(C-O)
stretching are shifted towards higher wavelengths by UV/ozone exposure up to 4 h. Nearly, no remarkable
variation is detected for the bands at 1782 nm (assigned to C-H stretching first overtone) and at 1641 nm
(assigned to C–H stretching) with exposure times up to 4 h. The band at 1770 nm assigned to C-H stretching
first overtone shifted towards higher wavelengths by UV/ozone exposure up to 3 h and disappeared with

Guirguis OW et al Journal of Scientific and Engineering Research, 2016, 3(2):84-96
Journal of Scientific and Engineering Research
87
increasing the exposure time to 4 h. The bands at 1376, 1119 nm (assigned to C-H stretching), at 1053 nm
(assigned to C-O stretching) and at 945 nm (assigned to O-H stretching + O-H deformation) indicate no
remarkable variations in their positions with increasing the exposure times up to 3 h and then disappeared when
the sample exposed to 4 h.
UV/VIS spectral analysis:
Optical absorption/transmission spectrum provides information about the band structure and the energy gap in
amorphous and crystalline material. The study of the optical properties in the UV/VIS regions (250-700 nm) can
help in understanding of the electronic structure and optical material [18-19]. From the data obtained of the
transmittance values (Figure 1), the tristimulus transmittance values (xt, yt and zt) of unexposed and exposed
HPMC samples are calculated and plotted as a function of wavelength (400-700 nm) and shown in Figure 2a-c.
It is observed from the figures that, the behaviors of yt , xt and zt of the unexposed and exposed HPMC samples
are similar and no change in their peak positions are detected. Furthermore, xt yt and zt values decrease with
increasing the exposure time up to 4 h. Tables 2 and 3 represent the values of xr, yr and zr and their percentage
changes (Δxt , Δyt and Δzt), respectively, at their peak positions for unexposed and exposed HPMC samples.
Figure 2: Variations in the tristimulus transmittance values: (a) xt, (b) yt and (c) Zt as functions of wavelength
for unexposed and exposed HPMC to UV/ozone with different times.
Table 2: Tristimulus transmittance values (xr, yr and zr) for unexposed and exposed HPMC to UV/ozone with
different times at their peak positions.
UV/ozone exposure time
(h)
xr yr zr
λ = 445 nm λ = 595 nm λ = 555 nm λ = 450 nm
Unexposed 345.257 787.010 858.230 1773.217
1 344.167 783.588 854.290 1767.232
2 316.899 733.349 798.931 1631.434
3 310.887 723.594 786.027 1600.271
4 313.619 710.709 777.755 1610.59
Table 3: Percentage changes in the maximum tristimulus transmittance values for unexposed and exposed
HPMC to UV/ozone with different times.
UV/ozone exposure time
(h)
(Δxt)% (Δxt)% (Δzt)%
λ = 445 nm λ = 595 nm λ = 555 nm λ = 450 nm
Unexposed - - - -
1 0.32 0.43 0.46 0.34
2 8.21 6.82 6.91 8.00
3 9.95 8.06 8.41 9.75
4 9.16 9.70 9.38 9.17
Guirguis OW et al Journal of Scientific and Engineering Research, 2016, 3(2):84-96
Journal of Scientific and Engineering Research
88
From the obtained data in Tables 2 and 3, the observed changes in the tristimulus transmittance values reflect
the damaged sites and change in the molecular configuration which indicates to the formation of new color
centers due to exposure to UV/ozone [17, 20].
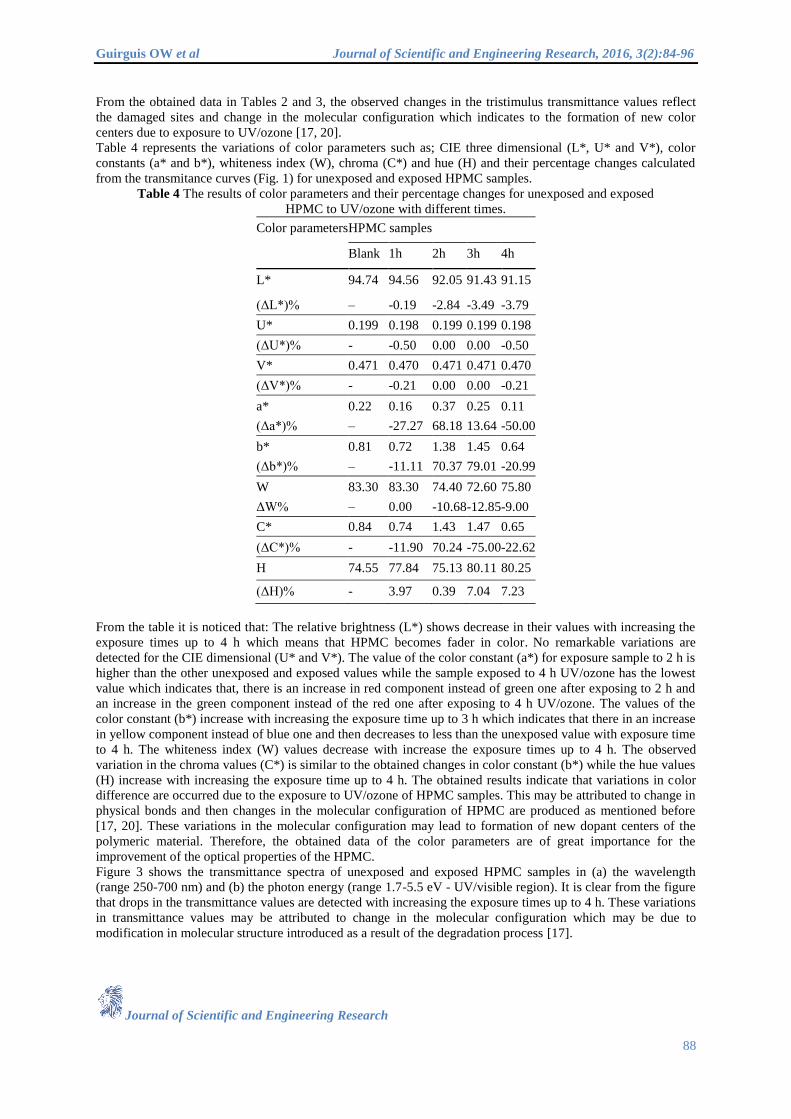
Table 4 represents the variations of color parameters such as; CIE three dimensional (L*, U* and V*), color
constants (a* and b*), whiteness index (W), chroma (C*) and hue (H) and their percentage changes calculated
from the transmitance curves (Fig. 1) for unexposed and exposed HPMC samples.
Table 4 The results of color parameters and their percentage changes for unexposed and exposed
HPMC to UV/ozone with different times.
Color parameters HPMC samples
Blank 1h 2h 3h 4h
L* 94.74 94.56 92.05 91.43 91.15
(ΔL*)% – -0.19 -2.84 -3.49 -3.79
U* 0.199 0.198 0.199 0.199 0.198
(ΔU*)% - -0.50 0.00 0.00 -0.50
V* 0.471 0.470 0.471 0.471 0.470
(ΔV*)% - -0.21 0.00 0.00 -0.21
a* 0.22 0.16 0.37 0.25 0.11
(Δa*)% – -27.27 68.18 13.64 -50.00
b* 0.81 0.72 1.38 1.45 0.64
(Δb*)% – -11.11 70.37 79.01 -20.99
W 83.30 83.30 74.40 72.60 75.80
ΔW% – 0.00 -10.68 -12.85 -9.00
C* 0.84 0.74 1.43 1.47 0.65
(ΔC*)% - -11.90 70.24 -75.00 -22.62
H 74.55 77.84 75.13 80.11 80.25
(ΔH)% - 3.97 0.39 7.04 7.23
From the table it is noticed that: The relative brightness (L*) shows decrease in their values with increasing the
exposure times up to 4 h which means that HPMC becomes fader in color. No remarkable variations are
detected for the CIE dimensional (U* and V*). The value of the color constant (a*) for exposure sample to 2 h is
higher than the other unexposed and exposed values while the sample exposed to 4 h UV/ozone has the lowest
value which indicates that, there is an increase in red component instead of green one after exposing to 2 h and
an increase in the green component instead of the red one after exposing to 4 h UV/ozone. The values of the
color constant (b*) increase with increasing the exposure time up to 3 h which indicates that there in an increase
in yellow component instead of blue one and then decreases to less than the unexposed value with exposure time
to 4 h. The whiteness index (W) values decrease with increase the exposure times up to 4 h. The observed
variation in the chroma values (C*) is similar to the obtained changes in color constant (b*) while the hue values
(H) increase with increasing the exposure time up to 4 h. The obtained results indicate that variations in color
difference are occurred due to the exposure to UV/ozone of HPMC samples. This may be attributed to change in
physical bonds and then changes in the molecular configuration of HPMC are produced as mentioned before
[17, 20]. These variations in the molecular configuration may lead to formation of new dopant centers of the
polymeric material. Therefore, the obtained data of the color parameters are of great importance for the
improvement of the optical properties of the HPMC.
Figure 3 shows the transmittance spectra of unexposed and exposed HPMC samples in (a) the wavelength
(range 250-700 nm) and (b) the photon energy (range 1.7-5.5 eV - UV/visible region). It is clear from the figure
that drops in the transmittance values are detected with increasing the exposure times up to 4 h. These variations
in transmittance values may be attributed to change in the molecular configuration which may be due to
modification in molecular structure introduced as a result of the degradation process [17].

Guirguis OW et al Journal of Scientific and Engineering Research, 2016, 3(2):84-96
Journal of Scientific and Engineering Research
89
Figure 3: Dependence of transmittance spectra on wavelength (a) and photon energy, hν (b) for unexposed and
exposed HPMC to UV/ozone with different times.
The absorption coefficient (α) of the unexposed and exposed HPMC films is calculated according to the relation
[21-23]:
(1) T
R)(1n
d
1 2
d is the thickness of the sample in cm, T and R are the transmittance and reflectance values, respectively. Fig.
4a and b illustrates the relation between the absorption coefficients (α) as a function of wavelength and photon
energy, respectively, for unexposed and exposed HPMC samples. It is clear from the figure that the absorption
coefficient coefficient (α) values increase with increasing the exposure time up to 4 h through the whole
wavelength and/or photon energy ranges. This increase may be attributed to the change of the molecular
configuration which indicates to the formation of new color centers as well as may be due to modification in
molecular structure introduced as a result of the degradation process, as previously mentioned and reported [17,
20].
Figure 4: Plots of absorption coefficient against wavelength (a) and photon energy, hν (b) for unexposed and
exposed HPMC to UV/ozone with different times.
The fundamental absorption edge is one of the most important features of the absorption spectra of crystalline
and amorphous materials. It is clear from Fig. 4b that the absorption coefficient values (α) increases with
increasing photon energy and a straight line relationship is deduced in the high α-region. The values of
absorption edge (Ee) are calculated from the intercept of the extrapolation lines to zero absorption with photon
energy axis and are listed in Table 5. It is clear that Ee values decrease with increasing exposure times up to 3 h

Guirguis OW et al Journal of Scientific and Engineering Research, 2016, 3(2):84-96
Journal of Scientific and Engineering Research
90
and then returns back to the value of the unexposed HPMC sample. This decrease in Ee indicates that exposure
with UV/ozone leads to rupture of the bonds and formation of free radicals.
Table 5: Values of absorption edge (Ee), band tail energy (Eb), direct energy gap (Ed) and
indirect energy gap (Eind) for unexposed and exposed HPMC to UV/ozone with different times.
UV/ozone
exposure time (h)
Ee (eV)
UV-region
Eb (eV) Ed (eV) Eind (eV)
UV-region UV-region Visible-region UV-region Visible-region
Unexposed 3.533 0.984 5.181 4.210 2.166 2.883
1 3.214 1.312 5.587 4.066 2.108 2.376
2 3.133 1.344 4.878 4.016 2.079 2.386
3 2.254 2.364 4.975 3.882 2.022 1.530
4 3.398 1.224 9.091 4.156 1.906 2.676
For the amorphous nature of the polymeric materials, the energy which interpreted the width of the tail localized
states in the normally forbidden band gap is given by applying Urbach relation as [21-23]:
(2) E
hν exp αα
b
o
where αo is a constant, υ is the frequency of radiation and Eb is the band tail energy value for each unexposed
and exposed HPMC samples calculated from the inverse of the slopes of the straight lines represented by ℓn α
against hν (Fig. 5). From the figure, it is clear that, each curve can be divided into two straight lines for each
sample, one of them in the UV region (3.2-5.5 eV) and the other in the visible region (1.7-3.1 eV). These
straight lines suggested that the absorption follows the quadratic relation for inter-band transitions which
verified Urbach rule (Mott and Davis; 1979). The values of band tail energy (Eb) for each region are calculated
and listed in Table 5. The data indicate that, in the UV region, the values of Eb increase with increasing exposure
times up to 3 h followed by a sharp decrease at 4 h exposure time. On the other hand, in the visible region, the
values of Eb indicate irregular change with increases exposure times and maximum variation in the value of Eb
is detected when the HPMC sample exposed to 4 h UV/ozone (i.e., increase by about 75%). From the data, the
regular change (in UV region) and irregular change (in visible region) of Eb may arise from the variation in the
total number available states which caused by UV/ozone according to the compromise between the degradation
and crosslinking processes due to UV/ozone exposure [18-19]. Ion addition, the observed changes in Eb values
may be due to the variation in the internal fields associated with structure disorder in the HPMC matrix [21].
Figure 5: Dependence of ℓn α on hν for unexposed and exposed HPMC samples to
UV/ozone with different times.
The optical energy gap (Eg) of the unexposed and exposed HPMC thin films has been deduced from the
absorption coefficient data as a function of photon energy. According to the accepted Tauc’s model, the power
part which obeys the Tauc [24] and Mott and Davis (1979) [21] is given from the relation as:
αhυ = B (hυ – Eg)n (3)
where B is the slope of Tauc’s edge called the band tail parameter in the range 105 - 10
6 (cm.eV)
-1 and n is the
electronic transition responsible type for absorption, being 1/2 or 2 for allowed direct and allowed indirect
transitions, respectively. Fig. 6a shows the dependence of (αhν)2
on hν in the range 1.7-5.5 eV for unexposed

Guirguis OW et al Journal of Scientific and Engineering Research, 2016, 3(2):84-96
Journal of Scientific and Engineering Research
91
and exposed HPMC samples. The inset of the figure shows the variation of (αhν)2
with hν in the visible region
(1.7-3.1 eV). From the figure and the inset, the values of allowed direct energy gap (Ed) are calculated by
extending the linear parts of the curves to zero absorption and are listed in Table 5. It is observed that, Ed values
in both UV and visible regions decrease with increasing the exposure time up to 4 h. These decreases indicate
that the values of Ed show the dependence on the composite and creation of localized states in the band gap as a
result of exposure to UV/ozone for different times.
Figure 6: Plots of (αhυ)
2 (a) and (αhυ)
½ (b) versus photon energy, hν, for unexposed and exposed HPMC to
UV/ozone with different times.
Figure 6b shows the change of (αhυ)1/2
as a function of hυ for unexposed and exposed HPMC samples. The
allowed indirect energy gap (Eind) values are also deduced by extrapolating the linear parts of the curves to zero
absorption and are tabulated in Table 5. It is observed that the values of Eind decrease with increasing exposure
times up to 3 h and then returns back to the unexposed value with increasing the exposure time to 4 h. It may be
presumed that the obtained decrease in the optical energy gap (direct and/or indirect allowed transitions) may be
due to the change in molecular configuration induced by exposure with UV/ozone which leads to rupture of the
bonds and formation of free radicals and then structural changes in the HPMC system are occurred [16-20].
Extinction coefficient and color strength determinations:
The extinction coefficient (K) presents the properties of the material to light. The extinction coefficient (k) is a
parameter characterizes the photonic material and can be calculated by using the relation [22]:
(4) 4π
αλK
Figure 7 shows the variation in the extinction coefficient (K) with wavelength of unexposed and exposed HPMC
samples. It is clear that, the variation behaviors of K for all samples are similar through the whole wavelength
range (250-700 nm) and their values are found to be small in the order 10-4
. This indicates that the prepared
composites are considered to be insulating materials at room temperature [25]. In addition, the increase in the
extinction coefficient values with increasing the exposure time up to 4 h shows that the fraction of light lost due
to scattering.
The color strength (α/S) of the prepared HPMC films is determined by using Kubelka-Munk equation as [26]:
(5) 2R
R)-(1
S
α 2
where α is the absorption coefficient, S is the scattering coefficient and R is the reflectance value. Figure 8
shows the dependence of the color strength (α/S) on wavelength (λ) for unexposed and exposed HPMC films to
UV/ozone with different times. It is clear from the figure that the values of α/S increase with increasing
wavelength and decrease markedly by increasing the exposure times up to 4 h. The observed decrease in α/S

Guirguis OW et al Journal of Scientific and Engineering Research, 2016, 3(2):84-96
Journal of Scientific and Engineering Research
92
values may be attributed the fact that the exposure HPMC samples give a fade color and structure disorder in the
HPMC matrix which is in agreement with the data of the color parameters.
Figure 7: Dependence of the extinction coefficient,
K, on wavelength, λ, for unexposed and exposed
HPMC to UV/ozone with different times.
Figure 8: Dependence of the color strength, α/S, on
wavelength, λ, for unexposed and exposed HPMC
to UV/ozone with different times.
Optical dispersion parameters analysis:
From the reflectance (R) and extinction coefficient (K) data, the real part of the complex refractive index (n) of
the prepared HPMC films is calculated according to the relation [27]:
(6) KR)(1
4R
R1
R1n 2
2
Figure 9 shows the refractive index distributions of unexposed and exposed HPMC films to UV/ozone with
different times in the visible region. The figure reveals that the values of n of the exposed films increased
markedly with increasing exposure time up to 4 h. Also, n values for each sample decrease with increasing the
wavelength. The increased in the values of n may be caused when the incident light interacts with the exposed
material, the refraction will be higher and hence the refractivity of the films will increase [28]. Such increases in
n may allow these materials to be used as an anti-reflection coating for solar cells, or as high-refractive index
lenses.
Figure 9: The variation of refractive index (n) as a
function of wavelength (λ) for unexposed and
exposed HPMC to UV/ozone with different times.
Figure 10: The dependence of n2 on λ
2 for unexposed
and exposed HPMC to UV/ozone with different times.

Guirguis OW et al Journal of Scientific and Engineering Research, 2016, 3(2):84-96
Journal of Scientific and Engineering Research
93
By plotting the variation of n2 versus λ
2 and according to the dispersion relation [29]:
(7) λ m c π
Neεn 2
*2
2
1
2
The lattice dielectric constant (ε1) and the ratio of carrier concentration to electron effective mass (e2N/πc
2m*)
can be calculated from the intercept and the slope of the straight line parts for unexposed and exposed HPMC
samples (Fig. 10). Table 6 reveals that the values of the lattice dielectric constant (ε1) increase with increasing
the exposure time up to 4 h. In addition, irregular increase in the (e2N/πc
2m*) ratio with increasing the exposure
time is observed. This means that exposure to UV/ozone with different times increases the charge carrier
concentration inside the HPMC matrix.
Table 6 Values of ε1, (e2N/πc
2m*), the energy parameter (Ep), the single oscillator energy (Eo), the long-
wavelength refractive index (n∞), λo is the average inter-band oscillator wavelength (λo) and the average
oscillator strength (So) and their percentage changes for unexposed and exposed HPMC to UV/ozone with
different times.
Dispersion parameters HPMC/Exposure time (h)
Unexposed 1 2 3 4
ε1
Δε1%
5.134
- 5.117
-0.33
7.767
51.29
7.920
54.27 8.468
64.94 (e
2N/πc
2m*) x 10
-6
Δ(e2N/πc
2m*)%
2.125
- 1.663
-21.74
4.257
100.33
3.187
49.98
3.536
66.40
Ep (eV)
ΔEp%
16.819
- 18.953
12.69
25.580
52.09
29.224
73.76 37.739
124.38 Εo (eV)
ΔEo%
5.689
- 6.056
6.05
5.484
-3.60
5.623
-1.16 6.784
19.25 n∞
Δn∞%
2.002
-
2.040
1.90
2.367
18.23
2.452
22.48
2.582
28.97
λo (nm)
Δλo%
212
-
201
-5.19
230
8.49
235
10.85
174
-17.92
So (nm
-2) x 10
-4
ΔSo%
0.669
-
0.783
17.04
0.870
30.04
0.932
39.31
1.868
179.22
Different dispersion parameters such as the energy parameter, Ep (a measure of the strength of inter-band optical
transitions) and the single oscillator energy, Eo (the average excitation energy for electronic transitions) can be
calculated from the change of n with λ on the basis of the model reported by Wemple and DiDomenico (1970)
[30] as:
(8) EE
ν)(h
E
E
1n
1
op
2
p
o
2
Figure 11a shows the variation of (n2-1)
-1 as a function of (hυ)
2 for unexposed and exposed HPMC to UV/ozone
with different times. Ep and Eo values are obtained from the intercept and slope of the linear part from the figure
and are tabulated in Table 6. It is noticed that the energy parameter (Ep) values markedly increase with
increasing the exposure time up to 4 h.
In addition from the change of n with λ, the long-wavelength refractive index (n∞), the average inter-band
oscillator wavelength (λo) and the average oscillator strength (So) are also calculated by the dispersion equation
as [27]:
(9) λ 1n
λ
1n
1
1n
1 2-
2
2
o
22
Figure 11b shows the variation of (n2-1)
-1 as a function of λ
-2 for unexposed and exposed HPMC to UV/ozone
with different times. The parameters n∞, λo, and So [= (n2∞-1)/λ
2o] are obtained from the intercept and the slope
of (n2
- 1)-1
versus λ-2
curves (Fig. 11b). The values of these parameters are given in Table 6. It is noticed from
the data observed in the table that the dispersion parameters of HPMC are remarkably changed by exposure to
UV/ozone with different exposure times.

Guirguis OW et al Journal of Scientific and Engineering Research, 2016, 3(2):84-96
Journal of Scientific and Engineering Research
94
Figure 11: The variation of (n
2-1)
-1 as a function of (hυ)
2 (eV)
2 (a) and λ
-2 (b) for unexposed and exposed HPMC
to UV/ozone with different times.
The real dielectric constant (εreal) and imaginary dielectric constant (εimag.) can be calculated by using the
following relations [31]:
εreal = n2(λ) – K
2(λ) (10)
εimag. = 2 n(λ) K(λ) (11)
Figure 12a, b shows the variation in εreal and εimg. as a function of photon energy (hυ) for unexposed and exposed
HPMC to UV/ozone with different times. It is clear from the figure that the values of εreal and εimg increase with
increasing the exposure time up to 4 h. This variation in the frequency dependence of the optical dielectric
constant due to exposure to UV/ozone gives information about the electronic excitations inside the materials.
Figure 12. The variation in the real value, εreal (a) and the imaginary value, εimg. (b) of the optical dielectric
constant as functions of photon energy (hυ) for unexposed and exposed HPMC to UV/ozone with different times.
Briefly, as previously reported [8,9] exposure to ultraviolet radiation may cause surface and structural
modifications polymeric films as results of photo-oxidation process. Due to this process formation of hydroxyl
and carbonyl groups in UV-irradiated polymers and biopolymers is accompanied. Also, exposure of the film
surface to ozone (O3) gives rise to surface oxidization as a consequence of O3 formation-decomposition
combined reactions which is also carried out with UV irradiation. Therefore, the technique under study can be
employed as pre-treatment after which grafting of certain chemical entities can be accomplished.

Guirguis OW et al Journal of Scientific and Engineering Research, 2016, 3(2):84-96
Journal of Scientific and Engineering Research
95
Conclusion:
From the obtained data, it may conclude that, HPMC samples under investigation exhibit a radiation
sensitization characteristic for each UV/ozone exposure time. In addition, the observed variations in the optical
parameters determined from the transmittance spectra due to exposure to UV/ozone with different exposure
times up to 4 h may be due to the changes occurred in the physical bonds and in the molecular configuration of
HPMC. These variations may lead to formation of new color centers of the polymeric system. In addition, the
results of the optical dispersion parameters are very important to improve the optical properties of HPMC.
Therefore, the changes observed in the color parameters and optical dispersion parameters are mainly depended
on the total quantity of UV/ozone radiation received by the material.
References:
[1]. Dumitriu, S. (1996). Polymeric biomaterials. Marcel Dekker Inc., New York.
[2]. He, W., & Benson R. (2013). Handbook of biopolymers and biodegradable plastics. A
volume in Plastics Design Library, 87–107.
[3]. Hofenk-de Graaff, J. (1981). Central research laboratory for objects of art and science. Gabriel
Metsustroat and 1071 EA: Amsterdam, The Netherlands.
[4]. Greener, I. K., & Fennema, O. (1989). Barrier properties and surface characteristics of edible, bilayer
films. Journal of Food Science, 54(6):1393-1399.
[5]. Lee, C. – Y., Chen, G. – L., Sheu, M. – T., & Liu, C. – H. (2006). Drug release from hydroxypropyl
cellulose and polyethylene oxide capsules: In vitro and in vivo assessment. The Chinese
Pharmaceutical Journal, 58:57-65.
[6]. Herder, J., Adolfsson, Å., & Larsson, A. (2006). Initial studies of water granulation of eight grades of
hypromellose (HPMC). International Journal of Pharmaceutics, 313(1-2):57-65.
[7]. Drozen, M. S., & Hill, D. W. (2006). US food and drug administration-hydroxypropyl methylcellulose
(HPMC) as being generally recognized as safe. Retrived on December 15th
.
[8]. Pocius, A. V. (2002). Adhesion and adhesives technology: An introduction. Hanser: Munich, Germany.
[9]. Sionkowska, A., Skopinska-Wisniewska, J., Planecka, A., & Kozlowska, J. (2010). The influence of
UV irradiation on the properties of chitosan films containing keratin. Polym. Deg. Stab. 95:2486-2491.
[10]. Vig, J. R. (1985). UV/ozone cleaning of surfaces. J. Vac. Sci. Technol. A 3(3):1027-1034.
[11]. Bolon, D. A., & Kunz, C. O. (1972). Ultraviolet depolymerization of photoresist polymers. Polym.
Eng. Sci. 12(2):109-111.
[12]. El-Zaher, N. A., & Osiris, W. G. (2005). Thermal and structural properties of poly(vinyl alcohol)
doped with hydroxypropyl cellulose. Journal of Applied Polymer Science, 96:1914-1923.
[13]. CIE Recommendation on Colorimetry (1986). CIE Publ. No. 15.2. Central Bureau of the CIE, Vienna.
[14]. CIE Recommendation on Uniform color spaces; Color Difference Equations, Psychometric Color
Terms (1971;1978). Suppl. No. 2 of CIE Publ. No. 15 (E-1.3.1), Paris.
[15]. Abd El-Kader, F. H., Gaafer, S. A., & Abd El-Kader, M. F. H. (2014). Characterization and optical
studies of 90/10 (wt/wt%) PVA/b-chitin blend irradiated with γ-rays. Spectrochimica Acta Part A:
Molecular and Biomolecular Spectroscopy 131:564–570
[16]. Lever, A. B. P. (1968). Organic electronic spectroscopy. Elsevier, Amsterdam, Netherland.
[17]. Miller, A. (1994). Handbook of optics. vol. 1, McGraw-Hill, New York, USA.
[18]. Abd El-Kader, F. H., Gafer, S. A., Basha, A. F., Bannan, S. I., & Basha, M. A. F. (2010). Thermal and
optical properties of gelatin/poly(vinyl alcohol) blends. Journal of Applied Polymer Science, 118:413-
420.
[19]. Chikwenze, R. A., & Nnabuchi, M. N. (2010). Effect of deposition medium on the optical and solid
state properties of chemical bath deposited CdSe thin films. Chalcogenide Letters, 7:389-396.
[20]. Osiris W. G., & Moselhey. M. T. H., Optical study of poly(vinyl alcohol)/hydroxypropyl
methylcellulose blends. J. Mater. Sci. 46:5775–5789.
[21]. Mott, N. F., & Davis, E. A. (1979). Electronic processes in non-crystalline materials. Oxford,
Clarendon.
[22]. Tintu, R., Saurav, K., Sulakshna, K., Nampoori, V. P. N., Radhakrishnan, P., & Thomas, S. (2010).
Ge28Se60Sb12/PVA composite films for photonic applications. J. Non-Oxide Glasses, 2:167-174.
[23]. Maradulin, A. A., Montroll, E. W., & G.H.Weiss, G. H. (1963). Theory of lattice dynamics in the
Harmonic Approximation, Academic Press, New York, USA.
[24]. Wood, D. L., & Tauc, J. (1972). Weak absorption tails in amorphous semiconductors. Phys. Rev. B,
5:3144.
[25]. Pankove, J. L. (1975). Optical process in semiconductors. Devers Publication, New York, USA.

Guirguis OW et al Journal of Scientific and Engineering Research, 2016, 3(2):84-96
Journal of Scientific and Engineering Research
96
[26]. Judd, D. B., & Wyszecki, G. (1975). Color in business science and industry. John Wiley & sons, Inc., 3rd
Ed., New York.
[27]. El Sayed, A. M., Diab, H. M., & El-Mallawany, R. (2013). Controlling the dielectric and optical
properties of PVA/PEG polymer blend via e-beam irradiation. J. Polym. Res. 20:1-10.
[28]. El Sayed, A. M., & Morsi, W. M. (2013). Dielectric relaxation and optical properties of polyvinyl
chloride/lead monoxide nanocomposites. Polym. Compos. 34:2031–2039.
[29]. Chahal, R. P., Mahendia, S., Tomar, A. K., & Kumar, S. (2012). γ-Irradiated PVA/Ag nanocomposite
films: Materials for optical applications. Journal of Alloys and Compounds, 538:212-219.
[30]. Wemple, S. H., & DiDomenico, Jr. M. (1970). Behavior of electronic dielectric constant in covalent
and ionic materials. Phys. Rev. B, 3:1338.
[31]. Al-Ghamdi, A. A. (2006). Optical band gap and optical constants in amorphous Se96-xTe4Agx thin
films. Vacuum, 80:400–405.