Embed Size (px)
Citation preview

SHORT-WAVELENGTH TECHNOLOGY AND THE POTENTIAL FOR
DISTRIBUTED NETWORKS OF SMALL RADAR SYSTEMS
Initial Submission: 2 October 2008
First Revision: 12 February 2009
Second Revision: 20 April 2009
David McLaughlina, David Pepynea, V. Chandrasekarb, Brenda Philipsa, James Kurosea, Michael
Zinka, Kelvin Droegemeierc, Sandra Cruz-Pold, Francesc Junyentb, Jerald Brotzgec, David
Westbrooka, Nitin Bharadwajb, Yanting Wangb, Eric Lyonsa, Kurt Hondle, Yuxiang Liub, Eric
Knappa, Ming Xuec, Anthony Hopfa, Kevin Kloeselc, Alfred DeFonzoa, Pavlos Kolliasf, Keith
Brewsterc, Robert Contrerasa, Theodore Djaferisa, Edin Insanica, Stephen Frasiera, Frederick
Carrc
a. University of Massachusetts, Amherst, MA 01003
b. Colorado State University, Fort Collins, CO 80523
c. University of Oklahoma, Norman, OK 73019
d. University of Puerto Rico, Mayagüez, P.R. 00681
e. National Severe Storms Laboratory, Norman, OK 73072
f. McGill University, Montreal, Quebec, Canada, H3A 2K6
* Corresponding author: David Pepyne, Univ. of Massachusetts, 151 Holdsworth Way, Amherst, MA 01003. E-mail: [email protected].

Capsule Summary
A new weather radar concept based on dense networks of small radars defeats the earth curvature
blockage that limits today’s large radars while simultaneously meeting the disparate data needs
multiple end-users.

1
Abstract
Dense networks of short-range radars capable of mapping storms and detecting atmospheric
hazards are described. Comprised of small X-band (9.4-GHz) radars spaced tens of km apart,
these networks defeat the earth curvature blockage that limits today’s long-range weather radars
and enable observing capabilities fundamentally beyond the operational state-of-the-art. These
capabilities include multiple Doppler observations for mapping horizontal wind vectors, sub-km
spatial resolution, and rapid-update (tens of seconds) observations extending from the boundary
layer up to the tops of storms. The small physical size and low power design of these radars
permits the consideration of commercial electronic manufacturing approaches and radar
installation on rooftops, communications towers, and other infrastructure elements, leading to
cost-effective network deployments. The networks can be architected in such a way that the
sampling strategy dynamically responds to changing weather in order to simultaneously
accommodate the data needs of multiple types of end-user. Such networks have the potential to
supplement, or replace, the physically-large long-range civil infrastructure radars in use today.

2
1. Introduction
Long-range microwave radar networks are an important part of the weather forecasting
and warning infrastructure used by many nations today. The observing capabilities of these
networks have improved considerably over the past 60 years as new technologies such as
coherent high-power transmitters, solid state electronics, Doppler and dual-polarization signal
processing, open software architectures and improved data dissemination and display
technologies have been developed and incorporated into the system design. Taking the United
States’ weather radar network as an example, it is generally agreed that the improved
performance and coverage of the WSR-88D (NEXRAD) system, relative to the predecessor
WSR-57 and WSR-74 systems, has led to significant improvement in the short-range forecasting
and warning of severe thunderstorms, tornadoes, and flash floods (Serafin and Wilson, 2000;
NRC, 1995). Despite significant capability and continual improvement, one fundamental
limitation of today’s weather radar networks – all of which are comprised of widely-spaced
radars – is the inability to observe the lower part of the atmosphere owing to the Earth's
curvature and terrain blockage. Continuing with the U.S. example, the radars comprising the
NEXRAD system are spaced ~230 km apart in the eastern U.S. and ~345 km in the western part
of the country. This spacing prevents the system from observing more than 70% of the
troposphere below 1 km altitude above ground level. A 1995 National Research Council study
(NRC, 1995) investigated the adequacy of this network relative to the detection and warning of a
variety of weather phenomena, including landfalling hurricanes, supercells, mesocyclones,
tornado vortices, microbursts, and various types of precipitation, including snowfall. This study
found that the WSR-88D network provides superior forecasting and warning capability
3
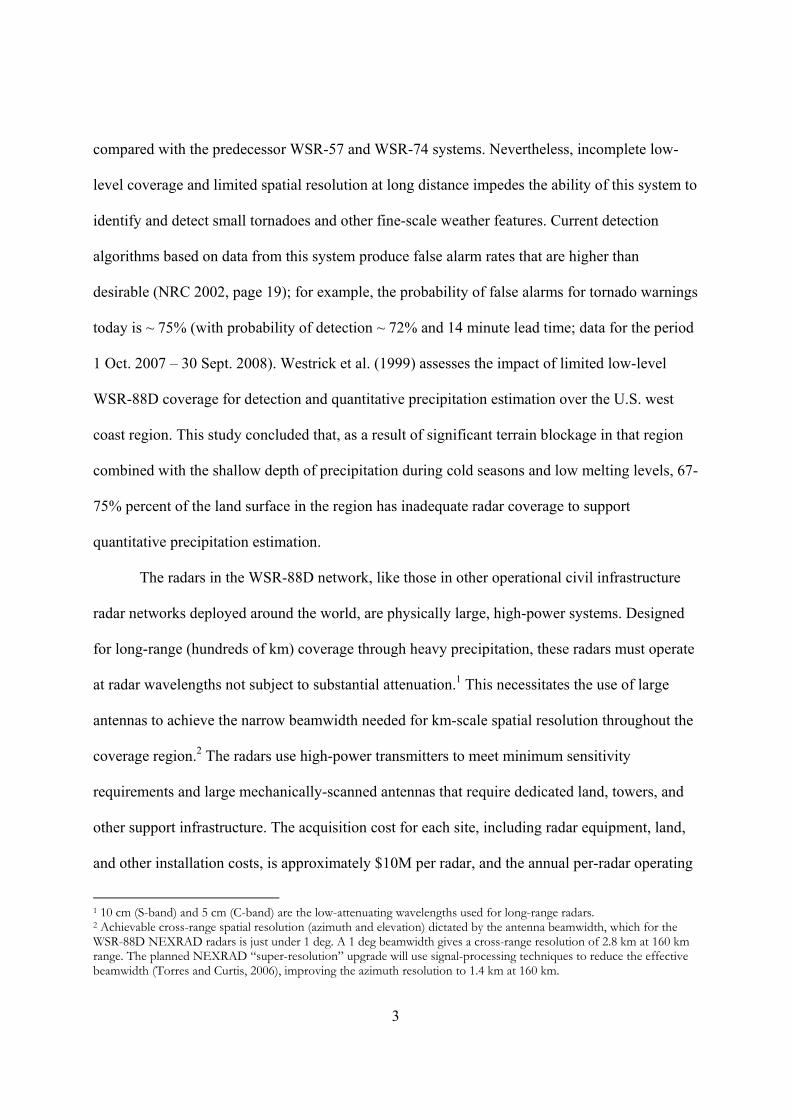
compared with the predecessor WSR-57 and WSR-74 systems. Nevertheless, incomplete low-
level coverage and limited spatial resolution at long distance impedes the ability of this system to
identify and detect small tornadoes and other fine-scale weather features. Current detection
algorithms based on data from this system produce false alarm rates that are higher than
desirable (NRC 2002, page 19); for example, the probability of false alarms for tornado warnings
today is ~ 75% (with probability of detection ~ 72% and 14 minute lead time; data for the period
1 Oct. 2007 – 30 Sept. 2008). Westrick et al. (1999) assesses the impact of limited low-level
WSR-88D coverage for detection and quantitative precipitation estimation over the U.S. west
coast region. This study concluded that, as a result of significant terrain blockage in that region
combined with the shallow depth of precipitation during cold seasons and low melting levels, 67-
75% percent of the land surface in the region has inadequate radar coverage to support
quantitative precipitation estimation.
The radars in the WSR-88D network, like those in other operational civil infrastructure
radar networks deployed around the world, are physically large, high-power systems. Designed
for long-range (hundreds of km) coverage through heavy precipitation, these radars must operate
at radar wavelengths not subject to substantial attenuation.1 This necessitates the use of large
antennas to achieve the narrow beamwidth needed for km-scale spatial resolution throughout the
coverage region.2 The radars use high-power transmitters to meet minimum sensitivity
requirements and large mechanically-scanned antennas that require dedicated land, towers, and
other support infrastructure. The acquisition cost for each site, including radar equipment, land,
and other installation costs, is approximately $10M per radar, and the annual per-radar operating
1 10 cm (S-band) and 5 cm (C-band) are the low-attenuating wavelengths used for long-range radars. 2 Achievable cross-range spatial resolution (azimuth and elevation) dictated by the antenna beamwidth, which for the WSR-88D NEXRAD radars is just under 1 deg. A 1 deg beamwidth gives a cross-range resolution of 2.8 km at 160 km range. The planned NEXRAD “super-resolution” upgrade will use signal-processing techniques to reduce the effective beamwidth (Torres and Curtis, 2006), improving the azimuth resolution to 1.4 km at 160 km.

4
and maintenance cost has been estimated to be $500k (NRC 2008, page 12). The large physical
size of these systems combined with potential environmental impacts limits the availability of
potential sites. Moreover, scanning of the WSR-88D antenna below 0.5 degrees elevation is
prohibited owing to public concerns about radiation safety. Leone et al. (1989) describe the site
selection procedure for the WSR-88D radar installations. The system is jointly owned by the
National Weather Service (NWS), Department of Defense (DoD), and Federal Aviation
Administration (FAA), and each of these agencies established criteria for siting the radars based
on factors including population distribution, climatology, approach and travel directions of
severe weather, locations of airports and airways, and the location of NWS forecast offices and
high-priority military and civilian facilities. The strategy for deploying national radar networks
such as this is to judiciously attempt to site radars where low-altitude coverage is most needed,
while simultaneously minimizing the number of radars in the network as a means of controlling
the life-cycle costs of the system.
The increasing need for improved coverage at low altitudes, particularly in the planetary
boundary layer, is articulated in several recent reports produced by federal agencies and National
Research Council committees (e.g., NRC, 2002; NRC, 2004; NRC, 2008; NRC 2009; OFCM,
2006). These reports reflect the emerging need for improved low-altitude radar coverage to
support numerous applications ranging from improved hazardous weather forecasting and
warning, to wind mapping for fire fighting and tracking airborne toxic release, to monitoring bird
migration, to enhanced support for roadway weather. Beyond weather, the DoD’s Strategy for
Homeland Defense & Civil Support (DoD, 2005, pg. 26) notes, “the nation will need to develop
an advanced capability to replace the current generation of radars to improve tracking and
identification of low-altitude threats.” Such needs cannot be met with networks comprised of

5
long-range radars owing to the fundamental inability of such systems to provide comprehensive
low-altitude coverage.
The National Science Foundation (NSF) Engineering Research Center (ERC) for
Collaborative Adaptive Sensing of the Atmosphere (CASA) is researching a new weather hazard
forecasting and warning technology based on low-cost, dense networks of radars that operate at
short range, communicate with one another and adjust their sensing strategies in direct response
to the evolving weather and to changing user needs (McLaughlin, et al. 2005; Kurose, et al.
2006; Philips et al. 2007). In contrast to the large weather radars in today's operational networks,
such as NEXRAD having 9-meter diameter antennas and radar spacing of hundreds of
kilometers, the antennas in dense networks are expected to be 1-meter in size with the radars
spaced tens of kilometers apart. The small size of these radars allows them to be placed on
existing infrastructure elements such as communication towers and rooftops (Figure 1). The
short range of the radars defeats the earth curvature blockage problem, enabling these networks
to comprehensively map damaging winds and heavy rainfall from the tops of storms down to the
boundary layer beneath the view of today’s networks. In addition to enabling comprehensive
low-altitude observations, short-range operation offers the potential for significant improvements
in resolution and update times compared to today’s state-of-the-art. These improvements, in turn,
enable a better characterization of storm morphology and analysis, offering the potential for
improvements in weather hazard forecasting and warning. In addition to the radars and their
associated hardware and data communication infrastructure, a new generation of meteorological
software is being developed to target the resources in these radars to simultaneously support
emergency managers and government and private industry organizations that need weather data
for making critical decisions.
6
A dense network of ~10,000 such radars would be required to blanket the contiguous
U.S. at 30 km radar spacing. Such radars would require less than 100 W of average transmitter
power, yet they would be capable of mapping storms with < 1 km spatial resolution throughout
the entire troposphere – from the critical low troposphere “gap” region up to the tops of storms.
Such networks thus have the potential to supplement – or perhaps, replace – the large networks
in use today. Blanket deployment of thousands of small radar nodes across an entire nation is but
one of several possible future deployment strategies for this technology. Additional strategies
would potentially include selective deployment of smaller networks in heavy population areas; in
geographic regions particularly prone to wind hazards or flash floods; in valleys within
mountainous regions; or in specific regions where it is particularly important to improve
observation of low-level meteorological phenomena. Cost, maintenance, and reliability issues, as
well as aesthetics and radiation safety concerns motivate the use of small (~1 meter diameter)
antennas and low-power transmitters that could be installed on either low-cost towers or existing
infrastructure elements (such as roof-tops or communication towers)3. The cost to deploy and
operate a dense network will include both the up-front cost of the radars and the recurring costs
to maintain them, buy or rent land and space on towers/rooftops, and provide for data
communication between the radars, operations and control centers, and users. These costs, in
addition to numerous technological and system-level tradeoffs, need to be balanced to ultimately
develop an effective system design.
The CASA Engineering Research Center is a partnership among academic, industrial,
and government participants (www.casa.umass.edu). The center aims to lay the fundamental and
technological foundations for dense, adaptive radar networks, conduct proof-of-concept
3 The average equivalent isotropic radiated power (EIRP) of such radars would be 48 dBW, compared to 76 dBW for the WSR-88D radars. Given the FCC’s 1.0 mW/cm2 microwave radiation safety specification, such small radars are radiation-safe at ranges beyond 20 m, whereas WSR-88D radiation safety begins at 530 m.

7
demonstrations using field-scale testbeds deployed in hazard-prone areas, and ultimately
transition the concepts and technologies into practice through commercialization and technology
transfer mechanisms. Projects undertaken within the center include the design and fabrication of
low-power solid state radars, new hazard detection algorithms that make use of the data, and the
creation of an open system software architecture for organizing hardware and software
components and interfacing to multiple groups of data users. The first testbed, comprising a
network of four small radars, was installed during winter/spring 2006 on telecommunication
towers in southwest Oklahoma in a region frequented by tornadoes and severe thunderstorms. A
user group comprised of emergency managers and public and private sector weather forecasters
is included in the CASA team and is participating in the design and testing of the system.
This paper discusses key system-level tradeoffs associated with this new approach to
weather radar network design and documents key aspects of CASA’s first testbed deployment as
a proof-of-concept. As background, we begin in Section 2 by characterizing the low-altitude
“sensing gap” that limits the coverage of any network comprised of widely spaced radars, and we
show how a dense network of closely-spaced radars overcomes this limitation. Placing radars
close together (a few tens of km apart), and operating them as a network substantially reduces
the radar physical size and transmitted power compared to today’s weather radar designs. In
Section 3 we describe the tradeoffs related to choice of wavelength, antenna size, power level,
and radar spacing for this concept. Section 4 presents results from CASA’s Oklahoma testbed
network and highlights the collaborative, adaptive radar coordination system developed to
support networked X-band radar operation. The approach to weather radar described in this
paper is still being matured, and while the Oklahoma testbed trials look promising, additional
work needs to be done to prove that this concept can be realized efficiently and effectively as a

8
new technology. Accordingly, Section 5 addresses cost issues, mentions some potential
shortcoming of this approach, and discusses open issues that need to be further investigated.
Pointers are also given to publications in the literature that describe aspects of this concept in
greater detail. This paper concludes with Section 6.
2. Sensing Gap
Figures 2a and 2b show NEXRAD coverage at altitudes of 3 km (~10,000 ft) and 1 km
(~3200 ft) above ground level (AGL), respectively (data courtesy I. Graffman,
NOAA/NWS/OST; see also Maddox et al. 2002). Coverage at 3 km altitude is comprehensive
east of the Rocky Mountains where the spacing between radars is ~230 km. In the western part
of the country, where the representative spacing between radars is ~345 km, coverage gaps exist
as a result of both earth curvature blockage and terrain blockage (NRC, 1995). Coverage is poor
at 1 km altitude throughout the entire CONUS except in those regions in close proximity to the
radar antennas.
The only way to provide more comprehensive coverage of the lower troposphere (e.g., <
3 km AGL) is to decrease the spacing between the radars. Figure 3 plots the percentage of the
volume in a thin layer above ground level covered versus radar spacing for different altitudes
(solid curves).4 Also plotted is the number of radars needed for blanket CONUS coverage versus
radar spacing (dashed line). The vertical bars in the figure at 230 km and 345 km are the two
representative NEXRAD spacings discussed above. As shown in the plots, decreasing the
spacing between the radars increases the low-altitude coverage (solid lines tending to increase
toward 100% with decreasing radar separation); the blockage due to the earth’s curvature is
4 The curves are idealized, smooth earth approximations. The plots assume a lowest beam tilt angle of 0.5 deg; the minimum tilt angle for a NEXRAD radar. Increasing the minimum tilt angle shifts the curves to the left; the 0.9 deg minimum beam tilt angle for the radars in the CASA testbed network discussed in Section 3, for example, shift the breakpoint in the 300 m curve from ~50 km to ~30 km.

9
“defeated” when the radar spacing is reduced to ~50 km or less. The next section discusses the
radar engineering tradeoffs that motivate consideration of small X-band radars spaced ~30 km
apart, a spacing at which, as shown in Figure 3, ~10,000 radars would be required for complete
CONUS coverage. The beamwidth for these radars will be about 1.8 degrees. As shown in
Figure 4, the entire beam of such a radar at its lowest tilt of 0.9 degrees is below 1 km. The
center of the beam is 0.5 km above ground level at 30 km; the worst-case beam height is lower
than this value when the radars are operated in a network as we describe in Section 4.
3. Short-Wavelength Engineering Design Tradeoffs
Cost-effective deployment of dense networks comprised of large numbers of radars
requires that the acquisition, deployment, and recurring costs be substantially smaller than the
per-radar costs of today’s high-power radar designs. Rather than acquiring acre-sized land plots
and deploying large towers to accommodate megawatt-class transmitters and 12-meter radomes,
dense networks will require deployment on small towers having small land footprints or the
utilization of existing infrastructure elements, such as rooftops, sides of buildings and
communication towers. This requires that the radars be physically small and that the radiated
power levels be low enough so as not to pose an actual or perceived radiation safety hazard.
A reasonable size for unobtrusive equipment deployment on existing infrastructure
elements is an antenna aperture of 1-meter. The aperture size (d) limits the resolution achieved
by a radar according to the relationship,
resolution (km) = beamwidth (radians) range (km) (1)
where,
beamwidth ≈ / d (2)
Operating a radar having a 1-meter antenna at S-Band ( = 10 cm), the frequency of the WSR-

10
88D NEXRAD system, results in a beamwidth of 5.7 degrees, which corresponds to a 3 km
spatial resolution at 30 km range5. However, sub-km scale weather features such as tornadoes
cannot be resolved at this coarse resolution. By going to a shorter wavelength, the resolution can
be improved. Operating the same 1-meter antenna at a wavelength of approximately 3 cm (X-
band) reduces the beamwidth to 1.8 degrees for a spatial resolution of 1 km at 30 km range.6
Short-wavelength (X-band) operation has the benefit of attaining high spatial resolution
with a smaller size aperture. Short-wavelength ( ~ 3 cm) operation also takes advantage of
enhanced Rayleigh/Mie scattering from hydrometeors, but at a cost of increased attenuation in
the presence of precipitation. Table 1 provides a comparison of attenuation at S-band to
attenuation at the shorter X-band wavelengths (calculated as in Doviak & Zrnic, 1993, pg. 42).
The large X-band attenuation values shown here preclude use of X-band for long-range radar
designs, but it is practical to build an adequate margin for attenuation into the radar design when
operating at tens of km range. Willie et al. (2006) estimated the actual attenuation that would be
experienced as a function of range for X-band radars viewing springtime rainstorms in
Oklahoma with results shown in Figure 5. Note that the data in the figure only include data
collected during rainstorms. In particular, the curves show that radars designed for 30 km
maximum range will experience two-way attenuation less than 16 dB for 90% of springtime
rainstorms in Oklahoma.7 The corresponding 90% value for radars designed for 60 km maximum
range is 7 dB higher, at 23 dB. Such an analysis drives consideration of shorter (i.e., moving to
5 The important figure-of-merit here is the resolution achieved in the cross-range (i.e., azimuth or elevation) direction, since this is the attribute of a radar’s spatial resolution that is limited by the physical size of the antenna. Achieving high spatial resolution in the range direction is a relatively simple matter to achieve using modest radar receiver bandwidths. 6 Signal-processing techniques similar to those being proposed for NEXRAD “super-resolution” (Torres and Curtis, 2006) can be applied to sharpen this resolution even further. 7 The springtime is referred to as Oklahoma’s “tornado season”, with the majority of tornados occurring between March and May.

11
the left in Figure 5) rather than longer (i.e., moving to the right in the figure) separations and 30
km has been selected by the CASA project as a starting point for radar design.
Figure 6 combines the attenuation information of Figure 5 with the other variables
needed to perform a standard radar range equation analysis to estimate the measurement
sensitivity for radars deployed in networks with 30 km spacing as a function of radar transmitter
power. The three curves describe the sensitivity that would be obtained at 30 km range under
clear-air conditions (lowest curve; no attenuation) and during precipitation (middle and upper
curves; attenuation data from Figure 5). The horizontal axis depicts average transmitted power
levels ranging from several hundred milliwatts through 10W, through 100W. As a point of
reference, 10W represents the average power emitted by a moderate-power magnetron
transmitter. Such transmitters are small devices (approximately the size of a fist or a human
heart) that cost under $1000. 100 W represents an estimate of the power level that could be
achieved using a low-cost phased array panel. Absent attenuation, the sensitivity at 30 km
depicted in Figure 6 ranges between 10 dBZ and 0 dBZ for transmitter power levels between
10W and 100W, respectively.
4. Networked Operation
In current operational weather radar networks, radar coverage is non-overlapping (except
at high altitudes) and the radars are operated largely independently of one another, repeatedly
scanning the entire volume around the radar in a “sit-and-spin” fashion. In contrast, an essential
feature of the short-range radars in the dense networks envisioned and described in this paper is
to arrange them to have full overlapping coverage so that every location in the network is visible
to multiple radars. This requires setting the maximum range of the radars approximately equal to

12
the spacing between the radars8. This permits the use of a radar control architecture that
coordinates the beam scanning of the radars in the network both collaboratively – to obtain
simultaneous views of a region for data fusion based algorithms such a multiple-Doppler wind
field retrievals (discussed in this section) and network based attenuation correction (see Section
5) – and adaptively to optimize where and how the space over the network is scanned based on
the type of weather occurring there and the data product needs of the system’s users. The result
of this collaborative adaptive sensing approach is network level performance that exceeds the
capabilities of its component radars in terms of update rate on key weather features, minimum
beam height, spatial resolution, sensitivity, attenuation tolerance, and ability to support multiple
users and multiple applications. Such network advantages – examples of which are demonstrated
in this section – decrease the design requirements on the individual radars that make up the
network. That is, key radar size and cost drivers, such as the antenna size and the peak
transmitter power needed to achieve a particular level of resolution or sensitivity, are lower than
they would need to be if the radars were not part of a collaborative, adaptive network. This
concept, which CASA has implemented as a “Meteorological Command and Control” (MCC)
software architecture in its “IP1” (Integrative Project #1) demonstration network in Oklahoma, is
one of the core enabling technologies behind the dense network approach. This section motivates
the collaborative, adaptive sensing concept of radar operations, describes the IP1 demonstration
network, and gives some examples from the network to illustrate the potential advantages of the
dense network collaborative, adaptive sensing approach.
8 Covering the cone-of-silence above a radar requires that the maximum range be set slightly higher than the radar spacing. This is described in greater detail in (McLaughlin et al. 2007). This spacing rule is satisfied by the WSR-88D network in the eastern part of the CONUS, enabling that system to achieve a degree of overlapping coverage at higher altitudes (e.g., > 3 km).

13
a. Collaborative, Adaptive Sensing
Under a traditional sit-and-spin concept-of-radar-operations, the update rate is the same
for all locations covered by the radar network. As the number of elevation angles required to
cover the volume of interest increases, however, this update rate can become unacceptably long.9
On the other hand, it is not necessary to scan all meteorological phenomena at same update rate
or in the same way. Powerful supercells within which circulations are rapidly forming and
dissipating should be sampled at a much higher rate and with a different scan strategy than, for
example, a large-scale, slow-moving stratiform rain event. Working with users of weather radar
data – National Weather Service forecasters, emergency managers, and a variety of subject
matter experts – CASA has identified update rates and scan strategies for different types of
weather phenomena (Philips et al. 2008). To execute these user defined scan strategies the MCC
in the IP1 demonstration network employs a concept-of-radar-operations based on targeted
sector scanning. That is, instead of the radars sitting-and-spinning, the radars perform back-and-
forth, bottom to top raster scans of selected sub-volumes of the network at update rates that
depend on the weather features detected in the volumes. Through such a time-space adaptive,
targeted sector-scanning approach the network achieves update rates on the order of 1-minute of
those weather features that the system’s users have indicated are most important to their data
needs. In addition, by optimally selecting which radar(s) are used to scan a given sub-volume,
the MCC is able to achieve a network-level performance that is better than that of the individual
radars that make up the network. In particular, for the IP1 demonstration network where the
radars are arranged approximately as equilateral triangles of 30 km on a side (as will be
9 In general, the shorter the operating-range of a radar, the larger the number of elevation angles required to meet a given coverage ceiling requirement. For example, for volume coverage up to 21 km (the coverage ceiling requirement for the current NEXRAD system) the radars in a dense network with 30 km radar spacing would have to cycle through nearly 30 elevation angles. NEXRAD, in contrast, cycles through no more than 14 elevation angles for sit-and-spin volume update rates of between 4 and 5 minutes.
14
described shortly), a simple “choose the closest radar” strategy means that no point in the
network is farther than ~ 18 km from a radar.10 For range dependent performance metrics such as
minimum beam height above ground level and spatial resolution this leads to a network
improvement factor of approximately 40% over the performance at 30 km. Thus, radars whose
beam center and spatial resolution at 30 km are 500 m and 1 km, respectively, achieve beam
floor and spatial resolution levels no more than 300 m and 600 m, respectively in a network. For
performance metrics that depend on the square of the range such as sensitivity, the network
improvement is nearly 65%, or 4.4 dB. Thus, radars having 10 dBZ sensitivity at 30 km achieve
worst-case sensitivity of no more than 6.6 dBZ under networked operation. For the case where
the closest radar might be attenuated, e.g., due to severe radome wetting or due to intense
precipitation between the closest radar and the volume of interest (recall Table 1), a “choose the
least attenuated radar” strategy can be used. The network advantage under such a strategy can be
a dramatic reduction in the path attenuation a radar needs to overcome. The study in
(Chandrasekar et al. 2009b) shows a reduction in the 90% attenuation margin of almost 10 dB
under networked operation.11 In addition to the advantages above, by choosing multiple radars to
simultaneously scan a common volume one obtains the additional advantage of being able to
extract data products not easily or as accurately obtained from single radar measurements, such
as the simultaneous measurement of several linearly independent components of the wind for 2-
and 3-D wind field estimation (multiple-Doppler wind field retrieval), or the estimation of
reflectivity from multiple observations of a common volume along differently attenuated paths
(Chandrasekar and Lim, 2008). The targeted sector scan approach used by the IP1 MCC is 10 18 km is the distance to the center of an equilateral triangle with side lengths equal to 30 km. 11 Technically, the range related performance improvements hold for all points in the network except the fraction of its volume due to the cone-of-silence above each radar. Here overlap is sufficient for a neighbor to cover this region, but there will be no range related network improvement over a radar’s baseline performance at a range equal to the spacing of the radars in the network. However, even for the cone-of-silence regions there can be a reduction in “effective” attenuation and improvement in velocity vector accuracy with judicious choice of which radar(s) perform the scan.

15
discussed in more detail below. For more rigorous treatments of the principles and advantages
network based sensing cf (Junyent and Chandrasekar, 2009; Chandrasekar et al. 2004;
Chandrasekar and Jayasumana, 2001; Insanic and Siqueira, 2008).
b. Demonstration Network
To investigate the dense network paradigm and collaborative adaptive sensing concept,
the participants of the CASA project designed, fabricated, and deployed a four-radar testbed in
Oklahoma. This IP1 demonstration network covers a 7,000 square km region in southwestern
Oklahoma that receives an average of 4 tornado warnings and 53 thunderstorm warnings per year
(Brotzge, 2006). The radars are spaced approximately 30 km apart and arranged in a topology
consisting of back-to-back equilateral triangles, an arrangement chosen because it maximizes the
volume of atmosphere around the network satisfying the conditions for dual-Doppler velocity
vector retrievals (Brewster et al. 2005). The maximum ranges of the radars are set to 40 km to
provide the overlapping coverage needed for multiple radar measurements and collaborative,
adaptive scanning experiments, including the ability of a radar to cover the cone-of-silence of
each of its neighbors. Figure 7 shows the radars in the IP1 testbed along with their coverage
range rings. Also shown in the figure are the two nearest NEXRAD radars, KFDR at Frederick to
the southwest and KTLX at Twin Lakes to the northeast. The range rings around these radars at
40 km and 60 km respectively show that the IP1 network is essentially midway between these
two radars in the low-level coverage gap between them. From a larger network perspective, IP1
represents two unit deployment cells in the sense that deployment of larger numbers of radars
covering larger spatial domains would be made by replicating the triangular topology shown in
Figure 7.

16
Figure 8 shows the architecture and major subcomponents of the individual radars in the
network (Junyent, 2007; Junyent et al. 2005). These radars are small-size (1.2 m parabolic dish
antenna), short-wavelength (3.2 cm, 9.41 GHz, X-band) units. Using low-power magnetron
transmitters (10 kW peak, 13 W average12), they have a single-pulse sensitivity of 10.8 dBZh at
30 km. The radars provide dual-polarization capabilities (simultaneous linear horizontal and
vertical) (Bringi and Chandrasekar, 2001) with a dual-polarized waveguide/antenna feedhorn
assembly and dual-channel coherent-on-receive receiver/data acquisition system (Khasgiwale et
al. 2005). To facilitate targeted sector scanning, the radars sit atop a high performance pedestal
assembly capable of high accelerations and rapid back-and-forth PPI (plan-position indicator)
sector scanning. A linear actuator attached directly to the antenna provides movement in
elevation, including an ability for rapid RHI (range-height indicator) scans. Except for replacing
broken parts, the radars can be monitored, maintained, and operated remotely over the Internet.
All data transfer from the radars is also by Internet links. For perspective, Table 2 compares an
IP1 node to a WSR-88D NEXRAD node. CASA’s costs to build and operate this network are
discussed Section 5 of this paper.
Running in a UNIX based computer at each radar is an integrated suite of algorithms for
signal processing (short-wavelength range-velocity ambiguity mitigation and attenuation
correction, low-level clutter suppression) and polarimetric meteorological moment data
estimation (Cho et al. 2005). Table 3 lists the data products generated by the IP1 radars. For
velocity ambiguity mitigation, a dual-PRF waveform unfolds Doppler velocities up to 38 m/s
(Bharadwaj and Chandrasekar, 2005). For range ambiguity mitigation, an algorithm based on the
random phase coding naturally provided by the magnetrons (Siggia, 1983) suppresses up to 20
12 This is the total radiated power. The IP1 radars are SHV dual-pol radars putting out 5.0 kW peak power per polarization. The duty cycle of the IP1 radars for its dual-PRF “storm” waveform is 0.13%, or 6.5 kW average radiated power per-polarization.

17
dB of overlaid echoes (Bharadwaj and Chandrasekar, 2007). The algorithms for clutter
suppression and attenuation correction are discussed in Section 5. Figure 9 from the IP1 radar at
Cyril (KCYR) shows the dual-polarization products reflectivity (Zh), differential reflectivity
(Zdr), differential phase (dp), and correlation coefficient (hv) resulting after ambiguity
mitigation, clutter suppression, and attenuation correction.
c. Meteorological Command and Control
Collaborative, adaptive sensing in the IP1 network is accomplished using a
Meteorological Command and Control (MCC) software architecture. As shown in Figure 10, this
architecture “closes-the-loop” between sensing and radar control; the top part of the loop
corresponds to data ingest, the bottom part of the loop corresponds to radar control. To explain,
we walk through the five major steps listed in the figure. The first step is the ingest of the data
products from the four radars into a data repository. This involves sending the data products
produced by the IP1 radars in the field, over the Internet, to a System Operation and Control
Center (SOCC)13. The SOCC performs functions of archival and real-time dissemination of data
to users. In addition, as data arrives at the SOCC, weather detection algorithms in Step 2 are run
on it in real-time to identify the locations of significant weather features within the radar network
domain. For IP1 these currently include algorithms for reflectivity contouring, storm cell
identification, and circulation detection. In Step 3, the detections from the weather detection
algorithms are posted in a feature repository. While Figure 10 only shows data coming from the
IP1 radars, the feature repository can accept detections from other sources, including, for
example, NEXRAD or manually entered storm-spotter reports. The process of radar control
begins in Step 4, where the detected weather features are converted into abstractions called tasks.
13 The SOCC can physically be located wherever there is an adequate network connection. The IP1 system is typically operated from a SOCC installed in an office in the National Weather Center in Norman, OK.

18
In simple terms, a task is a sub-volume of the atmosphere identifying where significant weather
features are located within the network coverage domain, a classification as to whether or not the
feature is associated with strong winds or high reflectivity, and a user assigned value indicating
how important it is to scan the task within the next minute. Since there are generally many tasks
(i.e., many weather features of potential interest) in the network at any time, an optimization
process in Step 5 applies a scanning strategy that is a combination of the “pick closest radar/pick
least attenuated radar” discussed previously, trading off factors such as the sector sizes to be
scanned (in azimuth and elevation) against closeness, signal-to-noise ratio (SNR), the number of
tasks to be scanned, the past history of scans, and the values assigned to the tasks by the users of
the system (Pepyne et al. 2008; Zink et al. 2008b). The actual commands output from the MCC
to the radars are described next.
d. Performance Examples
Since the first multi-radar data was ingested from the IP1 network on 9 May 2006,
several terabytes of data has been collected and analyzed. This includes evaluation by NWS
forecasters in the NOAA Hazardous Weather Testbed at the National Weather Center in Norman
OK during two Oklahoma spring storm seasons (2007 and 2008). For these experiments, the
MCC operated as follows: Scanning was divided into 1-minute intervals (referred to as MCC
“heartbeats”). During each such 1-minute heartbeat, each radar performed a low-level 360 PPI
surveillance sweep at 2 degrees (20 sec) followed by a multiple elevation PPI sector scan
targeted on one or more important meteorological phenomenon (40 seconds)14. The orientation
and width of the sector in azimuth was determined by the MCC optimization (Step 5 in Figure
10) to cover the meteorological features of interest to the users, while the number of elevations
14 Peroidically the radars also do a 10 second RHI scan for storm vertical cross-section analysis and storm top finding. When an RHI is performed, the time for PPI sector scanning is reduced from 40 to 30 seconds.
19
scanned within the sector varied with the width of the sector. For example, a 60-degree sector
included 7 elevations, while a 180-degree sector included only 4 elevations. The elevation angles
used were 1, 3, 5, 7, 9, and 11 degrees for coverage from less than 600 m to more than 10 km
above ground level. Figure 11 illustrates this combined surveillance and multiple-elevation
sector scan strategy. The right side of the figure shows a merged composite reflectivity product
of surveillance scans taken of a rapidly evolving supercell with an appendage from an April 10,
2007 severe weather event.15 The left side of the figure shows a multiple-elevation sector scan
targeted on the appendage, revealing the details of its vertical structure. Both the merged image
and the multiple-elevation sector scans can be viewed simultaneously and both are updated each
minute as the MCC optimizes radar scans in real-time. The high resolution and fast updates
offered by a dense network are illustrated in Figure 12, which compares observations of a hook
echo from the IP1 radar at Lawton to observations of the same event from the nearest NEXRAD
radar at Fredrick (KFDR). The short-range operation and narrow sector scanning detects fine
scale features at 200 m altitude that are not visible in the WSR-88D observations and the targeted
sector scanning offers update rates 5 times faster on the important weather features (Brotzge et
al. 2008). For scanning those volumes of the network visible to multiple-radars, the IP1 MCC
was designed with a scan optimizer for properly coordinating multiple radars to generate multi-
Doppler scans of detected storm cells for multi-Doppler wind field retrieval (Wang et al. 2008).
Figure 13 shows examples of the resulting wind vector products from the system; algorithms for
generating similar wind-vectors in near real-time are being tested (Gao et al. 2008).
Space constraints have only allowed us to illustrate a few examples of the advantages
provided by the dense network and collaborative adaptive sensing concepts, but it is becoming
clear that the dense network concept is demonstrating performance that goes well beyond the 15 For this appendage CASA has visual confirmation of a funnel cloud from a television station storm spotter video.

20
current NEXRAD operational state of the art in terms of temporal and spatial resolution, low-
altitude coverage, and ability to observe Doppler wind vector fields. A movie showing the IP1
MCC in action can be found at the CASA website (http://casa.umass.edu/).
5. Open Issues
This section considers cost and phased-array technology for small radars. We also discuss
some potential limitations of the small radar network approach, and we summarize some of the
ongoing research projects aimed at maturing the concept.
a. Cost
Radars can be purchased today at prices ranging from $200 for automobile collision
radar, to $2k-$20k for marine navigation radars, to $1M - $10M for large weather radars, to
costs in excess of hundreds of millions of dollars for the high-performance radars developed for
complex missions in defense and other applications. The cost of a radar is driven both by the
volume of radars manufactured and the required performance. The small radars considered for
dense networks transmit < 100 W average microwave power. From the point of view of
transmitted power this puts them in the same performance category as the marine radars at the
lower end of the price range, and if an opportunity develops to manufacture them in the large
numbers envisioned in this paper, we anticipate the price to be in $200k range16. While this
number is admittedly speculative, CASA’s costs to build, install, and operate the radars in the
IP1 testbed serves as a useful first data-point in projecting costs for this new class of radar. The
IP1 radars were designed and fabricated by CASA’s academic participants during 2004-2005
using a combination of off-the-shelf and custom-made components (Junyent, 2007; Khasgiwale
16 $200k is a cost target set by the participants of the CASA project based on both a technology costing exercise and the following calculation: The 156 radar NEXRAD system cost $1.56 billion to deploy between 1990 and 1997 (OFCM, 2006); assuming a $2 billion cost to acquire and deploy 10,000 radars for use in a nationwide “blanket deployment” across the CONUS, the per-radar cost would need to be $200k.
21
et al. 2005). The total parts-cost of the transceiver, antenna, computers, and data acquisition
system for these dual-polarized, coherent-on-receive radars was $78k. The total parts-cost, listed
in Table 4, for all components in a complete installation, including the towers, concrete,
radomes, environmental and power conditioning, and high-speed antenna positioners was
$229,50017. With two years of operating experience, CASA’s annual operations and maintenance
costs, also listed in Table 4, for each radar is $26k. Several caveats are noted: the IP1 radars
were developed by an academic team for use as an experimental research facility, and cost-
containment was not a strong design driver in realizing this system; these numbers reflect parts-
costs only, and they exclude labor and other costs associated with manufacturing and selling
commercial products; moreover these represent low volume costs, given that the CASA project
produced only four radars for this testbed.
b. Phased Array Radars
Phased arrays are a key enabling technology in many radars produced for defense
applications today, and they are a desirable technology for use in dense radar networks since they
do not require maintenance of moving parts, they permit flexibility in beam steering without
requiring heavy antenna pedestals such as those used in the CASA IP1 design, and they are more
robust with respect to component failure.18 Moreover, phased arrays can potentially be mounted
to the sides of towers and buildings as shown in Figure 14 giving flexibility in the selection of
suitable radar sites.
17 One of the four radar installations cost $80k more than this figure, owing to the construction of a taller, larger capacity tower. 18 Radar uptime for the 7-week 2007 spring storm season was 93%. For the 9-week 2008, the uptime percentage was 94%. In fact our biggest reliability problems with IP1 have been with the magnetrons and associated modulator boards, both single point failures. We admit that this is partially a result of our pushing the capabilities of these low cost transmitters with dual-PRF waveforms and so on, but it also points to the desirability of solid-state radars with their property of “graceful degradation” with array element failure.

22
A particular challenge to realizing cost-effective dense networks comprised of thousands
of phased-array radars will be to achieve a design that can be volume manufactured for $50K
per phased-array panel (assuming 4 panels per site and assuming each panel is a self-contained
using containing the antenna elements and radar transceivers as well as computers for beam
steering, data acquisition, and signal processing, communication interfaces and power
conditioning electronics). Establishing the specifications for these arrays is currently a work-in-
progress (e.g., McLaughlin et al. 2007); however several key parameters can be stated as listed in
Table 5.
Several thousand transmit/receive (T/R) modules are needed to obtain a phased array
capable of electronically steering a 2-degree beam in two dimensions over the desired scan range
without requiring moving parts. Realizing such an antenna requires the use of low-cost
microwave semiconductors combined with very low-cost packaging, fabrication and assembly
techniques. Puzella and Alm (2007) and Sarcione et al. (2008) describe an architecture and
prototype of a phased array with these characteristics being developed by Raytheon based on
manufacturing processes similar to those for making low-cost computer boards. Another
approach to realizing these panels is to perform electronic beam steering in the azimuth direction
while mechanically steering (tilting) the antenna in the elevation direction. Salazar et al. (2008)
describe a prototype version of such an antenna being developed within the CASA center. Since
electronic beam steering is only needed in the azimuth direction, the individual panels in this
design require only 64 1-Watt T/R modules, each of which is estimated to cost $500, which,
when realized, is expected to result in a cost of less than $50k per panel (McLaughlin, 2008).

23
c. Potential Limitations
While this paper argues that dense networks of small radars have the potential to
supplement, or perhaps replace, large radars, it is recognized that the concept proposed here is
still a research work-in-progress, and it may ultimately not prove feasible to do all the types of
measurements that large radars can perform. Two specific examples where large radars will
outperform small radars are in achieving sensitivity to weak echoes and performing observations
over the ocean. In those regions where they have visibility (e.g., above 2-3 km AGL) large,
high-power radars are capable of achieving higher sensitivity than the small radars described
here. Large radars sited near the coast have the ability to observe atmospheric flows as much as
200 km from the shoreline; this will not be feasible with smaller short-range radars installed on
land-based sites.
d. Ongoing Research Projects
There are a number of signal processing challenges that need addressing in order to
effectively operate small, low power, short wavelength radars at low elevation angles.
Attenuation and clutter are two such challenges. Even operating at short-range, attenuation
introduces errors into estimates of reflectivity that must be accounted for. A dual-polarization
attenuation correction is currently employed in IP1 to correct the retrieved radar reflectivity and
differential reflectivity in real time (Lim and Chandrasekar, 2005; Lim et al. 2007; Liu et al.
2007). Its performance is demonstrated in Figure 15a, with comparison against NEXRAD
observations. Using the capability for simultaneous measurements from multiple radars, a
network-based attenuation correction algorithm has also been devised in CASA (Chandrasekar
and Lim, 2008). This algorithm, which involves the simultaneous solution of a set of integral
equations describing the backscatter and propagation properties of a common observation

24
volume, brings the new paradigm of network based processing, and is being evaluated for real-
time operation in the IP1 network. To separate ground clutter from weather echoes, various
clutter suppression techniques are being explored. The current technique, whose performance is
illustrated in Figure 15b, is a spectral based approach that suppresses up to 40 dB of clutter
contamination (Moisseev and Chandrasekar, 2008; Moisseev, Nguygen, and Chandrasekar,
2008). Similar in design to GMAP (Siggia and Passarelli, 2004) the algorithm does not require a
clutter map; a property particularly useful under the IP1 targeted sector scan approach. Other
techniques are being evaluated, including some of which may more suitable for phased-array
radar applications (Nguyen, Moisseev, and Chandrasekar, 2008).
A potentially rich application for dense network technology is hydrological forecasting in
complex terrain where long-range radars cannot see due to terrain blockage. After several years
of in-house study, Meteo-France, for example, has chosen to install 2-4 gap-filling X-band radars
in the Tinee and Ubaye river valleys along the French eastern boarder to improve hydrological
forecasts and flood warning there (Tabary et al. 2008). For QPE, CASA is exploring the use of
the specific differential propagation phase (Kdp). Not only does Kdp have higher sensitivity at X-
band compared to the low-attenuating frequencies (C and S-band) but it is relatively immune to
rain attenuation, calibration biases, partial beam blockage, and hail contamination. See
(Chandrasekar, Maki, Wang, and Nakae (2009a) for preliminary results on the capabilities and
potential of X-band dual-polarization radar networks for flood warning in urban settings where
building clutter is an issue.
Controlling, monitoring, assimilating, and disseminating data from 10,000 radars
promises to be a major challenge. For radar control in large networks, distributed versions of the
MCC described in Section 4 have been developed where each radar runs a separate MCC and the

25
MCC’s negotiate with their nearest neighbors to decide which radar(s) should scan each task and
how the scan should be performed (Kranin, An, and Lesser, 2007). For remote monitoring and
management the radars in the IP1 testbed are all Internet accessible and the radar software has
been configured with various scripts for remote testing and calibration. For getting data to and
from the radars, wireless links to the radars, compression schemes for the data, and techniques
for needs-based data transmission are being explored (Li et al. 2007).19 For integration with the
existing infrastructure, CASA has made its data products compatible with existing NWS formats
(NetCDF etc.) and existing NOAA/NWS/EM visualization tools such as WDSS-II (Lakshmanan
et al. 2007) and WeatherScope (http://climate.ok.gov/software/). For Internet operation, CASA
has also developed its own custom web-based visualizations, and is working on visualizations for
handheld devices for individuals such as emergency managers, tornado spotters, and first
responders to use in the field.
Other research within CASA is evaluating the dense network concept through an analysis
of the IP1 data. (Brotzge et al. 2007; Chandrasekar et al. 2008) report on the overall operation of
the network. Zink et al. (2008a) evaluate the performance of the MCC. (Bharadwaj,
Chandrasekar, and Junyent, 2007) evaluate the IP1 signal processing waveforms. Data
assimilation from CASA is addressed in (Brewster et al. 2008). (Philips et al. 2008) reports on
studies related to identification of user need and user experience with the collaborative adaptive
sensing paradigm. Analysis of IP1 tornado detection and forecasting with CASA networks is
reported in (Brotzge et al. 2008; Brotzge et al. 2009; Chandrasekar et al. 2007; Proud et al. 2008;
Potvin et al. 2007).20 The impact of IP1 data on numerical weather prediction (NWP) is explored
19 Estimating the meteorological moments at the radars themselves, rather than shipping the I, Q data from the radars for such estimation, is equivalent to about a 100:1 compression ratio over the raw radar data. 20 During the 2007 spring experiment two confirmed tornadoes occurred within the coverage domain of the IP1 testbed. However, despite a record number of tornadoes in the U.S. in 2008, none occurred in the IP1 testbed domain. The IP1

26
in (Schenkman et al. 2008). (Cheong et al. 2008) reports on refractivity measurements conducted
at X-band for obtaining low-level moisture fields with such networks.
6. Summary
Current approaches to operational weather observation are based on the use of physically-
large, high-power long-range radars that are blocked from viewing the lower part of the
troposphere by the earth's curvature. This paper describes an alternate approach based on dense
networks comprised of large numbers of small X-band radars. Spacing these radars tens of km
apart defeats the earth curvature problem and enables sampling the full vertical depth of the
atmosphere using 1-m antennas and transmitters having only 10's of W transmitter power. Such
networks can provide observing capabilities beyond the operational state of the art while
simultaneously satisfying the needs of multiple users. Improved capabilities associated with this
technology include low-altitude coverage, sub-km spatial resolution, rapid update times, and
multi-Doppler retrievals of vector winds. This technology has the potential to supplement, or
perhaps replace, the widely spaced networks of physically large high power radars in use today.
Acknowledgements
This work is supported primarily by the Engineering Research Centers Program of the National
Science Foundation under NSF award number 0313747. Any opinions, findings, conclusions, or
recommendations expressed in this material are those of the authors and do not necessarily
reflect those of the National Science Foundation. CASA is a consortium of Academic,
Government, and Industry partners including the University of Massachusetts at Amherst (lead
organization), University of Oklahoma, Colorado State University, University of Puerto Rico at
Mayaguez, University of Delaware, University of Virginia, Rice University, McGill University,
testbed detected both of the 2007 tornadoes.

27
NOAA/National Weather Service, Department of Energy, OSHRE/OneNet, Raytheon Company,
Vaisala Inc., IBM, DeTect Inc., EWR Weather Radar, WeatherNews International,
KWTV/NEWS 9, and the Japan National Research Institute for Earth Science and Disaster
Prevention (NIED).

28
References
Bharadwaj, N. and V. Chandrasekar, 2005: Waveform design for CASA X-band Radars.
Preprints, 32nd Conf. on Radar Meteorology, Albuquerque, NM, Amer. Meteor. Soc.
Bharadwaj, N. and V. Chandrasekar, 2007: Phase coding for range ambiguity mitigation in dual-
polarized Doppler weather radars. J. Atmos. Oceanic Technol., 24, 1351-1363.
Bharadwaj, N., V. Chandrasekar, and F. Junyent, 2007: Evaluation of first generation CASA
radar waveforms in the IP1 testbed. Preprints, IEEE International Geoscience and Remote
Sensing Symposium (IGARSS), Barcelona, Spain.
Brewster, K. A., J. Brotzge, K. W. Thomas, Y. Wang, M. Xue, J. Gao, and D. Weber, 2008:
High resolution assimilation of CASA and NEXRAD radar data in near-real time: Results
from spring 2007 and plans for spring of 2008. Preprints, 12th Conference on IOAS-AOLS,
Amer. Meteor. Conf., New Orleans, LA.
Brewster, K., L. White, B. Johnson, and J. Brotzge, 2005: Selecting the sites for the CASA
NetRad, a Collaborative Radar Network. Preprints, Ninth Symp. on Integrated Observing and
Assimilation Systems for the Atmosphere, Oceans, and Land Surface (IOAS-AOLS), San
Diego, CA, Amer. Meteor. Soc.
Bringi, V.N. and V. Chandrasekar, 2001: Polarimetric Doppler weather radar: Principles and
Applications. Cambridge University Press, 636 pp.
Brotzge, J., 2006: Severe weather climatology of IP1. CASA Technical Report, Oklahoma
University, OK. [Available from J. Brotzge, University of Oklahoma, 120 David L. Boren
Blvd., Norman, OK 73072-7309].

29
Brotzge, J., D. Andra, K. Hondl, and L. Lemon, 2008: A case study evaluating Distributed,
Collaborative, Adaptive Scanning: Analysis of the May 8th, 2007, minisupercell event.
Preprints, Symposium on Recent Developments in Atmospheric Applications of Radar and
Lidar, AMS Conf., New Orleans, LA.
Brotzge, J., K. Brewster, V. Chandrasekar, B. Philips, S. Hill, K. Hondl, B. Johnson, E. Lyons,
D. McLaughlin, and D. Westbrook, 2007: CASA IP1: Network operations and initial data.
Preprints, 23rd Conf. IIPS, San Antonio, TX, Amer. Meteor. Soc.
Brotzge, J., K. Hondl, B. Philips, L. Lemon, E. Bass, D. Rude, and D. Andra, Jr., 2009:
Evaluation of Distributed Collaborative Adaptive Sensing for detection of low-level
circulations and implications for severe weather warning operations. Wea. Forecasting, in
review.
Chandrasekar, V. and A. P. Jayasumana, 2001: Radar design and management in a networked
environment. Preprints, Proc. of ITCOMM, Denver, CO, 142-147.
Chandrasekar, V. and S. Lim, 2008: Retrieval of reflectivity in a networked radar environment.
J. Atmos. Oceanic Technol., 25, 1755-1767.
Chandrasekar, V., S. Lim, N. Bharadwaj, W. Li, D. McLaughlin, V.N. Bringi, and E. Gorgucci,
2004: Principles of Networked Weather Radar Operation at Attenuating Frequencies.
Preprints, Proc. of the 2004 European Radar Conf. (ERAD 2004), Visby, Sweden, 109-114.
Chandrasekar, V., M. Maki, Y. Wang, and K. Nakane, 2009a: Considerations for Urban Flood
Monitoring using X-band dual-polarization radar network. Preprints, 23rd Conf. on
Hydrology, Special Symp. on Urban High Impact Weather, 11-15 January, Phoenix, AZ,
Amer. Meteor. Soc.

30
Chandrasekar, V., D. McLaughlin, J. Brotzge, M. Zink, B. Philips, and Y. Wang, 2007:
Distributed Collaborative Adaptive Radar Network: The CASA IP-1 Network and Tornado
Observations. Preprints, 33rd Conf. Radar Meteorology, Amer. Meteor. Soc., Cairns,
Australia.
Chandrasekar, V., D.J. McLaughlin, J. Brotzge, M. Zink, B. Philips, and Y. Wang, 2008:
Distributed Collaborative Adaptive Radar Network: Preliminary Results from the CASA IP1
Testbed. Proc. of the IEEE Radar Conference (RADAR’08), 26-30 May, Rome, Italy, 1-5.
Chandrasekar, V., D. Willie, Y. Wang, S. Lim, and D. McLaughlin, 2009b: Attenuation Margin
Requirements in a Networked Radar System for Observation of Precipitation. To appear,
IGARSS 2009: IEEE International Geoscience & Remote Sensing Symposium, Cape Town,
Africa, July 13-17.
Cheong, B., R. Palmer, C. Curtis, T. Yu, D. Zrnic, and D. Forsyth, 2008: Refractivity results
using the Phased-Array Radar: First results and potential for multimission operation. IEEE
Trans. On Geoscience and Remote Sensing, 46, 2527-2537.
Cho, Y.-G., N. Bharadwaj, V. Chandrasekar, M. Zink, F. Junyent, E. Insanic, and D.J.
McLaughlin, 2005: Signal processing architecture for a single radar node in a networked
radar environment (NetRad). Preprints, Proc. of the IEEE Int. Geoscience and Remote
Sensing Symp. (IGARSS), Seoul, Korea.
DoD, 2005: Strategy for Homeland Defense and Civil Support. U.S. Department of Defense,
Washington D.C., (http://www.defenselink.mil/news/Jun2005/d20050630homeland.pdf).
Doviak, R. J. and D. S. Zrnic, 1993: Doppler Weather Radar Observations (2nd ed.). Dover
Publications, Inc., 562 pp.

31
Gao, J., K. Brewster, Y. Wang, K. Thomas, J. Brotzge, and M. Xue, 2008: High-resolution three-
dimensional wind analysis of CASA IP-1 and WSR-88D radar data using the ARPS 3DVAR.
Preprints, 12th Conf. on IOAS-AOLS, New Orleans, LA, Amer. Meteor. Soc.
Insanic, E., and P. Siqueira, 2008: Resource allocation and optimization for a closely coordinated
network of X-band radars. Preprints, Proc. of the IEEE Int. Geoscience and Remote Sensing
Symp. (IGARSS), Boston, MA.
Junyent, F., 2007: Networked weather radar system using coherent-on-receive technology. Ph.D.
Dissertation, Dept. of Electrical and Computer Engineering, University of Massachusetts,
Amherst, MA.
Junyent, F. and V. Chandrasekar, 2009: Theory and characterization of weather radar networks.
J. Atmos. Oceanic Technol., Amer. Meteor. Soc., in press.
Junyent, F., V. Chandrasekar, D. J. McLaughlin, S. Fraiser, E. Insanic, R. Ahmed, N. Bharadwaj,
E. Knapp, L. Krnan, and R. Tessier, 2005: Salient features of radar nodes of the first
generation NetRad system. Preprints, Proc. of the IEEE Int. Geoscience and Remote Sensing
Symp. (IGARSS), Seoul, Korea.
Khasgiwale, R., L. Krnan, A. Perinkulam, and R. Tessier, 2005: Reconfigurable data acquisition
system for weather radar applications. Preprints, 48th Midwest Symp. on Circuits and
Systems, Covington, KY.
Krainin, M., B. An, and V. Lesser, 2007: An application of automated negotiation to distributed
task allocation. Preprints, Proc. of the Int. Conf. on Intelligent Agent Tech., Silicon Valley,
CA.

32
Kurose, J., E. Lyons, D. McLaughlin, D. Pepyne, B. Philips, D. Westbrook, and M. Zink, 2006:
An end-user responsive sensor network architecture for hazardous weather detection,
prediction, and response. Preprints, Asian Internet Eng. Conf. (AINTEC), Pathumthani,
Thailand.
Lakshmanan, V., T.M. Smith, G.J. Stumpf, and K.D. Hondl, 2007: The Warning Decision
Support System – Integrated Information. Weather and Forecasting, 22, 596-612.
Leone, D.A., R.M. Endlich, J. Petriceks, R.T.H. Collis, and J.R. Porter, 1989: Meteorological
considerations used in planning the NEXRAD network. Bull. Amer. Meteor. Soc., 70, 4-13.
Li, M., T. Yan, D. Ganesan, E. Lyons, P. Shenoy, A. Venkataramani, and M. Zink, 2007: Multi-
user Data Sharing in Radar Sensor Networks. Preprints, Proc. of the 5th ACM Conference on
Embedded Networked Sensor Systems (Sensys 2007), Sydney, Australia.
Lim, S. and V. Chandrasekar, 2005: An improved attenuation correction algorithm using dual-
polarization radar observations of precipitation. Preprints, Proc. of Intl. Symp. on Geoscience
and Remote Sensing, Seoul, Korea, 25-29 July, IEEE.
Lim, S., V. Chandrasekar, P. Lee and A. P. Jayasumana, 2007: Reflectivity retrieval in a
networked radar environment: Demonstration from the CASA IP1 radar network. Preprints,
Proc. of the 27th IEEE International Geoscience and Remote Sensing Symposium (IGARSS),
Barcelona, Spain.
Liu, Y., Y. Wang, D. Willie, V. Chandrasekar, and V. N. Bringi, 2007: Operational evaluation of
the real-time attenuation correction System for CASA IP1 testbed. Preprints, 33rd Conf. on
Radar Meteorology, Cairns, Queensland, Amer. Meteor. Soc.

33
Maddox, R. A., J. Zhang, J. J. Gourley, and K. W. Howard, 2002: Weather radar coverage over
the contiguous United States. Wea. Forecasting, 17, 927-934.
McLaughlin, D. J., 2008: CASA Update for NEXRAD TAC. Briefing to the NEXRAD Technical
Advisory Committee, September 4, 2008, MIT Lincoln Laboratory, Lexington, MA.
McLaughlin, D. J., V. Chandrasekar, K. Droegemeier, S. Frasier, J. Kurose, F. Junyent, B.
Philips, S. Cruz-Pol, and J. Colom, 2005: Distributed Collaborative Adaptive Sensing
(DCAS) for improved detection, understanding, and predicting of atmospheric hazards.
Preprints, 9th Symp. on Integrated Observation and Assimilation System for the Atmosphere,
Oceans, and Land Surface, San Diego, CA, Amer. Meteor. Soc.
McLaughlin, D.J., E.A. Knapp, Y. Yang, and V. Chandrasekar, 2007: Distributed weather radar
using X-Band active arrays. Preprints, IEEE Radar Conference, Boston, MA.
Moisseev, D.N., and Chandrasekar, 2008: Polarimetric spectral filter for adaptive clutter and
noise suppression. Journal of Atmospheric and Oceanic Technology, early online release,
posted January 2008.
Moisseev, D.N., C.M. Nguygen and V. Chandrasekar, 2008: Clutter Suppression for Staggered
PRT Waveforms. Journal of Atmospheric and Oceanic Technology, 25, 2209–2218.
Nguyen, C.M., D.N. Moisseev and V. Chandrasekar, 2008: A Parametric Time Domain Method
for Spectral Moment Estimation and Clutter Mitigation for Weather Radars. Journal of
Atmospheric and Oceanic Technology, 25, 83–92.
NRC (National Research Council), 1995: Assessment of NEXRAD Coverage and Associated
Weather Services. National Academy Press, Washington D.C.
34
NRC (National Research Council), 2002: Weather Technology Beyond NEXRAD. National
Academy Press, Washington D.C.
NRC (National Research Council) 2004: Where the Weather Meets the Road. National Academy
Press, Washington D.C.
NRC (National Research Council), 2008: Evaluation of the Multifunction Phased Array Radar
Planning Process. National Academy Press, Washington, D.C.
NRC (National Research Council), 2009: Observing Weather and Climate from the Ground Up.
National Academy Press, Washington D.C.
OFCM (Office of the Federal Coordinator for Meteorological Services and Supporting
Research), 2006: Federal Research and Development Needs and Priorities for Phased Array
Radar. FCM-R25-2006.
Pepyne, D., D. Westbrook, B. Philips, E. Lyons, M. Zink, and J. Kurose, 2008: Distributed
Collaborative Adaptive Sensing networks for remote sensing applications. Proc. of the
American Control Conf., Seattle, WA, 4167-4172.
Philips. B., D. Pepyne, D. Westbrook, E. Bass, J. Brotzge, W. Diaz, K. Kloesel, J. Kurose, D.
McLaughlin, H. Rodriguez, and M. Zink, 2007: Integrating End-User Needs into System
Design and Operation: The Center for Collaborative Adaptive Sensing of the Atmosphere
(CASA). Preprints, 16th Conf. on Applied Climatology, San Antonio, TX, Amer. Meteor. Soc.
Philips, B., D. Westbrook, D. Pepyne, J. Brotzge, E. Bass, and D. Rude, 2008: User evaluations
of adaptive scanning patterns in the CASA Spring Experiment 2007. Preprints, Proc. of the
IEEE 28th International Geoscience and Remote Sensing Symposium (IGARSS), Boston,
MA.

35
Potvin, C.K., A. Shapiro, T.-Y. Yu, J. Gao, and M. Xue, 2008: Using a Low-Order Model to
Detect and Characterize Tornadoes in Multiple-Doppler Radar Data. Monthly Weather
Review, Amer. Met. Soc., in press.
Proud, J.L., K. Droegemeier, V. Wood, and R. Brown, 2008: Sampling strategies for tornado and
mesocyclone detection using dynamically adaptive Doppler radars: A simulated study.
Journal of Atmospheric and Oceanic Technology, in press.
Puzella, A. and R. Alm, 2007: Air cooled, active transmit/receive panel array. Preprints, IEEE
Radar Conference, Lexington, MA.
Salazar, J. L., R. Medina, E. J. Knapp, and D. J. McLaughlin, 2008: Phase tilt array antenna
design for dense distributed radar network for weather sensing. Preprints, International
Geoscience Remote Sensing Symposium, Boston MA.
Sarcione, M., N. Kolias, M. Booen, D. McLaughlin, F. Chang, and A. Hajimiri, 2008: Looking
ahead: The future of RF technology, military and homeland perspectives. Microwave
Journal, 51, 52 - 62.
Schenkman, A., A. Shapiro, K. Brewster, M. Xue, J. Gao, and N. Snook, 2008: High resolution
assimilation of CASA radar data from a tornadic convective system. Preprints, Symp. Recent
Developments in Atmos. Appl. Radar and Lidar. 20-24 January, 2008, New Orleans, LA.
Serafin, R. J. and J. W. Wilson, 2000: Operational weather radar in the United States: Progress
and opportunity. Bull. Amer. Meteor. Soc., 81, 809-824.
Siggia, 1983: Processing phase-coded radar signals with adaptive digital filters. 21st Conference
on Radar Meteorology, Edmonton, Alberta, Canada. 513-518.
36
Siggia, A. and J. R. Passarelli, 2004: “Gaussian model adaptive processing (gmap) for improved
ground clutter cancellation and moment calculation.” Proc. of the 3rd European Conference
on Radar in Meteorology and Hydrology, ERAD, Visby, Gotland, Sweden, 67–73.
Tabary, P., J. Parent-du-Châtelet, M. Franco, R. Cremonini, C. Ciotti, and G. Vulpiani, 2008:
Overview of the weather radar networks and products in the “north-western” Mediterranean
region (Spain, France and Italy). Presented at the 2nd HyMeX workshop, Palaiseau, France.
Torres, S. and C. Curtis, 2006: Design considerations for improved tornado detection using
super-resolution data on the NEXRAD network. Preprints, Third European Conf. on Radar
Meteorology and Hydrology (ERAD), Barcelona, Spain.
Wang, Y., V. Chandrasekar, and B. Dolan, 2008: Development of scan strategy for dual-Doppler
retrieval in a networked radar system. Preprints, IEEE Intl. Geosciences and Remote Sensing
Symposium (IGARSS), Boston, MA.
Westrick, K. J., C. F. Mass, and B. A. Colle, 1999: The limitations of the WSR-88D radar
network for quantitative precipitation measurement over the costal western United States.
Bull. Amer. Meteor. Soc., 80, 2289-2209.
Willie, D., W. Li, Y. Wang, and V. Chandrasekar, 2006: Attenuation statistics for X-band radar
design. Preprints, Proc. of IGARSS 2006, Denver, CO.
Zink, M., E. Lyons, D. Westbrook, V. Chandrasekar, D. Pepyne, B. Philips, and J. Kurose,
2008a: Meteorological Command & Control: Architecture and performance evaluation.
Preprints, Proc. of IGARSS 2008, Boston, MA.
Zink, M., E. Lyons, D. Westbrook, J. Kurose, and D. Pepyne, 2008b: Closed-loop architecture
for Distributed Collaborative Adaptive Sensing of the Atmosphere: Meteorological Command &
Control. International Journal for Sensor Networks (IJSNET), in press.

37
Table 1. Two-way attenuation (dB) through 10 km of rain.
Rain Rate (mm/hr) S-band (10 cm) X-band (3.2 cm)
4 0.03 1.10
20 0.14 7.79
40 0.27 18.09
100 0.65 55.13

38
Table 2. Specification comparison between the IP1 (left) and WSR-88D (right) radars.
Transmitter Magnetron Klystron
Frequency 9.41 GHz (X-band) 2.7-3.0 GHz (S-band)
Wavelength 3.2 cm 10 cm
Peak Radiated Power 10 kW 500 kW
Duty Cycle (max) 0.0013 0.002
Average Radiated Power 13 W 1000 W
Antenna Size 1.2 m 8.5 m
Antenna Gain 36.5 dB 45.5 dB
Radome Size 2.6 m 11.9 m
Polarization Dual linear, simultaneous
horizontal/vertical
Single, linear horizontal
Beamwidth 1.8 deg 0.925 deg
PRF Dual, 1.6 kHz-2.4 kHz Single, 322-1282 Hz
Pulse width 660 ns 1600-4500 ns
Doppler Range 40 km 230 km
Range Increment 100 m 1000 m*
Azimuth Increment 1 deg 1 deg*
Scan Strategy 60-360 deg adaptive PPI
sector scans, 1-30 deg RHI
scans
360 PPI scans, 0.5-19.5 deg
elevation
* The NEXRAD “super-resolution” upgrade will reduce the range increment to 250 m and the azimuth increment to 0.5 degrees.

39
Table 3. Data Products generated by the IP1 radars.
Variable Units
Reflectivity dBZ
Velocity ms-1
Spectral Width ms-1
Differential Reflectivity dB
Differential Phase Degrees
Cross Pol Correlation Unitless
Normalized Coherent Power Unitless
Specific Phase Radians Per Meter
H Propagation Phase Radians
V Propagation Phase Radians

40
Table 4. IP1 component and O&M costs.
IP1 node component costs
Antenna $8,000
Radome $20,000
Tower (6 m)* $15,000
Data Acquisition $20,000
Transceiver $30,000
Elevation Positioner $10,000
Azimuth Positioner $90,000
Platform, frames $10,000
Computers, storage, networking hardware $20,000
HVAC $6,000
Electricity power-line $500
Total $229,500
* The 20 m tower at Cyril cost $120,000; Chickasha uses an existing 20 m tower.
IP1 yearly O&M costs
Electric Power $2,000
Spare parts/repairs $7,500
Networking $16,500
Land Lease** $0
Total Annual $26,000
** Land use is by donation to CASA.

41
Table 5. Key specifications for phased-array panels for the dense network application.
Peak transmit power per panel 10 – 100 W
Panel size 1 m 1 m
Average beamwidth 2 2
Polarization dual-linear transmit and receive
Number of panels per site 3 or 4
Azimuth scan range 45 for a 3 panel installation
60 for a 4 panel installation
Elevation scan range 0-20 for low level coverage < 3 km
0-56 for coverage up to 21 km

42
List of Figures
Figure 1. Dense Network Concept – thousands of small, low-cost, short-range radars mounted on
communication-towers, buildings, and other infrastructure elements, communicating with
one another to adjust their sensing strategies in direct response to the evolving weather and to
changing end-user needs. Provides fine-scale storm mapping throughout the entire
troposphere – from the boundary layer up to the tops of storms.
Figure 2. NEXRAD coverage at 3 km above ground level (a) and 1 km above ground level (b).
These plots are the center of the beam at 0.5 degrees elevation (NEXRAD lowest allowed
tilt, by policy). Coverage data courtesy I. Graffman, NOAA/NWS/OST.
Figure 3. Percent coverage (solid lines) and number of radars needed for CONUS coverage
(dashed line) vs. radar spacing. The vertical bar at 345 km is the representative spacing of the
NEXRAD radars to the west of the Rocky Mountains, and the vertical bar at 230 km is the
average spacing of the NEXRAD radars to the east of the Rocky Mountains. The vertical bar
at 30 km is CASA’s solution.
Figure 4. Beam height above ground level for a small (1-m antenna) short-wavelength (X-band)
radar. The shaded region is the coverage by the 1.8-degree beam at 0.9 degrees elevation
angle. The dotted line is the center of the beam. At this lowest tilt the entire beam is below 1
km over a 30 km range.
Figure 5. X-band attenuation statistics for Norman, Oklahoma (Willie et al. 2006). Note that the
plot only contains data collected when there was rain falling in the coverage domain of the
radar. This single radar attenuation statistic was derived from data from KOUN (a dual-pol
NEXRAD).

43
Figure 6. Sensitivity at 30 km as a function of transmit power for low-power radar technology.
The 80% and 90% attenuation curves incorporate the attenuation data from Figure 5 into the
radar equation.
Figure 7. Map of the CASA IP1 testbed in southwestern Oklahoma showing the radar sites and
40 km range rings. Also shown are the NEXRAD radars at Frederick (KFDR) in the lower
left and Twin Lakes (KTLX) in the upper right. The rings around the NEXRAD radars are at
40 km and 60 km, respectively.
Figure 8. Architecture of an IP1 radar node (from Junyent, 2007, pg. 49). The tower-top
rotating assembly contains the radar antenna, transceiver, data acquisition system, and
elevation actuator, all mounted on a frame atop the azimuth positioner. On the radome
floor, the non-rotating subsystems include a gigabit Ethernet switch, Ethernet controlled
power outlet strip, GPS amplifier, and position controller computer. A gigabit Ethernet
optic fiber links the tower top with the data processing server on the ground. The site is
connected to the Internet through a radio link.
Figure 9. CASA IP1 polarimetric variables: (a) reflectivity, Zh, (b) differential reflectivity, Zdr,
(c) differential phase, dp, and (d) correlation coefficient, hv. The CASA IP1 radars are
simultaneous horizontal and vertical (SHV) dual-polarization Doppler radars.
Figure 10. Flow diagram depicting the major processing steps of the closed-loop Meteorological
Command and Control (MCC) software architecture.
Figure 11. Sequence of sector scans performed around a meteorologically significant feature
beginning at 200 m AGL (lowest scan). The sector scan on the left shows the feature at 1,
2, 3, 5, 7, 9, and 11 degrees elevation angle.
44
Figure 12. CASA Test Network Data – “hook echo” observed by CASA’s pre-prototype network
at 200 m altitude (top) compared to a more distant WSR-88D NEXRAD radar located to the
southwest of the network (bottom). IP1 has update rates 5 times faster and spatial resolution
8 times finer than the current NEXRAD.
Figure 13. 3-D wind velocity retrieval from the IP1 system. Multiple-Doppler computations have
been done with the IP1 network down to 200 m AGL (500m MSL).
Figure 14. Artist’s renditions of two potential electronically scanned (e-scan) radar designs as
they might appear when mounted on existing infrastructure such as a cellular
communications tower (left) or the side of a building (right). The radar on the left is an
example of a phase-tilt deployment (electronically scanned in azimuth, mechanically in
elevation). The radar on the right is an example of a phase-phase deployment (electronically
steered in both azimuth and elevation).
Figure 15. Signal processing examples from the CASA’s IP1 network: (a) comparing CASA’s
dual-polarization attenuation correction technique with the KTLX NEXRAD radar, and (b)
illustrating CASA’s ground clutter filtering with adaptive spectral processing.
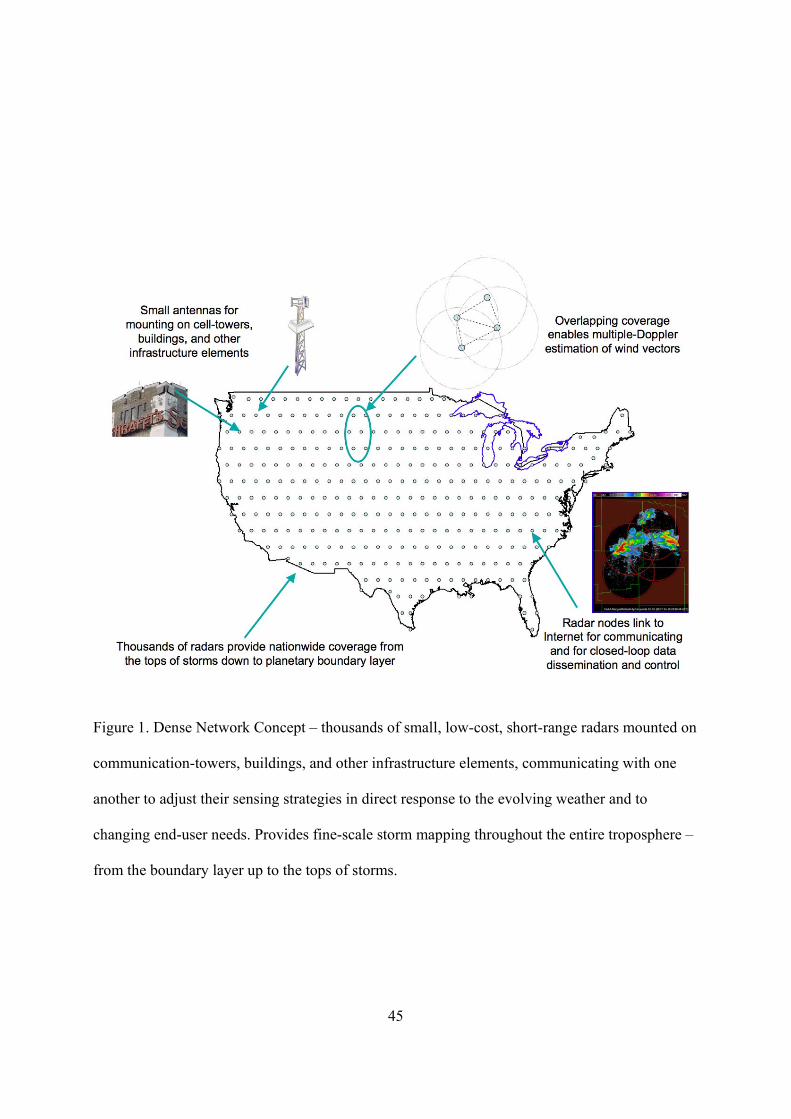
45
Figure 1. Dense Network Concept – thousands of small, low-cost, short-range radars mounted on
communication-towers, buildings, and other infrastructure elements, communicating with one
another to adjust their sensing strategies in direct response to the evolving weather and to
changing end-user needs. Provides fine-scale storm mapping throughout the entire troposphere –
from the boundary layer up to the tops of storms.
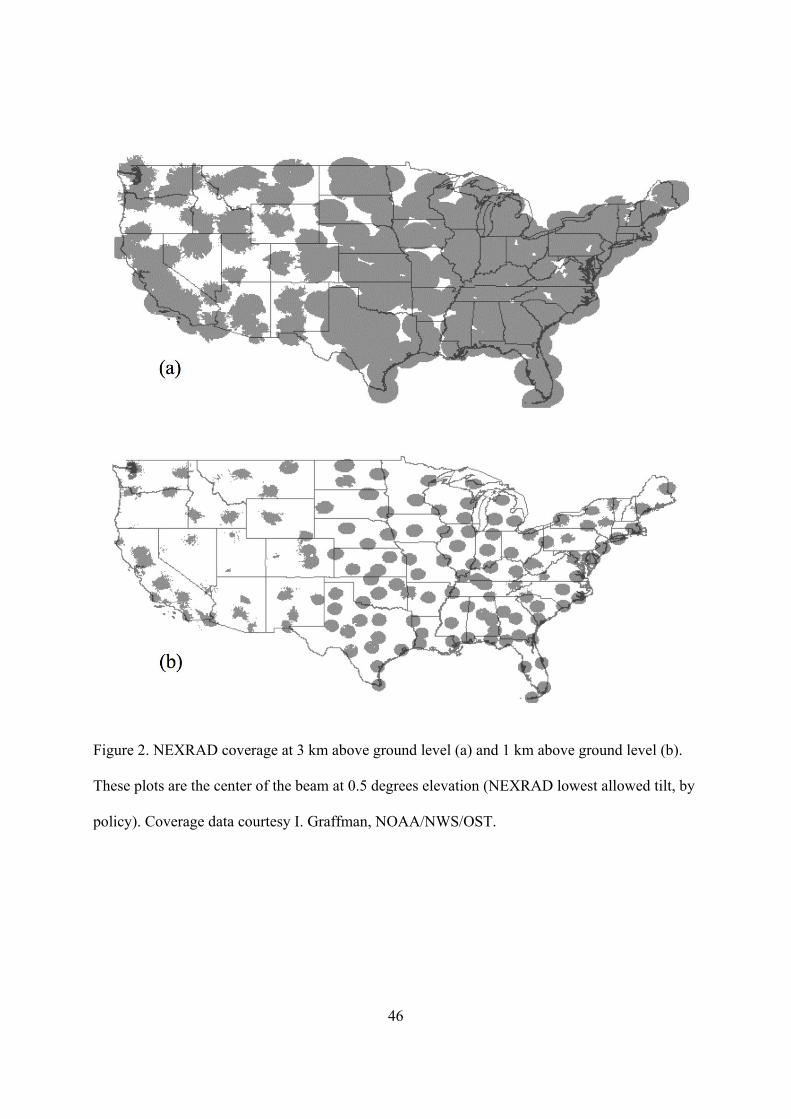
46
Figure 2. NEXRAD coverage at 3 km above ground level (a) and 1 km above ground level (b).
These plots are the center of the beam at 0.5 degrees elevation (NEXRAD lowest allowed tilt, by
policy). Coverage data courtesy I. Graffman, NOAA/NWS/OST.

47
Figure 3. Percent coverage (solid lines) and number of radars needed for CONUS coverage
(dashed line) vs. radar spacing. The vertical bar at 345 km is the representative spacing of the
NEXRAD radars to the west of the Rocky Mountains, and the vertical bar at 230 km is the
average spacing of the NEXRAD radars to the east of the Rocky Mountains. The vertical bar at
30 km is CASA’s solution.
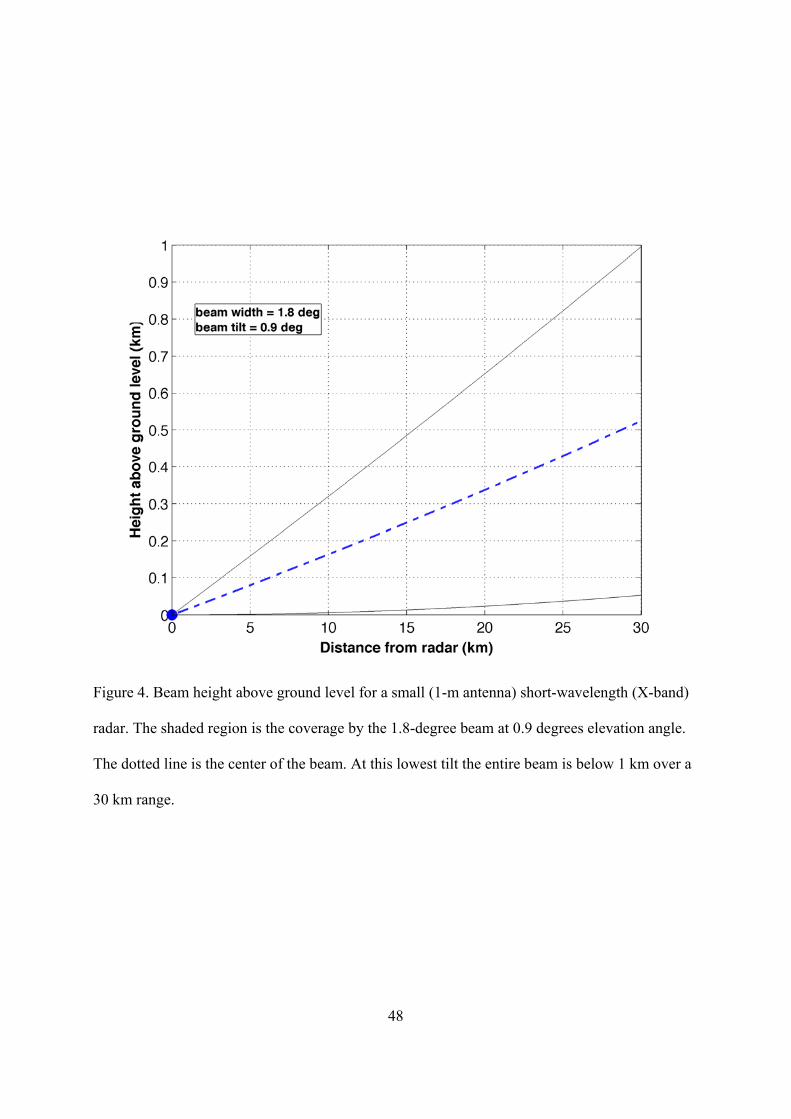
48
Figure 4. Beam height above ground level for a small (1-m antenna) short-wavelength (X-band)
radar. The shaded region is the coverage by the 1.8-degree beam at 0.9 degrees elevation angle.
The dotted line is the center of the beam. At this lowest tilt the entire beam is below 1 km over a
30 km range.

49
Figure 5. X-band attenuation statistics for Norman, Oklahoma (Willie et al. 2006). Note that the
plot only contains data collected when there was rain falling in the coverage domain of the radar.
This single radar attenuation statistic was derived from data from KOUN (a dual-pol NEXRAD).
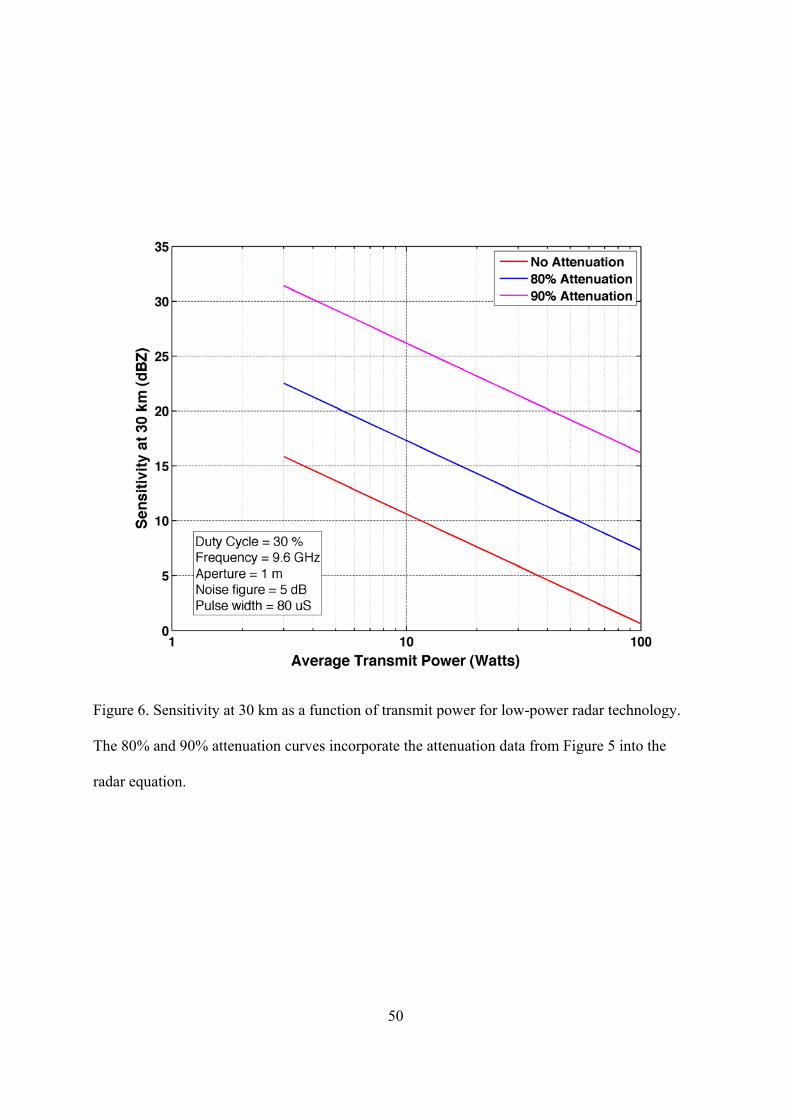
50
Figure 6. Sensitivity at 30 km as a function of transmit power for low-power radar technology.
The 80% and 90% attenuation curves incorporate the attenuation data from Figure 5 into the
radar equation.
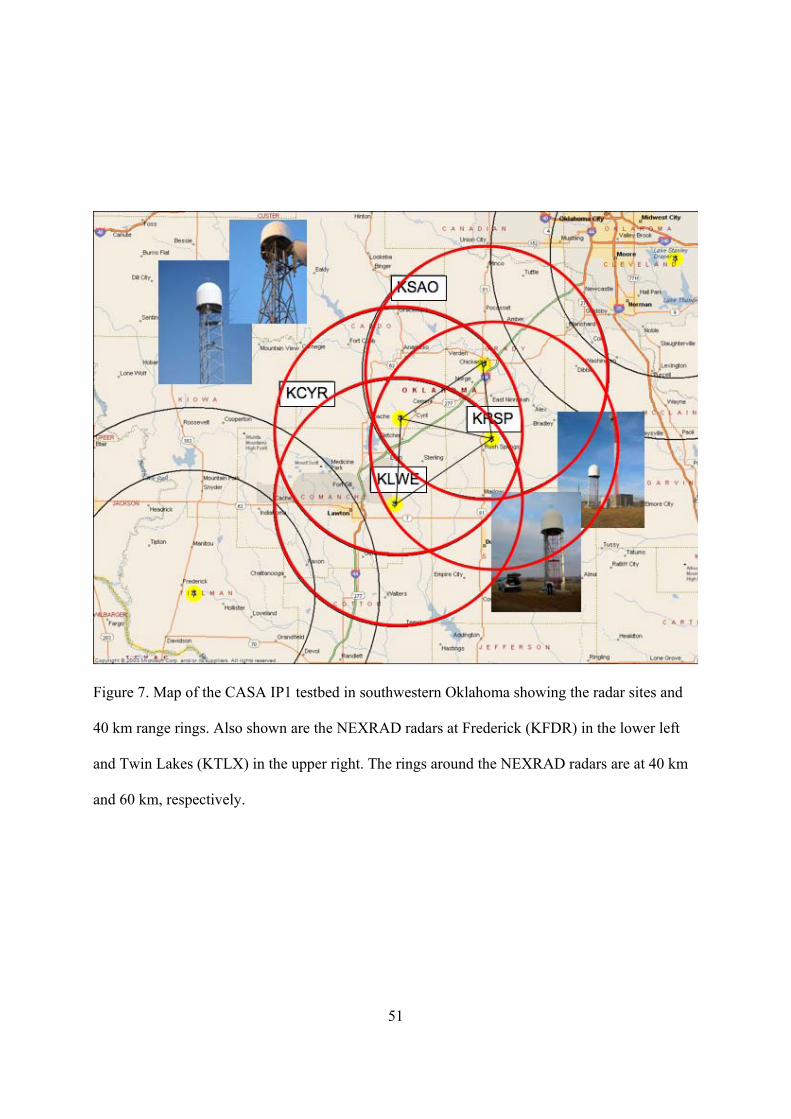
51
Figure 7. Map of the CASA IP1 testbed in southwestern Oklahoma showing the radar sites and
40 km range rings. Also shown are the NEXRAD radars at Frederick (KFDR) in the lower left
and Twin Lakes (KTLX) in the upper right. The rings around the NEXRAD radars are at 40 km
and 60 km, respectively.
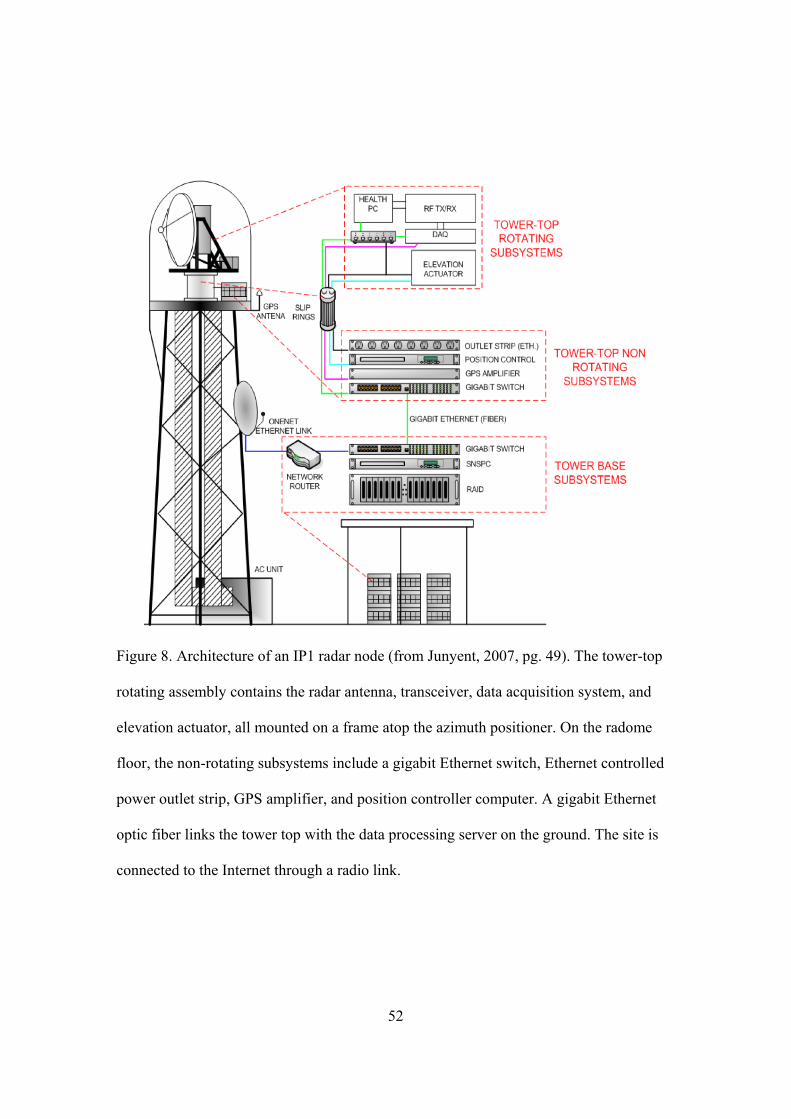
52
Figure 8. Architecture of an IP1 radar node (from Junyent, 2007, pg. 49). The tower-top
rotating assembly contains the radar antenna, transceiver, data acquisition system, and
elevation actuator, all mounted on a frame atop the azimuth positioner. On the radome
floor, the non-rotating subsystems include a gigabit Ethernet switch, Ethernet controlled
power outlet strip, GPS amplifier, and position controller computer. A gigabit Ethernet
optic fiber links the tower top with the data processing server on the ground. The site is
connected to the Internet through a radio link.

53
Figure 9. CASA IP1 polarimetric variables: (a) reflectivity, Zh, (b) differential reflectivity, Zdr,
(c) differential phase, dp, and (d) correlation coefficient, hv. The CASA IP1 radars are
simultaneous horizontal and vertical (SHV) dual-polarization Doppler radars.

54
Figure 10. Flow diagram depicting the major processing steps of the closed-loop Meteorological
Command and Control (MCC) software architecture.

55
Figure 11. Sequence of sector scans performed around a meteorologically significant
feature beginning at 200 m AGL (lowest scan). The sector scan on the left shows the
feature at 1, 2, 3, 5, 7, 9, and 11 degrees elevation angle.

56
Figure 12. CASA Test Network Data – “hook echo” observed by CASA’s pre-prototype network
at 200 m altitude (top) compared to a more distant WSR-88D NEXRAD radar located to the
southwest of the network (bottom). IP1 has update rates 5 times faster and spatial resolution 8
times finer than the current NEXRAD.

57
Figure 13. 3-D wind velocity retrieval from the IP1 system. Multiple-Doppler computations have
been done with the IP1 network down to 200 m AGL (500m MSL).

58
Figure 14. Artist’s renditions of two potential electronically scanned (e-scan) radar designs as
they might appear when mounted on existing infrastructure such as a cellular communications
tower (left) or the side of a building (right). The radar on the left is an example of a phase-tilt
deployment (electronically scanned in azimuth, mechanically in elevation). The radar on the
right is an example of a phase-phase deployment (electronically steered in both azimuth and
elevation).

59
Figure 15. Signal processing examples from the CASA’s IP1 network: (a) comparing CASA’s
dual-polarization attenuation correction technique with the KTLX NEXRAD radar, and (b)
illustrating CASA’s ground clutter filtering with adaptive spectral processing.