Embed Size (px)
DESCRIPTION
Aviation Finance
Citation preview

EAS431
Aviation Finance
Seminar 1

Understanding Financing Requirements
- Prediction of Air Traffic Growth• Depends on GDP Growth (2:1) and Real cost of Air Travel
- Capacity Growth • (Number of Seats, Efficient use, airborne Time, Flying
Speed)
- Numbers of Aircraft • Size of Aircraft
- Retirements (30 years life span)

Understanding Financing Requirements

Understanding Financing Requirements

Understanding Financing Requirements

CyclicalityFinancing needs to be fairly conservative
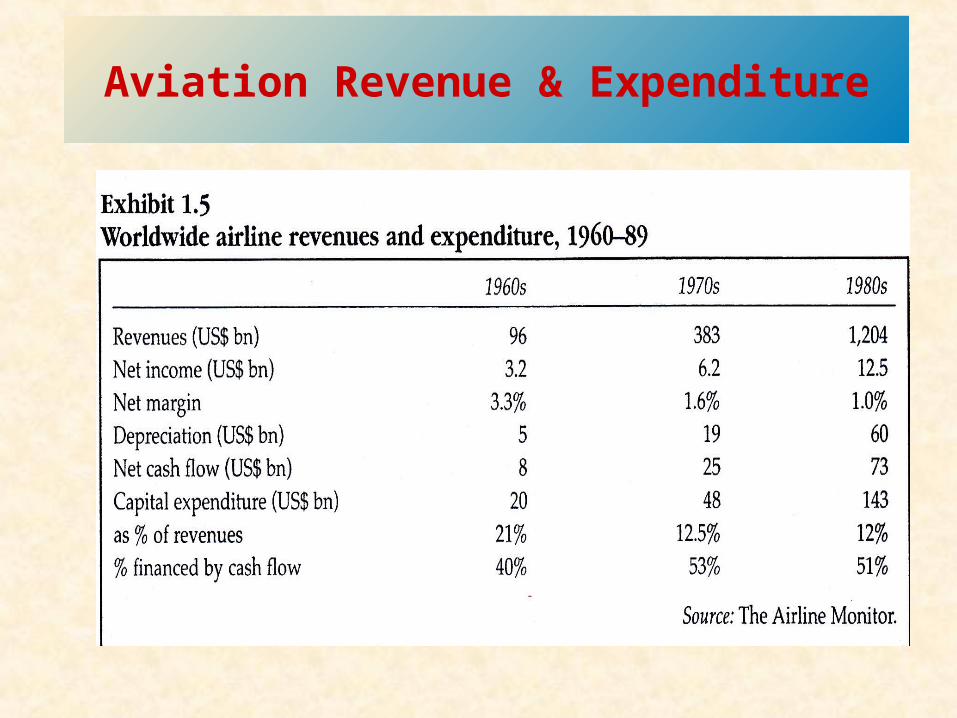
Aviation Revenue & Expenditure

Aviation Revenue & Expenditure

Financing Methods
Market Demand Fluctuations, Tax Funding

Residual Value Risk

Residual Value Risk

External Shock factors & Profitability
• GDP growth• War & terrorism (e.g. Iraq, Sept 11)• Environmental – Volcanic Eruption• Uncertain Fuel Prices
- hedging- Fuel Tanking- Fuel Surcharges to Passengers

External Shock factors & Profitability
• Asian currency crisis• Epidemic (Sars, Bird Flu)• Capital Intensive – Large Fixed Assets
– Low Cost Carriers• Govt vs Private
– National Strategic Economic Key Assets– Air transport Access

The Balance Sheet

Balance Sheet

Income Statement

Balance Sheet
2003 2002 2003 2002Cash 696 58 A/P 307 303
A/R 956 992 N/P 26 119
Inventory 301 361 Other CL 1,662 1,353Other CA 303 264 Total CL 1,995 1,775Total CA 2,256 1,675 LT Debt 843 1,091
Net FA 3,138 3,358 C/S 2,556 2,167
Total Assets
5,394 5,033 Total Liab. & Equity
5,394 5,033
Numbers in millions

Income Statement
Revenues 5,000
Cost of Goods Sold 2,006
Expenses 1,740
Depreciation 116
EBIT 1,138
Interest Expense 7
Taxable Income 1,131Taxes 442
Net Income 689
EPS 3.61
Dividends per share 1.08
Numbers in millions, except EPS & DPS

Sources and Uses
• Sources– Cash inflow – occurs when we “sell” something– Decrease in asset account (Sample B/S)
• Accounts receivable, inventory, and net fixed assets– Increase in liability or equity account
• Accounts payable, other current liabilities, and common stock
• Uses– Cash outflow – occurs when we “buy” something– Increase in asset account
• Cash and other current assets– Decrease in liability or equity account
• Notes payable and long-term debt
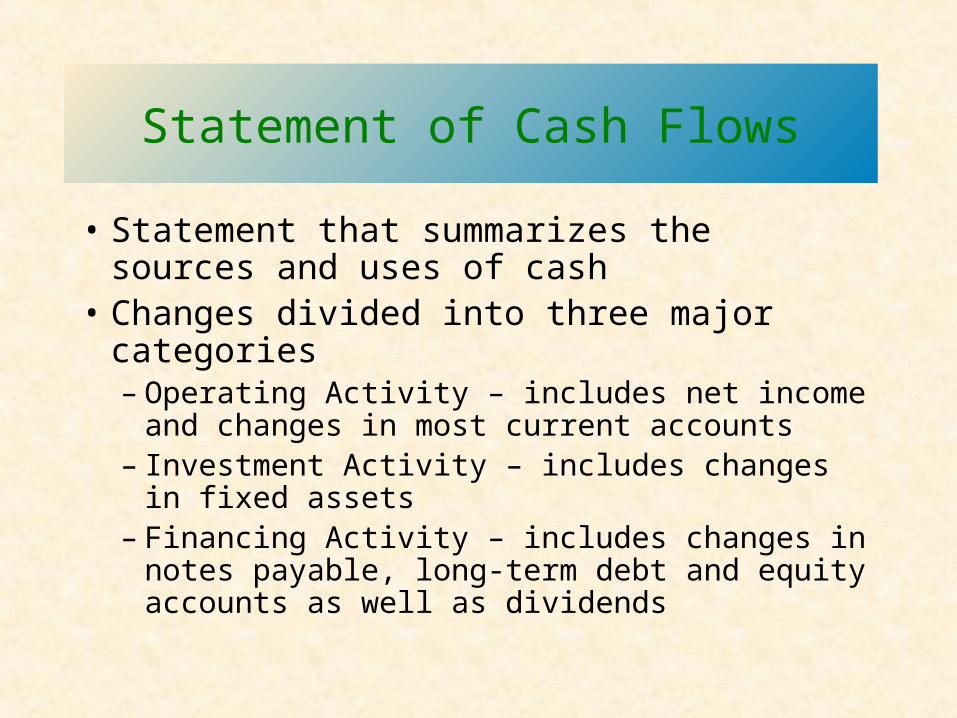
Statement of Cash Flows
• Statement that summarizes the sources and uses of cash
• Changes divided into three major categories– Operating Activity – includes net income and
changes in most current accounts– Investment Activity – includes changes in fixed
assets– Financing Activity – includes changes in notes
payable, long-term debt and equity accounts as well as dividends

Statement of Cash Flows
Cash, beginning of year 58 Financing Activity
Operating Activity Decrease in Notes Payable -93
Net Income 689 Decrease in LT Debt -248
Plus: Depreciation 116 Decrease in C/S (minus RE) -94
Decrease in A/R 36 Dividends Paid -206
Decrease in Inventory 60 Net Cash from Financing -641
Increase in A/P 4 Net Increase in Cash 638
Increase in Other CL 309 Cash End of Year 696
Less: Increase in CA -39
Net Cash from Operations 1,175
Investment Activity
Sale of Fixed Assets 104
Net Cash from Investments 104
Numbers in millions

What is business risk?
• Uncertainty about future operating income (EBIT), i.e., how well can we predict operating income?
• Note that business risk does not include financing effects.
Probability
EBITE(EBIT)0
Low risk
High risk

What determines business risk?
Uncertainty about demand (sales)
• Uncertainty about output prices
• Uncertainty about costs
• Operating leverage

What is operating leverage, and how does it affect a firm’s business risk?
• Operating leverage is the use of fixed costs rather than variable costs.
• If most costs are fixed, hence do not decline when demand falls, then the firm has high operating leverage.

Effect of Operating Leverage
• More operating leverage leads to more business risk, for then a small sales decline causes a big profit decline.
Sales
$ Rev.TC
FC
QBE Sales
$ Rev.
TCFC
QBE
} Profit

Using Operating Leverage
• Typical situation: Can use operating leverage to get higher E(EBIT), but risk also increases.
Probability
EBITL
Low operating leverage
High operating leverage
EBITH

What is financial leverage?Financial risk?
• Financial leverage is the use of debt and preferred stock.
• Financial risk is the additional risk concentrated on common stockholders as a result of financial leverage.

Business Risk vs. Financial Risk
• Business risk depends on business factors such as competition, product liability, and operating leverage.
• Financial risk depends only on the types of securities issued.– More debt, more financial risk.– Concentrates business risk on stockholders.

An Example:Illustrating Effects of Financial Leverage
• Two firms with the same operating leverage, business risk, and probability distribution of EBIT.
• Only differ with respect to their use of debt (capital structure).
Firm U Firm L No debt $10,000 of 12% debt $20,000 in assets $20,000 in assets 40% tax rate 40% tax rate

Firm U: Unleveraged
Economy Bad Average Good Probability 0.25 0.50 0.25 EBIT $2,000 $3,000 $4,000 Interest 0 0 0 EBT $2,000 $3,000 $4,000 Taxes (40%) 800 1,200 1,600 NI $1,200 $1,800 $2,400
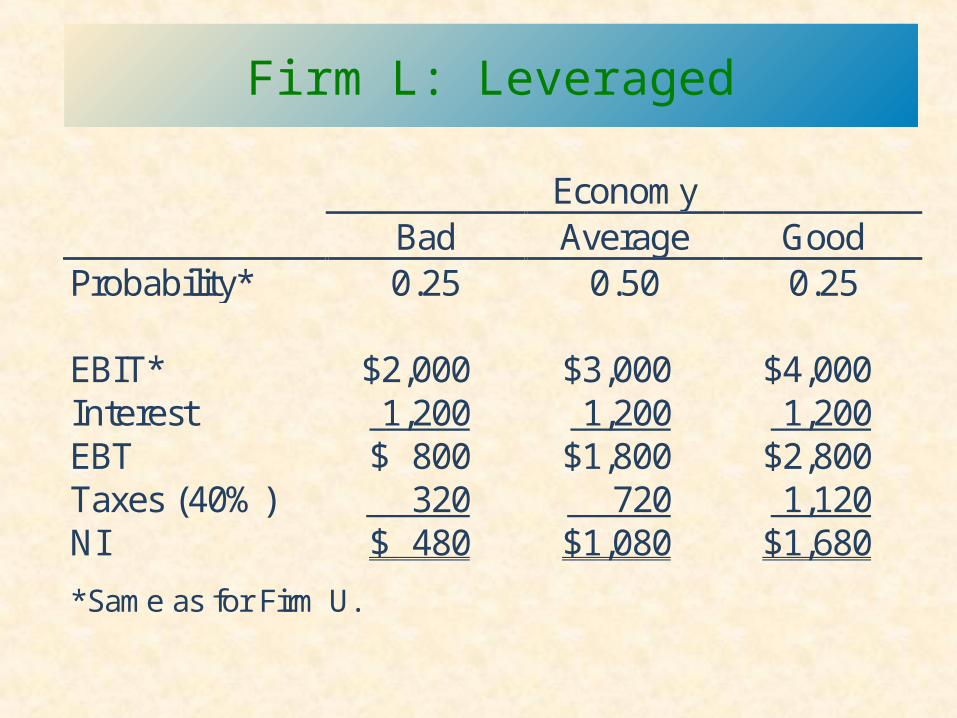
Firm L: Leveraged
Economy Bad Average Good Probability* 0.25 0.50 0.25 EBIT* $2,000 $3,000 $4,000 Interest 1,200 1,200 1,200 EBT $ 800 $1,800 $2,800 Taxes (40%) 320 720 1,120 NI $ 480 $1,080 $1,680 *Same as for Firm U.

Ratio Comparison Between Leveraged and Unleveraged Firms
Firm U Bad Average Good BEP 10.0% 15.0% 20.0% ROE 6.0 9.0 12.0 TIE Firm L Bad Average Good BEP 10.0% 15.0% 20.0% ROE 4.8 10.8 16.8 TIE 1.67× 2.50x 3.30x
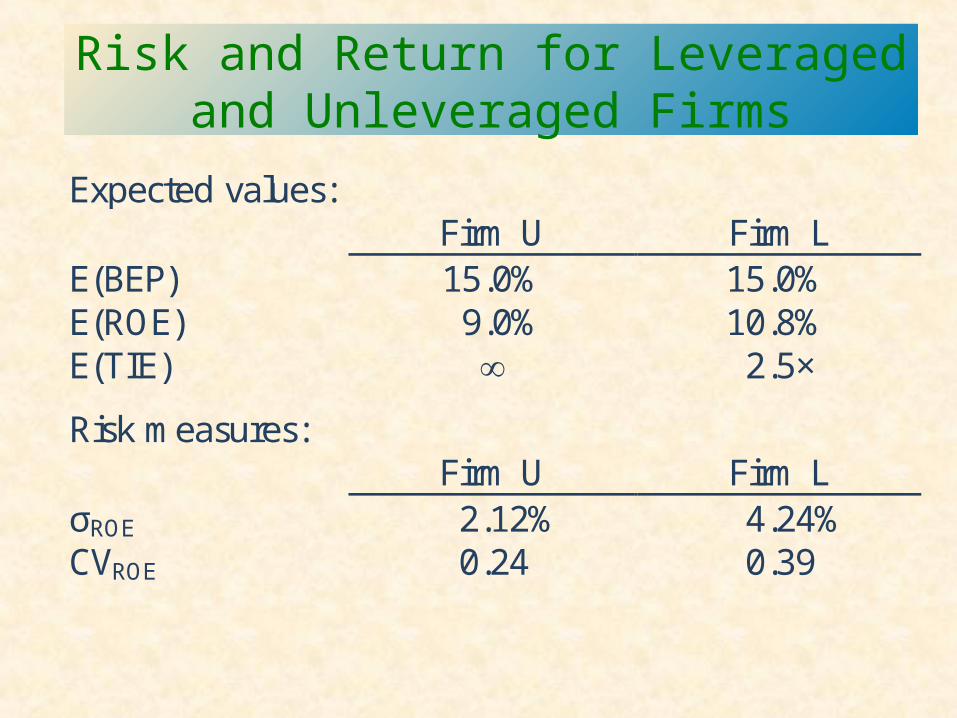
Risk and Return for Leveraged and Unleveraged Firms
Expected values: Firm U Firm L E(BEP) 15.0% 15.0% E(ROE) 9.0% 10.8% E(TIE) 2.5× Risk measures: Firm U Firm L σROE 2.12% 4.24% CVROE 0.24 0.39