Embed Size (px)
Citation preview
AVIATION INEGYPT
THE IMPACT ON TRAVEL & TOURISM,JOBS AND THE ECONOMY

CHAIRMAN:Vincent A.WolfingtonChairman EmeritusCarey International, Inc
VICE CHAIRMEN:Jean-Marc Espalioux Chairman of Management Board &CEOAccor
Jonathan S LinenVice ChairmanAmerican Express Company
EXECUTIVE COMMITTEE:Akbar Al BakerCEOQatar Airways
Peter ArmstrongPresident & CEORocky Mountaineer Railtours
Alex ChristouManaging PartnerAccenture
Andrew CosslettCEOInterContinental Hotels Group PLC
Sebastián EscarrerVice ChairmanSol Meliá
Manuel Fernando Espírito SantoChairmanEspírito Santo Tourism
Edouard EttedguiGroup Chief ExecutiveMandarin Oriental Hotel Group
Maurice Flanagan CBEVice Chairman & Group PresidentThe Emirates Group
Michael FrenzelChairmanTUI AG
Stephen P HolmesVice Chairman Cendant Corporation
Richard R KelleyChairmanOutrigger Enterprises, Inc
Geoffrey J W KentChairman & CEOAbercrombie & Kent
J W Marriott, JrChairman & CEOMarriott International, Inc
David MichelsChief Executive Hilton Group plcHilton International
Curtis NelsonPresident & COOCarlson Companies
Mike NessPresidentThe Travel Corporation
P R S OberoiChairmanThe Oberoi Group
Alan ParkerChief ExecutiveWhitbread PLC
Lalit SuriChairman & Managing DirectorBharat Hotels Ltd
Jonathan TischChairman & CEOLoews Hotels
GLOBAL MEMBERS:Giovanni AngeliniCEO & Managing DirectorShangri-La Hotels & Resorts
Ted BalestreriChairman & CEOCannery Row Company
Simón Barceló VadellCEOBarceló Hotels and Resorts
Henrik BartlManaging Director & Head of RealEstate Structured FinanceAareal Bank AG
Jürgen BaumhoffCEOQatar National Hotels Company
Raymond BicksonManaging DirectorThe Taj Group of Hotels
Regis Bulot Chairman of the Board Relais & Chateaux
Marilyn Carlson NelsonChairman & CEOCarlson Companies
Jennie ChuaChairmanRaffles International Ltd
David CliftonManaging Director, Europe & AsiaInterval International
Jim ComptonSenior VP, MarketingContinental Airlines
Fernando ConteChairman & CEOIberia,Airlines of Spain
Glen DavidsonSenior VP,Worldwide TravelInsurance & Related ServicesAmerican International Group, Inc
Alain DemissyPresident of the ExecutiveCommitteeMondial Assistance Group
Rod EddingtonChief Executive British Airways plc
Rakesh GangwalChairman, President & CEOWorldspan
Laurence GellerChairman & CEOStrategic Hotel Capital
Naresh GoyalChairman Jet Airways
Stelios Haji-IoannouChairman & FoundereasyGroup (UK) Ltd.
Arthur de HaastGlobal Chief Executive OfficerJones Lang Lasalle Hotels
Murray HennessyCEOAvis Europe Plc
Pansy HoManaging DirectorShun Tak Holdings Limited
Brent HobermanCo-Founder & CEOlastminute.com
James HoganPresident & Chief ExecutiveGulf Air
Samuel L KatzChairman & CEOTravel Distribution ServicesDivisionCendant Corporation
Larry KellnerChairman & CEOContinental Airlines
Sol KerznerChairman Kerzner International Ltd
Dara KhosrowshahiPresident & CEOExpedia Inc
Nigel KnowlesJoint CEODLA Piper Rudnick Gray Cary
J T KuhlmanCEOOne&Only Resorts
Krishna KumarVice ChairmanThe Taj Group of Hotels
Gerald LawlessChief Executive Jumeirah International
Leong Wai LengCEORaffles International Ltd
Manuel MartinPartnerCyberDodo Productions Ltd
Paul McManusPresident & CEOThe Leading Hotels of the World
Armin MeierPresident & CEOKuoni Travel Holding Ltd
Alan MulallyExecutive Vice PresidentThe Boeing Company
Devin J MurphyPresident & CEOCarey International, Inc
John M Noel President & CEOThe Noel Group
Tom NutleyChairmanReed Travel Exhibitions
Jean Gabriel PérèsPresident & CEOMövenpick Hotels & Resorts
Dionisio PestanaChairmanGroup Pestana
Fernando PintoCEOTAP Air Portugal
Nancy PoorSenior Vice President, OwnerRelationsCendant Hotel Group
Wolfgang Prock-SchauerChief Executive OfficerJet Airways
Bob PucciniCEO & PresidentThe Puccini Group
Duan Qiang ChairmanBeijing Tourism Group
David RadcliffeChief ExecutiveHogg Robinson plc
Kurt RitterPresident & CEORezidor SAS Hospitality
Christopher RodriguesCEOVisa International
Peter RogersPresident & CEODiners Club International
Carl RudermanChairmanUniversal Media
Mary SalfenGeneral Manager, Global Travel &Transportation IndustryIBM
Per SetterbergCEOGlobal Refund Group
Eric J SpeckExecutive Vice President& Chief Marketing OfficerSabre Holdings Corporation
Jean-Cyril SpinettaChairman & CEOAir France
David SteinChairmanThe Stein Group
Barry SternlichtChairman & CEOStarwood Hotels & Resorts
Ron StringfellowCEOTsogo Sun Group
Ian SwainPresidentSwain Tours
Andrew C TaylorPresident & CEOEnterprise Rent-a-Car
Kathleen TaylorPresident,Worldwide BusinessOperationsFour Seasons Hotels and Resorts
José Antonio TazónPresident & CEOAmadeus Global Travel Distribution
Jeffrey TofflerChairmanCoventry Partners
Simon Vincent CEOOpodo
Daniela WagnerManaging Director, Internationaloctopustravel.com
James WilsonChief Executive OfficerNakheel Co LLC
Philip WolfCEOPhoCusWright, Inc.
Peter YesawichChairman & CEOYesawich, Pepperdine,Brown & Russell
Mei YunxinPresidentBeijing Tourism Group
Sarmad ZokChief Executive OfficerKingdom Hotel Investments
HONORARY MEMBERS:André JordanChairmanAndré Jordan Group
Lord Marshall of KnightsbridgeChairmanPirelli UK plc
Sir Frank Moore,AOChairmanTaylor Byrne Tourism Group
Frank OlsonChairman of the BoardThe Hertz Corporation
Gérard PélissonCo-Chairman, Supervisory BoardAccor SA
Henry Silverman Chairman Cendant Corporation
Tommaso ZanzottoPresidentTZ Associates Ltd
CHAIRMAN EMERITUS:James D Robinson IIIGeneral PartnerRRE VenturesWTTC Chairman (1990-1994)
IMMEDIATE PAST CHAIRMAN:Sir Ian ProsserRetired ChairmanInterContinental Hotels GroupWTTC Chairman (2001-2003)
FORMER CHAIRMENHarvey Golub Retired Chairman & CEOAmerican Express CoWTTC Chairman (1996 – 2001)
Robert H. BurnsChairmanRobert H Burns Holdings LimitedWTTC Chairman (1994 – 1996)
PRESIDENT:Jean-Claude Baumgarten
Correct as at 7 October 2005
©2004 WORLD TRAVEL & TOURISM COUNCIL1-2 QUEEN VICTORIA TERRACE.SOVEREIGN COURT.LONDON E1W 3HA. UNITED KINGDOMTEL: +44 (0) 870 727 9882 or + 44 (0) 207 481 8007 • FAX: +44 (0) 870 728 9882 or + 44 (0) 207 488 1008 • [email protected] • www.wttc.org
1
INTRODUCTION............................................................................................................. 3
LIBERALIZATION IN THE GLOBAL AVIATION INDUSTRY..................................... 7
TRAVEL & TOURISM AND AIR TRANSPORT LIBERALIZATION......................... 13
RECENT TRENDS IN WORLD TOURISM AND CURRENT OUTLOOK ............. 15
ECONOMIC AND SOCIAL VALUE OF TRAVEL & TOURISM FOR EGYPT................... 20
EGYPTIAN AVIATION POLICIES AND THE AIR TRANSPORT INDUSTRY................... 23
SCENARIO FOR AIR TRANSPORT LIBERALIZATION IN EGYPT ....................... 30
CONCLUSIONS AND POLICY RECOMMENDATIONS ........................................... 36
REFERENCES AND DATA SOURCES ............................................................................................................... 39
APPENDIX ............................................................................................................................................................ 40
CONTENTS

3
This analysis assumes an important and strategic
role for the Travel & Tourism industry in Egypt,
bearing in mind that:
• The goals set by the Egyptian Government for
the growth of international tourist arrivals until 2011
and 2020 are objectively impossible to accomplish
with the current civil aviation and air transport
framework;
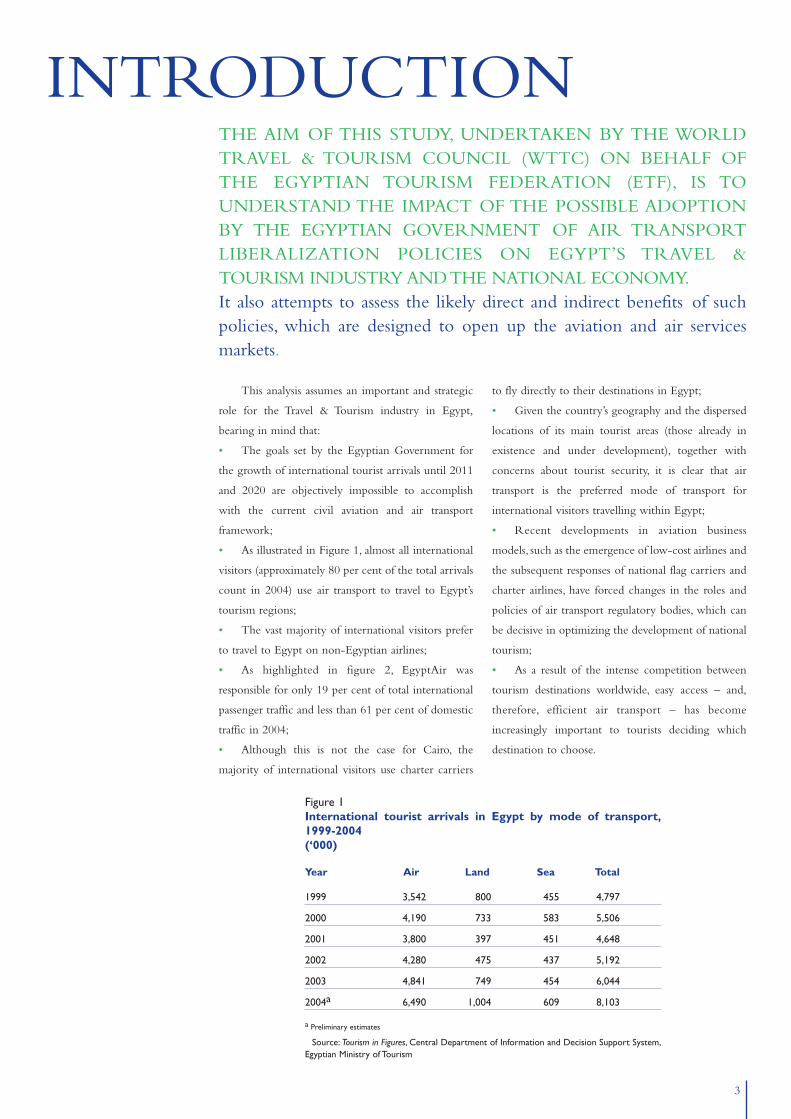
• As illustrated in Figure 1, almost all international
visitors (approximately 80 per cent of the total arrivals
count in 2004) use air transport to travel to Egypt’s
tourism regions;
• The vast majority of international visitors prefer
to travel to Egypt on non-Egyptian airlines;
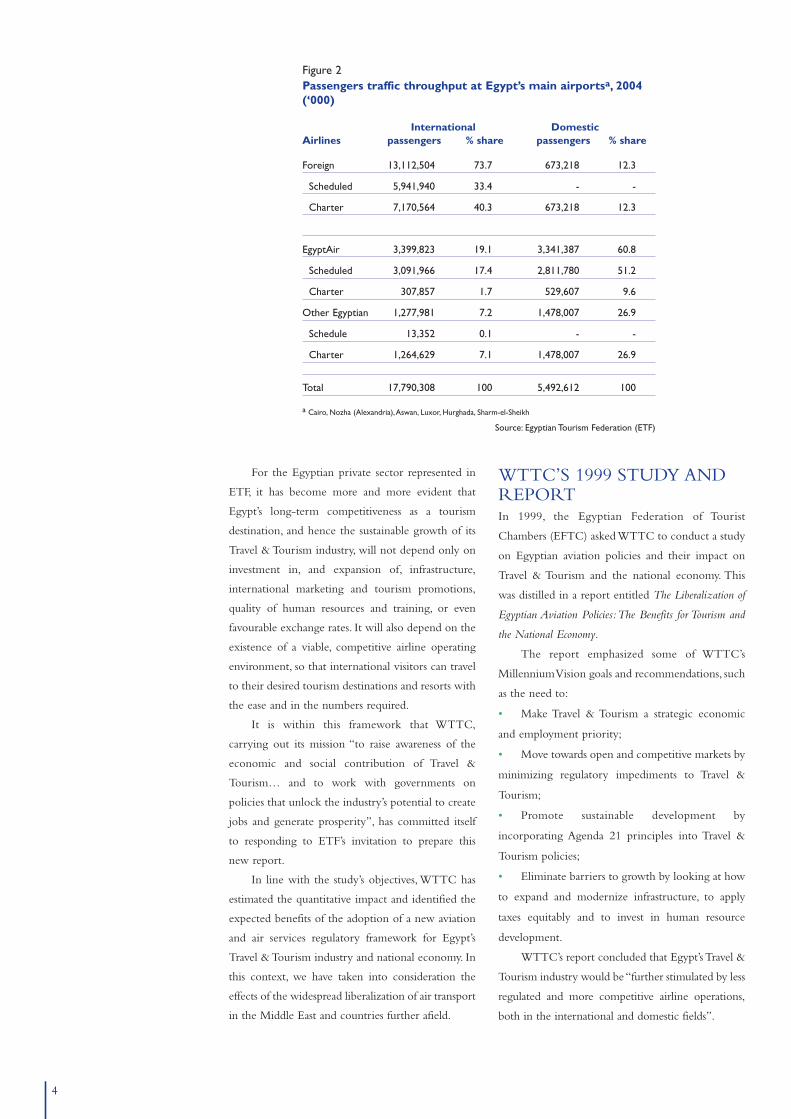
• As highlighted in figure 2, EgyptAir was
responsible for only 19 per cent of total international
passenger traffic and less than 61 per cent of domestic
traffic in 2004;
• Although this is not the case for Cairo, the
majority of international visitors use charter carriers
to fly directly to their destinations in Egypt;
• Given the country’s geography and the dispersed
locations of its main tourist areas (those already in
existence and under development), together with
concerns about tourist security, it is clear that air
transport is the preferred mode of transport for
international visitors travelling within Egypt;
• Recent developments in aviation business
models, such as the emergence of low-cost airlines and
the subsequent responses of national flag carriers and
charter airlines, have forced changes in the roles and
policies of air transport regulatory bodies, which can
be decisive in optimizing the development of national
tourism;
• As a result of the intense competition between
tourism destinations worldwide, easy access – and,
therefore, efficient air transport – has become
increasingly important to tourists deciding which
destination to choose.
THE AIM OF THIS STUDY, UNDERTAKEN BY THE WORLDTRAVEL & TOURISM COUNCIL (WTTC) ON BEHALF OFTHE EGYPTIAN TOURISM FEDERATION (ETF), IS TOUNDERSTAND THE IMPACT OF THE POSSIBLE ADOPTIONBY THE EGYPTIAN GOVERNMENT OF AIR TRANSPORTLIBERALIZATION POLICIES ON EGYPT’S TRAVEL &TOURISM INDUSTRY AND THE NATIONAL ECONOMY.It also attempts to assess the likely direct and indirect benefits of suchpolicies, which are designed to open up the aviation and air servicesmarkets.
INTRODUCTION
Figure 1International tourist arrivals in Egypt by mode of transport,1999-2004 (‘000)
Year Air Land Sea Total
1999 3,542 800 455 4,797
2000 4,190 733 583 5,506
2001 3,800 397 451 4,648
2002 4,280 475 437 5,192
2003 4,841 749 454 6,044
2004a 6,490 1,004 609 8,103
a Preliminary estimates
Source: Tourism in Figures, Central Department of Information and Decision Support System,Egyptian Ministry of Tourism
44
Figure 2Passengers traffic throughput at Egypt’s main airportsa, 2004 (‘000)
International DomesticAirlines passengers % share passengers % share
Foreign 13,112,504 73.7 673,218 12.3
Scheduled 5,941,940 33.4 - -
Charter 7,170,564 40.3 673,218 12.3
EgyptAir 3,399,823 19.1 3,341,387 60.8
Scheduled 3,091,966 17.4 2,811,780 51.2
Charter 307,857 1.7 529,607 9.6
Other Egyptian 1,277,981 7.2 1,478,007 26.9
Schedule 13,352 0.1 - -
Charter 1,264,629 7.1 1,478,007 26.9
Total 17,790,308 100 5,492,612 100
a Cairo, Nozha (Alexandria),Aswan, Luxor, Hurghada, Sharm-el-Sheikh
Source: Egyptian Tourism Federation (ETF)
For the Egyptian private sector represented in
ETF, it has become more and more evident that
Egypt’s long-term competitiveness as a tourism
destination, and hence the sustainable growth of its
Travel & Tourism industry, will not depend only on
investment in, and expansion of, infrastructure,
international marketing and tourism promotions,
quality of human resources and training, or even
favourable exchange rates. It will also depend on the
existence of a viable, competitive airline operating
environment, so that international visitors can travel
to their desired tourism destinations and resorts with
the ease and in the numbers required.
It is within this framework that WTTC,
carrying out its mission “to raise awareness of the
economic and social contribution of Travel &
Tourism… and to work with governments on
policies that unlock the industry’s potential to create
jobs and generate prosperity”, has committed itself
to responding to ETF’s invitation to prepare this
new report.
In line with the study’s objectives, WTTC has
estimated the quantitative impact and identified the
expected benefits of the adoption of a new aviation
and air services regulatory framework for Egypt’s
Travel & Tourism industry and national economy. In
this context, we have taken into consideration the
effects of the widespread liberalization of air transport
in the Middle East and countries further afield.
WTTC’S 1999 STUDY ANDREPORTIn 1999, the Egyptian Federation of Tourist
Chambers (EFTC) asked WTTC to conduct a study
on Egyptian aviation policies and their impact on
Travel & Tourism and the national economy. This
was distilled in a report entitled The Liberalization of
Egyptian Aviation Policies:The Benefits for Tourism and
the National Economy.
The report emphasized some of WTTC’s
Millennium Vision goals and recommendations, such
as the need to:
• Make Travel & Tourism a strategic economic
and employment priority;
• Move towards open and competitive markets by
minimizing regulatory impediments to Travel &
Tourism;
• Promote sustainable development by
incorporating Agenda 21 principles into Travel &
Tourism policies;
• Eliminate barriers to growth by looking at how
to expand and modernize infrastructure, to apply
taxes equitably and to invest in human resource
development.
WTTC’s report concluded that Egypt’s Travel &
Tourism industry would be “further stimulated by less
regulated and more competitive airline operations,
both in the international and domestic fields”.
55
In addition,WTTC recognized the need for a phased
approach towards full deregulation of international air
services and, in accordance with this, formulated some
recommendations as to the gradual implementation of
these policies.As an example, it recommended:
• The liberalization of existing bilateral
agreements and that some of the restrictive
provisions of the existing bilaterals (namely those
that limit capacity and designate a second Egyptian
airline on the most heavily travelled routes) should
be relaxed. Egypt should also support a program of
regional aviation liberalization;
• The removal of restrictions on international
charter operations (especially by eliminating the
existing regulation which limits charter operations to
Cairo International Airport);
• The privatization of EgyptAir;
• The ending of EgyptAir’s monopoly on
domestic routes, allowing private airlines to provide
competitive services on major sectors; and
• The prevention of predatory and exclusionary
behaviour.
In conclusion, WTTC reiterated that “the
adoption of these policies to create more open and
competitive airline operations will bring major
benefits to the Travel & Tourism industry in Egypt,
and will increase the vital contribution which the
industry makes to the country’s wealth and
employment”.
EVALUATION OF THE 1999REPORT’SRECOMMENDATIONSIt is now more than five years since the results of the
1999 study were released, and it is quite clear from
the current regulatory framework and operating
environment for Travel & Tourism and air transport
that the Egyptian Government and local authorities
were very responsive to most of the conclusions and
recommendations in the report. The Egyptian
authorities have also been very keen to ensure that
the country reacts positively to the new Travel &
Tourism challenges.
In fact, Travel & Tourism has become an
industry of strategic importance and a major priority
for government, as witnessed by:
• The increased investment in tourism
infrastructure;
• The reinforcement of international marketing
and promotional activities;
• The development of new resorts;
• Improvements in safety and security; and
• Investment in the training of Travel & Tourism
personnel.
It is also evident that favourable exchange rates
have been largely responsible for Egypt’s exceptional
price-competitiveness in the main European tourist
markets.
At the same time, monetary and fiscal policy
decisions have encouraged national and foreign
private investment in tourism development, not only
improving the quality of the national offer in
accommodation and entertainment, but also
attracting major international hotel and tourism
brands to Egypt.
Although these policies have contributed to the
growth of international visitors and tourism revenues
over the period 2000 to 2004, Egypt’s growth has
been modest in comparison with that of several of its
competitors, such as Turkey, Jordan, Bulgaria, and the
Lebanon and similar to that of Croatia, the United
Arab Emirates (UAE), Morocco and Saudi Arabia.
Nevertheless, when analyzing WTTC’s
recommendations for the creation of a more open
and more competitive air transport market, it should
be stressed that the Egyptian Government has taken
only minor initiatives in this area.This has prevented
the country’s Travel & Tourism sector from achieving
its full growth potential and has discouraged the
development of private Egyptian Travel & Tourism
groups. In addition, it has impeded the creation of
strong private airlines, as well as the development of
a more competitive Egyptian airline system.
Finally, the Egyptian authorities have not
heeded WTTC’s recommendation to open up direct
charter services to Cairo International Airport. As a
consequence, this has prevented the industry and the
national economy from taking full advantage of the
potential for growth of tourism flows and receipts,
thereby limiting the increase in Travel & Tourism
employment throughout the country.
The Egyptian air services regulatory
environment is characterized by:
• Restrictions regarding the operation of charter
services to Cairo International Airport;
• Numerous limitations and constraints as to the
operations of privately owned Egyptian airlines,
especially on the major domestic and international
6
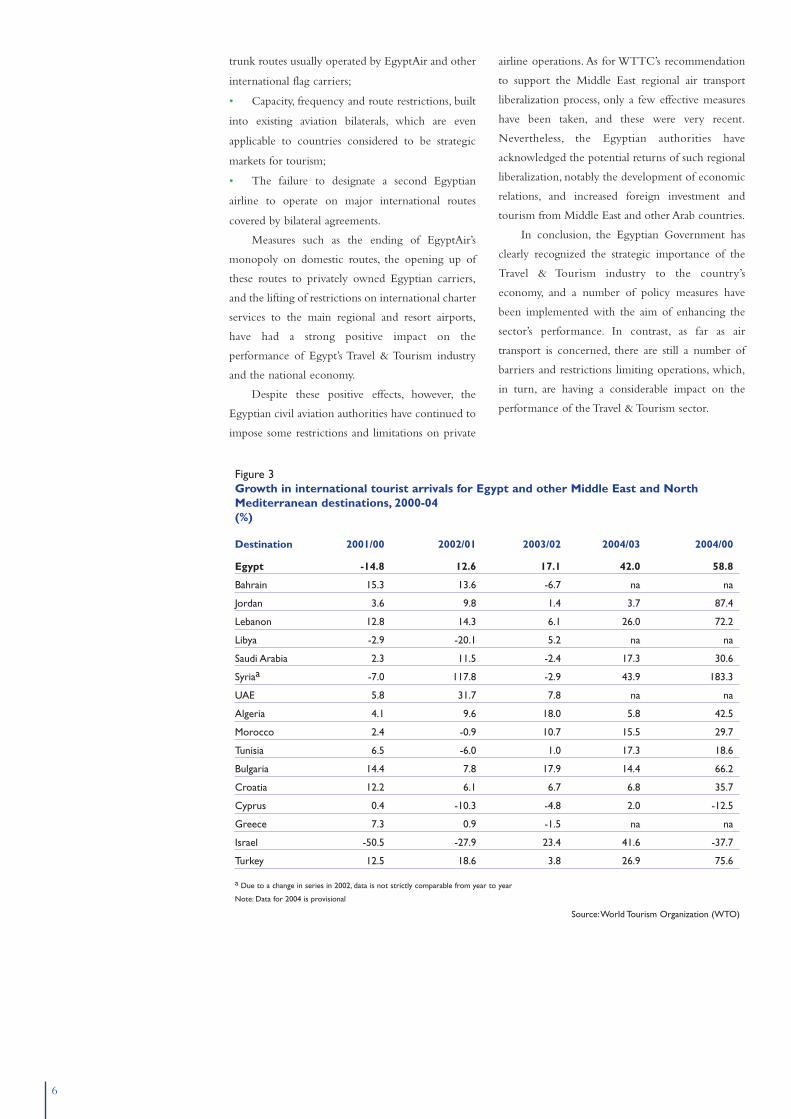
Figure 3Growth in international tourist arrivals for Egypt and other Middle East and NorthMediterranean destinations, 2000-04 (%)
Destination 2001/00 2002/01 2003/02 2004/03 2004/00
Egypt -14.8 12.6 17.1 42.0 58.8
Bahrain 15.3 13.6 -6.7 na na
Jordan 3.6 9.8 1.4 3.7 87.4
Lebanon 12.8 14.3 6.1 26.0 72.2
Libya -2.9 -20.1 5.2 na na
Saudi Arabia 2.3 11.5 -2.4 17.3 30.6
Syriaa -7.0 117.8 -2.9 43.9 183.3
UAE 5.8 31.7 7.8 na na
Algeria 4.1 9.6 18.0 5.8 42.5
Morocco 2.4 -0.9 10.7 15.5 29.7
Tunisia 6.5 -6.0 1.0 17.3 18.6
Bulgaria 14.4 7.8 17.9 14.4 66.2
Croatia 12.2 6.1 6.7 6.8 35.7
Cyprus 0.4 -10.3 -4.8 2.0 -12.5
Greece 7.3 0.9 -1.5 na na
Israel -50.5 -27.9 23.4 41.6 -37.7
Turkey 12.5 18.6 3.8 26.9 75.6
a Due to a change in series in 2002, data is not strictly comparable from year to year
Note: Data for 2004 is provisional
Source:World Tourism Organization (WTO)
trunk routes usually operated by EgyptAir and other
international flag carriers;
• Capacity, frequency and route restrictions, built
into existing aviation bilaterals, which are even
applicable to countries considered to be strategic
markets for tourism;
• The failure to designate a second Egyptian
airline to operate on major international routes
covered by bilateral agreements.
Measures such as the ending of EgyptAir’s
monopoly on domestic routes, the opening up of
these routes to privately owned Egyptian carriers,
and the lifting of restrictions on international charter
services to the main regional and resort airports,
have had a strong positive impact on the
performance of Egypt’s Travel & Tourism industry
and the national economy.
Despite these positive effects, however, the
Egyptian civil aviation authorities have continued to
impose some restrictions and limitations on private
airline operations. As for WTTC’s recommendation
to support the Middle East regional air transport
liberalization process, only a few effective measures
have been taken, and these were very recent.
Nevertheless, the Egyptian authorities have
acknowledged the potential returns of such regional
liberalization, notably the development of economic
relations, and increased foreign investment and
tourism from Middle East and other Arab countries.
In conclusion, the Egyptian Government has
clearly recognized the strategic importance of the
Travel & Tourism industry to the country’s
economy, and a number of policy measures have
been implemented with the aim of enhancing the
sector’s performance. In contrast, as far as air
transport is concerned, there are still a number of
barriers and restrictions limiting operations, which,
in turn, are having a considerable impact on the
performance of the Travel & Tourism sector.
7
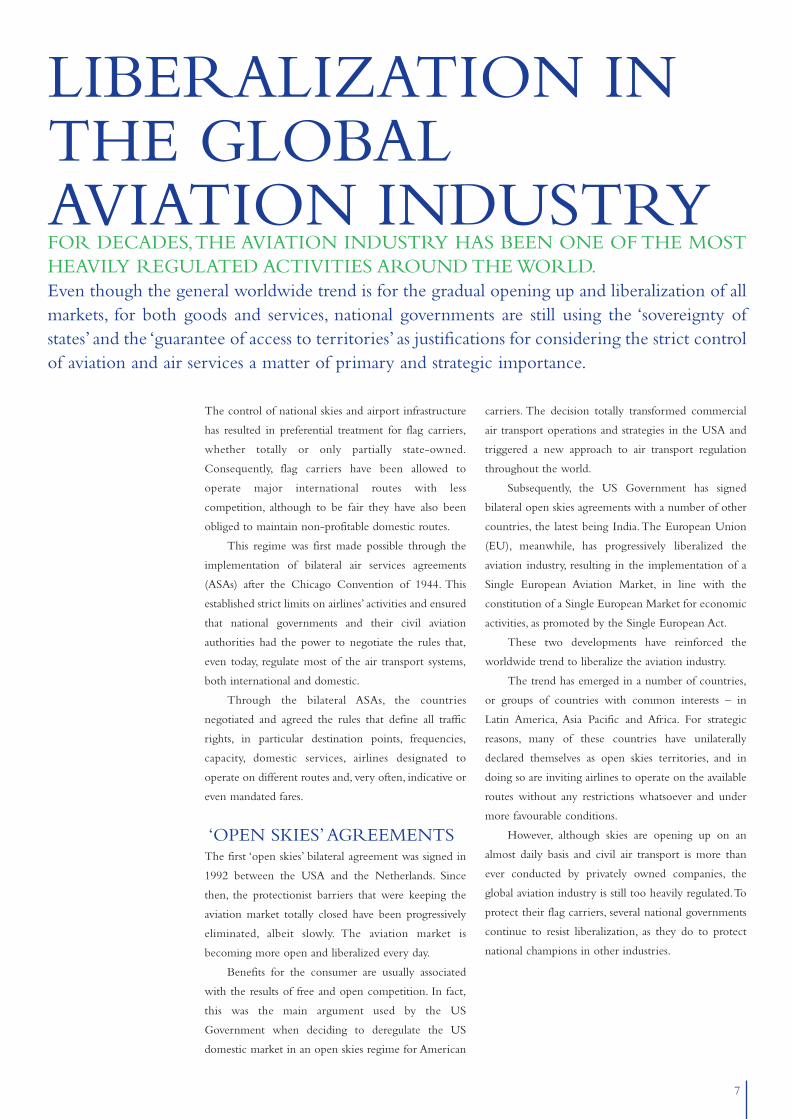
LIBERALIZATION INTHE GLOBALAVIATION INDUSTRYFOR DECADES,THE AVIATION INDUSTRY HAS BEEN ONE OF THE MOSTHEAVILY REGULATED ACTIVITIES AROUND THE WORLD.Even though the general worldwide trend is for the gradual opening up and liberalization of allmarkets, for both goods and services, national governments are still using the ‘sovereignty ofstates’ and the ‘guarantee of access to territories’ as justifications for considering the strict controlof aviation and air services a matter of primary and strategic importance.
The control of national skies and airport infrastructure
has resulted in preferential treatment for flag carriers,
whether totally or only partially state-owned.
Consequently, flag carriers have been allowed to
operate major international routes with less
competition, although to be fair they have also been
obliged to maintain non-profitable domestic routes.
This regime was first made possible through the
implementation of bilateral air services agreements
(ASAs) after the Chicago Convention of 1944. This
established strict limits on airlines’ activities and ensured
that national governments and their civil aviation
authorities had the power to negotiate the rules that,
even today, regulate most of the air transport systems,
both international and domestic.
Through the bilateral ASAs, the countries
negotiated and agreed the rules that define all traffic
rights, in particular destination points, frequencies,
capacity, domestic services, airlines designated to
operate on different routes and, very often, indicative or
even mandated fares.
‘OPEN SKIES’AGREEMENTSThe first ‘open skies’ bilateral agreement was signed in
1992 between the USA and the Netherlands. Since
then, the protectionist barriers that were keeping the
aviation market totally closed have been progressively
eliminated, albeit slowly. The aviation market is
becoming more open and liberalized every day.
Benefits for the consumer are usually associated
with the results of free and open competition. In fact,
this was the main argument used by the US
Government when deciding to deregulate the US
domestic market in an open skies regime for American
carriers. The decision totally transformed commercial
air transport operations and strategies in the USA and
triggered a new approach to air transport regulation
throughout the world.
Subsequently, the US Government has signed
bilateral open skies agreements with a number of other
countries, the latest being India.The European Union
(EU), meanwhile, has progressively liberalized the
aviation industry, resulting in the implementation of a
Single European Aviation Market, in line with the
constitution of a Single European Market for economic
activities, as promoted by the Single European Act.
These two developments have reinforced the
worldwide trend to liberalize the aviation industry.
The trend has emerged in a number of countries,
or groups of countries with common interests – in
Latin America, Asia Pacific and Africa. For strategic
reasons, many of these countries have unilaterally
declared themselves as open skies territories, and in
doing so are inviting airlines to operate on the available
routes without any restrictions whatsoever and under
more favourable conditions.
However, although skies are opening up on an
almost daily basis and civil air transport is more than
ever conducted by privately owned companies, the
global aviation industry is still too heavily regulated.To
protect their flag carriers, several national governments
continue to resist liberalization, as they do to protect
national champions in other industries.
8
REGIONAL LIBERALIZATIONAir transport liberalization and the adoption of bilateral open skies
agreements have provided travellers with a range of direct benefits, as
well as indirectly benefiting national economies. Recognition of the
extent of these benefits has encouraged many countries to pursue
regional agreements. Motives include cultural, ethnic or language
affinities, geographic proximity or contiguity, and a desire to strengthen
regional economic, commercial and / or political integration.
The signing of regional agreements has been strongly supported by
different US governments, in defence of their airlines’ interests and
traffic rights. The agreement between the USA and Canada, for
example, led to significant developments in so-called ‘regional
agreements’.
In the EU area, almost all restrictions and barriers imposed on
aviation and airline services have now been eliminated. EU airlines can
operate freely between two ‘points’ in different EU countries, including
servicing ‘cabotage’ routes. They are allowed to launch new routes or
operations in any EU country, and are entitled to acquire control of
airlines in any member state, providing that EU competition rules and
regulations are adhered to.
Australia and New Zealand have agreed on a ‘Trans Tasmanian
Single Aviation Market’ and the Latin American countries of Mercosur
(Argentina, Brazil, Paraguay, Uruguay and Chile) are making efforts to
develop a single civil aviation market, in the framework of their
economic and political integration. This is also happening with the
Andean Pact countries (Bolivia, Colombia, Ecuador, Peru and
Venezuela) and with Central American States (Guatemala, Nicaragua, El
Salvador and Honduras), all of which already have open skies
agreements with the USA.
These countries all expect the different processes of liberalization
to ensure easier, faster and cheaper access to the respective destinations,
whether inside or outside the different groups, and to stimulate
competition between their national airlines. In addition, they expect the
progressive opening of their skies to bring significant commercial and
economic benefits to their regions.
In Asia, the governments of a number of countries came to an
agreement about the urgent need for further progress in the
liberalization of the region’s air transport. Using the Association of
South East Asian Nations (ASEAN) as a platform, China, Hong Kong,
Singapore and Thailand are defining a roadmap of political decisions and
technical steps to be taken that would result in the lifting of all
restrictions regarding capacity, frequency, etc in the operations of
national airlines between capital cities by 2008. Furthermore, the
roadmap also calls for a regional open skies framework to be in place by
2015. ASEAN governments acknowledge the benefits of opening up
their markets and of air transport liberalization for their economies,
even if this exposes their flag carriers to more aggressive domestic and
international competition.
However, the most important development in the future – the
likely conclusion of current negotiations between the USA and EU –
will be the creation of a Common Aviation Area, which will almost
certainly also include Canada, thereby covering approximately 50 per
cent of international civil aviation traffic. This will give a powerful
impetus to the consolidation of similar regional agreements already
under negotiation or development in other parts of the world.
Although countries and regions are at different stages of
negotiation and implementation, the widespread adoption of liberal
regional air services agreements is certainly moving forward worldwide.
The liberalization of air transport between the Middle East and
other Arab countries is part of this process.
AVIATION LIBERALIZATION IN THEMIDDLE EAST AND THE ARABWORLDAfter a number of years of controversial and unsuccessful discussions
between the civil aviation authorities of the Arab countries, especially
those in the Middle East region, the issue of aviation and air services
liberalization gained momentum during the Annual General Meeting of
the Arab Air Carriers Organization (AACO), held in Amman, Jordan in
2004.
Faced with the threats of a unilateral imposition of competition
rules by the EU, pressure from the US Government for the elimination
of anti-competitive and less transparent practices, and a strong desire of
some Gulf states to end subsidies for their state-owned airlines,AACO
members recommended that a number of initiatives should be taken to
open up their markets and liberalize their air transport operations.
The main initiative proposed was for the establishment of a
Common Arab Aviation Market, under the auspices of the Arab Civil
Aviation Commission (ACAC).
The idea of a Common Arab Aviation Market was first conceived
in 2000, when ACAC proposed a phased programme for the
liberalization of air transport between Arab states, subsequently
endorsed by the organization’s General Assembly held on May 18.
This programme comprised four phases:
• During the first phase, from November 2000 to October 2002,
Arab civil aviation authorities would take the necessary measures to
abolish all restrictions on cargo and charter flights, making available
suitable administrative and regulatory facilities without the imposition
of additional aviation charges.
• During the second stage, from November 2002 to October 2004,
Arab civil aviation authorities would liberalize scheduled airline
services, allowing a 40:60 per cent capacity split between each pair of
airlines operating a route, without restricting capacity.
• During the third stage, from November 2004 to October 2006,
Arab civil aviation authorities would continue with full deregulation of
third and fourth freedom traffic rights, with no restrictions between the
Arab countries.
• During the fourth phase, from November 2006, civil aviation
authorities would grant fifth freedom traffic rights between the Arab
states. The implementation of this final stage would depend on the
evaluation of the preceding stages, and would take place after the legal
framework for liberalization were established.
9
The following would also have to be ensured:
• The guarantee of competitive rights and non-
discriminatory status, with a mechanism to solve
disputes;
• The adoption of supply-and-demand market rules
in the definition of air transport charges between Arab
states;
• Co-operation in marketing and code sharing for
onward domestic connections in the respective
countries; and
• Careful evaluation of the results of each phase
before moving on to next one.
With regard to the legal execution of the
programme, it was understood that the different phases
should be accomplished through bilateral agreements,
as a way of developing an appropriate air transport
system between all the Arab states.
In addition, at its 14th Summit, the Arab League
supported a resolve to apply air traffic rights between
the Arab states, in line with a decision taken earlier by
the Council of Ministers for Transport. Furthermore,
the Arab League authorized the Council of Ministers
for Transport to follow up on and monitor the
programme’s execution, submitting a detailed report on
the progress of its implementation.
Another important step is the plan for a
multilateral regional liberalization agreement. It is
agreed that this should include a set of practical
measures related to market opening, including an
arbitration scheme to deal with disputes. In addition, a
specific entity should be given responsibility for
monitoring and preventing the adoption of less
transparent and anti-competitive practices in civil
aviation by the signatory countries.
In line with the trend towards liberalization, the
national airlines of several Middle East and other Arab
countries have been making efforts in parallel to adapt
to the new demands of the global marketplace. These
include clearing their balance sheets, promoting
network co-ordination, and taking advantage of the
potential synergies made possible by the development
of regional hubs.
AACO recently announced that six Middle East
airlines, including EgyptAir, are planning to launch a
Multilateral Arab Civil Aviation Alliance in 2006,
aiming for better schedule co-ordination and code
sharing in their networks. Other AACO member
carriers from North African countries are closely
following the move, and will decide later if they will
join this Arab Alliance. Most of these airlines, not yet
involved in any global alliance, are pushing for regional
liberalization in order to develop co-operatively their
aviation operations to strategic markets, and compete
more strongly with larger international players on
major routes to and from Middle East and North
African Arab countries. It is quite clear that, if it is to
succeed, this project needs a more open regional air
transport environment.
A regional agreement is also a prerequisite for the
implementation and success of policies that are being
pursued by several governments towards the
privatization of their flag carriers.
THE IMPACT OF AIRTRANSPORTLIBERALIZATIONAs we have seen, the air transport liberalization
processes and the consequent opening up of civil air
transport markets have had a significant impact on the
aviation industry.
Major concerns expressed by national
governments have usually been associated with the
survival of their flag carriers in a globally competitive
environment, coupled with the likelihood of job losses,
the possible discontinuation of public interest routes
and possible compromises in safety and security
standards. Nevertheless, these concerns are today
generally considered disproportionate, or even
unfounded.
Although some airlines, especially those in the
USA, did not survive the aggressive competition of
new entrants known as low-cost or no-frills carriers,
the majority of traditional airlines have taken the
opportunity not only to restructure themselves, but
also to improve their efficiency in the marketplace, to
improve their customer service, and to contribute
better to the countries’ overall economic interests. In
some cases, the number of jobs created by the start-up
airlines, or so-called new entrants, has outweighed the
number of jobs lost. New airlines have taken advantage
of the market opening to fly to new destinations, or on
existing routes which in the past had been operated by
the traditional national carriers as monopolies.
The strong competition introduced by the
operation of several airlines on main trunk or
secondary routes has led to price reductions and to
changes in the way consumers view air transport.
Consumers now benefit from a wider range of choices
in terms of destinations, frequencies, quality and type of
service. The greater transparency of airfares and the
widespread use of the internet has turned air transport
into a really competitive sector, and has persuaded
traditional airlines to adopt revolutionary strategies
10
concerning customer loyalty and pricing, to the benefit of consumers
and without compromising safety and security standards.
Finally, the main impact has probably been on air transport
business models, especially in cases where emerging low-cost airlines
have competed strongly with – and to the detriment of – charters and
traditional flag carriers. Their operations have resulted in a marked
growth in the number of available seats at lower rates on the vast
majority of routes and, consequently, have led to a huge increase in the
number of travellers. Passengers now have easy and immediate access to
online ticket booking so the decision-making process is more
spontaneous and independent.
CASE STUDIESThe International Civil Aviation Organization (ICAO) collects and
disseminates comprehensive data on the experiences of different
member states in the area of liberalization.
This section examines the particular air transport liberalization
experiences of Spain, Greece, the Lebanon, Jordan, Dubai, Bahrain and
India, including the effects on the market entry/exit of individual
airlines, routes operated, fares applied, etc.
Spain fully deregulated its aviation and air services market in
1993. Before then, scheduled air services were restricted to the airlines
of the Iberia Group as a state concession and eight national carriers
were permitted to operate non-scheduled, or charter services.Ten years
later, besides Iberia, seven other private airlines now provide scheduled
services, and charters are operated by five carriers.While non-scheduled
traffic accounted for 15 per cent of overall domestic traffic in 1992, it
represented a share of barely 2 per cent ten years later.
Therefore, the impact of deregulation in Spain can be summed up
as follows:
• In 2002, two or three airlines operated on 40 per cent of the routes
where there was real competition, accounting for 82 per cent of the
traffic.
• Airline freedom to set fares has brought great benefits. Before
1992, fares required government approval (and they were closely related
to operating costs and route mileage) and the use of promotional fares
was rare.After 1993, although there was a general rise in the basic fare
levels, competition allowed passengers to travel at really attractive prices,
as a result of the extensive use of promotional airfares by all airlines.
• The whole domestic route network underwent a major
restructuring between 1992 and 2001. Operations ceased on 19 routes,
but services started up on 42 new routes.
• The entry of new airlines into the scheduled airline market began
around 1993-94, when Air Europa and Spanair expanded their
operations from traditional intra-European charter routes to higher-
density scheduled routes.After 1995, three new regional operators – Air
Nostrum,Air Europe Express and Aebal – entered the market, resulting
in a total of eight airlines in 2001.After a short period, Pan Air and Air
Europa Express abandoned the scheduled market in 2002, but all the
key airlines that had won market access continued their operations.
• The huge increase in the frequency of scheduled airline services
was boosted by the simultaneous development of Madrid and Barcelona
airports as regional hubs for the three major airlines and the entry of
regional operators into the mainland Spain market.As an example, there
was a spectacular increase – from 112 weekly frequencies in 1994 to 441
in 2001 – on the Madrid-Barcelona route.The switch from charter to
scheduled airline operations of a major share of traffic on routes to the
Canary and Balearic Islands also had a big impact.
• The overall domestic market – scheduled and non-scheduled
services – grew by 48 per cent in terms of traffic from 1992 to 2001,
with Madrid and Barcelona airports showing an increase in domestic
traffic throughput of 74 per cent and 64 per cent, respectively.
Greece first started making changes to its protectionist regulatory
framework in 1991, in anticipation of the Single European Aviation
Market. Until then, Olympic Airways enjoyed a monopoly in terms of
air transport operations. Although the new 1991 regulation allowed
aircraft registered in Greece to operate non-scheduled services of all
kinds – passenger, cargo and air taxi operations, international and/or
domestic flights – as well as international scheduled cargo flights, the
country’s monopolistic air transport regime ended only with the
implementation of the EU’s Third Liberalization Package in 1994.The
1991 legislation also lowered legal barriers to entry and permitted new
Greek operators to enter the market. Air transport liberalization in
Greece promoted greater competition, as is evidenced by the main
changes in key parameters, such as:
• During the early years of liberalization of the domestic market
(until 1999), the main players were Olympic Airways, its subsidiary
Olympic Aviation, Air Greece, Aegean Airlines and Cronus Airlines.
These early years of liberalization were characterized by the rapid
expansion of the industry and by the significant development of the
domestic market, since bigger new entrants started to compete with
Olympic. In 1999, Greece’s air transport industry underwent major
change – there were numerous mergers and acquisitions, licenses were
cancelled and new carriers failed. By September 2002, only 16 airlines
held a valid license. Nevertheless, only two of them were key players –
Olympic Airways and Aegean-Cronus – reflecting the current trend
towards consolidation.
• Before liberalization, airfare policy was subject to the approval of
the Price Committee of the Ministry of National Economy, which used
to take into consideration factors such as inflation rates and specific
route characteristics, eg whether they provided a social benefit. With
the coming into force of EU Regulation 2409/02, this practice for
establishing airfares was modified, with low-cost airlines offering
promotional fares, especially during the low season, and further
discounts being available to students, senior citizens and others.Today, as
there are two major airlines competing on 12 major routes in Greece,
published fares are at around the same level as they used to be.
• Olympic Airways, Olympic Aviation and the new entrants have
increased frequencies on domestic routes.
• With the inauguration of charter and scheduled services to/from
new domestic and European destinations and the increase in frequencies
on domestic routes, consumers enjoy a wider range of travel options.
Some Middle East countries, such as the Lebanon, Jordan, Dubai
11
potential has begun to be unlocked. This is in large part due to the
phased introduction of a more liberal air transport policy.
The Indian airline industry was nationalized in 1953 and remained
so for nearly 40 years.Although the country’s two national carriers,Air
India and Indian Airlines, are still government owned, gradual aviation
liberalization has led to Indian-owned private airlines operating
scheduled and charter flights on domestic routes and, more recently,
internationally.
After the domestic airline industry began to be liberalized in the
early 1990s, six privately owned airlines started domestic scheduled
operations. Domestic traffic immediately increased by more than 20 per
cent a year in 1992, 1993 and 1994.
After the liberalization of charter operations, the number of
incoming charter flights grew from 225 in 1992 to 982 in 1994,
contributing to an annual increase of 5 per cent in international tourist
arrivals.
India’s first low-cost airline,Air Deccan, was launched in 2003 and
carried over a million passengers in its first year of operation. In 2005
it expects to increase this number to four million. Six other no-frills
airlines have started operations in the past two years, and other start-ups
are due to be launched in the next months. Indian low-cost airlines
have announced that they plan to buy 220 new planes in the next five
years – more than the total number of planes currently being operated
by all Indian carriers, including Air India and Indian Airlines.
Jet Airways and Air Sahara, the first two privately owned domestic
airlines, are now able to operate internationally. Jet Airways now
currently serves Colombo, Kuala Lumpur, London and Singapore and
Air Sahara serves Colombo and Singapore.
The Indian Government is also gradually opening up its skies,
creating new opportunities for foreign carriers, allowing them to
operate as many flights to India as they want – but during peak season
only for the time being.
Although it is clear that there is still a long way to go, the Indian
Government is firmly committed to liberalizing the civil aviation
industry. Signs of its intentions were clear when it recently renegotiated
aviation bilateral agreements with the USA, UK and China, allowing
for an exceptional increase in the number of flights and in designated
airlines and destinations, which has stimulated a more aggressive and
competitive air transport environment.
As a result of this courageous policy, air traffic to India is growing at 20
per cent annually, and international arrivals increased last year by 15 per
cent, providing a significant boost to the Travel & Tourism industry and
the country’s economy as a whole.
Finally, thanks to air transport deregulation in India, state-owned Air
India and Indian Airlines are becoming increasingly efficient in order to
survive in the more competitive aviation marketplace.
and Bahrain, have also adopted and benefited from air transport
liberalization.
In line with its goal of increasing international tourist arrivals in
the country, the Lebanon began to implement an open skies policy in
2000. This included granting fifth freedom traffic rights without
reciprocity. As a result the Lebanon has made considerable progress in
terms of liberalization:
• An autonomous Civil Aviation Authority was established as a
regulator, replacing the Directorate General of Civil Aviation that
reported to the Ministry of Public Works and Transport.The Lebanese
national carrier, Middle East Airlines, has so far benefited from the open
skies policy, registering its first profit since the mid-1970s in 2002;
• Beirut International Airport offers significant potential for air
traffic growth, since its capacity of six million passengers a year is double
the current passenger volume.
Another country that is looking to boost tourism development is
Jordan, which has also adopted a policy of economic and trade
liberalization. The government is trying to establish an open aviation
regime and to implement a comprehensive regulatory framework for
civil aviation.Although air traffic between the EU and Jordan is limited
in absolute terms, it experienced uninterrupted growth between 1991
and 2001, when the overall Jordanian economy was hard hit by the
September 11, 2001 (9/11) attacks. In 2003, two-thirds of all scheduled
traffic between the EU and Jordan was operated by the flag carrier
Royal Jordanian, the privatization of which was put on hold after 9/11,
and which continues to profit from the considerable support of the
Government of Jordan. Most interesting, however, is the desire of the
government to develop Queen Alia Amman airport into an important
hub on the Mediterranean side of the Middle East.
Dubai has been operating an open skies regime from the start,
welcoming any foreign airline that wants to fly to the destination, even
in competition with the national flag carrier, Emirates. In particular,
Dubai has an open skies agreement with the USA and more than 100
airlines link Dubai with 145 international destinations. Emirates has
thrived on competition, making a profit in all but one year since it was
founded in 1985. Last year, despite the negative impact of terrorism and
nearby war, the airline’s net profit climbed 73 per cent and passenger
numbers increased by 23 per cent.
Bahrain signed an open skies agreement with Singapore on April
18, 2005.With the aim of boosting tourism, trade and investments, this
agreement removed all restrictions on passenger flights for their national
airlines, enabling them to operate freely on any route between and
beyond the two countries, without frequency limits.
The correlation between growth in the Travel & Tourism industry
and a more liberalized aviation and air transport environment is also
clearly demonstrated by the case of India.
With a population of more than one billion and a fast growing
middle class, India is now one of the world’s booming tourism
economies. WTTC’s 2005 Tourism Satellite Account (TSA) research
ranked India third in terms of long-term growth (to 2015).
While the world has been aware of the huge potential for Travel &
Tourism in India for many years, it is only relatively recently that this

13
As the other side of the same coin, easier and cheaper
air access to tourism destinations is undoubtedly
responsible for the revolution in consumer behaviour
with regard to Travel & Tourism.
New developments in aviation technology, airport
infrastructure and IT have made it possible for millions
of passengers from the main generating markets to
travel more frequently to short-, medium- and long-
haul tourism destinations around the globe’s five
continents.
There is no doubt that civil aviation and tourism
are today integral and inseparable parts of the global
Travel & Tourism industry of the 21st century.
Recognizing this, national governments and
international and regional industry organizations are
calling for improved co-ordination between air
transport, airport infrastructure, tourism investment
and tourism development policies.
The increasing contribution of the Travel &
Tourism industry to national economies and regional
development makes air transport liberalization, and
total or partial open skies policies, major issues in
countries’ economic and political agenda. Both
developed or developing countries, for which tourism
is a main source of wealth and job creation, and which
are looking for foreign investment to better exploit and
manage their natural, scenic, historical or cultural
resources for tourism purposes, are now in the front
line pushing for air transport liberalization.
In this quest to realize the full potential of Travel
& Tourism,WTTC has always fought against barriers to
development and, in this regard, open air access is
crucial.
WTTC’S VISION AND MAININITIATIVES IN AIRTRANSPORTLIBERALIZATIONTravel & Tourism is a major contributor to national,
regional and global development, and its contribution
to national economies is expected to increase even
further in the 21st century.
This growth is dependent on an expanding air
transport system, and at no time in the past years has
there been so much debate about the future of airline
and aviation operations and services, and the need for
new approaches to the problems of air transport. Some
measures have been taken, but much more needs to be
done.
The general liberalization of the world trading
environment creates an encouraging background for
new aviation policies. Moreover, internal changes and
new business models in the airline industry are having
a similar effect. Global alliances, code-sharing
agreements and other inter-airline arrangements are
changing the face and structure of the industry and
producing new pressures to discard restrictive bilaterals.
WTTC advocates four options for aviation
liberalization:
• A global agreement – either sector specific,
developed through the International Civil Aviation
Organization (ICAO), or as part of a broader trade
agreement like GATS (General Agreement on Trade in
Services);
• A limited multilateral agreement – regional, inter-
regional or between a group of like-minded states;
• A core of liberal bilateral agreements – a web of
agreements, built up by a group of core states with
common liberal bilaterals;
TRAVEL & TOURISMAND AIR TRANSPORTLIBERALIZATIONIT IS WIDELY RECOGNIZED TODAY THAT ONE OF THE MAIN REASONSBEHIND THE DECISION BY GOVERNMENTS TO OPEN UP NATIONALSKIES IS THE NEED TO CATER TO THE GROWING DEMAND FOR AIRTRANSPORT GENERATED BY THE WORLDWIDE INCREASE IN TRAVEL &TOURISM.
14
• A new attitude of governments with regard to traffic rights.
The first and best of these, a global agreement for multilateral
liberalization, still seems very unlikely for many years.
Today, the best prospects for making progress towards a freer
aviation regulatory framework lie in the following directions:
• The development of a core of standard liberal bilaterals (eg US
bilateral open skies agreements);
• The pursuit of aviation liberalization within specific trading regions
(eg the EU’s Open Skies Single Market);
• The encouragement by governments for agreements between
regions to create wider areas of free trade in air transport, in particular
between inbound and outbound markets.
According to WTTC, these policies can be pursued in parallel
because they are not mutually exclusive. The basic objectives of
liberalization remain unchanged: it is only the route towards them that
changes.
WTTC believes that the case for aviation liberalization now has
wide support and continues to be very strong.What is really missing is
the political will and courage to push in the right direction and
implement the necessary changes.
To a large extent this is because aviation policies are controlled by
people who think that the strategic importance of aviation requires
strong regulatory controls, different from other industries.
Air transport liberalization has always been a high priority for
WTTC because a market-oriented air transport system is vital to secure
the full economic benefits of Travel & Tourism. Liberalizing air transport
can contribute to facilitating world trade.The issues at stake go beyond
the concerns of airlines and air transport regulators alone.
Everyone involved in the growth of Travel & Tourism and trade
development has a vital interest in air transport liberalization.
To achieve its goal of aviation liberalization,WTTC is:
• Promoting the adoption of standard clauses for liberal bilateral
agreements, and encouraging their use wherever possible;
• Encouraging the adoption of liberal multilateral aviation policies;
• Supporting moves towards regional multilateral liberal aviation
agreements, which will create larger and freer markets between regions;
• Helping other economic, trade and tourism authorities understand
that aviation liberalization is essential to maximize the economic
benefits of international tourism;
• Giving wide circulation to the above-mentioned principles and
policies to all those who can bring pressure to bear on governments to
adopt the policies proposed.
WTTC believes that it is through these continuing pressures that
the benefits of freer trade will be recognized, and air transport in the 21st
century will come of age as an innovative, competitive, strong and
mature industry.As this happens, the world will also enjoy the expanded
economic and social benefits of a more rapidly growing Travel &
Tourism industry.
15
RECENT TRENDS INWORLD TOURISMAND CURRENTOUTLOOK RECENT STATISTICS FROM THE WORLD TOURISM ORGANIZATION(WTO) INDICATE THAT TOURISM REPRESENTS APPROXIMATELY 7 PERCENT OF GLOBAL EXPORTS OF GOODS AND SERVICES, MAKING IT THEFOURTH LARGEST EXPORT SECTOR IN THE WORLD.
These figures confirm the impact of the industry on both developed
and developing economies, contributing not only to rising GDP, as well
as increased wealth and employment generation, but also to the
encouragement of capital investment and an increase in foreign
exchange earnings.
During the three years from 2001-03, global Travel & Tourism
suffered four depressing scourges – economic downturns or recessions in
some major tourism generating markets, widespread terrorist attacks
(9/11, Djerba, Bali, Mombasa, etc), subsequent military conflicts in
Afghanistan and Iraq, and the SARS epidemic. But 2004 recorded the
best annual growth in tourism of the last 20 years, with international
tourist arrivals up 10 per cent over 2003’s level. At the same time there
have been substantial changes in tourist patterns and behaviour. While
these are due in part to growing concerns about security and to increased
price sensitivity, the main driver has been the rapid rise of no-frills airline
services, which has stimulated demand.These changes include:
• Increased travel frequency, but for shorter trips, in less expensive
destinations closer to home, often involving lower categories of travel
and accommodation;
• Enthusiastic adoption of the new intra-regional routes offered by
low-cost airlines (which have consolidated their position in Europe and
are growing rapidly in Asia Pacific and the Middle East);
• An increasing trend to ‘do it yourself ’ and last-minute booking,
stimulated and facilitated by the internet;
• Taking advantage of the aggressive price competition between
destinations, which has led to an increasing need for all industry players
to innovate and diversify in terms of product development and
marketing.
Fortunately, during 2004 and the early months of 2005, improved
economic and geopolitical conditions have boosted consumer
confidence. And preliminary estimates for global tourism performance
in the first half of 2005 confirm the sustained recovery.
In addition to an economic upturn in major generating markets
(especially the USA and Asia) and to renewed consumer confidence,
2004’s rebound was also due to the recovery of long-haul demand, a
return to growth in air traffic and more favourable exchange rates in
certain key source markets.
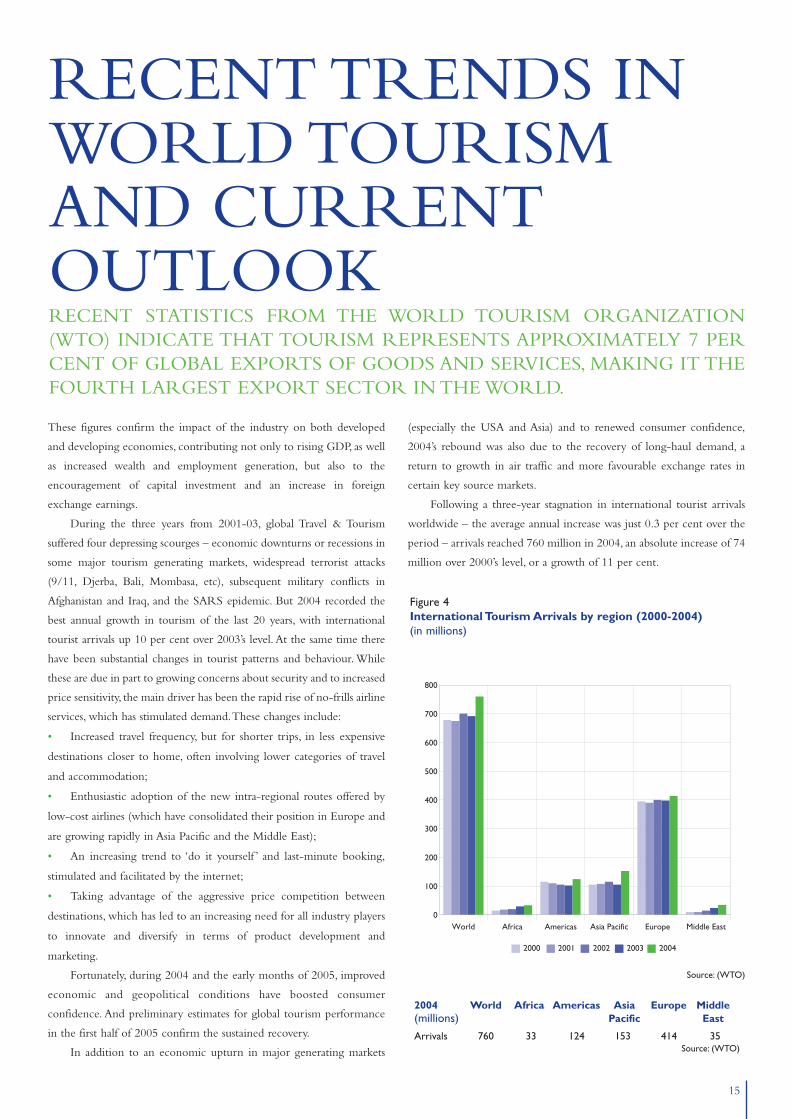
Following a three-year stagnation in international tourist arrivals
worldwide – the average annual increase was just 0.3 per cent over the
period – arrivals reached 760 million in 2004, an absolute increase of 74
million over 2000’s level, or a growth of 11 per cent.
World Africa Americas Asia Pacific Europe Middle East0
100
200
300
400
500
600
700
800
2000 2001 2002 2003 2004
Figure 4International Tourism Arrivals by region (2000-2004)(in millions)
Source: (WTO)
2004 World Africa Americas Asia Europe Middle(millions) Pacific East
Arrivals 760 33 124 153 414 35Source: (WTO)
16
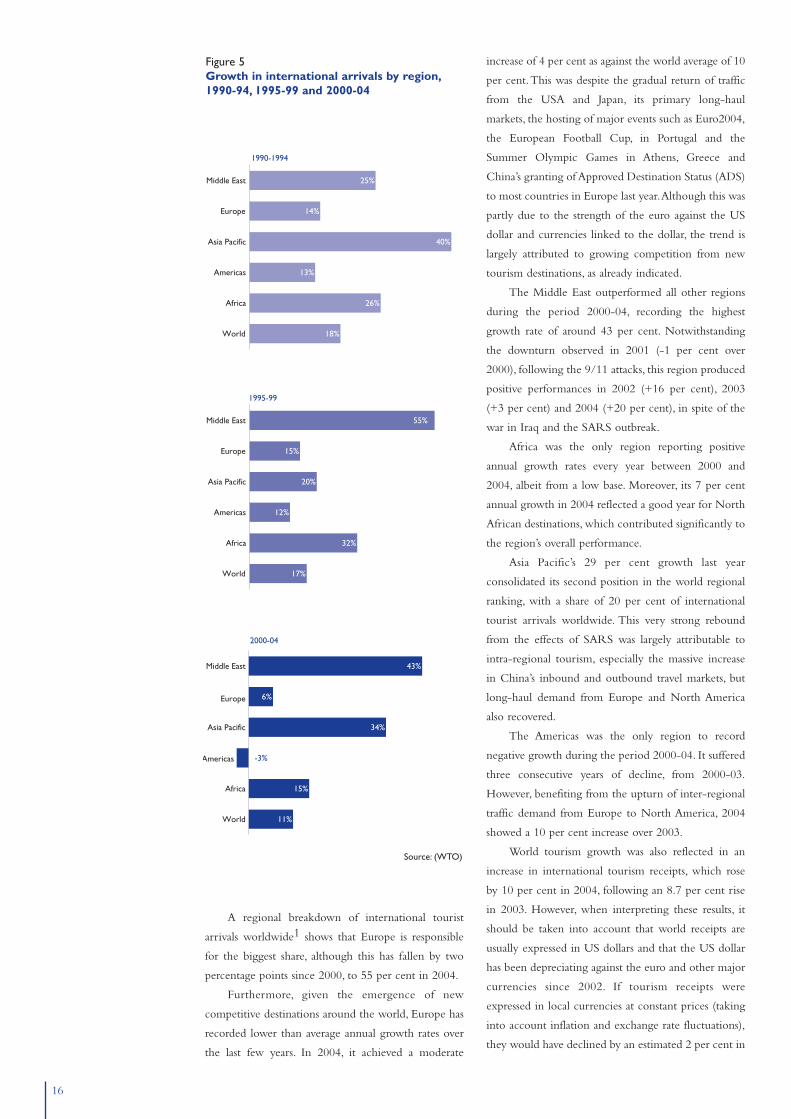
A regional breakdown of international tourist
arrivals worldwide1 shows that Europe is responsible
for the biggest share, although this has fallen by two
percentage points since 2000, to 55 per cent in 2004.
Furthermore, given the emergence of new
competitive destinations around the world, Europe has
recorded lower than average annual growth rates over
the last few years. In 2004, it achieved a moderate
increase of 4 per cent as against the world average of 10
per cent.This was despite the gradual return of traffic
from the USA and Japan, its primary long-haul
markets, the hosting of major events such as Euro2004,
the European Football Cup, in Portugal and the
Summer Olympic Games in Athens, Greece and
China’s granting of Approved Destination Status (ADS)
to most countries in Europe last year.Although this was
partly due to the strength of the euro against the US
dollar and currencies linked to the dollar, the trend is
largely attributed to growing competition from new
tourism destinations, as already indicated.
The Middle East outperformed all other regions
during the period 2000-04, recording the highest
growth rate of around 43 per cent. Notwithstanding
the downturn observed in 2001 (-1 per cent over
2000), following the 9/11 attacks, this region produced
positive performances in 2002 (+16 per cent), 2003
(+3 per cent) and 2004 (+20 per cent), in spite of the
war in Iraq and the SARS outbreak.
Africa was the only region reporting positive
annual growth rates every year between 2000 and
2004, albeit from a low base. Moreover, its 7 per cent
annual growth in 2004 reflected a good year for North
African destinations, which contributed significantly to
the region’s overall performance.
Asia Pacific’s 29 per cent growth last year
consolidated its second position in the world regional
ranking, with a share of 20 per cent of international
tourist arrivals worldwide. This very strong rebound
from the effects of SARS was largely attributable to
intra-regional tourism, especially the massive increase
in China’s inbound and outbound travel markets, but
long-haul demand from Europe and North America
also recovered.
The Americas was the only region to record
negative growth during the period 2000-04. It suffered
three consecutive years of decline, from 2000-03.
However, benefiting from the upturn of inter-regional
traffic demand from Europe to North America, 2004
showed a 10 per cent increase over 2003.
World tourism growth was also reflected in an
increase in international tourism receipts, which rose
by 10 per cent in 2004, following an 8.7 per cent rise
in 2003. However, when interpreting these results, it
should be taken into account that world receipts are
usually expressed in US dollars and that the US dollar
has been depreciating against the euro and other major
currencies since 2002. If tourism receipts were
expressed in local currencies at constant prices (taking
into account inflation and exchange rate fluctuations),
they would have declined by an estimated 2 per cent in
World
Africa
Americas
Asia Pacific
Europe
Middle East
18%
26%
13%
40%
14%
25%
1990-1994
World
Africa
Americas
Asia Pacific
Europe
Middle East
17%
32%
12%
20%
15%
55%
1995-99
World
Africa
Americas
Asia Pacific
Europe
Middle East
11%
15%
-3%
34%
6%
43%
2000-04
Figure 5Growth in international arrivals by region,1990-94, 1995-99 and 2000-04
Source: (WTO)
17
2003 over 2002. For the four-year period 2000-04, international tourism receipts increased more slowly than
tourist arrivals – by an average of nearly 7 per cent a year.
In the Middle East region, three countries enjoy a very large share of inbound tourism, accounting
between them for about two-thirds of total international tourist arrivals in the region.These are Saudi Arabia,
the United Arab Emirates and Egypt.
International arrivals in Egypt reached 8.1 million in 2004, up 42 per cent over the previous year.This
means that Egypt alone generates approximately 23 per cent of international arrivals in the Middle East and
around 1 per cent of the global tourism market.
Figure 6 compares Egypt’s performance with that of some of its competitors in the Middle East and East
Mediterranean.
EGYPT’S TRAVEL & TOURISM PERFORMANCEOver the three-year period 2000-03, international tourist arrivals in Egypt grew by 10 per cent – ten
times more than the world average growth over the same period2.According to the WTTC report 2004 Travel
& Tourism Economic Research – Egypt’s Travel & Tourism Forging Ahead, in terms of growth in demand for tourism
in 2004, the country ranked 14th in the world and second in the region, after Tunisia, in terms of Total
Demand.
As illustrated in figures 7 and 8 which follow, Egypt suffered a decline in arrivals in 2001, attributed to
the 9/11 attacks and the counter-terrorism war in Afghanistan, which prevented the country’s tourism sector
realizing its full potential during the period 2000-03 and from returning to the growth rates achieved in 1999
and 2000, which were relatively higher than those of other Middle East destinations.
The first signs of recovery in 2002 and the higher positive growth rates realized in 2003 and 2004 reflect
in part the positive impact of international marketing campaigns, following the impact of the SARS outbreak
in Asia and of the depreciation of the US dollar against the euro.
The Egyptian tourism authorities have been making concerted efforts to promote Egypt as a safe
destination, especially after the inordinate damage caused by recent local incidents, including the plane crash in
Figure 6International tourist arrivals and tourism receipts for Egypt and otherMiddle East and North Mediterranean destinations, 2004
Arrivals % change Receipts % changeDestination (mn) 2004/00 (èmn) 2004/00
Egypt 8,100 58.8 6,125 41.0
Bahrainb 2,955 22.1 654 5.5
Jordan 2,013 87.4 826 -23.1
Lebanon 1,278 72.2 1,278 204.1
Libyab 142 -18.4 70 -33.3
Saudi Arabiac 8,600 30.6 6,542 91.4
Syriaa 4,011 43.9 2,220 105.2
UAE 5,871b 50.3b 1,593 49.9
Algeria 1,234 42.5 142b 36.5b
Morocco 5,501 29.7 3,921 92.3
Tunisia 5,998 18.6 1,910 13.6
Bulgaria 4,630 66.2 2,168 101.9
Croatia 7,912 35.7 6,973 109.1
Cyprus 2,349 -12.5 2,096 8.2
Greece 13,969b 6.7b 12,872 39.6
Israel 1,506 -37.7 2,383 -68.8
Turkey 16,835 75.6 15,888 108.1
a Due to a change in series in 2002, data is not strictly comparable from year to yearb 2003 data and 2003/00 % change c % change in receipts for 2004/02
Source: (WTO)
18
Sharm-el-Sheikh at the beginning of 2003 and the terrorist bombings
in Taba and Nuweiba in October 2004.
This promotional investment has been focused on new products
and services, and its impact has been boosted by a number of external
factors such as the devaluation of the Egyptian pound, the easing of
entry formalities into the country, the expansion and modernization of
airport facilities, and the continuation of the Egyptian Government’s
Charter Flight Support Programme, instigated after the Luxor massacre
of November 1997.
The growth in international tourism to Egypt is also reflected in
an increase in average length of stay – up to 8.8 nights in 2003 and 10.1
nights in 2004, or an 84 per cent increase over 20003.
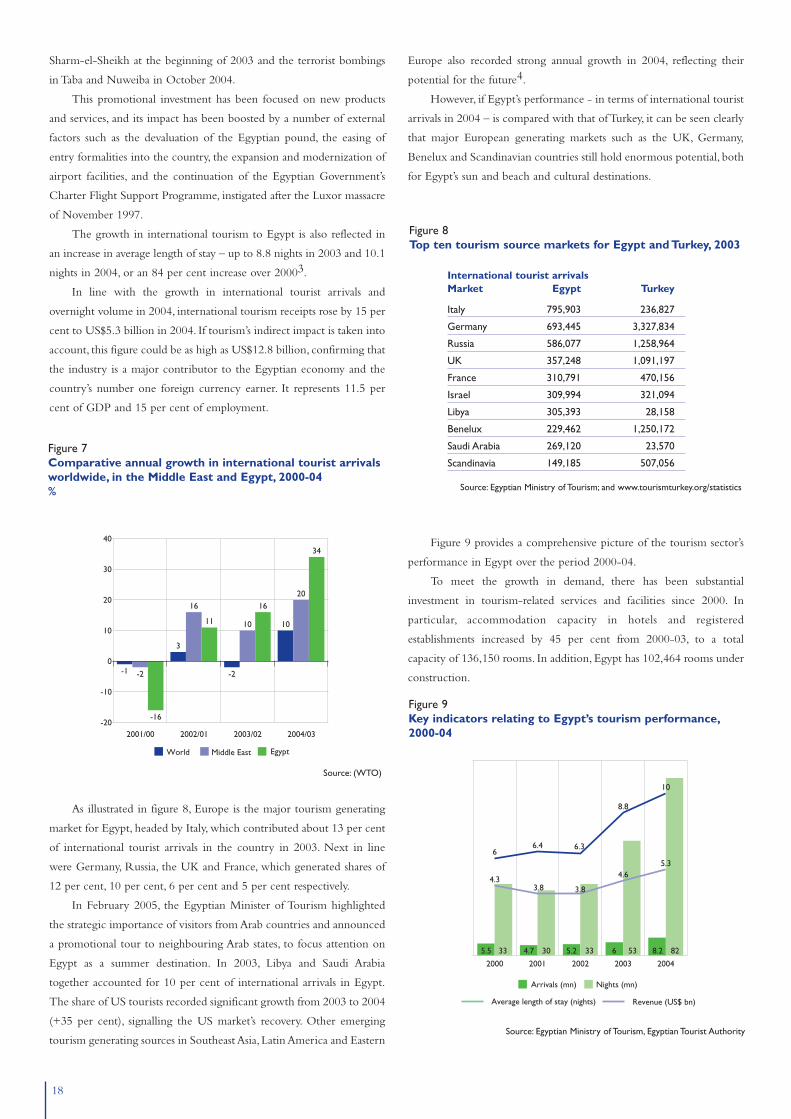
In line with the growth in international tourist arrivals and
overnight volume in 2004, international tourism receipts rose by 15 per
cent to US$5.3 billion in 2004. If tourism’s indirect impact is taken into
account, this figure could be as high as US$12.8 billion, confirming that
the industry is a major contributor to the Egyptian economy and the
country’s number one foreign currency earner. It represents 11.5 per
cent of GDP and 15 per cent of employment.
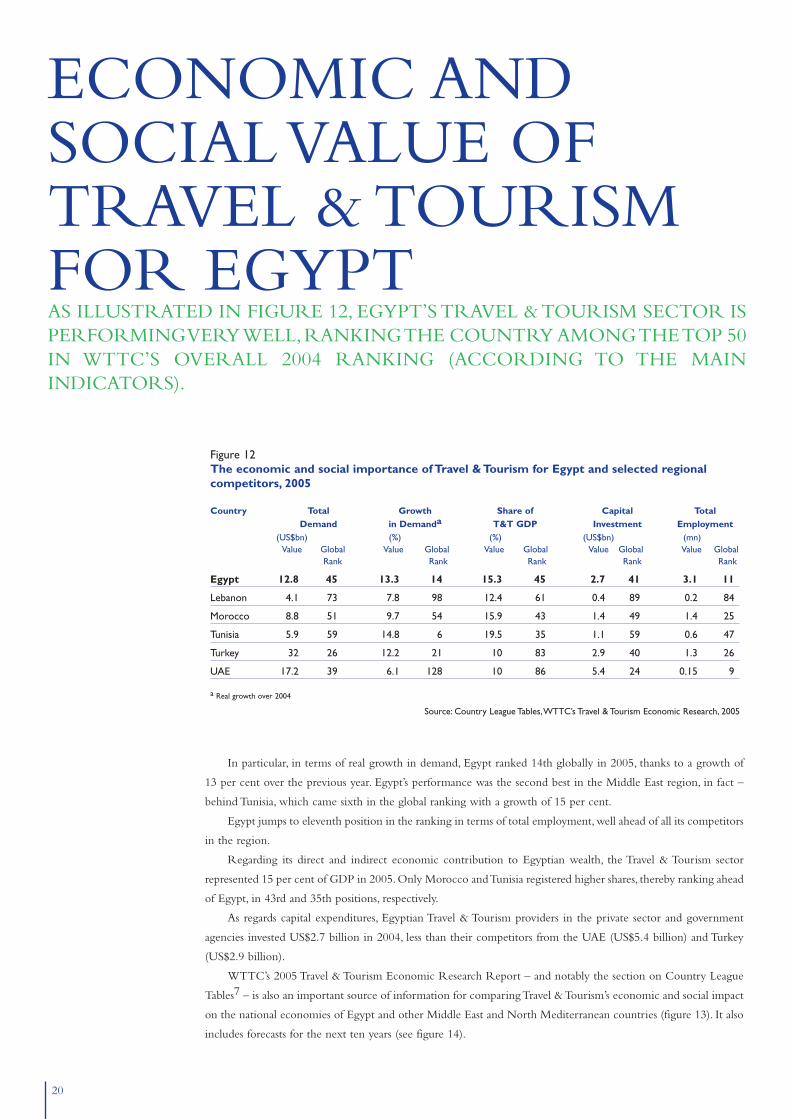
As illustrated in figure 8, Europe is the major tourism generating
market for Egypt, headed by Italy, which contributed about 13 per cent
of international tourist arrivals in the country in 2003. Next in line
were Germany, Russia, the UK and France, which generated shares of
12 per cent, 10 per cent, 6 per cent and 5 per cent respectively.
In February 2005, the Egyptian Minister of Tourism highlighted
the strategic importance of visitors from Arab countries and announced
a promotional tour to neighbouring Arab states, to focus attention on
Egypt as a summer destination. In 2003, Libya and Saudi Arabia
together accounted for 10 per cent of international arrivals in Egypt.
The share of US tourists recorded significant growth from 2003 to 2004
(+35 per cent), signalling the US market’s recovery. Other emerging
tourism generating sources in Southeast Asia, Latin America and Eastern
Europe also recorded strong annual growth in 2004, reflecting their
potential for the future4.
However, if Egypt’s performance - in terms of international tourist
arrivals in 2004 – is compared with that of Turkey, it can be seen clearly
that major European generating markets such as the UK, Germany,
Benelux and Scandinavian countries still hold enormous potential, both
for Egypt’s sun and beach and cultural destinations.
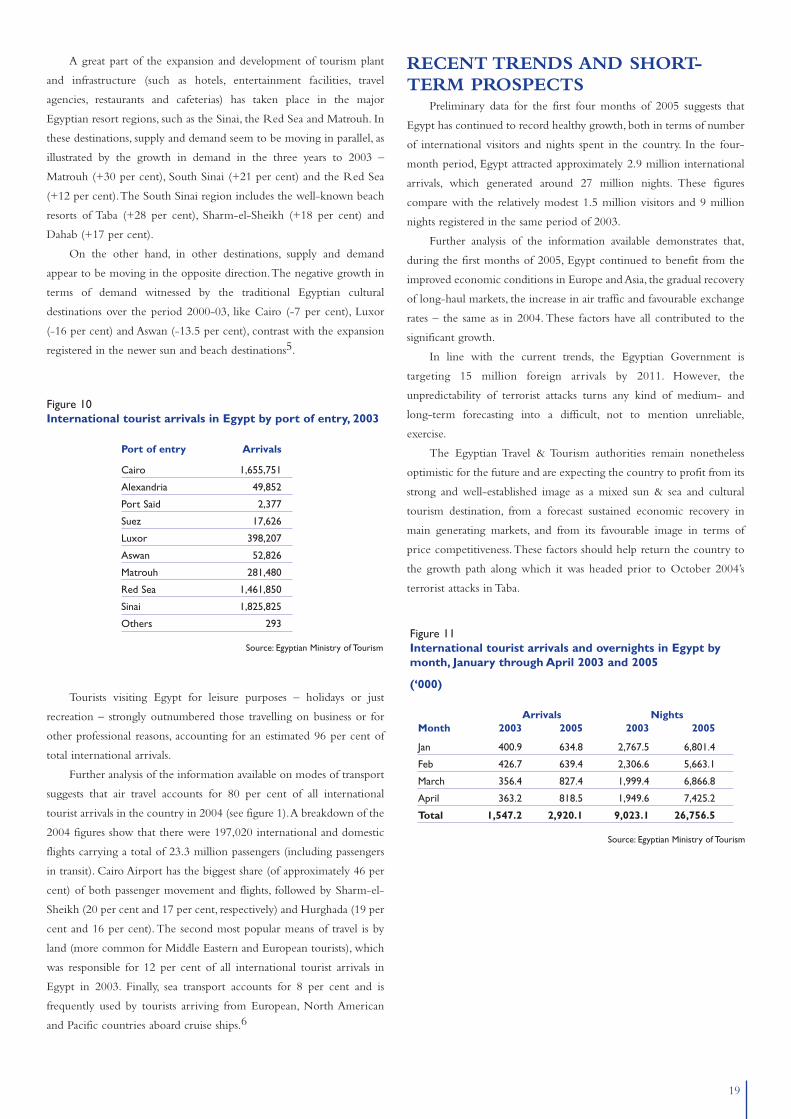
Figure 9 provides a comprehensive picture of the tourism sector’s
performance in Egypt over the period 2000-04.
To meet the growth in demand, there has been substantial
investment in tourism-related services and facilities since 2000. In
particular, accommodation capacity in hotels and registered
establishments increased by 45 per cent from 2000-03, to a total
capacity of 136,150 rooms. In addition, Egypt has 102,464 rooms under
construction.
2001/00 2002/01 2003/02 2004/03-20
-10
0
10
20
30
40
-1 -2
-16
3
16
11
-2
10
16
10
20
34
World Middle East Egypt
Figure 7Comparative annual growth in international tourist arrivalsworldwide, in the Middle East and Egypt, 2000-04%
Source: (WTO)
2000 2001 2002 2003 2004
5.5 33 4.7 30 5.2 33 6 53 8.2 82
66.4 6.3
8.8
10
4.33.8 3.8
4.65.3
Arrivals (mn) Nights (mn)
Average length of stay (nights) Revenue (US$ bn)
Figure 9Key indicators relating to Egypt’s tourism performance,2000-04
Source: Egyptian Ministry of Tourism, Egyptian Tourist Authority
Figure 8Top ten tourism source markets for Egypt and Turkey, 2003
International tourist arrivalsMarket Egypt Turkey
Italy 795,903 236,827
Germany 693,445 3,327,834
Russia 586,077 1,258,964
UK 357,248 1,091,197
France 310,791 470,156
Israel 309,994 321,094
Libya 305,393 28,158
Benelux 229,462 1,250,172
Saudi Arabia 269,120 23,570
Scandinavia 149,185 507,056
Source: Egyptian Ministry of Tourism; and www.tourismturkey.org/statistics
19
A great part of the expansion and development of tourism plant
and infrastructure (such as hotels, entertainment facilities, travel
agencies, restaurants and cafeterias) has taken place in the major
Egyptian resort regions, such as the Sinai, the Red Sea and Matrouh. In
these destinations, supply and demand seem to be moving in parallel, as
illustrated by the growth in demand in the three years to 2003 –
Matrouh (+30 per cent), South Sinai (+21 per cent) and the Red Sea
(+12 per cent).The South Sinai region includes the well-known beach
resorts of Taba (+28 per cent), Sharm-el-Sheikh (+18 per cent) and
Dahab (+17 per cent).
On the other hand, in other destinations, supply and demand
appear to be moving in the opposite direction.The negative growth in
terms of demand witnessed by the traditional Egyptian cultural
destinations over the period 2000-03, like Cairo (-7 per cent), Luxor
(-16 per cent) and Aswan (-13.5 per cent), contrast with the expansion
registered in the newer sun and beach destinations5.
Tourists visiting Egypt for leisure purposes – holidays or just
recreation – strongly outnumbered those travelling on business or for
other professional reasons, accounting for an estimated 96 per cent of
total international arrivals.
Further analysis of the information available on modes of transport
suggests that air travel accounts for 80 per cent of all international
tourist arrivals in the country in 2004 (see figure 1).A breakdown of the
2004 figures show that there were 197,020 international and domestic
flights carrying a total of 23.3 million passengers (including passengers
in transit). Cairo Airport has the biggest share (of approximately 46 per
cent) of both passenger movement and flights, followed by Sharm-el-
Sheikh (20 per cent and 17 per cent, respectively) and Hurghada (19 per
cent and 16 per cent).The second most popular means of travel is by
land (more common for Middle Eastern and European tourists), which
was responsible for 12 per cent of all international tourist arrivals in
Egypt in 2003. Finally, sea transport accounts for 8 per cent and is
frequently used by tourists arriving from European, North American
and Pacific countries aboard cruise ships.6
RECENT TRENDS AND SHORT-TERM PROSPECTS
Preliminary data for the first four months of 2005 suggests that
Egypt has continued to record healthy growth, both in terms of number
of international visitors and nights spent in the country. In the four-
month period, Egypt attracted approximately 2.9 million international
arrivals, which generated around 27 million nights. These figures
compare with the relatively modest 1.5 million visitors and 9 million
nights registered in the same period of 2003.
Further analysis of the information available demonstrates that,
during the first months of 2005, Egypt continued to benefit from the
improved economic conditions in Europe and Asia, the gradual recovery
of long-haul markets, the increase in air traffic and favourable exchange
rates – the same as in 2004. These factors have all contributed to the
significant growth.
In line with the current trends, the Egyptian Government is
targeting 15 million foreign arrivals by 2011. However, the
unpredictability of terrorist attacks turns any kind of medium- and
long-term forecasting into a difficult, not to mention unreliable,
exercise.
The Egyptian Travel & Tourism authorities remain nonetheless
optimistic for the future and are expecting the country to profit from its
strong and well-established image as a mixed sun & sea and cultural
tourism destination, from a forecast sustained economic recovery in
main generating markets, and from its favourable image in terms of
price competitiveness.These factors should help return the country to
the growth path along which it was headed prior to October 2004’s
terrorist attacks in Taba.
Figure 11International tourist arrivals and overnights in Egypt bymonth, January through April 2003 and 2005
(‘000)
Arrivals NightsMonth 2003 2005 2003 2005
Jan 400.9 634.8 2,767.5 6,801.4
Feb 426.7 639.4 2,306.6 5,663.1
March 356.4 827.4 1,999.4 6,866.8
April 363.2 818.5 1,949.6 7,425.2
Total 1,547.2 2,920.1 9,023.1 26,756.5
Source: Egyptian Ministry of Tourism
Figure 10International tourist arrivals in Egypt by port of entry, 2003
Port of entry Arrivals
Cairo 1,655,751
Alexandria 49,852
Port Said 2,377
Suez 17,626
Luxor 398,207
Aswan 52,826
Matrouh 281,480
Red Sea 1,461,850
Sinai 1,825,825
Others 293
Source: Egyptian Ministry of Tourism
20
In particular, in terms of real growth in demand, Egypt ranked 14th globally in 2005, thanks to a growth of
13 per cent over the previous year. Egypt’s performance was the second best in the Middle East region, in fact –
behind Tunisia, which came sixth in the global ranking with a growth of 15 per cent.
Egypt jumps to eleventh position in the ranking in terms of total employment, well ahead of all its competitors
in the region.
Regarding its direct and indirect economic contribution to Egyptian wealth, the Travel & Tourism sector
represented 15 per cent of GDP in 2005. Only Morocco and Tunisia registered higher shares, thereby ranking ahead
of Egypt, in 43rd and 35th positions, respectively.
As regards capital expenditures, Egyptian Travel & Tourism providers in the private sector and government
agencies invested US$2.7 billion in 2004, less than their competitors from the UAE (US$5.4 billion) and Turkey
(US$2.9 billion).
WTTC’s 2005 Travel & Tourism Economic Research Report – and notably the section on Country League
Tables7 – is also an important source of information for comparing Travel & Tourism’s economic and social impact
on the national economies of Egypt and other Middle East and North Mediterranean countries (figure 13). It also
includes forecasts for the next ten years (see figure 14).
ECONOMIC ANDSOCIAL VALUE OFTRAVEL & TOURISMFOR EGYPTAS ILLUSTRATED IN FIGURE 12, EGYPT’S TRAVEL & TOURISM SECTOR ISPERFORMING VERY WELL,RANKING THE COUNTRY AMONG THE TOP 50IN WTTC’S OVERALL 2004 RANKING (ACCORDING TO THE MAININDICATORS).
Figure 12The economic and social importance of Travel & Tourism for Egypt and selected regionalcompetitors, 2005
Country Total Growth Share of Capital Total Demand in Demanda T&T GDP Investment Employment
(US$bn) (%) (%) (US$bn) (mn)Value Global Value Global Value Global Value Global Value Global
Rank Rank Rank Rank Rank
Egypt 12.8 45 13.3 14 15.3 45 2.7 41 3.1 11
Lebanon 4.1 73 7.8 98 12.4 61 0.4 89 0.2 84
Morocco 8.8 51 9.7 54 15.9 43 1.4 49 1.4 25
Tunisia 5.9 59 14.8 6 19.5 35 1.1 59 0.6 47
Turkey 32 26 12.2 21 10 83 2.9 40 1.3 26
UAE 17.2 39 6.1 128 10 86 5.4 24 0.15 9
a Real growth over 2004
Source: Country League Tables,WTTC’s Travel & Tourism Economic Research, 2005
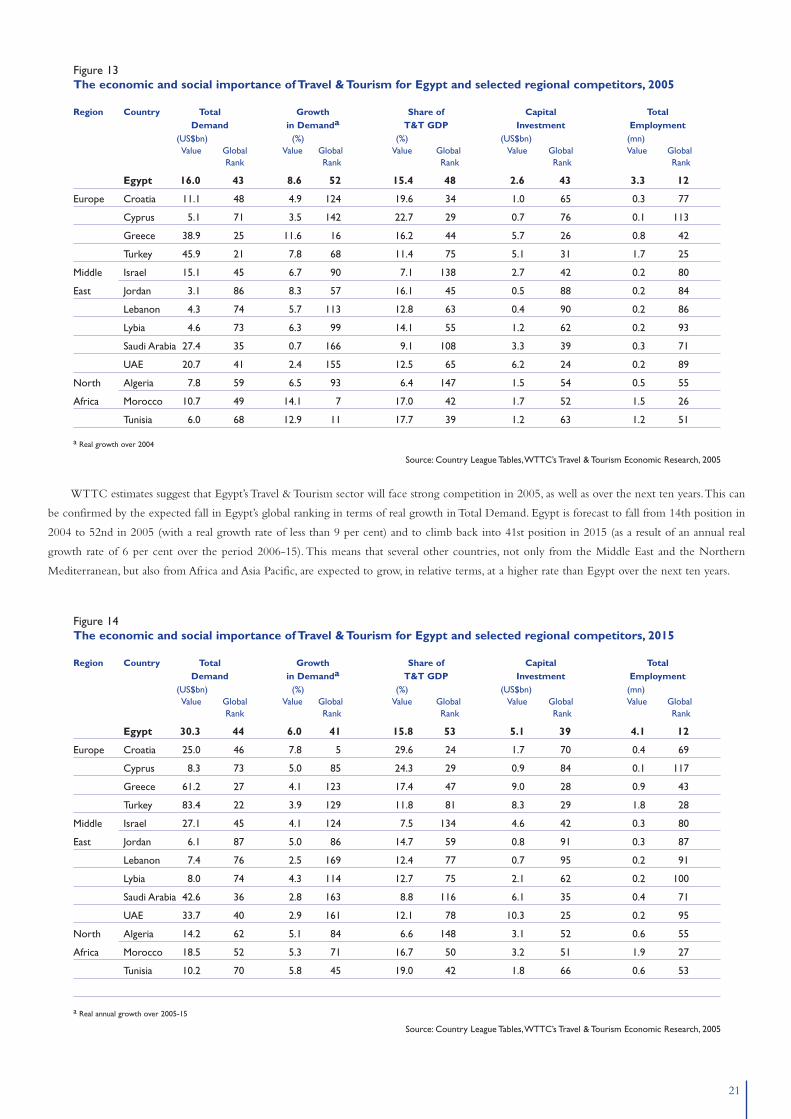
21
WTTC estimates suggest that Egypt’s Travel & Tourism sector will face strong competition in 2005, as well as over the next ten years.This can
be confirmed by the expected fall in Egypt’s global ranking in terms of real growth in Total Demand. Egypt is forecast to fall from 14th position in
2004 to 52nd in 2005 (with a real growth rate of less than 9 per cent) and to climb back into 41st position in 2015 (as a result of an annual real
growth rate of 6 per cent over the period 2006-15). This means that several other countries, not only from the Middle East and the Northern
Mediterranean, but also from Africa and Asia Pacific, are expected to grow, in relative terms, at a higher rate than Egypt over the next ten years.
Figure 13The economic and social importance of Travel & Tourism for Egypt and selected regional competitors, 2005
Region Country Total Growth Share of Capital Total Demand in Demanda T&T GDP Investment Employment
(US$bn) (%) (%) (US$bn) (mn)Value Global Value Global Value Global Value Global Value Global
Rank Rank Rank Rank Rank
Egypt 16.0 43 8.6 52 15.4 48 2.6 43 3.3 12
Europe Croatia 11.1 48 4.9 124 19.6 34 1.0 65 0.3 77
Cyprus 5.1 71 3.5 142 22.7 29 0.7 76 0.1 113
Greece 38.9 25 11.6 16 16.2 44 5.7 26 0.8 42
Turkey 45.9 21 7.8 68 11.4 75 5.1 31 1.7 25
Middle Israel 15.1 45 6.7 90 7.1 138 2.7 42 0.2 80
East Jordan 3.1 86 8.3 57 16.1 45 0.5 88 0.2 84
Lebanon 4.3 74 5.7 113 12.8 63 0.4 90 0.2 86
Lybia 4.6 73 6.3 99 14.1 55 1.2 62 0.2 93
Saudi Arabia 27.4 35 0.7 166 9.1 108 3.3 39 0.3 71
UAE 20.7 41 2.4 155 12.5 65 6.2 24 0.2 89
North Algeria 7.8 59 6.5 93 6.4 147 1.5 54 0.5 55
Africa Morocco 10.7 49 14.1 7 17.0 42 1.7 52 1.5 26
Tunisia 6.0 68 12.9 11 17.7 39 1.2 63 1.2 51
a Real growth over 2004
Source: Country League Tables,WTTC’s Travel & Tourism Economic Research, 2005
Figure 14The economic and social importance of Travel & Tourism for Egypt and selected regional competitors, 2015
Region Country Total Growth Share of Capital Total Demand in Demanda T&T GDP Investment Employment
(US$bn) (%) (%) (US$bn) (mn)Value Global Value Global Value Global Value Global Value Global
Rank Rank Rank Rank Rank
Egypt 30.3 44 6.0 41 15.8 53 5.1 39 4.1 12
Europe Croatia 25.0 46 7.8 5 29.6 24 1.7 70 0.4 69
Cyprus 8.3 73 5.0 85 24.3 29 0.9 84 0.1 117
Greece 61.2 27 4.1 123 17.4 47 9.0 28 0.9 43
Turkey 83.4 22 3.9 129 11.8 81 8.3 29 1.8 28
Middle Israel 27.1 45 4.1 124 7.5 134 4.6 42 0.3 80
East Jordan 6.1 87 5.0 86 14.7 59 0.8 91 0.3 87
Lebanon 7.4 76 2.5 169 12.4 77 0.7 95 0.2 91
Lybia 8.0 74 4.3 114 12.7 75 2.1 62 0.2 100
Saudi Arabia 42.6 36 2.8 163 8.8 116 6.1 35 0.4 71
UAE 33.7 40 2.9 161 12.1 78 10.3 25 0.2 95
North Algeria 14.2 62 5.1 84 6.6 148 3.1 52 0.6 55
Africa Morocco 18.5 52 5.3 71 16.7 50 3.2 51 1.9 27
Tunisia 10.2 70 5.8 45 19.0 42 1.8 66 0.6 53
a Real annual growth over 2005-15
Source: Country League Tables,WTTC’s Travel & Tourism Economic Research, 2005
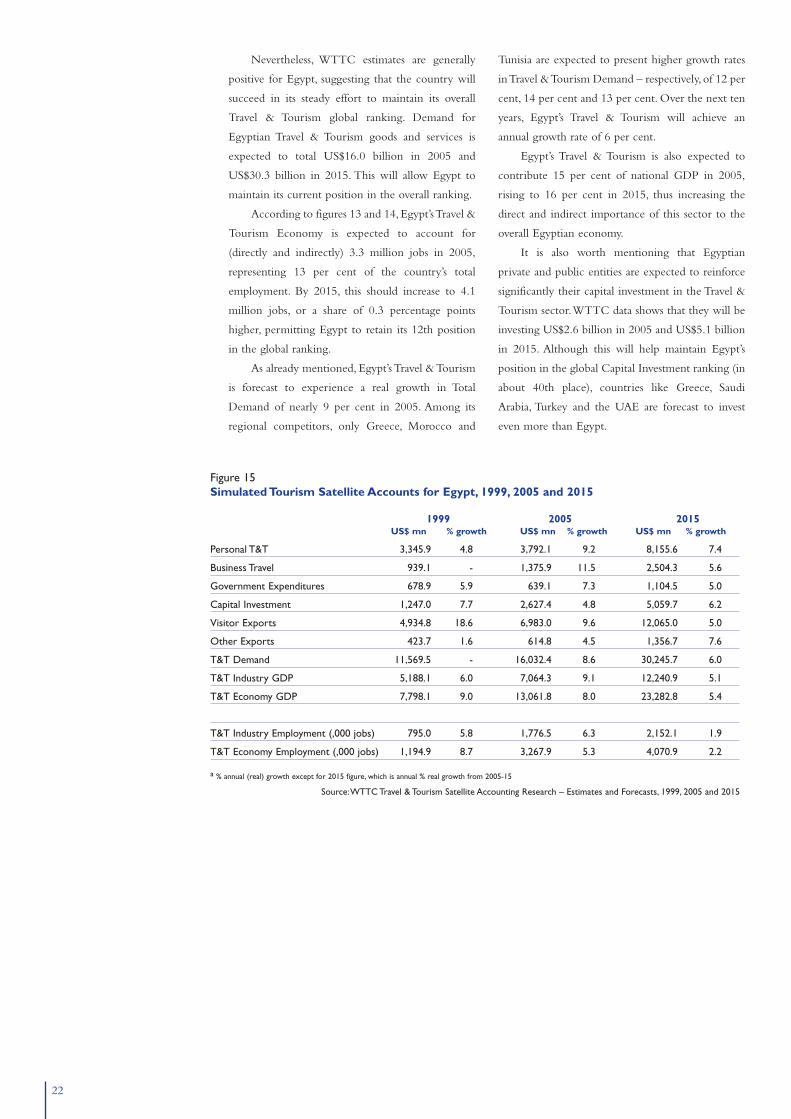
22
Nevertheless, WTTC estimates are generally
positive for Egypt, suggesting that the country will
succeed in its steady effort to maintain its overall
Travel & Tourism global ranking. Demand for
Egyptian Travel & Tourism goods and services is
expected to total US$16.0 billion in 2005 and
US$30.3 billion in 2015. This will allow Egypt to
maintain its current position in the overall ranking.
According to figures 13 and 14, Egypt’s Travel &
Tourism Economy is expected to account for
(directly and indirectly) 3.3 million jobs in 2005,
representing 13 per cent of the country’s total
employment. By 2015, this should increase to 4.1
million jobs, or a share of 0.3 percentage points
higher, permitting Egypt to retain its 12th position
in the global ranking.
As already mentioned, Egypt’s Travel & Tourism
is forecast to experience a real growth in Total
Demand of nearly 9 per cent in 2005. Among its
regional competitors, only Greece, Morocco and
Tunisia are expected to present higher growth rates
in Travel & Tourism Demand – respectively, of 12 per
cent, 14 per cent and 13 per cent. Over the next ten
years, Egypt’s Travel & Tourism will achieve an
annual growth rate of 6 per cent.
Egypt’s Travel & Tourism is also expected to
contribute 15 per cent of national GDP in 2005,
rising to 16 per cent in 2015, thus increasing the
direct and indirect importance of this sector to the
overall Egyptian economy.
It is also worth mentioning that Egyptian
private and public entities are expected to reinforce
significantly their capital investment in the Travel &
Tourism sector.WTTC data shows that they will be
investing US$2.6 billion in 2005 and US$5.1 billion
in 2015. Although this will help maintain Egypt’s
position in the global Capital Investment ranking (in
about 40th place), countries like Greece, Saudi
Arabia, Turkey and the UAE are forecast to invest
even more than Egypt.
Figure 15Simulated Tourism Satellite Accounts for Egypt, 1999, 2005 and 2015
1999 2005 2015US$ mn % growth US$ mn % growth US$ mn % growth
Personal T&T 3,345.9 4.8 3,792.1 9.2 8,155.6 7.4
Business Travel 939.1 - 1,375.9 11.5 2,504.3 5.6
Government Expenditures 678.9 5.9 639.1 7.3 1,104.5 5.0
Capital Investment 1,247.0 7.7 2,627.4 4.8 5,059.7 6.2
Visitor Exports 4,934.8 18.6 6,983.0 9.6 12,065.0 5.0
Other Exports 423.7 1.6 614.8 4.5 1,356.7 7.6
T&T Demand 11,569.5 - 16,032.4 8.6 30,245.7 6.0
T&T Industry GDP 5,188.1 6.0 7,064.3 9.1 12,240.9 5.1
T&T Economy GDP 7,798.1 9.0 13,061.8 8.0 23,282.8 5.4
T&T Industry Employment (,000 jobs) 795.0 5.8 1,776.5 6.3 2,152.1 1.9
T&T Economy Employment (,000 jobs) 1,194.9 8.7 3,267.9 5.3 4,070.9 2.2
a % annual (real) growth except for 2015 figure, which is annual % real growth from 2005-15
Source:WTTC Travel & Tourism Satellite Accounting Research – Estimates and Forecasts, 1999, 2005 and 2015
23
Air transport legislation produced and implemented
over decades tended to protect the national airline and
prevent it from facing competition from international
carriers on scheduled airline routes, from charter
airlines to the resort destinations, and from other
private Egyptian carriers in the domestic market.
International scheduled services on routes
to/from Egypt were always constrained by frequency
and capacity restrictions contained in bilateral
agreements, and by government decisions designating
EgyptAir as the sole operator of these services.
EgyptAir had, has and will continue to have, a
major role as an airline operator on domestic and
international routes, but it is quite clear today that
taking a protectionist stance has prevented Egypt from
tapping the full potential of its Travel & Tourism
industry. It has also prevented the country from having
a stronger and more competitive airline system, with
the participation of private Egyptian airlines.
WTTC believes that in pursuing these policies,
the Egyptian Government has indirectly limited the
contribution of these industries (airline and Travel &
Tourism) to the growth of the national economy.
Meanwhile, as Travel & Tourism investment,
employment and wealth creation became increasingly
important for the Egyptian economy – and very
ambitious goals have been set to increase the number of
annual arrivals – the Egyptian Government was obliged to
ease these policies and liberalize aviation and air transport.
The results were immediate and the substantial
annual increase in international arrivals during the
1990s can largely be attributed to the changes
introduced in civil aviation policy on the regulation of
international charter services.
RECENT DEVELOPMENTSIN LEGISLATIONSince 1996, several decisions on air transport regulation
have had a strong impact on the Travel & Tourism
sector in Egypt, the more important being:
• Order 52/1996, from the Egyptian Civil Aviation
Authority, allowing charter services to be launched and
operated from any foreign city to all Egyptian airports
(except Cairo International) with no restrictions.
This decision led to a substantial annual growth in
charter services and passenger traffic, especially to
cultural and resort destinations like Luxor, Aswan,
Sharm-el-Sheikh and Hurghada, and helped private
Egyptian airlines to launch charter operations from
several European cities to these destinations. Charter
traffic to Cairo did not increase significantly due the
exclusion of Cairo International Airport from the new
regulation (with the exception, still in force today, of
allowing foreign and Egyptian charter operators to
carry traffic through Cairo as part of a triangular route,
or from cities not served by EgyptAir). There is no
doubt that this restriction was introduced to protect
the national airline from competition on direct charter
services to Cairo.
• Investment decree 357/2000 for the Ministry of
Civil Aviation, allowing international airlines already
operating scheduled flights to Egypt, under air transport
bilaterals, to apply for extra flights to Luxor, Hurghada,
Sharm-el-Sheikh and St Catherine - Sinai Airports,
with no quota restrictions on frequency or capacity.
This decision had a limited impact on Travel &
Tourism, as only a small number of international
airlines showed interest and applied to operate these
‘extra flights’.
EGYPTIAN AVIATIONPOLICIES AND THEAIR TRANSPORTINDUSTRYIN LINE WITH THE TREND IN OTHER COUNTRIES,THE EGYPTIAN CIVILAVIATION AUTHORITY, UNDER THE UMBRELLA OF THE MINISTRY OFCIVIL AVIATION, HAS ALWAYS HAD A VERY CLOSE RELATIONSHIP WITHSTATE-OWNED FLAG CARRIER EGYPTAIR.
24
• Investment decree 1167/2001 for the Ministry
of Civil Aviation, allowing all Arab countries’
airlines, including private Egyptian airlines, to
operate without any restrictions non-regular, or
charter, flights from their countries of origin to all
Egyptian airports, with the exception of Cairo
International Airport.
In this context, the Egyptian Government
followed the decisions of the Arab Civil Aviation
Commission (ACAC) 2000 meeting, which
recommended that “third and fourth freedom
rights” should be granted, with no restrictions, under
the framework of the existing bilateral agreements
signed between Arab countries.
Only a few Only a few Arab countries’ airlines,
including one low-cost carrier, are operating
scheduled flights to Alexandria and Luxor airports,
taking advantage of this decision.
CONSTRAINTS OFINTERNATIONAL POLICIESThe major constraints of Egyptian international
aviation policies are related to:
• the existence of traffic capacity restrictions with
countries now considered to be of strategic
importance for Egyptian Travel & Tourism;
• the designation of EgyptAir as the sole Egyptian
operator of international regular services;
• the exclusion of Cairo Airport in all
liberalization policy decisions, preventing charter
airlines from flying directly to Cairo, which is still
the main tourism destination in Egypt;
• the difficulties imposed on international airlines
applying for so called “sixth freedom traffic rights” to
fly passengers from their main international markets
to Cairo International Airport through their home
hub airports;
• the problems and restrictions imposed on
private Egyptian airlines wishing to operate
international charter services from countries or cities
in Europe regularly served by EgyptAir.
It is now widely recognized that, in Egypt, a
country dependent on airline services for more than
80 per cent of foreign arrivals and for which,
therefore, adequate air transport is critical, these
types of constraints have to be removed urgently, so
as ensure the full economic and social potential of
this sector.
CONSTRAINTS OFDOMESTIC POLICIESDespite claims by the Civil Aviation Authority to
have “widely opened the domestic market” to all
Egyptian operators, EgyptAir has, in fact, maintained
a virtual monopoly on domestic air transport
services in Egypt. The national airline operates
scheduled services from Cairo to nine cities around
the country, and transported 6.7 million passengers
in 2004.The main domestic routes are Cairo-Luxor,
Cairo-Hurghada, and Cairo-Sharm-el-Sheikh.
Domestic traffic increased substantially between
1998 and 2004, but the percentage of passengers
transported by private Egyptian carriers over this
period declined. Most of these airlines, launched to
operate charter flights or air taxi services, have
suspended their operations, or simply collapsed due
to a lack of profitability.
The main reason for this abnormal situation was
that the Civil Aviation Authority, being the
responsible body for approving and licensing
domestic scheduled flights by Egyptian private
airlines, always put extremely stringent demands on
these airlines. They made it obligatory for these
companies to invest heavily in building or renting
airport facilities, in making their own equipment
available to serve passengers and to carry out aircraft
maintenance in all the airports through which they
wished to operate. Finally, they had to comply with
significant restrictions on their daily schedules in
cases where EgyptAir was flying the same route.
These non-transparent barriers were, and still
are, responsible for the poor economic and financial
performances of private Egyptian airlines, and for the
high fares still paid by locals and foreigners for air
travel on domestic routes.
THE ROLE OF EGYPTAIRAND PRIVATE EGYPTIANAIRLINESWTTC’s 1999 report on Egyptian aviation clearly
demonstrated the relatively weak role of the national
flag carrier EgyptAir in the country’s Travel &
Tourism. In questioning the reasons behind civil
aviation policies aimed to protect EgyptAir from
international and domestic airline competitors on its
main routes, and especially to Cairo, the report
pointed out that:
• The total annual revenue generated by
25
EgyptAir is very small if compared with the annual
global output of the Egyptian Travel & Tourism
industry;
• EgyptAir’s net foreign exchange earnings (after
deducting revenue earned from resident and expatriate
Egyptians, and deducting expenditures in foreign
currencies) are insignificant compared with the total
net foreign exchange earnings of Travel & Tourism;
• Similarly, total direct employment in the airline
and the number of indirect jobs generated by its
schedule operations cannot be compared with the total
number of direct and indirect jobs associated with the
Travel & Tourism Industry or Economy.
While it does not intend to belittle the role of
EgyptAir as the national airline, the report concludes
that its contribution to the national economy is limited
and “the protection of its interests may be in conflict
with the larger national benefits to be derived from the
expansion of Travel & Tourism”.
As shown in figure 2, EgyptAir was responsible in
2004 for 19 per cent of total international scheduled
and non-scheduled passenger traffic through Cairo and
the main Egyptian international airports, and for
approximately 61 per cent of total domestic (scheduled
and non-scheduled) passenger traffic.
Figures 16-19, which show the breakdown of
passenger traffic and flights by international and
Egyptian airlines at main airports, demonstrate the
following additional facts:
• EgyptAir accounts for a significant share of
international scheduled passenger traffic through Cairo
(34 per cent) and Luxor (63 per cent) airports;
• International flag carriers transport a large share of
total international scheduled traffic throughout Cairo
and Nozha (Alexandria) airports;
• International charter airlines are responsible for
almost 36 per cent of total international non-scheduled
passenger traffic through Cairo and almost 90 per cent
of total international non-scheduled traffic through
Sharm-el-Sheikh, Luxor and Hurghada airports. The
remaining passenger traffic was carried by either
EgyptAir or private Egyptian airlines;
• EgyptAir operates most of the domestic scheduled
flights between Cairo and other Egyptian airports, and
almost 30 per cent of non-scheduled domestic services
to and from Luxor and Aswan airports;
• Private Egyptian airlines are responsible for a small
and declining share of international charter traffic to
Cairo, Hurghada and Sharm-el-Sheikh, but still play an
important role in the domestic non-scheduled traffic
and in air taxi services in Cairo and almost all other
Egyptian airports.
Government decisions, which prevent
international charter airlines from serving Cairo
Airport with direct flights, and non-transparent
barriers limiting the activities of private Egyptian
airlines in the domestic market, created the conditions
for EgyptAir to maintain its position on international
routes to Cairo and on domestic scheduled services.
This meant that the airline was protected from
aggressive competitors, both in terms of the domestic
and international markets.
If Egyptian citizens (resident and expatriate) are
excluded from the international scheduled traffic
count, one can see clearly that EgyptAir plays a minor
and non-decisive role in the air transport of foreign
tourists and visitors to Egypt.
EgyptAir’s current fleet of 37 aircraft (with a
combined total of 7,972 seats) will be supplemented
with four new Airbus A320s due to be added in 2006
and 2007.
Considering the limited expansion proposed for
EgyptAir’s fleet, if the Egyptian Government has a
target of 15 million foreign arrivals by 2011, one can
assume that most of the projected annual growth in
number of tourists will be catered for by non-Egyptian
international scheduled airlines, including low-cost
carriers, and charter airlines.
In addition to the flag carrier EgyptAir, there are
various private Egyptian airlines operating scheduled
services, charter or air taxi services on international
and domestic routes.
Figre 16’s breakdown of 2004 passenger traffic
clearly shows that Egyptian airlines, other than
EgyptAir, concentrate their operations on international
charter flights to Luxor, Hurghada and Sharm-el-
Sheikh airports, and on non-scheduled domestic flights
(charter and air taxi services) between Cairo and other
main Egyptian airports. Even so, their contribution to
total passenger traffic is limited when compared with
traffic operated by international carriers or charter
airlines, or indeed domestic scheduled passenger traffic
carried by EgyptAir.Figure 20 highlights the relatively weak
development of Egyptian private airlines’ fleet and seat
capacity from 1999 to 2005 (May). It also shows that
several companies no longer operate or have simply
disappeared. WTTC believes the main reasons for this
are related to the constraints and difficulties created by
the civil aviation authorities for Egyptian private
airlines, in order to protect EgyptAir from additional
competition on international and domestic routes.
WTTC believes that existing Egyptian privately
owned airlines have the technical, financial and
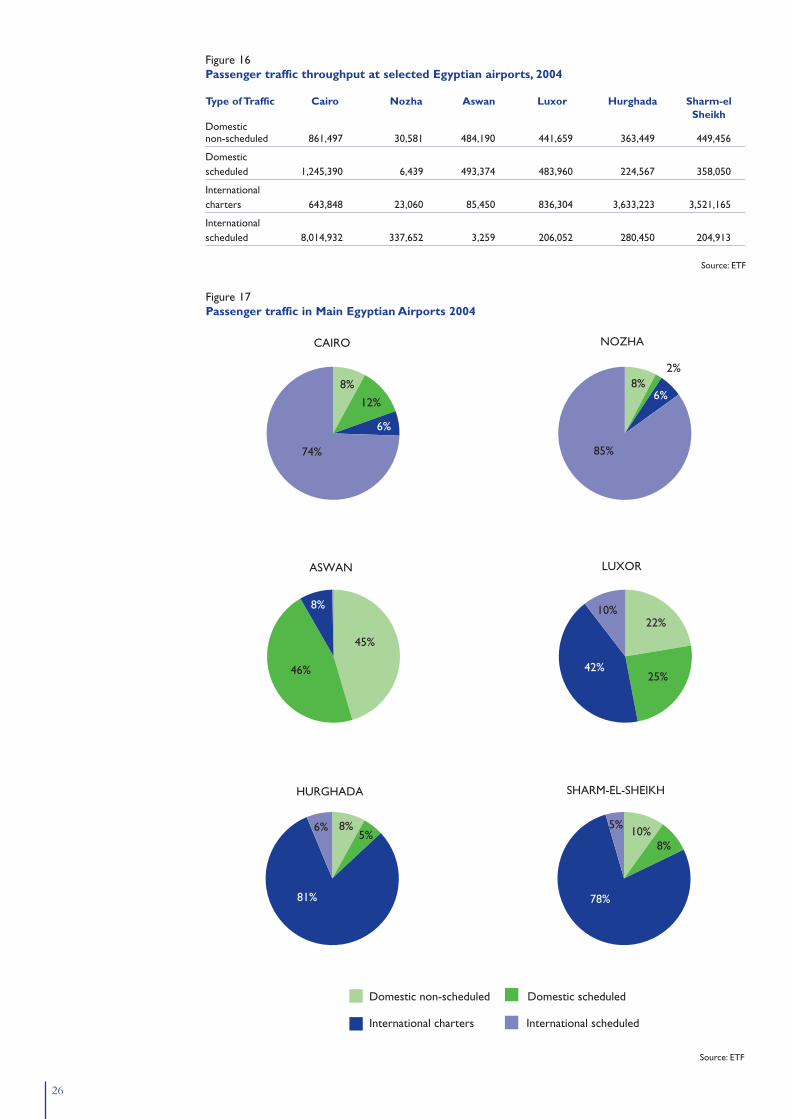
26
Figure 16Passenger traffic throughput at selected Egyptian airports, 2004
Type of Traffic Cairo Nozha Aswan Luxor Hurghada Sharm-elSheikh
Domestic non-scheduled 861,497 30,581 484,190 441,659 363,449 449,456
Domestic scheduled 1,245,390 6,439 493,374 483,960 224,567 358,050
International charters 643,848 23,060 85,450 836,304 3,633,223 3,521,165
International scheduled 8,014,932 337,652 3,259 206,052 280,450 204,913
Source: ETF
8%
12%
6%
74%
8%2%
6%
85%
45%
46%
8%
22%
25%42%
10%
8%5%
81%
6% 10%8%
78%
5%
CAIRO NOZHA
ASWAN LUXOR
HURGHADA SHARM-EL-SHEIKH
Domestic non-scheduled Domestic scheduled
International charters International scheduled
Figure 17Passenger traffic in Main Egyptian Airports 2004
Source: ETF
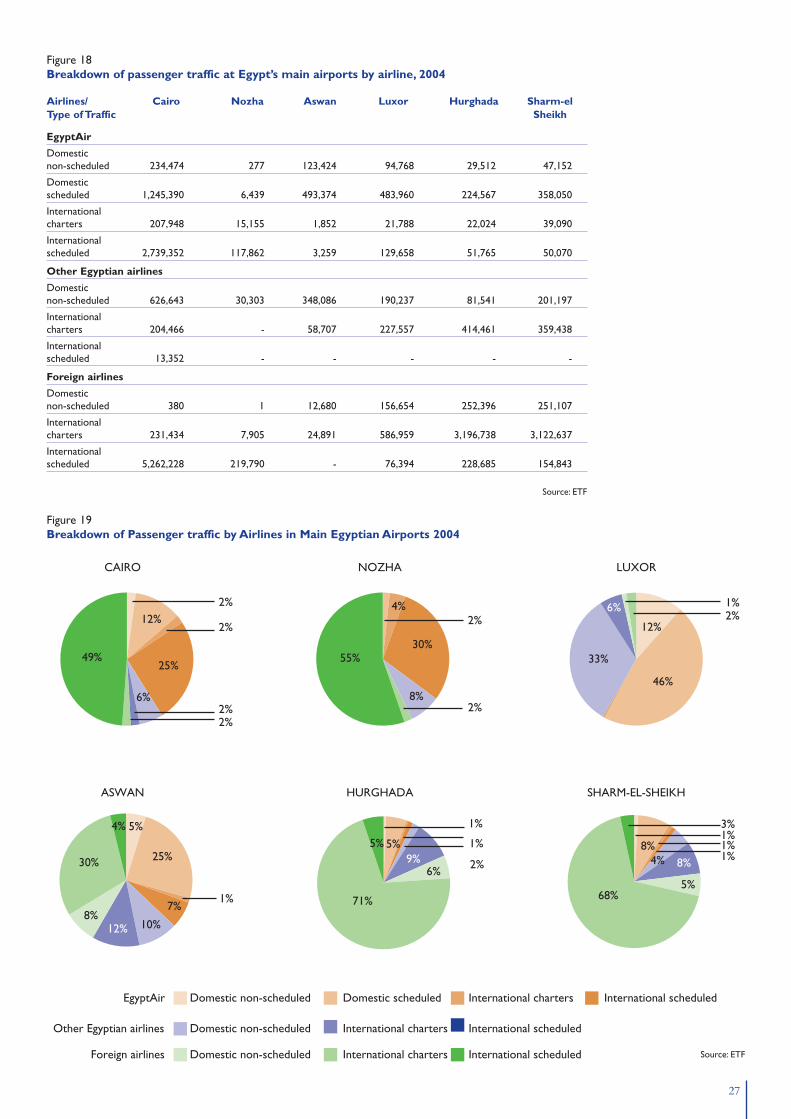
27
Figure 18Breakdown of passenger traffic at Egypt’s main airports by airline, 2004
Airlines/ Cairo Nozha Aswan Luxor Hurghada Sharm-elType of Traffic Sheikh
EgyptAir
Domestic non-scheduled 234,474 277 123,424 94,768 29,512 47,152
Domestic scheduled 1,245,390 6,439 493,374 483,960 224,567 358,050
International charters 207,948 15,155 1,852 21,788 22,024 39,090
International scheduled 2,739,352 117,862 3,259 129,658 51,765 50,070
Other Egyptian airlines
Domestic non-scheduled 626,643 30,303 348,086 190,237 81,541 201,197
International charters 204,466 - 58,707 227,557 414,461 359,438
International scheduled 13,352 - - - - -
Foreign airlines
Domestic non-scheduled 380 1 12,680 156,654 252,396 251,107
International charters 231,434 7,905 24,891 586,959 3,196,738 3,122,637
International scheduled 5,262,228 219,790 - 76,394 228,685 154,843
Source: ETF
2%12%
2%
25%
6%2%2%
49%
2%4%
30%
8%2%
55%
12%
46%
33%
6% 1%2%
5%
25%
1%7%
10%12%8%
30%
4% 1%
5% 1%
2%9%6%
71%
5%1%
8% 1%1%4% 8%
5%68%
3%
CAIRO NOZHA
ASWAN
LUXOR
HURGHADA SHARM-EL-SHEIKH
Domestic non-scheduled Domestic scheduled International charters International scheduled
Domestic non-scheduled International charters International scheduled
Domestic non-scheduled International charters International scheduled
EgyptAir
Other Egyptian airlines
Foreign airlines
Figure 19Breakdown of Passenger traffic by Airlines in Main Egyptian Airports 2004
Source: ETF
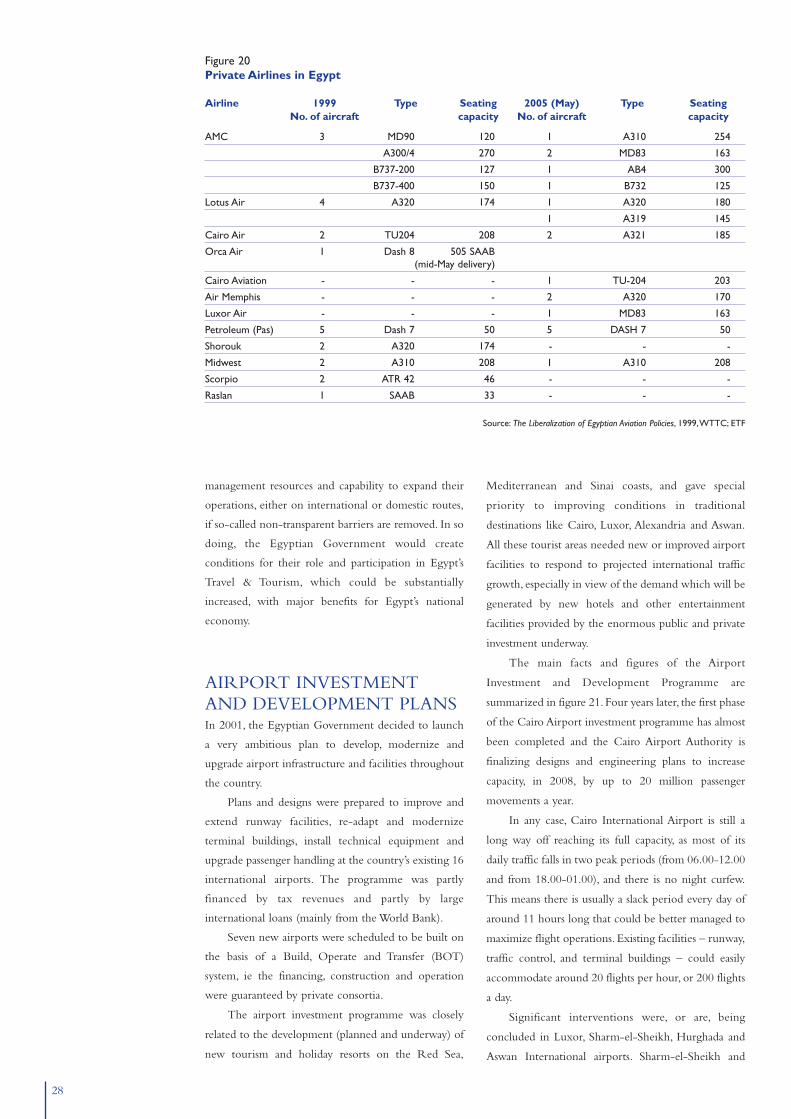
28
Figure 20Private Airlines in Egypt
Airline 1999 Type Seating 2005 (May) Type SeatingNo. of aircraft capacity No. of aircraft capacity
AMC 3 MD90 120 1 A310 254
A300/4 270 2 MD83 163
B737-200 127 1 AB4 300
B737-400 150 1 B732 125
Lotus Air 4 A320 174 1 A320 180
1 A319 145
Cairo Air 2 TU204 208 2 A321 185
Orca Air 1 Dash 8 505 SAAB (mid-May delivery)
Cairo Aviation - - - 1 TU-204 203
Air Memphis - - - 2 A320 170
Luxor Air - - - 1 MD83 163
Petroleum (Pas) 5 Dash 7 50 5 DASH 7 50
Shorouk 2 A320 174 - - -
Midwest 2 A310 208 1 A310 208
Scorpio 2 ATR 42 46 - - -
Raslan 1 SAAB 33 - - -
Source: The Liberalization of Egyptian Aviation Policies, 1999,WTTC; ETF
management resources and capability to expand their
operations, either on international or domestic routes,
if so-called non-transparent barriers are removed. In so
doing, the Egyptian Government would create
conditions for their role and participation in Egypt’s
Travel & Tourism, which could be substantially
increased, with major benefits for Egypt’s national
economy.
AIRPORT INVESTMENTAND DEVELOPMENT PLANSIn 2001, the Egyptian Government decided to launch
a very ambitious plan to develop, modernize and
upgrade airport infrastructure and facilities throughout
the country.
Plans and designs were prepared to improve and
extend runway facilities, re-adapt and modernize
terminal buildings, install technical equipment and
upgrade passenger handling at the country’s existing 16
international airports. The programme was partly
financed by tax revenues and partly by large
international loans (mainly from the World Bank).
Seven new airports were scheduled to be built on
the basis of a Build, Operate and Transfer (BOT)
system, ie the financing, construction and operation
were guaranteed by private consortia.
The airport investment programme was closely
related to the development (planned and underway) of
new tourism and holiday resorts on the Red Sea,
Mediterranean and Sinai coasts, and gave special
priority to improving conditions in traditional
destinations like Cairo, Luxor, Alexandria and Aswan.
All these tourist areas needed new or improved airport
facilities to respond to projected international traffic
growth, especially in view of the demand which will be
generated by new hotels and other entertainment
facilities provided by the enormous public and private
investment underway.
The main facts and figures of the Airport
Investment and Development Programme are
summarized in figure 21. Four years later, the first phase
of the Cairo Airport investment programme has almost
been completed and the Cairo Airport Authority is
finalizing designs and engineering plans to increase
capacity, in 2008, by up to 20 million passenger
movements a year.
In any case, Cairo International Airport is still a
long way off reaching its full capacity, as most of its
daily traffic falls in two peak periods (from 06.00-12.00
and from 18.00-01.00), and there is no night curfew.
This means there is usually a slack period every day of
around 11 hours long that could be better managed to
maximize flight operations. Existing facilities – runway,
traffic control, and terminal buildings – could easily
accommodate around 20 flights per hour, or 200 flights
a day.
Significant interventions were, or are, being
concluded in Luxor, Sharm-el-Sheikh, Hurghada and
Aswan International airports. Sharm-el-Sheikh and
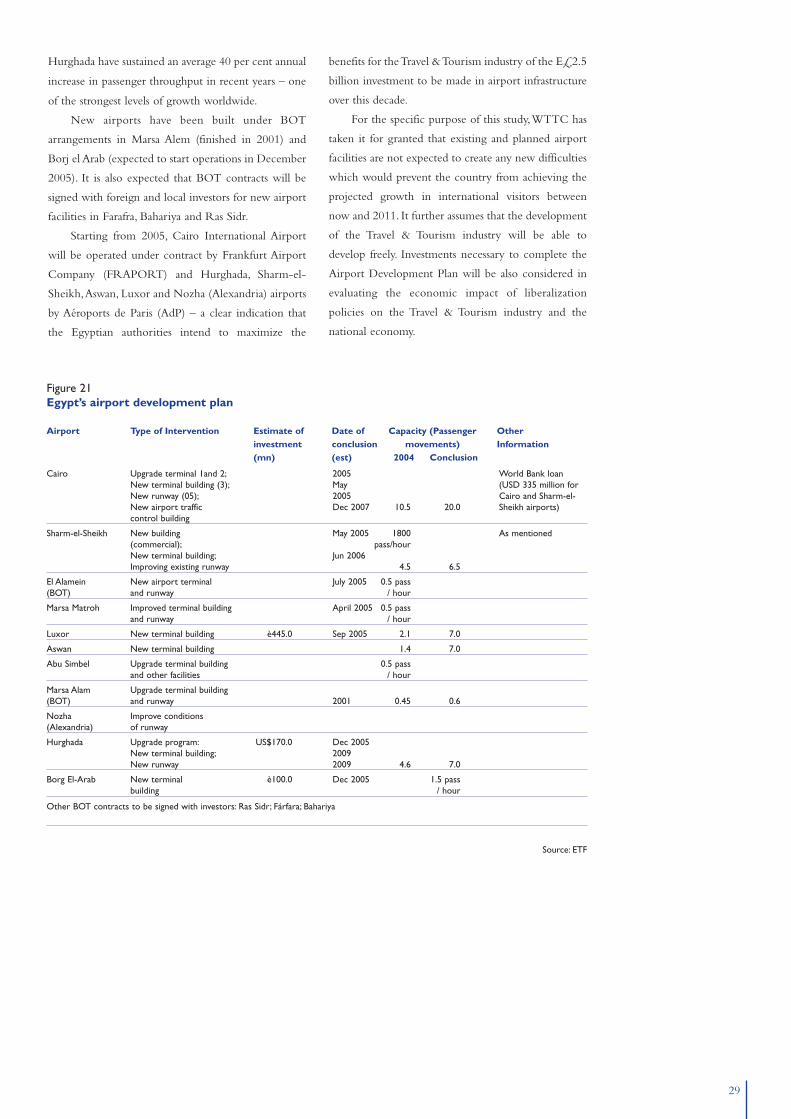
29
Hurghada have sustained an average 40 per cent annual
increase in passenger throughput in recent years – one
of the strongest levels of growth worldwide.
New airports have been built under BOT
arrangements in Marsa Alem (finished in 2001) and
Borj el Arab (expected to start operations in December
2005). It is also expected that BOT contracts will be
signed with foreign and local investors for new airport
facilities in Farafra, Bahariya and Ras Sidr.
Starting from 2005, Cairo International Airport
will be operated under contract by Frankfurt Airport
Company (FRAPORT) and Hurghada, Sharm-el-
Sheikh,Aswan, Luxor and Nozha (Alexandria) airports
by Aéroports de Paris (AdP) – a clear indication that
the Egyptian authorities intend to maximize the
benefits for the Travel & Tourism industry of the E£2.5
billion investment to be made in airport infrastructure
over this decade.
For the specific purpose of this study,WTTC has
taken it for granted that existing and planned airport
facilities are not expected to create any new difficulties
which would prevent the country from achieving the
projected growth in international visitors between
now and 2011. It further assumes that the development
of the Travel & Tourism industry will be able to
develop freely. Investments necessary to complete the
Airport Development Plan will be also considered in
evaluating the economic impact of liberalization
policies on the Travel & Tourism industry and the
national economy.
Figure 21Egypt’s airport development plan
Airport Type of Intervention Estimate of Date of Capacity (Passenger Otherinvestment conclusion movements) Information(mn) (est) 2004 Conclusion
Cairo Upgrade terminal 1and 2; 2005 World Bank loan New terminal building (3); May (USD 335 million forNew runway (05); 2005 Cairo and Sharm-el-New airport traffic Dec 2007 10.5 20.0 Sheikh airports)control building
Sharm-el-Sheikh New building May 2005 1800 As mentioned(commercial); pass/hourNew terminal building; Jun 2006Improving existing runway 4.5 6.5
El Alamein New airport terminal July 2005 0.5 pass(BOT) and runway / hour
Marsa Matroh Improved terminal building April 2005 0.5 passand runway / hour
Luxor New terminal building è445.0 Sep 2005 2.1 7.0
Aswan New terminal building 1.4 7.0
Abu Simbel Upgrade terminal building 0.5 passand other facilities / hour
Marsa Alam Upgrade terminal building(BOT) and runway 2001 0.45 0.6
Nozha Improve conditions(Alexandria) of runway
Hurghada Upgrade program: US$170.0 Dec 2005New terminal building; 2009New runway 2009 4.6 7.0
Borg El-Arab New terminal è100.0 Dec 2005 1.5 passbuilding / hour
Other BOT contracts to be signed with investors: Ras Sidr; Fárfara; Bahariya
Source: ETF
30
The latest available figures confirm that almost 80 per
cent of total foreign visitors travel by air to Egypt.
EgyptAir, the national flag carrier, is responsible
for carrying only a small share of these visitors, yet
more than 60 per cent of domestic traffic. Despite a
major improvement in efficiency, plans to lease new
planes and to restructure route operations, it is not
expected to be in a position to meet tourism air
transport growth needs within the next five to ten
years.
To achieve the projected growth to 2011
(Egyptian Ministry of Tourism) or 2015 (WTTC), new
conditions have to be created in order to:
• Significantly increase the number of foreign
visitors arriving on scheduled flights by international
flag carriers or low-cost airlines;
• Significantly increase the number of non-
scheduled flights by international and/or Egyptian
charter carriers, operating from the main tourist
markets to all Egyptian airports (including Cairo and
the resort areas);
• Significantly increase frequencies and capacity on
existing and new domestic routes, to link cultural and
historic sites (Cairo, Luxor, Alexandria, Aswan, etc)
with the main sun & beach resort areas, easing tourist
circulation within the country and increasing average
length of stay in different regions.
The existing restrictions contained in
international bilateral agreements, Egyptian aviation
and air services legislation, and the frequent
discriminatory behaviour and procedures by civil
aviation authorities, are today major limitations to
international and Egyptian airlines’ operations. If not
changed, they will form one of the most serious
constraints to the projected growth of international
tourists in the years to come, and to the expected
performance of the Egyptian Travel & Tourism
industry.
The lack of transparent decisions and the technical
barriers facing privately owned Egyptian airlines are
the main factors impeding the existence of a stronger
and competitive Egyptian airline system. In fact,
contrary to the experience of countries like Turkey,
India, Indonesia and Malaysia, the launch in Egypt of
several private airlines to operate international or
domestic routes has been followed by their successive
decline or failure, mainly due to problems artificially
created to undermine their profitability.
The existence of a stronger Egyptian airline
system, led by EgyptAir, and with the contribution of
a number of private airlines competing on scheduled
and charter routes – especially to/from Europe and the
Middle East – is seen as strategically very important to
help maintain Egypt’s position as a competitive tourism
destination. It will also help to reduce the traditional
dependence on international airlines and tour
operators’ charter companies, which dominate air
transport to the country.
On domestic routes, the almost virtual monopoly
enjoyed by EgyptAir to operate scheduled services, and
the technical barriers imposed on private airlines, are
creating significant constraints on tourists wishing to
visit two or more regional destinations within the
country. International tour operators and local travel
agents estimate that package prices could be
substantially reduced and the average stay extended, if
routes linking Cairo to other historic, cultural or resort
regions were operated by several competing airlines.
WTTC considers that, within the policy measures
that will have to be taken to guarantee the
SCENARIO FOR AIRTRANSPORTLIBERALIZATIONTHE PERFORMANCE OF THE TRAVEL & TOURISM INDUSTRY IN EGYPTSINCE 2003, IN TERMS OF ARRIVALS, OVERNIGHT VOLUME ANDINTERNATIONAL TOURISM RECEIPTS, REFLECTS A RETURN TOSUSTAINED STRONG GROWTH.This leads one to conclude that the country has a significant development potential that has yetto be tapped.
31
attractiveness and competitiveness of Egypt as one of the world’s main
tourism destinations, clear priority should be given to decisions that will
allow support the liberalization process, which was briefly initiated
several years ago. All decisions should be oriented towards facilitating
the overall performance of the Travel & Tourism industry, even if the
short-term effect will probably be to cause damage to the results and
profitability of EgyptAir’s international or domestic operations.
AVIATION LIBERALIZATIONASSUMPTIONS All quantitative projections and estimates included in this report
regarding the impact of aviation liberalization on the Travel & Tourism
industry and the national economy assume that the Egyptian
Government will take the initiative to embark on an aviation and air
services liberalization programme, taking the main decisions by
December 2005. These include approaching other governments to
renegotiate or unilaterally grant, on request, additional traffic rights
within the framework of existing aviation bilaterals, and implementing
several important changes to legislation that regulate aviation and air
transport in Egypt. In the following ‘aviation liberalization scenario’, the
assumption is made that decisions will be taken to:
• Within the aviation bilaterals, ease the restrictions and limitations
on number of designated airlines, destinations, capacity and frequencies,
allowing as many direct scheduled flights by international airlines to
Cairo and other Egyptian airports as possible, even if reciprocity from
countries of origin are not granted8;
• Designate, whenever possible under the existing bilateral
agreements, a second Egyptian airline, offering it traffic rights to operate
international routes, especially those which EgyptAir, as the first
designated carrier, has no interest or capacity in flying to;
• Encourage international airlines to carry passengers from a third
country to Egypt via an international flag carrier’s hub9 (“sixth
freedom” traffic rights);
• Allow unlimited access to Cairo International Airport to all
(international and Egyptian) charter airlines wanting to fly non-
scheduled international flights, subject to slot availability;
• Allow unlimited access to Cairo International and other Egyptian
airports to low-cost carriers wanting to fly international scheduled
services, subject to slot availability;
• End existing restrictions on Egyptian private airlines operating
domestic routes and eliminate all discriminatory procedures and
technical barriers to their normal operations.
This ‘aviation liberalization scenario’, to be adopted by December
2005, would be a major step towards realizing some of the conditions
critical to tapping the full potential of Travel & Tourism in Egypt.
Additional assumptions have been made that:
• Investments to modernize, upgrade or expand the existing facilities
in all Egyptian airports by 2008 will guarantee that capacity will no
longer limit the projected annual increase in international arrivals or
domestic airline traffic;
• Airport taxes and other related operational fees, in Cairo and other
international airports, will be similar to those imposed on airlines in
airports in main Mediterranean and Middle East tourism destinations.
ECONOMIC IMPACT OF AIRTRANSPORT LIBERALIZATION INEGYPT Introduction and summary
This report assesses the potential impact of air transport liberalization on
Egypt’s Travel & Tourism, and the wider implications for the country’s
economy. This assessment is based on the OEF/TSA10 model for
Egypt, which allows us to look at broad tourism indicators and at how
these come together to make up the Travel & Tourism Economy, and
the wider economic impact this has.
The main analysis is based on constructing an alternative scenario
that assumes the full implementation of an air liberalization policy, to
compare with a baseline scenario which assumes no progress with
liberalization. In this alternative scenario, OEF has estimated tourist
numbers by looking at the impact of air liberalization in other aviation
markets, and by combining this with an assumption about the typical
elasticity of demand for air travel. OEF has also made allowance for
other associated increases in tourism activity, in particular likely
increases in tourism investment to meet the accommodation demands
of a growing number of tourists.
The alternative scenario shows that international tourist arrivals
could be increased by 2.5 million by 2011 if air transport were
liberalized than would otherwise be the case. This would mean an
additional 220,000 jobs (directly in the Travel & Tourism Industry and,
indirectly, in related sectors) and US$1.6 billion additional GDP
generated by the Travel & Tourism industry.
Analysis shows, however, that such liberalization is unlikely to be
sufficient to meet an arrivals target of 15 million a year by 2011, as
defined recently by the Egyptian Government. (The appendix shows
what the arrivals scenario would look like if this target were to be met.)
The remainder of this sub-chapter is divided into four sections.The
first presents a brief summary of the potential sources of economic
benefits.The second gives an outline of our ‘baseline forecast’ for Travel
& Tourism in Egypt in the absence of liberalization.The third describes
the methodology for constructing a ‘liberalization scenario’ covering the
period 2006-11. Finally, the main conclusions on the economic impact
of the alternative scenario relative to the base forecast are presented.
POTENTIAL SOURCES OFECONOMIC BENEFITSIn general, air liberalization agreements between two countries permit
unrestricted air services by the airlines of both countries between and
beyond each other’s territories, eliminating restrictions on how often
the carriers can fly, on the kind of aircraft they can operate and on the
prices they can charge.They may also provide for full liberalization of
32
scheduled and charter operations, as well as all-cargo
services, over a one to five-year transition period.
According to standard economic theory,
liberalization in international trade and investment in
aviation services have the potential to benefit
economic activity via improvements in efficiency and
gains to consumers (EC Report, 2002). The
contributions to these benefits are varied, but the most
important include:
• Improved efficiency due to increased competition
– less efficient airlines would adopt the practices of
more efficient ones, or more efficient airlines would
replace the less efficient ones.
• Taking advantage of economies of scale – airlines
can achieve additional savings by changing their
combined route network to connect more flights to
hub airports. They can also attain higher capacity
utilization, both of passenger and cargo services.
• Pricing synergies – liberalization would allow
better co-ordination of pricing on routes that currently
require passengers to fly on two or more airlines to
reach their destination.
• Liberalization of trade in services can result in
increased demand – first, through the direct effect of
the lifting of restrictions to air transport flows, leading
to an increase in flights and routes. Second, price
reductions resulting from competitive forces and cost
savings can result in lower fares which, in turn, would
lead to increased passenger volumes.
• Better investment prospects – the implementation
of an open skies policy would lead to a significant
growth in investment as airlines establish new
operations, open new markets and consolidate their
existing operations.
In terms of their wider economic contribution,
airline services are key to facilitating the development
of a more diversified export base and increased
tourism. The development of commercial aviation is
instrumental in reducing the costs of trade and the
movement of goods and people. New investment is
attracted to locations with good air transport links to
the rest of the world.The experience of Southeast Asia
during the last four decades is one example of the
benefits that the expansion of international trade can
have in fostering economic growth, improving
economic efficiency and making a significant
contribution to poverty alleviation (Air Transport
Action Group, 2003).
In contrast, air transport infrastructure shortages
and limited competition in airline services can be a
major obstacle to economic growth by making market
access both difficult and expensive. Moreover, a limited
number of regional hubs and the lack of a well-
developed network of domestic airports can seriously
hamper the opening of tourism resorts in remote areas
or in places far from the main regional hubs or
international airports.
In summary, efficient air transport will stimulate
demand both in terms of destinations and number of
flights, improve customer service, offer more
competitive fares and encourage tourist traffic. Easy
access to tourism destinations is considered to be a
prerequisite for the development of tourism. This
includes an extended domestic airline network,
frequent flight schedules and linkages through hubs. It
is the scope for encouraging additional tourism that is
the focus of this report.
Baseline Travel & Tourism forecast
Figure 22 sets out the key features of Oxford Economic
Forecasting’s (OEF’s) Tourism Satellite Account
projections for Egypt, produced in association with
WTTC.Although these projections do not cover visitor
numbers as such, it is possible to infer the likely number
of visitors from the projections for foreign visitor
spending in Egypt. These are consistent with foreign
visitor arrivals rising from 8.5 million this year (2005)
to 11.0 million by 2011. It is worth remembering,
however, that this forecast could be significantly affected
by unexpected movements in the exchange rate.
As already indicated, inbound tourism into Egypt
has risen substantially in recent years, boosted by more
competitive exchange rates, particularly in comparison
with source markets in the eurozone. If the euro were
to depreciate against the US dollar, visitor numbers
may also fall back.The projections are based on relative
stability in the real effective exchange rate – in other
words, ongoing modest falls in the Egyptian exchange
rate, broadly in line with inflation.
On the basis of these visitor numbers, the
projections show the GDP of the Travel & Tourism
industry rising from US$9.6 billion in 2005, once the
direct and indirect (ie supply chain) elements are both
taken into account, to US$13.2 billion by 2011, with
Travel & Tourism Industry jobs stable at slightly more
than 9 per cent of total employment.
The ‘liberalization scenario’OEF’s ‘alternative scenario’, of the impact of the
liberalization of air transport policy, is based first and
foremost on the effect of price incentives on demand,
in order to derive international tourist arrivals. It is
expected that the implementation of the proposed air
transport liberalization policy in 2005/06 would result
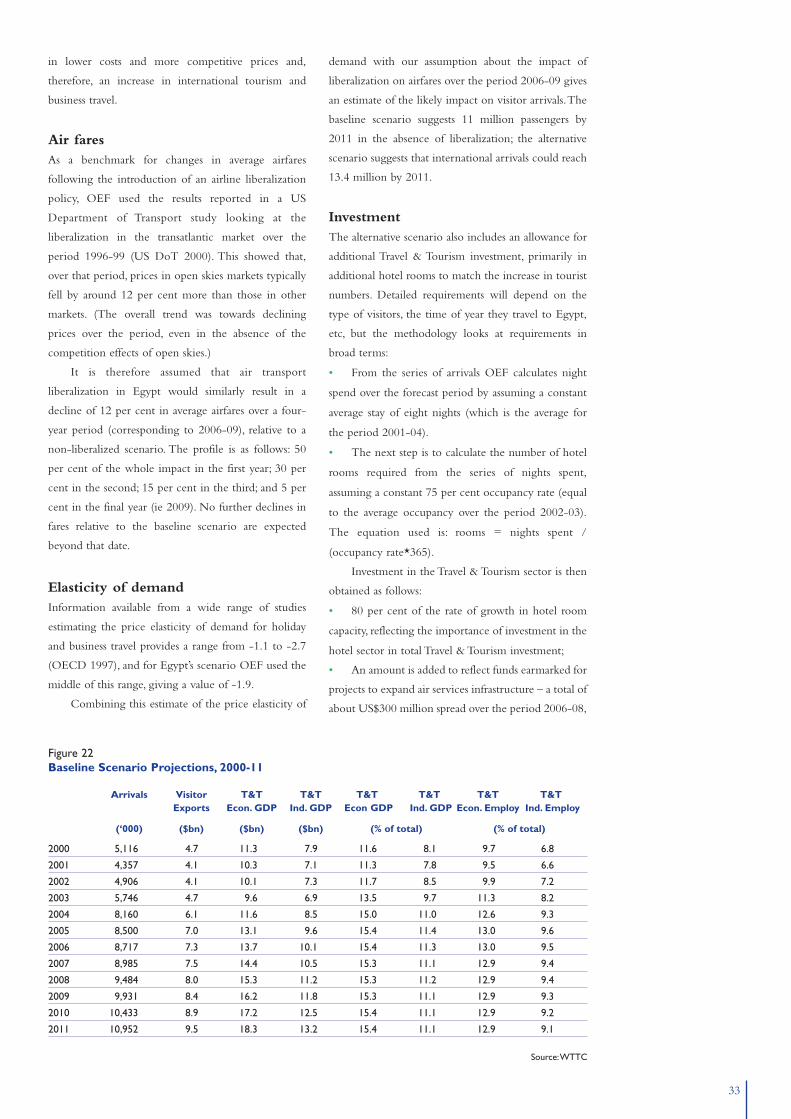
33
in lower costs and more competitive prices and,
therefore, an increase in international tourism and
business travel.
Air faresAs a benchmark for changes in average airfares
following the introduction of an airline liberalization
policy, OEF used the results reported in a US
Department of Transport study looking at the
liberalization in the transatlantic market over the
period 1996-99 (US DoT 2000). This showed that,
over that period, prices in open skies markets typically
fell by around 12 per cent more than those in other
markets. (The overall trend was towards declining
prices over the period, even in the absence of the
competition effects of open skies.)
It is therefore assumed that air transport
liberalization in Egypt would similarly result in a
decline of 12 per cent in average airfares over a four-
year period (corresponding to 2006-09), relative to a
non-liberalized scenario. The profile is as follows: 50
per cent of the whole impact in the first year; 30 per
cent in the second; 15 per cent in the third; and 5 per
cent in the final year (ie 2009). No further declines in
fares relative to the baseline scenario are expected
beyond that date.
Elasticity of demandInformation available from a wide range of studies
estimating the price elasticity of demand for holiday
and business travel provides a range from -1.1 to -2.7
(OECD 1997), and for Egypt’s scenario OEF used the
middle of this range, giving a value of -1.9.
Combining this estimate of the price elasticity of
demand with our assumption about the impact of
liberalization on airfares over the period 2006-09 gives
an estimate of the likely impact on visitor arrivals.The
baseline scenario suggests 11 million passengers by
2011 in the absence of liberalization; the alternative
scenario suggests that international arrivals could reach
13.4 million by 2011.
InvestmentThe alternative scenario also includes an allowance for
additional Travel & Tourism investment, primarily in
additional hotel rooms to match the increase in tourist
numbers. Detailed requirements will depend on the
type of visitors, the time of year they travel to Egypt,
etc, but the methodology looks at requirements in
broad terms:
• From the series of arrivals OEF calculates night
spend over the forecast period by assuming a constant
average stay of eight nights (which is the average for
the period 2001-04).
• The next step is to calculate the number of hotel
rooms required from the series of nights spent,
assuming a constant 75 per cent occupancy rate (equal
to the average occupancy over the period 2002-03).
The equation used is: rooms = nights spent /
(occupancy rate*365).
Investment in the Travel & Tourism sector is then
obtained as follows:
• 80 per cent of the rate of growth in hotel room
capacity, reflecting the importance of investment in the
hotel sector in total Travel & Tourism investment;
• An amount is added to reflect funds earmarked for
projects to expand air services infrastructure – a total of
about US$300 million spread over the period 2006-08,
Figure 22Baseline Scenario Projections, 2000-11
Arrivals Visitor T&T T&T T&T T&T T&T T&TExports Econ. GDP Ind. GDP Econ GDP Ind. GDP Econ. Employ Ind. Employ
(‘000) ($bn) ($bn) ($bn) (% of total) (% of total)
2000 5,116 4.7 11.3 7.9 11.6 8.1 9.7 6.8
2001 4,357 4.1 10.3 7.1 11.3 7.8 9.5 6.6
2002 4,906 4.1 10.1 7.3 11.7 8.5 9.9 7.2
2003 5,746 4.7 9.6 6.9 13.5 9.7 11.3 8.2
2004 8,160 6.1 11.6 8.5 15.0 11.0 12.6 9.3
2005 8,500 7.0 13.1 9.6 15.4 11.4 13.0 9.6
2006 8,717 7.3 13.7 10.1 15.4 11.3 13.0 9.5
2007 8,985 7.5 14.4 10.5 15.3 11.1 12.9 9.4
2008 9,484 8.0 15.3 11.2 15.3 11.2 12.9 9.4
2009 9,931 8.4 16.2 11.8 15.3 11.1 12.9 9.3
2010 10,433 8.9 17.2 12.5 15.4 11.1 12.9 9.2
2011 10,952 9.5 18.3 13.2 15.4 11.1 12.9 9.1
Source:WTTC
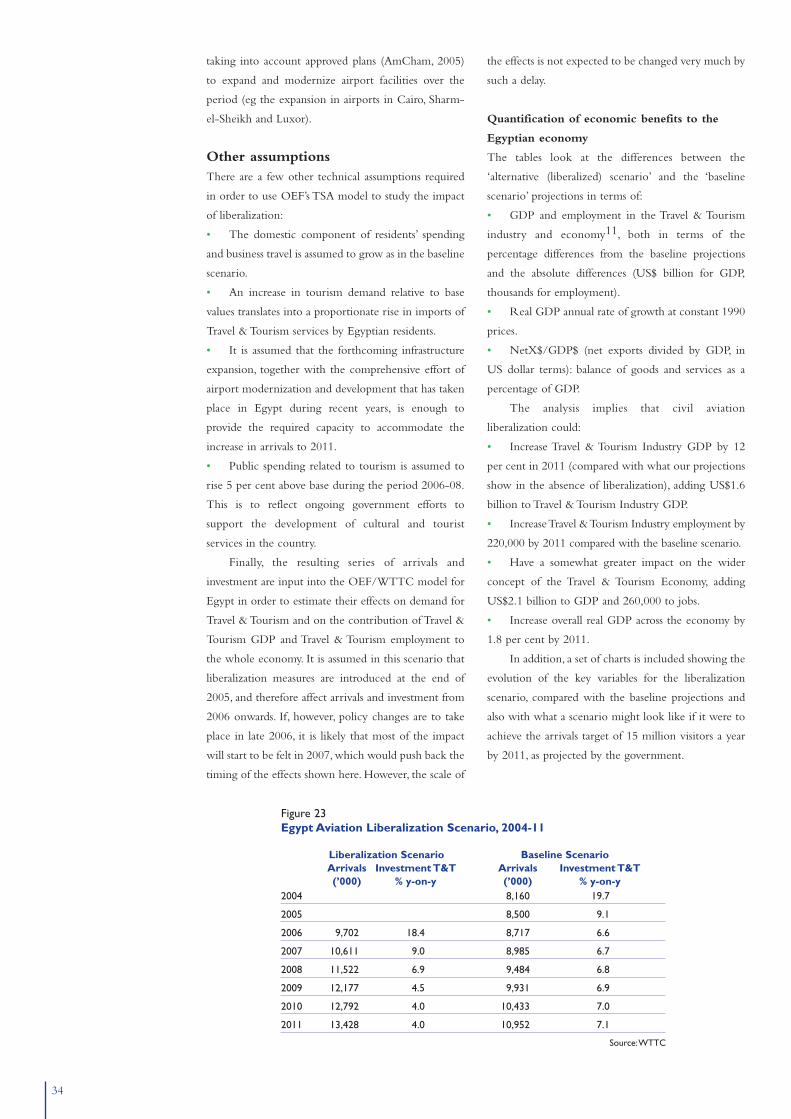
34
taking into account approved plans (AmCham, 2005)
to expand and modernize airport facilities over the
period (eg the expansion in airports in Cairo, Sharm-
el-Sheikh and Luxor).
Other assumptionsThere are a few other technical assumptions required
in order to use OEF’s TSA model to study the impact
of liberalization:
• The domestic component of residents’ spending
and business travel is assumed to grow as in the baseline
scenario.
• An increase in tourism demand relative to base
values translates into a proportionate rise in imports of
Travel & Tourism services by Egyptian residents.
• It is assumed that the forthcoming infrastructure
expansion, together with the comprehensive effort of
airport modernization and development that has taken
place in Egypt during recent years, is enough to
provide the required capacity to accommodate the
increase in arrivals to 2011.
• Public spending related to tourism is assumed to
rise 5 per cent above base during the period 2006-08.
This is to reflect ongoing government efforts to
support the development of cultural and tourist
services in the country.
Finally, the resulting series of arrivals and
investment are input into the OEF/WTTC model for
Egypt in order to estimate their effects on demand for
Travel & Tourism and on the contribution of Travel &
Tourism GDP and Travel & Tourism employment to
the whole economy. It is assumed in this scenario that
liberalization measures are introduced at the end of
2005, and therefore affect arrivals and investment from
2006 onwards. If, however, policy changes are to take
place in late 2006, it is likely that most of the impact
will start to be felt in 2007, which would push back the
timing of the effects shown here. However, the scale of
the effects is not expected to be changed very much by
such a delay.
Quantification of economic benefits to the
Egyptian economy
The tables look at the differences between the
‘alternative (liberalized) scenario’ and the ‘baseline
scenario’ projections in terms of:
• GDP and employment in the Travel & Tourism
industry and economy11, both in terms of the
percentage differences from the baseline projections
and the absolute differences (US$ billion for GDP,
thousands for employment).
• Real GDP annual rate of growth at constant 1990
prices.
• NetX$/GDP$ (net exports divided by GDP, in
US dollar terms): balance of goods and services as a
percentage of GDP.
The analysis implies that civil aviation
liberalization could:
• Increase Travel & Tourism Industry GDP by 12
per cent in 2011 (compared with what our projections
show in the absence of liberalization), adding US$1.6
billion to Travel & Tourism Industry GDP.
• Increase Travel & Tourism Industry employment by
220,000 by 2011 compared with the baseline scenario.
• Have a somewhat greater impact on the wider
concept of the Travel & Tourism Economy, adding
US$2.1 billion to GDP and 260,000 to jobs.
• Increase overall real GDP across the economy by
1.8 per cent by 2011.
In addition, a set of charts is included showing the
evolution of the key variables for the liberalization
scenario, compared with the baseline projections and
also with what a scenario might look like if it were to
achieve the arrivals target of 15 million visitors a year
by 2011, as projected by the government.
Figure 23Egypt Aviation Liberalization Scenario, 2004-11
Liberalization Scenario Baseline ScenarioArrivals Investment T&T Arrivals Investment T&T(’000) % y-on-y (’000) % y-on-y
2004 8,160 19.7
2005 8,500 9.1
2006 9,702 18.4 8,717 6.6
2007 10,611 9.0 8,985 6.7
2008 11,522 6.9 9,484 6.8
2009 12,177 4.5 9,931 6.9
2010 12,792 4.0 10,433 7.0
2011 13,428 4.0 10,952 7.1
Source:WTTC
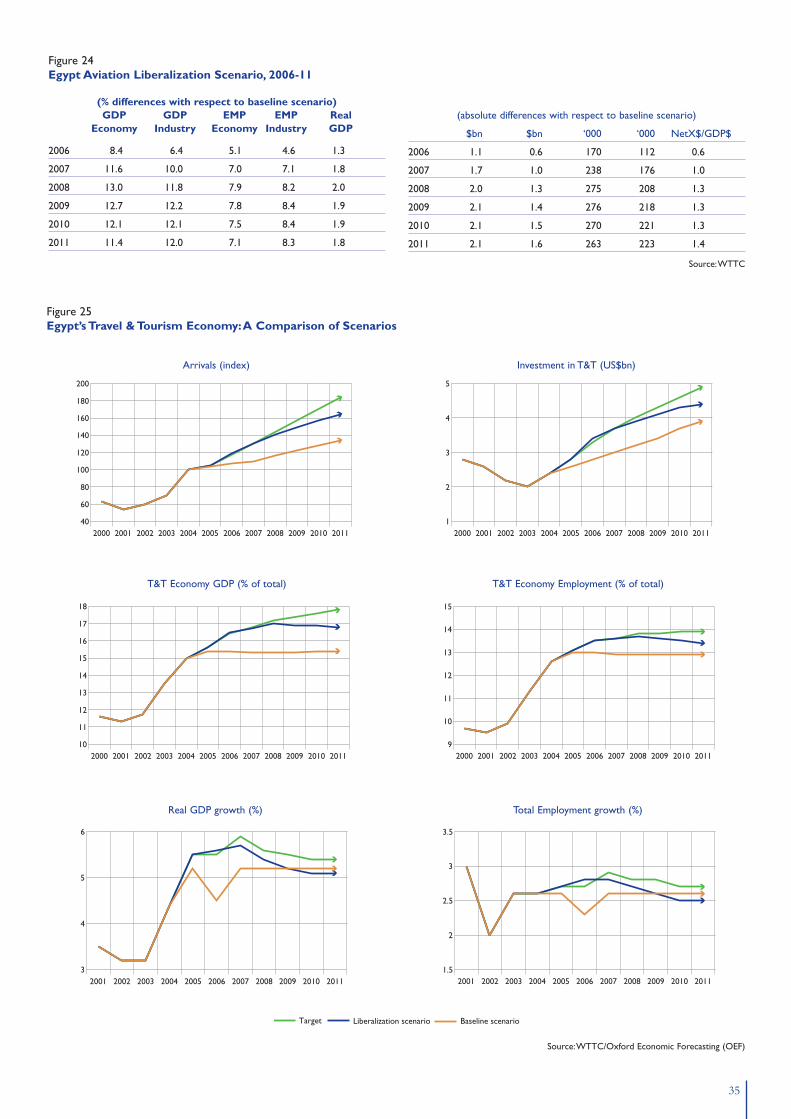
35
Figure 24Egypt Aviation Liberalization Scenario, 2006-11
(% differences with respect to baseline scenario)GDP GDP EMP EMP Real
Economy Industry Economy Industry GDP
2006 8.4 6.4 5.1 4.6 1.3
2007 11.6 10.0 7.0 7.1 1.8
2008 13.0 11.8 7.9 8.2 2.0
2009 12.7 12.2 7.8 8.4 1.9
2010 12.1 12.1 7.5 8.4 1.9
2011 11.4 12.0 7.1 8.3 1.8
(absolute differences with respect to baseline scenario)
$bn $bn ‘000 ‘000 NetX$/GDP$
2006 1.1 0.6 170 112 0.6
2007 1.7 1.0 238 176 1.0
2008 2.0 1.3 275 208 1.3
2009 2.1 1.4 276 218 1.3
2010 2.1 1.5 270 221 1.3
2011 2.1 1.6 263 223 1.4
Source:WTTC
Figure 25Egypt’s Travel & Tourism Economy:A Comparison of Scenarios
2000 2001 2002 2003 2004 2005 2006 2007 2008 2009 2010 201140
60
80
100
120
140
160
180
200
2000 2001 2002 2003 2004 2005 2006 2007 2008 2009 2010 201110
11
12
13
14
15
16
17
18
2001 2002 2003 2004 2005 2006 2007 2008 2009 2010 20113
4
5
6
2000 2001 2002 2003 2004 2005 2006 2007 2008 2009 2010 20111
2
3
4
5
2000 2001 2002 2003 2004 2005 2006 2007 2008 2009 2010 20119
10
11
12
13
14
15
2001 2002 2003 2004 2005 2006 2007 2008 2009 2010 20111.5
2
2.5
3
3.5
Arrivals (index) Investment in T&T (US$bn)
T&T Economy GDP (% of total) T&T Economy Employment (% of total)
Real GDP growth (%) Total Employment growth (%)
Target Liberalization scenario Baseline scenario
Source:WTTC/Oxford Economic Forecasting (OEF)
36
OUTLOOKEconomic recovery in the USA, the EU, Japan and
other Asian countries, a renewal of tourist confidence,
and lower air transport fares and accommodation
prices (related to increased competition in aviation
services and tourism destinations) are responsible for
the strong rebound in world Travel & Tourism.
Despite the irruption of geopolitical conflicts and
the multiplication of periodic terrorist attacks, more
people are travelling to medium- and long-haul
destinations, and more investment is being put into
new accommodation and entertainment facilities, both
in mature and in newly emerging resorts and tourism
destinations.
China, India and Russia are all experiencing huge
growth in tourism demand, and new infrastructure and
increased hotel supply are helping to boost the Travel
& Tourism industry and local economies. Citizens are
travelling not only within their world regions, but also
to intercontinental destinations.
The aviation industry is under pressure, with no
spare capacity to respond to increasing Travel &
Tourism and general air transport needs, especially in
peak seasons. Airlines are placing large orders for new
aircraft to be delivered in the next few years,
anticipating a significant growth in traffic demand.
As for Middle Eastern and North African
countries, including Egypt, prospects for the next few
years are bullish, despite political instability in the
region (notably in Iraq and Israel / Palestine), and fears
of new terrorist attacks.
Following a consistently favourable trend in 2003-
04, preliminary results for the first quarter of 2005,
together with WTTC and WTO forecasts for the full
12 months of 2005, point to sustained growth for
Travel & Tourism in Egypt.
European markets will sustain their position as the
most important tourism generating countries for
Egypt, both in number of international arrivals and in
volume of tourism receipts. Arab intra-regional
tourism is growing fast, and new markets like Russia
and other parts of eastern Europe, China, India,
Australia, Malaysia and Singapore are showing
enormous potential for the future.
The Egyptian Government seems to be
committed to a long-term tourism strategy, aiming to
create the necessary conditions not only to increase
foreign tourist arrivals, but also to increase average
length of stay in different tourist regions of the country
and to increase foreign currency receipts. The
government is aware of the importance of Travel &
Tourism for the country’s economy and is supporting
public and private investment in new and upgraded
airport and tourism infrastructure. Other policies
related to the needs and priorities of Travel & Tourism
are also being implemented, to:
• market and promote Egypt as a tourism
destination;
• encourage foreign and local private investment;
• train and qualify Travel & Tourism personnel; and
• ensure the safety and security of tourists and
tourism regions.
Other very sensitive policies – including monetary,
fiscal and civil aviation and air transport policies – seem
to be receiving renewed attention, as their impact on
the Travel & Tourism Industry are increasingly seen to
be decisive. By implementing these policies, the
Egyptian Government is hoping to achieve a target of
15 million foreign tourist arrivals by 2011.
CONCLUSIONSThe most important conclusion of this report is that,
even if the prospects for sustained worldwide growth
in demand are confirmed, and domestic policies with
positive effects on Travel & Tourism keep being
successfully implemented, the existing civil aviation
regulatory framework will prevent Egypt from
realizing its full potential as a tourism destination. In
this case, the targeted 15 million foreign tourist arrivals
in 2011 could not be achieved.
Egyptian Travel & Tourism statistics demonstrate
that most international tourists arrive by plane, so civil
CONCLUSIONS AND POLICYRECOMMENDATIONS
37
aviation and air transport policies and regulatory
decisions will have a strong impact on the performance
of the Travel & Tourism industry.
OEF’s forecasts and other research also lead to the
conclusion that the Egyptian Travel & Tourism industry
and the national economy will benefit from a less
regulated and more competitive airline operating
environment. The ‘aviation liberalization scenario’ laid
out in this study assumes the implementation of a full
set of liberalization policy measures. It forecasts 13.5
million tourist arrivals in 2011 – 2.5 million more than
in the ‘baseline scenario’, in which the existing civil
aviation regulatory environment would not be changed.
OEF’s research and analysis also suggests that, if
the Egyptian Government decides to move towards a
more open and competitive market in civil aviation
and air services, following the example of countries
like India,Turkey and the UAE, an additional increase
of 225,000 jobs and US$1.6 billion in Travel &
Tourism GDP could be achieved by 2011, compared
with the ‘baseline scenario’ projections.
While not intending to disparage the role and
importance of EgyptAir as the national carrier,
available data shows how limited its contribution to
international tourism is, not only from the main
generating markets in Europe, but most importantly
from countries now considered to be of strategic
interest for Egyptian tourism. It is quite clear that the
needs of air transport, related to the expected increase
in number of tourist arrivals by 2011, cannot be
satisfied by EgyptAir. Other international airlines
(scheduled, charter and low-cost) and Egyptian private
companies will continue to play an important and
decisive role in serving millions of tourists who decide
to travel from their countries of origin to different
Egyptian tourism regions.
Protecting EgyptAir’s interests and limiting the
operations of international or Egyptian privately
owned airlines will conflict with the larger economic
and social benefits that should result from the expected
growth of Travel & Tourism.The report also stresses the
need to remove existing non-transparent barriers to
the operation of Egyptian privately owned airlines,
allowing them to contribute positively to air transport
to and within the country. By doing so, the conditions
will be created to develop a stronger and more
competitive Egyptian Airline System, taking advantage
of synergies between EgyptAir and private airlines, and
reducing the country’s dependence on international
airlines.
Although it could be expected that EgyptAir
would be forced to make significant changes to its
structure and operations to face competition in a more
open aviation regulatory environment, benchmark
evidence shows that national carriers, under pressure
from new entrants and other competitors, are capable
of successfully reorganizing their structure and
operations and of becoming stronger, more efficient
and very competitive.
POLICYRECOMMENDATIONSWTTC believes that the long-term objectives of
Egypt’s civil aviation policy should be the opening up
of markets and the liberalization of air transport
services.
To secure the full economic benefits possible from
the development of Travel & Tourism, WTTC
specifically recommends that the Egyptian
Government take rapid steps to change the existing
protectionist civil aviation regulatory environment.
WTTC recommends a set of short-term
initiatives and policy decisions to be taken to:
• Respond positively and immediately to
international flag carriers’ requests to operate
additional frequencies or increase capacity on direct
scheduled services to Cairo International or other
Egyptian airports, thereby easing current restrictions
related to existing ASAs.
• Eliminate the existing restrictions on international
charter operations to Cairo International Airport, at
least outside the peak-hour periods (06.00-12.00 and
18.00-01.00). Assuming an average capacity of 20
flights per hour, this decision would allow a significant
number of additional foreign tourists to have direct
access to the Cairo region.
• Attract low-cost airlines to Cairo International
and other Egyptian airports, providing that they
guarantee year-round scheduled services, operating an
agreed number of daily frequencies and capacity.
• End all restrictions and all discriminatory practices
against privately owned Egyptian airlines wishing to
operate domestic routes. Existing non-transparent
barriers give room for EgyptAir to act as the sole
operator of scheduled services on domestic routes.
WTTC believes that open competition between
EgyptAir and other Egyptian airlines on domestic
routes will immediately result in lower airfares,
attracting more foreign tourists to visit different
regions of the country, and increasing average length of
stay. Tour operators, travel agents and airlines will no
longer be obliged to charge very high additional fares
38
to their normal package prices or airline seat-only fares
if their clients wish to include domestic sectors in their
overall trips.
• Encourage and allow international flag carriers to
carry passengers from a third country via their home
hub airport to Egypt on scheduled flights. These
special, so called, “sixth freedom” rights should
primarily be granted to airlines that demonstrate their
capability to fly passengers and potential tourists to
Cairo from countries considered to be of strategic
interest to Egyptian tourism, and not yet served by
direct scheduled flights.
As for short- to medium-term initiatives and
policy decisions,WTTC recommends that:
• Restrictive provisions included in air services
agreements (ASAs) signed with countries considered
to be of strategic interest for Egyptian tourism should
be renegotiated and released. The Egyptian
Government should take the initiative in approaching
their counterparts, suggesting the abolition of
restrictions on capacity, frequencies and points to serve,
allowing as many scheduled flights by international
airlines to Cairo and other Egyptian airports as
possible, even if reciprocity would not be immediately
granted.
• Egyptian privately owned airlines should have
access to traffic rights under bilateral ASAs, and
designated as another Egyptian operator on
international routes where other countries also have
two or more airlines flying to different Egypt
destinations. On international routes in which
EgyptAir has shown no interest in operating – or no
capacity to operate – other Egyptian airlines should be
encouraged to apply for the available traffic rights.
• All restrictions and regulations that are today
limiting international charter or low-cost operations to
Cairo International Airport should be eliminated.After
the Cairo International Airport upgrade and expansion
plan is completed, there will be no excuse for
maintaining existing restrictions, and the additional
capacity will allow the airport to accommodate the
expected increase in international and domestic
passenger traffic.
• New legislation should be introduced to protect
private Egyptian airlines on both international and
domestic routes from scheduling rules and pricing
strategies or other constraints designed to drive them
out of business. Thus allowing fair competition on
domestic routes. In fact, the Egyptian Government
should take all the necessary steps to create the
conditions for an efficient Egyptian airline system,
involving EgyptAir and other private Egyptian airlines.
A strong and competitive Egyptian airline system
would more easily prevent Egypt’s Travel & Tourism
Industry and Economy from irregular practices by
international tour operators and charter carriers.
Although not directly related to the objective of
this report, WTTC recommends that the Egyptian
Civil Aviation Authority and the Egyptian Holding
Company for Airports should work closely together to
take the necessary steps regarding Cairo Airport’s
infrastructure, equipment and management to:
• Allow EgyptAir to develop its own ‘hub-and-
spoke’ strategy, taking full advantage of Cairo’s
exceptional geographic position to link African and
European countries to Middle and Far East regions;
• Implement a commercial and marketing strategy
for the airport, by approaching international airlines to
start scheduled or non-scheduled services, or to
increase their frequencies and capacity to Cairo.
Airport promotional activities are a very important,
and sometimes decisive, component of countries’
tourism marketing policies or strategies, probably due
to their capacity to make established or emerging
tourism destinations more attractive and more
competitive to international airline operations.
Finally, WTTC does not recommend that Egypt
should unilaterally adopt an open skies aviation policy,
as regional conditions still do not exist to take full
advantage of this type of initiative. It should continue
to support the establishment of a Common Arab
Aviation Market that will pave the way to a multilateral
regional aviation liberalization agreement, where a
Middle East and North Africa open skies environment
should finally be implemented and achieved.
39
FOOTNOTES
1 WTO Barometer, June 2005, World TourismOrganization2 Ministry of Tourism,The Central Department ofInformation and Decision Support System3 Egyptian Tourist Authority, Information Centre,unpublished statistics4Egyptian Ministry of Tourism5 Egyptian Ministry of Tourism6Egyptian Ministry of Tourism7 For the past 15 years,WTTC has been developingforecasts for the economic contribution of Travel &Tourism to national economies, based on theTourism Satellite Accounting methodology. Eachyear in collaboration with Oxford EconomicForecasting (OEF), WTTC undertakes in depthTSA research studies on selected countries. TheseSpecial Country Reports quantify all aspects ofTravel & Tourism demand then translate thisinformation into economic concepts of production,which can be compared with other industries andthe economy as a whole to provide information thatwill assist in policy and business decision making.The reports also set out WTTC’s recommendationson policies that we believe will help optimize thepotential benefits of Travel & Tourism, ensuringlonger-term sustainable development and spreadingthe benefits across all levels of the economy andcountry. WTTC currently forecasts for 174countries across the world.8 Absolute priority should be given to internationalairlines flying from the markets considered strategicto Egypt’s future tourism (EU countries, the MiddleEast, Russia and eastern Europe, Turkey, China,India, Japan, South Korea,Australia, etc)9 Sixth freedom traffic rights should be given toairlines wishing to carry passengers and potentialtourists from countries considered as new strategicmarkets for Egyptian tourism, and not yet served bydirect scheduled flights; (eg India, China, Japan,Malaysia, Indonesia, Singapore, Australia, NewZealand, Hong Kong, South Korea, etc)Oxford Economic Forecasting – Tourism SatelliteAccount.10 The Travel & Tourism industry covers thosesectors normally regarded as serving tourists.However, we also define a wider concept of theTravel & Tourism economy which includes not justsupply to visitors but also goods/services producedmore widely on behalf of the tourist, ie collectivegovernment spending, capital formation and non-visitor exports. In both cases, the concepts reportedhere include both direct and indirect GDP andemployment, ie they include the impact ofpurchases made from supplier comp
REFERENCES ANDDATA SOURCES
Airline Business (Reed), Monthly Magazine
Airlines International (IATA), Issue 02/03, Feb,March, 2005
Air Transport Action Group (ATAG), TheContribution of Air Transport to SustainableDevelopment in Africa, 2003
Al- Ahram – Weekly on Line, Liberalizing theArab Skies, Nov. 2002
American Chamber of Commerce in Egypt(BSAC), The Tourism Sector in Egypt, 2002
American Chamber of Commerce in Egypt(BSAC), Tourism Sector Developments in Egypt,2005
Association of European Airlines (AEA), Airlines& Tourism – A Mutually Beneficial Relationship,2001
Association of European Airlines (AEA), AEAContribution to the Development of EU ExternalAviation Policy, 2004
Association of European Airlines (AEA),Developing the Agenda for the Community’sExternal Aviation Policy - Communication for theCommission-AEA Position, 2005
Aviation Week & Space Technology,WeeklyMagazine
Business Monitor International, Egypt TourismReport, Q1, 2005
Clancy, Michael, Globalizing the Skies: Domesticand International Sources of Commercial AirTransport
Egypt Air,Annual Resume, 2004
Egypt Air, Summer Timetable, 2005
Egypt Holding Company for Airports
Egypt Tourism Federation (ETF)
Egypt Ministry of Tourism, Central Departmentof Information and Decision SupportSystem. Tourism in Figures, 2003
Egyptian Tourist Authority, (ETA). InformationCenter, Unpublished Statistics 2003
European Commission,The Economic Impact ofan EU-US Open Skies Aviation Area, 2002
International Civil Aviation Organization(ICAO), Aviation Regulation: New Millennium– New Direction address by Dr.Assad Kotaite,2000
International Civil Aviation OrganizationJournal, Number 2, 2005
International Civil Aviation Organization(ICAO), Minutes of the Worldwide AirTransport Conference: Challenges andOpportunities of Liberalization, March, 2003
International Air Transport Association (IATA),International Traffic Statistics, 2004
International Air Transport Association (IATA),International Cargo and Passenger Forecasts2004 to 2008
OECD, Carbon Changes on Aviation Fuels, 1997
Orient Aviation (AAPA), Monthly Magazine
Oxford Economic Forecast (OEF), EconomicImpact of Air Liberalization in Egypt, June/July2005
US Department of Transport, 2000. TransatlanticDeregulation:The Alliance Network Effect.
World Travel & Tourism Council (WTTC), TheWay Forward-Multilateral Air TransportLiberalization, 1993
World Travel & Tourism Council (WTTC), AirTransport and Freer World Trade, 1997
World Travel & Tourism Council (WTTC), TheLiberalization of Egyptian Aviation Policies:TheBenefits for Tourism and the National Economy,1999
World Travel & Tourism Council (WTTC),Blueprint for New Tourism, 2003/04
World Travel & Tourism Council (WTTC),Progress & Priorities, 2004/05
World Travel & Tourism Council, Travel &Tourism Satellite Accounting Research, Estimatesand forecasts, 1999, 2005 and 2015
World Travel & Tourism Council, Egypt’s Travel& Tourism Forging Ahead,Travel & TourismEconomic Research, 2004
World Travel & Tourism Council (WTTC),Egypt – Travel & Tourism Sowing the Seeds ofGrowth,Travel & Tourism Economic Research,2005
World Tourism Organization (WTO),Compendium of Tourism Statistics 1999-2003(2005 edition)
World Tourism Organization (WTO), Tourismand Air Transport, Seminar Proceedings, May2000
World Tourism Organization(WTO), TourismMarket Trends 2003 and 2004 Editions
World Tourism Organization (WTO), TourismMarket Trends – 2004 Profile Egypt
World Tourism Organization, Tourism Highlights,2004
World Tourism Organization (WTO), TheFuture of Traditional Destinations – SeminarProceedings, May 2004
World Tourism Organization (WTO), Overviewof International and European Tourism in 2004and Outlook for 2005, May 2005
World Tourism Organization (WTO),CloserCooperation Would Bring Mutual Benefits to theAviation and Tourism Sectors, by Chris Lyle,ICAO Journal
World Tourism Organization (WTO), WorldTourism Barometer, 2003, 2004, 2005
www.tourismturkey.org/statistics
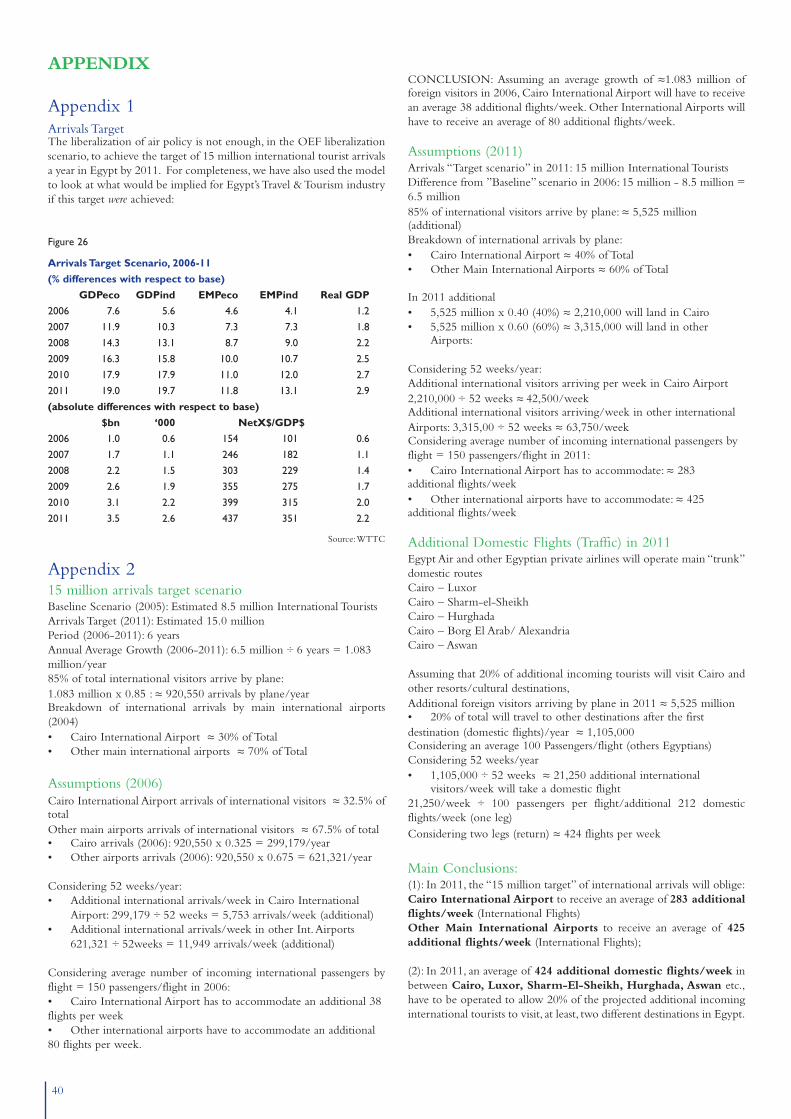
40
APPENDIX
Appendix 1Arrivals TargetThe liberalization of air policy is not enough, in the OEF liberalizationscenario, to achieve the target of 15 million international tourist arrivalsa year in Egypt by 2011. For completeness, we have also used the modelto look at what would be implied for Egypt’s Travel & Tourism industryif this target were achieved:
Figure 26
Arrivals Target Scenario, 2006-11
(% differences with respect to base)
GDPeco GDPind EMPeco EMPind Real GDP
2006 7.6 5.6 4.6 4.1 1.2
2007 11.9 10.3 7.3 7.3 1.8
2008 14.3 13.1 8.7 9.0 2.2
2009 16.3 15.8 10.0 10.7 2.5
2010 17.9 17.9 11.0 12.0 2.7
2011 19.0 19.7 11.8 13.1 2.9
(absolute differences with respect to base)
$bn ‘000 NetX$/GDP$
2006 1.0 0.6 154 101 0.6
2007 1.7 1.1 246 182 1.1
2008 2.2 1.5 303 229 1.4
2009 2.6 1.9 355 275 1.7
2010 3.1 2.2 399 315 2.0
2011 3.5 2.6 437 351 2.2
Source:WTTC
Appendix 215 million arrivals target scenarioBaseline Scenario (2005): Estimated 8.5 million International TouristsArrivals Target (2011): Estimated 15.0 million Period (2006-2011): 6 yearsAnnual Average Growth (2006-2011): 6.5 million ÷ 6 years = 1.083million/year85% of total international visitors arrive by plane:1.083 million x 0.85 : ≈ 920,550 arrivals by plane/yearBreakdown of international arrivals by main international airports(2004)• Cairo International Airport ≈ 30% of Total• Other main international airports ≈ 70% of Total
Assumptions (2006)Cairo International Airport arrivals of international visitors ≈ 32.5% oftotalOther main airports arrivals of international visitors ≈ 67.5% of total • Cairo arrivals (2006): 920,550 x 0.325 = 299,179/year• Other airports arrivals (2006): 920,550 x 0.675 = 621,321/year
Considering 52 weeks/year:• Additional international arrivals/week in Cairo International
Airport: 299,179 ÷ 52 weeks = 5,753 arrivals/week (additional)• Additional international arrivals/week in other Int.Airports
621,321 ÷ 52weeks = 11,949 arrivals/week (additional)
Considering average number of incoming international passengers byflight = 150 passengers/flight in 2006:• Cairo International Airport has to accommodate an additional 38flights per week• Other international airports have to accommodate an additional80 flights per week.
CONCLUSION: Assuming an average growth of ≈1.083 million offoreign visitors in 2006, Cairo International Airport will have to receivean average 38 additional flights/week. Other International Airports willhave to receive an average of 80 additional flights/week.
Assumptions (2011)Arrivals “Target scenario” in 2011: 15 million International TouristsDifference from ”Baseline” scenario in 2006: 15 million - 8.5 million =6.5 million85% of international visitors arrive by plane: ≈ 5,525 million(additional)Breakdown of international arrivals by plane:• Cairo International Airport ≈ 40% of Total• Other Main International Airports ≈ 60% of Total
In 2011 additional• 5,525 million x 0.40 (40%) ≈ 2,210,000 will land in Cairo• 5,525 million x 0.60 (60%) ≈ 3,315,000 will land in other
Airports:
Considering 52 weeks/year:Additional international visitors arriving per week in Cairo Airport2,210,000 ÷ 52 weeks ≈ 42,500/weekAdditional international visitors arriving/week in other internationalAirports: 3,315,00 ÷ 52 weeks ≈ 63,750/weekConsidering average number of incoming international passengers byflight = 150 passengers/flight in 2011:• Cairo International Airport has to accommodate: ≈ 283additional flights/week• Other international airports have to accommodate: ≈ 425additional flights/week
Additional Domestic Flights (Traffic) in 2011Egypt Air and other Egyptian private airlines will operate main “trunk”domestic routesCairo – LuxorCairo – Sharm-el-SheikhCairo – HurghadaCairo – Borg El Arab/ AlexandriaCairo – Aswan
Assuming that 20% of additional incoming tourists will visit Cairo andother resorts/cultural destinations,Additional foreign visitors arriving by plane in 2011 ≈ 5,525 million• 20% of total will travel to other destinations after the firstdestination (domestic flights)/year ≈ 1,105,000Considering an average 100 Passengers/flight (others Egyptians)Considering 52 weeks/year• 1,105,000 ÷ 52 weeks ≈ 21,250 additional international
visitors/week will take a domestic flight 21,250/week ÷ 100 passengers per flight/additional 212 domesticflights/week (one leg)Considering two legs (return) ≈ 424 flights per week
Main Conclusions:(1): In 2011, the “15 million target” of international arrivals will oblige:Cairo International Airport to receive an average of 283 additionalflights/week (International Flights)Other Main International Airports to receive an average of 425additional flights/week (International Flights);
(2): In 2011, an average of 424 additional domestic flights/week inbetween Cairo, Luxor, Sharm-El-Sheikh, Hurghada, Aswan etc.,have to be operated to allow 20% of the projected additional incominginternational tourists to visit, at least, two different destinations in Egypt.

The World Travel & Tourism Council (WTTC) would like to express its gratitude to the following individuals – well-known personalities
and experts – for their valuable contributions to this report:
H E Ahmed El Maghraby, Minister of Tourism
H E Minister of Civil Aviation Ahmed Shafik
Elhamy ElZayat, Chairman and CEO, Emeco Travel,Chairman of the Egyptian Tourism Federation (ETF)
Ahmed El Khadem, Chairman, Egyptian Tourism Authority (ETA)
Ibrahim Manaa, Chairman, Egypt Holding Company for Airports
Mohamed Mounir,Vice President Commercial, EgyptAir
Elsayed Saber, President,AMC Airlines
Professor Ahmed Galak, Executive Director,The Egyptian Center for Economic Studies
Professor Adla M Ragab,Associate Professor,Faculty of Economy and Political Science, Cairo University
Zoheir Garranah,Assistant to the Minister of Tourism
Ismail A E Ismail, Country Manager, Carlson Wagonlit Travel
Nabil Abdellatif, Chairman, Starco Group Travel
Hossan S Gouda, President, Blue Sky Travel Group
Mounir Wissa, Managing Director, Escapade Travel
WTTC also acknowledges, with thanks, the input of ETF Executive Director, Hisham Zaazou;Aviation Consultant,
Aly Mourad; and Executive Assistant Manager, Mrs Manal Hosny.
Thanks are also due to the entire research and economics team associated with this Egypt Report:
Oxford Economic ForecastingAlan Wilson, Director of Consulting Services
Pablo Astorga, Senior EconomistThe OEF Macroeconomic Forecasting and Technical Teams
ThinkturMaria Teresa Cavaco, Economist
Luis Correia da Silva, Managing Director
World Travel & Tourism CouncilRichard Miller, Executive Vice President
Olivia Ruggles-Brise, Policy and Communications Co-ordinatorLisa Fox, Co-ordinator, Regional Initiatives and Publications