Embed Size (px)
Citation preview
Aviation EconomicsJames House, LG,
22/24 Corsham StreetLondon N1 6DR
Tel: +44 (0) 20 7490 5215Fax: +44 (0) 20 7490 5218e-mail: [email protected]
Issue No: 41 March 2001
Aviation Strategy
Sabena: blue skies turning very stormy
The €250m capital injection received last month from the Belgianstate and SAirGroup may not prevent Sabena from becoming
the first European flag-carrier to disappear. The capital injection isjust intended as a first step towards full recovery. It was only madeafter yet another ambitious restructuring programme, which aims toimprove EBIT by €354m a year, was agreed to by the trade unionsafter frantic and acrimonious negotiations. The annual savings ondirect labour costs alone are targeted at €52m.
The Belgian state purchased new non-voting share certificatesvalued at €100m through its financial arm Zephyr Fin and SAiracquired more share certificates at a cost of €150m. While theBelgian state contribution has been roundly criticised by the airline'scompetitors, it is not expected that it will be disapproved by theEuropean Commission (whether SAir is happy or not with theCommission's stance is difficult to tell).
For now, Sabena has just pulled back from the brink. UnderBelgian company law, once the company's net worth sank to lessthan 25% of nominal equity in early December, the shareholderswere to either come up fast with a capital injection to redress thebalance sheet and meet the legal criteria, or liquidate the company.
Meanwhile the “Blue Sky” recovery plan has started. Newlyacquired aircraft were grounded and put up for sale. Prestigiouslong-haul Brussels-Newark and Brussels-Johannesburg serviceswere eliminated. Sabena-owned properties in New York and else-where will be sold.
Analysis
Sabena’s woes 1-2
Regional Jets on a steepclimb up their S-curve 3-5
Ryanair and itssecondary airport policy 5-6
Labour costs spiralin the US 7-8
New Air Canada:its real prospects 9-11
The avoidable cost question 11-12
Briefing
AirTran and its717 assets 13-16
Management
Who is responsible forrevenue management? 17-19
Macro-trends 20-21
Micro-trends 22-23
CONTENTS
PUBLISHER
www.aviationeconomics.com
-300
-250
-200
-150
-100
-50
0
50
1992 1993 1994 1995 1996 1997 1998 1999 2000
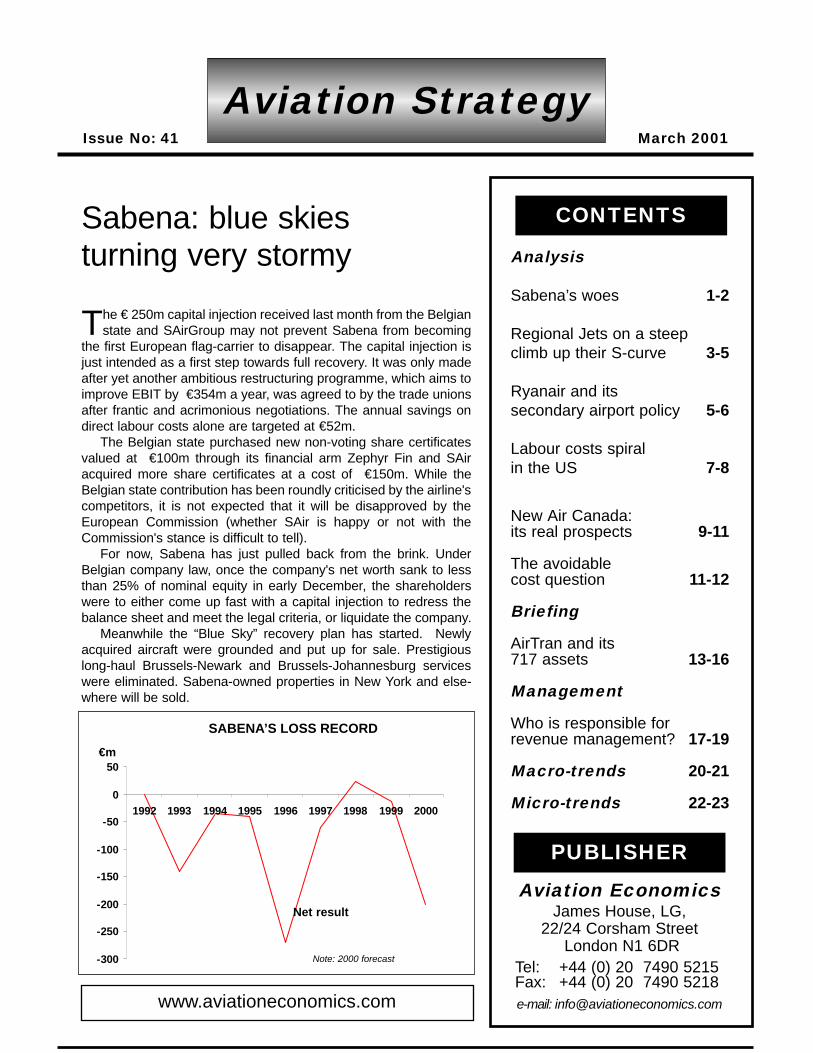
Note: 2000 forecast
SABENA’S LOSS RECORD
Net result
€m

Aviation StrategyAnalysis
March 2001
AviationStrategy
is published 12times a year by
AviationEconomicson the first of each month
Editor:Keith McMullan
Associate Editor:Heini Nuutinen
Subscriptionenquiries:
Keith McMullanTel: +44 (0) 20
7490 5215
Copyright:Aviation
EconomicsAll rights reserved
AviationEconomics
Registered No:2967706 (England)
Registered Office:James House, LG22/24 Corsham StLondon N1 6DR
VAT No: 701780947
ISSN 1463-9254
The opinions expressed inthis publication do not nec-essarily reflect the opinionsof the editors, publisher orcontributors. Every effort is
made to ensure that theinformation contained in thispublication is accurate, but
no legal reponsibility isaccepted for any errors or
omissions.
The contents of this publica-tion, either in whole or inpart, may not be copied,
stored or reproduced in anyformat, printed or electronic,without the written consent
of the publisher.
Compounding its problems, Sabena nolonger enjoys the unconditional support ofthe Belgian political and business elite. Onlythe French-speaking Socialist Party seemsto still stand by Sabena. One former politicalsupporter noted: "the airline played with fire.It renewed its entire fleet much too fast. Itlaunched loss-making new routes and con-tinued to price fares below cost."
There is widespread exasperation withthe unions. When at the end of August 2000CEO Christoph Müller came up with BlueSky, labour leaders were not pleased. "Theproblem is not with us, but with management,the board and the government,", complainthe pilots.
Because they suspected that Swissairwould cherry pick the best of Sabena'sroutes and other assets, the pilots and otherunions demanded an independent audit byIPSC, affiliated to ALPA. There is general dis-agreement on the audit's findings: still, staffproductivity is not the problem claim theunions. Management is to blame, and theBelgian state failed to provide enough capi-tal. The airline’s management reads thatfinancial resources were insufficient to renewthe fleet and at the same time grow so fast.Former managers are blamed; PaulReutlinger, who was in charge between 1996and 2000, is directly blamed.
A typical tale of an unreconstructed andunrealistic flag-carrier.
Sabena's hub development and itsalliance with American had huge potential.But its strategy appears to be largely basedon aggressive pricing to increase traffic vol-umes between European city pairs, viaBrussels, and little feed to long-haul ser-vices. Even if the numbers look good forBrussels airport, Sabena's the bottom line isnot there. Connecting passengers alwayscontribute less unit revenue than O&D traffic,and Sabena has not adapted its unit costbase to a hub operation.
Indeed, in recent years, Sabena hasclearly opted for growth at almost any price.
While turnover grew at a fast clip - €1.8bn in1997, €2.1bn in 1998, €2.3bn in 99, lossesmounted just as fast. No stranger to annuallosses (Sabena turned up a profit only twicein four decades), the airline earned at longlast a net profit of €22m in 98 but went backto lose €14m the following year. And thencame 2000 for which a loss of €200m isexpected.
The reaction of some local observers hasbeen bewilderment. "Accounts do not seemto reflect reality, said a professor of econom-ics at Brussels Catholic University. "It isimpossible to lose so much money in soshort a time."
Meanwhile, SAirGroup's plan to increaseits stake in Sabena to 85% is on hold. Themain interest of the SAir is in increasing itsexisting stake into the catering, cargo han-dling and ground handling activities, ratherthan in the main airline business. This wouldbe impossible to accept by the BelgianGovernment and a complete break-up of therelationship between the two main share-holders would be more likely.
This would leave Sabena at the mercy oflarger predators. Lufthansa and BritishAirways are rumoured to circle around theBelgian airline, both interested in the possi-bilities of gaining an additional hub. Springwill be hot in Brussels.
Correction: SAAIn the previous issue we stated that SAA does not operate to Germany. Of course, it flies toFrankfurt. Also we may have been too pessimistic in opining that “break-even is probably thebest [financial] result that can be expected for 2000/01”.
In operation On order737 17A319 12 16A320 2 1A321 3A330 10A340 2 4MD-11 2Total 48 21
SABENA’S FLEET
Source: ACAS, Dec 2000
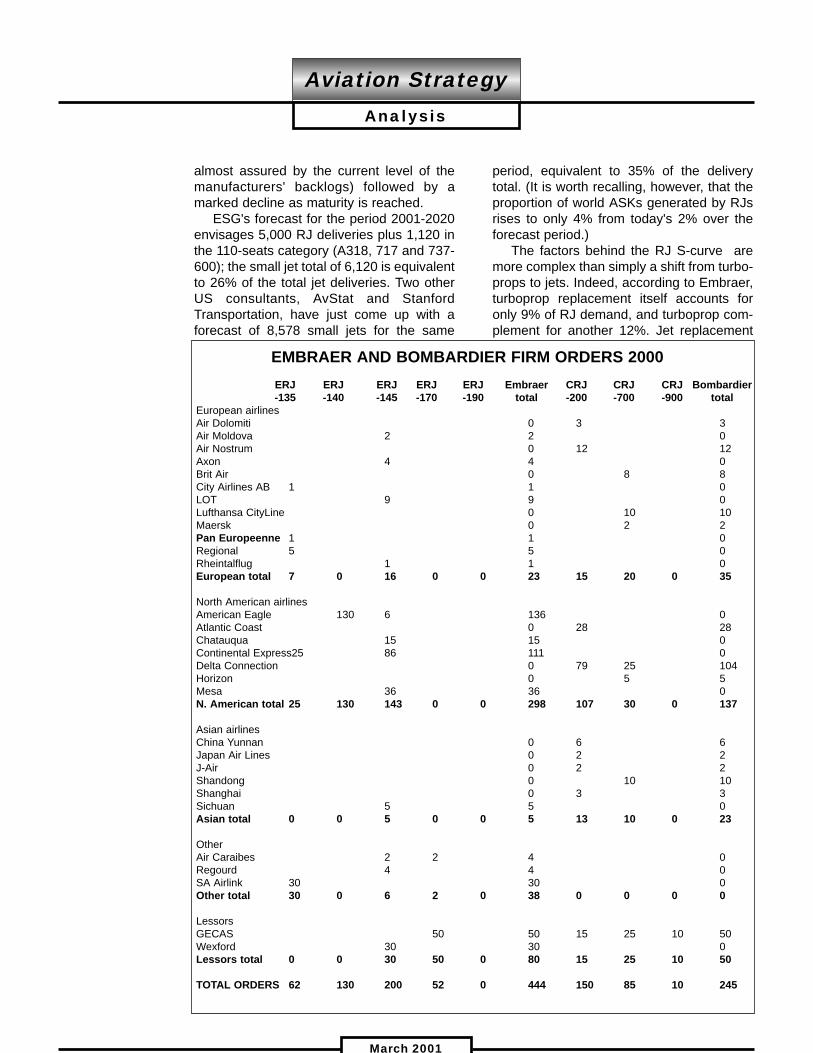
RJs on a steep climbup their S-curve
The Regional Jet phenomenon seemunstoppable. According to our estimates
RJ orders accounted for 41% of a recordtotal of 1,917 jets (see last issue forBoeing/Airbus analysis).
Our total of 786 identified orders forEmbraer, Bombardier, Fairchild Dornier andBAE Systems do not quite tie in with themanufacturers' official total of 778 grossorders. But, given the number of switchesbetween RJ types and between turbopropsand RJs, the difference is not significant.
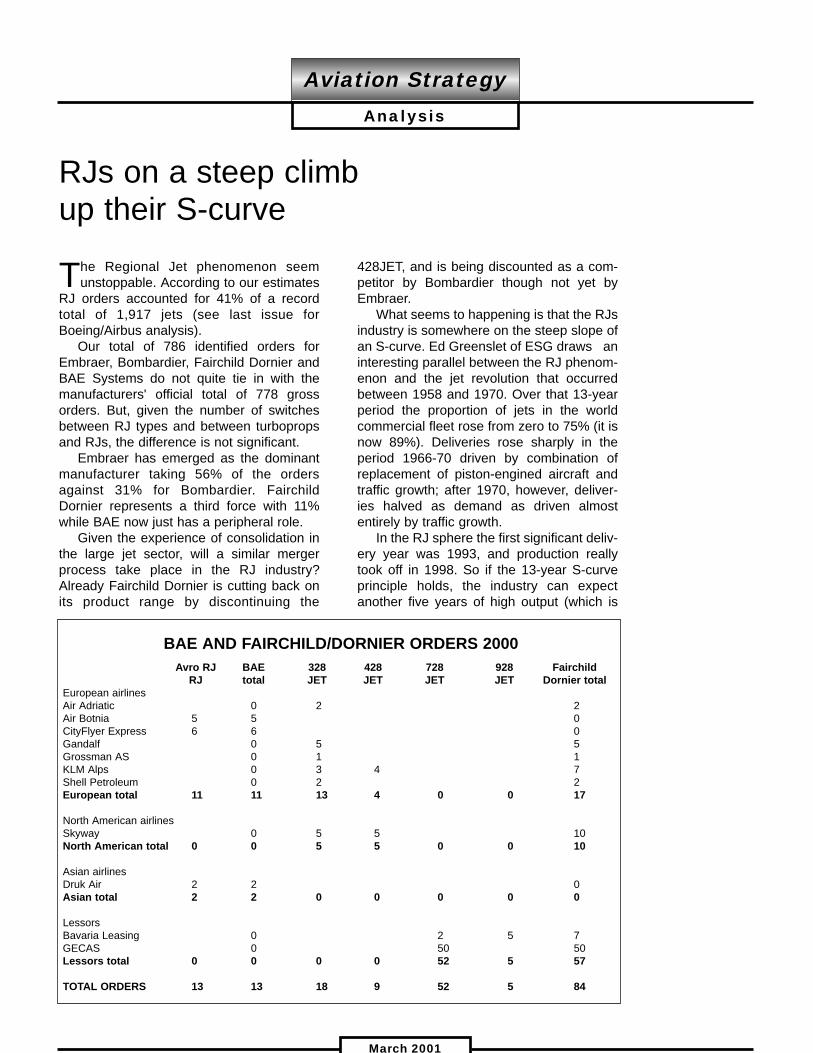
Embraer has emerged as the dominantmanufacturer taking 56% of the ordersagainst 31% for Bombardier. FairchildDornier represents a third force with 11%while BAE now just has a peripheral role.
Given the experience of consolidation inthe large jet sector, will a similar mergerprocess take place in the RJ industry?Already Fairchild Dornier is cutting back onits product range by discontinuing the
428JET, and is being discounted as a com-petitor by Bombardier though not yet byEmbraer.
What seems to happening is that the RJsindustry is somewhere on the steep slope ofan S-curve. Ed Greenslet of ESG draws aninteresting parallel between the RJ phenom-enon and the jet revolution that occurredbetween 1958 and 1970. Over that 13-yearperiod the proportion of jets in the worldcommercial fleet rose from zero to 75% (it isnow 89%). Deliveries rose sharply in theperiod 1966-70 driven by combination ofreplacement of piston-engined aircraft andtraffic growth; after 1970, however, deliver-ies halved as demand as driven almostentirely by traffic growth.
In the RJ sphere the first significant deliv-ery year was 1993, and production reallytook off in 1998. So if the 13-year S-curveprinciple holds, the industry can expectanother five years of high output (which is
Aviation StrategyAnalysis
March 2001
Avro RJ BAE 328 428 728 928 FairchildRJ total JET JET JET JET Dornier total
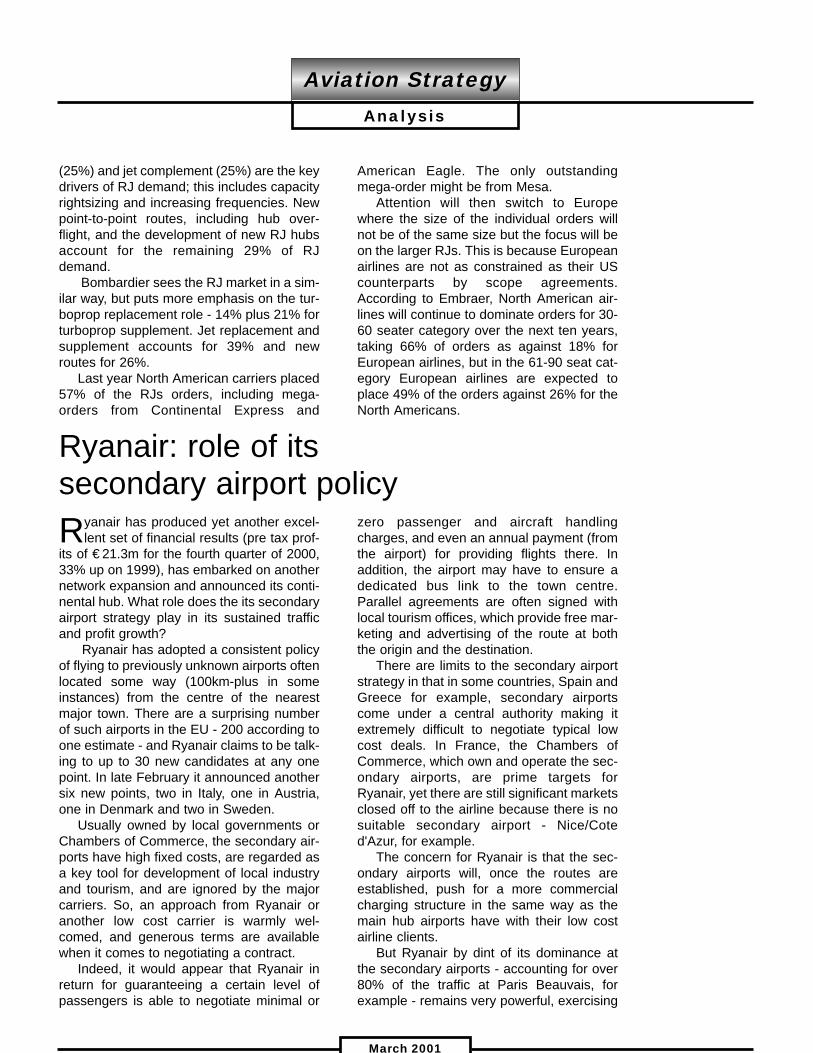
European airlinesAir Adriatic 0 2 2Air Botnia 5 5 0CityFlyer Express 6 6 0Gandalf 0 5 5Grossman AS 0 1 1KLM Alps 0 3 4 7Shell Petroleum 0 2 2European total 11 11 13 4 0 0 17
North American airlinesSkyway 0 5 5 10North American total 0 0 5 5 0 0 10
Asian airlinesDruk Air 2 2 0Asian total 2 2 0 0 0 0 0
LessorsBavaria Leasing 0 2 5 7GECAS 0 50 50Lessors total 0 0 0 0 52 5 57
TOTAL ORDERS 13 13 18 9 52 5 84
BAE AND FAIRCHILD/DORNIER ORDERS 2000
almost assured by the current level of themanufacturers' backlogs) followed by amarked decline as maturity is reached.
ESG's forecast for the period 2001-2020envisages 5,000 RJ deliveries plus 1,120 inthe 110-seats category (A318, 717 and 737-600); the small jet total of 6,120 is equivalentto 26% of the total jet deliveries. Two otherUS consultants, AvStat and StanfordTransportation, have just come up with aforecast of 8,578 small jets for the same
period, equivalent to 35% of the deliverytotal. (It is worth recalling, however, that theproportion of world ASKs generated by RJsrises to only 4% from today's 2% over theforecast period.)
The factors behind the RJ S-curve aremore complex than simply a shift from turbo-props to jets. Indeed, according to Embraer,turboprop replacement itself accounts foronly 9% of RJ demand, and turboprop com-plement for another 12%. Jet replacement
Aviation StrategyAnalysis
March 2001
ERJ ERJ ERJ ERJ ERJ Embraer CRJ CRJ CRJ Bombardier -135 -140 -145 -170 -190 total -200 -700 -900 total
European airlinesAir Dolomiti 0 3 3Air Moldova 2 2 0Air Nostrum 0 12 12Axon 4 4 0Brit Air 0 8 8City Airlines AB 1 1 0LOT 9 9 0Lufthansa CityLine 0 10 10Maersk 0 2 2Pan Europeenne 1 1 0Regional 5 5 0Rheintalflug 1 1 0European total 7 0 16 0 0 23 15 20 0 35
North American airlinesAmerican Eagle 130 6 136 0Atlantic Coast 0 28 28Chatauqua 15 15 0Continental Express25 86 111 0Delta Connection 0 79 25 104Horizon 0 5 5Mesa 36 36 0N. American total 25 130 143 0 0 298 107 30 0 137
Asian airlinesChina Yunnan 0 6 6Japan Air Lines 0 2 2J-Air 0 2 2Shandong 0 10 10Shanghai 0 3 3Sichuan 5 5 0Asian total 0 0 5 0 0 5 13 10 0 23
OtherAir Caraibes 2 2 4 0Regourd 4 4 0SA Airlink 30 30 0Other total 30 0 6 2 0 38 0 0 0 0
LessorsGECAS 50 50 15 25 10 50Wexford 30 30 0Lessors total 0 0 30 50 0 80 15 25 10 50
TOTAL ORDERS 62 130 200 52 0 444 150 85 10 245
EMBRAER AND BOMBARDIER FIRM ORDERS 2000
(25%) and jet complement (25%) are the keydrivers of RJ demand; this includes capacityrightsizing and increasing frequencies. Newpoint-to-point routes, including hub over-flight, and the development of new RJ hubsaccount for the remaining 29% of RJdemand.
Bombardier sees the RJ market in a sim-ilar way, but puts more emphasis on the tur-boprop replacement role - 14% plus 21% forturboprop supplement. Jet replacement andsupplement accounts for 39% and newroutes for 26%.
Last year North American carriers placed57% of the RJs orders, including mega-orders from Continental Express and
American Eagle. The only outstandingmega-order might be from Mesa.
Attention will then switch to Europewhere the size of the individual orders willnot be of the same size but the focus will beon the larger RJs. This is because Europeanairlines are not as constrained as their UScounterparts by scope agreements.According to Embraer, North American air-lines will continue to dominate orders for 30-60 seater category over the next ten years,taking 66% of orders as against 18% forEuropean airlines, but in the 61-90 seat cat-egory European airlines are expected toplace 49% of the orders against 26% for theNorth Americans.
Aviation StrategyAnalysis
March 2001
Ryanair: role of itssecondary airport policyRyanair has produced yet another excel-
lent set of financial results (pre tax prof-its of €21.3m for the fourth quarter of 2000,33% up on 1999), has embarked on anothernetwork expansion and announced its conti-nental hub. What role does the its secondaryairport strategy play in its sustained trafficand profit growth?
Ryanair has adopted a consistent policyof flying to previously unknown airports oftenlocated some way (100km-plus in someinstances) from the centre of the nearestmajor town. There are a surprising numberof such airports in the EU - 200 according toone estimate - and Ryanair claims to be talk-ing to up to 30 new candidates at any onepoint. In late February it announced anothersix new points, two in Italy, one in Austria,one in Denmark and two in Sweden.
Usually owned by local governments orChambers of Commerce, the secondary air-ports have high fixed costs, are regarded asa key tool for development of local industryand tourism, and are ignored by the majorcarriers. So, an approach from Ryanair oranother low cost carrier is warmly wel-comed, and generous terms are availablewhen it comes to negotiating a contract.
Indeed, it would appear that Ryanair inreturn for guaranteeing a certain level ofpassengers is able to negotiate minimal or
zero passenger and aircraft handlingcharges, and even an annual payment (fromthe airport) for providing flights there. Inaddition, the airport may have to ensure adedicated bus link to the town centre.Parallel agreements are often signed withlocal tourism offices, which provide free mar-keting and advertising of the route at boththe origin and the destination.
There are limits to the secondary airportstrategy in that in some countries, Spain andGreece for example, secondary airportscome under a central authority making itextremely difficult to negotiate typical lowcost deals. In France, the Chambers ofCommerce, which own and operate the sec-ondary airports, are prime targets forRyanair, yet there are still significant marketsclosed off to the airline because there is nosuitable secondary airport - Nice/Coted'Azur, for example.
The concern for Ryanair is that the sec-ondary airports will, once the routes areestablished, push for a more commercialcharging structure in the same way as themain hub airports have with their low costairline clients.
But Ryanair by dint of its dominance atthe secondary airports - accounting for over80% of the traffic at Paris Beauvais, forexample - remains very powerful, exercising
in some cases monopsonistic control. Also, most of the secondary airports are
not strictly profit-making entities; they arefunded by local taxes, regional subsidies, etcfunneled through the regional authority orlocal Chamber of Commerce. And as bud-gets tend to be increased in line with trafficincreases, there may not be an obviousincentive to battle Ryanair on charges.Consequently, Ryanair seem to be able topush through extensions on its existing con-tracts of up to 20 years.
Nevertheless, there are limits to whatRyanair can demand of the secondary air-ports and what they can provide. Theprocess of establishing a new continentalhub (more precisely a platform at whichRyanair will position 737s) illustrates this.
The hub choiceBrussels Charleroi, now served from
Dublin and London, has now been chosen,with Ryanair planning to position two 737sthere and operate to up to seven cities fromthe airport.
Ryanair states that it plans to invest€100m at Charleroi, a rather depressed for-mer coal-mining town, and guarantee 100local jobs.
What this investment will consist of isunclear. It was only last year that the localgovernment rejected a Ryanair request forsupport of flight crew overnight costs inreturn for positioning a 737 there, the politi-
cal argument being that although Ryanairlanded a lot of passengers in Wallonie(French-speaking southern Belgium) theyspent their money in Brussels City (a differ-ent administration). Evidently, Ryanair suc-ceeded in the changing the political view-point.
Stockholm was probably the closestcompetitor. But this city has limited potentialto develop into a European version of aSouthwest-type hub (see Briefing, Sept.2000 for a discussion of this concept) as it islocated too far north. Pisa probably sufferedfrom a similar disadvantage, being too farsouth in Ryanair’s network.
Frankfurt Hahn was some observers'favourite, but it comes under the authority ofFAG, which operates Frankfurt Main (50mpassengers a year), and on past experiencedoes not welcome any additional competi-tion.
A Paris hub might have been thought ofas ideal for a continental expansion. ButParis Beauvais is situated just too far outfrom the centre of Paris, and its terminalcapacity is limited at present (extensionwork is being carried out). Ryanair oper-ates there from Dublin and Glasgow but aLondon Stansted service would be verydifficult partly because of competition fromEurostar. The airport's management havealso apparently balked at the length of theextension of the current contract Ryanairhad suggested.
Aviation StrategyAnalysis
March 2001
AVIATION STRATEGY ONLINE
Subscribers can access Aviation Strategy (including all back numbers)through our website www.aviationeconomics.com.
However, you need a personal password - to obtain it email [email protected]
Aviation StrategyAnalysis
March 2001
Last year the main concern was rising fuelprices. Now everybody is worried about
potential strikes, as labour contract negotia-tions are breaking down all around, andabout the adverse effects of a slowing econ-omy on demand and unit revenues. Yet, thebiggest threat facing the US airline industryis rising labour expenses.
When fuel prices reached their recentpeak late last year, Standard & Poor's ana-lyst Philip Baggaley put the situation in per-spective when he pointed out that fuel priceswere still not that high by historical stan-dards. His main concern on the cost sidewas rising labour expenses - a bigger andmore permanent threat than fuel.
Labour is the single largest cost categoryfor airlines, usually accounting for at leastone third of operating costs. Unlike fuel,labour costs have been rising faster thaninflation since the early 1990s, and the trendaccelerated last year with extremely expen-sive contracts like United's new deal with itspilots.
The United standardUnited was in an unusual situation in that
all of its labour contracts became amendablewith the ending of the ESOP last year. Itspilots were determined to restore their 1994-level wages to industry-leading rates, and inorder to avoid further costly work slowdownsUnited basically gave them what they want-ed. They secured immediate pay rises of21.5-28.5%, followed by four annual 4%increases. This raised their pay 2-19%(depending on aircraft type) over the highestrates currently paid in the industry.
The deal, ratified in October, raised thebar for the rest of the industry, not just forpilots but right across employee groups.Suddenly, even the leaders of other majorairlines began talking about "industry-lead-ing" contracts, which would be indexed topay at leading competitors. "Each airline's
contract is expected to establish a newbenchmark that will subsequently be sur-passed by others in a leap-frog progressionof ever-higher pay", observed Baggaley.
The first concrete indication that this isindeed happening came in early February,when Delta offered its pilots wages thatexceed those of United's. The proposalincluded initial 7-17.5% rises and subse-quent annual increases that would add up to23-34% higher pay over the four-year con-tract. Delta Express pilots would be paidmore than their counterparts at Southwest.Delta also dropped its earlier controversialproposal to link pay increases to pilot pro-ductivity and company performance.
However, the pilots merely called the pro-posal "a step in the right direction", as thereremained disagreement over issues such asretroactive pay, job protection, use of region-al jets and elimination of a lower pay scale atDelta Express. The two sides failed to reachagreement by their self-imposed February28 deadline and were expected to ask to bereleased from federal mediation, whichwould start a 30-day countdown to a possi-ble strike.
Not even Southwest appears immune tothese new labour attitudes. Its pilots union isbelieved to have asked for an early renego-tiation of its current labour contract, whichwill not become amendable until September2004. One analyst suggested this was adirect consequence of the United pilot dealand Delta's latest offer to Delta Expresspilots.
The United pilot deal obviously alsoraised the expectations of other labourgroups at United. Its mechanics, who havebeen staging work slowdowns, are talkingabout "zooming right past the highest con-tracts in the industry", while its flight atten-dants, who are seeking substantial mid-termpay increases, now want "industry-leading-plus" wages.
United will pay a heavy price for the new
Labour costsspiral in the US
contracts. Its labour costs are currentlyexpected to surge by at least 20% in 2001.The latest estimate from Merrill Lynch is thatthe US industry's labour costs will rise by12% this year.
UAL's CFO Douglas Hacker recently pre-dicted that, as has often happened in thepast, revenue gains would soon offset thelabour cost increases. However, that seemsvery unlikely if the economy slows further.Reduced demand and higher domesticcapacity growth will diminish the industry'sability to raise fares. Merrill Lynch analystMichael Linenberg suggested recently thatthere may not be any systemwide fareincreases for at least the next two or threequarters.
The only bright spot is that fuel priceshave declined a little in recent months.American, for example, expects paying 6.4%less per gallon of fuel in the current quarterthan in the December quarter. But any fuelsavings will, of course, be overwhelminglyoffset by labour cost hikes.
While the US industry's aggregate earn-ings are expected to decline in 2001, Unitedcurrently estimates that it will only breakeven this year if the US Airways acquisitiongoes through.
The current labour situation in the US ishighly unusual in that the four largest carri-ers - United, American, Delta and Northwest- are all involved in contract negotiationswith key unions. The talks are difficult asworkers' expectations are high (in the wakeof the United pilot deal) while managementsare concerned about a slowing economy. Allare experiencing some type of job actions orovertime refusals, which have led to flightdelays and cancellations, and may facestrikes.
However, UBS Warburg analyst SamButtrick reassured investors in a recentresearch note that overlapping strikes, orany strikes for that matter, are extremelyunlikely. First, the National Mediation Boardcontrols the timing of a potential strike and isunlikely to allow overlapping cooling-off peri-ods. Second, President Bush has signalledhis intent to intervene if necessary. APresidential Emergency Board could delayany strike by 60 days.
Of course, none of that would solve any-thing. The past year has demonstrated howa key labour group's mere refusal to workovertime, if over a period of several months,can inflict almost as severe financial damageas a typical short airline strike.
Aviation StrategyAnalysis
March 2001
CUSTOMISED COMPANY AND MARKET BRIEFINGS
If you are interested in a briefing on a particular airline, manufacturer,lessor or industry sector/market, Aviation Economics is able to produce
in-depth reports customised to your requirements.
Contact: Tim Coombs or Keith McMullan +44 (0)20 7490 5215
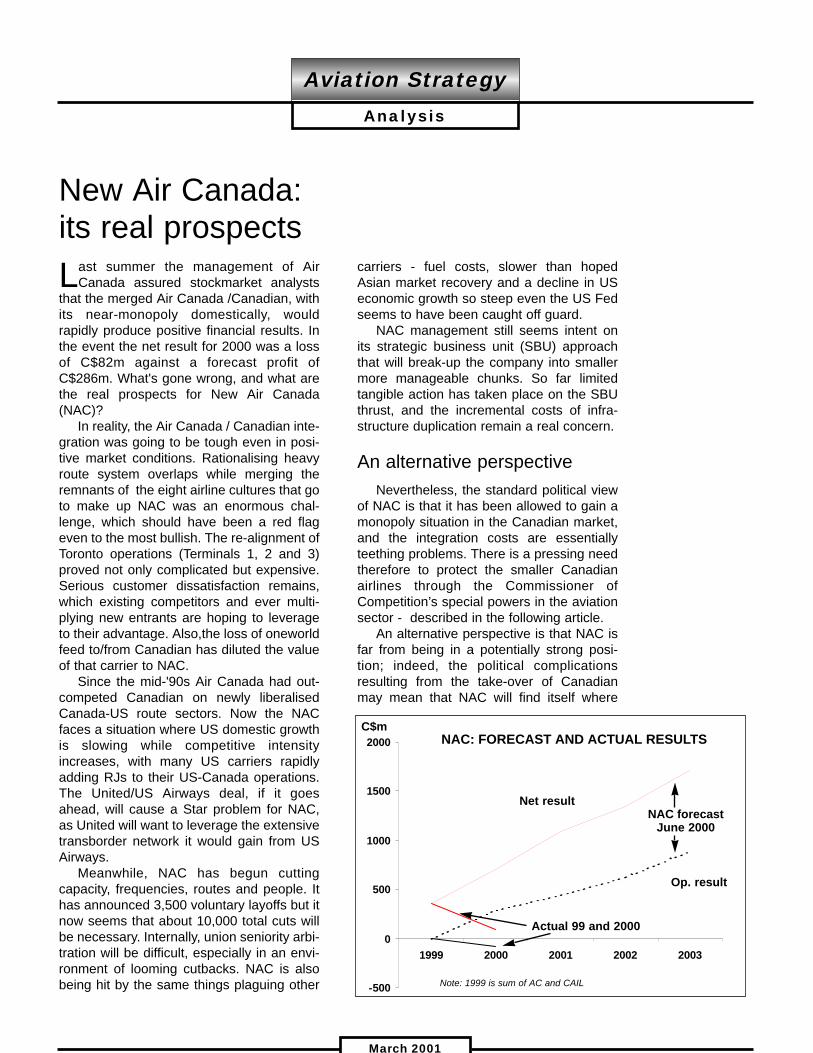
Last summer the management of AirCanada assured stockmarket analysts
that the merged Air Canada /Canadian, withits near-monopoly domestically, wouldrapidly produce positive financial results. Inthe event the net result for 2000 was a lossof C$82m against a forecast profit ofC$286m. What's gone wrong, and what arethe real prospects for New Air Canada(NAC)?
In reality, the Air Canada / Canadian inte-gration was going to be tough even in posi-tive market conditions. Rationalising heavyroute system overlaps while merging theremnants of the eight airline cultures that goto make up NAC was an enormous chal-lenge, which should have been a red flageven to the most bullish. The re-alignment ofToronto operations (Terminals 1, 2 and 3)proved not only complicated but expensive.Serious customer dissatisfaction remains,which existing competitors and ever multi-plying new entrants are hoping to leverageto their advantage. Also,the loss of oneworldfeed to/from Canadian has diluted the valueof that carrier to NAC.
Since the mid-'90s Air Canada had out-competed Canadian on newly liberalisedCanada-US route sectors. Now the NACfaces a situation where US domestic growthis slowing while competitive intensityincreases, with many US carriers rapidlyadding RJs to their US-Canada operations.The United/US Airways deal, if it goesahead, will cause a Star problem for NAC,as United will want to leverage the extensivetransborder network it would gain from USAirways.
Meanwhile, NAC has begun cuttingcapacity, frequencies, routes and people. Ithas announced 3,500 voluntary layoffs but itnow seems that about 10,000 total cuts willbe necessary. Internally, union seniority arbi-tration will be difficult, especially in an envi-ronment of looming cutbacks. NAC is alsobeing hit by the same things plaguing other
carriers - fuel costs, slower than hopedAsian market recovery and a decline in USeconomic growth so steep even the US Fedseems to have been caught off guard.
NAC management still seems intent onits strategic business unit (SBU) approachthat will break-up the company into smallermore manageable chunks. So far limitedtangible action has taken place on the SBUthrust, and the incremental costs of infra-structure duplication remain a real concern.
An alternative perspectiveNevertheless, the standard political view
of NAC is that it has been allowed to gain amonopoly situation in the Canadian market,and the integration costs are essentiallyteething problems. There is a pressing needtherefore to protect the smaller Canadianairlines through the Commissioner ofCompetition’s special powers in the aviationsector - described in the following article.
An alternative perspective is that NAC isfar from being in a potentially strong posi-tion; indeed, the political complicationsresulting from the take-over of Canadianmay mean that NAC will find itself where
Aviation StrategyAnalysis
March 2001
-500
0
500
1000
1500
2000
1999 2000 2001 2002 2003
New Air Canada:its real prospects
NAC: FORECAST AND ACTUAL RESULTSC$m
Net result
Op. result
NAC forecastJune 2000
Actual 99 and 2000
Note: 1999 is sum of AC and CAIL
Canadian was 12 months after its ownacquisition of Ward Air (1991) - short ofcash, in a recession, and saddled with anon-competitive cost profile.
Back in 1999 the government (both fed-eral and some provincial) finally decided thatit was unwilling to bail out Canadian again.Instead, it opted for a radical policy rethink,abandoning the key concept of maintaining alopsided duopoly. By providing antitrustexemptions for merger talks and questioningthe protective covenants on shareholdercontrol contained in the Air CanadaPrivatization Act, the government signaledits willingness for others to bid for bothCanadian and Air Canada. In the fall of1999 air traffic growth was still strong and itseemed that nothing but synergies wouldemerge from some form of a merger orforced amalgamation of Air Canada andCanadian. Importantly, the governmentwould be spared the embarrassment ofmass redundancies should Canadian go outof business.
Onex Corp., backed by AmericanAirlines and politically well-connected, couldhave provided the ideal suitor for both air-lines, as well as alleviating some political dif-ficulties. Government could always claimthat a market solution had prevailed over thetraditional political subsidy alternative. Anew crop of vigorous new entrants would, inthe fullness of time, be counted upon to pro-vide the newly merged beast with customerpleasing competition. Airline customers (vot-ers) would see that this was the right solu-tion and government would be happy to pro-vide those competitive safeguards thatwould make the whole restructuring work.
However, Air Canada, backed by its Starpartner Lufthansa, launched its own suc-cessful bid to take over Canadian, addingdebt and a very weak operating brand to itsown ineffective cost structure. HadCanadian been allowed to fail, which it wasclose to doing in late fall of 99, Air Canadawould have been a strong contender for thefew valuable Canadian assets remaining.
Canadian’s political legacyBut, distracted by the heat of the Onex
battle, Air Canada was not only forced tobuy all of Canadian but also to agree to aseries of social commitments with the gov-ernment. These undertakings sought to calmboth public and employee fears over mas-sive lay-offs, abandonment of thinnerdomestic route, unbridled price rises, etc.
Meanwhile, the government increasinglypresented itself as a white knight who wouldensure the new Air Canada would honour itscommitments to employees and the public.By winter 2000 the problems of merging AirCanada and Canadian were causing anuproar thereby fortifying the government'srole in defending the monopolistically-impaired traveller. The summer of 2000 isremembered as one of the worst in terms ofservice quality that Canadian air travellershave ever seen. The government nowdecided to create an airline complaintsombudsman post, appointing a formerNational Hockey League referee as its firstoffice holder.
In late 2000 NAC decided to respond tonew entrant Canjet by using the usual tools.Canjet complained and the governmentdecided to restrict NAC from playing withfares or capacity too much lest they be con-sidered predatory. So the deregulated mar-ket is now somewhat re-regulated, with apolicy objective of increasing competition - are-balancing of Canadian domestic marketshare to about 60% for NAC and 40% for therest.
Finding itself in this situation, NAC, thehighest cost player in the market, has to cutroutes, jobs and airplanes, but its ability todo so is curtailed by its public commitmentsto government. Thus voluntary job cuts androute capacity contractions, mostly interna-tionally, are all NAC is allowed to do to get toa recession-survivable position.
What gives?Soon something will have to give. Most
likely will be a re-negotiation of some ofthose government commitments. OtherwiseNAC will spill copious incremental amountsof red ink. In fact, in 12 months from now ifno major internal synergies (C$700m wasinitially mentioned by NAC management),
Aviation StrategyAnalysis
March 2001

The tricky question ofavoidable costsAs mentioned in the previous article,
Canada's Commissioner of Competitionhas now issued draft guidelines on "TheAbuse of Dominance in the Airline Industry".Comments are requested by May 18, 2001.
One of the most important features grant-ed under the Competition Act and enshrinedin these guidelines is that Commissioner ofCompetition has special powers "to inter-vene to prevent injury to competition". Theidea is that the Commissioner will be able toprevent predation rather than just investigat-ing actions which may already have provedfatal to its victim.
Anti-competitive Acts are defined aspredatory, exclusionary and other conductscarried out by a dominant carrier in four mainareas:• Pre-empting airport facilities, services or
slots that are required by another carrier forthe operation of its business, with the objectof withholding the airport facilities or servicesfrom a market;• Using commissions, incentives or otherinducements (including the use of FFPs) tosell or purchase flights for the purpose ofdisciplining or eliminating a competitor orimpeding or preventing a competitor's entryinto, or expansion in, a market;• Altering schedules, networks, or infrastruc-ture for the purpose of disciplining or elimi-nating a competitor; and • Operating or increasing capacity (or usinga low-cost second brand carrier) on a routeat fares that do not cover the "avoidablecost" of providing service.
The last point is the most problematicwhen defining anti-competitive behaviour. In
Aviation StrategyAnalysis
March 2001
are allowed,and markets continue to slow,and competition continues to escalate, andfuel continued to rise, and Canadian debtcontinues to weigh heavily on NAC, thenthings look decidedly bleak. At that pointNAC will be where Canadian was by mid-1999 except this time there will be no othermajor Canadian carrier to merge or absorbNAC. So what then?
Some interesting options present them-selves. By the fall of 2002 NAC will have thejustification to do all the cost-cutting andstructural synergising it can muster. Otherlower cost domestic market carriers(WestJet, Canjet, Canada 3000, etc.) willhave grown, and could conceivably havegarnered 30%-plus of domestic point-to-point traffic, thus making things seem lessmonopolistic.
With markets either at or close to theircyclical low it is not a major leap to posit thatNAC financials would be precarious by theend of 2002. NAC’s need for further debtsupport or cash infusion could then possiblyput the carrier in play once again.
Enter the government, which would pre-
sumably be searching for another marketsolution, so avoiding unnecessary govern-ment fiscal involvement. And the startlingopportunity to repeat the events of the fall of1999 emerges.
Onex or some other Canadian venturecapital firm could step forward with theassurance of either formal or tacit govern-ment approval. To the acquirer the transac-tion would seem much easier to accomplishthan the original Canadian buyout by AirCanada.
By fall 2002, domestic monopoly is nolonger a hot potato, much of NAC’s costre-alignment is done, markets are flat orturning up, customers’ memories of the ter-rible summer of 2000 are fading, and unionintegration issues are at least partlyresolved.
If anything resembling this scenario wereto materialise, then NAC shareholderswould consider the merger a failure, butOnex or another VC firm might consider thelonger term result a success. Time will tell asit always does.
By Louis Gialloreto, McGill University
Contact:[email protected]
or
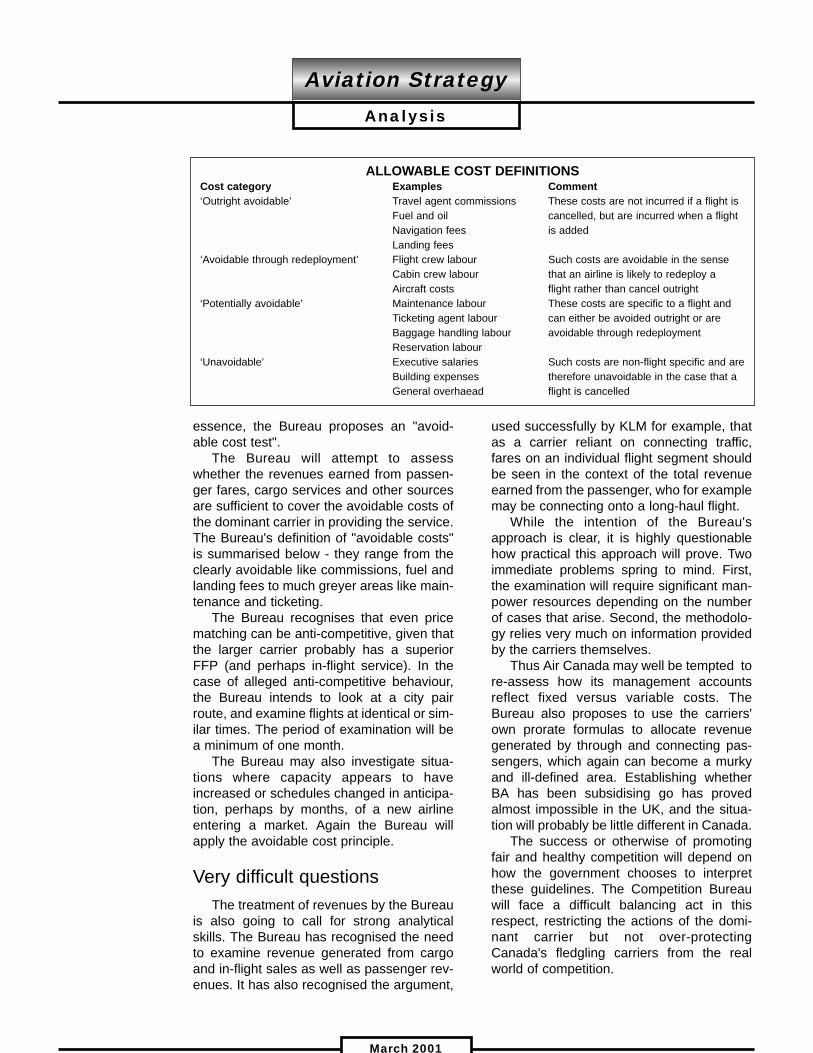
essence, the Bureau proposes an "avoid-able cost test".
The Bureau will attempt to assesswhether the revenues earned from passen-ger fares, cargo services and other sourcesare sufficient to cover the avoidable costs ofthe dominant carrier in providing the service.The Bureau's definition of "avoidable costs"is summarised below - they range from theclearly avoidable like commissions, fuel andlanding fees to much greyer areas like main-tenance and ticketing.
The Bureau recognises that even pricematching can be anti-competitive, given thatthe larger carrier probably has a superiorFFP (and perhaps in-flight service). In thecase of alleged anti-competitive behaviour,the Bureau intends to look at a city pairroute, and examine flights at identical or sim-ilar times. The period of examination will bea minimum of one month.
The Bureau may also investigate situa-tions where capacity appears to haveincreased or schedules changed in anticipa-tion, perhaps by months, of a new airlineentering a market. Again the Bureau willapply the avoidable cost principle.
Very difficult questionsThe treatment of revenues by the Bureau
is also going to call for strong analyticalskills. The Bureau has recognised the needto examine revenue generated from cargoand in-flight sales as well as passenger rev-enues. It has also recognised the argument,
used successfully by KLM for example, thatas a carrier reliant on connecting traffic,fares on an individual flight segment shouldbe seen in the context of the total revenueearned from the passenger, who for examplemay be connecting onto a long-haul flight.
While the intention of the Bureau'sapproach is clear, it is highly questionablehow practical this approach will prove. Twoimmediate problems spring to mind. First,the examination will require significant man-power resources depending on the numberof cases that arise. Second, the methodolo-gy relies very much on information providedby the carriers themselves.
Thus Air Canada may well be tempted tore-assess how its management accountsreflect fixed versus variable costs. TheBureau also proposes to use the carriers'own prorate formulas to allocate revenuegenerated by through and connecting pas-sengers, which again can become a murkyand ill-defined area. Establishing whetherBA has been subsidising go has provedalmost impossible in the UK, and the situa-tion will probably be little different in Canada.
The success or otherwise of promotingfair and healthy competition will depend onhow the government chooses to interpretthese guidelines. The Competition Bureauwill face a difficult balancing act in thisrespect, restricting the actions of the domi-nant carrier but not over-protectingCanada's fledgling carriers from the realworld of competition.
Aviation StrategyAnalysis
March 2001
ALLOWABLE COST DEFINITIONSCost category Examples Comment‘Outright avoidable’ Travel agent commissions These costs are not incurred if a flight is
Fuel and oil cancelled, but are incurred when a flightNavigation fees is addedLanding fees
‘Avoidable through redeployment’ Flight crew labour Such costs are avoidable in the senseCabin crew labour that an airline is likely to redeploy aAircraft costs flight rather than cancel outright
‘Potentially avoidable’ Maintenance labour These costs are specific to a flight and Ticketing agent labour can either be avoided outright or are Baggage handling labour avoidable through redeploymentReservation labour
‘Unavoidable’ Executive salaries Such costs are non-flight specific and are Building expenses therefore unavoidable in the case that a General overhaead flight is cancelled
AirTran: impressive recoveryleveraged on 717 assets
AirTran Airways, the second largest (afterFrontier) of the early 1990s generation of
US low-fare airlines, has staged an impressivefinancial recovery over the past two years, butuntil recently its prospects were marred by a$230m balloon debt payment due this April. Inlate January the carrier secured a bindingagreement with Boeing Capital Corporation(BCC) to refinance that debt. With the majorobstacle removed, AirTran can now focus itsefforts on growth, fleet renewal and consolidat-ing profitability.
The debt being refinanced consists of twolots of junk bonds issued by AirTran's prede-cessor ValuJet, $150m in April 1996 and $80min August 1997. Those proceeds, together withValuJet's large cash reserves, enabled thecompany to sustain operations through threeyears of heavy losses as it rebuilt operationsand restructured itself after the 1996 crash andthree-month grounding.
However, the need to repay the $230mdebt in April 2001 increasingly cloudedAirTran's prospects and kept its share pricelow. It would not be able to generate enoughcash flow from operations to repay the debt,and refinancing it in a weak bond market wasquite a challenge for a small airline with rela-tively weak credit ratings.
As on other occasions in the past, Boeingcame to the rescue. In a deal reached in prin-ciple in November and finalised in late January,BCC agreed to provide $220m in debt andequity instruments, with the remaining $10mcoming from internally generated funds. At cur-rent interest rates, the all-in financing cost overthe seven-year term of the loan will be 11.25-11.75%, which is probably less than whatAirTran would have paid in the current publicjunk bond market.
AirTran will now retire the existing $230m ofdebt in mid-April. Clearly, as many analystspoint out, eliminating the refinancing risk faroutweighs the negative effects, namely com-mon stock dilution of up to 8% (which willreduce EPS growth) and higher interest costs.
The company's share price has recoveredstrongly since the Boeing deal wasannounced. Also, Standard & Poor's recentlyraised AirTran's credit ratings by one notch, cit-ing the refinancing and improved earnings andcash flow.
Boeing's involvement was hardly surprisingin light of AirTran's 717 launch customer statusand substantial order commitment (originallyValuJet's $1bn 50-aircraft launch order for theMD-95 in 1995). In May 2000, as AirTranbegan to feel the burden of high interestexpenses following the purchase of the initialten 717s, Boeing agreed to provide leasefinancing for the next 20 717s on highlyfavourable terms, covering deliveries up toFebruary 2002.
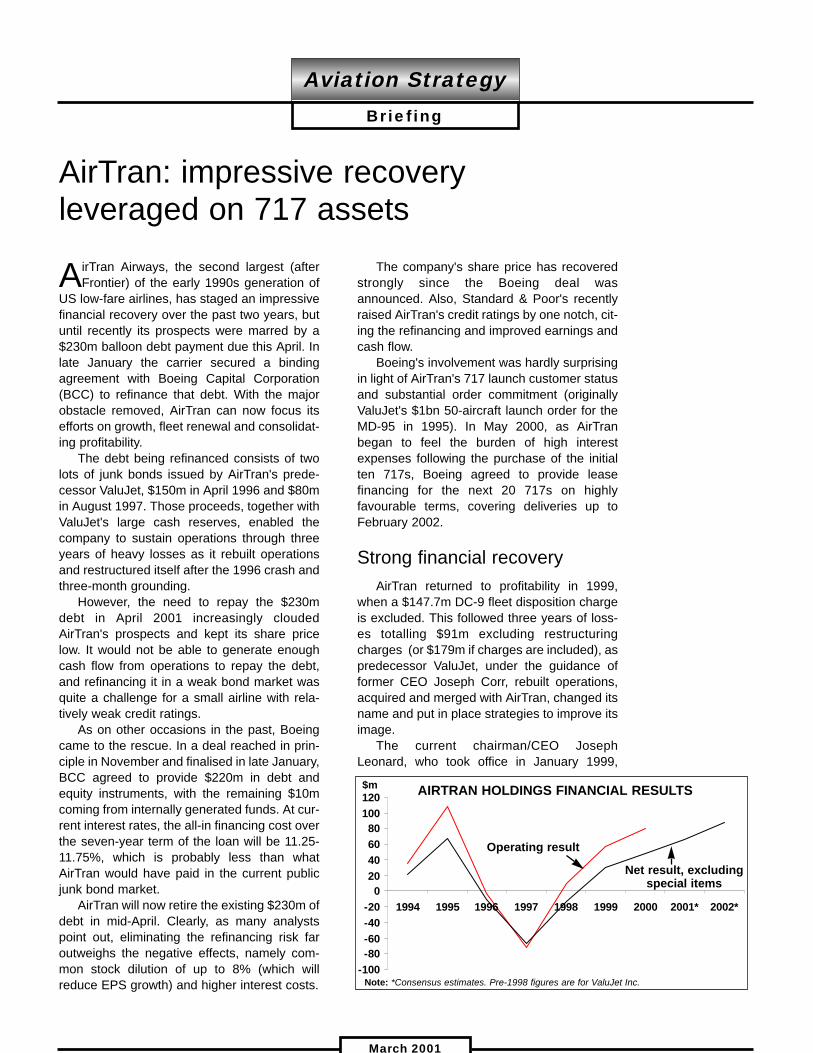
Strong financial recoveryAirTran returned to profitability in 1999,
when a $147.7m DC-9 fleet disposition chargeis excluded. This followed three years of loss-es totalling $91m excluding restructuringcharges (or $179m if charges are included), aspredecessor ValuJet, under the guidance offormer CEO Joseph Corr, rebuilt operations,acquired and merged with AirTran, changed itsname and put in place strategies to improve itsimage.
The current chairman/CEO JosephLeonard, who took office in January 1999,
Aviation StrategyBriefing
March 2001
-100-80-60-40-20
020406080
100120
1994 1995 1996 1997 1998 1999 2000 2001* 2002*
$m AIRTRAN HOLDINGS FINANCIAL RESULTS
Note: *Consensus estimates. Pre-1998 figures are for ValuJet Inc.
Operating result
Net result, excludingspecial items
focused on cost controls and refining revenuestrategies. Profitability was restored as unitcosts were reduced and yields and load factorsrecovered substantially. Leonard and his man-agement team are highly regarded by WallStreet.
AirTran reported a $47.4m net profit on rev-enues of $624.1m for 2000, up 63% and 24%respectively on the 1999 results. Operatingprofit rose by 45% to $81.2m, representing a13% margin - the second highest in the USindustry after Southwest's 18.1%.
The results were impressive in light of theextremely challenging operating environment.AirTran's own fuel expenses more than dou-bled last year. The carrier also talked of a sig-nificant slowdown in ATC efficiency at itsAtlanta hub and at critical Northeast airports,which it estimated reduced average speedover its entire system by 30 miles per hour.
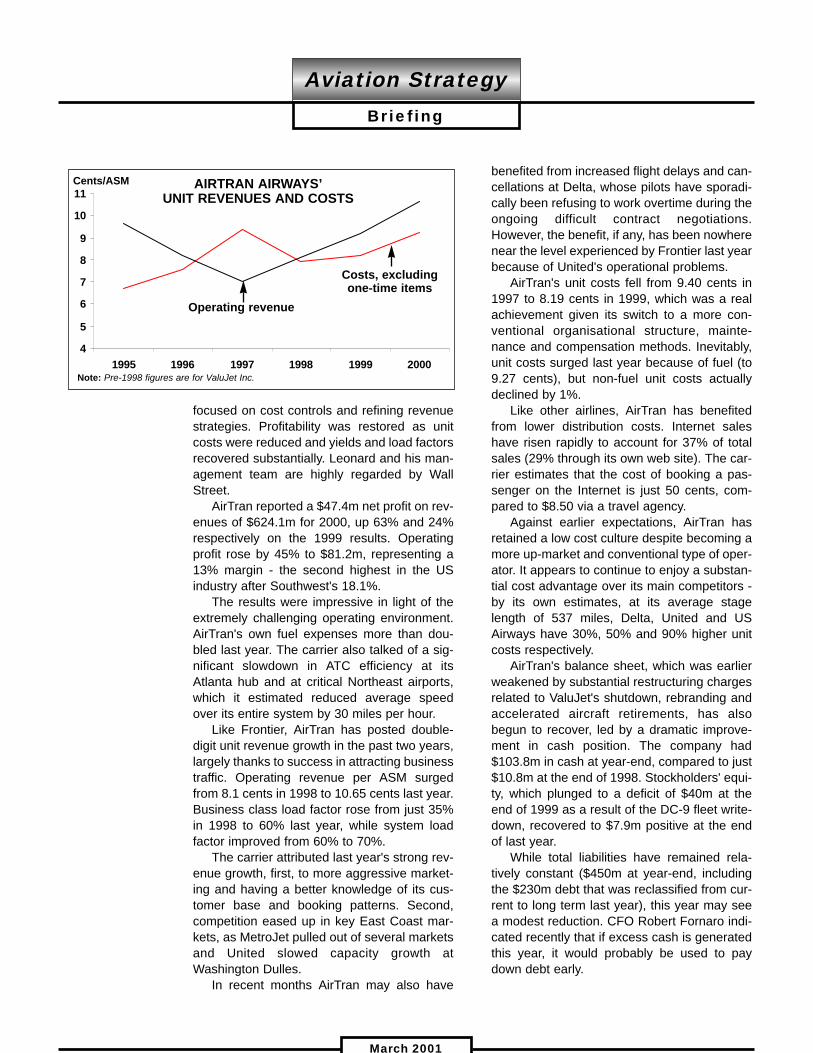
Like Frontier, AirTran has posted double-digit unit revenue growth in the past two years,largely thanks to success in attracting businesstraffic. Operating revenue per ASM surgedfrom 8.1 cents in 1998 to 10.65 cents last year.Business class load factor rose from just 35%in 1998 to 60% last year, while system loadfactor improved from 60% to 70%.
The carrier attributed last year's strong rev-enue growth, first, to more aggressive market-ing and having a better knowledge of its cus-tomer base and booking patterns. Second,competition eased up in key East Coast mar-kets, as MetroJet pulled out of several marketsand United slowed capacity growth atWashington Dulles.
In recent months AirTran may also have
benefited from increased flight delays and can-cellations at Delta, whose pilots have sporadi-cally been refusing to work overtime during theongoing difficult contract negotiations.However, the benefit, if any, has been nowherenear the level experienced by Frontier last yearbecause of United's operational problems.
AirTran's unit costs fell from 9.40 cents in1997 to 8.19 cents in 1999, which was a realachievement given its switch to a more con-ventional organisational structure, mainte-nance and compensation methods. Inevitably,unit costs surged last year because of fuel (to9.27 cents), but non-fuel unit costs actuallydeclined by 1%.
Like other airlines, AirTran has benefitedfrom lower distribution costs. Internet saleshave risen rapidly to account for 37% of totalsales (29% through its own web site). The car-rier estimates that the cost of booking a pas-senger on the Internet is just 50 cents, com-pared to $8.50 via a travel agency.
Against earlier expectations, AirTran hasretained a low cost culture despite becoming amore up-market and conventional type of oper-ator. It appears to continue to enjoy a substan-tial cost advantage over its main competitors -by its own estimates, at its average stagelength of 537 miles, Delta, United and USAirways have 30%, 50% and 90% higher unitcosts respectively.
AirTran's balance sheet, which was earlierweakened by substantial restructuring chargesrelated to ValuJet's shutdown, rebranding andaccelerated aircraft retirements, has alsobegun to recover, led by a dramatic improve-ment in cash position. The company had$103.8m in cash at year-end, compared to just$10.8m at the end of 1998. Stockholders' equi-ty, which plunged to a deficit of $40m at theend of 1999 as a result of the DC-9 fleet write-down, recovered to $7.9m positive at the endof last year.
While total liabilities have remained rela-tively constant ($450m at year-end, includingthe $230m debt that was reclassified from cur-rent to long term last year), this year may seea modest reduction. CFO Robert Fornaro indi-cated recently that if excess cash is generatedthis year, it would probably be used to paydown debt early.
Aviation StrategyBriefing
March 2001
4
5
6
7
8
9
10
11
1995 1996 1997 1998 1999 2000
AIRTRAN AIRWAYS’ UNIT REVENUES AND COSTS
Cents/ASM
Note: Pre-1998 figures are for ValuJet Inc.
Costs, excludingone-time items
Operating revenue
Impact of the Boeing 717AirTran may have paid as little as $20m per
aircraft - and it got a major say in the 717'sdesign specifications. The aircraft, introducedto service in October 1999, is ideally suited toAirTran's short haul, high-frequency EastCoast markets. The airline operates it in 117-seat, two-class configuration, gaining a useful11 extra seats or 8% more capacity over theDC-9.
Moving to a brand new fleet will obviouslyimprove operational reliability and enhanceimage. The average age of AirTran's aircraft isprojected to almost halve in three years, from22 years at the end of 2000 to 12 years at theend of 2003, as the 717s replace the carrier'sDC-9s and 737s.
But, most importantly, the 717 offers amajor reduction in maintenance and fuel costsover the late 1960s and early 1970s-vintageDC-9s. The aircraft has achieved a 24% betterfuel burn over the DC-9, compared to 18%guaranteed by Boeing. It will help AirTranmaintain its unit cost advantage over competi-tors.
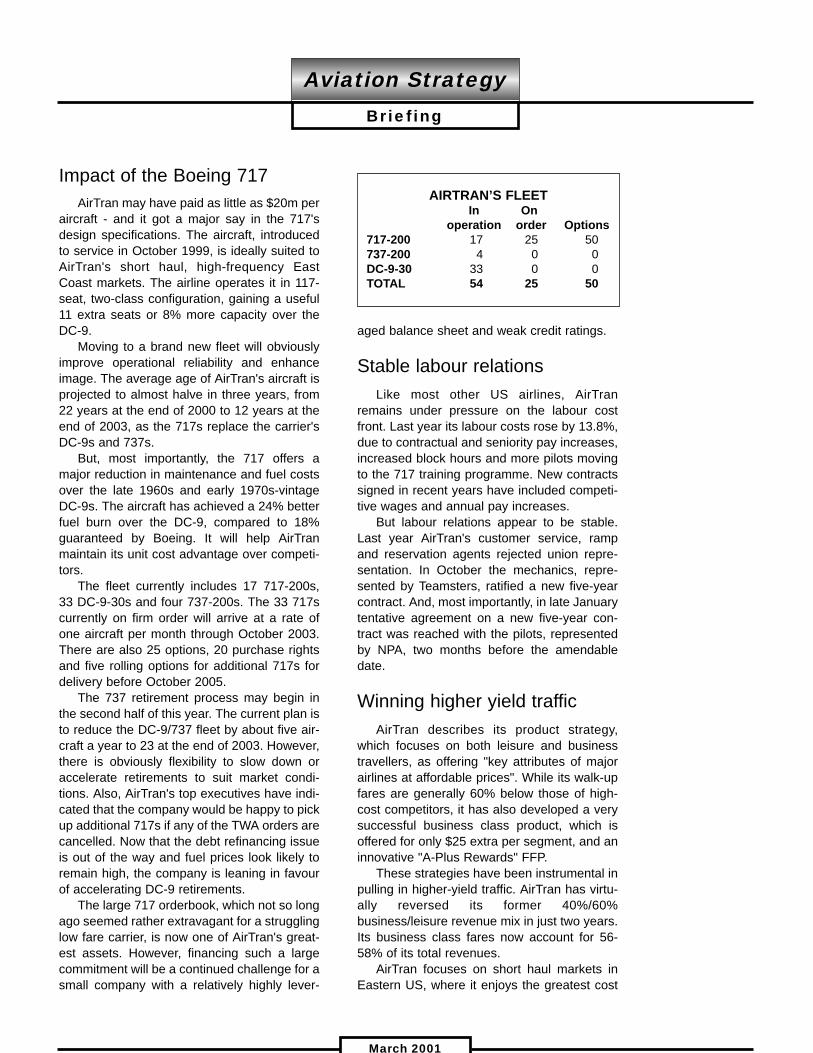
The fleet currently includes 17 717-200s,33 DC-9-30s and four 737-200s. The 33 717scurrently on firm order will arrive at a rate ofone aircraft per month through October 2003.There are also 25 options, 20 purchase rightsand five rolling options for additional 717s fordelivery before October 2005.
The 737 retirement process may begin inthe second half of this year. The current plan isto reduce the DC-9/737 fleet by about five air-craft a year to 23 at the end of 2003. However,there is obviously flexibility to slow down oraccelerate retirements to suit market condi-tions. Also, AirTran's top executives have indi-cated that the company would be happy to pickup additional 717s if any of the TWA orders arecancelled. Now that the debt refinancing issueis out of the way and fuel prices look likely toremain high, the company is leaning in favourof accelerating DC-9 retirements.
The large 717 orderbook, which not so longago seemed rather extravagant for a strugglinglow fare carrier, is now one of AirTran's great-est assets. However, financing such a largecommitment will be a continued challenge for asmall company with a relatively highly lever-
aged balance sheet and weak credit ratings.
Stable labour relationsLike most other US airlines, AirTran
remains under pressure on the labour costfront. Last year its labour costs rose by 13.8%,due to contractual and seniority pay increases,increased block hours and more pilots movingto the 717 training programme. New contractssigned in recent years have included competi-tive wages and annual pay increases.
But labour relations appear to be stable.Last year AirTran's customer service, rampand reservation agents rejected union repre-sentation. In October the mechanics, repre-sented by Teamsters, ratified a new five-yearcontract. And, most importantly, in late Januarytentative agreement on a new five-year con-tract was reached with the pilots, representedby NPA, two months before the amendabledate.
Winning higher yield trafficAirTran describes its product strategy,
which focuses on both leisure and businesstravellers, as offering "key attributes of majorairlines at affordable prices". While its walk-upfares are generally 60% below those of high-cost competitors, it has also developed a verysuccessful business class product, which isoffered for only $25 extra per segment, and aninnovative "A-Plus Rewards" FFP.
These strategies have been instrumental inpulling in higher-yield traffic. AirTran has virtu-ally reversed its former 40%/60%business/leisure revenue mix in just two years.Its business class fares now account for 56-58% of its total revenues.
AirTran focuses on short haul markets inEastern US, where it enjoys the greatest cost
Aviation StrategyBriefing
March 2001
AIRTRAN’S FLEETIn On
operation order Options717-200 17 25 50737-200 4 0 0DC-9-30 33 0 0TOTAL 54 25 50
differential over competitors. The strategy is toserve large primary business centres and devel-op underserved secondary markets, particularlythose that suffer from high fares.
The airline has established a successful hub-bing operation at Hartsfield Atlanta, where it hasa 22-gate single concourse facility and room forgrowth. Atlanta has a large local traffic base andis ideally located for attracting connecting pas-sengers. Traffic growth there has averaged 8-9%annually since the early 1990s, compared to 4%nationally, and is projected to grow by 6% annu-ally over the next few years. Of course, the mar-ket is overwhelmingly dominated by Delta, butAirTran is the second largest carrier with 9%and 12% passenger and departure shares.
Atlanta accounts for 90% of AirTran's pas-senger flows, but in recent years the carrierhas developed point-to-point services else-where in the East. These includeChicago/Midway-Minneapolis, Pittsburgh toChicago and LaGuardia and Philadelphia tothree Florida cities.
While AirTran intends to continue strength-ening its position in Atlanta, it also sees somegreat market opportunities in the Northeast,given "big cities, short distances, high fares". Itappears to have chosen Pittsburgh as a newfocus city and is also keen to grow fromPhiladelphia and LaGuardia. Also, the airlinewould like to have a substantial hub operationat Washington National.
The main problem, of course, is lack of slotsand gates at many of those airports.Consequently, AirTran has taken a very aggres-sive stance in respect of the divestiture of slotsthat is likely to take place if the United-USAirways merger is allowed by the regulators.
In late February the carrier filed formalcomplaints with the DoT about a potentialUnited-American "monopolisation" of theWashington National market. It is asking theDoT to order the reallocation of slots atNational to new-entrant or limited incumbentcarriers, regardless of the outcome of thepending airline mergers. AirTran argues that, ifthe proposed deals go through, United andAmerican would control 66% and 80% of theNational and Dulles markets respectively.
It is possible that the DoT may not want tocomplicate the already extremely complex regu-
latory issues associated with a major airlinemerger scenario with new-entrant issues.AirTran is certainly not counting on it for growthopportunities.Prospects
After two years of marginal growth and con-solidation, AirTran has entered a new growthphase. Its ASMs are projected to increase byabout 20% both this year and in 2002. But thefavourable unit revenue trend is expected tocontinue, as more 717s are added and a newrevenue management system, introduced inDecember, kicks in fully.
AirTran expects its non-fuel unit costs to goup by 2-4% in 2001, mainly due to contractualwage increases, automation expenses and air-craft rents. While the growth of the 717 fleetwill have a favourable impact on fuel and main-tenance costs, analysts believe that those sav-ings will be offset by considerably higher own-ership costs (rental expenses).
The carrier has budgeted for fuel at around$1 per gallon, net of fuel hedge benefits. It hashedged 50% of its first-quarter needs at $29per barrel and 30% of its needs in the remain-der of the year at $24.
The current consensus forecast is a profitof 97 cents per share for 2001, which wouldrepresent a 35% increase, and a profit of $1.27per share for 2002 (including the dilutiveimpact of the Boeing transaction).
Now that the debt repayment risk has beeneliminated, the main risk factor mentioned byanalysts is AirTran's presence in the congest-ed and fiercely competitive East Coast market.However, the carrier is expected to retain itscost advantage and may even face a reducedthreat from its number one competitor, Delta.
Atlanta-based James Parker, analyst withRaymond James, believes that AirTran cancontinue to profitably coexist with Delta, first,because its costs are so much lower. Second,it will probably expand capacity only modestlyabove market growth in Atlanta so as not tothreaten Delta. Third, there is now greaterscrutiny by the regulators regarding predatorypractices. Fourth, business travellers areresisting the high and rising fares of the majorcarriers. This will even more be the case if theeconomy slows further.
Aviation StrategyBriefing
March 2001
By HeiniNuutinen
Who is responsible for revenue?
Revenue on a plane is influenced bymany different functions: network plan-
ning, which sets the schedule and assignsthe fleet type; the salesforce at each end ofthe route and in all the feeder markets,which negotiates contracts and launch pro-motions; the pricing function, which definesand monitors fares and restrictions; andfinally revenue management, which controlscapacity by allocating the right number ofseats to each fare in each market for everyflight every day.
If we look at how these functions havedeveloped at major airlines over the lastdecade, they all have generally becomehighly sophisticated:• Network planning has access to detaileddata on origin/destination (O/D) and marketshare, receives timely and accurate routeprofitability reports, has network profitabilitytools that can simulate and assess differentnetwork scenarios, and has intelligent toolsthat enable the most profitable assignmentof fleet types. • Revenue management has been continu-ously improving forecasting techniques, andnow uses advanced segmentation tech-niques, and has access to high-performanceIT systems allowing the control of space atnetwork level.• Pricing can monitor competitors' prices ina timely way, and can simulate the impact ofpricing decisions (own and competitors') andpromotion campaigns.• Marketing and Sales have detailed mar-ket share data for each O/D for every pointof sale, possess timely and detailedadvanced booking information, use segmen-tation to tailor performance-oriented con-tracts, and have a real multi-channel distrib-ution network in place.
All this sounds great and it does repre-sent a real advance. However, it seems thatthe price for this very high level of speciali-sation is that these functions tend to work as"silos" and that cross-functional manage-
ment has lost ground. It is not uncommon tohear people from one functional departmentblaming other functions for lack of perfor-mance or for lack of understanding of "howthings work".
Nor is easy for a CEO to point to one spe-cific person if revenue performance is belowexpectations, as so many people and func-tions influence it. If more revenue is needed,most people will look only to Marketing andSales, not recognising that this is a cross-functional challenge. And Marketing andSales will typically react by using pricing andpromotions in a quite undifferentiated way.
Managing andmeasuring revenue
So how can we manage revenue perfor-mance better? The first step is to be able tomeasure revenue performance.
Airlines typically use two basic tools tomeasure revenue performance:• Route profitability reports Althoughthese help to show where money is made orlost in a network, they do not provide anyparticular insight into revenue performance -defined as the impact of all operationallevers that can influence revenue. Thus, oneroute could be highly unprofitable eventhough its revenue performance is excellent.And such reports give no information what-soever on the revenue improvement poten-tial of a route.· Revenue index This is the typical incre-mental approach, where target revenueindexes are set on the basis of previousyears' revenues. Most airline salesforces aremeasured and rewarded on achieving orbeating the index. However, even if produc-tion increases and other factors are takeninto account, an index will not say anythingabout absolute revenue performance andwill not give any insight on possible perfor-mance gaps.
If new insights on revenue performance
Aviation StrategyManagement
March 2001
are to be gained, new metrics and process-es are needed. Especially in a network envi-ronment, with a high share of connectingpassengers, it becomes difficult to isolateparts of the network and find out whetherthey are doing well and, if not, what are theimprovement levers.
A possible approach is to define new per-formance metrics that would make routes ormarkets comparable with each other - aninternal benchmarking process. The differ-ent nature of competition in non-stop andconnecting markets (markets are defined asO/D flows), means that two different metricsare needed:• Non-stop markets Revenue per ASK isthe most appropriate performance indicator,as it reflects both yields and load factors.However, to make different markets compa-rable, two corrections need to be made. In anetwork environment, a significant share ofthe capacity on a route is "reserved" for con-necting passengers, so that the "real" capac-ities (or "real" ASK) are smaller. Secondly,yields decrease with increasing stagelength, an effect that can be filtered out witha regression curve.• Connecting markets Yield-adjusted trafficshare of accessible market is one possibleperformance indicator. The accessible mar-ket is defined as the total O/D traffic minusthe traffic flying non-stop. This might seemquite conservative, but reflects the fact thatpassengers flying non-stop can be divertedto a hub only by offering a substantial dis-count (if at all).There is no "capacity" element in the metric,as there is no meaningful definition of capac-ity for connecting passengers. This casealso needs two corrections. Yield deviationfrom the average yield should be used tocorrect the performance metric, so that thequality of the revenue is captured (as it isquite easy to "buy" market share in connect-ing markets). Secondly, here too, yieldsshould be adjusted for different stagelengths.
These metrics can be constructed bycombining data sources that are normallyused in isolation, such as OAG scheduledata, MIDT and revenue/traffic/yield infor-mation.
How to compare revenueperformance across markets
Assuming that the performance metricshave been calculated for the most importantO/D markets, the next question is how thesedata should be used to identify revenue-enhancing actions. The first step is to com-pare markets that are in fact comparable -comparing strong markets with other strongmarkets, and weak markets with other weakmarkets. There are two main ways of seg-menting the markets - by type of link, and bythe "richness " of the traffic flow: • Type of link This reflects the structuralcompetitive position in serving a specific O/Dmarket. Possible segments are hub-to-hub,hub-to-strong spoke, hub-to-weak spoke,hub-to-competitor's hub, spoke-to-spoke,and spoke-to-competitor's hub. The slotposition or the overall market share in a spe-cific city will determine whether a spoke isstrong or weak.• "Richness" of the traffic flow: It is easierto achieve better yields in markets which bytheir nature have a high share of premiumpassengers, i.e. less price-sensitive busi-ness travellers.
Apart from these two factors, any otherdifference in revenue performance can onlybe executional, i.e. something that can beimproved by managerial decisions to act onone or several revenue drivers (pricing,schedule, capacity, etc.). In other words,comparing revenue performance and its dri-vers between comparable markets canreveal the reasons for any difference in per-formance, which can then be acted upon.The beauty of this approach is that quantita-tive targets can be set for each market.
How to manage revenuecross-functionally
To move from the traditional approach toa cross-functional means that key execu-tives must adopt a new mindset on manag-ing revenue performance. Instead of a mar-keting and sales-driven approach, they mustadopt an O/D performance improvementapproach. This requires a shift in focus:• From local markets and accounts to the
Aviation StrategyManagement
March 2001
best balance between local markets• From pure sales/pricing levers to a broad-er range of revenue-enhancing actions• From incremental performance (the "index"approach) to the idea of absolute achievableperformance (given the structural condi-tions).
In other words, it is necessary to take amore differentiated approach to increasingrevenue performance, rather than pushingsales everywhere with the same intensityand methods. The full spectrum of actionsshould be considered, using the O/D perfor-mance metrics and their drivers as a plat-form for discussion, and to cut across organ-isational and functional boundaries.
Four-step processA four-step process to manage revenue
performance on an ongoing basis might looklike this:1. Identify and segment key markets Thisis a one-off effort to select the markets to beincluded, and to define the performancemetrics and the segmentation method (asdescribed above).2. Analyse performance drivers At givenintervals the performance metrics and theirdrivers are calculated and made available tocross-functional teams for a detailed analy-sis. It is important not to stop at the perfor-mance metric level, which is the benchmark,but to gain transparency on the different dri-vers as well (e.g., adjusted load factors,adjusted yields, traffic shares, shares of pre-mium passenger traffic, frequency shares,shares of traffic sold in hub, etc.) and to lookat the performance of every single flight
serving a specific O/D market. This way,some potential issues can be identified, likeweak flights within one route, directionalimbalances in traffic or capacity, directionalimbalances in yield, the effect of seasonalityon load factors and yields, spill effects, etc.3. Diagnose and set targets The analysisenables the cross-functional teams to identi-fy best performance through internal, or ifpossible external, benchmarking. Then thekey drivers of the performance gap can beidentified and targets set for each underper-forming market.4. Develop market-specific revenueenhancement measures In this stepactions are developed by brainstorming, for-mulating hypotheses on improvementlevers, doing the appropriate validations andfinally defining an action plan with all mea-sures and responsibilities. Obviously, someactions will have to be traded off againsteach other - for example, price changes in alocal market might trigger changes in thecapacity allocated by the revenue manage-ment system, improving a specific high-potential connection might negatively affectother connections, etc. This is where func-tional expertise and IT tools can help makethe best trade-offs, once that the full pictureis clear.
This market-by-market cross-functionalprocess for revenue performance manage-ment is not a substitute for functional excel-lence, but rather a way to complement it. Itcan contribute significantly to improving prof-itability, especially if an airline operates alarge network with many markets served andsignificant connecting traffic.
Aviation StrategyManagement
March 2001
By Lucio Pompeo,Associate Principal.McKinsey & Co., Inc.
AIRCRAFT AND ASSET VALUATIONS
Contact Paul Leighton at AVAC (Aircraft Value Analysis Company)
Email: [email protected]: +44 (0) 20 7477 6563
Aviation StrategyMacro-trends
March 2001
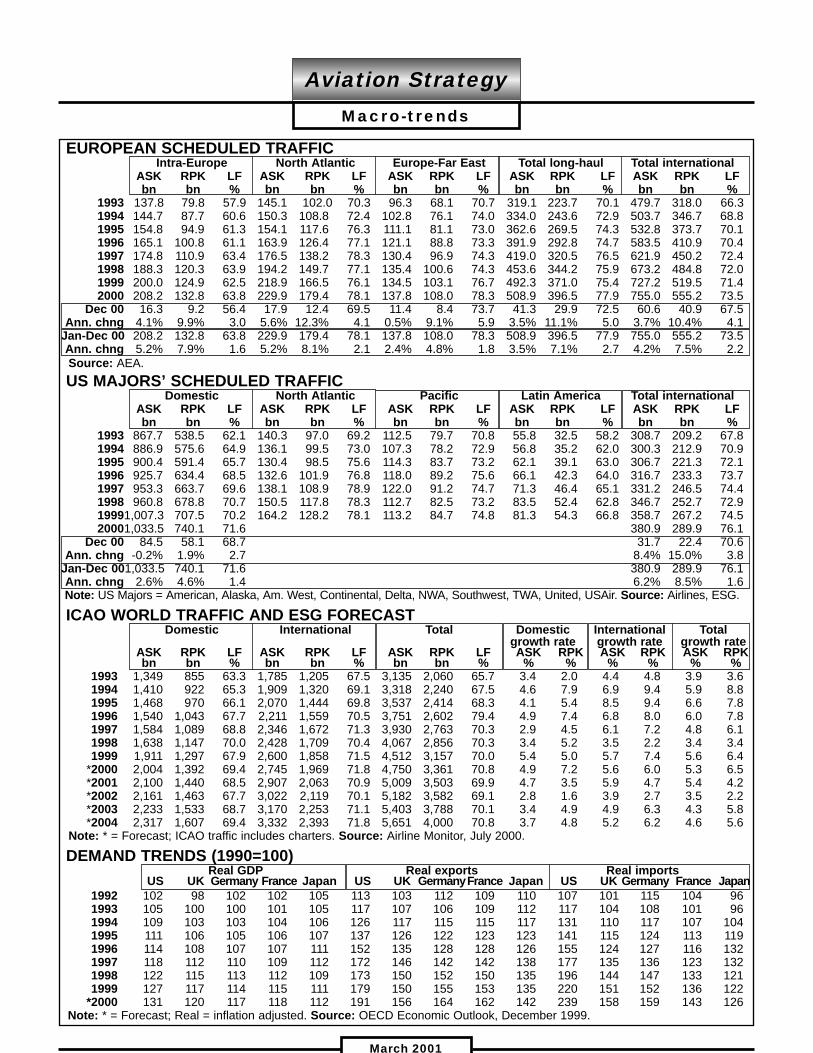
EUROPEAN SCHEDULED TRAFFICIntra-Europe North Atlantic Europe-Far East Total long-haul Total international
ASK RPK LF ASK RPK LF ASK RPK LF ASK RPK LF ASK RPK LFbn bn % bn bn % bn bn % bn bn % bn bn %
1993 137.8 79.8 57.9 145.1 102.0 70.3 96.3 68.1 70.7 319.1 223.7 70.1 479.7 318.0 66.31994 144.7 87.7 60.6 150.3 108.8 72.4 102.8 76.1 74.0 334.0 243.6 72.9 503.7 346.7 68.81995 154.8 94.9 61.3 154.1 117.6 76.3 111.1 81.1 73.0 362.6 269.5 74.3 532.8 373.7 70.11996 165.1 100.8 61.1 163.9 126.4 77.1 121.1 88.8 73.3 391.9 292.8 74.7 583.5 410.9 70.41997 174.8 110.9 63.4 176.5 138.2 78.3 130.4 96.9 74.3 419.0 320.5 76.5 621.9 450.2 72.41998 188.3 120.3 63.9 194.2 149.7 77.1 135.4 100.6 74.3 453.6 344.2 75.9 673.2 484.8 72.01999 200.0 124.9 62.5 218.9 166.5 76.1 134.5 103.1 76.7 492.3 371.0 75.4 727.2 519.5 71.42000 208.2 132.8 63.8 229.9 179.4 78.1 137.8 108.0 78.3 508.9 396.5 77.9 755.0 555.2 73.5
Dec 00 16.3 9.2 56.4 17.9 12.4 69.5 11.4 8.4 73.7 41.3 29.9 72.5 60.6 40.9 67.5Ann. chng 4.1% 9.9% 3.0 5.6% 12.3% 4.1 0.5% 9.1% 5.9 3.5% 11.1% 5.0 3.7% 10.4% 4.1
Jan-Dec 00 208.2 132.8 63.8 229.9 179.4 78.1 137.8 108.0 78.3 508.9 396.5 77.9 755.0 555.2 73.5Ann. chng 5.2% 7.9% 1.6 5.2% 8.1% 2.1 2.4% 4.8% 1.8 3.5% 7.1% 2.7 4.2% 7.5% 2.2Source: AEA.US MAJORS’ SCHEDULED TRAFFIC
Domestic North Atlantic Pacific Latin America Total internationalASK RPK LF ASK RPK LF ASK RPK LF ASK RPK LF ASK RPK LFbn bn % bn bn % bn bn % bn bn % bn bn %
1993 867.7 538.5 62.1 140.3 97.0 69.2 112.5 79.7 70.8 55.8 32.5 58.2 308.7 209.2 67.81994 886.9 575.6 64.9 136.1 99.5 73.0 107.3 78.2 72.9 56.8 35.2 62.0 300.3 212.9 70.91995 900.4 591.4 65.7 130.4 98.5 75.6 114.3 83.7 73.2 62.1 39.1 63.0 306.7 221.3 72.11996 925.7 634.4 68.5 132.6 101.9 76.8 118.0 89.2 75.6 66.1 42.3 64.0 316.7 233.3 73.71997 953.3 663.7 69.6 138.1 108.9 78.9 122.0 91.2 74.7 71.3 46.4 65.1 331.2 246.5 74.41998 960.8 678.8 70.7 150.5 117.8 78.3 112.7 82.5 73.2 83.5 52.4 62.8 346.7 252.7 72.919991,007.3 707.5 70.2 164.2 128.2 78.1 113.2 84.7 74.8 81.3 54.3 66.8 358.7 267.2 74.520001,033.5 740.1 71.6 380.9 289.9 76.1
Dec 00 84.5 58.1 68.7 31.7 22.4 70.6Ann. chng -0.2% 1.9% 2.7 8.4% 15.0% 3.8
Jan-Dec 001,033.5 740.1 71.6 380.9 289.9 76.1Ann. chng 2.6% 4.6% 1.4 6.2% 8.5% 1.6Note: US Majors = American, Alaska, Am. West, Continental, Delta, NWA, Southwest, TWA, United, USAir. Source: Airlines, ESG.
ICAO WORLD TRAFFIC AND ESG FORECASTDomestic International Total Domestic International Total
growth rate growth rate growth rateASK RPK LF ASK RPK LF ASK RPK LF ASK RPK ASK RPK ASK RPKbn bn % bn bn % bn bn % % % % % % %
1993 1,349 855 63.3 1,785 1,205 67.5 3,135 2,060 65.7 3.4 2.0 4.4 4.8 3.9 3.61994 1,410 922 65.3 1,909 1,320 69.1 3,318 2,240 67.5 4.6 7.9 6.9 9.4 5.9 8.81995 1,468 970 66.1 2,070 1,444 69.8 3,537 2,414 68.3 4.1 5.4 8.5 9.4 6.6 7.81996 1,540 1,043 67.7 2,211 1,559 70.5 3,751 2,602 79.4 4.9 7.4 6.8 8.0 6.0 7.81997 1,584 1,089 68.8 2,346 1,672 71.3 3,930 2,763 70.3 2.9 4.5 6.1 7.2 4.8 6.11998 1,638 1,147 70.0 2,428 1,709 70.4 4,067 2,856 70.3 3.4 5.2 3.5 2.2 3.4 3.41999 1,911 1,297 67.9 2,600 1,858 71.5 4,512 3,157 70.0 5.4 5.0 5.7 7.4 5.6 6.4
*2000 2,004 1,392 69.4 2,745 1,969 71.8 4,750 3,361 70.8 4.9 7.2 5.6 6.0 5.3 6.5*2001 2,100 1,440 68.5 2,907 2,063 70.9 5,009 3,503 69.9 4.7 3.5 5.9 4.7 5.4 4.2*2002 2,161 1,463 67.7 3,022 2,119 70.1 5,182 3,582 69.1 2.8 1.6 3.9 2.7 3.5 2.2*2003 2,233 1,533 68.7 3,170 2,253 71.1 5,403 3,788 70.1 3.4 4.9 4.9 6.3 4.3 5.8*2004 2,317 1,607 69.4 3,332 2,393 71.8 5,651 4,000 70.8 3.7 4.8 5.2 6.2 4.6 5.6
Note: * = Forecast; ICAO traffic includes charters. Source: Airline Monitor, July 2000.
DEMAND TRENDS (1990=100)Real GDP Real exports Real imports
US UK Germany France Japan US UK GermanyFrance Japan US UK Germany France Japan1992 102 98 102 102 105 113 103 112 109 110 107 101 115 104 961993 105 100 100 101 105 117 107 106 109 112 117 104 108 101 961994 109 103 103 104 106 126 117 115 115 117 131 110 117 107 1041995 111 106 105 106 107 137 126 122 123 123 141 115 124 113 1191996 114 108 107 107 111 152 135 128 128 126 155 124 127 116 1321997 118 112 110 109 112 172 146 142 142 138 177 135 136 123 1321998 122 115 113 112 109 173 150 152 150 135 196 144 147 133 1211999 127 117 114 115 111 179 150 155 153 135 220 151 152 136 122
*2000 131 120 117 118 112 191 156 164 162 142 239 158 159 143 126Note: * = Forecast; Real = inflation adjusted. Source: OECD Economic Outlook, December 1999.
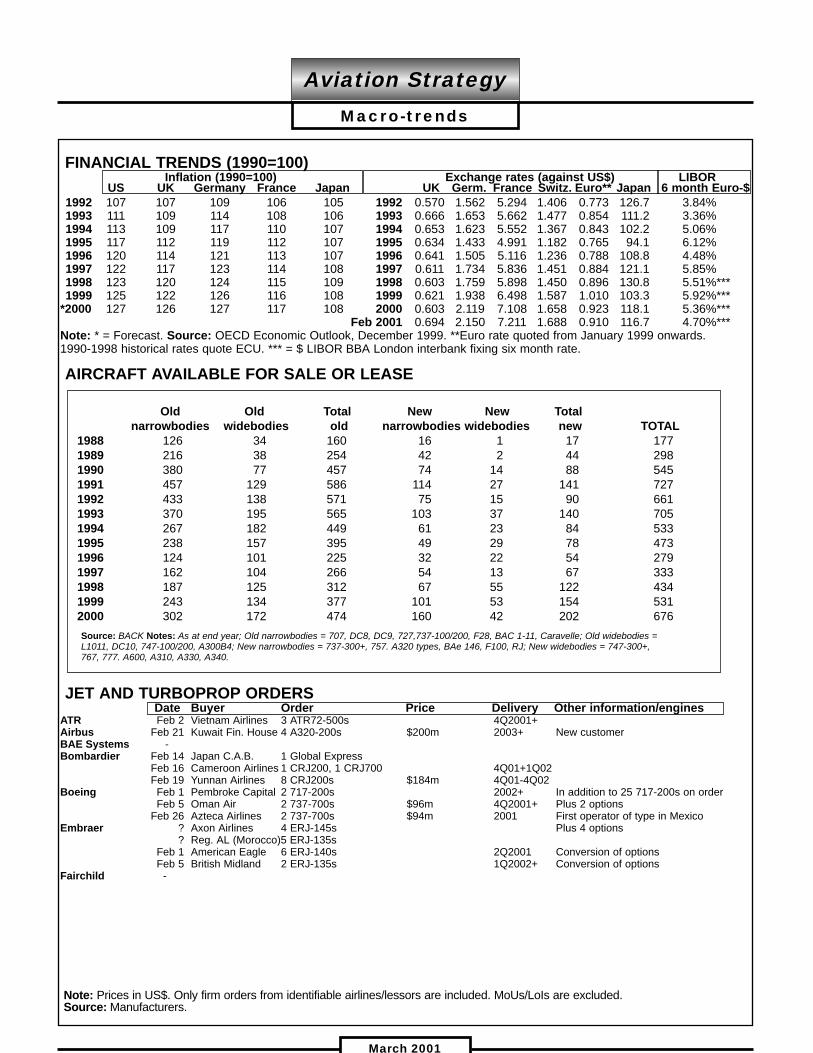
FINANCIAL TRENDS (1990=100)Inflation (1990=100) Exchange rates (against US$) LIBOR
US UK Germany France Japan UK Germ. France Switz. Euro** Japan 6 month Euro-$1992 107 107 109 106 105 1992 0.570 1.562 5.294 1.406 0.773 126.7 3.84%1993 111 109 114 108 106 1993 0.666 1.653 5.662 1.477 0.854 111.2 3.36%1994 113 109 117 110 107 1994 0.653 1.623 5.552 1.367 0.843 102.2 5.06%1995 117 112 119 112 107 1995 0.634 1.433 4.991 1.182 0.765 94.1 6.12%1996 120 114 121 113 107 1996 0.641 1.505 5.116 1.236 0.788 108.8 4.48%1997 122 117 123 114 108 1997 0.611 1.734 5.836 1.451 0.884 121.1 5.85%1998 123 120 124 115 109 1998 0.603 1.759 5.898 1.450 0.896 130.8 5.51%***1999 125 122 126 116 108 1999 0.621 1.938 6.498 1.587 1.010 103.3 5.92%***
*2000 127 126 127 117 108 2000 0.603 2.119 7.108 1.658 0.923 118.1 5.36%***Feb 2001 0.694 2.150 7.211 1.688 0.910 116.7 4.70%***
Note: * = Forecast. Source: OECD Economic Outlook, December 1999. **Euro rate quoted from January 1999 onwards.1990-1998 historical rates quote ECU. *** = $ LIBOR BBA London interbank fixing six month rate.
AIRCRAFT AVAILABLE FOR SALE OR LEASE
JET AND TURBOPROP ORDERSDate Buyer Order Price Delivery Other information/engines
ATR Feb 2 Vietnam Airlines 3 ATR72-500s 4Q2001+Airbus Feb 21 Kuwait Fin. House 4 A320-200s $200m 2003+ New customerBAE Systems -Bombardier Feb 14 Japan C.A.B. 1 Global Express
Feb 16 Cameroon Airlines 1 CRJ200, 1 CRJ700 4Q01+1Q02Feb 19 Yunnan Airlines 8 CRJ200s $184m 4Q01-4Q02
Boeing Feb 1 Pembroke Capital 2 717-200s 2002+ In addition to 25 717-200s on orderFeb 5 Oman Air 2 737-700s $96m 4Q2001+ Plus 2 options
Feb 26 Azteca Airlines 2 737-700s $94m 2001 First operator of type in Mexico Embraer ? Axon Airlines 4 ERJ-145s Plus 4 options
? Reg. AL (Morocco)5 ERJ-135sFeb 1 American Eagle 6 ERJ-140s 2Q2001 Conversion of optionsFeb 5 British Midland 2 ERJ-135s 1Q2002+ Conversion of options
Fairchild -
Note: Prices in US$. Only firm orders from identifiable airlines/lessors are included. MoUs/LoIs are excluded.Source: Manufacturers.
Aviation StrategyMacro-trends
March 2001
Old Old Total New New Total narrowbodies widebodies old narrowbodies widebodies new TOTAL
1988 126 34 160 16 1 17 1771989 216 38 254 42 2 44 2981990 380 77 457 74 14 88 5451991 457 129 586 114 27 141 7271992 433 138 571 75 15 90 6611993 370 195 565 103 37 140 7051994 267 182 449 61 23 84 5331995 238 157 395 49 29 78 4731996 124 101 225 32 22 54 2791997 162 104 266 54 13 67 3331998 187 125 312 67 55 122 4341999 243 134 377 101 53 154 5312000 302 172 474 160 42 202 676Source: BACK Notes: As at end year; Old narrowbodies = 707, DC8, DC9, 727,737-100/200, F28, BAC 1-11, Caravelle; Old widebodies =L1011, DC10, 747-100/200, A300B4; New narrowbodies = 737-300+, 757. A320 types, BAe 146, F100, RJ; New widebodies = 747-300+,767, 777. A600, A310, A330, A340.
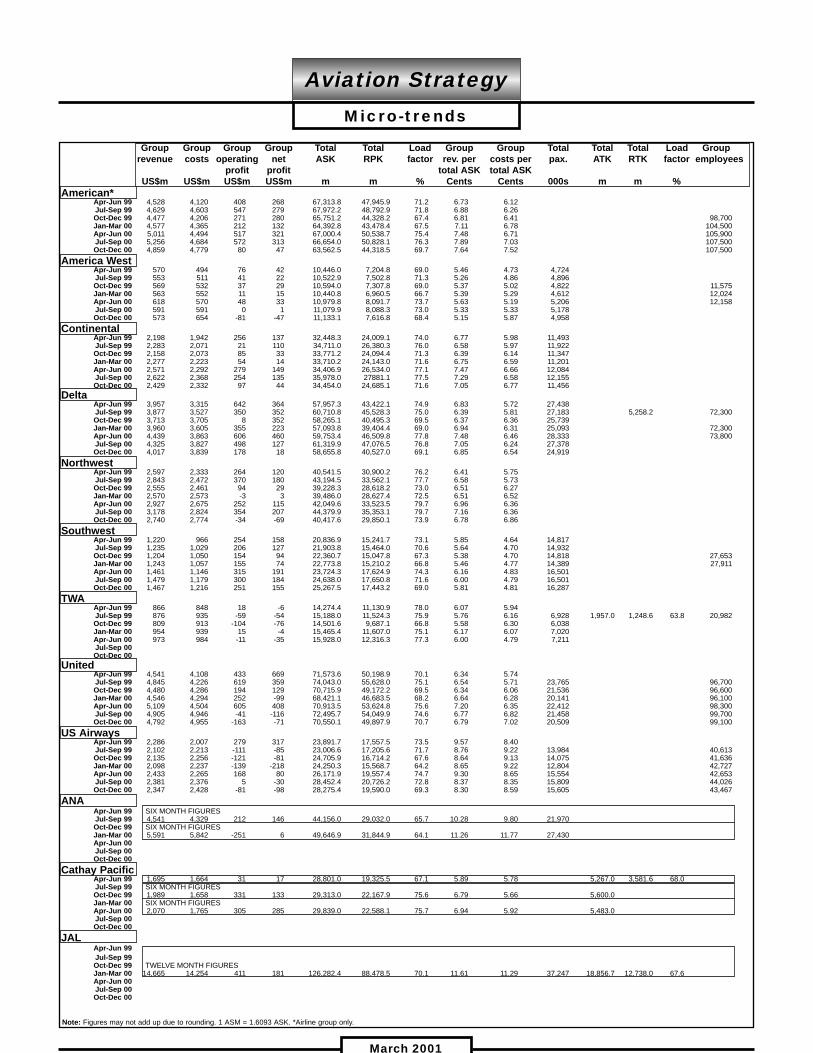
Group Group Group Group Total Total Load Group Group Total Total Total Load Grouprevenue costs operating net ASK RPK factor rev. per costs per pax. ATK RTK factor employees
profit profit total ASK total ASKUS$m US$m US$m US$m m m % Cents Cents 000s m m %
American*Apr-Jun 99 4,528 4,120 408 268 67,313.8 47,945.9 71.2 6.73 6.12Jul-Sep 99 4,629 4,603 547 279 67,972.2 48,792.9 71.8 6.88 6.26Oct-Dec 99 4,477 4,206 271 280 65,751.2 44,328.2 67.4 6.81 6.41 98,700Jan-Mar 00 4,577 4,365 212 132 64,392.8 43,478.4 67.5 7.11 6.78 104,500Apr-Jun 00 5,011 4,494 517 321 67,000.4 50,538.7 75.4 7.48 6.71 105,900Jul-Sep 00 5,256 4,684 572 313 66,654.0 50,828.1 76.3 7.89 7.03 107,500Oct-Dec 00 4,859 4,779 80 47 63,562.5 44,318.5 69.7 7.64 7.52 107,500
America WestApr-Jun 99 570 494 76 42 10,446.0 7,204.8 69.0 5.46 4.73 4,724Jul-Sep 99 553 511 41 22 10,522.9 7,502.8 71.3 5.26 4.86 4,896Oct-Dec 99 569 532 37 29 10,594.0 7,307.8 69.0 5.37 5.02 4,822 11,575Jan-Mar 00 563 552 11 15 10,440.8 6,960.5 66.7 5.39 5.29 4,612 12,024Apr-Jun 00 618 570 48 33 10,979.8 8,091.7 73.7 5.63 5.19 5,206 12,158Jul-Sep 00 591 591 0 1 11,079.9 8,088.3 73.0 5.33 5.33 5,178Oct-Dec 00 573 654 -81 -47 11,133.1 7,616.8 68.4 5.15 5.87 4,958
ContinentalApr-Jun 99 2,198 1,942 256 137 32,448.3 24,009.1 74.0 6.77 5.98 11,493Jul-Sep 99 2,283 2,071 21 110 34,711.0 26,380.3 76.0 6.58 5.97 11,922Oct-Dec 99 2,158 2,073 85 33 33,771.2 24,094.4 71.3 6.39 6.14 11,347Jan-Mar 00 2,277 2,223 54 14 33,710.2 24,143.0 71.6 6.75 6.59 11,201Apr-Jun 00 2,571 2,292 279 149 34,406.9 26,534.0 77.1 7.47 6.66 12,084Jul-Sep 00 2,622 2,368 254 135 35,978.0 27881.1 77.5 7.29 6.58 12,155Oct-Dec 00 2,429 2,332 97 44 34,454.0 24,685.1 71.6 7.05 6.77 11,456
DeltaApr-Jun 99 3,957 3,315 642 364 57,957.3 43,422.1 74.9 6.83 5.72 27,438Jul-Sep 99 3,877 3,527 350 352 60,710.8 45,528.3 75.0 6.39 5.81 27,183 5,258.2 72,300Oct-Dec 99 3,713 3,705 8 352 58,265.1 40,495.3 69.5 6.37 6.36 25,739Jan-Mar 00 3,960 3,605 355 223 57,093.8 39,404.4 69.0 6.94 6.31 25,093 72,300Apr-Jun 00 4,439 3,863 606 460 59,753.4 46,509.8 77.8 7.48 6.46 28,333 73,800Jul-Sep 00 4,325 3,827 498 127 61,319.9 47,076.5 76.8 7.05 6.24 27,378Oct-Dec 00 4,017 3,839 178 18 58,655.8 40,527.0 69.1 6.85 6.54 24,919
NorthwestApr-Jun 99 2,597 2,333 264 120 40,541.5 30,900.2 76.2 6.41 5.75Jul-Sep 99 2,843 2,472 370 180 43,194.5 33,562.1 77.7 6.58 5.73Oct-Dec 99 2,555 2,461 94 29 39,228.3 28,618.2 73.0 6.51 6.27Jan-Mar 00 2,570 2,573 -3 3 39,486.0 28,627.4 72.5 6.51 6.52Apr-Jun 00 2,927 2,675 252 115 42,049.6 33,523.5 79.7 6.96 6.36Jul-Sep 00 3,178 2,824 354 207 44,379.9 35,353.1 79.7 7.16 6.36Oct-Dec 00 2,740 2,774 -34 -69 40,417.6 29,850.1 73.9 6.78 6.86
SouthwestApr-Jun 99 1,220 966 254 158 20,836.9 15,241.7 73.1 5.85 4.64 14,817Jul-Sep 99 1,235 1,029 206 127 21,903.8 15,464.0 70.6 5.64 4.70 14,932Oct-Dec 99 1,204 1,050 154 94 22,360.7 15,047.8 67.3 5.38 4.70 14,818 27,653Jan-Mar 00 1,243 1,057 155 74 22,773.8 15,210.2 66.8 5.46 4.77 14,389 27,911Apr-Jun 00 1,461 1,146 315 191 23,724.3 17,624.9 74.3 6.16 4.83 16,501Jul-Sep 00 1,479 1,179 300 184 24,638.0 17,650.8 71.6 6.00 4.79 16,501Oct-Dec 00 1,467 1,216 251 155 25,267.5 17,443.2 69.0 5.81 4.81 16,287
TWAApr-Jun 99 866 848 18 -6 14,274.4 11,130.9 78.0 6.07 5.94Jul-Sep 99 876 935 -59 -54 15,188.0 11,524.3 75.9 5.76 6.16 6,928 1,957.0 1,248.6 63.8 20,982Oct-Dec 99 809 913 -104 -76 14,501.6 9,687.1 66.8 5.58 6.30 6,038Jan-Mar 00 954 939 15 -4 15,465.4 11,607.0 75.1 6.17 6.07 7,020Apr-Jun 00 973 984 -11 -35 15,928.0 12,316.3 77.3 6.00 4.79 7,211Jul-Sep 00Oct-Dec 00
UnitedApr-Jun 99 4,541 4,108 433 669 71,573.6 50,198.9 70.1 6.34 5.74Jul-Sep 99 4,845 4,226 619 359 74,043.0 55,628.0 75.1 6.54 5.71 23,765 96,700Oct-Dec 99 4,480 4,286 194 129 70,715.9 49,172.2 69.5 6.34 6.06 21,536 96,600Jan-Mar 00 4,546 4,294 252 -99 68,421.1 46,683.5 68.2 6.64 6.28 20,141 96,100Apr-Jun 00 5,109 4,504 605 408 70,913.5 53,624.8 75.6 7.20 6.35 22,412 98,300Jul-Sep 00 4,905 4,946 -41 -116 72,495.7 54,049.9 74.6 6.77 6.82 21,458 99,700Oct-Dec 00 4,792 4,955 -163 -71 70,550.1 49,897.9 70.7 6.79 7.02 20,509 99,100
US AirwaysApr-Jun 99 2,286 2,007 279 317 23,891.7 17,557.5 73.5 9.57 8.40Jul-Sep 99 2,102 2,213 -111 -85 23,006.6 17,205.6 71.7 8.76 9.22 13,984 40,613Oct-Dec 99 2,135 2,256 -121 -81 24,705.9 16,714.2 67.6 8.64 9.13 14,075 41,636Jan-Mar 00 2,098 2,237 -139 -218 24,250.3 15,568.7 64.2 8.65 9.22 12,804 42,727Apr-Jun 00 2,433 2,265 168 80 26,171.9 19,557.4 74.7 9.30 8.65 15,554 42,653Jul-Sep 00 2,381 2,376 5 -30 28,452.4 20,726.2 72.8 8.37 8.35 15,809 44,026Oct-Dec 00 2,347 2,428 -81 -98 28,275.4 19,590.0 69.3 8.30 8.59 15,605 43,467
ANAApr-Jun 99 SIX MONTH FIGURESJul-Sep 99 4,541 4,329 212 146 44,156.0 29,032.0 65.7 10.28 9.80 21,970Oct-Dec 99 SIX MONTH FIGURESJan-Mar 00 5,591 5,842 -251 6 49,646.9 31,844.9 64.1 11.26 11.77 27,430Apr-Jun 00Jul-Sep 00Oct-Dec 00
Cathay PacificApr-Jun 99 1,695 1,664 31 17 28,801.0 19,325.5 67.1 5.89 5.78 5,267.0 3,581.6 68.0Jul-Sep 99 SIX MONTH FIGURESOct-Dec 99 1,989 1,658 331 133 29,313.0 22,167.9 75.6 6.79 5.66 5,600.0Jan-Mar 00 SIX MONTH FIGURESApr-Jun 00 2,070 1,765 305 285 29,839.0 22,588.1 75.7 6.94 5.92 5,483.0Jul-Sep 00Oct-Dec 00
JALApr-Jun 99Jul-Sep 99Oct-Dec 99 TWELVE MONTH FIGURESJan-Mar 00 14,665 14,254 411 181 126,282.4 88,478.5 70.1 11.61 11.29 37,247 18,856.7 12,738.0 67.6Apr-Jun 00Jul-Sep 00Oct-Dec 00
Aviation StrategyMicro-trends
March 2001
Note: Figures may not add up due to rounding. 1 ASM = 1.6093 ASK. *Airline group only.

Group Group Group Group Total Total Load Group Group Total Total Total Load Grouprevenue costs operating net profit ASK RPK factor rev. per costs per pax. ATK RTK factor employees
profit total ASK total ASKUS$m US$m US$m US$m m m % Cents Cents 000s m m %
Korean AirApr-Jun 99Jul-Sep 99 TWELVE MONTH FIGURESOct-Dec 99 4,340 4,177 163 232 49,516.0 36,693.0 74.0 8.76 8.44 20,564 7,827 5,995 78.2Jan-Mar 00Apr-Jun 00Jul-Sep 00Oct-Dec 00
MalaysianApr-Jun 99Jul-Sep 99Oct-Dec 99 TWELVE MONTH FIGURESJan-Mar 00 2,148 1,652 496 -67 48,906.0 34,930.0 71.4 4.39 3.38 7,531.5 4,853.4 64.4Apr-Jun 00Jul-Sep 00Oct-Dec 00
SingaporeApr-Jun 99 SIX MONTH FIGURESJul-Sep 99 2,577 2,259 317 346 43,145.7 32,288.3 74.8 5.97 5.24 6,752 8,251.9 5,852.7 70.9Oct-Dec 99 SIX MONTH FIGURESJan-Mar 00 2,459 2,203 256 439 44,582.6 33,430.1 75.0 5.51 4.94 7,030 8,665.8 6,185.7 71.4Apr-Jun 00 SIX MONTH FIGURESJul-Sep 00 2,864 2,438 426 668 46,477.5 36,136.6 77.8 61.6 5.25 7,584 8,950.0 6,524.6 72.9Oct-Dec 00
Thai AirwaysApr-Jun 99 TWELVE MONTH FIGURESJul-Sep 99 2,858 2,695 163 136 51,788.0 37,642.0 72.7 5.52 5.20 16,331 7,309.0 5,097.0 69.7Oct-Dec 99Jan-Mar 00Apr-Jun 00Jul-Sep 00Oct-Dec 00
Air FranceApr-Jun 99 SIX MONTH FIGURESJul-Sep 99 5,249 4,889 360 316 56,934.0 43,896.0 77.1 9.22 8.59 20,600Oct-Dec 99 SIX MONTH FIGURESJan-Mar 00 4,831 4,430 401 41 55,508.0 41,650.0 75.0 8.70 7.98 19,200Apr-Jun 00 SIX MONTH FIGURESJul-Sep 00 5,506 5,132 374 385 60,088.0 48,464.0 80.7 9.16 8.54 4,125.0 4,689.0 65.2Oct-Dec 00
AlitaliaApr-Jun 99 1,937 1,990 -53 1 26,227.2 16,805.2 64.1 7.39 7.59 11,318 3,749.3 2,434.3 64.9Jul-Sep 99Oct-Dec 99Jan-Mar 00 SIX MONTH FIGURESApr-Jun 00 2,225 2,254 -29 -15 24,747.8 16,898.8 68.3 8.99 9.11 11,693 3,464.8 2,404.5 69.4Jul-Sep 00Oct-Dec 00
BAApr-Jun 99 3,527 3,378 149 302 45,813.0 32,032.0 69.9 7.70 7.37 11,733 6,437.0 4,215.0 65.5 65,179Jul-Sep 99 3,933 3,742 191 49 47,465.0 35,873.0 75.6 8.29 7.88 12,983 6,690.0 4,689.0 70.1 65,607Oct-Dec 99 3,473 3,476 -3 -112 45,347.0 30,192.0 66.6 7.66 7.67 11,084 6,469.0 4,270.0 66.1 65.800Jan-Mar 00 3,097 3,281 -184 -247 44,533.0 29,328.0 65.9 6.95 7.37 10,778 6,253.0 4,041.0 64.6 64,874Apr-Jun 00 3,488 3,342 146 -85 44,826.0 32,295.0 72.0 7.78 7.46 11,633 6,475.0 4,407.0 68.1 61,411Jul-Sep 00 3,673 3,293 380 197 45,333.0 35,093.0 77.4 8.10 7.26 12,615 6,608.0 4,741.0 71.7 62,793Oct-Dec 00 3,328 3,212 116 84 42,347.0 29,008.0 68.5 7.86 7.58 10,493 6,230.0 4,128.0 66.3 62,831
IberiaApr-Jun 99Jul-Sep 99 TWELVE MONTH FIGURESOct-Dec 99 3,712 3,659 53 179 50,227.6 34,606.8 68.9 7.39 7.28 21,877Jan-Mar 00Apr-Jun 00Jul-Sep 00Oct-Dec 00
KLMApr-Jun 99 1,626 1,547 79 37 18,778.0 14,302.0 76.2 8.66 8.24 3,253.0 2,427.0 74.6 34,980Jul-Sep 99 1,731 1,596 135 32 19,630.0 16,083.0 81.9 8.81 8.13 3,352.0 2,640.0 78.8 35,226Oct-Dec 99 1,450 1,479 -29 -17 19,014.0 14,434.0 75.9 7.63 7.78 3,280.0 2,550.0 77.7 35,128Jan-Mar 00 1,361 1,436 -75 -142 18,627.0 14,084.0 75.6 7.31 7.71 3,238.0 2,453.0 75.8 35,348Apr-Jun 00 1,600 1,509 91 39 18,730.0 15,149.0 80.9 8.54 8.06 3,276.0 2,549.0 77.8 27,267Jul-Sep 00 1,615 1,445 170 100 19,386.0 16,378.0 84.5 8.33 7.45 3,359.0 2,703.0 80.5 26,447Oct-Dec 00 1,617 1,574 43 4 19,050.0 14,715.0 77.2 8.49 8.26 3,316.0 2,618.0 78.9 26,349
Lufthansa***Apr-Jun 99 3,322 3,012 310 97 30,500.0 22,279.0 73.0 10.89 9.86 11,444 5,626.0 3,993 71.0 53,854Jul-Sep 99 4,049 3,677 382 184 31,335.0 23,866.0 76.2 12.92 11.73 11,891 5,699.0 4,142.0 72.7Oct-Dec 99 3,398 2,964 434 378 29,120.0 20,313.0 69.8 11.67 10.18 10,807 5,503.0 3,930.0 71.4 66,207Jan-Mar 00 2,831 2,742 89 11 28,599.0 19,781.0 69.2 9.90 9.59 10,355 5,422.0 3,751.0 69.2Apr-Jun 00 3,346 3,123 223 400 31,865.0 24,405.0 76.6 10.50 9.80 12,249 5,988.0 4,338.0 72.4Jul-Sep 00 3,375 2,993 382 182 32,654.0 25,878.0 79.2 10.33 9.17 12,849 6,156.0 4,536.0 73.7Oct-Dec 00
SASApr-Jun 99 1,357 1,294 63 60* 8,466.0 5,571.0 65.8 16.03 15.28 5,580 27,706Jul-Sep 99 1,173 1,150 23 12* 8,450.0 5,667.0 67.1 13.88 13.61 5,589 27,589Oct-Dec 99 1,210 1,083 127 138* 8,227.0 5,210.0 63.3 14.71 13.16 5,536 27,201Jan-Mar 00 1,145 1,179 -34 -33* 8,253.0 4,992.0 60.5 13.87 14.24 5,314 28,060Apr-Jun 00 1,289 1,176 113 112* 8,492.0 6,004.0 70.7 15.18 13.85 6,236 28,295Jul-Sep 00 1,122 1,070 52 33* 8,496.0 6,155.0 72.4 13.21 12.59 5,943 28,485Oct-Dec 00 1,310 1,131 179 174* 8,541.0 5,492.0 64.3 5,747 27,767
Swissair**Apr-Jun 99 1,932 1,877 55 57 23,411.0 16,130.0 68.9 8.25 8.02 7,784 10,715Jul-Sep 99 SIX MONTH FIGURESOct-Dec 99 2,344 2,272 72 125 21,934.0 16,839.0 76.8 10.69 10.36 6,081Jan-Mar 00 SIX MONTH FIGURESApr-Jun 00 1,916 2,006 -90 2 25,476.0 18,241.0 71.6 7.52 7.87 9,162 3,972.8 2,719.6 68.5Jul-Sep 00Oct-Dec 00
Aviation StrategyMicro-trends
March 2001
Note: Figures may not add up due to rounding. 1 ASM = 1.6093 ASK. *Pre-tax. **SAirLines’ figures apart from net profit, which is SAirGroup. ***Excludes Condor from 1998 onwards. 4Q+ data are on IAS basis.
The Principals and Associates of Aviation Economics apply a problem-solving, creative and pragmatic approach to commercial aviation projects.
Our expertise is in strategic and financial consulting in Europe, the Americas, Asia, Africa and the Middle East, covering:
• Start-up business plans • Turnaround strategies • State aid applications
• Antitrust investigations • Merger/takeover proposals • Competitor analyses
• Credit analysis • Corporate strategy reviews • Market forecasts
• Privatisation projects • IPO prospectuses • Cash flow forecasts
• Asset valuations • E&M processes • Distribution policy
For further information please contact:Tim Coombs or Keith McMullan
Aviation EconomicsJames House, LG, 22/24 Corsham Street, London N1 6DR
Tel: + 44 (0)20 7490 5215 Fax: +44 (0)20 7490 5218e-mail:[email protected]
PLEASE RETURN THIS FORM TO:Aviation EconomicsJames House, LG
22/24 Corsham StreetLondon N1 6DR
Fax: +44 (0)20 7490 5218
Delivery addressName
Position
Company
Address
Country Postcode
Tel Fax
I enclose a Sterling, Euro or US Dollarcheque, made payable to:Aviation Economics
Please invoice me
Please charge my AMEX/Mastercard/Visacredit cardCard numberName on card Expiry date
I am sending a direct bank transfer of£390 net of all charges to AviationEconomics’ account: HSBC BankSort code: 40 04 37 Account no: 91256904
Aviation Economics
Please enter my Aviation Strategysubscription for:One year (12 issues) @£390 / €625 / US$625,starting with the issue(Discounts available for multiplesubscriptions - please call for details)
DATA PROTECTION ACTThe information you provide will be held on our database and may beused to keep you informed of our products and services or for selectedthird party mailings
Invoice address (if different from delivery address)
NamePositionCompanyAddress
Country Postcode
SUBSCRIPTION FORM