Embed Size (px)
Citation preview
AVOIDANCE OF SMOKY ESTABLISHMENTS, AVOIDANCE OF SMOKY ESTABLISHMENTS, ERIE/NIAGARA COUNTIES, NEW YORK, ERIE/NIAGARA COUNTIES, NEW YORK,
2002/03. 2002/03.
Cheryl Higbee Joseph Bauer, PhD
K. Michael Cummings, PhD, MPH William Wieczorek, PhD
Terry AlfordAndrew Hyland, PhD
Presented at
2003 National Conference on Tobacco or Health
Boston, Massachusetts
December 10, 2003
Acknowledgement
This project was supported by grants through the New York State Department of Health, the Erie-Niagara Tobacco Free Coalition and the National Cancer Institute Cancer Center Support Grant (CA16056).


Background
• People are bothered by secondhand smoke.
• Workers in bars and restaurants where smoking is allowed report irritation to their throat and lungs due to secondhand smoke.
• The discomfort associated with secondhand smoke leads many people to avoid smoky places, particularly restaurants and bars.
Background
• Hundreds of municipalities in the United States have regulations that restrict smoking in restaurants and bars.
• Now 5 states serving 21% of the nation’s population have smoke-free bars.
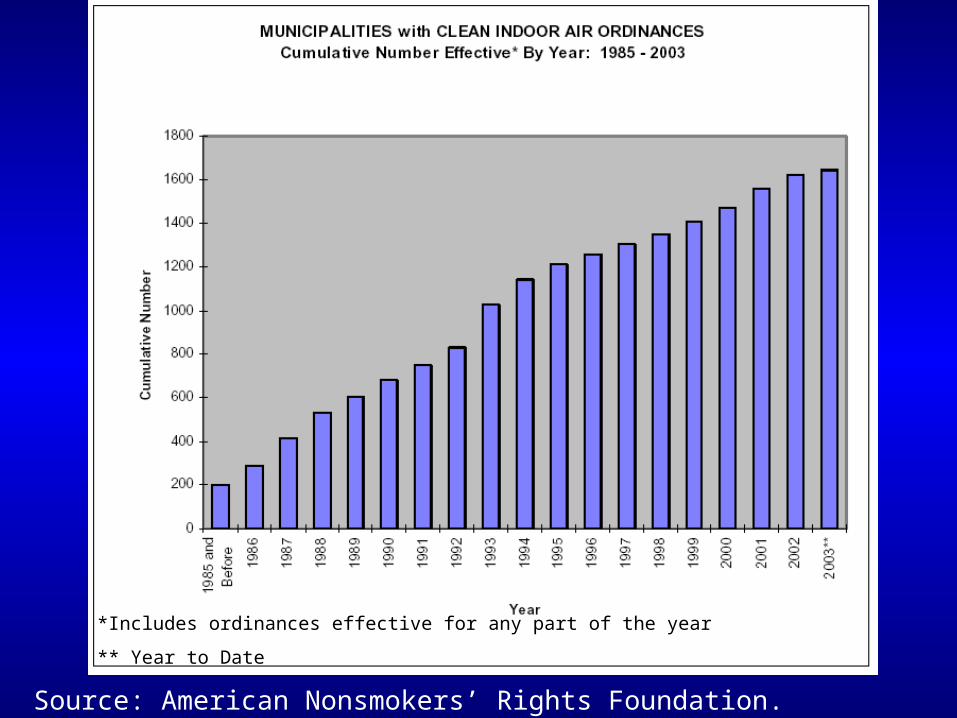
*Includes ordinances effective for any part of the year
** Year to Date
Source: American Nonsmokers’ Rights Foundation. (www.no-smoke.org/ordgraph)
?Do people avoid going to smoky
places?
Objective
• To estimate the extent to which consumers report an aversion to secondhand smoke.
• To examine the level of avoidance of smoky places.
• To examine the characteristics of those who avoid smoky establishments.
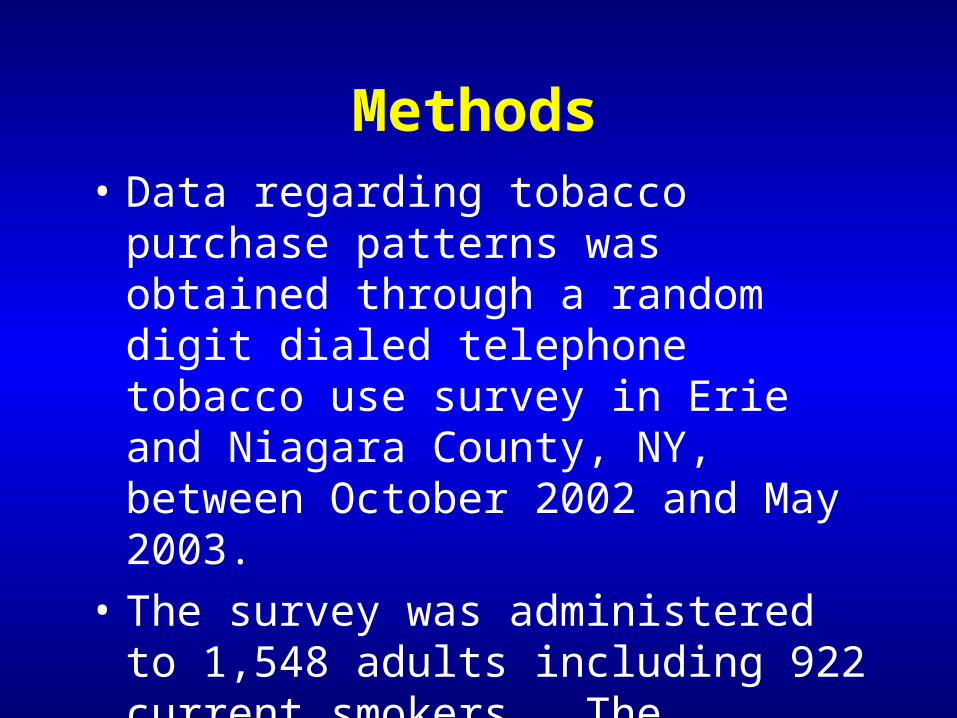
Methods• Data regarding tobacco purchase patterns
was obtained through a random digit dialed telephone tobacco use survey in Erie and Niagara County, NY, between October 2002 and May 2003.
• The survey was administered to 1,548 adults including 922 current smokers. The response rate for the survey was 60%.
Erie-Niagara Tobacco Use Survey
http://www.stopthebutts.com/
Are you bothered by secondhand smoke?
How does secondhand smoke bother you?
Watery eyes?…the smell?…allergies? …asthma?…itching?…stuffy nose? … coughing?…in some other way? (Yes/No)
Survey Measures
In the past 12 months, did the presence of secondhand cigarette smoke keep you from going to a restaurant, bar or tavern, bowling alley, casino or bingo hall?
Survey Measures
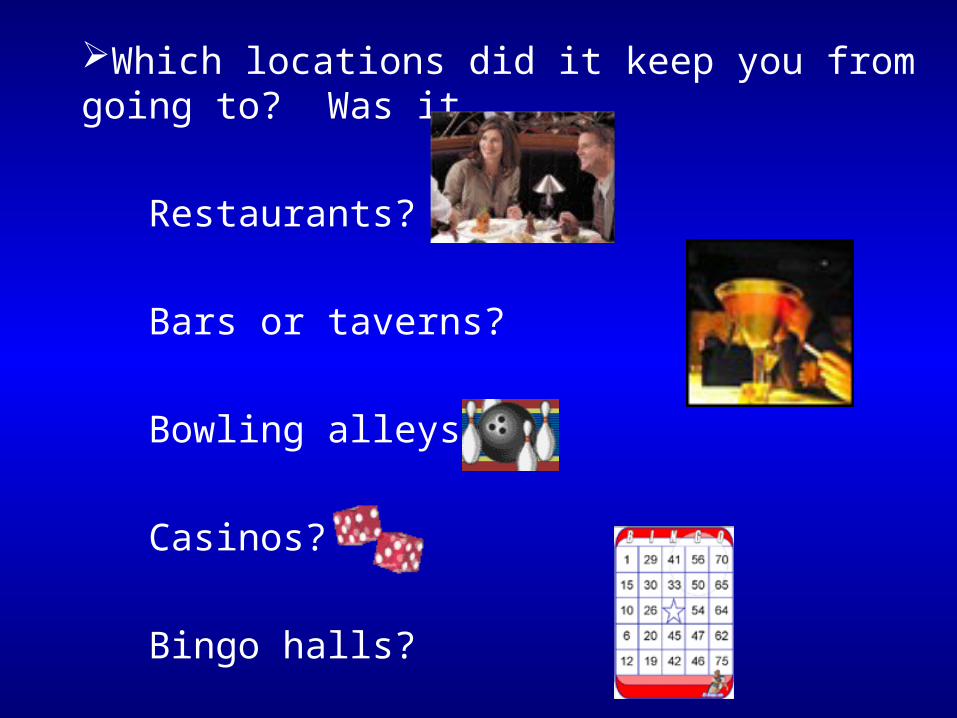
Which locations did it keep you from going to? Was it….
Restaurants?
Bars or taverns?
Bowling alleys?
Casinos?
Bingo halls?
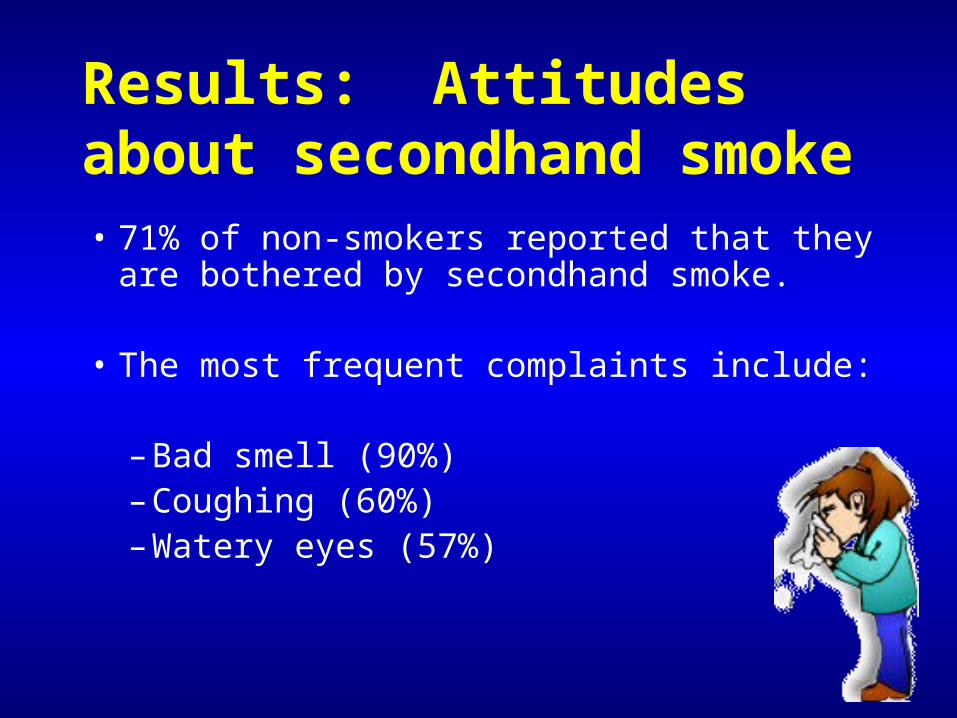
Results: Attitudes about secondhand smoke
• 71% of non-smokers reported that they are bothered by secondhand smoke.
• The most frequent complaints include:
– Bad smell (90%)– Coughing (60%)– Watery eyes (57%)

Results: Avoidance of smoky establishments
• 29% of all respondents reported having avoided patronizing a smoky establishment in the past 12 months.
– 34% of non-smokers avoided a smoky establishment
– 10% of current smokers avoided a smoky establishment
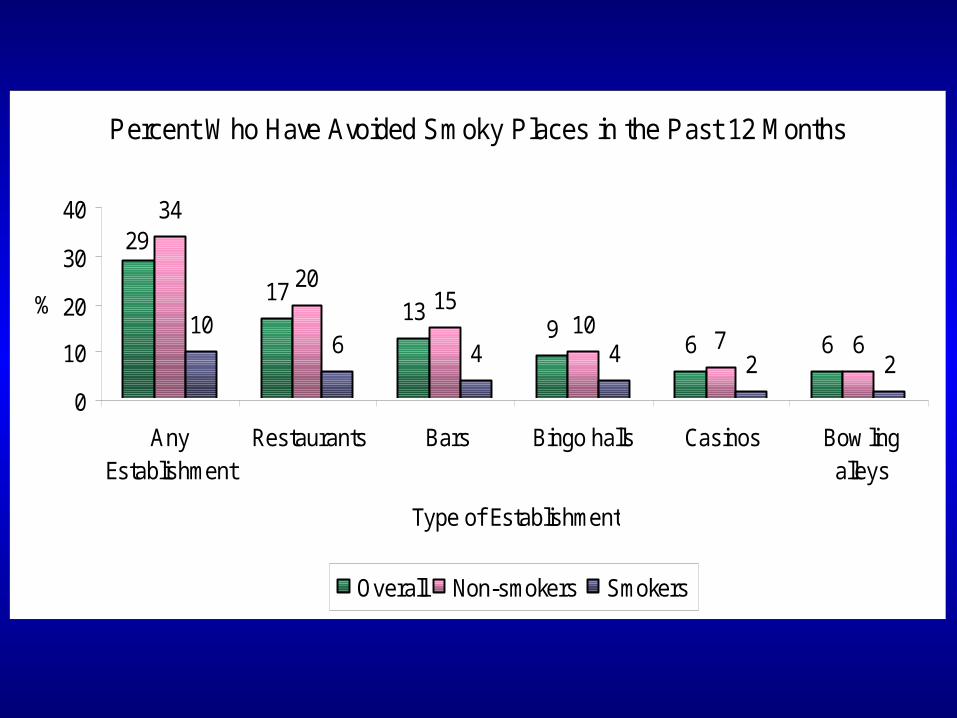
Percent Who Have Avoided Smoky Places in the Past 12 Months
1713
96 6
34
2015
107 6
106 4 4 2 2
29
0
10
20
30
40
AnyEstablishment
Restaurants Bars Bingo halls Casinos Bow lingalleys
Type of Establishment
%
Overall Non-smokers Smokers

Number of Residents Who have Avoided Restaurants and Bars in the Past 12 Months
Because of Secondhand Smoke
126,700
93,600
28,20016,700
0
25,000
50,000
75,000
100,000
125,000
150,000
Erie County Niagara County
Avoided Smoky Restaurants Avoided Smoky Bars
Who Avoids Smoky Places?
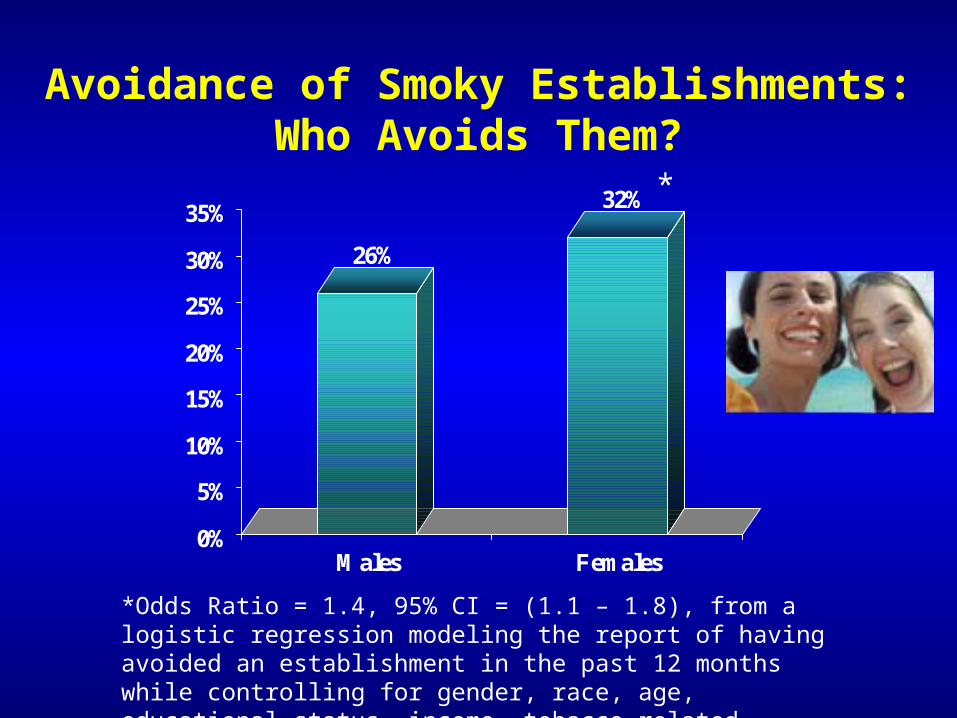
*Odds Ratio = 1.4, 95% CI = (1.1 – 1.8), from a logistic regression modeling the report of having avoided an establishment in the past 12 months while controlling for gender, race, age, educational status, income, tobacco-related illness, smoking status, and county of residence.
Avoidance of Smoky Establishments:Who Avoids Them?
26%
32%
0%
5%
10%
15%
20%
25%
30%
35%
Males Females
*
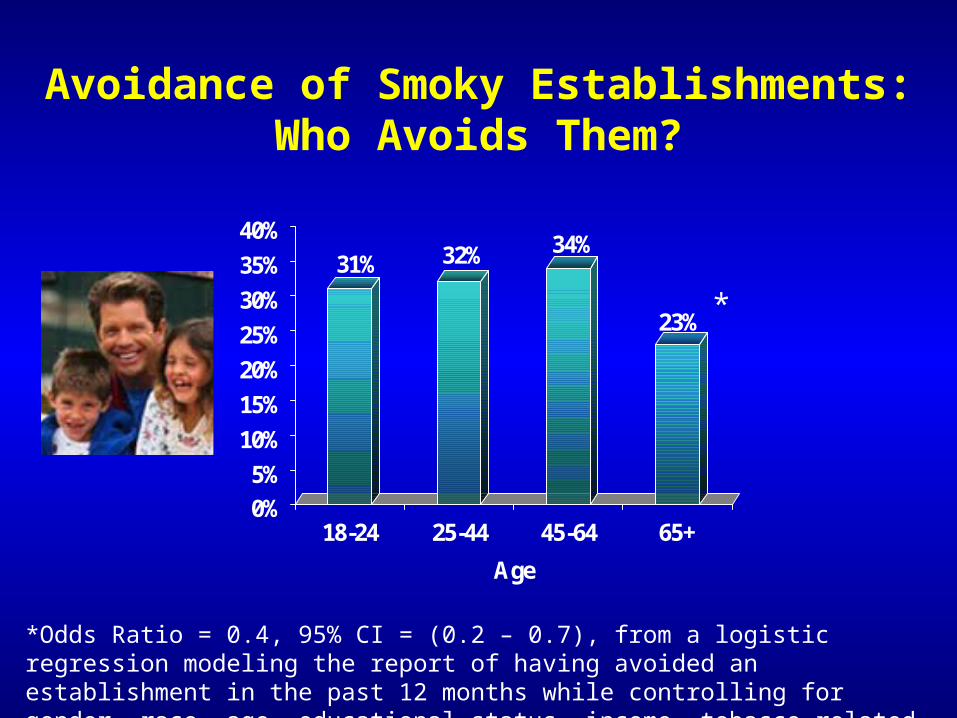
Avoidance of Smoky Establishments:Who Avoids Them?
*Odds Ratio = 0.4, 95% CI = (0.2 – 0.7), from a logistic regression modeling the report of having avoided an establishment in the past 12 months while controlling for gender, race, age, educational status, income, tobacco-related illness, smoking status, and county of residence.
31% 32% 34%
23%
0%
5%
10%
15%
20%
25%
30%
35%
40%
18-24 25-44 45-64 65+
Age
*
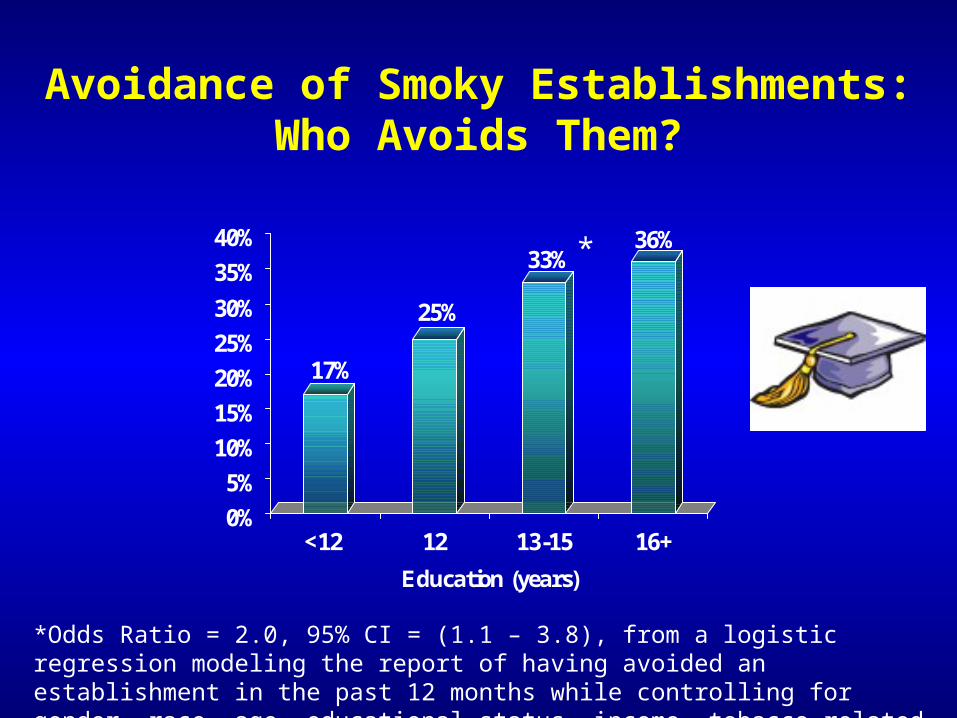
Avoidance of Smoky Establishments:Who Avoids Them?
*Odds Ratio = 2.0, 95% CI = (1.1 – 3.8), from a logistic regression modeling the report of having avoided an establishment in the past 12 months while controlling for gender, race, age, educational status, income, tobacco-related illness, smoking status, and county of residence.
17%
25%
33%36%
0%
5%
10%
15%
20%
25%
30%
35%
40%
<12 12 13-15 16+
Education (years)
*
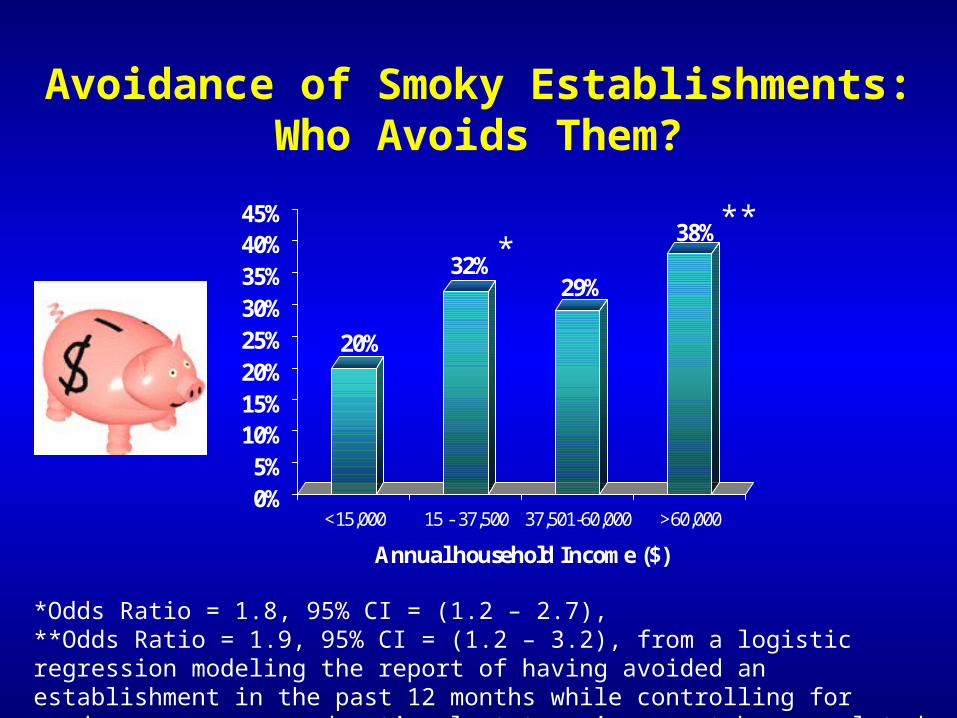
Avoidance of Smoky Establishments:Who Avoids Them?
*Odds Ratio = 1.8, 95% CI = (1.2 – 2.7), **Odds Ratio = 1.9, 95% CI = (1.2 – 3.2), from a logistic regression modeling the report of having avoided an establishment in the past 12 months while controlling for gender, race, age, educational status, income, tobacco-related illness, smoking status, and county of residence.
20%
32%29%
38%
0%5%
10%15%20%25%30%35%40%45%
<15,000 15 - 37,500 37,501-60,000 >60,000
Annual household Income ($)
***
Avoidance of Smoky Establishments:Who Avoids Them?
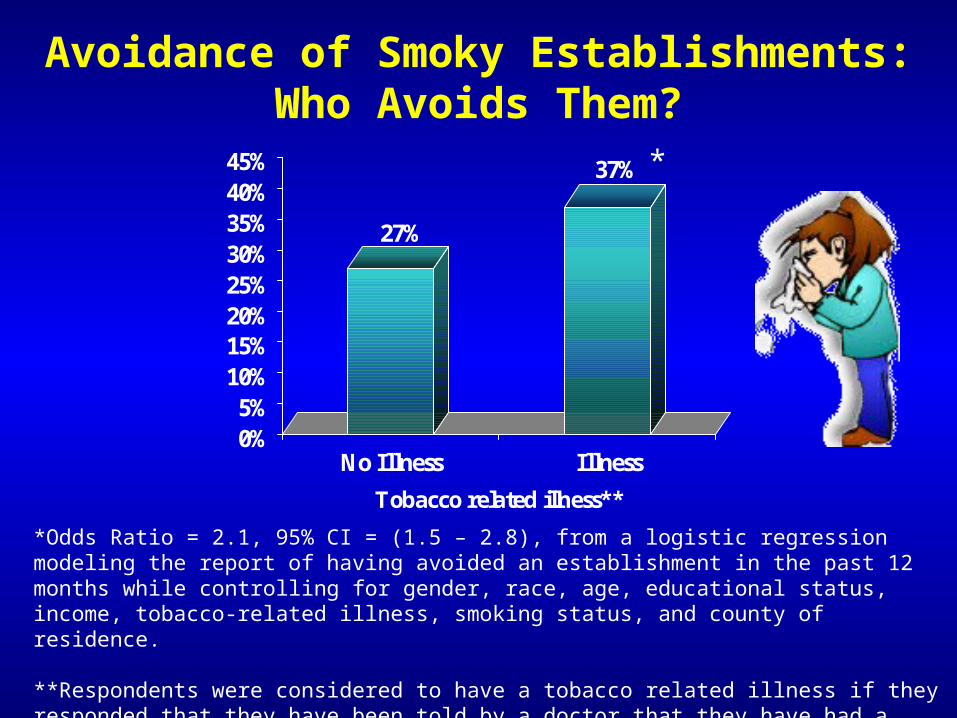
*Odds Ratio = 2.1, 95% CI = (1.5 – 2.8), from a logistic regression modeling the report of having avoided an establishment in the past 12 months while controlling for gender, race, age, educational status, income, tobacco-related illness, smoking status, and county of residence.
**Respondents were considered to have a tobacco related illness if they responded that they have been told by a doctor that they have had a heart attack, stroke, asthma, emphysema, chronic bronchitis, or cancer of the esophagus, larynx, throat, lung, oral cavity or mouth.
27%
37%
0%5%
10%15%20%25%30%35%40%45%
No Illness Illness
Tobacco related illness**
*
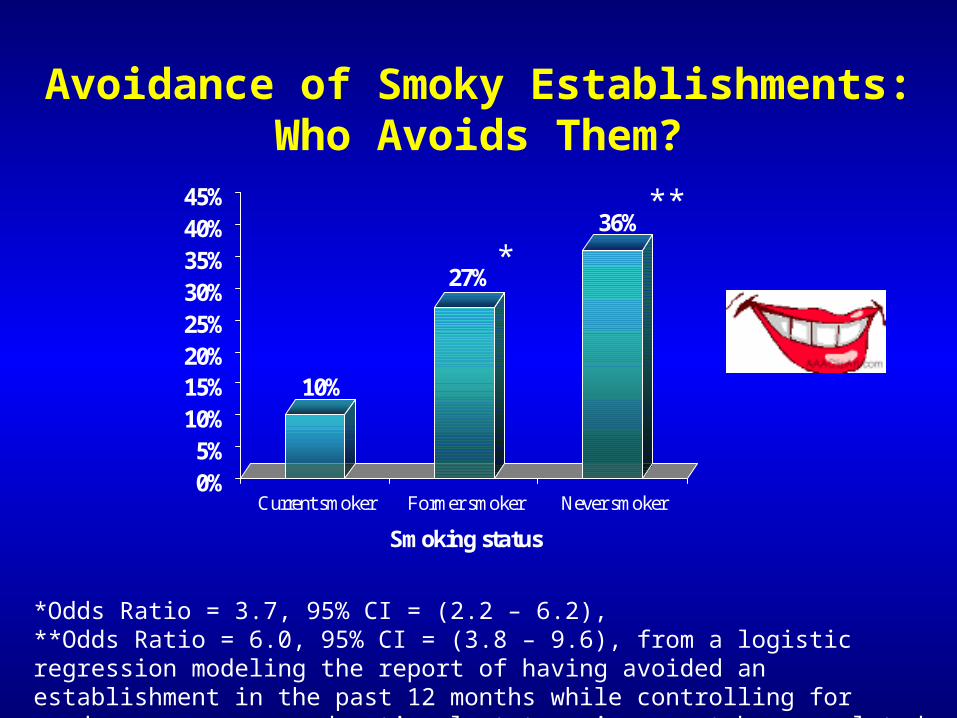
Avoidance of Smoky Establishments:Who Avoids Them?
*Odds Ratio = 3.7, 95% CI = (2.2 – 6.2), **Odds Ratio = 6.0, 95% CI = (3.8 – 9.6), from a logistic regression modeling the report of having avoided an establishment in the past 12 months while controlling for gender, race, age, educational status, income, tobacco-related illness, smoking status, and county of residence.
10%
27%
36%
0%5%
10%15%20%25%30%35%40%45%
Current smoker Former smoker Never smoker
Smoking status
**
*

Few smokers have left Erie County to dine in restaurant where smoking is allowed in the past
12 months.
5%
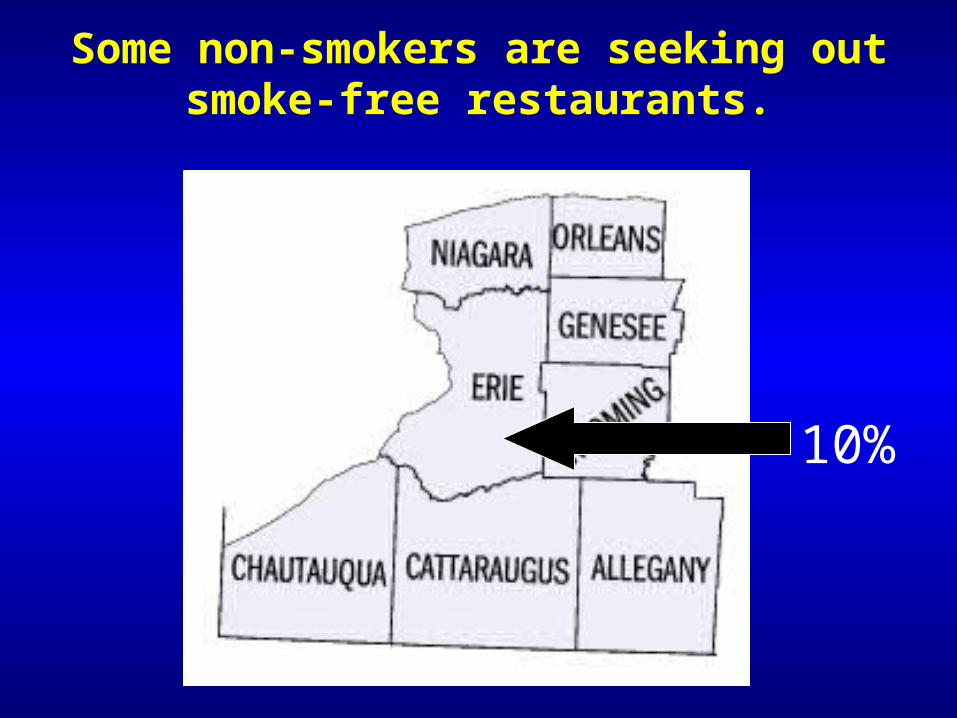
Some non-smokers are seeking out smoke-free restaurants.
10%
Conclusions
• A large majority of non-smokers are bothered by secondhand smoke.
• Consumers avoid patronizing smoky establishments in large numbers
Conclusions• By reaching out to this population,
patronage and sales could be boosted when smoke-free regulations are implemented.
• Some businesses by benefit from redeveloped business plans and alternative marketing strategies to be consistent with the consumer market.