Embed Size (px)
Citation preview


�
�
�
�
�
�
�
�
�
�
�
�
�
�
�
�
Best Distributor of the Year by NetApp.
Best sales performance award for APAC region by Kodak.
Best performer in IWS and LES consumer category by HP.
APJ most outstanding partner of the Year – 2009.
APAC Partner with Highest growth – 2009 by Ncomputing.
Best Channel Partner 2009 - GCC Channel Awards.
Best After Sales Services - Choice of Channel Awards (COC) 2009.
Distributor of the year 2010 - Channel Middle East Awards.
Distributor of the year award – H&BN.
Best Distributor Award for MENA region.
Best Specialty Distributor by CISCO for Nigeria.
Volume Retail Distributor of the year award in RETAIL Academy awards.
Best Channel in the Asia Pacific region for HP Indigo Business.
Best performing country in the Asia Pacific Region for HP Indigo Business.
Best customer experience for Asia pacific region for HP Indigo Business.
Best Partner in Asia Pacific and Japan region for sales, service and support- HP Indigo.
ME
AWARDS & ACCOLADES
Mobiilty, Connectivity, Dependability - AtRedington, this defines the driving force and themodel for business excellence, in supply chainsolutions. With a distribution network spreadacross South Asia, Middle East and Africa and amarket penetration of more than 18 countries,the Company is amongst the largest, supplychain solution providers to over 75 leadingmanufacturers of Information Technology,Telecom, Lifestyle and Consumer Electronics
, worldwide .Products
Supported by a wide and well connecteddistribution network of more than 23,600channel partners, team of trained and talentedworkforce and Automated Distribution Centres,Redington has drawn up plans to take its placeamongst the key world class, supply chainsolution providers.
MOBILITY... CONNECTIVITY... DEPENDABILITY...

93Mobility, Connectivity, Dependability
ContentsPage
Corporate Information 02
Letter from the Managing Director 04
Five years at a glance 06
Directors' Report 08
Report on Corporate Governance 20
Management Discussion and Analysis 35
Standalone Financial Statements
Auditors' Report 49
Balance Sheet 52
Profit and Loss Account 53
Cash Flow Statement 54
Schedules forming part of Accounts 55
Notes to Accounts 60
Balance Sheet Abstract and Company's General Profile 71
Consolidated Financial Statements
Auditors' Report 73
Balance Sheet 74
Profit and Loss Account 75
Cash Flow Statement 76
Schedules forming part of Consolidated Accounts 77
Notes to Consolidated Accounts 82
Statement under Section 212 of the Companies Act,1956 relating to Subsidiary Companies 92
2 Annual Report 2009 - 2010
CORPORATE INFORMATION
BOARD OF DIRECTORS
Chairman Prof. J. Ramachandran
Managing Director Mr. R. Srinivasan
Deputy Managing Director Mr. Raj Shankar
Whole-time Director Mr. M. Raghunandan
Directors Mr. R. Jayachandran
Mr. Huang Chi Cheng
Mr. Tu, Shu-Chyuan
Mr. Steven A. Pinto
Mr. William Adamopoulos
Mr. N. Srinivasan
Company Secretary Mr. M. Muthukumarasamy
Statutory Auditors M/s. Deloitte Haskins & Sells
Chartered Accountants
Internal Auditors M/s. Pricewaterhouse Coopers
Chartered Accountants

3Mobility, Connectivity, Dependability
Bankers Bank of Nova Scotia
Barclays Bank PLC
BNP Paribas
Citibank N.A.
DBS Bank Limited
Deutsche Bank AG
HDFC Bank Limited
Hongkong and Shanghai Banking Corporation Limited
ICICI Bank Limited
IDBI Bank Limited
IndusInd Bank Limited
ING Vysya Bank Limited
Kotak Mahindra Bank Limited
Standard Chartered Bank
State Bank of India
The Royal Bank of Scotland
Union Bank of India
Yes Bank Limited
Registered Office SPL Guindy House,
95, Mount Road, Guindy,
Chennai - 600 032.
Tel : + 91 44 4224 3352, 4224 3353
Fax : + 91 44 2235 2790
Website www.redingtonindia.com

4 Annual Report 2009 - 2010
Dear Shareholders,The year that has passed by was a challenging year for your Company. While the westerneconomies are showing signs of gradual recovery, the developing economies demonstrateda smarter and quicker turn-around. However, overall recovery is still at a nascent stage andmany economies are still experiencing the after-effects of the global meltdown.
Your Company's persistent belief in the growth opportunities in emerging economies ofIndia, Middle East and Africa has been vindicated by a strong recovery in these markets.The new decade looks set to fulfill the promise that these countries would finally emerge asthe new drivers of the World Economy on the back of their expanding markets and growingprosperity. These governments have made determined efforts towards accelerated growth,by encouraging businesses through special packages and massive investments ininfrastructure.
Your Company managed to continue its growth, despite the challenges posed by the entirebusiness eco-system. The unstinted support of all stake-holders has been a key element in enabling your Companyovercome difficulties posed by the global financial crisis, a liquidity crunch that followed, the Dubai debt crisis and theslowdown in overall demand for the products distributed by it.
We ended Fiscal 2010 by posting a consolidated turnover of Rs. 13,779 Crore, a Y-o-Y growth of 9% despite sluggishdemand, postponement of purchases by consumers and increased competition. The Company's disciplined approachtowards offering value added solution to customers, prudent risk management, efficient working capital norms and controllingthe cost of operations has resulted in the consolidated profit after tax (before Minority interest) growing by 25% to Rs. 212Crore and profit after tax (after Minority interest) going up by 15% to Rs. 184 Crore.
The Board of Directors has recommended a final Dividend of Rs. 5/- per share for fiscal 2010. In order to improve theliquidity of your Company's equity shares in the Stock Exchanges, your Company's Board of Directors have approved(subject to member's approval) the proposal for 5:1 stock split.
The highlight of the year under review was the month-on-month growth in sales of "Blackberry" smart phones. Smartphones as a category among the mobile phones is experiencing sustained growth even while other categories are showinga slow down. This was possible due to our strong presence in servicing Retail space and appointment of a highly committedbusiness partners.
This success has demonstrated to global telecom handset vendors the inherent advantages of an alliance with a strongdistribution partner where earlier they were entirely dependent on telecom service providers.
In order to strengthen its smart phone initiative, your Company is investing in building a support services infrastructure thatwill specifically cater to "Blackberry" smart phone customers in India. It is proposed to set these centres in 10 cities for astart.
While our relationship with Nokia started in Nigeria two years back, today we distribute Nokia products in Kenya and Ghanaas well. In last fiscal year, we were the leading partner for Nokia in Nigeria, which is a large market for mobile handsets. Forthe Company, revenue from sale of Nokia products crossed USD 250 Million for the first time last year.
The Central and State Governments in India have committed huge investments in the area of e-governance. These ordersare normally complex in nature and demand high quality execution skills. To support our partners engaged in execution ofthese orders, your Company has put in place a dedicated project team. The buoyancy in this space and your Company's
LETTER FROM THE MANAGING DIRECTOR

5Mobility, Connectivity, Dependability
intense engagement with key partners was an important element for your Company's success even during the difficultphase of slowdown last fiscal year and continues to provide opportunities in the coming years as well.
A key addition to our Vendor bouquet last fiscal year was Dell in Middle East (ME). Dell was seeking a change from their"All Direct" business model to partnering with distributors. Partnering Dell not only added significant revenue during adifficult year, but is likely to play a significant strategic role in future too. Our strong presence in ME retail space made thistie-up possible.
Once more, supported by the highest category-rating from CRISIL / ICRA for short-term debt program, your Companycould raise funds at very attractive interest rates. The edge in interest rate vis-à-vis the competitors provided your Companya great advantage in the market place. Sufficient funds were available even during the tough phase of tight liquidity conditionin the debt market. I am sure you will feel happy to know that your Company did not forego any business opportunity dueto non-availability of funds during this period.
Easyaccess Financial Services, the finance arm of your Company has turned in a good performance by extending financein the form of receivables factoring and extended credit (Channel Finance) to your Company's channel partners and othercustomers, recording another good year of accelerated profit growth and an enviable position of "Nil" non-performing assetsfor the second year in succession. With increased equity investment in December 2009, Easyaccess Financial Services ispoised to scale greater heights in the years to come.
I am happy to share that your Company's first Automated Distribution Centre (ADC) at Chennai is operational since lastyear. With 225,000 pallet sq. ft. at its disposal and an effective warehouse management system operational, your Companyis well poised to access opportunities in the fast-growing Third Party Logistics (3PL) space. ADC in Dubai would beoperational in September this year. Work in the Kolkata ADC has commenced and is likely to be operational by the earlypart of next year.
Your Company had identified Africa as a potential market in the early part of 2000 itself. With a good presence in West andEast Africa, there is a conscious move towards North Africa in the last few quarters. In the year under review, subsidiarieswere set-up in Morocco and Libya. We expect all these new initiatives to contribute in a big way to our revenue in futureyears.
With the conclusion of the broadband spectrum auction in India and entry of large players, connectivity is bound to increasedramatically. In an industry study conducted, it was found that unavailability of connectivity was a major handicap inincreasing PC penetration in India. Currently, there are about 8.75 Million broadband connections in India. This is estimatedto move beyond 214 million connections by 2014 (Source: CII (Broadband) Report) giving a big push to PC and mobiledevices penetration. Your Company is well positioned to take advantage of this opportunity.
It is rightly said that circumstances can change very quickly in the IT market and nowhere is that more evident than indistribution space. However, I am confident that your Company's well thought-out and clear business objectives andstrategies would enable it to continue meeting its growth objectives in foreseeable future.
Our ambition is to be the leading distribution player in all the markets where we have presence and increase the shareholderreturn. With the support from our experienced Board members and the committed team of professionals, I feel confident ofmeeting this goal.
At the end I would like to thank all our constituents for their support and more specifically to our Promoter shareholders,other shareholders and employees for the impeccable trust they have reposed on the Company. Together we shall marchahead with confidence.
R. SrinivasanManaging Director
ChennaiMay 21, 2010

6 Annual Report 2009 - 2010
Standalone Financials
(Rs. in Crore)
Particulars 2009-10 2008-09 2007-08 2006-07 2005-06 CAGR
Total Revenue 6,459.88 6,071.64 5,780.27 4,717.53 3,696.62 15%
EBIDTA 201.60 173.87 148.25 101.76 68.90 31%
PBT 153.16 124.25 103.57 65.63 45.33 36%
PAT 99.46 80.69 67.11 42.42 29.14 36%
Networth 675.98 614.39 569.56 535.02 367.63
Capital Employed 1,051.50 904.29 821.82 852.09 566.96
EBIDTA / Revenue 3.12% 2.86% 2.56% 2.16% 1.86%
PAT / Revenue 1.54% 1.33% 1.16% 0.90% 0.79%
Return on Average Capital Employed * 31.67% 31.20% 25.87% 19.85% 20.45%
Return on Average Equity * 38.97% 29.76% 24.60% 17.91% 17.45%
EPS (Rs.) # 12.68 10.36 8.62 6.41 4.79
Book Value per Share (Rs.) 85.96 78.90 73.15 68.71 58.28
# For EPS calculation-weighted average number of equity shares have been considered.
* Investments made in Subsidiaries are excluded
FIVE YEARS AT A GLANCE

7Mobility, Connectivity, Dependability
Consolidated Financials
(Rs. in Crore)
Particulars 2009-10 2008-09 2007-08 2006-07 2005-06 CAGR
Total Revenue 13,778.65 12,683.14 10,883.81 9,067.14 6,795.52 19%
EBIDTA 365.72 329.57 259.04 198.47 131.06 29%
PBT 275.92 219.02 177.06 127.25 92.36 31%
PAT 184.33 159.66 136.07 101.70 74.34 25%
Networth 1,075.72 1,002.20 721.49 625.61 432.86
Capital Employed 2,464.85 2,226.51 1,505.44 1,226.88 911.26
EBIDTA/Revenue 2.65% 2.60% 2.38% 2.19% 1.93%
PAT/Revenue 1.34% 1.26% 1.25% 1.12% 1.09%
Return on Average Capital Employed * 16.25% 18.50% 18.86% 18.19% 18.80%
Return on Average Equity * 23.04% 22.54% 21.68% 21.27% 23.47%
EPS (Rs.) # 23.51 20.50 17.48 15.36 12.23
Book Value per Share (Rs.) 136.80 128.71 92.66 80.34 68.62
# For EPS calculation, weighted average number of equity shares have been considered.
* For FY 10 and FY 09, investment from Investcorp held as Fixed Deposit, amounting to USD 50 Mn have beenexcluded. While calculating return on average capital employed and return on average equity, goodwill has beenexcluded / capital reserve has been included appropriately.
Note:
Financials are post acquisition of following entities - FY 06 (Redington Distribution Pte Ltd and Cadensworth(India) Ltd) and FY 08 (Easyaccess Financial Services Limited).

8 Annual Report 2009 - 2010
To the Members,
Your Directors are delighted to present their Seventeenth Annual Report on the business and operations of the Companyfor the year ended March 31, 2010.
Financial Highlights (Rs. In Crore)
Particulars Consolidated Standalone
2009-10 2008-09 2009-10 2008-09
Net Sales /Income from operations 13757.75 12668.27 6449.61 6066.16
Other Income 20.90 14.82 10.27 5.28
Total Revenue 13778.65 12683.09 6459.88 6071.44
Total Expenditure
a) Cost of goods sold 13033.14 12005.69 6085.26 5720.55
b) Trading Expenditure 34.93 32.48 19.55 17.43
c) Staff Cost 165.50 150.27 79.78 75.81
d) Other Expenditure 179.36 165.08 73.69 83.78
Profit before Interest, Depreciation and Tax (EBIDTA) 365.72 329.57 201.60 173.87
Interest 66.37 97.82 33.04 44.91
Depreciation 23.43 12.73 15.40 4.71
Profit before Tax (PBT) 275.92 219.02 153.16 124.25
Provision for Taxation 63.90 49.98 53.70 43.56
Profit after Tax (PAT) 212.02 169.04 99.46 80.69
Minority Interest 27.69 9.38 NIL NIL
Net Profit for the year 184.33 159.66 99.46 80.69
DIRECTORS’ REPORT

9Mobility, Connectivity, Dependability
During the year under review, there has been a moderate growth in terms of turnover by 9%, EBIDTA by 11% and aninteresting growth in PAT by 15% over the previous year on consolidated basis.
Your Directors have made the following appropriations out of the above profits:-
(Rs. in Crore)Balance in Profit and Loss Account brought forward : 189.70Less: Dividend for the year 2008-09 including Dividend Distribution Tax for additional
equity shares allotted under the ESOP Scheme after the closure of the financial year 0.28189.42
Add: Profit for the year 2009-10 99.46
Profit available for appropriation : 288.88Less: Proposed Dividend @ Rs.5/- per share ( i.e. 50%) for the year ended
31st March 2010 : 39.42Dividend Distribution Tax thereon : 6.55Transfer to General Reserve : 9.95 55.92Balance in the Profit and Loss Account to be carried forward : 232.96
DIVIDEND
Considering your Company's financial performance, the Directors have recommended a dividend of Rs. 5/- per share(i.e. 50%) for the year under review as compared to Rs. 4/- per share (i.e.40%) in the previous year.
PERFORMANCE
FY'10 was the 17th year of your Company's Indian operations and in all these 17 years the company has shownsignificant growth in revenue and profit year on year. The members would be happy to note that even in the difficultyear under review, the growth was maintained.
The Consolidated revenue of your Company was Rs. 13,778.65 Crore as against Rs.12,683.09 Crore in the previousyear with a CAGR of 19% for five years. The Consolidated net profit for the year under review was Rs. 184.33 Croreas against Rs.159.66 Crore in the previous year with a CAGR of 25% for the last five years.
The Stand alone revenue of your Company was Rs. 6,459.88 Crore as against Rs. 6,071.44 Crore in the previousyear with a CAGR of 15% for five years and the profit after tax was Rs. 99.46 Crore as against Rs. 80.69 Crore in theprevious year with CAGR of 36% for the last five years.
The Earnings Per Share (EPS) on consolidated basis (based on weighted average number of shares) increased toRs. 23.51 in the year under review as compared to Rs. 20.50 in the previous year. EPS on standalone basis hasincreased to Rs. 12.68 from Rs. 10.36 in the previous year.
DISTRIBUTION BUSINESS
INFORMATION TECHNOLOGY PRODUCTS
Following the global meltdown, there was slowdown in the sale of IT products until the first half of the year underreview. On the back of gradual recovery of business sentiments during the second half of the year under review, thesales growth picked up and enabled your Company to show positive growth for the full year.
Your Company has adopted various strategies to maintain its overall growth objectives by adding key vendors to itsportfolio and intensifying its focus in tier II cities and towns setting the base for accelerated growth in the ensuingyears.
The aggressive pace of both the Central and State Governments to drive their e-governance projects and increasedbudgetary allocation for the education and health sector is expected to stimulate demand for IT products. Strongtraction in desktop sales, continued consumer confidence and a revival in IT spend spurred personal computer (PC)sales during the January-March 2010 quarter, recording 33% year-on-year growth (IDC Research).
It is expected when most budget announcements are translated into actual expenditure, it would trigger huge demandfor IT products. Your Company is poised to exploit all these opportunities to its advantage with a clear focus ongrowth areas.

10 Annual Report 2009 - 2010
Tie-up with key vendors to complement the product bouquet has always been an important growth strategy for yourCompany and last fiscal was significant from this point of view, with the addition of Oracle, D-Link, LG-Nortel, RSASecurity, Iomega, Citrix, Lifesize Communications, NComputing, NetApp, Array Network, Ricoh and Fujitsu.
Your Company's overseas subsidiaries have signed new distribution contracts with vendors like Dell, Fujitsu andLenovo in the Systems space for select countries in Middle East and Africa and also signed new contracts withvendors like Juniper Networks, Check point Software, Netgear, Coral Telecom, Ascom and Molex in the value addeddistribution space.
During the financial year under review, your Company has added more than 2,000 channel partners in India. As of31st March 2010, your Company along with its subsidiaries has more than 75 brands, 23,600 channel partners, 78warehouses and 68 sales offices.
NON-INFORMATION TECHNOLOGY PRODUCTS
In the NON-IT products space, your Company currently has presence in Digital Lifestyle, Telecom, Consumer Electronicsand Digital Printing industry. Your Company's decision to venture into verticals other than IT products had enabled itto grow its revenue even during a difficult and challenging year. Today, your Company is a Supply Chain Solutionsplayer for many products, though IT products currently constitute a major share to the Company's total revenue.
Digital Lifestyle Products
Until previous year, your Company was distributing products like Apple Mac Notebooks, Apple Ipods, Microsoft Xboxgaming consoles and gaming contents.
During the year under review, your Company has added MapmyIndia's navigation devices & Jabra's wireless telecomaccessories. With the highway travel becoming increasingly popular in the country, MapmyIndia's navigation GPSdevices loaded with India's best maps and satellite based voice guided navigation ensuring safe travel, would be inhigh demand in future.
Telecom
During the year under review, telecom products such as Blackberry smart phone in India and inclusion of moreterritories for distributing Nokia hand sets in Middle East and Africa, enabled the Company to sustain its growthstrategy.
India is now the second largest mobile market in the world after China, with about 400 million mobile users. Accordingto Cellular Operators Association of India's (COAI) projection, there will be 1240 Million mobile users in 2015 - whichmeans one phone for every Indian.
The demand for Blackberry Smartphones has been encouraging in the year under review. Your Company's strongrelationship with large retail store customers has enabled it to show consistent monthly growth both in terms of unitssold and sales revenue.
Your Company has recently tied up with LG electronics for distribution of their mobile phones in the Tamilnadu market.This gives us entry into the high growth mobile handset space.
Your Company's MEA operations have obtained a new distribution contract from Nokia for Ghana market. The volumeshave been scaled up significantly in Nigeria and Kenya through better reach and coverage. Your Company's subsidiary,Redington Gulf FZE, has been honoured with the No.1 distributor position for Nokia products in Sub-Saharan Africaand has also been awarded the best distributor for Nokia products in East and West Africa.
Consumer Electronics
India, being a vast market with a strong consumer base and a growing interest in life-style products, the Company hasextended its experience in distribution of technology products to Consumer Electronics products as well.
The sale of Consumer Electronics products has shown an increased growth percentage every year. When the Industryhas grown by 15% during the year under review, compared to previous year, the revenue from sale of consumerelectronics products to your Company has grown by 65%. This was possible with the immense support received fromthe trade partners and the vendors.
11Mobility, Connectivity, Dependability
Within a short span from the start of consumer durable business your Company has expanded its branch network forsale of consumer electronics products to 14 cities with a market base of about 2,500 channel partners.
With an objective to become a one-stop shop for retailers, your Company has entered into partnerships with vendorslike LG, Whirlpool, Godrej etc in the Consumer Electronics space.The addition of Godrej consumer appliances duringthis year under review is a welcome addition in this segment.
Digital Printing
In early 2005, your Company, joined hands with HP Indigo and started distribution and after sales service of DigitalPrinting machines. Currently your Company has about 80 HP Indigo printing machines operating in India in theCommercial and Industrial printing segments and continues to grow with printing turning 'Digital'.
For short-run jobs, Digital Printing Machines are more cost effective compared to conventional offset printing machines,while providing much quicker “turn-around-time” for such jobs.
The unique establishment of Redington’s “HP Indigo Digital Press Demo Centre” and its “Indigo Training Facility” inChennai demonstrates your Company's strong commitment to its customers in the graphic arts and digital publishingindustry in India. The Demo centre is the fifth such centre for HP Indigo globally.
AFTER SALES SERVICES BUSINESS
Your Company enhanced its after sales service support from existing warranty and post warranty support for IT andTelecom products to pre-sale and post sale support for enterprise products. These services include pre sale technicalsupport, design, installations, remote technical support and 24x7 on-site support. Your Company could carve outmore business from existing customers and vendors by providing superior services and ensuring customer satisfaction.Your Company extended and strengthened its support network by adding more locations. Your Company deliversservices to customers through 48 owned service centres (Previous Year - 43) and 220 partner service centres (PreviousYear - 211) in India. In MEA markets, your Company's subsidiaries have 20 owned service centres (Previous Year18) and 15 partner service centres (Previous Year 15).
Complementing the new initiative in the distribution space, your Company's service unit extended its support servicesto new telecommunication vendors as well. Today, Blackberry customers can avail services at 27 locations across theCountry and efforts are on to extend these services from more locations. To provide a new experience to the customersof Blackberry smart phones, your Company is planning to invest in Blackberry exclusive service centres in large cities.One such centre is already operational at Chennai during the year under review.
Your Company's Service Division started their Remote Infrastructure Management Services from their new NetworkOperations Centre (NOC) at Chennai. Through this facility we can remotely manage services of our corporate customersusing advanced technology. Your Company will extend this support to IT as well as Telecom enterprise customers.
Your Company also provides L1,L2,L3 and L4 services and offer warranty and post warranty repair support for MobileHandsets(GSM and CDMA), Fixed Wireless Phones (FWP), Fixed Wireless Terminals (FWTs) and Personal DigitalAssistant (PDA).
The Company's strong forward and reverse logistics capabilities enable spare parts to reach nook and corners of Indiaon time and timely return of defective units to the supplier. Certification Body of TUV SUO Management ServiceGmbH has certified that your Company’s After Sales Services has established and applied a Quality ManagementSystem for its services.
Your Company's overseas subsidiary in MEA has established 3 new service centers in that region. All these servicecenters in the region have been accredited ISO 9001:2008 quality rating. The subsidiary has been given “The BestAfter Sales Service Provider Award” by Value Added Reseller (VAR), a leading channel magazine in the Middle East.
SUPPLY CHAIN SOLUTIONS
Automated Distribution Centre
The first ADC in Chennai has started operations effective last fiscal. In Dubai, the work on the state-of-the-art100,000 sq ft ADC at Jebel Ali Free Zone is nearing completion and is expected to be operational by middle of the

12 Annual Report 2009 - 2010
current year 2010-11. Your Company has initiated steps to set-up an ADC in Kolkata and is expected to be operationalby early part of 2011.
Commencing operations from these network of ADCs is expected to enhance productivity in throughput and enabletie-up for third party logistics services.
The transition to the new automated warehousing facility at Chennai has been smooth with zero variance in stocksand minimal loss of operations time.
Third Party Logistics (3PL) Services
The year under review was a challenging one for the 3PL business. Economic slow down resulted in reduced inventoriesand volume for the companies in various industries with a corresponding impact in 3PL operations. Many Corporateslooked at cutting down supply chain related cost in order to maintain margins. The cost assumed higher importancethan the quality of service and speed of delivery.
However, your Company was able to maintain an edge over competition to retain contracts with leading brands likeCadbury, Sonicwall, Vodafone and Kuehne+Nagel and established its presence in the market place. During the yearunder review, the Company signed up with IFB and Girias (Large Format Retailer) for 3PL services.
SUBSIDIARY COMPANIES
The Company has 29 subsidiary companies as on March 31, 2010.
During the year under review, your Company's Indian and Overseas direct and step down subsidiary companies havemade excellent contribution to the consolidated revenue and earnings' growth.
a. Indian Subsidiaries:
M/s. Easyaccess Financial Services Limited, a Non-Banking Finance Company which predominantly providesfinance to your Company's Channel partners in the IT Distribution Industry, commenced undertaking a significantfactoring business for non-Redington related customers widening its horizons and reach as a good value propositioninitiative.
Your Company has increased its investment in this wholly owned subsidiary from Rs. 83 Crore toRs. 221 Crore during the year under review in order to comply with the minimum capitalisation requirementprescribed in Foreign Direct Investment (FDI) guidelines. Under FDI guidelines, it is mandatory for an FDI companyto invest a minimum of USD 50 Million in its wholly-owned NBFC before completion of two years from the start ofNBFC operations.
The company has shown an excellent growth of 83% by earning post tax profits of Rs.12.90 Crore during 2009-10(previous year post tax profits Rs. 7.03 Crore) and is showing great potential going forward.
M/s. Nook Micro Distribution Limited has changed its name from M/s.Nook Holdings Limited in line with the objectof the company to engage in Micro Distribution of IT and Non-IT products in smaller cities and towns.
b. Overseas Subsidiaries:
Your Company's step down subsidiary M/s. Redington Gulf FZE incorporated three subsidiaries viz. M/s. RedingtonMorocco Ltd, Morocco, M/s. Redington Tanzania Ltd, Tanzania and M/s. Cadensworth UAE LLC, Dubai, UAE.Your Company's wholly owned subsidiary in Singapore, M/s. Redington Distribution Pte Ltd., has incorporated asubsidiary in Srilanka in the name of M/s. Redington (SL) Private Ltd.
Your Company's overseas operations, which are being carried out by the subsidiary companies, are in tune withtheir business plans and they have enabled your Company to continue with its growth momentum.
As required under the Listing agreement with the Stock Exchanges, the Company has prepared the ConsolidatedFinancial Statements, according to the applicable Indian Accounting Standards. Your Company provides theconsolidated financial statements alongwith the standalone financial statements to the investors.
An application made by the Company under Section 212(8) of the Companies Act, 1956, to the Central Governmentfor exempting the Company from attaching a copy of the Balance Sheet and the Profit and Loss Account of thesubsidiary companies and other documents to be attached under Section 212(1) of the Act to the Annual Report

13Mobility, Connectivity, Dependability
Blackberry Smart phones in
India and inclusion of more
territories for distributing Nokia
handsets in Africa, enabled the
Company to sustain its growth
strategy. Tied up with LG
Electronics for distribution of
thei r mobi le phones in
Tamilnadu market.
TELECOM JOURNEY AT REDINGTON

14 Annual Report 2009 - 2010
of the Company. A statement containing salient financial figures of the subsidiary companies is containedin the report.
CREDIT RATING
Your Company continues to enjoy the highest rating 'P1+' (read as P one plus) and 'A1+' (read as A one plus) for shortterm borrowings from CRISIL and ICRA (Credit Rating Agencies) respectively for Rs. 600 Crore, indicating verystrong financial position. As part of the rating requirements under the Basel II norms for working capital facilities frombanks, your company is rated 'P1+' and ' A+/Stable' by CRISIL and 'A1+' and 'LA+' from ICRA for its short term debtinstruments and cash credit facilities respectively.
EMPLOYEE STOCK OPTION PLAN 2008
With an objective to attract and retain talent, your Company instituted an Employee Stock Option Plan in February2008 and granted 23,35,973 options to the employees of the Company and its subsidiaries. The details of the optionsgranted under Redington (India) Limited - Employee Stock Option Plan - 2008 are given in Annexure - A.
ADDITIONAL INFORMATION RELATING TO CONSERVATION OF ENERGY, TECHNOLOGY ABSORPTION ANDEXPENDITURE IN R & D
As your Company is not engaged in manufacturing activities, the reporting requirement on these matters is notapplicable.
UTILIZATION OF THE INITIAL PUBLIC ISSUE PROCEEDS
In the financial year 2006-07, your Company went to the Indian capital market with an Initial Public Offer (IPO) andmobilized funds (net of issue expenses) aggregating to Rs. 138.99 Crore for meeting its various objectives, whichincludes setting up Automated Distribution Centres and High Level Repair Centres.
A sum of Rs. 132.46 Crore has so far been utilized for the objectives stated in the offer document and the balanceamount is expected to be deployed within the next two years, for which the Company is approaching the shareholdersfor approving the extension of time.
SHARES IN DEMAT SUSPENSE ACCOUNT:
During the Company's Initial Public Offer, 120 shares allotted to two shareholders, inter alia, got rejected by theDepositories due to want of sufficient/ correct information. These shares are lying unclaimed by the shareholders andkept in a Demat Suspense Account maintained with a Depository Participant. The Company has been making effortsto get the details from the investors and credit these shares to their accounts.
DIRECTORS
In accordance with the provisions of the Companies Act, 1956 and the Articles of Association of your Company, Prof.J. Ramachandran and Mr. William Adamopoulos, Directors would retire by rotation as Directors at the forthcomingAnnual General Meeting and being eligible, have offered themselves for re-appointment.
DIRECTORS' RESPONSIBILITY STATEMENT:
Pursuant to Section 217(2AA) of the Companies Act, 1956, the Directors confirm:
a. that in the preparation of the annual accounts, the applicable accounting standards had been followed along withproper explanation relating to material departures, if any;
b. that appropriate accounting policies have been selected and applied consistently, and that the judgments andestimates made are reasonable and prudent so as to give a true and fair view of the state of affairs of yourCompany as at 31st March 2010 and of the profit of your Company for the said year;
c. that proper and sufficient care has been taken for the maintenance of adequate accounting records in accordancewith the provisions of the Companies Act, 1956, for safeguarding the assets of your Company and for preventingand detecting fraud and other irregularities;
d. that the annual accounts have been prepared on a going concern basis.
15Mobility, Connectivity, Dependability
CORPORATE GOVERNANCE
A separate section on Corporate Governance forming part of the Directors' Report and the certificate from the Company'sauditors confirming compliance of Corporate Governance norms as stipulated in Clause 49 of the Listing Agreementwith the Indian Stock Exchanges is included in the Annual Report.
PARTICULARS OF EMPLOYEES
As per the provisions of Section 219(1)(b)(iv) of the Companies Act, 1956, the report and accounts are being sent toall the members excluding the statements of particulars under section 217(2A). Any member interested in obtaining acopy of the statement may write to the company.
AUDITORS
M/s Deloitte Haskins & Sells (DHS), who are the Statutory Auditors of the Company hold office until the conclusion ofthe ensuing Annual General Meeting. It is proposed to re-appoint them for the Financial Year 2010-11. DeloitteHaskins & Sells have, under Section 224(1)(B) of the Companies Act, 1956, furnished a certificate of their eligibility forre-appointment and also a confirmation that they have been peer reviewed by the Institute of Chartered Accountantsof India.
FOREIGN EXCHANGE
Your Company's earnings / outgo in foreign currencies are outlined in the notes to the Annual Accounts.
ACKNOWLEDGEMENTS
The Directors wish to convey their appreciation to all the employees of the Company and its subsidiaries and stepdown subsidiaries for their collective contribution to the Company's performance. The Directors would also like tothank the employees, shareholders, customers, channel partners, suppliers, bankers, Government and all the otherbusiness associates for the continuous support given by them to the Company.
On behalf of the Board of Directors
Place : Chennai J. RamachandranDate : May 21, 2010 Chairman
16 Annual Report 2009 - 2010
Annexure - A
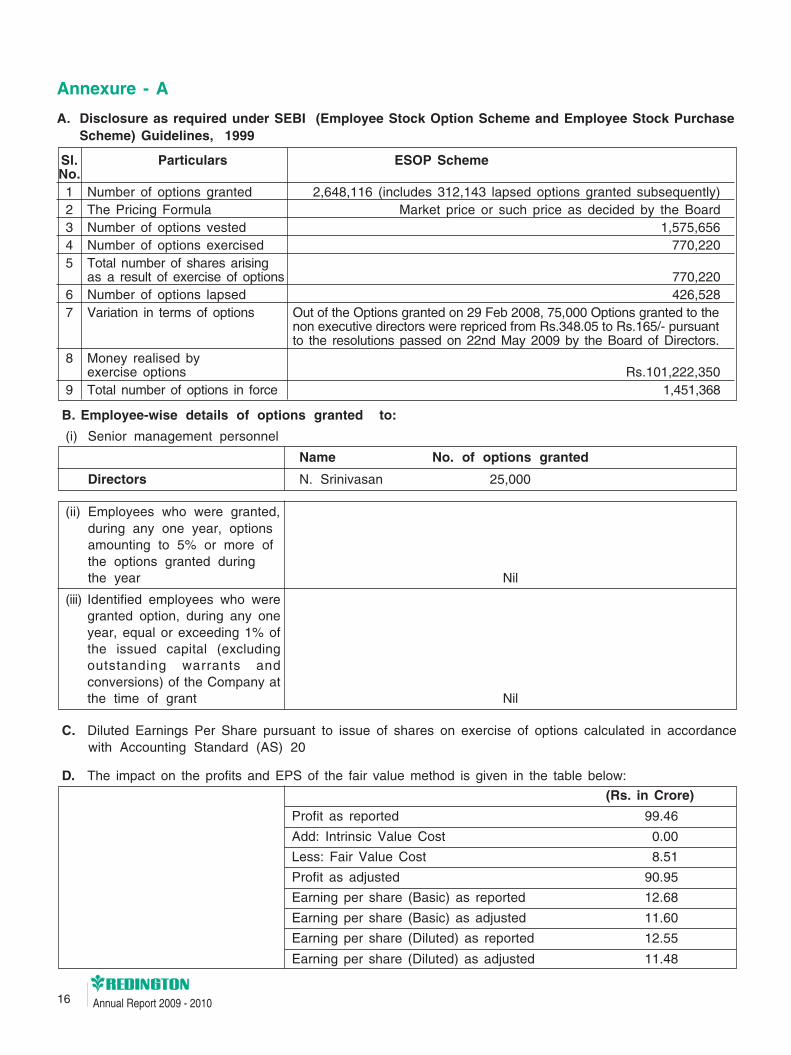
A. Disclosure as required under SEBI (Employee Stock Option Scheme and Employee Stock PurchaseScheme) Guidelines, 1999
Sl. Particulars ESOP SchemeNo.1 Number of options granted 2,648,116 (includes 312,143 lapsed options granted subsequently)2 The Pricing Formula Market price or such price as decided by the Board3 Number of options vested 1,575,6564 Number of options exercised 770,2205 Total number of shares arising
as a result of exercise of options 770,2206 Number of options lapsed 426,5287 Variation in terms of options Out of the Options granted on 29 Feb 2008, 75,000 Options granted to the
non executive directors were repriced from Rs.348.05 to Rs.165/- pursuantto the resolutions passed on 22nd May 2009 by the Board of Directors.
8 Money realised byexercise options Rs.101,222,350
9 Total number of options in force 1,451,368
B. Employee-wise details of options granted to:
(i) Senior management personnel
Name No. of options granted
Directors N. Srinivasan 25,000
(ii) Employees who were granted,during any one year, optionsamounting to 5% or more ofthe options granted duringthe year Nil
(iii) Identified employees who weregranted option, during any oneyear, equal or exceeding 1% ofthe issued capital (excludingoutstanding warrants andconversions) of the Company atthe time of grant Nil
C. Diluted Earnings Per Share pursuant to issue of shares on exercise of options calculated in accordancewith Accounting Standard (AS) 20
D. The impact on the profits and EPS of the fair value method is given in the table below:
(Rs. in Crore)
Profit as reported 99.46
Add: Intrinsic Value Cost 0.00
Less: Fair Value Cost 8.51
Profit as adjusted 90.95
Earning per share (Basic) as reported 12.68
Earning per share (Basic) as adjusted 11.60
Earning per share (Diluted) as reported 12.55
Earning per share (Diluted) as adjusted 11.48

17Mobility, Connectivity, Dependability
The variables used for calculating the Fair Values and their rationale is as follows:
A. Stock Price:
The stock price of the Company is the closing price of the Company's equity share on the NSE on the day prior to thedate of grant
Under the ESOP Scheme of the Company one option entitles an employee to one equity share of the Company.
B. Volatility:
Volatility is a measure of the amount by which a price has fluctuated or is expected to fluctuate during a period.The measure of volatility used in the Black-Scholes option-pricing model is the annualized standard deviation of thecontinuously compounded rates of return on the stock over a period of time.
The period to be considered for volatility has to be adequate to represent a consistent trend in the price movements.It is also important that movements due to abnormal events get evened out.
There is no research that demonstrates conclusively how long the historical period used to estimate expected long-term future volatility should be.
The entity's stocks have been publicly traded from February 15, 2007 on NSE & BSE. This does not provide adequatehistorical data for the calculation of historical volatility. However, the Guidance note on Accounting for EmployeeShare-based Payments issued by the Institute of Chartered Accountants of India states that if a newly listed enterprisedoes not have sufficient information on historical volatility, it should nevertheless compute historical volatility for thelongest period for which trading activity is available. Accordingly, we have considered the volatility from February 15,2007 to the date of grant on NSE for the fair value computation.
The Fair value of an option is very sensitive to this variable. Higher the volatility, higher is the Fair value. The rationalebeing, the more volatile a stock is, the more is its potential to go up (or come down), and the more is the probabilityto gain from the movement in the price. Accordingly, an option to buy a highly volatile stock is more valuable than theone to buy a less volatile stock, for the probability of gaining is lesser in the latter case.
C. Risk free interest rate :
The risk-free interest rate being considered for the calculation is the interest rate applicable for maturity equal to theexpected life of the options based on the zero-coupon yield curve for Government Securities.
D. Exercise Price:
We have considered the exercise price as per the information provided by the Company.
E. Time to Maturity/Expected Life of options:
Time to Maturity / Expected Life of options is the period for which the Company expects the options to be live. Theminimum life of a stock option is the minimum period before which the options cannot be exercised and the maximum
E. Weighted average exercise a. Exercise price equals market price 165.00prices of options whose b. Exercise price is greater than market price Nil
c. Exercise price is less than market price NilWeighted average fair value a. Exercise price equals market price 79.82of options whose b. Exercise price is greater than market price Nil
c. Exercise price is less than market price NilF. Method and Assumptions used to estimate the fair value of options granted during the year:
The fair value has been calculated using the Black Scholes Option Pricing modelThe Assumptions used in the model are as follows:
Date of grant 22-May-091. Risk Free Interest Rate 6.21%2. Expected Life 4.253. Expected Volatility 60%4. Dividend Yield 1.46%5. Price of the underlying share in the market at the time of the option grant (Rs.) 197.50
18 Annual Report 2009 - 2010
life is the period after which the options cannot be exercised.
According to SEBI Guidelines, the expected life of an award of stock options shall take into account the followingfactors -i. The expected life must at least include the vesting period.ii. The average lengths of time of similar grants have remained outstanding in the past. If the company does not
have a sufficiently long history of stock option grants, the experience of an appropriately comparable peer groupmay be taken into consideration.
iii. The expected life of stock options should not be less than half of the exercise period of the stock options issueduntil and unless the same is supported by historical evidences with respect to stock options issued by thecompany earlier.
The fair value of each award has been determined based on different expected lives of the options that vest eachyear, as if the award were several separate awards, each with a different vesting date. A weighted average of 3vests has been calculated to arrive at the value of the options granted.
The time to maturity has been estimated as illustrated by the following example. In case of the grant made May22, 2009 the earliest date of exercise is one year from the date of grant that is May 22, 2010. Hence, the minimumlife of the option is 1 year. The exercise period is five years from the date of vest as per the ESOP scheme; hencethe maximum life is 6 years (1 year of vesting period + 5 years of exercise period). The expected life is the averageof minimum and maximum life, i.e. 3.5 years [(1 + 6)/2]. The time to maturity for the remaining vests has beencalculated in a similar manner.
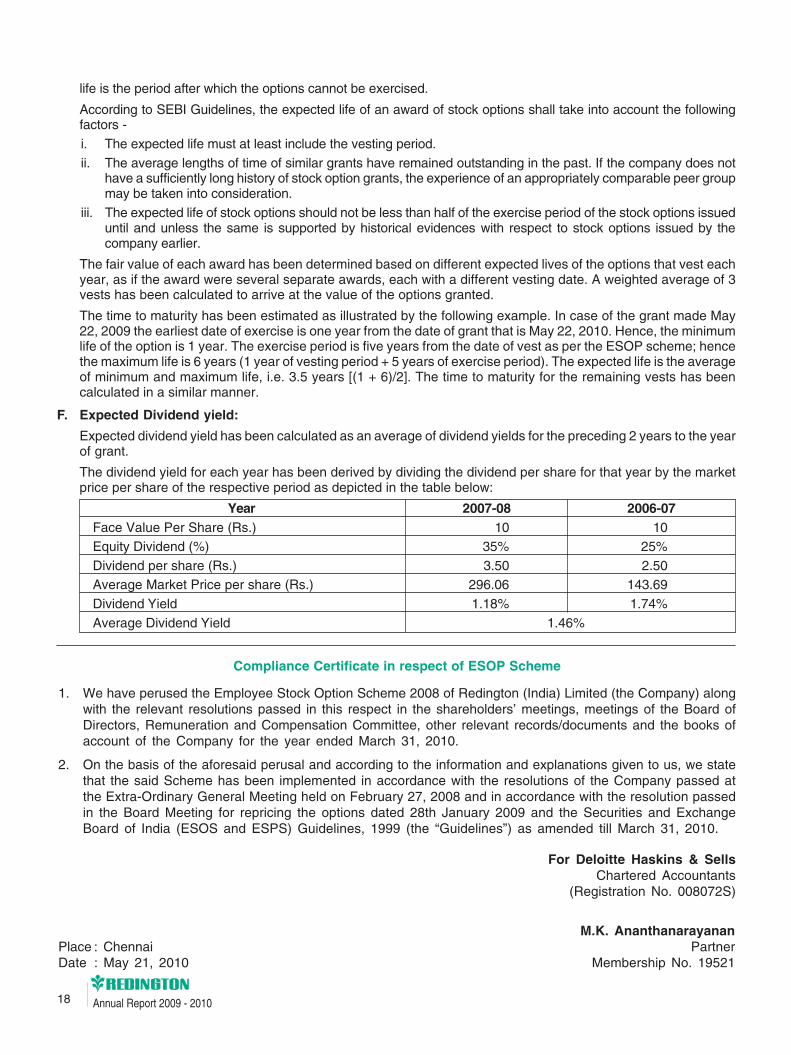
F. Expected Dividend yield:
Expected dividend yield has been calculated as an average of dividend yields for the preceding 2 years to the yearof grant.
The dividend yield for each year has been derived by dividing the dividend per share for that year by the marketprice per share of the respective period as depicted in the table below:
Year 2007-08 2006-07Face Value Per Share (Rs.) 10 10Equity Dividend (%) 35% 25%Dividend per share (Rs.) 3.50 2.50Average Market Price per share (Rs.) 296.06 143.69Dividend Yield 1.18% 1.74%Average Dividend Yield 1.46%
Compliance Certificate in respect of ESOP Scheme
1. We have perused the Employee Stock Option Scheme 2008 of Redington (India) Limited (the Company) alongwith the relevant resolutions passed in this respect in the shareholders’ meetings, meetings of the Board ofDirectors, Remuneration and Compensation Committee, other relevant records/documents and the books ofaccount of the Company for the year ended March 31, 2010.
2. On the basis of the aforesaid perusal and according to the information and explanations given to us, we statethat the said Scheme has been implemented in accordance with the resolutions of the Company passed atthe Extra-Ordinary General Meeting held on February 27, 2008 and in accordance with the resolution passedin the Board Meeting for repricing the options dated 28th January 2009 and the Securities and ExchangeBoard of India (ESOS and ESPS) Guidelines, 1999 (the “Guidelines”) as amended till March 31, 2010.
For Deloitte Haskins & SellsChartered Accountants
(Registration No. 008072S)
M.K. AnanthanarayananPlace : Chennai PartnerDate : May 21, 2010 Membership No. 19521

19Mobility, Connectivity, Dependability
A key addition to our Vendor bouquet last
fiscal was Dell in the Middle East (ME),
who were seeking a change from their
`All Direct’ Business model. Partnering
Dell not only added significant revenue
during the difficult year, but is likely to
play a significant strategic role in future
too. Our strong presence in ME retail
space made the tie up possible.
FOCUSING ON MORE VENDOR ADDITIONS

20 Annual Report 2009 - 2010
Table 1: Composition of the Board of Directors
*Directorship Committees of No. of BoardWhether
in other public other Indian Public MeetingsAttendedName Category
Companies Companies. during 2009-10last AGMMembership Chairmanship Held Attended
Prof. J. Ramachandran Non- Executive Chairman, 7 4 3 6 5 YesIndependent Director
Mr. R. Jayachandran Non- Executive Director 1 Nil Nil 6 3 Yes
Mr. Huang Chi Cheng** Non- Executive Director Nil Nil Nil 6 1 No
Mr. Tu, Shu - Chyuan** Non- Executive Director Nil Nil Nil 6 4 Yes
Mr. Steven A Pinto Independent Director Nil Nil Nil 6 4# Yes
Mr. William Adamopoulos Independent Director Nil Nil Nil 6 3# Yes
Mr. N. Srinivasan Independent Director 14 5 4 6 5 Yes
Mr. R. Srinivasan Managing Director 1 1 Nil 6 6 Yes
Mr. Raj Shankar Deputy Managing Director 1 1 Nil 6 4 Yes
Mr. M. Raghunandan Whole- Time Director 2 Nil Nil 6 6 Yes
* Private companies, foreign bodies corporate and companies under Section 25 of the Companies Act, 1956 are excluded in computingthe Directorships. Only Audit Committee and Investors and Shareholder's Grievance Committee are considered for the purpose ofCommittee positions as per listing agreement.
** Representing Synnex Limited.# Mr. William Adamopoulos attended through tele conferencing for the meeting held on 31st October 2009 and 25th January, 2010.
Mr. Steven A. Pinto attended through tele conferencing on 25th January, 2010.
REPORT ON CORPORATE GOVERNANCE1. REDINGTON'S PHILOSOPHY ON CORPORATE GOVERNANCE
Your Company firmly believes that continuous enhancement of stakeholders’ wealth can be accomplished only byadhering to high quality governance practices. Redington’s policies and plans are framed based on conductingbusiness ethically in all spheres of its operation. The practices are well executed by best expertise on the Boardand it enables the business to be more effective and consistent. The well defined ethical standard results inimprovement of the human resources, identification of potential risks and method to mitigate the same.
2. BOARD OF DIRECTORS :
Company's management team is effectively structured to achieve long term strategic objectives. The Company'sdirectors have expertise in the field of Business planning, strategy, human resources management and finance.The designation of board includes Managing, Whole- time, Executive, Non- Executive Director and IndependentDirectors. The Board consists of ten members and the Chairman of the Board is an independent Director.
The Chairman of the Board being a Non - Executive Independent Director, the composition of the Board isoptimally structured with 1/3rd of Independent Directors. None of your Directors is a member in more than 10committees or Chairman of more than five committees. None of the Non - Executive Directors has any materialrelationship with the company.
During the Financial Year 2009-10, the Board met six times on April 11, 2009, May 22, 2009, July 24, 2009,October 31, 2009, December 12, 2009 and January 25, 2010. The gap between two Board meetings did notexceed 4 months as stipulated in Companies Act, 1956. The maximum interval between two board meetings waswell within the prescribed limits of Clause 49. The Board has unfettered right to obtain and access to any informationwithin the company and to any of the Company's employees. As a practice of good Corporate Governance theBoard discussed about the issues pertaining to the Company's business prospects and other significant issuesoccurred during the year.

21Mobility, Connectivity, Dependability
3. AUDIT COMMITTEE :
The Chairman of the Committee is an Independent Director and the majority of the committee members areindependent directors. The Chairman of our Audit committee has the accounting and financial managementexpertise. The core objective of our Audit committee includes
• Reviewing the Company's financial reporting process and disclosure of financial information.
• Periodical interaction with Internal and External auditors
• Reviewing the scope of the internal audit plan, procedures, adequacy of the internal audit functions anddiscussions with auditors in relation to the adequacy of internal control systems.
• Recommending appointment of statutory auditors for the company and fixing their remuneration
• Review of related party transactions
• Ensuring compliance as per Listing Agreement with respect to financial reporting process.
• Reviewing the Company's risk management and financial policies.
• Reviewing accounting policies and accounting standards applicable to the Company and ensuring compliancein accordance with the requirement of the Companies Act, 1956.
The dates on which the audit committee met were May 20, 2009, July 24, 2009, October 31, 2009 and January 25, 2010.
Table2: Attendance record of Audit Committee:
S.No Name of the Director Category Position No. of meetings
Held Attended
1 Mr. N. Srinivasan Independent Director Chairman 4 4
2 Prof. J. Ramachandran Independent Director Member 4 4
3 Mr. Steven A. Pinto Independent Director Member 4 3 #
4 Mr. Raj Shankar Deputy Managing Director Member 4 4
# Mr. Steven A. Pinto attended the meeting held on 25th January, 2010 through tele conferencing. The ManagingDirector, Chief Financial Officer, Statutory Auditors and Internal Auditors are regularly invited to attend the AuditCommittee meetings.
Mr. M. Muthukumarasamy acted as Secretary of this Committee as well.
4. SHAREHOLDERS'/ INVESTORS' GRIEVANCE COMMITTEE:
The Chairman of the committee is an independent director. The role of this committee is to address investor'scomplaints pertaining to non receipt of annual reports, Dividend payments etc.
The dates on which our committee met were
May 20, 2009, July 24, 2009, October 31, 2009 and January 25, 2010.
Table3: Attendance record of Shareholders’/Investors’ Grievance Committee:
S.No Name of the Director Category Position No. of meetingsHeld Attended
1 Prof. J. Ramachandran Independent Director Chairman 4 4
2 Mr. R. Srinivasan Managing Director Member 4 4
3 Mr. M. Raghunandan Whole time Director Member 4 4

22 Annual Report 2009 - 2010
Table 6: Details of remuneration paid/ payable to Directors from the period 1st April 2009 to 31st March, 2010.
Salary & Commission Performance Sitting Fees OptionsName of Director Perquisites (Rs./Lacs) Linked Bonus (Rs./Lacs) granted
(Rs. /Lacs) (Rs./Lacs) (Nos)
Prof. J. Ramachandran - 10.10 - 2.40 25,000
Mr. R. Jayachandran - - - - -
Mr. Huang Chi Cheng - - - - -
Mr. Tu, Shu-Chyuan - - - - -
Mr. Steven A Pinto - 11.00 - 1.50 25,000
Mr. William P Adamopoulos - 12.05 - 0.45 25,000
Mr. N. Srinivasan - 10.60 - 1.90 25,000
Mr. R. Srinivasan - - - - 1,00,000
Mr. Raj Shankar - - - - 1,00,000
Mr. M. Raghunandan 23.06 - 16.00 - 76,143
Total 23.06 43.75 16.00 6.25 3,76,143
The investors related complaints and their redressal have been provided in the table 4 given below.
Table 4: Complaints status
S.No Nature of complaint Received Addressed Pending
1 Non receipt of dividend warrants. 3 3 0
2 Non receipt of refund order 1 1 0
TOTAL 4 4 0
Mr. M.Muthukumarasamy, Company Secretary is the Compliance Officer.
5. REMUNERATION COMMITTEE :
The remuneration committee has been constituted with four directors with the Chairman and another Director beingan Independent Director. The dates on which the committee met were 22.05.2009, 24.07.2009 and 20.03.2010.
Some of the items discussed by the Committee are given below
• Payment of performance linked Bonus to Whole-time Director.
• Payment of fees for Independent Directors for attending the meeting of the Board
• In addition to payment of sitting fees, Non- executive Independent Directors are remunerated by way of commissionupto a limit of one percent of the net profits of the Company subject to such lower limit as may be determined bythe Board from time to time.
• Reviewing the remuneration of the Senior Management team.
Table 5: Attendance record of Remuneration Committee:
S.No Name of the Director Category Position No. of meetingsHeld Attended
1 Mr. Steven A. Pinto Independent Director Chairman 3 3
2 Mr. N. Srinivasan Independent Director Member 3 2
3 Mr. R. Srinivasan Managing Director Member 3 3
4 Mr. M. Raghunandan Whole-time Director Member 3 3
23Mobility, Connectivity, Dependability
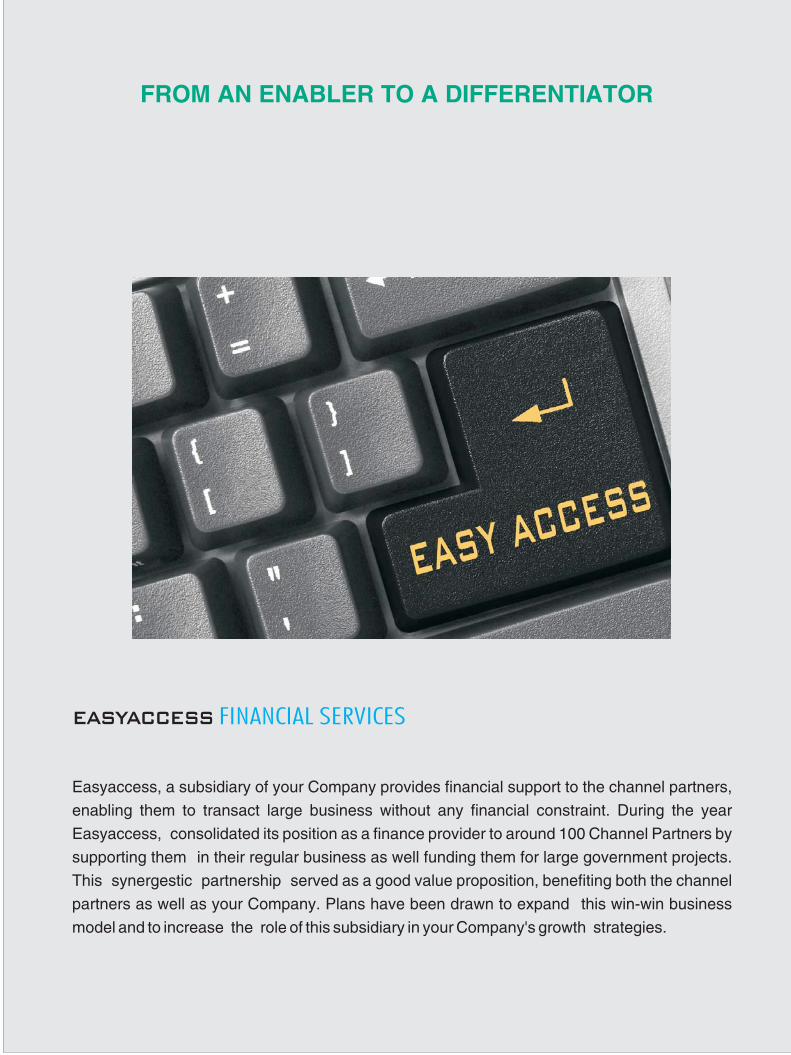
Easyaccess, a subsidiary of your Company provides financial support to the channel partners,
enabling them to transact large business without any financial constraint. During the year
Easyaccess, consolidated its position as a finance provider to around 100 Channel Partners by
supporting them in their regular business as well funding them for large government projects.
This synergestic partnership served as a good value proposition, benefiting both the channel
partners as well as your Company. Plans have been drawn to expand this win-win business
model and to increase the role of this subsidiary in your Company's growth strategies.
EASYACCESS FINANCIAL SERVICES
FROM AN ENABLER TO A DIFFERENTIATOR

24 Annual Report 2009 - 2010
Table 7: Shareholding of Directors in the Company as on March 31, 2010
Sl. No. Name of the Director Category No. of Shares % to Equity capital
1 Prof. J. Ramachandran Independent Director 12,500 0.0158
2 Mr. Steven A Pinto Independent Director 18,750 0.0238
3 Mr. Raj Shankar Deputy Managing Director 2,87,018 0.3649
4 Mr. M. Raghunandan Whole time Director 70,010 0.0890
6. CODE OF BUSINESS CONDUCT AND ETHICS FOR DIRECTORS AND SENIOR MANAGEMENT:
Your Company has laid down a code of conduct for all Board members and senior management of the companywith an aim to ensure effective and best business practices and strict adherence to the legal requirements as well.The code of conduct has been posted on the Company's website www. redingtonindia.com.
The Board members and the Senior Management personnel affirmed compliance with the code on an annualbasis. A declaration to this effect has been given by the Managing Director as below:
I hereby confirm that the company has obtained affirmation from all the members of the Board andSenior Management that they have complied with the Code of Business Conduct and Ethics for Directorsand Senior Management in respect of the financial year 2009-10.
R. SrinivasanManaging Director
7. GENERAL BODY MEETINGS:
Location and time of last 3 Annual General Meetings:
Year Location Date Day Time
2008-2009 Narada Gana Sabha, Mini Hall, No.314,T.T.K Road, Chennai -600 018. July 24, 2009 Friday 02.00 P.M.
2007-2008 Narada Gana Sabha, Mini Hall, No.314,T.T.K Road, Chennai -600 018. July 26, 2008 Saturday 11.00 A.M.
2006-2007 Narada Gana Sabha, Mini Hall, No.314,T.T.K Road, Chennai -600 018. July 26, 2007 Thursday 10.00 A.M.
No extra-ordinary General Meetings were convened during the last financial year.No resolutions were passed through Postal Ballot last financial year.
Table 8: Details of Special Resolutions passed in the last three Annual General Meeting.
Year Special resolutions passed
2008-2009 Approval to amend the clause 6.1, 15 and 21.1 of the Employee Share Purchase Scheme as givenbelow :
6.1 The company shall issue / allot a maximum of 15,52,500 shares under this scheme. In addition tothe aforementioned shares, the Trust is entitled to purchase from the open market and transfer to theemployees such number of equity shares of the Company as may be determined by the Board/Compensation Committee from time to time.
15 WITHHOLDING FRINGE BENEFIT TAX
All shares issued under the Scheme shall be subject to any applicable taxes (including withholding taxand Fringe Benefit Tax)
21.1 The scheme shall continue to be in effect for a period of 72 months from the "Effective Date" orfrom the date of approval of variations to the Scheme, if any, unless terminated by the Company or theGroup.

25Mobility, Connectivity, Dependability
2007-2008 Approval for varying cost estimates as contained in the 'Object of the Issue' clause of the Prospectusdated January 31, 2007, to meet the additional fund requirements/expenditure incurred/ to be incurreddue to escalation in the cost for setting up of Automated Distribution Centres (ADCs) at Chennai,Mumbai, New Delhi and Kolkata including land, construction and expenditure incurred/ to be incurred forprocurement of warehouse management software, material handling equipments from internal accrualsand temporary borrowings.
2006-2007 Approval for payment of commission to the Non- Executive Directors of the Company.
Approval to keep the Register of Members, Indices, Returns and Copies of certificates at the office ofRegistrar and Share Transfer Agents of the Company, M/s. Cameo Corporate Services Limited at'Subramanian Building', No.1 Club House Road, Chennai - 600 002.
Approval for the application and utilization of funds earmarked for specific purposes as stated in prospectusdated January 31, 2007 to the extent not required immediately, by way of investing in high qualityinterest/ dividend bearing liquid instruments and for managing the working capital requirements.
8. SUBSIDIARY COMPANIES:
Easyaccess Financial Services Limited is a material non-listed Indian Subsidiary as per clause 49 of the ListingAgreement. Prof. J. Ramachandran, Independent Director, of our company is appointed as an Independent Directoron the Board of Easyaccess Financial Services Limited with effect from 21st May 2010.
9. DISCLOSURES :
RELATED PARTY TRANSACTIONS:
There were no material related party transactions during the year 2009-10 that are prejudicial to the interest of thecompany.
RISK MANAGEMENT
Our approach to risk management is to optimize the risk reward balance by building competence and leverage theopportunity. Risk management incorporates an integrated group-wide approach to identify, assess measure, manage,and monitor the risks to which our businesses are exposed. We have a well-defined business contingency plan anddisaster recovery plan to address these unforeseen events and minimize the impact on services delivered in Indiaor abroad. A write-up on the above has been given in the Management and Discussion Analysis Report.
PROCEEDS FROM PUBLIC ISSUE
The funds pending utilization have been utilized for the purpose mentioned in the prospectus. The Audit Committee/Board is updated at regular intervals on the utilization of the IPO proceeds. The Company is approaching theshareholders for approving extended time by two more years to fully deploy the proceeds of the issue
NON-COMPLIANCE BY THE COMPANY, PENALTIES, STRICTURES:
The Company has complied with the requirements of the Stock Exchange/ SEBI/ any Statutory Authority on allmatters related to capital markets wherever applicable, during the last four years. There are no penalties or stricturesimposed on the Company by Stock Exchange or SEBI or any Statutory Authorities relating to the above.
APPOINTMENT / RE-APPOINTMENT OF DIRECTORS
Prof J. Ramachandran and Mr. William Adamopoulos, Directors of the Company, are liable to retire by rotation andbeing eligible have offered themselves for re-appointment. Notices have been received from the members of thecompany proposing their re-appointment as the Directors liable to retire by rotation.

26 Annual Report 2009 - 2010
The details of Directors seeking re-appointment at the forthcoming Annual General Meeting are provided intable No.9:
Table 9: Brief Resume of Directors seeking Re-appointment
Name of the Director Prof. J. Ramachandran
Brief resume of the Director J. Ramachandran is BOC Chair Professor of Business Policy at the Indian Instituteof Management Bangalore. His major research interest is in the area ofinternationalization of firms from emerging economies. He also pursues researchin the area of cultural and creative industries. Recent recognition for his workinclude the IIMB-Tata Steel Award for the Best Case Study in Corporate SocialResponsibility, Best Case Awards from the Association of Indian ManagementSchools and the Central and East European Management DevelopmentAssociation, Best Proposal Runner up award from the Strategic ManagementSociety at the India Special Conference and the Academy of Management BestPaper Proceedings. India's leading business publications Business World andBusiness Today have cited him as a Star Teacher. A qualified CharteredAccountant, Cost Accountant and a Fellow of the Indian Institute of ManagementAhmedabad, Professor Ramachandran has been the Harry Reynolds VisitingInternational Professor at the Wharton School of the University of Pennsylvania;and a Visiting Professor at INSEAD, Fontainebleau, France and the CarlsonSchool of Management, University of Minnesota, USA. Professor Ramachandranis a former member of the Board of Governors of the Indian Institute of ManagementBangalore.
Expertise in Specific Functional Area 1. Strategic management; International Business
Directorship in Indian Public Limited 1. Reliance Communications Limited
Companies other than Redington 2. Reliance Communication and Infrastructure Limited
(India) Limited 3. Sasken Communication Technologies Limited
4. Bhoruka Power Corporation Limited
5. Indofil Organic Industries Limited
6. Infotech Enterprises Limited
7. Tejas Network India Limited
Membership of Committees inPublic Limited Companies
1. Audit Committee 1. Reliance Communications Limited
2. Sasken Communication Technologies Limited
3. Infotech Enterprises Limited
4. Reliance Communication and Infrastructure Limited
5. Tejas Network India Limited
2. Shareholders/InvestorsGrievance Committee Reliance Communications Limited

27Mobility, Connectivity, Dependability
The state-of-the-art, Automated DistributionCentre at Chennai in operation since last year.
The , Automated Distribution Centre atJebel Ali Free Zone, Dubai - construction in progress.
state-of-the-art
EXCELLENCE IN WAREHOUSING

28 Annual Report 2009 - 2010
11. COMPLIANCE WITH THE NON-MANDATORY REQUIREMENTS
The company has the following non- mandatory committee:-
Remuneration Committee
The company has set up Remuneration Committee and the detailed particulars are furnished in Para 5.
The company would implement other non- mandatory requirements in due course as and when required and/ ordeemed necessary by the Board.
12. MEANS OF COMMUNICATION:
We have established procedures to disseminate, in a planned manner, relevant information to our shareholders,analysts, employees and the society at large.
A. The quarterly, half yearly and annual results are published in Business Standard and Makkal Kural whichare national and local dailies.
B. The quarterly, half yearly and annual results and shareholding pattern are also posted on the website of thecompany (www.redingtonindia.com) and on Electronic Data Interpretation Filing and Retrieval System(EDIFAR) at www.sebiedifar.nic.in.
C. The Company also intimates the Stock Exchanges all price sensitive information and such other matterswhich in its opinion are Material and of relevance to the investors/ shareholders.
D. The Management Discussion and Analysis on financial and operational performance of the company is providedin the Annual Report.
The company has designated '[email protected]' as an email id for the purpose of registering complaintsby investors and displayed the same on the company's website.
Name of the Director Mr. William Adamopoulos
Brief resume of the Director William Adamopoulos serves as President and Publisher, Forbes Asia. He isresponsible for all Forbes Media LLC business interests in Asia Pacific and theMiddle East, including Forbes Asia, local partnerships Forbes India, ForbesChina, Forbes Korea and Forbes Indonesia, Forbes.com and the annual ForbesGlobal CEO Conference.
Prior to establishing an Asian headquarters for Forbes in 1999, Adamopouloswas the publisher and Managing Director of the Asian Wall Street Journal, andthe President of Dow Jones Publishing Company (Asia).
A 1984 graduate of Harvard College where he studied economics, Adamopoulosis based in Singapore.
Expertise in Specific Functional Area Financial analysis and appraisal
Directorship in Indian Public limitedCompanies other than Redington(India ) Limited NIL
Membership of Committees inIndian Public Limited Companies NIL

29Mobility, Connectivity, Dependability
13. GENERAL SHAREHOLDERS' INFORMATION :
I. Annual General Meeting.
Date : Tuesday, July 20, 2010
Time : 10.00 A.M.
Venue : Narada Gana Sabha, No. 314 (Old No. 254), T.T.K. Road, Chennai - 600 018.
II. Financial Calendar : 1st April to 31st March
III. Date of Book Closure : July 14, 2010 to July 20, 2010
IV. Dividend payment date : Within 30 days from the date of declaration
V. Listing on Stock Exchanges :
Name Address Scrip/Stock code
National Stock Exchange of Exchange Plaza, 5th Floor,India Limited Plot No.c/1, G Block,
Bandra Kurla Complex,Bandra (E), Mumbai - 400 051. REDINGTON
Bombay Stock Exchange Phirooze Jeejeebhoy Towers,Limited Dalal Street, Fort,
Mumbai - 400 001. 532805
VI. Depositories (Stock Code) : INE891D01018
VII. Registrar and Share Transfer : M/s. Cameo Corporate Services Limited,Agents Subramanian Building,
No.1, Club House Road,Chennai 600 002.Phone No: +91 44 2846 0390 (5 lines)Fax No : + 91 44 2846 0129.Email : [email protected]
Website : www.cameoindia.com
VIII. Share Transfer System:
Share Transfer Committee:
Share Transfer Committee has been reconstituted with three directors with the Chairman being anIndependent Director.
S.No Name of the Director Category Position
1 Mr. N. Srinivasan Independent Director Chairman
2 Mr. R. Srinivasan Managing Director Member
3 Mr. M. Raghunandan Whole time Director Member
The share transfer committee registers the shares sent for transfers in physical form provided the documentsare complete and valid in all respects within a period of 15 days from the date of receipt of such documents.The committee meets at regular intervals to issue duplicate share certificates, transmission of shares andother related complaints.

30 Annual Report 2009 - 2010
Redington @ NSE Nifty Rebased450400350300250200150100500
Apr -0
9
May
-09
Jun-
09
Jul -
09
Aug-0
9
Sept -
09
Oct -0
9
Nov-0
9
Dec-0
9
Jan
-10
Feb -1
0
Mar
-10
NSE BSES. No Month
High Low Close High Low Close
1 Apr - 09 144.40 108.50 134.35 141.95 110.10 134.10
2 May - 09 236.95 133.75 230.85 236.65 133.60 230.25
3 Jun - 09 273.60 221.15 243.00 272.90 222.05 238.00
4 Jul - 09 238.80 206.15 210.90 236.10 204.85 210.45
5 Aug - 09 237.15 209.60 229.20 238.45 209.40 230.05
6 Sep - 09 271.15 232.70 263.50 263.25 232.90 262.00
7 Oct - 09 281.65 245.10 278.15 282.05 245.00 280.50
8 Nov - 09 316.70 256.45 296.90 316.75 257.10 297.30
9 Dec - 09 316.00 289.95 312.65 315.40 288.85 310.35
10 Jan - 10 338.00 296.55 301.75 341.75 296.20 300.85
11 Feb - 10 308.65 290.22 296.30 308.15 290.00 295.10
12 Mar - 10 378.00 296.00 371.80 377.90 295.65 371.20
IX. Secretarial Audit:
The secretarial audit for reconciling the total admitted capital with NSDL and CDSL and the total issued andlisted capital for each of the quarter in the Financial year ended March 31, 2010 was carried out.The Audit Report confirms that the total issued/ paid up share capital is in agreement with the total numberof shares in physical and dematerialised form.
X. MARKET PRICE DATA:

31Mobility, Connectivity, Dependability
Certification Body of TUV SUO Management Service GmbH has awarded ISO 9001:2008 certification to
your Company for providing Support Services for Computers, Computer Peripherals, Mobile Phones,
Network Products, IT Infrastructure Management and Call Center Management Services. Trading of IT
Accessories, Providing Warehousing and Logistics Services for IT Customer.
COMMITTED TO QUALITY

32 Annual Report 2009 - 2010
XI. DISTRIBUTION OF SHAREHOLDING AS ON MARCH 31, 2010.
Share No. of % of total No. of % ofHolding Shareholders Shareholders Shares total
1-500 10960 94.30 7,51,880 0.96
501-1000 284 2.44 2,27,241 0.29
1001-2000 146 1.26 2,14,599 0.27
2001-3000 58 0.50 1,45,509 0.19
3001-4000 36 0.31 1,23,792 0.16
4001-5000 29 0.25 1,35,628 0.17
5001-10000 38 0.33 2,86,203 0.36
10001 & Above 72 0.62 7,67,51,114 97.60
Total 11623 100.00 7,86,35,966 100.00
Redington @ BSE Sensex Rebased
400
350
300
250
200
150
100
50
0
Apr -0
9
May
-09
Jun-
09
Jul -
09
Aug-0
9
Sept -
09
Oct -0
9
Nov-0
9
Dec-0
9
Jan
-10
Feb -1
0
Mar
-10
XII. STATEMENT SHOWING SHAREHOLDING PATTERN AS ON MARCH 31, 2010.
Category No. of holders No. of shares % of shareholding
Promoter Holding
Foreign bodies corporate 1 33901595 43.11
Total of Promoter Holding 1 33901595 43.11
Non promoter holding
Mutual funds/ UTI 12 2961620 3.77
Financial Institutions/ Banks 1 50 0.00
Foreign Institutional Investors 42 14407142 18.32
Non Institutions
Bodies Corporate 262 2852768 3.63
Indian Public 10523 1712494 2.18
NRI/OCB/ Foreign Nationals 233 22416307 28.51
Others 549 383990 0.49
Total of Non promoter Holding 11622 44734371 56.89
Grand Total 11623 78635966 100.00

33Mobility, Connectivity, Dependability
29% 0%43%
2%
4% 18% 4%
Promoter MFs/UTI FIIs
Bodies Corporate Indian Public NRI/OCB/FNs
Others
XIII. DEMATERIALISATION OF SHARES AND LIQUIDITY
The shares of the company are compulsorily traded in dematerialised form by all categories of investors.As on March 31, 2010, 71.83 % shares of the Company are held in dematerialised form.
XIV. ECS MANDATE:
In order to enable us to serve our investors better, we request shareholders to update their bank accounts withtheir respective depository participants.
XV. ADR/GDRs
There are no outstanding GDRs/ ADRs/ Warrants or any convertible instruments.
XVI. WAREHOUSE LOCATIONS:
Our company has the following distribution offices, warehouses and services centres both in India andoverseas.
Particulars IndiaOverseas operations
(through its subsidiary companies)
Sales Offices 53 15
Warehouses 62 16
Service Centres 48 20
XVII.ADDRESS FOR CORRESPONDENCE:
The shareholders may address their communication/ suggestions/ grievances/ queries to the Registrarand Share Transfer Agents at their address mentioned in earlier para VII. or to-
The Company SecretaryRedington (India) LimitedSPL SRIRAM NIVASNo. 38 Venkatakrishna Road,Mandaveli, Chennai - 600 028.Tel. No.: 91 44 3918 1300Fax : 91 44 3918 1333Email : [email protected]
The company has its website namely www.redingtonindia.com. The website provides detailed informationabout the Company, its products and service offered, locations of its corporate offices and various salesoffices etc. The quarterly results, annual reports and shareholding patterns are updated on the website ofthe Company.
SHAREHOLDING PATTERN

34 Annual Report 2009 - 2010
CERTIFICATE UNDER SUB CLAUSE V OF CLAUSE 49 OF LISTING AGREEMENT
We, R. Srinivasan, Managing Director and S.V. Krishnan, Chief Financial Officer of the Company hereby confirmand certify that
a. we have reviewed financial results for the year ended March 31, 2010 and that to the best of our knowledgeand belief :
i. these statements do not contain any materially untrue statement or omit any material fact or containstatements that might be misleading;
ii. these statements together present a true and fair view of the company’s affairs and are in compliancewith existing accounting standards, applicable laws and regulations.
b. There are, to the best of our knowledge and belief, no transactions entered into by the company duringthe period which are fraudulent, illegal or violative of the company’s code of conduct.
c. We accept responsibility for establishing and maintaining internal controls for financial reporting and thatwe have evaluated the effectiveness of internal control systems of the company pertaining to financial reportingand we have disclosed to the auditors and the Audit Committee, deficiencies in the design or operationof such internal controls, if any, of which we are aware and the steps we have taken or propose to taketo rectify these deficiencies.
d. We have indicated to the auditors and the Audit committee
i. that no significant changes in internal control over financial reporting during the period;
ii. that changes in accounting policies during the period have been disclosed in the notes to the financialstatements; and
iii. that no instances of significant fraud of which we have become aware and the involvement therein,if any, of the management or an employee having a significant role in the company’s internal controlsystem over financial reporting.
Place : Chennai R. Srinivasan S.V. KrishnanDate : May 21, 2010 Managing Director Chief Financial Officer
AUDITOR’S CERTIFICATE ON CORPORATE GOVERNANCETo the Members of Redington (India) Limited
We have examined the compliance of conditions of corporate governance by Redington (India) Limited, for the yearended on 31st March 2010 as stipulated in Clause 49 of the Listing Agreement of the said company with stockexchanges.
The compliance of conditions of corporate governance is the responsibility of the management. Our examination waslimited to a review of procedures and implementation thereof, adopted by the company for ensuring the compliance ofthe conditions of Corporate Governance as stipulated in the said clause. It is neither an audit nor an expression ofopinion on the financial statements of the company.
In our opinion and to the best of our information and according to the explanations given to us by the Directors and theManagement, we certify that the company has complied with the conditions of Corporate Governance as stipulated inClause 49 of the above mentioned Listing Agreement.
We state that no investor grievance is pending against the Company as at March 31, 2010 as per the recordsmaintained by the Shareholder / Investors Grievance Committee.
We further state that such compliance is neither an assurance as to the future viability of the Company nor of theefficiency or effectiveness with which the management has conducted the affairs of the Company.
For Deloitte Haskins & SellsChartered Accountants
(Registration Number: 008072S)
M.K. AnanthanarayananPlace : Chennai PartnerDate : May 21, 2010 Membership No. 19521

35Mobility, Connectivity, Dependability
MANAGEMENT DISCUSSION AND ANALYSIS
GLOBAL ECONOMIC OUTLOOK
The impact of economic slowdown seems to be vanishing in the emerging economies. In most advanced economies,the recovery remained sluggish by past standards, whereas in many emerging and developing economies, it wasrelatively vigorous. Global production and trade which was declining in the first half of the year bounced back in thesecond half of the year. The prediction of United Nations regarding the rise in global economic growth by 2.4% is agood indication. If the growth of the world economies continues at this pace, it would spur the demand.
The Global Information Technology Report 2009-10(GITR) highlighted the key role of Information and CommunicationTechnology (ICT) as an enabler of a more economically, environmentally and socially sustainable world in the aftermathof one of the most serious economic crises in decades. It is also stated that many countries would be successful byleveraging ICT and taking full advantage of ICT advances to enhance overall competitiveness. GITR has raisedIndia's Ranking from 54th to 43rd for its preparedness to effectively use ICT for different purposes like generalbusiness, regulatory and infrastructure environment.
INDIAN LANDSCAPE
The impact of global crisis has been felt by the world nations differently and at varying degree. While this cloudedIndia's growth pace, the Country was able to achieve positive GDP growth more than what was predicted at thebeginning. Indian economy is expected to grow faster in the next fiscal. The Centre for Monitoring Indian Economy(CMIE) expects India's GDP growth to accelerate to 9.2% in 2010 - 11.
In a year that witnessed postponement in spending decisions by consumers, the Government sector in India providedthe much-needed fillip to the IT industry's growth. Not only did the government spending on ICT products and solutionshelp the market demand, the stimulus programs from the Government during the year facilitated shoring up demandacross all industries.
IDC expects this trend to continue in 2010 as well with large e-governance projects to be awarded and implemented inmany States (provinces) as well as by several Central (federal) government ministries. Some of the projects on the anvilinclude the Accelerated Power Development and Reforms Programme (APDRP), the e-District and State Data Centre(SDC) projects and those proposed by the Ministries of Posts, Railways and Defence. All these projects are expected toinvolve huge spending on ICT solutions in 2010. The 29 State Governments across India are cumulatively estimated tohave spent more than INR 37,000 million (nearly US$ 820 million) in 2009 on IT products alone. IDC expects this figureto grow by more than 11% in 2010. Thirty Central Government ministries on the other hand presented an opportunity ofINR 36,000 million (nearly US$ 800 million) in 2009, which is forecast to grow by 14% in 2010.
The year 2010 would be a transitional year for IT deployments in Indian Public sector and Government Departmentswith the focus shifting to automation of the back-end processes. This is largely guided by the realization that front-enddelivery mechanisms alone is not sufficient till the back-end infrastructure and organisational capacities are built toserve the common man better. The automation/digitization is expected to give a boost to adoption of DocumentManagement Services (DMS) and digital imaging technologies by government departments. Scanning of documents,be it for internal archival/storage or for the delivery of statutory certificates to citizens, is going to be one of the keythrust areas in 2010.
NATURE OF BUSINESS
Your Company along with its subsidiaries is in the business of end-to-end supply chain management of IT and non-ITproducts in various geographies which has high potential for growth. The Company also renders after sales supportservices, financial services and logistics services.

36 Annual Report 2009 - 2010
The foremost objective of the supply chain business is to ensure ultimate reach of the products to end customer at theoptimal cost and shortest possible time. The IT distribution industry is encompassed with network of interconnectedbusiness partners like value added resellers, systems integrators, sub distributors, large format retailers and smallmom and pop stores. The distribution channel provides geographically dispersed demand to be served at a lower costthan what vendors can typically achieve on their own. The channel makes it easier for business to acquire newtechnology as opposed to acquiring that technology in a multi-vendor model.
INDUSTRY STRUCTURE
IT BUSINESS
India remains a focus geography for all Global IT Hardware and Software vendors. The major reasons for this are thefavorable growth oriented fiscal policies of the Government, huge investments in e-Governance projects, upgrading ofIT infrastructure by the Banking and Financial Services sector, investments in the Education sector and continuedspending by the Indian Consumer on the back of positive economic sentiments. The much anticipated revival ofinfrastructure spending would have a significant positive impact on the IT eco-system.
Your Company works as a national distributor for all leading international IT Brands. It distributes a complete bouquetof IT products including desktops, laptops, servers, software packages, peripherals, components, networkingequipments, storage products and high-end enterprise level Servers / Storage / Software.
Your Company managed to maintain its success story even during highly challenging times by focusing on growthareas, keeping a tight control on costs and adding key vendors to its portfolio.
Your Company would continue to tailor its strategies to meet the future challenges in order to ensure that the growthobjectives are not diluted and it continuously identifies newer and fresher areas for business acquisition.
NON -IT BUSINESS
Your Company has penetrated into distribution of non-information technology products successfully since 2004.
In India, Government's recent approval for 3G enabled telecom service would provide more scope to increase thegrowth in the telecom product demand. Your Company sees robust growth in the coming years in the mobile handsetdistribution market and believes BlackBerry sales would prove to be a catalyst for this growth, as there are clear shiftin consumer taste towards Smartphones.
Consumer Electronics industry consists of durable goods used for domestic purposes such as televisions, washingmachines, refrigerators, microwave ovens, etc. The growth in the consumer durables sector has been driven primarilyby factors such as the boom in the real estate & housing industry and with rising affluence level of a considerablesection of the population.
As per a survey conducted by FICCI on the Indian consumer durables industry, a shift in consumer preferencestowards higher-end, technologically advanced branded products has been quite discernable. This shift can be explainedby narrowing differentials between the prices of branded and unbranded products added with the high quality of aftersales service provided by the branded players. The shift has also been triggered by the availability of foreign brandedproducts in India owing to lower import duties. The surge in advertising has been instrumental in bringing about a seachange in the consumer behavior pattern and preference.
SERVICES
Your Company from the beginning believed in the importance of 3rd party neutral service provider for vendors andcustomers in high growth large markets like India, Middle East and Africa. Presence of 3rd party neutral serviceprovider helps the brand owners to deliver timely service and at lower cost. Your Company has been able to map a
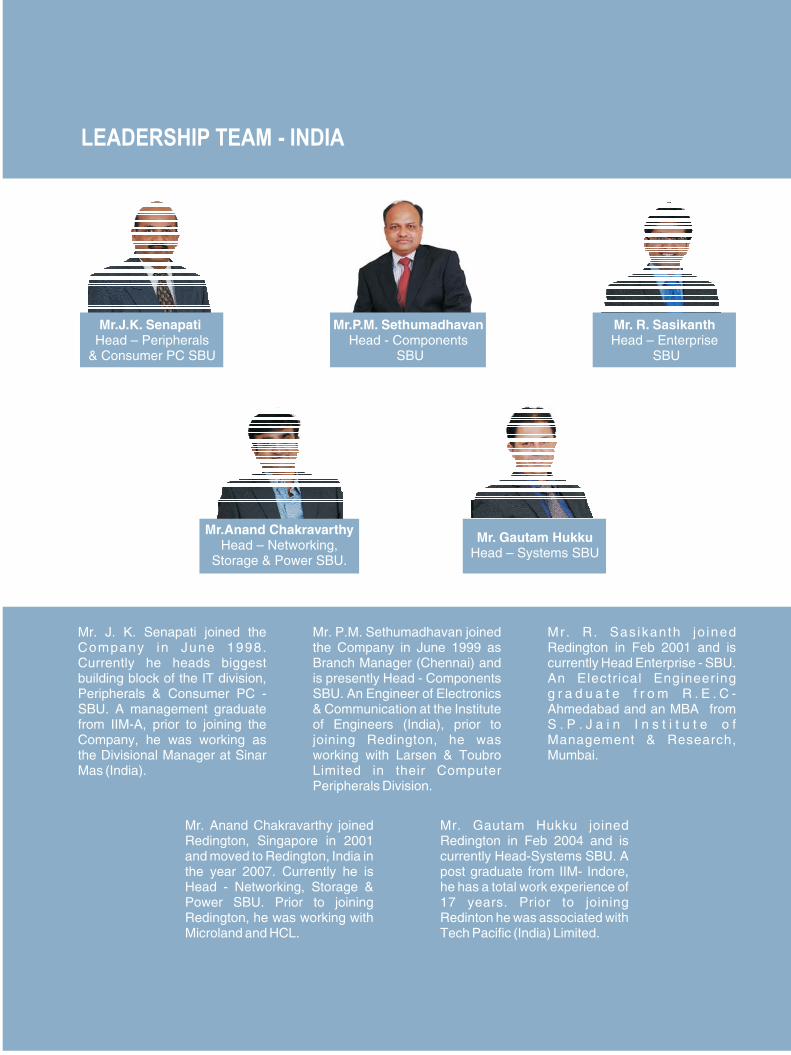
37Mobility, Connectivity, Dependability
Mr.Anand ChakravarthyHead – Networking,
Storage & Power SBU.
Mr. R. SasikanthHead – Enterprise
SBU
Mr.P.M. SethumadhavanHead - Components
SBU
Mr.J.K. SenapatiHead – Peripherals
& Consumer PC SBU
Mr. Gautam HukkuHead – Systems SBU
Mr. J. K. Senapati joined theCompany in June 1998.Currently he heads biggestbuilding block of the IT division,Peripherals & Consumer PC -SBU. A management graduatefrom IIM-A, prior to joining theCompany, he was working asthe Divisional Manager at SinarMas (India).
Mr. Anand Chakravarthy joinedRedington, Singapore in 2001and moved to Redington, India inthe year 2007. Currently he isHead - Networking, Storage &Power SBU. Prior to joiningRedington, he was working withMicroland and HCL.
Mr. P.M. Sethumadhavan joinedthe Company in June 1999 asBranch Manager (Chennai) andis presently Head - ComponentsSBU. An Engineer of Electronics& Communication at the Instituteof Engineers (India), prior tojoining Redington, he wasworking with Larsen & ToubroLimited in their ComputerPeripherals Division.
Mr . R. Sas ikanth jo inedRedington in Feb 2001 and iscurrently Head Enterprise - SBU.An Electrical Engineeringg r a d u a t e f r o m R . E . C -Ahmedabad and an MBA fromS . P . J a i n I n s t i t u t e o fManagement & Research,Mumbai.
Mr. Gautam Hukku joinedRedington in Feb 2004 and iscurrently Head-Systems SBU. Apost graduate from IIM- Indore,he has a total work experience of17 years. Prior to joiningRedinton he was associated withTech Pacific (India) Limited.
LEADERSHIP TEAM - INDIA

38 Annual Report 2009 - 2010
Mr. R. VenkateshHead-Software Solutions
SBU
Mr. R. Venkatesh joined theCompany in October 2000 and ispresently the Head - SoftwareSolutions SBU. Prior to softwaresolutions SBU, he was handlingNetworking / Storage businessand has in total 14 Years ofExperience.
Mr. Rajesh Khetarpal joinedRedington India in Jan 2000 asChannel Development Managerand is currently the Head-Lifestyle and Telecom SBU.Prior to joining Redington heworked with organizations likeY e l m . C o m , V i d e o c o nInternat ional , Sylvania &Laxman etc.
Mr. Rajesh KhetarpalHead -Lifestyle &
Telecom SBU
Mr. Ramesh NatarajanHead - Sales
Mr. Ramesh Natarajan joinedthe company in 1997 and iscurrently Head - Sales. Prior tojoining Redington he wase m p l o y e d w i t h P e r t e c hComputers Limited as a TerritoryManager
Mr. K. SundaresanHead - Credit
M r . K . S u n d a r e s a n j o i n e dRedington in June 2002 and heis currently Head - Credit. He is aChartered Accountant and priorto joining Redington he wasemployed with Bhavani ImpexSdn Bhd . , Kua la lumpur ,Malaysia.
LEADERSHIP TEAM - INDIA

39Mobility, Connectivity, Dependability
consistent growth in our service business by being the neutral service provider, providing customers in India withworld class service support in association with leading global IT and Telecommunication organisations. Your Companyhas always been the frontrunner in many activities providing end-to-end support services including warranty services,supply of authorised spare parts and upgrades to other service providers, annual maintenance services, technicalresponse centre, high level repair services for mobile handsets and motherboards etc. and thereby giving significantvalue-addition to the vendors and customers.
THIRD PARTY LOGISTICS
Globalization resulted in Indian firms’ demanding new logistics capabilities and more complex solutions for logisticschallenges. There is a greater realisation about importance expert logistics services. Due to economies of scale, 3PLservice provider like your Company, are better positioned to provide a cost effective solution to these expert logisticneeds.
More companies are turning towards 3PL to help them in successful management of supply chain processes. 3PLprovides the ability to bring down conventional logistics costs and handle more complicated tasks.
The 3PL industry is expected to become a $90 million industry from the current $58 million, as around 55 per cent ofIndian companies are outsourcing logistic services, which used to be between 10-15 per cent ten years ago (Source:Business Standard). Value added services are currently the most important driving factor for such a shift giving hopesfor further shift in future.
Your Company manages low turnaround time at cost effective mode supported by investment in Distribution Centreand high quality warehouse management software. Supply Chain Solution services form an integral part of yourCompany's operations. Your Company's initiative to set up Automated Distribution Centres(ADCs) at four Metros inIndia and one in Dubai is progressing well. ADC at Chennai started its operations in the last financial year. It waschallenging to implement a best of breed warehouse management system, performance testing of high end VeryNarrow Aisle (VNA) equipments and giving adequate training to the manpower. Unlike a normal warehouse, theuniqueness of ADC is having process driven operations.
OVERSEAS OPERATIONS
Your Company always aims at networking seamlessly beyond boundaries. Your Company’s overseas subsidiariescontribute equally to the growth. The global turmoil last year has affected the growth in IT industry in the overseasoperations. Majority of our vendors de-grew their revenue in this market due to serious erosion of demand, mainlyfrom corporate segment. In the Middle East market, there was de-growth in units sold across all the product categories,except in Notebooks.
However, your Company’s subsidiary, Redington Gulf could retain its revenue growth in the MEA by adding newbrands like Dell and couple of other brands in higher margin value space. Redington-Gulf’s strong retail customerbase which facilitated tie-up with Dell in May 2009 was a significant move for the company in its MEA growth strategy.Addition of Dell brand in our bouquet when our largest vendor was de-growing in these markets was an important steptowards the Company achieving positive growth in its MEA revenue.
During the last 3 to 4 years, Redington-Gulf is making conscious effort to move into distribution of value products inMEA markets. The value division was started with focus on networking products and solutions. The vision behindvalue-added distribution is to establish the Company as a leading one-stop-solutions provider for informationmanagement, information convergence and information security vertical. With the addition of 5 brands in the yearunder review, currently your Company’s overseas subsidiary, Redington-Gulf has about 15 brands in this space andis showing a consistent growth. The Value Division is associated with some of the leading global brands includingAvaya, Ascom, Coral Maksat, Cisco, HP ProCurve, HP Software, Juniper, Microsoft, Nortel, Netgear, RedHat,SonicWall, Trapeze Networks and TrendMicro.

40 Annual Report 2009 - 2010
In the Telecom segment, a significant performer in our African market was Nokia in Nigeria and Kenya. Nokia is theNo. 1 telecom brand in these markets. Telecom as a segment has done well for the company in the last couple ofyears. In Nigeria, Redington Gulf has increased its market share to take a leadership position through better logistics,penetration and reach. In Kenya, Redington Gulf and its subsidiaries managed to scale up its business through itspresence in upcountry markets. Redington Gulf has been awarded contract by Nokia for Ghana market also.
While your Company’s overseas subsidiaries have set their footprint in Africa in the early 2000, there are continuousefforts to expand the geographical spread within that region. Recently, Redington Gulf has added two new markets,Ghana (in West Africa) and Uganda (in East Africa). There are well laid out strategies to move into North Africa in a bigway. The period under review, also saw a revival of our business fortunes in Egypt.
STRENGTHS, RISKS AND CONCERNS
A. STRENGTHS
The enduring relationship which we maintain with our vendors and the customers portrays the success of our business.The uniqueness of your Company is the relationship it enjoys, with the vendors and channel partners spanning morethan 15 years. Be it the offerings and the value propositions we provide to our channel partners, or multi- locationdeliveries and billings, we are always ready to accompany our partners and customers till the transaction closurestage. Your Company's robust IT infrastructure enables managing its network of business locations in a time and costefficient manner. Efficient inventory management and receivables management paved the way to effectively managethe challenges of economic downturn which in turn yielded better competitive edge over our rivals. Your Company'swide reach, fulfilling the demand of the customers enabled diversified growth thereby ultimately establishing ouridentity across different sub sects of these markets. Your Company also provides its customers with project baseddelivery services which require a highly coordinated activity of delivery of multiple products to multiple locations and insome cases installing them as well. Your Company's presence in the Support Services space, the unique featurecompared to other distributors, gives it an advantage in completing complex project supplies.
B. RISK AND CONCERNS
Your company, being in distribution and support services space, is conscious about risks arising out of vendorrelationships, market performance, geographical risk,foreign exchange risk, credit risk, inventory management andinterest rate risks. A well structured policy has been established to address the issues of risk factors and adequateinternal control systems has been installed in the organization to mitigate the risk arising out of process, operationaland compliance issues. Internal audit has been carried out at regular intervals to ensure the adequacy of the controlsin the performance of the Company. Insurance coverage has been taken by your Company to safeguard the assetsfrom the risk arising out of natural calamity such as fire threats etc and insurance policies has also been taken tosafeguard the Employees' interest. Some of the challenges associated with this business are highlighted in the forthcoming paragraphs.
As a prudent policy, the Company takes foreign exchange forward contracts to hedge against forex risk towards itsoutstanding payables.
Business strategy of vendors
Vendors having global footprints take decisions for specific markets in line with their global strategies. In the recenteconomic downturn, the focus of many vendors to emerging markets to grow their global business. In order to increasetheir market share and show more growth, some of the vendors resorted to strategies like more direct sales, reductionin discounts and rebates, partnering with smaller players, etc. Over time, however, Vendors realized that it makes farbetter sense to leverage distributor's network to cost-effectively sell their products. Distributors reach the products tothe market through diverse reseller channels with specialized needs that are very difficult to directly address orthrough the small players.

41Mobility, Connectivity, Dependability
Mr. B. RamkumarHead - Value Business
MEA
Mr. B. Ram Kumar is apostgraduate in businessadministration and has over 10years of experience, with both ITvendors and d is t r ibu t ioncompanies. He has beenassociated with Redington Gulffor over 5 years and currentlyheads the Value Business inMiddle East & Africa.
Mr. Jeetendra Berry is aGraduate in Engineering andhas over 15 years of experiencewith various IT Resellers andSystem Integrators. He hasbeen associated with RedingtonGroup for 12 years and currentlyheads the HP PSG Businessacross seven countries UAE,Saudi Arabia, Kuwait, Qatar,Egypt, Bahrain and Oman.
Mr. Jim MathewHead – Telecom Business
Africa
M r . J i m M a t h e w i s aPostgraduate in BusinessAdministration with over 10years of experience in theTelecom & IT
H e h a s b e e nassociated with Redington Gulffor over 4 years
distributioni n d u s t r y .
Mr. Santosh SansareHead- IT Business
Africa
Mr. Santosh Sansare is apostgraduate in businessadministration with over 11years of experience spanningP r o c e s s A u t o m a t i o n ,Instrumentation & IT Distributioncompan ies .He has beenassociated with Redington Gulffor over 4 years and currentlyheads the IT businesses inAfrica
Mr. Jeetendra BerryHead - HP-PSG,ME.
Mr. Sukhil NairHead - PC Division, ME
Mr. Sukhil Nair is a Graduate inCommerce and has over 12years of experience in sales andmarketing Telecom and ITi n d u s t r y . H e h a s b e e nassociated with RedingtonGroup for 9 years and currentlyheads the PC division forRedington Gulf.
LEADERSHIP TEAM - MEA

42 Annual Report 2009 - 2010
Mr. S. ChidambaramHead - Supply ChainManagement –MEA
Mr. S. Chidambaram is a postG r a d u a t e i n o p e r a t i o n smanagement and has over 18years of experience in thedistribution industry. . He hasbeen associated with Redingtonfor over 15 years and currentlyheads the Supply ChainManagement for Redington Gulfacross Middle East and Africa
Mr. Ashok VeeraraghavanHead - Sales Retail &
Corporate - ME
Mr. Ashok Veeraraghavan is aG r a d u a t e i n E l e c t r i c a lEngineering with over 21 yearsof experience in BuildingAutomat ion indust ry andDistribution Industry. He hasbeen associated with RedingtonGulf for over 9 years andcurrently heads the Corporate &Retail Sales for Redington GulfFZE
Mr. Sunil D' SouzaHead - IT Systems,
MEA
Mr. Sunil D'souza is a Graduatein Computer Science and hasover 13 years experience in ITI n d u s t r y . H e h a s b e e nassociated with Redington Gulffor 9 years and currently headsthe Information TechnologySystem.
Mr.Sriram SrinivasanHead - HP IPG,
Hardware & Supplies, ME
Mr. Sriram Srinivsan is a PostGraduate in Management andhas over 20 years of experiencein Off ice Automat ion, IThardware Distribution and a briefstint in the Audio Visual Industry.He has been associated withRedington Group for 16 yearsand currently heads the HPImaging and Printing GroupH a r d w a r e a n d S u p p l i e sBusiness in ME.
LEADERSHIP TEAM - MEA

43Mobility, Connectivity, Dependability
Changes in consumer behaviour pattern
The post recession scenario has become tougher for the manufacturers and retailers due to the unexpected changein the consumer buying pattern. The cash flow stress of individuals and corporate during the downturn are hard to goaway from memory and results in cautious purchase decisions. The thrust is on the vendors to intensify their marketingplans so that it gives platform for the customers to buy the products. The provision of liberal credit or payment ermsor an attractive sales promotion scheme or freebie offering would encourage immediate purchase. Vendors are thepillars on which our business model is built. If vendors grow at a higher pace, we tend to show stronger growth as well.
OPPORTUNITY AND DE-RISKING STRATEGIES
In this competitive business scenario, organizations with high potential foresee the challenges and devise a plan toovercome them with their strategic approach. Being very well equipped both resourcefully and technologically yourCompany managed to be one of the leading players in the distribution space. The timely strategic policies and efficientexecution skills have enabled your Company to continue with its success story over these years.
One of the strategic moves by the Government of India towards ensuring beneficial schemes reaching the commonman and to bridge the gap between haves and have-nots is the initiation of Unique Identification Project. This alongwith Government's focus on e-governance projects and increased budgetary allocation for education sector is expectedto spur demand for IT products. Being a leading distributor with a srong distribution reach, long standing relationshipwith many vendors and customers, expert understanding of this business, credible financial strength, vast supportservices for both infrastructure, capability to provide finance to channel community and logistic services for bothvendors and channel partners, these are attractive business opportunities for your Company.
HORIZONTAL AND VERTICAL EXPANSION
It’s your Company’s consistent endeavour to add new products, brands and markets. Addition of newer brands andproducts enhances the vendor’s market share as the products are sold through your Company’s channel partners. Inaddition, your Company expands its operations globally by exploring new markets or by widening our reach in anexisting market. There is a huge potential for the IT and Telecom products in the unexplored markets of Africa.A recent survey reports that the world economic slowdown had little impact in the African region. The company’sstrategic vision is to discover new markets beyond our current frontiers without compromising the market share in ourexisting markets. In large countries like India, the upsurge in consumer demand from small towns and tier II cities hasnecessitated a distributor’s role for a cost-efficient distribution. Your company is making investments in growing itsreach across many of these small towns and cities to play an important role in its future growth.
INTERNAL CONTROL SYSTEMS
Your Company has adequate Internal Controls in place. Your Company accords importance to the role of its InternalAuditors in periodical review of various internal control systems and processes. The management and the auditcommittee interact with internal auditors to understand the proper functioning of its internal control framework. Inaddition, as required under clause 41 of the Listing Agreement, before finalizing the quarterly, half yearly and annualaccounts the CEO and CFO ensures the adequacy of the Internal Control system which is reviewed by the AuditCommittee, Internal and Statutory Auditors.
MATERIAL DEVELOPMENT IN HUMAN RESOURCES
The most important reason for your company’s success in meeting its business objectives is its employee strength.Higher level of capability and commitment is required from the employees, in a high transaction oriented distributionbusiness where the decision making is distributed across all its locations and monitored centrally. Our core employeestrength has enabled us to grow faster than the market and the competitors in these markets, to become a leadingdistributor in most of the markets where your Company has operations.

44 Annual Report 2009 - 2010
6,796
9,067
12,683
13,779
FY06
FY07
FY08
FY09
FY10
TOTAL REVENUES (Rs. in Crore)
10,884
EBIDTA (Rs. in Crore)
FY06
FY07
FY08
FY09
FY10
131.06
198.47
259.04
329.57
365.72
PBT & PAT
FY07
FY09
FY10
FY06
FY08
PAT PBT92.3674.34
127.25101.70
177.06136.07
219.02159.66
275.92184.33
0.79
DEBT EQUITY RATIO
FY09
FY10 0.87
3.69FY09
FY10
CURRENT RATIO
3.02
FINANCIAL PERFORMANCE & POSITION
The financial statement of your Company and its Indian subsidiaries are prepared in accordance with GenerallyAccepted Accounting Principles in India. The consolidated financials of Redington Distribution Pte. Ltd and its subsidiaryis prepared in accordance with the Singapore Financial Reporting Standards. Other overseas subsidiaries that areincorporated in Middle East and Africa region are prepared under the International Financial Reporting Standards.
Analysis of Consolidated Financials
Revenues - Revenues for the fiscal 2010 grew by 8.64%
to Rs.13,778.65 Crore from 12,683.09 Crore in the
previous year. Revenues from Overseas subsidiaries
contributed to 53.12% of the total revenues.
EBIDTA - grew by 10.97% to Rs.365.72 Crore duringthe fiscal 2010 as against Rs.329.57 Crore during thefiscal 2009. EBIDTA as a percentage of Sales andservice income touched a high of 2.65 % during the fiscal2010 as against 2.60 % during the previous fiscal.
PBT and PAT- Profit before tax increased to Rs.275.92Crore during the year as against Rs.219.02 Crore duringthe last fiscal year.
The provision for current tax and deferred tax for theyear is Rs. 63.90 Crore. PAT for the year after minorityinterest increased to Rs. 184.33 Crore during the yearas against Rs.159.66 Crore during the fiscal 2009.
The growth of 25.98% and 15.45% in the PBT and PATrespectively has been mainly on account of increasedcontribution from higher margin products and operationalefficiencies. The PBT and PAT as a % of sales have
grown to 2 % and 1.54 % respectively, as against 1.73%
and 1.33% in the previous fiscal.
Borrowings - Increased by 16.85% to Rs.1148.59 Crore
as on 31st March 2010 as against Rs.982.98 Crore as
of 31st March, 2009.
Fixed Assets - Increased to Rs.96.81 Crore during the
fiscal 2010 as against Rs.87.99 Crore during the previous
fiscal the main addition being investment for construction
of ADC.

45Mobility, Connectivity, Dependability
Summarized Cash Flow Statement:
Rs in Crore
Particulars 2009-10 2008-09
Cash and cash Equivalents at the beginning of the year 602.39 182.95
Add: Cash generated from/ (used in)
Operating activities 11.05 (99.69)
Investing activities (53.43) (13.33)
Financing Activities 84.43 427.81
Currency Translation (100.78) 104.54
Opening cash balance of subsidiaries acquired during the year - 0.11
Cash and cash Equivalents at the end of the year 582.60 602.39
Less: Deposits held for more than 3 months 38.94 -
Cash and cash Equivalents at the end of the year 543.66 602.39
Employee Compensation Costs - Increased to Rs.165.50 Crore in fiscal 2010 as against Rs. 150.27 Crore duringthe fiscal 2009. Employee compensation cost as a percentage of revenue increased from 1.18% to 1.20 % in currentfinancial year. The increase is inevitable to retain the skilled personnel.
Interest - Interest cost has decreased to Rs. 66.38 Crore as against Rs. 97.82 Crore during the previous fiscal.Interest as a percentage of sales has decreased from 0.77% in the previous fiscal to 0.48 % in the current fiscal year.
Other Expenses - mainly includes Rent, Insurance, Communication, travel and Exchange Loss. Increased to Rs.179.36Crore during this fiscal year 2010 as against Rs. 165.08 crore during the previous year.
Analysis of Standalone Financials
3,697
4,718
5,780
6,072
6,460
FY06
FY07
FY08
FY09
FY10
TOTAL REVENUES (Rs. in Crore) EBIDTA (Rs. in Crore)
FY06
FY07
FY08
68.90
101.76
148.25
FY09 173.87
FY10 201.60
Revenue – Revenue has grown to Rs.6,459.88 Crore inthe fiscal year 2010 from Rs.6,071.43 Crore in fiscal 2009.
EBIDTA increased by 15.95% to Rs. 201.60 Crore duringthe fiscal year 2010 as against Rs. 173.87 Crore in previousfiscal year 2009. EBIDTA as against the total revenue hasbeen increased to 3.12% during this fiscal year as against2.86% during the previous financial year 2009.

46 Annual Report 2009 - 2010
Summarized Cash Flow Statement:Rs in Crore
Particulars 2009-10 2008-09
Cash and cash Equivalents at the beginning of the year 55.96 77.59
Add: Cash generated from / (used in)
Operating activities 89.05 26.86
Investing activities (148.21) (12.95)
Financing Activities 23.16 (35.54)
Cash and cash Equivalents at the end of the year 19.96 55.96
Cautionary Statement
Statement in the Management Discussion and Analysis describing the Company's objectives, projections, outlook,expectations, estimates, etc. may constitute 'forward looking statements' within the meaning of applicable laws andregulations. Actual results may differ materially from such expectations, projections, etc.
PBT and PAT - Profit before tax increased to Rs.153.16Crore during the year as against Rs.124.25 Crore duringthe last fiscal year. Profit After Tax increased to Rs.99.46Crore during the year as against Rs.80.69 Crore duringthe fiscal 2009. The growth of 23.19% and 23.26 % inthe PBT and PAT respectively has been mainly onaccount of better product mix and operational efficiencies.
The PBT and PAT as a % of revenue have grown to 2.37% and 1.54 % respectively, as against 2.05% and 1.33%in the previous fiscal.
Borrowings - Increased to Rs. 375.52 Crore as on 31stMarch 2010 as against Rs.289.91 Crore as of 31st March,2009.
Employee compensation cost increased to Rs. 79.78Crore from Rs. 75.81 Crore in the fiscal year 2010.
PBT & PAT
FY06
FY07
FY08
FY09
FY1099.46
153.16
80.69124.25
67.11
103.57
42.42
65.63
29.14
45.33 PAT PBT
Though there has not been much increase in this fiscal
year when compared to the previous financial year the
difference is inevitable to retain the existing skilled human
personnel.
Other expenses for this financial year have shown
12.05% decrease due to reduction in cost of operations
and reduced receivable factoring. The other expenses
have been reduced to Rs.73.69 Crore when comparedto previous fiscal year which stood at Rs.83.78 Crore.
Interest cost reduced to Rs.33.03 Crore as against theprevious financial year which stood at Rs.44.91 Crore.
There has been a remarkable reduction in the interest
payment to the extent of 26.43%. The interest cost as a
% of total revenue has been decreased to 0.5 % from
0.7% in this financial year.
1.97
DEBT EQUITY RATIO
FY09
FY10
1.77
0.47
FY09
FY10
CURRENT RATIO
0.56

�
�
�
�
�
�
�
�
�
�
�
�
�
�
�
�
Best Distributor of the Year by NetApp.
Best sales performance award for APAC region by Kodak.
Best performer in IWS and LES consumer category by HP.
APJ most outstanding partner of the Year – 2009.
APAC Partner with Highest growth – 2009 by Ncomputing.
Best Channel Partner 2009 - GCC Channel Awards.
Best After Sales Services - Choice of Channel Awards (COC) 2009.
Distributor of the year 2010 - Channel Middle East Awards.
Distributor of the year award – H&BN.
Best Distributor Award for MENA region.
Best Specialty Distributor by CISCO for Nigeria.
Volume Retail Distributor of the year award in RETAIL Academy awards.
Best Channel in the Asia Pacific region for HP Indigo Business.
Best performing country in the Asia Pacific Region for HP Indigo Business.
Best customer experience for Asia pacific region for HP Indigo Business.
Best Partner in Asia Pacific and Japan region for sales, service and support- HP Indigo.
ME
AWARDS & ACCOLADES

48 Annual Report 2009 - 2010
StandaloneFinancial Statements

49Mobility, Connectivity, Dependability
AUDITOR’S REPORT TO THE MEMBERS OF REDINGTON (INDIA) LIMITED
1. We have audited the attached Balance Sheet of REDINGTON (INDIA) LIMITED ("the Company") as at 31stMarch, 2010, the Profit and Loss Account and the Cash Flow Statement of the Company for the year ended onthat date, both annexed thereto. These financial statements are the responsibility of the Company's Management.Our responsibility is to express an opinion on these financial statements based on our audit.
2. We conducted our audit in accordance with the auditing standards generally accepted in India. Those Standardsrequire that we plan and perform the audit to obtain reasonable assurance about whether the financial statementsare free of material misstatements. An audit includes examining, on a test basis, evidence supporting the amountsand the disclosures in the financial statements. An audit also includes assessing the accounting principles usedand the significant estimates made by the Management, as well as evaluating the overall financial statementpresentation. We believe that our audit provides a reasonable basis for our opinion.
3. As required by the Companies (Auditor's Report) Order, 2003 (CARO) issued by the Central Government interms of Section 227(4A) of the Companies Act, 1956, we enclose in the Annexure a statement on the mattersspecified in paragraphs 4 and 5 of the said Order.
4. Further to our comments in the Annexure referred to in paragraph 3 above, we report as follows:
(a) we have obtained all the information and explanations which to the best of our knowledge and belief werenecessary for the purposes of our audit;
(b) in our opinion, proper books of account as required by law have been kept by the Company so far as itappears from our examination of those books;
(c) the Balance Sheet, the Profit and Loss Account and the Cash Flow Statement dealt with by this report are inagreement with the books of account;
(d) in our opinion, the Balance Sheet, the Profit and Loss Account and the Cash Flow Statement dealt with bythis report are in compliance with the Accounting Standards referred to in Section 211(3C) of the CompaniesAct, 1956;
(e) in our opinion and to the best of our information and according to the explanations given to us, the saidaccounts give the information required by the Companies Act, 1956 in the manner so required and give a trueand fair view in conformity with the accounting principles generally accepted in India:
(i) in the case of the Balance Sheet, of the state of affairs of the Company as at 31st March, 2010;
(ii) in the case of the Profit and Loss Account, of the profit of the Company for the year ended on that dateand
(iii) in the case of the Cash Flow Statement, of the cash flows of the Company for the year ended on thatdate.
5. On the basis of the written representations received from the Directors as on 31st March, 2010 taken on recordby the Board of Directors, none of the Directors is disqualified as on 31st March, 2010 from being appointed asa director in terms of Section 274(1)(g) of the Companies Act, 1956.
For Deloitte Haskins & SellsChartered Accountants
(Registration Number: 008072S)
M.K. AnanthanarayananPlace : Chennai PartnerDate : May 21, 2010 Membership No. 19521

50 Annual Report 2009 - 2010
ANNEXURE TO THE AUDITORS’ REPORT(Referred to in paragraph 3 of our report of even date)
(i) Having regard to the nature of the Company's business/activities/result, clauses (x), (xii), (xiii), (xiv), (xviii) ofCARO are not applicable.
(ii) In respect of its fixed assets:
(a) The Company has maintained proper records showing full particulars, including quantitative details andsituation of the fixed assets.
(b) The fixed assets were physically verified during the year by the Management in accordance with a regularprogramme of verification which, in our opinion, provides for physical verification of all the fixed assets atreasonable intervals. According to the information and explanation given to us, no material discrepancieswere noticed on such verification.
(c) The fixed assets disposed off during the year, in our opinion, do not constitute a substantial part of the fixedassets of the Company and such disposal has, in our opinion, not affected the going concern status of theCompany.
(iii) In respect of its inventory:
(a) As explained to us, the inventories were physically verified during the year by an external firm of charteredaccountants at reasonable intervals.
(b) In our opinion and according to the information and explanation given to us, the procedures of physicalverification of inventories followed by the Management were reasonable and adequate in relation to thesize of the Company and the nature of its business.
(c) In our opinion and according to the information and explanations given to us, the Company has maintainedproper records of its inventories and no material discrepancies were noticed on physical verification.
(iv) The Company has neither granted nor taken any loans, secured or unsecured, to/from companies, firms or otherparties listed in the Register maintained under Section 301 of the Companies Act, 1956.
(v) In our opinion and according to the information and explanations given to us, there is an adequate internalcontrol system commensurate with the size of the Company and the nature of its business with regard topurchases of inventory and fixed assets and the sale of goods and services. During the course of our audit, wehave not observed any major weakness in such internal control system.
(vi) In respect of contracts or arrangements entered in the Register maintained in pursuance of Section 301 of theCompanies Act, 1956, to the best of our knowledge and belief and according to the information and explanationsgiven to us, we are of the opinion that there are no transactions that need to be entered in the register maintainedunder section 301 of the Companies Act 1956.
(vii) According to the information and explanations given to us, the Company has not accepted any deposit from thepublic during the year. In respect of unclaimed deposits, the Company has complied with the provisions ofSections 58A & 58AA or any other relevant provisions of the Companies Act, 1956.
(viii) In our opinion, the internal audit functions carried out during the year by firm of Chartered Accountants appointedby the Mangement have been commensurate with the size of the Company and the nature of its business.
(ix) To the best of our knowledge and according to the information and explanations given to us, the Central Governmenthas not prescribed the maintenance of cost records for any other product of the Company.
(x) According to the information and explanations given to us in respect of statutory dues:
(a) The Company has generally been regular in depositing undisputed dues, including Provident Fund, InvestorEducation and Protection Fund, Employees' State Insurance, Income-tax, Sales Tax, Wealth Tax, ServiceTax, Custom Duty, Cess and other material statutory dues applicable to it with the appropriate authorities.
(b) There were no undisputed amounts payable in respect of Income-tax, Wealth Tax, Custom Duty, Cess andother material statutory dues in arrears as at 31st March, 2010 for a period of more than six months fromthe date they became payable.

51Mobility, Connectivity, Dependability
(c) Details of dues of Income-tax, Sales Tax, Wealth Tax, Service Tax, Custom Duty, Excise Duty and Cesswhich have not been deposited as on 31st March, 2010 on account of disputes are given below:
Name of the Nature of Forum where Period to which Amount involvedStatute Dues dispute is pending the amount relates (Rs. in Lakhs)
The Customs Act, 1962 Customs Duty CESTAT / Bill of entries relatingCommissioner to various years 15.27
Sales Tax Act of Local Sales Tax Various appellateVarious States authorities 2002-03 17.28
2003-04 80.432005-06 152.672006-07 34.032007-08 82.972008-09 141.922009-10 31.12
Central Sales Tax Act, 1956 Central Sales Various appellateTax authorities 2002-03 5.19
2004-05 0.242005-06 5.182006-07 44.992007-08 3.712008-09 0.37
Income Tax Act, 1961 Income Tax CIT (A) and DisputeResolution Panel Assessment year(DRP) 2005-06 24.52
Income Tax Act, 1961 Income Tax CIT (A) and DisputeResolution Panel Assessment year(DRP) 2006-07 105.70
(xi) In our opinion and according to the information and explanations given to us, the Company has not defaulted inthe repayment of dues to banks, financial institutions and debenture holders.
(xii) In our opinion and according to the information and explanations given to us, the terms and conditions of theguarantees given by the Company for loans taken by others from banks and financial institutions are not primafacie prejudicial to the interests of the Company.
(xiii) In our opinion and according to the information and explanations given to us, the term loans have been appliedfor the purposes for which they were obtained.
(xiv) In our opinion and according to the information and explanations given to us and on an overall examination of theBalance Sheet, we report that funds raised on short-term basis have not been used during the year for long-term investment.
(xv) According to the information and explanations given to us, during the period covered by our audit report, theCompany had issued only unsecured debentures and as such no security / charge needs to be created.
(xvi) The Management has disclosed the end use of money raised by public issues and we have verified the same.
(xvii) To the best of our knowledge and according to the information and explanations given to us, no fraud by theCompany and no fraud on the Company has been noticed or reported during the year.
For Deloitte Haskins & SellsChartered Accountants
(Registraion No. 008072S)
M.K. AnanthanarayananPlace : Chennai PartnerDate : May 21, 2010 Membership No. 19521

52 Annual Report 2009 - 2010
In terms of our report attached For and on behalf of the Board
For Deloitte Haskins & Sells R Srinivasan Raj Shankar M RaghunandanChartered Accountants Managing Director Dy. Managing Director Wholetime Director
M K Ananthanarayanan S V Krishnan M MuthukumarasamyPartner Chief Financial Officer Company Secretary
Place : ChennaiDate : May 21, 2010
BALANCE SHEET AS AT MARCH 31, 2010 (Rs in Lakhs)
As At As AtSchedule 31.03.2010 31.03.2009
Sources of Funds
Share Holders’ FundsShare Capital 1 7,863.60 7,786.57Reserves and Surplus 2 59,734.15 53,652.13
67,597.75 61,438.70
Loan FundsSecured Loans 3 30,955.49 15,681.94
Unsecured Loans 4 6,596.80 13,308.80
37,552.29 28,990.74
105,150.04 90,429.44
Application of Funds
Fixed Assets 5Gross Block 10,477.96 8,081.55
Less: Depreciation 3,770.66 2,561.20
Net Block 6,707.30 5,520.35
Add: Capital Advances/Capital Work in Progress 131.37 1,028.036,838.67 6,548.38
Investments 6 45,905.09 32,093.25
Deferred Tax Asset (Net) [Note: 2(d)] 249.76 (13.12)
Current Assets, Loans and Advances 7
Inventories 42,241.21 27,344.57
Sundry Debtors 67,855.45 64,502.26
Cash and Bank Balances 1,996.37 5,595.72
Loans and Advances 7,702.00 7,855.56
119,795.03 105,298.11
Less: Current Liabilities and Provisions 8
Current Liabilities 62,540.90 49,325.82
Provisions 5,097.61 4,171.36
67,638.51 53,497.18
Net Current Assets 52,156.52 51,800.93
105,150.04 90,429.44
Notes on Accounts 16
Schedules 1 to 8 and 16 form part of this Balance Sheet

53Mobility, Connectivity, Dependability
PROFIT AND LOSS ACCOUNT FOR THE YEAR ENDED MARCH 31, 2010(Rs in Lakhs)
Year Ended Year EndedSchedule March 31, 2010 March 31, 2009
IncomeSales and Service Income 9 644,961.42 606,615.65
Other Income 10 1,026.72 527.71
645,988.14 607,143.36
Expenditure
Cost of Goods Sold 11 608,526.06 572,054.89
Trading Expenses 12 1,954.93 1,743.22
Employee Compensation Costs 13 7,978.25 7,580.95
Other Expenses 14 7,368.84 8,377.57
625,828.08 589,756.63
Profit Before Interest, Depreciation and Tax 20,160.06 17,386.73
Interest 15 3,303.78 4,490.54
Depreciation 1,540.50 471.08
4,844.28 4,961.62
Profit Before Tax 15,315.78 12,425.11
Provision For Taxation - Current Tax 5,633.05 4,265.00
- Deferred Tax (262.88) (15.49)
- Fringe Benefit Tax – 106.74
5,370.17 4,356.25
Profit for the year 9,945.61 8,068.86
Balance in Profit and Loss Account brought forward 18,969.85 15,351.86
Less: Dividend including Dividend Distribution Taxfor previous year [Note: 2(r)] 28.28 18,941.57 - 15,351.86
Profit available for appropriation 28,887.18 23,420.72
AppropriationsTransfer to General Reserve 994.56 806.89Proposed Dividend for the year 3,942.34 3,114.65Dividend Distribution Tax on Proposed Dividend 654.77 529.33Balance in Profit and Loss Account 23,295.51 18,969.85
28,887.18 23,420.72
EPS -Basic (Rs.) - Face value - Rs.10 12.68 10.36
EPS -Diluted (Rs.) - Face value - Rs.10 12.55 10.36Notes on Accounts 16Schedules 9 to 16 form part of this Profit and Loss Account
In terms of our report attached For and on behalf of the Board
For Deloitte Haskins & Sells R Srinivasan Raj Shankar M RaghunandanChartered Accountants Managing Director Dy. Managing Director Wholetime Director
M K Ananthanarayanan S V Krishnan M MuthukumarasamyPartner Chief Financial Officer Company Secretary
Place : ChennaiDate : May 21, 2010
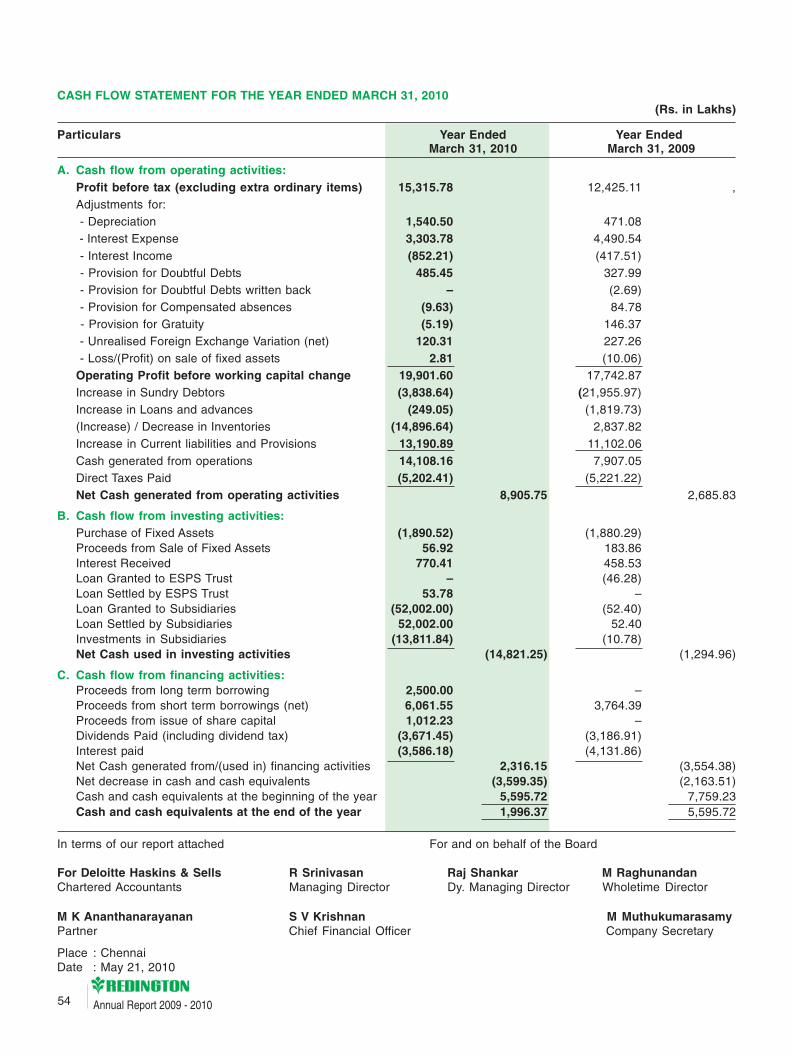
54 Annual Report 2009 - 2010
CASH FLOW STATEMENT FOR THE YEAR ENDED MARCH 31, 2010 (Rs. in Lakhs)
Particulars Year Ended Year EndedMarch 31, 2010 March 31, 2009
A. Cash flow from operating activities:Profit before tax (excluding extra ordinary items) 15,315.78 12,425.11 ,Adjustments for: - Depreciation 1,540.50 471.08 - Interest Expense 3,303.78 4,490.54 - Interest Income (852.21) (417.51) - Provision for Doubtful Debts 485.45 327.99 - Provision for Doubtful Debts written back – (2.69) - Provision for Compensated absences (9.63) 84.78 - Provision for Gratuity (5.19) 146.37 - Unrealised Foreign Exchange Variation (net) 120.31 227.26 - Loss/(Profit) on sale of fixed assets 2.81 (10.06)Operating Profit before working capital change 19,901.60 17,742.87Increase in Sundry Debtors (3,838.64) (21,955.97)Increase in Loans and advances (249.05) (1,819.73)(Increase) / Decrease in Inventories (14,896.64) 2,837.82Increase in Current liabilities and Provisions 13,190.89 11,102.06Cash generated from operations 14,108.16 7,907.05Direct Taxes Paid (5,202.41) (5,221.22)Net Cash generated from operating activities 8,905.75 2,685.83
B. Cash flow from investing activities:Purchase of Fixed Assets (1,890.52) (1,880.29)Proceeds from Sale of Fixed Assets 56.92 183.86Interest Received 770.41 458.53Loan Granted to ESPS Trust – (46.28)Loan Settled by ESPS Trust 53.78 –Loan Granted to Subsidiaries (52,002.00) (52.40)Loan Settled by Subsidiaries 52,002.00 52.40Investments in Subsidiaries (13,811.84) (10.78)Net Cash used in investing activities (14,821.25) (1,294.96)
C. Cash flow from financing activities:Proceeds from long term borrowing 2,500.00 –Proceeds from short term borrowings (net) 6,061.55 3,764.39Proceeds from issue of share capital 1,012.23 –Dividends Paid (including dividend tax) (3,671.45) (3,186.91)Interest paid (3,586.18) (4,131.86)Net Cash generated from/(used in) financing activities 2,316.15 (3,554.38)Net decrease in cash and cash equivalents (3,599.35) (2,163.51)Cash and cash equivalents at the beginning of the year 5,595.72 7,759.23Cash and cash equivalents at the end of the year 1,996.37 5,595.72
In terms of our report attached For and on behalf of the Board
For Deloitte Haskins & Sells R Srinivasan Raj Shankar M RaghunandanChartered Accountants Managing Director Dy. Managing Director Wholetime Director
M K Ananthanarayanan S V Krishnan M MuthukumarasamyPartner Chief Financial Officer Company Secretary
Place : ChennaiDate : May 21, 2010

55Mobility, Connectivity, Dependability
Schedules forming part of Balance Sheet (Rs. in Lakhs)
As At As At31.03.2010 31.03.2009
SCHEDULE 1
Share Capital
Authorised8,50,00,000 (P.Y. 8,50,00,000) Equity Shares ofRs.10/- each 8,500.00 8,500.00
Issued, Subscribed and Paid up
7,86,35,966 (P.Y. 7,78,65,746) Equity Shares ofRs.10/- each fully paid up 7,863.60 7,786.57
i. includes 1,46,93,796 (P.Y.1,46,93,796) sharesissued for consideration other than cash
ii. 7,70,220 (P.Y. Nil) Shares issued during the yearunder Redington employee stock option plan, 2008[Note: 2 (w)] 7,863.60 7,786.57
SCHEDULE 2
Reserves and Surplus
Securities Premium Account 32,791.44 32,791.44
Collected during the year 935.20 –
33,726.64 32,791.44
General Reserve
Opening Balance 1,902.21 1,095.32
Transfer from Profit and Loss Account 994.56 806.89
2,896.77 1,902.21
Hedge Accounting Reserve - [Note :- 2 (q)] (184.77) (11.37)
Balance in Profit and Loss Account 23,295.51 18,969.85
59,734.15 53,652.13
SCHEDULE 3
Secured Loans
Short Term Loans From Banks [Note: 2 (b)]
Working Capital Demand Loan / Cash Credit 28,455.49 15,681.94
Term Loan(Repayable within one year is Rs. 625 lacs, P.Y. - NIL) 2,500.00 –
30,955.49 15,681.94
SCHEDULE 4
Unsecured Loans
Short Term Loans from Banks 3,596.80 5,308.80
Commercial Paper
- From Banks 1,000.00 2,000.00
- From Others 2,000.00 6,000.00
3,000.00 8,000.00
6,596.80 13,308.80

56 Annual Report 2009 - 2010
(Rs. in Lakhs)As At As At
31.03.2010 31.03.2009
SCHEDULE 6
Investments
Long Term
In Subsidiaries - Unquoted
Investment in Redington International (Holdings) Limited 21,412.33 21,412.33
38,00,000 (P.Y. 38,00,000) Equity Shares fully paid-upin Redington Distribution Pte. Ltd. 1,762.81 1,762.81
13,01,294 (P.Y.13,01,294) Equity Shares of Rs.10/- eachfully paid-up in Cadensworth (India) Ltd 612.27 612.27
15,10,30,000 (P.Y. 8,20,30,000) Equity Shares of Rs.10/-each fully paid-up in Easyaccess Financial Services Ltd 22,074.74 8,274.74
50,000 (P.Y. 25,000) Equity Shares of US$ 1 each fullypaid-up in Redington International Mauritius Limited 22.62 10.78
50,000 (P.Y. 50,000) Equity Shares of Rs.10/- each fullypaid-up in Nook Micro Distribution Limited 15.32 15.32
50,000 (P.Y. 50,000) Equity Shares of Rs.10/- each fullypaid-up in Redington (India) Investments Private Ltd 5.00 5.00
45,905.09 32,093.25
SCHEDULE 5 – Fixed Assets(Rs. in Lakhs)
Gross Block Depreciation Net Block
Description As at As at As at For the As at As at As at01.04.09 Additions Deletions 31.03.10 01.04.09 Year Deletions 31.03.10 31.03.10 31.03.09
A. Tangible Assets
Land 2,607.03 8.52 – 2,615.55 – – – – 2,615.55 2,607.03
Building 623.98 1,424.48 – 2,048.46 96.51 88.47 – 184.98 1,863.48 527.47
Plant and Machinery 683.68 333.75 30.35 987.08 140.76 271.92 28.12 384.56 602.52 542.92
Furniture & Fixtures 1,552.94 586.70 93.90 2,045.74 761.20 465.94 87.57 1,139.57 906.17 791.74
Office Equipments 344.52 117.79 38.92 423.39 121.12 142.30 35.85 227.57 195.82 223.40
Computers 1,620.22 116.53 152.67 1,584.08 981.93 439.37 151.38 1,269.92 314.16 638.29
Vehicles 192.86 62.27 74.93 180.20 47.67 38.68 28.12 58.23 121.97 145.19
B.Intangible Assets
Software 456.32 137.14 – 593.46 412.01 93.82 – 505.83 87.63 44.31
Total 8,081.55 2,787.18 390.77 10,477.96 2,561.20 1,540.50 331.04 3,770.66 6,707.30 5,520.35
Previous Year 7,508.86 1,177.94 605.25 8,081.55 2,521.57 471.08 431.45 2,561.20 5,520.35
Schedules forming part of Balance Sheet

57Mobility, Connectivity, Dependability
SCHEDULE 7Current Assets, Loans and Advances
Current AssetsInventories Trading Stocks 41,920.20 26,786.55
Service Spares 321.01 558.02
42,241.21 27,344.57Sundry Debtors (Unsecured)Over Six Months
Considered Good 4,781.59 3,521.00
Considered Doubtful 508.53 491.04 5,380.12 4,012.04
Other Debts (Considered Good) 63,073.86 60,981.26
68,453.98 64,993.30
Less : Provision for Doubtful Debts 598.53 491.04 67,855.45 64,502.26
Cash and Bank BalancesCash on Hand 15.33 1.34
Remittances in Transit – 11.51
Balances with Scheduled Banks- On Current Account 1,966.84 5,366.12
- On Deposit Account (including margin money forbank guarantees) 14.20 216.75
1,996.37 5,595.72
Loans and Advances
Secured and Considered Good(Secured by deposit of title deed relating to property) 6.38 8.47
Unsecured and Considered Good:Due from Subsidaries
Easyaccess Financial Services Ltd 2.25 22.19
(Maximum amount outstanding at any time during theyear Rs.10038.43 lakhs, P.Y., Rs. 29.71 Lakhs)
Redington Gulf FZE 26.15 0.22
(Maximum amount outstanding at any time during theyear Rs.35.54 lakhs, P.Y., Rs. 16.27 Lakhs)
Nook Micro Distribution Limited 13.61 13.62
(Maximum amount outstanding at any time during theyear Rs.14.09 lakhs, P.Y., Rs. 15.50 Lakhs)
Advances Recoverable in Cash or in kind for value tobe received 820.76 1,430.92
Other Advances 374.53 666.80
Deposits 1,316.88 1,225.44
Prepaid Taxes (Net of Provision Rs. 18,697.31 Lakhs,P.Y. Rs.13064.26 Lakhs) 519.95 868.51
Receivable from Customs Department 4,621.49 3,619.397,702.00 7,855.56
119,795.03 105,298.11
Schedules forming part of Balance Sheet (Rs. in Lakhs)
As At As At31.03.2010 31.03.2009

58 Annual Report 2009 - 2010
Schedules forming part of Balance Sheet (Rs. in Lakhs)
As At As At31.03.2010 31.03.2009
SCHEDULE 8Current Liabilities and Provisions
Current LiabilitiesSundry Creditors- Due to Micro and Small Enterprises
- [Note :- 2(h)] 3.78 Nil- Other than Micro and Small Enterprises
(includes amounts due to subsidiaryRs.231.80 Lakhs, P.Y. Rs.335.16 Lakhs) 48,971.04 38,787.10
- Exchange variation on Foreign Exchange contracts 197.39 11.37Expenses Payable(includes amounts due to subsidiary Rs. 3.60 lakhs,PY Rs. Nil) 6,419.93 5,030.89Unclaimed Dividend * 2.36 1.55Interest accrued but not due on loans 179.00 461.40Other Liabilities 6,767.40 5,033.51
62,540.90 49,325.82* No amount is due and outstanding to be credited
to Investor Education and Protection fund as onMarch 31, 2010.
ProvisionsProposed Dividend 3,942.34 3,114.65Dividend Tax on Proposed Dividend 654.77 529.33Compensated Absences 186.86 189.83Gratuity 313.64 337.55
5,097.61 4,171.36
67,638.51 53,497.18
Schedules forming part of Profit and Loss account (Rs. in Lakhs)
Year Ended Year EndedMarch 31, 2010 March 31, 2009
SCHEDULE 9
Sales and Service IncomeSales 610,116.11 570,270.37
Service Income (Tax deducted at source ofRs.236.45 Lakhs, P.Y. Rs.164.22 Lakhs) 8,782.68 8,019.12
Supplier Rebates and Discounts 26,062.63 28,326.16
644,961.42 606,615.65
SCHEDULE 10
Other IncomeInterest Income on Loan/Trade Debts (Tax deductedat source of Rs.82.07 Lakhs, P.Y. Rs.41.86 Lakhs) 852.21 417.51
Bad Debts written off in earlier years recovered 94.86 32.97
Provision for Doubtful Debts no longer requiredwritten back – 2.69
Miscellaneous Income 79.65 74.54
1,026.72 527.71
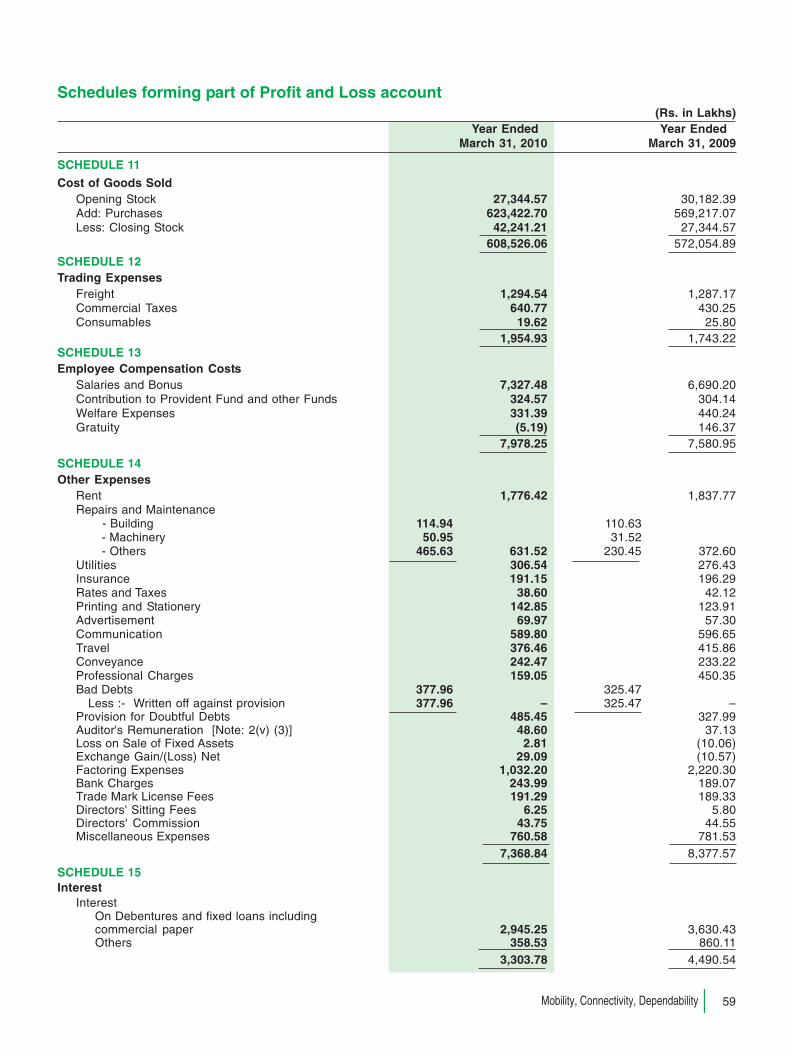
59Mobility, Connectivity, Dependability
Schedules forming part of Profit and Loss account (Rs. in Lakhs)
Year Ended Year EndedMarch 31, 2010 March 31, 2009
SCHEDULE 11
Cost of Goods SoldOpening Stock 27,344.57 30,182.39Add: Purchases 623,422.70 569,217.07Less: Closing Stock 42,241.21 27,344.57
608,526.06 572,054.89
SCHEDULE 12Trading Expenses
Freight 1,294.54 1,287.17Commercial Taxes 640.77 430.25Consumables 19.62 25.80
1,954.93 1,743.22SCHEDULE 13Employee Compensation Costs
Salaries and Bonus 7,327.48 6,690.20Contribution to Provident Fund and other Funds 324.57 304.14Welfare Expenses 331.39 440.24Gratuity (5.19) 146.37
7,978.25 7,580.95
SCHEDULE 14Other Expenses
Rent 1,776.42 1,837.77Repairs and Maintenance - Building 114.94 110.63 - Machinery 50.95 31.52 - Others 465.63 631.52 230.45 372.60Utilities 306.54 276.43Insurance 191.15 196.29Rates and Taxes 38.60 42.12Printing and Stationery 142.85 123.91Advertisement 69.97 57.30Communication 589.80 596.65Travel 376.46 415.86Conveyance 242.47 233.22Professional Charges 159.05 450.35Bad Debts 377.96 325.47 Less :- Written off against provision 377.96 – 325.47 –Provision for Doubtful Debts 485.45 327.99Auditor's Remuneration [Note: 2(v) (3)] 48.60 37.13Loss on Sale of Fixed Assets 2.81 (10.06)Exchange Gain/(Loss) Net 29.09 (10.57)Factoring Expenses 1,032.20 2,220.30Bank Charges 243.99 189.07Trade Mark License Fees 191.29 189.33Directors' Sitting Fees 6.25 5.80Directors' Commission 43.75 44.55Miscellaneous Expenses 760.58 781.53
7,368.84 8,377.57
SCHEDULE 15Interest
InterestOn Debentures and fixed loans includingcommercial paper 2,945.25 3,630.43Others 358.53 860.11
3,303.78 4,490.54

60 Annual Report 2009 - 2010
SCHEDULE 16
Notes on Accounts for the year ended March 31, 2010
1. Significant Accounting Policies
a. Basis of preparation of financial statements
The financial statements have been prepared under the historical cost convention on accrual basis and in accordancewith Generally Accepted Accounting Principles in India (Indian GAAP). The said financial statements comply with therelevant provisions of the Companies Act, 1956 (the Act) and the Accounting Standards notified by the CentralGovernment of India under Companies (Accounting Standard) Rules, 2006, to the extent applicable to the Company.
b. Use of Estimates
The preparation of the financial statements in conformity with the Generally Accepted Accounting Principles requiresestimates and assumptions to be made that affect the reported amount of assets and liabilities and the disclosuresrelating to contingent assets and liabilities as on the date of financial statements and the reported amount of revenuesand expenses during the reporting period. Management believes that the estimates used in the preparation of financialstatements are prudent and reasonable. Actual results could differ from these estimates.
c. Fixed assets
Fixed Assets are recorded at cost less accumulated depreciation. Cost comprises of direct cost, related taxes, duties,freight and attributable finance costs till such assets are ready for its intended use.
d. Depreciation
1. Depreciation is provided on straight line basis based on estimated economic useful life of the asset.
2. Individual asset values up to Rs.5,000/- is fully depreciated in the year of addition.
3. Expenditure on Interiors on premises taken on lease are capitalized and depreciated over a period of five yearswhich however is less than the primary / extended lease period.
4. Depreciation on fixed assets is provided on a straight-line basis over the estimated useful lives, as determined bythe Management at the following rates which are higher than the rates prescribed under Schedule XIV of theCompanies Act, 1956.
Class of Asset Percentage of Depreciation
Buildings 5.00Plant & Machinery 20.00Furniture & Fixtures 25.00Office Equipments 20.00Computers 33.33Vehicles 20.00Software 33.33
5. Depreciation on additions to fixed assets is provided from the month of addition.
e. Impairment of assets
The company determines whether there is any indication of impairment of the carrying amount of its assets. Therecoverable amounts of such assets are estimated, if any indication exists and impairment loss is recognized whereverthe carrying amount of the assets exceeds its recoverable amount. Where it is not possible to estimate the recoverableamount of an individual asset, the company estimates the recoverable amount of the cash-generating unit to which theasset belongs.
f. Leases
Leases are classified as finance or operating leases depending upon the terms of the lease agreements.
g. Investments
Long-term investments are stated at cost of acquisition. Cost for overseas investment comprises the Indian Rupeevalue of the consideration paid for the investment translated at the exchange rate prevalent on the date of investment.Provision for diminution is made if such diminution is considered other than temporary.
h. Inventories
Inventories are valued at lower of cost and net realizable value. Costs include cost of purchase and other costsincurred in bringing the inventories to the warehouse. In respect of Trading stocks and service spares, cost is determinedon weighted average basis.
Schedules forming part of Balance Sheet and Profit and Loss account

61Mobility, Connectivity, Dependability
i. Warranties
The Original Equipment Manufacturer generally warrants the products distributed by the Company. Therefore theCompany does not independently warrant the products it distributes and accordingly no provision for warranties orclaims is required.
j. Revenue Recognition1. Sales revenue is recognized when the ownership and title is transferred on invoicing based on confirmed orders
which generally coincides with delivery. Revenue is stated net of trade discounts and sales tax.2. Service revenue is recognized when services are rendered. Warranty and Maintenance Contracts revenue is
recognized as per the terms of contract.3. Revenue from supplier schemes is accrued, based on the fulfillment of terms of such programs
k. Foreign Currency Transactions
Foreign currency transactions are recorded at the prevailing rate on the date of transaction. Gains or losses onsettlement of the transaction are accounted under appropriate heads in the Profit and Loss account. Monetary assetsand liabilities denominated in foreign currency are restated at the exchange rates as on the Balance Sheet date andexchange gain/loss is suitably dealt with in the Profit and Loss Account. The premium or discount arising at theinception of the foreign exchange contract is amortised as expense or income over the tenor of the contract.
l. Employee Benefits
(i) Short Term Employee Benefits
Short term employee benefits including accumulated compensated absences determined as per Company's policy/scheme are recognized at the Balance Sheet date as expense based on expected obligation on undiscountedbasis.
(ii) Long Term Employee BenefitsDefined Benefit PlanCompensated Absences & GratuityThe liability for Gratuity and compensated absences (Leave benefits) is provided based on actuarial valuation as atthe Balance Sheet date, using the Projected Unit Credit Method. Actuarial gains and losses are recognized in theProfit and Loss Account for the year in which they occur. The retirement benefit obligation recognized in theBalance Sheet represents the present value of the defined benefit obligation as adjusted for unrecognized pastservice cost.
Defined Contribution Plan
Contribution under statutory laws relating to employee benefits, including Provident Fund and ESI, is made inaccordance with the respective rules and is charged to Profit and Loss Account.
m. Provision for taxation
i. Provision for tax is determined in accordance with the provisions of the Income Tax Act, 1961, on the income for theyear chargeable to tax.
ii. Deferred tax assets and liabilities are recognized for the future tax consequences of timing differences between thecarrying values of the assets and liabilities and their respective tax bases using enacted or substantially enactedtax rates. Deferred tax assets, subject to consideration of prudence, are recognized and carried forward to theextent they can be realized.
n. Earnings per share
The earnings considered in ascertaining the Company's earning per share comprise the net profit after tax. Thenumber of shares used in computing basic earnings per share is the weighted average number of shares outstandingduring the year. The number of shares used in computing diluted earnings per share comprises the weighted averagenumber of shares considered for deriving basic earnings per share and also the weighted average number of shares,if any, which would have been issued on the conversion of all dilutive potential equity shares.
o. Provisions, Contingent Liabilities and Contingent Assets
Provisions are recognized only when there is a present obligation as a result of past events and when a reliableestimate of the amount of obligation can be made. Contingent liability is disclosed for (i) Possible obligation which willbe confirmed only by future events not wholly within the control of the Company or (ii) Present obligations arising frompast events where it is not probable that an outflow of resources will be required to settle the obligation or a reliableestimate of the amount of the obligation cannot be made. Contingent assets are not recognized in the financialstatements.
p. Employee Stock Option Scheme
Stock options granted to the employees under the Employee Stock Option Scheme are evaluated in accordance withthe accounting treatment prescribed by the Employee Stock Option Scheme and Employee Stock Purchase SchemeGuidelines, 1999 issued by Securities and Exchange Board of India. The Company follows the intrinsic value methodof accounting for the options and accordingly the excess of market value of the stock options as on date of grant over

62 Annual Report 2009 - 2010
the exercise price of the options, if any, is recognized as deferred employee compensation and is charged to the Profitand Loss Account on graded vesting basis over vesting period of options.
q. Derivative Instruments and Hedge Accounting
The Company uses foreign currency forward contracts to hedge its risks associated with foreign currency fluctuationsrelating to certain firm commitments and highly probable forecast transactions. The Company does not hold derivativefinancial instruments for speculative purposes. The Company has applied to all such contracts outstanding as onMarch 31, 2010 the hedge accounting principles set out in Accounting Standard 30 "Financial Instruments : Recognitionand Measurement" (AS30) by marking them to market. Changes in the fair value of the contracts that are designatedand effective as hedges of future cash flows are recognised directly in Hedging Reserve Account and the ineffectiveportion is recognised in the profit and loss account.
2. Notes forming part of Accounts
a. Utilisation of Initial Public Offer (IPO) Funds As At March 31, 2010(Rs. in Lakhs)
Details 2009-10 2008-09
Proceeds from issue of shares 14,951.03 14,951.03
Less: - Issue Expenses 1,051.53 1,051.53
Net IPO Proceeds 13,899.50 13,899.50
Less: - Utilisation of Funds 13,245.60 11,697.70
Balance of IPO Funds used in working capitalpending deployment 653.90 2,201.80
The proceeds of initial public offer are being utilized for the purposes stated in the offer document. The Company isseeking Share holder's approval for further time to utilize the balance funds beyond the stipulated period in the offerdocument at the ensuing Annual General Meeting.
b. Secured Loans
Working Capital Demand Loan / Cash credits and Term loan are secured by a pari-passu charge on fixed and currentassets.
c. Unsecured Loans
During the year, the Company has privately placed Unsecured Redeemable Non convertible debentures with a dailycall and put option to meet its working capital requirements. There are no amounts outstanding as at March 31, 2010and the maximum amount outstanding any time during the year was Rs. 33,400 lakhs (P.Y. Rs. 49,500 lakhs).
The Company placed Commercial Paper during the year and the maximum amount outstanding at any time during theyear was Rs. 40,500 lakhs (P.Y. Rs.16,000 lakhs).
d. Deferred Tax
Break-up of Deferred Tax Assets and Deferred Tax Liabilities arising on account of timing differences:
(Rs. in Lakhs)
Particulars As at March 31, 2010 As at March 31, 2009
i. Deferred Tax Assets:
Provision for Doubtful Debts 198.82 166.91
Gratuity 104.18 114.73
Compensated Absences 62.07 64.52
Total 365.07 346.16
ii. Deferred Tax Liability:
Depreciation 115.31 359.28
Total 115.31 359.28
Deferred Tax Asset (Net) 249.76 (13.12)

63Mobility, Connectivity, Dependability
e. Depreciation
Hitherto, the Company was depreciating fixed assets at rates specified under Schedule XIV of the Companies Act,1956. During the year, the Company has reviewed the estimated useful life of all assets. In view of the revision in theestimated useful life of its assets, the unamortized depreciable amount is charged over the revised remaining usefullife and consequently the depreciation charge for the year is higher by Rs. 959.11 lacs with a corresponding impact onthe profit for the year.
f. Sundry Debtors
Sundry Debtors are net of amounts received from certain banks/subsidiary pursuant to agreements to purchase /assign certain receivables without recourse.
g. Sundry Creditors
Supplier balances included under Sundry Creditors are net of rebates and discount entitlements from them.
h. Due to Micro and Small Enterprises
In accordance with the Notification No: GSR 719 (E) dated 16.11.2007 issued by the Ministry of Corporate Affairs,certain disclosures are required to be made relating to Micro and Small Enterprises as defined under the Micro, Smalland Medium Development Act, 2006. The Company has circulated the letters and based on confirmation from theparties necessary disclosures are made in the financials.
The amount outstanding for more than 45 days is Rs.Nil (Previous period Rs. Nil) to Micro, Small and Mediumenterprises as per Micro, Small and Medium Enterprises Development Act, 2006 on the basis of such parties havingbeen identified by the Management and relied upon by the auditors.
(Rs. in Lakhs)
Particulars 31st March, 2010 31st March, 2009
Dues outstanding for more than 45 days NIL NIL
Amount remaining unpaid as at the end of the year
- Principal amounts 3.78 NIL
- Interest amounts NIL NIL
The amount of interest paid in terms of section 18, along withthe amounts of the payment made to the supplier beyond theappointed day during the year NIL NIL
The amount of interest due and payable for the period of delayin making payment :
- As per the terms of the contract NIL NIL
- As specified by the Act NIL NIL
The amount of interest accrued and remaining unpaid at theend of the year NIL NIL
i. Contingent Liabilities(Rs. in Lakhs)
Particulars As at March 31, 2010 As at March 31, 2009
1. Guarantees by banks on behalf of the Company 281.10 198.19
2. Corporate Guarantees outstanding
• On behalf of subsidiaries 48,060.62 46,436.47
• Others 321.68 342.55
3. Bills Discounted 2,614.30 3,095.44
4. Factoring 4,625.00 5,825.00
5. Claims against Company not acknowledged as debts 159.53 139.20
6. The Company has in addition to above issued letter of comfort /awareness to banks, with reference to complianceof terms and conditions of the facilities granted to its subsidiaries.

64 Annual Report 2009 - 2010
7. Disputed Income Tax/Sales Tax/Customs Duty demands(Rs. in Lakhs)
Name of the Statute Nature of Dues Financial Forum where As at As atYear Dispute is March March
pending 31, 2010 31, 2009
The Customs Act, 1962 Customs duty Various Years Various appellateAuthorities 64.87 24.82
Income Tax Act, 1961 Income Tax Various years Various appellateAuthorities 130.22 43.91
Sales Tax Act of Sales Tax Various years Various appellatevarious states Authorities 719.13 127.09
Central Sales Tax Act, Sales Tax Various years Various appellate1956 Authorities 61.08 45.29
The Company has been legally advised that the company has a good case and hence no provision is considerednecessary. The Company has paid Rs.226.13 lakhs under protest (P.Y. Rs.109.84 Lakhs), which has been consideredas recoverable.
j. Capital CommitmentsEstimated amount of contracts remaining to be executed on capital account and not provided for, (net of advances) isRs.9.72 Lakhs (P.Y. Rs.1,582.25 Lakhs).
k. GratuityThe Company's obligation towards Gratuity fund is a Defined Benefit Plan and the details of actuarial valuation as atthe year end is given below:
1. Movement (Rs. in Lakhs)
Particulars 2009-10 2008-09
Projected Benefit Obligation at the beginning of the year 337.55 205.36
Service cost 89.60 108.40
Interest Cost 24.61 11.90
Actuarial (gain) / Loss (119.40) 26.07
Benefits paid (18.72) (14.18)
Projected Benefit Obligation at the end of the year 313.64 337.55
Amount recognised in the Balance Sheet:
Projected benefit obligation at the end of the year 313.64 337.55
Fair value of the plan assets at the end of the year NIL NIL
Liability recognised in the Balance Sheet 313.64 337.55
Particulars 2009-10 2008-09Cost of the defined plan for the year:Current service cost 89.60 108.40
Interest on obligation 24.61 11.90
Expected return on plan assets NIL NIL
Net actuarial loss recognized in the year (119.40) 26.07
Net cost / (gain) recognised in the Profit and Loss account (5.19) 146.37
2. Mean Financial Assumptions
Particulars 2009-10 2008-09
Discount Rate 7.5% 6%
Salary escalation rate 5% 5%
Demographic assumptions - Mortality LIC 94-96 rates LIC 94-96 rates
Demographic assumptions - Withdrawal 3% upto age 35 3% upto age 35

65Mobility, Connectivity, Dependability
The amount provided for gratuity as per actuarial valuation has been arrived after considering future salary increase,inflation, seniority and promotion.
l. The Company had entered into an agreement with one of its wholly owned overseas subsidiary for payment of TradeMark License fees for a period of ten years at USD 4,00,000/- per annum with effect from April 1, 2006 and the amountpaid for the year is Rs.191.29 Lakhs (Previous Year Rs.189.33 Lakhs) which is charged to the profit and loss account.
m. Cost of goods sold includes Rs.1,291.39 Lakhs (Previous Year Rs.390.08 Lakhs) on account of foreign exchangeloss on import purchases.
n. The Company's overseas step down subsidiary, Redington International (Holdings) Limited, a company incorporatedin Cayman Islands issued and allotted 7,310 equity shares at USD 47.84 per share to the employees of the Companyand its subsidiaries under an Employee Share Purchase Scheme. This has no financial impact or commitment onthe Company.
o. Operating LeasesThe Company has taken premises on cancelable operating lease for its offices, which are for a period ranging from11 months to 9 years.
p. Segment ReportingThe Company primarily operates in distribution business and after sales services of IT and other products and as therevenue from service segment is less than 10% of the total revenue, there are no reportable segments as required tobe disclosed under the Accounting Standard 17 "Segment Reporting". Although the Company's operations covervarious States in India, the State laws have no significant impact on profitability. Accordingly there are no geographicalsegments to be reported.
q. Accounting for Financial InstrumentsThe Company has recognized Mark to Market (MTM) Losses of Rs. 184.77 Lakhs (P.Year Rs.11.37 Lakhs) relating toforward contracts entered into to hedge the foreign currency risk of highly probable transactions that are designatedas effective cash flow hedges, in the Hedge Reserve Account. The Company has not entered into any speculative/other derivative transaction.Details of Foreign Exchange Contract Exposures as at the year end are as under:
(Rs. In Lakhs)Type of Contract March 31, 2010 March 31, 2009
Forward Contracts entered into to hedge the foreign currencyrisk of highly probable forecast transactions 11,554.05 5,973.03Forward Contracts entered into for import creditors outstanding 57,499.18 37,156.30
r. DividendsSubsequent to the date of approval of the annual accounts by the Board and before the book closure date, 6,04,370equity shares were alloted under the Redington (India) Limited Employee Stock Option Plan 2008 to employees anddividends of Rs. 24.17 lakhs on these shares were paid. The total amount of Rs. 28.28 lakhs including dividenddistribution tax have been appropriated from the opening balance of Profit and Loss Account.
s. Events occurring after the balance sheet dateAfter March 31, 2010, equity shares of Rs.10/- each fully paid up were issued and allotted at a predetermined premiumpursuant to the exercise of stock options under Redington (India) Limited Employee Stock Option Plan 2008.
Date of allotment No. of SharesApril 15, 2010 72,380April 30, 2010 73,715May 14, 2010 64,658
t. Earnings per ShareThe calculation of the Basic and Diluted Earning per share is based on the following data:-
Description March 31,2010 March 31,2009 Profit after Tax (Rs. In Lakhs) 9,945.61 8,068.86Weighted AverageNumber of equity shares (Basic) 7,84,05,200 7,78,65,746Earning per share- Basic Rs. 12.68 10.36Weighted AverageNumber of equity shares (Diluted) 7,92,21,236 7,78,65,746Earning per share- Diluted Rs. 12.55 10.36
Face Value per share in Rs. 10/- 10/-

66 Annual Report 2009 - 2010
u. Related Parties1) Key Management Personnel
Mr. R.Srinivasan, Managing DirectorMr. Raj Shankar, Deputy Managing DirectorMr. M.Raghunandan, Wholetime DirectorRefer Note v (1) for remuneration
2) Names of the related parties
Party where control exists Redington Employees Share Purchase Trust
Parties with Significant Influence Redington (Mauritius) Limited, MauritiusSynnex Mauritius Limited, Mauritius
Subsidiary Companies Nook Micro Distribution Limited, India *Redington (India) Investments Private Limited, India*Cadensworth (India) Limited, India*Easyaccess Financial Services Limited, India*Redington International Mauritius Limited, Mauritius*Redington International (Holdings) Limited, Cayman IslandsRedington Gulf FZE, Dubai*Cadensworth FZE, Dubai*Redington Gulf & Co. LLC, OmanRedington Nigeria Ltd, NigeriaRedington Egypt Ltd, EgyptRedington Kenya Ltd, KenyaRedington Middle East LLC, DubaiRedington Qatar WLL, QatarRedington Arabia Limited, Saudi ArabaRedington Africa Distribution FZE, DubaiRedington Bahrain SPC, BahrainRedington Distribution Pte Ltd, Singapore *Redington Bangladesh Limited, BangladeshRedington Qatar Distribution WLL, QatarRedington Kenya (EPZ) Ltd., KenyaRedington Limited, GhanaRedington Uganda Limited, UgandaAfrica Joint Technical Services, LibyaRGF Private Trust Company Limited, Cayman IslandsCadensworth United Arab Emirates LLC, DubaiRedington Morocco Limited, Morocco.Redington Tanzania Ltd., TanzaniaRedington SL (Private) Limted, Sri Lanka
*Represents companies with whom transactions have taken place during the year.
3) Nature of Transactions(Rs. in Lakhs)
Nature of Transactions Year Ended March 31, 2010 Year Ended March 31, 2009Party Where Control Exists Party Where Control Exists
Redington Employees Share Puchase TrustInterest Income 0.67 0.95Trust Expenses NIL 1.17Amount Receivable at year end NIL 0.76Loan Granted NIL 46.28Dividend Paid 1.39 0.18Loan Repaid 53.78 NILLoan Outstanding NIL 53.78
(Rs. in Lakhs)Nature of Transactions Year Ended March 31, 2010 Year Ended March 31, 2009
Parties with Parties withSignificant Influence Significant Influence
Redington (Mauritius) LimitedDividend Paid 1,356.06 1,186.56Synnex Mauritius LimitedDividend Paid 881.53 771.34

67Mobility, Connectivity, Dependability
(Rs. in Lakhs)Nature of Transactions Year Ended March 31, 2010 Year Ended March 31, 2009
Subsidiary Companies Subsidiary CompaniesNook Micro Distribution LimitedRent 6.00 6.00Interest Income 1.48 1.78Consultancy charges -Expenses 4.00 NILSales/Service Charges- Income 0.77 NILAmount Receivable at year end (Net) 10.01 13.62Investments at year end 15.32 15.32Redington (India) Investments Private LtdSales/Service Charges - Income 0.45 NILInterest Income 0.01 NILSales/Service Charges - Expenses 3.00 NILLoan Granted 2.00 NILLoan Repaid 2.00 NILInvestments at year end 5.00 5.00Easyaccess Financial Services LtdLease Rent NIL 4.21Sales/Service Charges - Income 18.58 58.64Receivables Factored 195,966.16 185,780.63Factoring Expenses 910.26 1,709.56Interest Income 281.81 0.98Amount Receivable at year end 2.25 22.19Loan Granted 52,000 NILLoan Repaid 52,000 NILEquity Contribution 13,800 NILInvestments at year end 22,074.74 8,274.74Cadensworth (India) LtdPurchase of Fixed Assets NIL 0.41Sales/Service Charges - Expense 12.29 10.33Sales/Service Charges - Income 2.45 0.34Interest Income NIL 0.22Amount Payable at year end 5.26 9.75Loan Granted NIL 52.40Loan Repaid NIL 52.40Investments at year end 612.27 612.27Redington Distribution Pte LtdTrading Purchases 2,604.04 2,603.56Sales/Service Charges 2.15 190.69Trade Mark License Fees 191.29 189.33Amount Payable at year end (Net) 226.54 367.60Investments at year end 1,762.81 1,762.81Corporate Guarantees given 9,563.70 10,803.36Redington International Mauritius LtdEquity Contribution 11.84 10.78Investments at year end 22.62 10.78Redington International (Holdings) LtdInvestments at year end 21,412.33 21,412.33Redington Gulf FZEAmount Receivable at year end 26.15 0.22Corporate Guarantees given 29,516.92 35,633.11Cadensworth FZETrading Purchases 0.95 1.07Amount Payable at year end NIL 0.51Corporate Guarantees given 8,980.00 NIL

68 Annual Report 2009 - 2010
v. Additional information pursuant to the provisions of Part II of Schedule VI of the Companies Act, 1956:
1. Managerial Remuneration
(Rs. in Lakhs)
ParticularsYear Ended Year Ended
March 31, 2010 March 31, 2009
(a) Computation of net profit under section 349 of theCompanies Act, 1956
Profit before Taxation 15,315.78 12,425.11
Add:
Wholetime Director Remuneration 39.06 43.08
Directors' Sitting Fees 6.25 5.80
Directors' Commission 43.75 44.55
Provision for Doubtful Debts 485.45 574.51 327.99 421.42
15890.29 12846.53
Less :Profit/(loss) on Disposal of Fixed Assets (Net) (2.81) 10.06
Debts written off against previous year provisionand not debited to P&L account 377.96 375.15 325.47 335.53
15,515.14 12,511.00
Commission @ 1% thereon 155.15 125.11
Restricted to 43.75 44.55
(b) Remuneration to Wholetime Director
1) Salaries, Allowances & Bonus 36.30 40.15
2) Contribution to Provident Fund* 1.44 1.44
3) Perquisites 1.32 1.49
Total 39.06 43.08
(c) Remuneration to Non-Wholetime DirectorsSitting Fees 6.25 5.80Commission 43.75 44.55
Total 50.00 50.35
*Excludes contribution to gratuity & compensated absences since employee wise valuation is not available
(d) Remuneration drawn overseas by the Managing Director/ Deputy Managing Director from wholly ownedoverseas subsidiary
(Rs. in Lakhs)
ParticularsYear Ended Year Ended
March 31, 2010 March 31, 2009
Salary, Allowances and Bonus 393.91 414.34
Contribution to provident fund 3.81 4.14
Total 397.72 418.48
2. Quantitative Particulars
Particulars Year Ended March 31, 2010 Year Ended March 31, 2009
Qty Value Qty Value(Nos.) (Rs in Lakhs) (Nos.) (Rs in Lakhs)
Opening Stock 727,920 26,786.55 9,63,562 29,855.13
Purchases 16,055,486 625,249.76 15,615,440 567,201.79
Sales 15,643,776 610,116.11 15,851,082 570,270.37
Closing Stock 11,39,630 41, 920.20 727,920 26,786.55
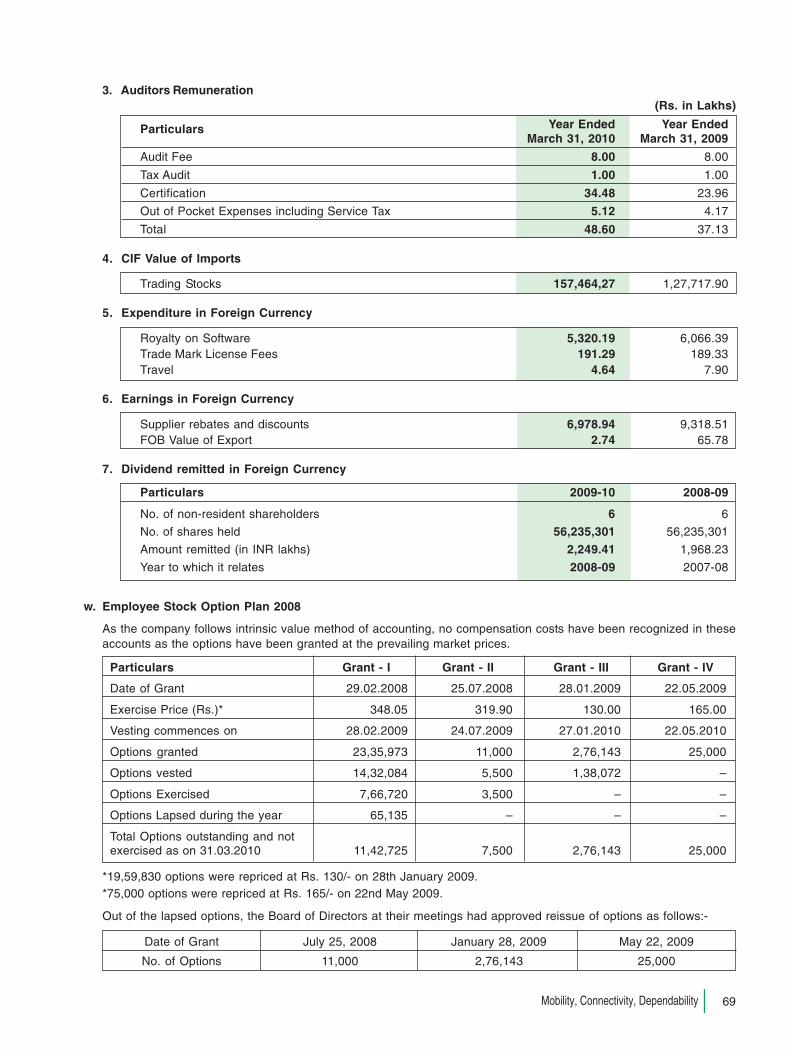
69Mobility, Connectivity, Dependability
3. Auditors Remuneration(Rs. in Lakhs)
Year Ended Year EndedParticularsMarch 31, 2010 March 31, 2009
Audit Fee 8.00 8.00
Tax Audit 1.00 1.00
Certification 34.48 23.96
Out of Pocket Expenses including Service Tax 5.12 4.17
Total 48.60 37.13
4. CIF Value of Imports
Trading Stocks 157,464,27 1,27,717.90
5. Expenditure in Foreign Currency
Royalty on Software 5,320.19 6,066.39Trade Mark License Fees 191.29 189.33Travel 4.64 7.90
6. Earnings in Foreign Currency
Supplier rebates and discounts 6,978.94 9,318.51FOB Value of Export 2.74 65.78
7. Dividend remitted in Foreign Currency
Particulars 2009-10 2008-09
No. of non-resident shareholders 6 6
No. of shares held 56,235,301 56,235,301
Amount remitted (in INR lakhs) 2,249.41 1,968.23
Year to which it relates 2008-09 2007-08
w. Employee Stock Option Plan 2008
As the company follows intrinsic value method of accounting, no compensation costs have been recognized in theseaccounts as the options have been granted at the prevailing market prices.
Particulars Grant - I Grant - II Grant - III Grant - IV
Date of Grant 29.02.2008 25.07.2008 28.01.2009 22.05.2009
Exercise Price (Rs.)* 348.05 319.90 130.00 165.00
Vesting commences on 28.02.2009 24.07.2009 27.01.2010 22.05.2010
Options granted 23,35,973 11,000 2,76,143 25,000
Options vested 14,32,084 5,500 1,38,072 –
Options Exercised 7,66,720 3,500 – –
Options Lapsed during the year 65,135 – – –
Total Options outstanding and notexercised as on 31.03.2010 11,42,725 7,500 2,76,143 25,000
*19,59,830 options were repriced at Rs. 130/- on 28th January 2009.*75,000 options were repriced at Rs. 165/- on 22nd May 2009.
Out of the lapsed options, the Board of Directors at their meetings had approved reissue of options as follows:-
Date of Grant July 25, 2008 January 28, 2009 May 22, 2009
No. of Options 11,000 2,76,143 25,000

70 Annual Report 2009 - 2010
The fair value of options based on the valuation of the independent valuer as of the respective dates of grant are given below:
Grant Date 29-Feb-08Repriced on Repriced on
25-Jul-08Repriced on
28-Jan-09 22-May-0928-Jan-09 22-May-09 28-Jan-09
Fair Value 171.33 25.56 33.04 159.71 23.77 47.46 79.82
Assumptions:
Stock Price: The stock price of the Company is the closing price of the Company's equity share on the NSE on the day priorto the date of grant
Volatility: Volatility is a measure of the amount by which a price has fluctuated or is expected to fluctuate during a period. Themeasure of volatility used in the Black-Scholes option-pricing model is the annualized standard deviation of the continuouslycompounded rates of return on the stock over a period of time. The period to be considered for volatility has to be adequate torepresent a consistent trend in the price movements. It is also important that movements due to abnormal events get evenedout. The entity's stocks have been publicly traded from February 15, 2007 on NSE & BSE.
Exercise Price: Options have been granted primarily at a price of Rs.348.05 on 29th February 2008. Subsequently, 19,59,830and 75,000 options were re-priced at a Market price of Rs. 130/- and Rs. 165/- on 28th January 2009 and 22nd May 2009respectively.
Risk free interest rate: The risk-free interest rate being considered for the calculation is the interest rate applicable formaturity equal to the expected life of the options based on the zero-coupon yield curve for Government Securities.
Time of Maturity: Time to Maturity / Expected life of options is the period for which the Company expects the options to be live.The minimum life of stock option is the minimum period before which the options cannot be exercised and the maximum life isthe period after which the options cannot be exercised. The fair value of each award has been determined based on differentexpected lives of the options that vest each year, as if the award were separate awards, each with a different vesting date.A weighted average of 3 vests has been calculated to arrive at the value of the options granted.
Expected Dividend yield: Expected dividend yield has been calculated as an average of dividend yields for the preceding2 years to the year of grant.
The impact on the profit of the Company as at the year end and the basic and diluted earnings per share, had the Companyfollowed the fair value method of accounting for stock options is set out below:
(Rs. in lakhs)
Particulars 2009-10 2008-09
Profit after tax as per Profit and Loss Account (a) 9,945.61 8,068.86
Add: Employee Stock Compensation Expense as per Intrinsic Value Method NIL NIL
Less: Employee Stock Compensation Expense as per Fair Value Method 850.93 2,569.08
Profit after tax recomputed for recognition of employee stock compensation expenseunder fair value method (b) 9,094.68 5,499.78
Earnings per share based on earnings as per (a) above– Basic 12.68 10.36– Diluted 12.55 10.36
Earnings per share had fair value method been employed for accounting of employeestock options as per (b) above
– Basic 11.60 7.06– Diluted 11.48 7.06
x. Previous year figures have been regrouped wherever necessary to conform to the current year's classification.

71Mobility, Connectivity, Dependability
BALANCE SHEET ABSTRACT AND COMPANY’S GENERAL BUSINESS PROFILE
I Registration Details
Registration No State Code
Balance Sheet Date
II Capital raised during the year (Rs. in Thousands)
Public Issue Rights Issue
Bonus Issue Private Placement
III Position of Mobilisation and Deployment of Funds (Rs. in Thousands)
Total Liabilities Total assets
SOURCES OF FUNDS
Paid-up Capital Reserves & Surplus
Secured Loans Unsecured Loans
APPLICATION OF FUNDS
Net Fixed Assets Investments
Net Current Assets Misc. Expenditure
Accumulated Losses
IV Performance of Company (Rs. in Thousands)
Turnover (incl. Other Income Total Expenditure
+/- Profit/Loss before tax +/- Profit/Loss after tax
Earning per Share (in Rs.) (Basic) Dividend Rate %
Earning per Share (in Rs.) (Diluted)
V Generic Names of Three Principal Products/Services of the Company (As per monetary terms)
Item Code No. (ITC Code) Product Description
Place : ChennaiDate : May 21, 2010
2 8 7 5 8
3 1 - 0 3 - 1 0
N I L
N I L
1 0 5 1 5 0 0 4
7 8 6 3 6 0
3 0 9 5 5 4 9
6 8 3 8 6 7
5 2 1 5 6 5 2
6 4 5 9 8 8 1 4
1 5 3 1 5 7 8
1 2 . 6 8
1 8
N I L
N I L
1 0 5 1 5 0 0 4
5 9 7 3 4 1 5
6 5 9 6 8 0
4 5 9 0 5 0 9
N I L
6 3 0 6 7 2 3 6
9 9 4 5 6 1
5 0
N A N A
N I L
1 2 . 5 5
72 Annual Report 2009 - 2010
ConsolidatedFinancial Statements

73Mobility, Connectivity, Dependability
AUDITORS’ REPORT TO THE BOARD OF DIRECTORS OF REDINGTON (INDIA) LIMITED
1. We have audited the attached Consolidated Balance Sheet of REDINGTON (INDIA) LIMITED ("the Company"), its
subsidiaries (the Company and its subsidiaries constitute "the Group") as at 31st March, 2010, the Consolidated Profit and
Loss Account and the Consolidated Cash Flow Statement of the Group for the year ended on that date, both annexed
thereto. These financial statements are the responsibility of the Company's Management and have been prepared on the
basis of the separate financial statements and other information regarding components. Our responsibility is to express an
opinion on these Consolidated Financial Statements based on our audit.
2. We conducted our audit in accordance with the auditing standards generally accepted in India. Those Standards require
that we plan and perform the audit to obtain reasonable assurance about whether the financial statements are free of
material misstatements. An audit includes examining, on a test basis, evidence supporting the amounts and the disclosures
in the financial statements. An audit also includes assessing the accounting principles used and the significant estimates
made by the Management, as well as evaluating the overall financial statement presentation. We believe that our audit
provides a reasonable basis for our opinion.
3. We did not audit the financial statements of certain subsidiaries and joint ventures, whose financial statements reflect total
assets of Rs.178,946.08 lacs, as at 31st March, 2010, total revenues of Rs.735,525.80 lacs and net cash inflows amounting
to Rs.1,934.58 lacs for the year ended on that date as considered in the Consolidated Financial Statements. These financial
statements have been audited by other auditors whose reports have been furnished to us and our opinion in so far as it
relates to the amounts included in respect of these subsidiaries and joint ventures is based solely on the reports of the
other auditors.
4. We report that the Consolidated Financial Statements have been prepared by the Company in accordance with the
requirements of Accounting Standard 21 (Consolidated Financial Statements) as notified under the Companies (Accounting
Standards) Rules, 2006.
5. Based on our audit and on consideration of the separate audit reports on the individual financial statements of the Company,
and the aforesaid subsidiaries and joint ventures and associates, and to the best of our information and according to the
explanations given to us, in our opinion, the Consolidated Financial Statements give a true and fair view in conformity with
the accounting principles generally accepted in India:
(i) in the case of the Consolidated Balance Sheet, of the state of affairs of the Group as at 31st March, 2010;
(ii) in the case of the Consolidated Profit and Loss Account, of the profit of the Group for the year ended on that date and
(iii) in the case of the Consolidated Cash Flow Statement, of the cash flows of the Group for the year ended on that date.
For Deloitte Haskins & SellsChartered Accountants
(Registration No. 008072 S)
M.K. AnanthanarayananPlace : Chennai PartnerDate : May 21, 2010 Membership No. 19521

74 Annual Report 2009 - 2010
CONSOLIDATED BALANCE SHEET AS AT MARCH 31, 2010 (INR in Lakhs)
As At As AtSchedule 31.03.2010 31.03.2009
Sources of Funds
Shareholders’ FundsShare Capital 1 7,863.60 7,786.57Reserves and Surplus 2 99,708.63 92,433.03
107,572.23 100,219.60
Minority Interest 24,025.29 24,133.16Loan Funds
Secured Loans 3 59,987.07 33,140.42
Unsecured Loans 4 54,872.26 65,158.02114,859.33 98,298.44
246,456.85 222,651.20
Application of FundsFixed Assets 5Gross Block 16,002.90 13,539.49
Less: Depreciation 7,532.54 5,892.78Net Block 8,470.36 7,646.71Add: Capital Advances 1,210.35 1,151.89
9,680.71 8,798.60
Deferred Tax asset (Net) - [Note: 4(d)] 337.58 36.14
Current Assets, Loans and Advances 6
Inventories 98,284.92 77,935.71Sundry Debtors 181,643.50 140,456.70Cash and Bank Balances 58,260.21 60,238.65
Loans and Advances 15,185.18 14,658.53353,373.81 293,289.59
Less: Current Liabilities and Provisions 7
Current Liabilities 110,897.97 74,626.85Provisions 6,037.28 4,846.28
116,935.25 79,473.13
Net Current Assets 236,438.56 213,816.46
246,456.85 222,651.20
Notes on Accounts 14
Schedules 1 to 7 and 14 form part of this Consolidated Balance Sheet
In terms of our report attached For and on behalf of the Board
For Deloitte Haskins & Sells R Srinivasan Raj Shankar M RaghunandanChartered Accountants Managing Director Dy. Managing Director Wholetime Director
M K Ananthanarayanan S V Krishnan M MuthukumarasamyPartner Chief Financial Officer Company Secretary
Place : ChennaiDate : May 21, 2010

75Mobility, Connectivity, Dependability
CONSOLIDATED PROFIT AND LOSS ACCOUNT FOR THE YEAR ENDED MARCH 31, 2010
(INR in Lakhs)2009-10 2008-09
Schedule March 31, 2010 March 31, 2009
INCOME
Sales and Service Income 8 1,375,775.15 1,266,827.48Other income 9 2,090.15 1,481.57
1,377,865.30 1,268,309.05EXPENDITURE
Cost of goods sold 1,303,314.39 1,200,569.06Trading Expenses 10 3,492.74 3,247.48Employee Compensation Costs 11 16,549.94 15,027.04Other Expenses 12 17,935.75 16,508.01
1,341,292.82 1,235,351.59
Profit before Interest, Depreciation and Tax 36,572.48 32,957.46Interest 13 6,637.62 9,781.97Depreciation 2,343.15 1,273.72
Profit Before Tax 27,591.71 21,901.77
Provision for taxation - Current Tax 6,690.85 4,919.88- Deferred Tax (301.16) (30.41)- Fringe benefit Tax – 6,389.69 108.55 4,998.02
Profit after Tax 21,202.02 16,903.75Minority interest 2,769.04 937.62
Profit for the year 18,432.98 15,966.13
Balance Brought Forward 24,538.78 35,137.16Less :- Transfer to Capital Reserve – 21,973.08Less :- Dividend including Dividend Distribution
Tax for previous year [Note no: 4(n)] 28.28 24,510.50 – 13,164.08
Profit available for appropriation 42,943.48 29,130.21
AppropriationsTransfer to General Reserve 994.56 806.89Proposed Dividend 3,942.34 3,114.65Corporate Dividend Tax on Proposed Dividend 704.94 529.33Transfer to Statutory Reserve 258.04 140.56Balance carried forward to Consolidated Balance Sheet 37,043.60 24,538.78
42,943.48 29,130.21
EPS- Basic (Face Value - Rs.10 Per Share) 23.51 20.50EPS- Diluted (Face Value - Rs.10 Per Share) 23.27 20.50
Notes on Accounts 14
Schedules 8 to 14 form part of this Consolidated Profit and Loss Account
In terms of our report attached For and on behalf of the Board
For Deloitte Haskins & Sells R Srinivasan Raj Shankar M RaghunandanChartered Accountants Managing Director Dy. Managing Director Wholetime Director
M K Ananthanarayanan S V Krishnan M MuthukumarasamyPartner Chief Financial Officer Company Secretary
Place : ChennaiDate : May 21, 2010

76 Annual Report 2009 - 2010
CONSOLIDATED CASH FLOW STATEMENT FOR THE YEAR ENDED MARCH 31, 2010 (INR in Lakhs)
Particulars Year Ended Year EndedMarch 31, 2010 March 31, 2009
Cash flow from operating activities:Net Profit before taxation 27,591.71 21,901.77Adjustments for:
- Depreciation 2,343.15 1,273.72- Interest Expense 6,637.62 9,781.97- Interest Income (1,837.93) (1,296.08)- Provision for Doubtful debts 1,464.87 621.48- Provision for Doubtful debts written back – (2.69)- Bad debts written off 30.31 173.27- Provision for compensated absences 50.19 84.78- Provision for gratuity 243.61 541.89- Unrealised Foreign Exchange Variation (Net) 120.31 227.27- Equity settled reserve – 12.48- (Profit) / Loss on sale of fixed assets 2.81 (5.39)
Operating Profit before working capital changes 36,646.65 33,314.47Increase in Sundry Debtors (42,681.98) (33,367.01)Decrease in Loans and advances 5,554.26 1,513.24Increase in Inventories (20,349.21) (6,056.89)Increase in Current liabilities 29,147.60 1,872.12Cash generated from / (used in) operations 8,317.32 (2,724.07)Interest Paid by Financial Services Subsidiary (989.76) (1,444.69)Direct taxes paid (6,222.06) (5,800.89)Net Cash generated from/(used in) operating activities 1,105.50 (9,969.65)Cash flow from investing activities:Purchase of fixed assets (3,487.04) (2,760.27)Proceeds from sale of fixed assets 58.54 188.33Interest received 1,925.30 1,296.08Loan granted to ESPS Trust – (46.28)Loan settled by ESPS Trust 53.78 –Deposits placed (3,893.78) –Investment in subsidiaries – (10.78)Net Cash used in investing activities (5,343.20) (1,332.92)Cash flow from financing activities:Proceeds from issue of share capital by a subsidiary 156.99 34,402.13Proceeds from issue of share capital by parent company 1,012.23 –Proceeds from long term borrowing 2,500.00 –Proceeds from short term borrowings (Net) 14,060.89 19,903.08Dividends Paid, including dividend tax (3,671.45) (3,186.91)Interest paid (5,615.81) (8,337.29)Net Cash generated from financing activities 8,442.85 42,781.01Net increase in cash and cash equivalents 4,205.15 31,478.44Cash and cash equivalents at the beginning of the year 60,238.65 18,295.31Opening cash balances of subsidiaries acquired &consolidated during the year – 10.78Currency Translation Adjustment (10,077.37) 10,454.12Cash and cash equivalents at the end of the year 54,366.43 60,238.65Reconciliation of Cash and cash equivalentsCash and cash equivalents at the end of the year asper Balance Sheet 58,260.21 60,238.65Less: Bank deposits held for more than three months 3,893.78 –Cash and cash equivalents at the end of the year 54,366.43 60,238.65
In terms of our report attached For and on behalf of the Board
For Deloitte Haskins & Sells R Srinivasan Raj Shankar M RaghunandanChartered Accountants Managing Director Dy. Managing Director Wholetime Director
M K Ananthanarayanan S V Krishnan M MuthukumarasamyPartner Chief Financial Officer Company Secretary
Place : ChennaiDate : May 21, 2010

77Mobility, Connectivity, Dependability
Schedules forming part of Consolidated Balance Sheet
(INR in Lakhs)As At As At
31.03.2010 31.03.2009
SCHEDULE 1
Share Capital
Authorised
8,50,00,000 Equity Shares of Rs.10/- each 8,500.00 8,500.00
Issued, Subscribed and Paid up7,86,35,966 (P.Y. 7,78,65,746) Equity Shares ofRs.10/- each Fully Paid up (includes 1,46,93,796shares issued for consideration other than cash) 7,863.60 7,786.57
SCHEDULE 2Reserves and Surplus
Capital Reserve
Balance as on 01.04.2009 32,505.05 239.97Adjustments on consolidation 2,148.25 32,265.08Currency translation adjustment (6,396.93) 28,256.37 32,505.05
Securities Premium Account
Balance as on 01.04.2009 32,791.44 32,791.44
Received during the year 935.20 33,726.64 – 32,791.44
General Reserve
Balance as on 01.04.2009 1,902.21 1,095.32
Transfer from Profit and Loss Account 994.56 2,896.77 806.89 1,902.21
Statutory ReserveBalance as on 01.04.2009 164.98 56.69
Transfer from Profit and Loss Account 258.04 140.56
Adjustments on consolidation – 423.02 (32.27) 164.98
Hedge Accounting Reserve (184.77) (11.37)
Employee Share Purchase Reserve 11.05 12.48
Foreign Currency Translation Reserve Balance as on 01.04.2009 765.72 (1,037.08) Adjustments during the year (992.12) (226.40) 1,802.80 765.72
Profit and Loss AccountBrought forward from Profit and Loss Account 37,043.60 24,538.78Adjustments on consolidation (2,237.65) 34,805.95 (236.26) 24,302.52
99,708.63 92,433.03
SCHEDULE 3Secured Loans
Loans from Banks
Working Capital Demand Loan / Cash Credit 57,487.07 33,140.42
Term Loan 2,500.00 –
59,987.07 33,140.42

78 Annual Report 2009 - 2010
SCHEDULE 5 – Fixed Assets(INR in Lakhs)
Gross Block Depreciation Net Block
A.Tangible Assets
Land 2,607.02 8.52 – – 2,615.54 – – – – – 2,615.54 2,607.02
Buildings 653.46 1,424.48 – – 2,077.94 103.14 91.90 – – 195.04 1,882.90 550.32
Plant and Machinery 1,068.50 337.07 30.35 – 1,375.22 384.10 315.23 28.12 – 671.21 704.01 684.40
Furniture & Fixtures 4,619.32 892.99 96.30 (332.59) 5,083.42 2,331.82 991.64 88.43 (196.24) 3,038.79 2,044.63 2,287.50
Office Equipments 662.06 185.08 39.13 (35.80) 772.21 282.97 201.09 35.98 (19.03) 429.05 343.16 379.09
Computers 1,910.50 222.55 152.67 (31.13) 1,949.25 1,162.82 497.12 151.38 (18.02) 1,490.54 458.71 747.68
Vehicles 635.76 156.36 74.93 (67.55) 649.64 318.18 116.88 28.12 (34.83) 372.11 277.53 317.58
B.Intangible Assets
Software 1,382.87 201.53 – (104.72) 1,479.68 1,309.75 129.29 – (103.24) 1,335.80 143.88 73.12
Total 13,539.49 3,428.58 393.38 (571.79) 16,002.90 5,892.78 2,343.15 332.03 (371.36) 7,532.54 8,470.36 7,646.71
Previous Year 11,386.34 1,943.61 683.11 892.65 13,539.49 4,595.49 1,273.72 500.17 523.74 5,892.78 7,646.71 6,790.85
SCHEDULE 4
Unsecured Loans
Commercial Paper 3,000.00 8,000.00
Non-Convertible Debentures – 6,400.00
Short Term Loans from Banks
Short Term Loans / Cash Credit 51,872.26 50,758.02
54,872.26 65,158.02
Schedules forming part of Consolidated Balance Sheet
(INR in Lakhs)As At As At
31.03.2010 31.03.2009
As
at01
.04.
2009
Ad
dit
ion
s
Dis
po
sal
Tran
slat
ion
adju
stm
ent
As
at31
.03.
2010
As
at01
.04.
2009
Fo
r th
e ye
ar
Del
etio
n
Tran
slat
ion
adju
stm
ent
As
at31
.03.
2010
As
at31
.03.
2010
As
at31
.03.
2009
Description

79Mobility, Connectivity, Dependability
Schedules forming part of Consolidated Balance Sheet (INR in Lakhs)
As At As At31.03.2010 31.03.2009
SCHEDULE 6
Current Assets, Loans and Advances
InventoriesTrading Stocks 97,963.91 76,352.51Service Spares 321.01 98,284.92 1,583.20 77,935.71
Sundry Debtors (Unsecured)Over Six MonthsConsidered Good 5,116.27 3,771.11Considered Doubtful 665.35 566.54
5,781.62 4,337.65Less than Six Months
Considered Good 176,527.23 136,685.59Considered Doubtful 1,900.71 1,150.77
184,209.56 142,174.01Less : Provision for Doubtful Debts 2,566.06 181,643.50 1,717.31 140,456.70
Cash and Bank BalancesCash on Hand 314.95 114.20Remittances in Transit – 11.51Balances with Banks- On Current Account 10,332.11 15,601.08- On Deposit Account 47,081.10 43,465.50- On Other Deposits (including margin money for
bank guarantees) 532.05 58,260.21 1,046.36 60,238.65Loans and AdvancesSecured and Considered Good 6.38 8.47Unsecured and Considered Good:Advances Recoverable in Cash or in kind for value
to be received 2,335.58 3,925.41Other Advances 6,262.07 4,828.13Deposits 1,693.11 1,587.65Advance tax including TDS receivable 261.09 671.85Receivable from Customs 4,621.49 3,637.02Accrued interest 5.46 –
15,185.18 14,658.53
353,373.81 293,289.59SCHEDULE 7
Current Liabilities and ProvisionsCurrent LiabilitiesSundry Creditors 87,160.26 55,115.04Interest accrued but not due 179.00 463.96Expenses Payable 11,774.41 10,396.35Liabilities relating to foreign exchange contracts 197.39 11.37Unclaimed Dividend 2.36 1.55Other Liabilities 11,584.55 110,897.97 8,638.58 74,626.85
ProvisionsProposed Dividend 3,942.34 3,114.65Tax on Dividend 704.94 529.33Provision for standard assets 120.00 –Provision For Compensated absences 189.97 194.00Provision For Gratuity / End of Service Indemnity 1,080.30 6,037.28 1,008.30 4,846.28
116,935.25 79,473.13

80 Annual Report 2009 - 2010
SCHEDULE 8
Income from Operations
Sales 1,279,785.87 1,160,176.92
Service Income 31,913.46 29,136.68
Suppliers Rebates and Discounts (Net) 61,533.25 76,450.34
Financial services 2,542.57 1,063.54
1,375,775.15 1,266,827.48
SCHEDULE 9
Other Income
Interest Income 1,837.93 1,296.08
Bad debts written off in earlier years recovered 94.86 95.00
Provision for Doubtful Debts no longer required written back – 2.69
Miscellaneous Income 157.36 87.80
2,090.15 1,481.57
SCHEDULE 10
Trading Expenses
Freight 2,832.35 2,791.43
Commercial Taxes 640.77 430.25
Consumables 19.62 25.80
3,492.74 3,247.48
SCHEDULE 11
Employee Compensation
Salaries and Bonus 15,576.14 13,675.15
Contribution to Provident Fund and other Funds 364.58 344.42
Welfare Expenses 365.61 465.58
Gratuity/End of service indemnity 243.61 541.89
16,549.94 15,027.04
Schedules forming part of Consolidated Profit and Loss account (INR in Lakhs)
Year Ended Year EndedMarch 31, 2010 March 31, 2009

81Mobility, Connectivity, Dependability
Schedules forming part of Consolidated Profit and Loss account (INR in Lakhs)
Year Ended Year EndedMarch 31, 2010 March 31, 2009
SCHEDULE 12
Other Expenses
Rent 3,643.65 3,418.47
Repairs and Maintenance 1,226.07 946.77
Utilities 450.08 371.26
Insurance 1,388.19 1,161.08
Rates and Taxes 97.96 46.08
Printing and Stationery 270.28 206.04
Advertisement / Sales promotion 2,039.96 958.91
Communication 1,375.12 1,264.83
Travel 1,210.98 1,276.46
Conveyance 244.41 237.64
Professional Charges 811.98 996.56
Bad Debts 408.27 498.74
Less: Written off against opening provision 377.96 30.31 325.47 173.27
Provision for doubtful debts 1,464.87 621.48
Loss on Sale of Assets/Assets Discarded (Net) 2.81 (5.39)
Auditor's Remuneration (including subsidiaries' auditors) 306.98 157.50
Factoring Expenses 121.94 510.74
Bank charges 1,288.65 1,087.70
Exchange loss 106.99 1,039.66
Directors' Sitting Fees 8.25 8.75
Directors' Commission 61.75 55.05
Provision for standard assets 120.00 –
Miscellaneous Expenses 1,664.52 1,975.12
17,935.75 16,508.01
SCHEDULE 13Interest
Interest on Loans
To Banks 4,504.07 6,689.79
To Others 1,565.00 495.36
Interest on Debentures 568.55 2,596.82
6,637.62 9,781.97

82 Annual Report 2009 - 2010
Notes to consolidated accounts for the year ended March 31, 2010
1. Status and Operations
Redington (India) Limited (Company), registered under the Indian Companies Act is the distributor for Information Technologyproducts, Telecom products and Consumer Durables for Indian market. The Company also renders after sales service.The Company has wholly owned subsidiaries in Mauritius and Singapore viz. Redington International Mauritius Limitedand Redington Distribution Pte. Ltd. The principal activity of Redington International Mauritius Limited is to hold investmentsin overseas subsidiaries dealing in wholesale distribution of Information Technology and telecom products, their parts andtheir subsequent after sales service. The principal activity of Redington Distribution Pte Limited and its subsidiary iswholesale distribution of Information Technology products and their parts in Singapore and Bangladesh. The Companyalso operates in NBFC segment through its wholly owned subsidiary Easyaccess Financial Services Limited.
2. Basis of consolidation
The consolidated financial statement comprises financial statements of Redington (India) Limited and its subsidiaries (Group),drawn up to March 31, 2010. These consolidated financial statements have been prepared in accordance with AccountingStandard 21, "Consolidated Financial Statements" which is not materially different from International Financial ReportingStandards. Subsidiary companies considered in these consolidated financial statements are:
Schedules forming part of Consolidated Balance Sheet and Profit and Loss Account
SCHEDULE 14
A. Immediate Subsidiaries
Name of the Company Country of Effective date of Ownershipincorporation control/acquisition Interest%
Nook Micro Distribution Limited India April 1, 1995 100Redington (India) Investments Private Limited India June 28, 1995 100Redington International Mauritius Limited Mauritius July 16, 2008 100Redington Distribution Pte. Limited Singapore April 1, 2005 100Cadensworth (India) Limited India April 1, 2005 100Easyaccess Financial Services Limited India January 10, 2008 100
B. Subsidiaries of Redington International Mauritius Limited
Name of the Company Country of Effective date of Ownership Beneficialincorporation investment / acquisition Interest% Interest%
Redington International (Holdings) Cayman Islands July 14, 2008 69.63 69.63Limited
C. Subsidiary of Redington International (Holdings) Limited
Name of the Company Country of Effective date of Ownership Beneficialincorporation investment / acquisition Interest% Interest%
Redington Gulf FZE Dubai, UAE November 13, 2008 100 100
D. Subsidiaries of Redington Gulf FZE
Name of the Company Country of Effective date of Ownership Beneficialincorporation Investment / acquisition Interest% Interest%
Redington Egypt Ltd Egypt February 9, 2000 100 100Redington Nigeria Ltd Nigeria October 15, 2002 100 100Redington Gulf & Co. LLC Oman November 11, 2003 70 100Redington Kenya Ltd Kenya July 19, 2004 100 100Cadensworth FZE Dubai, UAE March 29, 2005 100 100Redington Middle East LLC ^ Dubai July 1, 2005 49 100Redington Arabia Limited Saudi Arabia December 1, 2005 100 100Redington Africa Distribution FZE Dubai, UAE December 1, 2005 100 100Redington Qatar WLL ^ Qatar December 1, 2005 49 100Redington Bahrain SPC Bahrain March 26, 2007 100 100

83Mobility, Connectivity, Dependability
Name of the Company Country of Effective date of Ownership Beneficialincorporation Investment / acquisition Interest% Interest%
Redington Qatar Distribution WLL ^ Qatar August 15, 2007 49 100Redington Limited Ghana November 28, 2008 100 100Redington Kenya EPZ Ltd Kenya December 10, 2008 100 100Africa Joint Technical Services Libya May 7, 2008 65 100Redington Uganda Ltd Uganda January 9, 2009 100 100RGF Private Trust Company Limited Cayman Isands February 24, 2009 100 100Redington Morocco Ltd ** Morocco October 5, 2009 100 100Redington Tanzania Ltd ** Tanzania August 13, 2009 100 100Cadensworth UAE LLC ^ Dubai, UAE May 5, 2009 49 100
^ Although the percentage of holding is less than 50, the Company has the power to govern the strategic operating andfinancial decisions and exercise control. Consequently, the above-mentioned are consolidated with the Group'sfinancial statements.
** Yet to commence operations.
E. Subsidiary of Redington Distribution Pte. Ltd.
Name of the company Country of Effective date Ownership Beneficialincorporation of acquisition Interest% Interest%
Redington Bangladesh Limited Bangladesh June 24, 2005 99 100Redington SL (Private) Limited ** Sri Lanka October 28, 2009 100 100
** Yet to commence operations.
The following have been considered in preparing the consolidated financial statements:
a. Financial Statements of Redington (India) Limited and Easyaccess Financial Services Limited prepared in accordance withIndian Generally Accepted Accounting Principles (Indian GAAP) under historical cost convention on the accrual basis andaudited by Deloitte Haskins and Sells, Chartered Accountants, Chennai.
b. Financial statements of Cadensworth (India) Limited, Nook Micro Distribution Limited and Redington (India) InvestmentsPrivate Limited prepared in accordance with Indian Generally Accepted Accounting Principles (Indian GAAP) under historicalcost convention on the accrual basis and audited by M/s. A S Varadharajan & Co., Chartered Accountants, Chennai
c. Consolidated financial statements of Redington International Mauritius Limited prepared in accordance with InternationalFinancial Reporting Standards (IFRS) and audited by Deloitte & Touche (M.E.),
d. Consolidated financial statements of Redington Distribution Pte. Limited prepared under Singapore Financial ReportingStandards and audited by Ernst & Young.
Necessary adjustments have been made in the consolidated financial statements to confirm to Indian GAAP wherever there aresignificant differences between Indian GAAP / Singapore Financial Reporting Standards / IFRS.
The audited financial statements of the Parent Company and its Indian subsidiaries and the consolidated financial statements ofRedington International Mauritius Limited and Redington Distribution Pte Limited used in the consolidation are drawn up to thesame reporting date as of the Company.
The consolidated financial statements have been prepared using uniform accounting policies and on the following basis:a) The financial statements of the Company and its subsidiary companies have been combined on a line-by-line basis by
adding together like items of assets, liabilities, income and expenses. Inter Company balances and transactions and unrealizedprofits or losses have been fully eliminated.
b) Capital Reserve arising on consolidation represents the excess of net worth over the carrying cost of acquisition of therespective subsidiaries. Goodwill arising on consolidation represents the excess of carrying cost of acquisition of subsidiariesover the net worth of the respective subsidiaries. Such capital reserve has been adjusted against the goodwill in thepresentation of consolidated financial statements.
c) The notes to the consolidated financial statements are prepared under the requirements of Indian GAAP.
3. Significant accounting policies
a. Basis of preparation of Consolidated Financial Statements
The financial statements have been prepared under the historical cost convention on accrual basis and in accordancewith Generally Accepted Accounting Principles in India (Indian GAAP). The said financial statements comply with therelevant provisions of the Companies Act, 1956 (the Act) and the Accounting Standards notified by the Central Governmentof India under Companies (Accounting Standard) Rules, 2006, to the extent applicable to the Company.
Financial Statements have been prepared in accordance with International Financial Reporting Standards (IFRS) forRedington International Mauritius and its subsidiaries and the provisions of Singapore Financial Reporting Standards forRedington Distribution Pte. Ltd. and its subsidiary. The Consolidated Financial Statements of Overseas Subsidiaries

84 Annual Report 2009 - 2010
have been regrouped and recast to conform to the preparation of financial statements in accordance with Indian GAAP.Necessary adjustments have been made in the consolidated financial statements to bring them in line with Indian GAAP.
b. Use of estimatesThe preparation of the financial statements in conformity with the generally accepted accounting principles requiresestimates and assumptions to be made that affect the reported amount of assets and liabilities and the disclosuresrelating to contingent assets and liabilities as on the date of financial statements and the reported amount of revenuesand expenses during the reporting period. Management believes that the estimates used in the preparation of financialstatements are prudent and reasonable. Actual results could differ from these estimates.
c. Fixed Assets and Depreciationi. Fixed Assets are recorded at cost less accumulated depreciation. Cost comprises of direct cost, related taxes,
duties, freight and attributable finance costs till such assets are ready for its intended use.ii. Depreciation is provided on straight line basis based on estimated economic useful life of the asset.iii. Individual asset values up to Rs.5,000/- is fully depreciated in the year of addition in the Parent company and its
Indian subsidiaries.iv. Expenditure on Interiors on premises taken on lease are capitalized and depreciated over a period of five years
which however is less than the primary / extended lease period.v. Depreciation on fixed assets is provided on a straight-line basis over the estimated useful lives, as determined by the
Management at the following rates:
Asset category Percentage of Depreciation
Building 5.00Plant and Machinery 20.00Furniture and Fixtures 25.00Office Equipments 20.00Computers 33.33Vehicles 20.00Intangible assets 33.33
vi. Depreciation on additions to fixed assets is provided from the month of addition.
d. Impairment of assetsThe Group determines whether there is any indication of impairment of the carrying amount of its assets. Therecoverable amounts of such assets are estimated, if any indication exists and impairment loss is recognized whereverthe carrying amount of the assets exceeds its recoverable amount. Where it is not possible to estimate the recoverableamount of an individual asset, the Group estimates the recoverable amount of the cash-generating unit to which theasset belongs.
e. LeasesLeases are classified as finance or operating leases depending upon the terms of the lease agreements.
f. InventoriesInventories are valued at lower of cost and net realizable value. Cost includes cost of purchase and other costsincurred in bringing the inventories to their warehouse. In respect of Trading stocks and service spares, cost isdetermined on weighted average basis. Cost is determined on weighted average method (on FIFO method by thestep down subsidiaries of Redington International Mauritius Limited).
g. WarrantiesThe original equipment manufacturer generally warrants the products distributed by the group. Therefore, the groupdoes not independently warrant the product it distributes and accordingly no provision for warranties or claims isrequired.
h. Revenue Recognitioni. Sales revenue is recognized when the ownership and title is transferred on invoicing based on confirmed orders,
which generally coincides with delivery. Revenue is stated net of trade discounts and sales tax.ii. Service revenue is recognized when services are rendered. Warranty and Maintenance Contracts revenue is
recognized as per the terms of contract.iii. Revenue from supplier schemes is accrued, based on the fulfillment of terms of such programs.iv. Lease income is accrued over the period of lease.v. Interest on loans is recognized on accrual basis.
i. Foreign Currency Transactions
Foreign currency transactions are recorded at the prevailing rate on the date of transaction. Gains or losses onsettlement of the transaction are accounted under appropriate heads in the Profit and Loss Account. Monetaryassets and liabilities denominated in foreign currency are restated at the exchange rates as on the Balance Sheet

85Mobility, Connectivity, Dependability
date and exchange gain / loss is suitably dealt with in the Profit and Loss Account. The premium or discount arisingat the inception of the foreign exchange contract is amortized as expense or income over the tenor of the contract
The assets and liabilities of foreign subsidiaries whose operations are of non-integral nature are translated at theclosing exchange rates, the items of income and expense of foreign subsidiaries are translated at average exchangerate and resulting exchange differences are classified as cumulative translation adjustment and debited / credited toForeign Currency Translation Reserve.
The assets and liabilities of foreign subsidiaries are translated at the closing exchange rates at Rs.44.90 per USD.Income and expenses of foreign subsidiaries are translated at average exchange rates at Rs.47.5242 per USD
j. Employee benefits
(i) Short Term Employee Benefits
Short term employee benefits including accumulated compensated absences determined as per Company's policy/scheme are recognized at the Balance Sheet date as expense based on expected obligation on undiscounted basis.
(ii) Long Term Employee Benefits
Defined Benefit Plan
Compensated Absences & Gratuity:
The liability for Gratuity and compensated absences (Leave benefits) is provided based on actuarial valuation as atthe Balance Sheet date, using the Projected Unit Credit Method. Actuarial gains and losses are recognized in theProfit and Loss Account for the year in which they occur. The retirement benefit obligation recognized in the BalanceSheet represents the present value of the defined benefit obligation as adjusted for unrecognized past service cost.With respect to overseas subsidiaries provision for employee's end of service indemnity is made in accordance withthe laws as applicable in respective countries.
Defined Contribution Plan
Contribution under statutory laws relating to employee benefits, including Provident Fund and ESI, is made inaccordance with the respective rules and is charged to Profit and Loss Account.
k. Provision for Taxation
i. Provision for tax is determined in accordance with the tax laws of respective countries, on the income for the yearchargeable to tax.
ii. Deferred tax assets and liabilities are recognized for the future tax consequences of timing differences between thecarrying values of the assets and liabilities and their respective tax bases using enacted or substantially enacted taxrates. Deferred tax assets, subject to consideration of prudence, are recognized and carried forward to the extentthey can be realized.
l. Earnings per share
The earnings considered in ascertaining the Group's earning per share comprise the net profit after tax. The number ofshares used in computing basic earnings per share is the weighted average number of shares outstanding during theyear. The number of shares used in computing diluted earnings per share comprises the weighted average number ofshares considered for deriving basic earnings per share and also the weighted average number of shares, if any, whichwould have been issued on the conversion of all dilutive potential equity shares.
m. Provisions, Contingent Liabilities and Contingent Assets
Provisions are recognized only when there is a present obligation as a result of past events and when a reliable estimateof the amount of obligation can be made. Contingent liability is disclosed for (i) Possible obligation which will beconfirmed only by future events not wholly within the control of the Company or (ii) Present obligations arising from pastevents where it is not probable that an outflow of resources will be required to settle the obligation or a reliable estimateof the amount of the obligation cannot be made. Contingent assets are not recognized in the financial statements.
n. Employee Stock Option Scheme
Stock options granted to the employees by the company under the Employee Stock Option Scheme are evaluated inaccordance with the accounting treatment prescribed by the Employee Stock Option Scheme and Employee StockPurchase Scheme Guidelines, 1999 issued by Securities and Exchange Board of India. The Company follows theintrinsic value method of accounting for the options and accordingly the excess of market value of the stock options ason date of grant over the exercise price of the options, if any, is recognized as deferred employee compensation and ischarged to the Profit and Loss Account on graded vesting basis over vesting period of options.
o. Derivative Instruments and Hedge Accounting
The Group uses foreign currency forward contracts and currency options to hedge its risks associated with foreigncurrency fluctuations relating to certain firm commitments and highly probable forecast transactions. The Group doesnot hold derivative financial instruments for speculative purposes. The Group has applied to all such contracts outstanding

86 Annual Report 2009 - 2010
as on March 31, 2010 the hedge accounting principles set out in Accounting Standard 30 "Financial Instruments :Recognition and Measurement" (AS30) by marking them to market. Changes in the fair value of the contracts that aredesignated and effective as hedges of future cash flows are recognized directly in Hedging Reserve Account and theineffective portion is recognized in the profit and loss account.
p. Financial risk management objectives
The fair value of financial assets and liabilities approximate the carrying values in the Balance Sheet as of March31,2010 as these assets and liabilities are substantially due to be realized and settled within a period of one year in thenormal course of the Group's business.
The financial risk management policies are discussed by the management of the Group on a regular basis to ensure thatthese are in line with the overall business strategies and its risk management philosophy. Management sets policieswhich seek to minimize potential adverse effects of financial performance of the Group. The Management providesnecessary guidance / instructions to the employees covering specific areas.
There has been no change to the Group exposure to these financial risks or the manner in which it manages andmeasures the risk.
q. Segment Accounting
The generally accepted accounting principles used in the preparation of the financial statements are applied to recordrevenue and expenditure in individual segments. Segment revenue and segment results include transfers betweensegments and such transfers are eliminated in the consolidation of the segments. Expenses that are directly identifiableto segments are considered for determining the segment result. Segment assets and liabilities include those directlyidentifiable with the respective segments.
4. Notes forming part of Accounts
a) Minority Interest
The step down subsidiary issued and allotted 7,310 equity shares to the employees of the Parent Company and itssubsidiaries under an Employee Share Purchase Scheme during the year.
b) Secured Loans
Working Capital Demand Loan / Cash credits and Term Loans are secured by a pari-passu charge on the Fixed Assetsand Current Assets.
The Parent Company has issued letter of awareness to banks, with reference to compliance of terms and conditions ofthe facilities granted to its subsidiaries.
c) Unsecured Loans
During the year, the Company and one of its wholly owned subsidiaries has privately placed Unsecured RedeemableNon convertible debentures with a daily call and put option to meet its working capital requirements. There are noamounts are outstanding as at March 31, 2010.
Bank borrowings of Redington Distribution Pte. Limited and Redington International Mauritius Limited are secured byassignment of insurance policies over inventories, Time deposits and continuing corporate guarantees of Redington(India) Limited.
d) Deferred Tax
Breakup of Deferred Tax Assets and Deferred Tax liabilities arising on account of timing differences:
INR in Lakhs
Particulars As at March As at March31, 2010 31, 2009
i. Deferred Tax Assets:Provision for doubtful debts 198.81 166.91Gratuity & Compensated absences 169.66 183.40Others 60.56 16.32
Total 429.03 366.63ii. Deferred Tax Liability:
Depreciation 91.45 330.49Total 91.45 330.49Net Deferred Tax Asset 337.58 36.14

87Mobility, Connectivity, Dependability
e) Inventories
Out of the total inventories, Rs.53,065.96 Lakhs (P.Y Rs.48,605.64 lakhs) pertain to step down subsidiaries of RedingtonInternational Mauritius Limited are valued on FIFO basis or net realizable value whichever is lower. The rest of inventoriesare valued at weighted average cost or net realizable value whichever is lower (Refer Policy no: 3 (f)). The inventoriesinclude goods in transit of Rs.1,024.97 lakhs (P.Y Rs.1,338.47 lakhs).
f) Sundry Debtors
Receivables are stated at their value as reduced by appropriate allowance for estimated doubtful debts. Sundry debtorsare net of amounts received from certain banks pursuant to agreements to purchase/assign certain receivables withoutrecourse.
g) Sundry Creditors
Sundry Creditors are stated at their nominal value. Supplier balances included under Sundry Creditors are net of rebatesand discount entitlements from them.
h) Revenue recognition
Out of the total sales, Rs.6,69,677.65 lakhs (P.Y Rs.5,90,074.03 lakhs) pertaining to overseas subsidiaries have beenrecognized on the basis of deliveries (Policy no: 3 (h)).
i) Gratuity / End of service indemnity
The Group's obligation towards gratuity/end of service indemnity fund is a Defined Benefit Plan and the details ofvaluation as at March 31, 2010 is given below:
INR in lakhs
Particulars 2009-10 2008-09
Projected Benefit Obligation as at April 1, 2009 1,008.30 552.64
Service cost 340.44 503.50
Interest Cost 25.18 12.15
Actuarial Gain / (Loss) (122.01) 26.24
Benefits paid 46.80 (104.71)
Currency translation (86.11) 18.48
Projected Benefit Obligation as at March 31, 2010 1,212.61 1,008.30
Amount recognised in the Balance Sheet:
Projected benefit obligation at the end of the year 1,080.03 1,008.30
Fair value of the plan assets at the end of the year NIL NIL
Liability recognised in the Balance Sheet 1,080.03 1,008.30
Cost of the defined plan for the year:
Current service cost 340.44 501.89
Interest on obligation 25.18 12.15
Expected return on plan assets NIL NIL
Net actuarial gains recognized in the year (122.01) 27.85
Net cost recognised in the Profit and Loss account 243.61 541.89
Mean Financial Assumptions for Parent Company & its Indian Subsidiaries:
Particulars 2009-10 2008-09
Discount Rate 7.5% 6%
Salary escalation rate 5% 5%
Demographic assumptions - Mortality LIC 94-96 rates LIC 94-96 rates
Demographic assumptions - Withdrawal 3% up to age 35 3% upto age 35
The amount provided for gratuity as per actuarial valuation has been arrived after considering future salary increase,inflation, seniority and promotion for Parent Company and Indian subsidiary.

88 Annual Report 2009 - 2010
For Redington International Mauritius Limited and its subsidiaries, provision for end of service indemnity has beenmade in accordance with local labour laws of the countries where each entity is established and is based on currentremuneration and cumulative service period at the balance sheet date.
j) Depreciation
During the year, the Company and its Indian subsidiaries reviewed the estimated useful life of all assets. In view of therevision in the estimated useful life of its assets, the unamortized depreciable amount is charged over the revisedremaining useful life and consequently the depreciation charge for the year is higher by Rs.867.37 lakhs with acorresponding impact on the profit for the year.
k) Contingent Liabilities
INR in lakhs
As at March As at March 31, 2010 31, 2009
a. Guarantees by banks 832.00 740.80
b. Disputed Income Tax / Sales Tax /Customs Duty demands- Disputed customs duty 64.87 24.82- Disputed sales tax demand 780.21 172.38- Disputed Income tax demand 136.19 49.88
c. Letter of Credit 2,402.15 2,333.12
d. Bills discounted* 2,584,94 5,341.40
e. Claims against the Company not acknowledged as debts 162.24 139.20
f. Corporate guarantees issued to others 321.68 342.55
g. Factoring* 2,000.00 4,250.00
* Net of intra group transaction
l) Capital Commitments
Estimated amount of contracts remaining to be executed on capital account and not provided for (net of advances)Rs.2467.41 lakhs (Previous year Rs 1618.79 lakhs)
m) Statutory Reserve
Profit and Loss Account include Rs.22.85 lakhs representing statutory reserves required by the local laws of the countrieswhere overseas subsidiaries are domiciled, created by allocating a certain percentage of net profits for the year. Thesereserves are not distributable except as provided by the relevant country's law.
n) Dividends
Subsequent to the date of approval of the annual accounts by the Board and before book closure date, 6,04,370 equityshares were allotted under the Redington (India) Limited Employee Stock Option Plan 2008 to employees and dividendof Rs.24.17 lakhs on these shares were paid. The total amount of Rs.28.28 lakhs including dividend distribution taxhave been appropriated from the opening balance of the Profit and Loss Account.
o) Earnings per Share
Earnings per share - Basic and Diluted
The net profit for the year as numerator and the weighted average number of equity shares as the denominator has beenused in calculating the basic earnings per share
Description March 31, 2010 March 31, 2009
Profit after Tax (Rs. in Lakhs) 18,432.98 15,966.13
Weighted Average - Number of equity shares (Basic) 7,84,05,200 7,78,65,746
Earnings per share - Basic Rs. 23.51 20.50
Numerator-Profit after Tax (Rs. in Lakhs) 18,432.98 15,966.13
Weighted Average - Number of equity shares (Diluted) 7,92,21,236 7,78,65,746
Face Value per share in Rs. 10/- 10/-
Earnings per share - Diluted Rs. 23.27 20.50

89Mobility, Connectivity, Dependability
p) Segmental ReportingThe Company has identified geographic segment as its primary segment. Geographical segments are reported Viz.,India and Overseas. Secondary segments identified are Distribution & Service business and financial service business.
Primary segment INR in Lakhs
Particulars India Overseas Eliminations Consolidated2009-10 2008-09 2009-10 2008-09 2009-10 2008-09 2009-10 2008-09
REVENUEExternal Revenue 648,679.75 608,656.56 729,185.55 659,652.48 – – 1,377,865.30 1,268,309.04Inter segment revenue 2.15 196.87 2,792.38 2,744.42 (2794.53) (2941.29) – –Total Revenue 648,681.90 608,853.43 731,977.93 662,396.90 (2794.53) (2941.29 1,377,865.30 1,268,309.04PBT 17,313.90 13,532.85 10,277.81 8,368.92 27,591.71 21,901.77Segment Assets 186,357.64 147,097.48 177,319.83 155,762.89 (285.37) (735.94) 363,392.10 302,124.43Segment Liabilities 139,356.64 103,833.35 92,739.19 71,025.89 (301.25) (731.55) 231,794.58 174,127.69Other Information :Depreciation 1,665.43 669.91 677.72 603.81 2,343.15 1,273.72Capital Expenditure 2,881.58 1,330.37 547.02 613.24 3,428.60 1,943.61
Secondary segment INR in LakhsParticulars Distribution & Service Financial Services Eliminations Consolidated
2009-10 2008-09 2009-10 2008-09 2009-10 2008-09 2009-10 2008-09REVENUEExternal Revenue 1,375,314.55 1,267,241.92 2,550.75 1,067.12 – – 1,377,865.30 1,268,309.04Inter segment revenue 910.26 1,713.77 (910.26) (1,713.77) – –
Total Revenue 1,375,314.55 1,267,241.92 3,461.01 2,780.89 (910.26) (1,713.77) 1,377,865.30 1,268,309.04PBT 25,614.25 20,832.63 1,977.46 1,069.14 27,591.71 21,901.77Segment Assets 305,216.17 268,935.24 58,278.18 33,925.13 (102.25) (735.94) 363,392.10 302,124.43Segment Liabilities 197,699.83 149,975.27 34,499.06 24,883.97 (404.31) (731.55) 231,794.58 174,127.69Other Information :Depreciation 2,291.07 1,250.26 52.08 23.46 2,343.15 1,273.72Capital Expenditure 3,339.73 1,832.55 88.87 111.06 3,428.60 1,943.61
q) Accounting for Financial Instruments
The Parent Company has recognized Mark to Market (MTM) Losses of Rs.184.77 lakhs (PY -Rs. 11.37 Lakhs) as ofMarch 31,2010 relating to forward contracts entered into to hedge the foreign currency risk of highly probable transactionsthat are designated as effective cash flow hedges, in the Hedge Reserve Account. The Parent Company and its subsidiarieshave not taken any forward contract for speculative purposes.
r) Assets on leaseParticulars in terms of Accounting Standard 19 on lease transactions:Finance Lease Assets
INR in lakhs
As at March As at March 31, 2010 31, 2009
Gross Investment 145.84 204.56
Net Investment 124.58 166.02
Maturity pattern on gross/ Present Value of Minimum Lease PaymentINR in lakhs
Lease Rental receivable Gross NetLess than 1 year 65.59 51.25Later than 1 year, but less than 5 years 80.25 73.33Later than 5 years – –Total 145.84 124.58
Unearned Finance Charges – 21.25

90 Annual Report 2009 - 2010
s) Related Parties
i) Key Management PersonnelMr. R Srinivasan, Managing DirectorMr. Raj Shankar, Deputy Managing DirectorMr. M Raghunandan, Wholetime Director
ii) Name of the related parties
Party where control exists Redington Employees Share Purchase Trust
Parties with Significant Influence Redington (Mauritius) Limited, MauritiusSynnex Mauritius Limited, Mauritius
iii) Remuneration to Key Management Personnel - Rs. 39.06 Lakhs (2008-09 Rs. 43.08 Lakhs) (Key ManagementPersonnel of Parent Company). Rs.467.30 Lakhs ^ (2008-09 - Rs. 454.87 Lakhs) (Key Management Personnel ofOverseas subsidiaries).^ Remuneration paid by overseas subsidiaries includes amounts paid to Managing Director and Deputy Managing
Director of the parent company. They however, do not receive any remuneration from the parent company.
iv) Nature of Transactions INR in lakhs
Nature of transactionParty where control exists
2009-10 2008-09Interest Income 0.67 0.95Dividend paid 1.39 0.18Trust Expenses NIL 1.17Loan granted NIL 46.28Loan repaid 53.78 NILLoan outstanding NIL 53.78Amount Receivable at the end of the year NIL 0.76
INR in Lakhs
Nature of transactionParties with significant influence
2009-10 2008-09Redington (Mauritius) LimitedDividend Paid 1,356.06 1,186.56Synnex Mauritius LimitedDividend Paid 881.53 771.34
t) Events occurred after Balance Sheet DateAfter March 31, 2010, equity shares of Rs.10/- each fully paid up were issued and allotted at a pre-determined premiumpursuant to the exercise of stock options under Redington (India) Limited Employee Stock Option Plan 2008.
Date of allotment No. of SharesApril 15, 2010 72,380April 30, 2010 73,715May 14, 2010 64,658
u) Employee Stock Option Plan 2008As the company follows intrinsic value method of accounting, no compensation costs have been recognized in theseaccounts as the options have been granted at the prevailing market prices.
Particulars Grant - I Grant - II Grant - III Grant - IVDate of Grant 29.02.2008 25.07.2008 28.01.2009 22.05.2009Exercise Price (Rs.)* 348.05 319.90 130.00 165.00Vesting commences on 28.02.2009 24.07.2009 27.01.2010 22.05.2010Options granted 23,35,973 11,000 2,76,143 25,000Options vested 14,32,084 5,500 1,38,072 -Options Exercised 7,66,720 3,500 - -Options Lapsed during the year 65,135 - - -Total Options outstanding andnot exercised as on 31.03.2010 11,42,725 7,500 2,76,143 25,000
*19,59,830 options were repriced at Rs. 130/- on 28th January 2009.*75,000 options were repriced at Rs. 165/- on 22nd May 2009.

91Mobility, Connectivity, Dependability
Out of the lapsed options, the Board of Directors at their meetings had approved reissue of options as follows:-
Date of Grant July 25, 2008 Jan 28, 2009 May 22,2009
No. of Options 11,000 2,76,143 25,000
The fair value of options based on the valuation of the independent valuer as of the respective dates of grant are givenbelow:
Grant Date 29-Feb-08Repriced on Repriced on
25-Jul-08Repriced on
28 Jan-09 22-May-0928-Jan-09 22-May-09 28-Jan-09
Fair Value 171.33 25.56 33.04 159.71 23.77 47.46 79.82
Assumptions:
Stock Price: The stock price of the Company is the closing price of the Company's equity share on the NSE on theday prior to the date of grant
Volatility: Volatility is a measure of the amount by which a price has fluctuated or is expected to fluctuate duringa period. The measure of volatility used in the Black-Scholes option-pricing model is the annualized standarddeviation of the continuously compounded rates of return on the stock over a period of time. The period to beconsidered for volatility has to be adequate to represent a consistent trend in the price movements. It is alsoimportant that movements due to abnormal events get evened out. The entity's stocks have been publicly traded fromFebruary 15, 2007 on NSE & BSE.
Exercise Price: Options have been granted primarily at a price of Rs.348.05 on 29th February 2008. Subsequently,19,59,830 and 75,000 options were re-priced at a Market price of Rs.130/- and Rs.165/- on 28th January 2009 and22nd May 2009 respectively.
Risk free interest rate: The risk-free interest rate being considered for the calculation is the interest rate applicablefor maturity equal to the expected life of the options based on the zero-coupon yield curve for Government Securities.
Time of Maturity: Time to Maturity / Expected life of options is the period for which the Company expects the optionsto be live. The minimum life of stock option is the minimum period before which the options cannot be exercisedand the maximum life is the period after which the options cannot be exercised. The fair value of each award hasbeen determined based on different expected lives of the options that vest each year, as if the award were separateawards, each with a different vesting date. A weighted average of 3 vests has been calculated to arrive at the valueof the options granted.
Expected Dividend yield: Expected dividend yield has been calculated as an average of dividend yields for thepreceding 2 years to the year of grant.
The impact on the profit of the Company as at the year end and the basic and diluted earnings per share, had theCompany followed the fair value method of accounting for stock options is set out below:
INR in lakhs2009-10 2008-09
Profit after tax as per Profit and Loss Account (a) 18,432.98 15,966.13
Add: Employee Stock Compensation Expense as per Intrinsic Value Method NIL NIL
Less: Employee Stock Compensation Expense as per Fair Value Method 850.93 2569.08
Profit after tax recomputed for recognition of employee stock compensationexpense under fair value method (b) 17,582.05 13,397.05
Earnings per share based on earnings as per (a) above - Basic 23.51 20.50
Earnings per share based on earnings as per (a) above - Diluted 23.27 20.50
Earnings per share had fair value method been employed for accounting ofemployee stock options - Basic 22.42 17.21
Earnings per share had fair value method been employed for accounting ofemployee stock options - Diluted 22.19 17.21
v) Previous year figures have been regrouped to conform to current year classifications

92 Annual Report 2009 - 2010
Inve
stm
ent
othe
r tha
nPr
ofit
Prov
isio
nPr
ofit
Sl.N
oNa
me o
f Com
pany
Repo
rting
Exch
ange
Tota
lTo
tal
inve
stm
ent
Befo
refo
rAf
ter
Prop
osed
Curre
ncy
Rate
Capi
tal
Rese
rves
Asse
tsLi
abili
ties
in su
bsid
iary
Turn
over
Taxa
tion
Taxa
tion
Tax
Div
iden
dCo
untry
1No
ok M
icro D
istrib
ution
Lim
ited
INR
1.00
005.
007.
3623
.49
11.1
3–
6.00
2.19
1.74
0.45
–IN
DIA
2Re
dingt
on (I
ndia)
Inve
stmen
ts Pr
ivate
Lim
ited
INR
1.00
005.
005.
9711
.08
0.11
–3.
000.
130.
040.
09–
INDI
A
3Ea
syac
cess
Fina
ncial
Ser
vices
Lim
ited
INR
1.00
0015
103.
0086
76.1
258
278.
1834
499.
06–
3460
.28
1977
.46
687.
2912
90.1
730
2.06
INDI
A
4Ca
dens
worth
(Ind
ia) L
imite
dIN
R1.
0000
130.
1310
89.5
812
83.1
763
.46
–37
1.63
18.3
19.
368.
95–
INDI
A
5Re
dingt
on B
angla
desh
Lim
ited
TAKA
0.64
8719
.46
6.97
31.7
35.
30–
–2.
13–
2.13
–BA
NGLA
DESH
6Re
dingt
on D
istrib
ution
Pte
. Lim
ited
USD
44.9
000
1796
.00
2530
.51
1530
4.48
1097
7.97
–70
821.
6787
4.09
171.
0970
3.01
–SI
NGAP
ORE
7Re
dingt
on G
ulf F
ZEAE
D12
.225
014
67.0
048
125.
4515
1335
.87
1017
43.4
2–
5959
75.7
846
26.4
749
.98
4576
.49
–UA
E
8Re
dingt
on G
ulf a
nd C
o. L
LCRO
116.
6017
4.90
82.4
950
2.73
245.
34–
783.
6782
.70
5.48
77.2
2–
OMAN
9Re
dingt
on N
igeria
Lim
ited
NN0.
2999
29.9
9(4
80.2
0)75
16.3
079
66.5
1–
3596
2.62
409.
7063
.63
346.
07–
NIGE
RIA
10Re
dingt
on E
gypt
Lim
ited
LE8.
4864
4.24
133.
3938
31.6
836
94.0
5–
1418
7.81
66.0
816
.30
49.7
8–
EGYP
T
11Re
dingt
on K
enya
Lim
ited
SH0.
5811
5.81
(483
.67)
8129
.18
8607
.04
–20
1032
7.95
484.
08–
484.
08–
KENY
A
12Ca
dens
worth
FZE
AED
12.2
250
122.
2538
61.0
613
439.
8894
56.5
7–
4026
6.28
988.
45–
988.
45–
UAE
13Re
dingt
on M
iddle
East
LLC
AED
12.2
250
36.6
811
81.3
972
79.1
960
61.1
2–
4751
6.49
333.
44–
333.
44–
UAE
14Re
dingt
on Q
atar
WLL
QR12
.339
224
.68
687.
8211
08.2
739
5.77
–20
66.7
427
6.08
42.5
623
3.52
–QA
TAR
15Re
dingt
on A
frica
Dist
ribut
ion F
ZEAE
D12
.225
012
2.25
1306
.24
1677
6.95
1534
8.46
–12
7169
.10
1278
.62
–12
78.6
2–
UAE
16Re
dingt
on A
rabia
Lim
ited
SR11
.971
011
9.71
753.
3824
28.1
715
55.0
8–
4330
.93
114.
5329
.33
85.2
0–
SAUD
I ARA
BIA
17Re
dingt
on B
ahra
in SP
CBD
119.
0716
59.5
4(5
.42)
286.
1523
2.03
–57
6.65
56.5
7–
56.5
7–
BAHR
AIN
18Re
dingt
on Q
atar
Dist
ribut
ion C
ompa
ny W
.L.L
.QR
12.3
392
24.6
8(1
0.09
)96
.34
81.7
5–
–31
.02
–31
.02
–QA
TAR
19Re
dingt
on In
tern
ation
al (H
olding
s) L
imite
dUS
D44
.900
06.
7167
789.
3567
830.
8134
.75
––
(10.
78)
–(1
0.78
)–
CAYM
AN IS
LAND
S
20Re
dingt
on In
tern
ation
al M
aurit
ius Li
mite
dUS
D44
.900
022
.45
(14.
72)
13.3
55.
62–
–(8
.23)
–(8
.23)
–M
AURI
TIUS
21Re
dingt
on K
enya
EPZ
Lim
ited
SH0.
5811
0.58
(32.
18)
1298
.42
1330
.02
–38
87.9
310
.48
–10
.48
–KE
NYA
22Af
rica J
oint T
echn
ical S
ervic
es C
ompa
nyLD
35.3
994
106.
207.
6517
7.28
63.4
3–
137.
2310
.21
1.94
8.27
–LI
BYA
23Ca
dens
worth
UAE
LLC
AED
12.2
250
36.6
827
3.20
7254
.24
6944
.36
–81
89.9
628
9.21
–28
9.21
–UA
E
24Re
dingt
on Li
mite
dGH
S31
.623
817
5.67
1.02
1349
.72
1173
.03
–12
41.0
13.
922.
821.
10–
GHAN
A
25Re
dingt
on U
gand
a Lim
ited
UGS
0.21
63.
250.
6670
8.74
704.
83–
825.
471.
881.
150.
73–
UGAN
DA
RGF
Priva
te T
rust
Com
pany
Lim
ited,
Cay
man
Islan
ds,
Redin
gton
Mor
occo
Lim
ited,
Mor
occo
, Red
ingto
n Tan
zania
Ltd
., Ta
nzan
ia an
d Re
dingt
on S
L (Pr
ivate
) Lim
ited,
Sri
Lank
a ar
e ye
t to
com
men
ce o
pera
tions
.
Abbr
evia
tion:
INR
- Ind
ian R
upee
s; AE
D - U
AE D
irham
s; QR
- Qa
tari
Riya
l; RO
- Om
ani R
iyal; U
SD -
US D
ollar
; NN
- Nige
rian
Naira
; SH
- Ken
yan
Shilli
ng; S
R - S
audi
Riya
l; LE
- Egy
ptian
Pou
nd;T
AKA
- Ban
glade
sh Ta
ka; B
D - B
ahra
in Di
nar;
GHS
- Gha
naian
Ced
i;UG
S - U
gand
a Sh
illing
; LD
- Liby
an D
inar.
Sta
tem
ent
pu
rsu
ant
to e
xem
pti
on
rec
eive
d u
nd
er S
ecti
on
212
(8)
of
the
Co
mpa
nie
s A
ct,
1956
rel
atin
g t
o s
ub
sid
iary
Co
mpa
nie
s(R
s. I
n La
khs)