Embed Size (px)
Citation preview

AWEIL NORTH COUNTY
SQUEAC ASSESSMENT
REPORT BY
MARCH 22, 2018 Report By: Jacqueline Macharia
MARCH 22, 2018 Report By: Jacqueline Macharia

i
Acknowledgement This is an expression of gratitude towards the individuals and organizations that effortlessly
supported the processes of this noble exercise. The 2017 SQUEAC in Aweil North County would
not have been successful without their inputs.
• The donor for funding the assessment
• The Ministry of Health (MoH), State MoH and the County Health Department for their
support and authorizing the assessment process within the community to proceed as
planned
• The entire Aweil North community for their patience, willingness to give information to
the best of their knowledge when called upon and in allowing screening of their children.
• Premiere Urgence Internationale (PUI) for providing some inputs used in triangulation
being the nutrition partner in Aweil North
• Concern worldwide for their inputs in planning for the assessment and mobilizing the
community concerning the exercise. Thank you to the staff that went out of their way to
assist during some processes for smooth running.

ii
Table of Content
Acknowledgement -------------------------------------------------------------------------------------------- i
Abbreviations ------------------------------------------------------------------------------------------------ iv
Executive Summary ----------------------------------------------------------------------------------------- v
Introduction --------------------------------------------------------------------------------------------------- 1
1.1 Background ----------------------------------------------------------------------------------------------------------- 1
1.2 Shocks ------------------------------------------------------------------------------------------------------------------ 1
1.3 Health and Nutrition ----------------------------------------------------------------------------------------------- 2
1.4 Previous SQUEAC -------------------------------------------------------------------------------------------------- 3
1.5 Timing of the Assessment ----------------------------------------------------------------------------------------- 3
1.6 Justification ----------------------------------------------------------------------------------------------------------- 3
1.7 Objectives -------------------------------------------------------------------------------------------------------------- 3
1.8 Challenges ------------------------------------------------------------------------------------------------------------- 4
Methodology -------------------------------------------------------------------------------------------------- 4
2.1.1 Quantitative Data ---------------------------------------------------------------------------------------------- 4
2.1.1.1 Admission by Month ---------------------------------------------------------------------------------------------- 4
2.1.1.2 MUAC Admissions ------------------------------------------------------------------------------------------------ 6
2.1.1.3 Time to Default ----------------------------------------------------------------------------------------------------- 7
2.1.1.4 Length of Stay ------------------------------------------------------------------------------------------------------ 7
2.1.1.5 Discharge Outcomes ----------------------------------------------------------------------------------------------- 9
2.1.1.6 Documentation ----------------------------------------------------------------------------------------------------- 11
2.1.2 Qualitative Data ---------------------------------------------------------------------------------------------- 12
2.1.2.1 Barriers and Boosters -------------------------------------------------------------------------------------------- 13
2.2 Stage 2 ---------------------------------------------------------------------------------------------------------------- 20
2.2.1 Stage 2 Process ------------------------------------------------------------------------------------------------ 20
2.2.2 Case Definition ------------------------------------------------------------------------------------------------ 21
2.2.3 Prior Formation ---------------------------------------------------------------------------------------------- 22
2.2.3.1 Un-weighted Barriers and Boosters -------------------------------------------------------------------------- 22
2.2.3.2 Weighted Barriers and Boosters ------------------------------------------------------------------------------ 22
2.2.3.3 Concept Map ------------------------------------------------------------------------------------------------------- 23
2.2.3.4 Histogram Prior --------------------------------------------------------------------------------------------------- 23
2.3 Stage 3 ---------------------------------------------------------------------------------------------------------------- 24
2.3.1 Sample Size Calculation ------------------------------------------------------------------------------------ 24
2.3.2 Quantitative Sampling Framework --------------------------------------------------------------------- 24
2.3.3 Case Finding Methodology -------------------------------------------------------------------------------- 25
2.3.4 Quantitative Data Results --------------------------------------------------------------------------------- 25
2.3.5 Reasons for SAM Non-Attendance ---------------------------------------------------------------------- 26
Conclusion ------------------------------------------------------------------------------------------------------------ 27
Annexes ------------------------------------------------------------------------------------------------------- 28
Annex 1 Recommendations ------------------------------------------------------------------------------------------ 28
Annex 2: Wide Area Survey Results ------------------------------------------------------------------------------ 30

iii
Annex 3: Point and Period Coverage ----------------------------------------------------------------------------- 31
Annex 4: List of Aweil North SQUEAC Participants -------------------------------------------------------- 31
Annex 5: Review of Selected Action Points Derived from the Previous SQUEAC ------------------- 32
Annex 6: Concept Map in the Context of Aweil North ------------------------------------------------------- 33
List of Figures
Figure 1: Admissions over Time (Dec 16 – Nov 17) ------------------------------------------------------------------ 5
Figure 2: Total Admission by MUAC (Sep - Nov 17) ---------------------------------------------------------------- 6
Figure 3: MUAC ≥ 11.5 cm Admissions by Centre (Sep – Nov 17) ----------------------------------------------- 7
Figure 4: Time-to-Default (Sep - Nov 17) ------------------------------------------------------------------------------- 7
Figure 5: Length of Stay (Sep 17 - Nov 17) ----------------------------------------------------------------------------- 8
Figure 6: Discharge Outcomes over Time (Dec 16 – Nov 17) ------------------------------------------------------- 9
Figure 7: Admissions and Discharge by Payam (Dec 16 – Nov 17) ---------------------------------------------- 10
Figure 8: Example of a Register showing drastic changes in MUAC measurements, missing exit
information and mixed up visit dates ----------------------------------------------------------------------------------- 11
Figure 9: Prior Mode based on BayesSQUEAC calculator at β(12.5,5.9) --------------------------------------- 23
Figure 10: Beta Binomial Conjugate Analysis using BayesSQUEAC calculator ------------------------------ 26
Figure 11: Reasons for SAM Non-Attendance ------------------------------------------------------------------------ 26
List of Tables
Table 1: Distribution of OTP sites by Payam in Aweil North County ------------------------------------------- 10
Table 2: Barriers and Boosters ------------------------------------------------------------------------------------------- 13
Table 3: Stage 2 Results by Village ------------------------------------------------------------------------------------- 21
Table 4: LQAS Decision Rule Results --------------------------------------------------------------------------------- 21
Table 5: Weighted and Un-Weighted Barriers and Boosters ------------------------------------------------------- 22
Table 6: Single Coverage Estimate Results ---------------------------------------------------------------------------- 25
List of Equations
Equation 1: Sample Size Calculation (SAM Cases) ----------------------------------------------------------------- 24
Equation 2: Sample Size Calculation (Number of Villages) ------------------------------------------------------- 24

iv
Abbreviations CF: Community Facilitator
CI: Confidence/Credible Interval
CMAM: Community Management of Acute malnutrition
CNV: Community Nutrition Volunteers
CWW: Concern Worldwide
FSNMS: Food Security and Nutrition Monitoring Survey
GAM: Global Acute Malnutrition
GFD: General Food Distribution
HHP: Home Health Promoters
IPC: Integrated Phase Classification
KAP: Knowledge, Attitude and Practice
LQAS: Lot Quality Assurance Sampling
MTMSG: Mother to Mother Support Group
MUAC: Mid-Upper Arm Circumference
NBeG: Northern Bahr el Ghazal
NGO: Non-Governmental Organization
OPD: Outpatient Department
OTP: Outpatient Therapeutic Program
PHCC: Primary Health Care Centre
PHCU: Primary Health Care Unit
PUI: Premeire Urgence Internationale
RUTF: Ready to Use Therapeutic Food
SAM: Severe acute malnutrition
SC: Stabilization Centre
SMART: Standardized Monitoring and Assessment of Relief and Transitions
SQUEAC: Semi-Quantitative Evaluation of Access and Coverage
TSFP: Targeted Supplementary Feeding Program

v
Executive Summary
Aweil North is one of the five counties in the former Northern Bar El Ghazal (NBeG) State that
borders North Sudan to the North, Aweil West County to the South and East, while Aweil East
County borders the Aweil North to the West. There are seven administrative Payams that are
considered to be rural1 areas and home to 267, 2102 within the Aweil North. The main sources of
household food in the area were reported as cultivation, market purchase of food and General Food
Distribution (GFD). There was flooding within the County that saw some families being displaced
while their houses submerged in the process3. A post floods needs assessment conducted in
September 2017 within 3 Payams (Malual West, Malual East and Ariath) suspected to be most hit
by the occurrence revealed that Ariath Payam was the least affected by crop damage and
displacement. Mass Mid-Upper Circumference (MUAC) screening conducted by the assessors’
revealed Malual East to have the highest proxy GAM rate (Malual East 14%; Malual West 7.0%;
Ariath 7.5%) of the 3 Payams.
There are currently 35 operational Community Management of Acute Malnutrition (CMAM)
collective sites, supported by 2 organizations (Premeire Urgence Internationale-PUI and Concern
Worldwide-CWW) across the 7 Payams. Concern Worldwide (CWW) supports 24 of these sites
in integrated health and nutrition services.
The previous SQUEAC assessment, carried out in May-June 2014, realized a point coverage
estimate of 42.8% (33.5-51.7) within the catchment of the then 16 sites under CWW’s jurisdiction.
Since then, CWW addressed nearly all the recommendations with some ongoing activities
embedded into the routine programming such as on job trainings4. This 2017 assessment utilized
the 3 stages of the SQUEAC methodology aimed at determining the coverage estimate of the OTP
in Aweil North CWW catchment areas while establishing the program barriers and boosters. The
assessment was carried out between December 10th and 20th with a team of 14 enumerators, with
some assistance from Community Nutrition Volunteers and Home Health Promoters from the
Health facility catchment of each sampled village (stage 2 and 3). A coverage estimate of 80.4%
(73.2-86.3; 95%CI) was revealed and noted to be higher than the expected Sphere standard for the
rural area (at least 50% coverage). This variation in coverage was believed to have been due to
implementation of action points set during the previous SQUEAC 2014 (Annex 5), differences in
the seasonal timing of the assessment (beginning Planting season in 2014 versus post-harvest
season in 2017) in addition to the well triangulated initiatives identified herein as boosters.
Conclusively, there was evident community acceptance of the program within Aweil North County
that seemed to enhance the program coverage through uptake of OTP services by the malnourished
children, through their caregivers. This seemed to reduce the effect of most of the barriers
identified to have potential to negatively affect the program coverage. Some of the
recommendations put forward included: initiation of income generating support groups among
caregivers of OTP beneficiaries, identification and support of health and nutrition integrated
outreach sites attached to the already established health facilities, mobility and protective gear
(such as bicycles, gumboots and rain coats) support for the CNVs and HHPs to enhance defaulter
tracing and active case finding even in the far villages as well as rainy season.
1 92% of NBeG population live in the rural areas according to Concern South Sudan Context Analysis Revised 2016 2 South Sudan National Bureau of Statistics/United Nations as cited by CWW south Sudan context analysis 3 Rapid needs assessment post floods conducted in Aweil North in September 2017 4 CWW action points updated January 2016

vi
Main Program Boosters and Barriers of Aweil North SQUEAC assessment 2017
Main boosters Explanation
1 Prioritization of CMAM
beneficiaries for GFD
The directive saw increment in the admissions and was believed to
increase community awareness and program referrals.
2 Increased Coverage of OTP
Centers
Increment of 6 sites within the assessment period (8 since the
previous SQUEAC 2014)
3 Positive opinion of the
program
Neighbors without children in the program referred some caregivers
with malnourished children to the program. Some chiefs stated that
some people are moving back into Aweil North in search of food
and medical assistance having heard about the ongoing programs by
Non-Governmental Organizations (NGOs).
4 Collaboration between the
Community Nutrition
Volunteers (CNVs),Home
Health Promoters (HHPs),
chiefs and Boma Health
Committee (BHC)
They work together to curb sharing, theft and sale of RUTF,
defaulting, mobilization. The active BHC holds an average of 1
meeting a month for progress evaluation.
5 Mitigation of double
registration
These include: Ink marking on different finger by organization,
Some BHC representatives stay within the distribution ground to
also assist in acknowledging the suspected cases of double
registration, facilities within the same route and those nearby are
served within the same day for OTP.
6 SC-OTP-TSFP interface Beneficiaries are documented as transfers to the various OTP
programs inclusive of the Stabilization Center (SC) as protocol
demands
Main Barriers Explanation
1 RUTF as food Plumpy nut was being sold in some markets; some caregivers sell or
exchange the RUTF with traders; RUTF stock theft at centre level
2 Weak Defaulter tracing and
poor active case finding
Villages that are about an hour and above walking distance are
rarely visited for active case finding.
3 Non strict conformity to
OTP guidelines
Lack of adherence to admission and discharge criteria, the
measurements and the number of visits to that regard. SMART
survey 2017 revealed higher GAM and SAM rates using Z score
than MUAC nearly all beneficiaries are admitted by MUAC.

1 | P a g e
Introduction
1.1 Background
The former NBeG was among the 10 original states of the South Sudan republic covering an
approximate area of 30,543.3km2 wherein Aweil is the capital. The population in the larger NBeG
has had a 90% increase since 2008 census (720,898) to about 1,368,984 as highlighted by the
Concern Worldwide (CWW) context analysis for 2016. The state is surrounded by Darfur region
to the North, Western Bahr El Ghazal to the West and South as well as Warrap and Abyei to the
East. The percentage of children under 5 years within the State’s population was approximated at
19% while each household was estimated to have an average of 6 members5.
More specifically, Aweil North is one of the 5 Counties in the former NBeG bordering Aweil West
County to its South and East, Aweil East County to its West, and North Sudan to the North. The
County is sectioned administratively into 7 payams namely: Malual North, Malual Center, Malual
East, Malual West, Korok East, Korok Center and Ariath; and further divided into Bomas (a group
of villages). The County is inhabited by a projected population estimate of 267,2106 most of who
are estimated to live in the rural areas7. A slight majority of the population was reported through
the assessment to depend on cultivation during successful food production periods and then GFD
when it was available, while some engaged in market purchases8 of food.
1.2 Shocks
In this assessment period, the County received floods between July and September 2017 that saw
about 25% of gardens destroyed especially Malual East, Malual West and Ariath9. It was estimated
that the available harvest was likely to sustain the households for approximately 3 months with the
most affected Payams in terms of crop damage, being Malual West and Malual East. As well, mass
screening was conducted during the post floods assessment and Malual East showed highest
malnutrition levels of the 3 Payams at the time. It was also noted that Maper Dut village was the
most affected village by the floods with the displaced population showing highest malnutrition
rates of the all villages that were assessed. The post floods assessment report (2017) reported high
suspected malaria caseload estimated at 1 case per household, and there being no medication in
the health facilities, many children were likely not to have gotten timely treatment.
5 As used in the November 2016 SMART survey in Aweil North county 6 South Sudan National Bureau of Statistics/United Nations as cited by CWW south Sudan context analysis 7 92% of NBeG population live in the rural areas according to Concern South Sudan Context Analysis Revised 2016 8Interviews with CWW 9 Rapid needs assessment post floods conducted in Aweil North in September 2017

2 | P a g e
Counties within the NBeG (that includes Aweil North) were reported suffer effects of conflicts
that occur in the neighboring states10. Ideally, some of the market goods in Aweil North rely on
importation by road networks that are dampened by closed boundaries and insecure routes as
experienced during the 2016 politically instigated conflict. As well, the wet season of 2017
reportedly affected the agricultural zones through floods leading to loss of crops11. CWW revealed
that the Aweil North area had received below average rainfall in the previous planting season
(2016) and the 2017 crop loss, due to the floods, was very likely to encroach on the dwindling food
basket12.
1.3 Health and Nutrition
Over the years most, of the basic services within NBeG have been either supported or offered by
NGOs. This practice has been feared to facilitate dependency-syndrome amongst the rural
population of the republic13. Nonetheless, access to the basic amenities such as clean water for
usage in the state remained at about 60% of population14. The areas that primarily depend on rain
water will embark on digging the ground (in the dry season) for some of that commodity, which
has been seen to contribute to water borne illnesses15. In early 2016, the entire NBeG area (that
includes Aweil) was declared to be in nutrition emergency which deteriorated through the year.
According to the Food Security and Nutrition Monitoring Survey (FSNMS) conducted at the end
of that year, the household food insecurity was on the rise with reduced income, crop loss and high
food prices. A report published by FSNMS (Mach, 2017) the highest food insecurity level (67%
of households) in NBeG compared to previous years’ up-to 2010 at the same period of the year.
The IPC report in May 2017 showed emergency (IPC phase 4) food insecurity status, except Aweil
Centre. By September 2017, the level of food insecurity in NBeG seemed to have improved to
crisis phase; a state that was projected to decline back to emergency by March 2018. This was
reported to result from reduction in post harvest gains linked to increased food insecurity16
According to the most recent SMART survey conducted in November 2017, GAM by Z-score
(GAM 18.5%; SAM 4.8%) was higher than GAM by MUAC (GAM 11.7%; SAM 2.5%.
Essentially, Aweil North has so far 2 partners (Premiere Urgence Internationale (PUI) and CWW
(CWW) with a total of 35 OTP sites with a plan for expansion into 3 more sites by one partner.
CWW supports 24 of those sites (4 PHCCs and 20PHCUs) spread across all 7 payams of Aweil
North County. The interventions uses an integrated approach of Outpatient Therapeutic Program
10 Concern South Sudan context analysis revised 2016 11 Rapid needs assessment post floods conducted in Aweil North in September 2017 12 Interviews with Concern Worldwide staff within the food security docket. 13 Concern South Sudan context analysis revised 2016 14 Concern South Sudan context analysis revised 2016 15 Revealed through the assessment in Mindik village of Jaac Payam
16 http://www.ipcinfo.org/fileadmin/user_upload/ipcinfo/docs/South_Sudan_KeyMessages_Sept2017.pdf

3 | P a g e
(OTP), Targeted Supplementary Feeding Program (TSFP), community outreach activities through
Mother to mother support groups and integrated Blanket Supplementary feeding Program (BSFP)-
GFD programs in all the 24 facilities. Gok Machar PHCC is the only SC supported by CWW in
the County.
1.4 Previous SQUEAC
The most recent SQUEAC assessment in Aweil North took place between May and June 2014,
which was well into the cultivation season17 revealing a point coverage estimate of 42.8% (33.5-
51.7) within the catchment of the 16 OTP sites (14 PHCUs and 2 PHCCs), supported by CWW at
the time. This was classified less than the SPHERE Standards of 50% for a rural area. The main
barriers at the time were; walking distance to the OTP sites, Long length of stay in program, Lack
of MUAC tapes among HHPs, lack of malnutrition assessment knowledge among the HHPs, Some
un-incentivized HHPs and RUTF stock outs. Since then, significant improvements in programme
quality have been implemented.
1.5 Timing of the Assessment
This SQUEAC was carried out in the post-harvest season (December, 2017) which was dry and
virtually road accessibility to the facilities from the villages was assured.
1.6 Justification
The most recent SQUEAC assessment in Aweil North was conducted in 2014 (3 years ago) and
revealed coverage below the Sphere standard for a rural area. The supporting organization (CWW)
had evidently made changes and additions into its OTP activities which were based on the
recommendations provided in the previous SQUEAC assessment. As such, another round of
SQUEAC assessment was needed so as to quantify initiative to assess programme coverage and
allow the organization to plan and implement according to the finding.
1.7 Objectives
The overall objective of the SQUEAC assessment was to determine the coverage estimate of the
OTP in Aweil North as well as the barriers and boosters to program access. This was guided by
the following specific objectives.
1. To enhance the competencies of supervisors and data collectors in carrying out SQUEAC
coverage assessment.
2. To estimate the coverage of the OTP catchment areas in Aweil North.
3. To identify barriers and boosters to access of OTP services using data gathered from
acute malnutrition cases found not admitted in the program at the time of the survey.
17 Seasonal calendar

4 | P a g e
4. To develop recommendations and action plan based on findings to improve OTP access
and increase the overall coverage.
1.8 Challenges
The list of catchment villages that was provided to facilitate stages 2 and 3 sampling was noted to
have some errors in the naming of the villages. In addition the list also had 2 catchments areas that
overlapped with the catchment villages for the PUI such as Gorayen and Malual North Villages.
Nevertheless, with the help of the community facilitators, community nutrition volunteers and the
home health promoters, this list was finally rectified and updated prior to the commencement of
the sampling procedures. The challenges were adequately overcome and did not affect the quality
of the assessment.
Methodology
The survey used standard SQUEAC methodology, which outlines three phases of study. Stage 1
involved identifying areas of low and high coverage as well as reasons for the coverage using
routine program data, any other existing data and qualitative data (mainly interviews and
observation). Stage 2 involved confirming the location of areas of high and low coverage and the
reasons for coverage failure identified in stage 1. This was done using a small-area survey. Stage
3 involved provision of an overall estimate of program coverage using Bayesian techniques.
Participation in this assessment was voluntary and the respondents had every right to withdraw
anytime from the interview without any obligation. Informed verbal consent was sought from the
respondents before starting interview. Responses were recorded anonymously and confidentiality
was maintained throughout the procedure.
2.1 Stage 1
2.1.1 Quantitative Data
Data collected included program data as extracted from the OTP official MoH registers of 24
CWW supported health facilities for analysis. These data was categorized as Admission by month,
admissions by Payam, MUAC admissions, and admission by centre, length of stay, time to default,
discharge outcomes by Payam, defaulters and non-respondents by centre.
2.1.1.1 Admission by Month
There was an increase of 6 CWW supported OTP centers between December 2016 and January
2017 within Aweil North that could have resulted in the increase in admissions in early 2017
(Figure 1).

5 | P a g e
Figure 1: Admissions over Time (Dec 16 – Nov 17)
Month Dec Jan Feb Mar Apr May June July Aug Sep Oct Nov
Diseases Diarrhea Pneumonia & Fever Diarrhea&
Fever
Climate Dry Rain Floods Dry
Food
availability
+++ + +++
Program New Facilities CNV
incentive
360SSp
MUA
C
CNV incentive
increase to 20$
MUAC &
New staff
New
staff
Food prices + ++ ++ +++ ++ +
Migration Back
home
To farmlands for weeding, planting Back
home
GFD +++ +++ +++
The sudden spike in May and August followed the first and second rounds of GFD distribution
(by CWW) that targeted beneficiaries in the OTP treatment programs as well as the onset of high
childhood illnesses’ (Pneumonia and fever). Interestingly, the CNVs who were in place received
an increase in their salaries (from 360SSP to 20$ paid as 2280SSP) between July and August that
seemed to have resulted in a spike in admissions. Strengthening of human resource capacity at
OTP/TSFP sites between September and October, as well as, the MUAC screening carried out
during the flood assessment in Aweil North may have contributed to the slight increase in
admissions. On the other hand, the program admissions in North seem to be severely affected by
the onset of rains that resulted in floods, both on land and the river blocking nearby villages from
being accessible. This is witnessed between May and July dip in the numbers when interviewees18
stated that the flooding between July and August rendered some villages inaccessible for
community mobilization and OTP programming.
18 Caregivers of defaulters, CNVs, HHPs, Health facility in-charge, CWW
0
100
200
300
400
500
600
# A
dm
issi
on
s
Admissions over time (Dec '16-Nov '17)
Admissions Seasons M3A3

6 | P a g e
2.1.1.2 MUAC Admissions
Children who were admitted with MUACs close to the admission criteria were termed as early
admissions while those who had MUAC measurements further away from the criteria were
referred to as late admissions19. This assessment used 10.0cm MUAC as the cut off for the “late
admissions” and ≤9.5cm as the critically low measurements20. In the 3 months preceding the
assessment (September to November 2017), the median MUAC was 11.2cm for Aweil North with
a moderately long tail of low MUACs at admission. More specifically, only 4% of the children
were late admissions 28% of whom had critically low MUACs. (Figure 2).
Figure 2: Total Admissions by MUAC (Sep - Nov 17)
This trend elucidates that the mechanisms used to reach more caregivers of malnourished children
for treatment have had a significant effect in timely admissions of most children. In Aweil North,
some of these mechanisms included active case finding, mass screening, community and OPD
referrals, increase and incentives of the OTP teams, community dialogue meetings, and
collaborations between community entities towards malnutrition awareness creation 21 During
quantitative (from the OTP registers) and qualitative data collection (interviews), it was revealed
that MUAC was the only anthropometric measurement used for OTP admissions and discharge
and then Oedema22. There was no evidence of the consideration of the weight-for-height z-score
in any admission or discharge within the assessment period. It was for these reasons that the
number of these MUAC measurements was extracted for the period September to November
201723. In line, nearly all the OTP centers had been admitting some children with MUAC of
19 19 Myatt, Mark et al. 2012. Semi-Quantitative Evaluation of Access and Coverage SQUEAC)/ Simplified Lot
Quality Assurance Sampling Evaluation of Access and Coverage (SLEAC) Technical Reference. Washington, DC:
FHI 360/FANTA.
20 Globally accepted threshold for “late admissions” are not available.
21 Interviews carried out during the SQUEAC assessment 22 The CMAM guideline recommends admissions by either MUAC <11.5 or Weight-for-height <-3 or oedema + ++
without complication. 23 MUAC measurements for the the children admitted by Oedema were not considered.
0
50
100
Ad
mis
sion
s
MUAC admissions Sep '17 to Nov '17
Late admissions
Median MUAC

7 | P a g e
≥11.5cm. In the previous 3 months, September to November 2017, only Abyei chok PHCU,
Warcuei PHCU, Maperngok PHCU and Malual Deng Arum PHCU that had no record of any
children admitted by MUAC at 11.5cm or above. Further, Gok Machar recorded the highest
admissions with MUAC of above 11.5 cm (Figure 3).
Figure 3: MUAC ≥ 11.5 cm Admissions by Centre (Sep – Nov 17)
2.1.1.3 Time to Default
The period taken by caregivers of beneficiaries to become defaulters gave some insight into how
well the program was able to retain its beneficiaries (Figure 4).
Figure 4: Number of visits before defaulting, Sep'17-Nov'17
This assessment examined the defaulter rate in the three month period between September and
November 2017. Early defaulters were those who stopped attending the visits before 4 visits while
the late defaulters after the 4th visit24. According to the observation in the OTP records, there were
a number of non-attendees who stopped visiting the OTP as soon as they were admitted This early
defaulting was in line with the period when the 3rd round of GFD (September to November 2017)
24 Myatt, Mark et al., 2015
0
5
10
15
20
25
30
# A
dm
issi
on
s
Admissions by MUAC ≥ 11.5cm by OTP site, Sep' 17-Nov' 17
0 5 10 15 20 25 30 35
8+ visits
7 visits
6 visits
5 visits
4 visits
3 visits
2 visits
1 visit
Number of visits
Nu
mber
of
def
ault
ers
Time-to-Default (Sep - Nov 17)

8 | P a g e
was conducted; food availability was highest being that harvest period had started, which resulted
in lowest food prices. Interviews within the SQUEAC assessments revealed that caregivers were
not keen on the program visits whenever they had food within their households 25 . The late
defaulters (81) were most likely to be recovering SAM cases awaiting discharge 26
(MUAC≥11.5cm)27.
2.1.1.4 Length of Stay
The beneficiaries in the program were discharged as cured in various weeks in the program. Most
of the cured children in the 3 preceding months of this assessment were discharged on their 6th
week of attendance. Some however were discharged before the 6 recommended weeks 28 as
minimum length of stay (Figure 5).
Figure 5: Length of Stay (Sep 17 - Nov 17)
According to the observation in the registers, most the children discharged as cured before 6 weeks
were likely admitted with inaccurate measurements as seen with drastic change in MUAC
measurement within a week or 2. This assessment found that a few others would be discharged
much later in the program into the 12th week that would otherwise denote non respondent discharge
criteria29. It was also noted in the registers that some children were discharged as cured
without the 2 consecutive visits of achieving the discharge measurement.
25 Interviews with CF, CNVs and HHPs 26 Myatt, Mark et al. 2012. Semi-Quantitative Evaluation of Access and Coverage SQUEAC)/ Simplified Lot Quality
Assurance Sampling Evaluation of Access and Coverage (SLEAC) Technical Reference. Washington, DC: FHI
360/FANTA.
27 Myatt, Mark et al., 2012. 28 South Sudan CMAM guidelines 29 South Sudan CMAM guidelines
0
50
100
150
200
250
1 2 3 4 5 6 7 8 9 10 11 12
Nu
mb
er o
f cu
red
ben
efic
iari
es
Week of discharge as cured
Median length of stay

9 | P a g e
2.1.1.5 Discharge Outcomes
The cure rate was generally a plateau throughout the year at 75%, which the Sphere considers the
standard for that performance indicator. According to the registers, some beneficiaries that had
been admitted earlier in the year had missed a few visits and then discharged as cured at a separate
month regardless of the inconsistent attendance30. This was believed to have been an exercise to
“clean” the books for a new-record start. This was however noted to reduce towards September
admissions. Even so, there was a slight decline between August and October that coincides with
an increase in defaulters beyond the Sphere of 15%, as expected. Food availability was at its
highest with lowest food prices even as the 2nd and 3rd FGD rounds took place within the same
period (August to October). As revealed during the assessment31 visits to the OTP centers reduce
with increase in food availability in the household (Figure 6).
Figure 6: Discharge Outcomes between December 2016 and November 2017
Month Dec
2016
Jan
2017
Feb
2017
Mar
2017
Apr
2017
May
2017
June
2017
July
2017
Aug
2017
Sep
2017
Oct
2017
Nov
2017
Diseases Diarrhea Pneumonia & Fever Diarrhea &
fever
Climate Dry Rain Floods Dry
Food
availability
+++ + +++
Program New Facilities CNV
incentive
360SSp
MUAC CNV incentive
increase to
20$
MUAC &
New staff
New
staff
Food prices + ++ ++ +++ ++ +
Migration Back
home
To farmlands for weeding, planting Back
home
GFD +++ +++ +++
Admissions and Discharge by Payam
30 OTP registers observation 31 Interviews with CF and CNVs
0.0%
20.0%
40.0%
60.0%
80.0%
Dec Jan Feb Mar Apr May Jun Jul Aug Sep Oct Nov
Discharge outcomes over time (Dec'16 to Nov '17)
Cured A3 DeathsA3 DefaultA3 Non-Response A3

10 | P a g e
Malual East and Malual West have each 5 CWW supported OTP centers, Malual North and Ariath
each host 4 facilities while the remaining Payams (Malual Center, Korok East and Korok Center)
have 3, 2 ad 1 facilities respectively. Six facilities were added into the pool of CWW supported
centers for OTP between December 2016 and January 2017 and have admitted approximately 1030
OTP beneficiaries within the assessment period (December 2016-November 2017). They include:
Muony PHCU, Peth PHCU, Lueth Ngor PHCU, Rup Mading PHCU, Abyei Chok PHCU and
Makuach Akec PHCU (Table 1).
Table 1: Distribution of OTP sites by Payam in Aweil North County
Payam OTP Health Facilities
Malual East Malual Deng Arum PHCU; Mayen Ulem PHCC; Warapei PHCC; Wathok PHCU; Jaac
PHCU
Malual West Muony PHCU*; Manyiel PHCU; Akuak Malual PHCU; Majak Baai PHCC
Malual North Gok Machar PHCC; Mayom Adhal PHCU; Rolngut PHCU; Peth PHCU*
Ariath Kajiik PHCU; Maper Ngok PHCU; Ariath PHCU; Lueth Ngor PHCU*
Malual Center Pamat PHCU; Marol deng Geng PHCU; Ajak Wol PHCU
Korok East Rup Mading PHCU*; Abyei Chok PHCU*
Korok Center Makuach Akec PHCU*
*Means the site became a CWW supported OTP site between December 2016 and January 2017
Malual East had the highest cumulative admissions in the assessment period (Dec 2016-November
2017) (Figure 7) as also found out during the post-floods needs assessment conducted in
September 2017. The Payam has the most sites (5), two of which were PHCCs therefore serving
more clientele who get to learn about the program and get treatment. The lowest admission case
load in the same period was in Korok Centre which also had one of the highest defaulter rates in
the County (above 20%). The payam had only 1 CWW OTP site (Makuac Akech) and was nearer
the Aweil East Border which encouraged movement of beneficiaries. In essence, only Malual
center and Malual West had defaulter rates that were in line with the Sphere standard (<15%) for
the performance indicator. It is Malual center that had the highest cumulative level of non-response
out of the 7 Payams (Figure 7).
Potential reasons explaining this included: the differences in the population sizes in those facilities
catchment, nearness to borders that could have encouraged more defaulting due to movement,
flood affected areas through the County that limit movement or displacement and damage crop
production, common childhood illnesses accelerated by the floods, community based initiatives’
to curb theft, sale and sharing of RUTF in the community, level of opportunity cost among
caregivers, distance from household to health centre among others. Well triangulated factors that
were believed to have affected coverage in the county were documented as barriers and boosters.
Figure 7: Admissions and Discharge by Payam (Dec 16 – Nov 17)

11 | P a g e
2.1.1.6 Documentation
The official MoH registers were available for review and the beneficiaries had been recorded.
However, the OTP registers showed some shortcomings that challenged data extraction as some
seemed to have potential to negatively affect program services (Figure 8).
Figure 8: Example of a Register showing drastic changes in MUAC measurements, missing exit
information and mixed up visit dates
They instances included:
• Admission dates did not follow chronologically,
• Skipped visit dates that were then backdated within the following visits,
0.0%
5.0%
10.0%
15.0%
20.0%
25.0%
0
100
200
300
400
500
600
700
800
900
Malual East Malual
North
Ariath Korok East Malual
Center
Malual
West
Korok
Centre
Def
au
lter
s a
nd
No
n r
esp
on
den
ts
NU
mb
er o
f A
dm
issi
on
s
Admissions %Defaulters %Non-Respondents

12 | P a g e
• Blank spaces with no indication of absenteeism then the measurements continue in the date the beneficiary returns,
• “Returned defaulters” were recorded as either “new cases” or “returned referrals”,
• Admissions with no indication of measurements nor village information,
• Admissions lacking admission dates in addition to some missing discharge information in the exit information columns.
All the same, the documentation showed a reduction of these instances from September and November 2017. Orange arrows, red
circles and dashes have been used to highlight the drastic MUAC measurement changes, mixed up visit months, a discharge of below
11.5cm and missing exit measurements, date and length of stay for the cured beneficiaries.
2.1.2 Qualitative Data
Completion of quantitative data analysis warranted the use of interviews techniques that enable gathering of new information, on the
community to expound on the information attained. The 14 enumerators who took part in this SQUEAC were derived from the team
that took part in the December 2017 Aweil West County SQUEAC as they had already been trained in the interview techniques required
for the qualitative data collection. The enumerators had undergone a one day qualitative data collection training with one-on-one daily
feedback sessions to enable them to master the required interviewing techniques. During this Aweil North County SQUEAC (December
2017), more daily one-on-one feedback sessions were carried out with those enumerators to ensure that questions in the interview guides
were adequately asked to unveil new information in the context of Aweil North. These were carried out within the catchment areas of 9
health facilities in line with the timelines and available resources. Interview guides were revised to explore possible barriers and boosters
in the context of Aweil North CMAM interventions, while other qualitative data collection tools were formulated as necessitated by any
new information. About 35 interviews were conducted in stage 1 from different sources and methods for triangulation and was
considered comprehensive when no new information was being revealed.
All the findings of the qualitative data collection were summarized in the barriers and boosters, which was the main focus of this
assessment. The term “door” (likened to malnutrition) was used universally by the community in reference to the state of being weak
and thin as a result of lack of food or improper breastfeeding. The condition was mostly said to be seen among young children within
the community although most were stated to have already received or were receiving treatment at the “panadoor” (treatment center for
malnutrition). The interviews further revealed that the HHPs sometimes would pass by their homes to take MUAC measurements or
mobilize for the same, after which those whose measurement was not “mangok”(green) would be asked to go to their nearest facility
for admission. The findings that had a negative effect were labeled as barriers while those that depicted a positive effect were the

13 | P a g e
boosters. This was the main focus of this assessment that was then summarized into tables with the explanation as revealed through the
assessment (Table 2). The interrelationship among the different barriers and boosters was also presented as a concept map (Annex 6).
2.1.2.1 Barriers and Boosters
All the barriers and boosters that had been adequately triangulated were presented in tables (Table 2).
Table 2: Barriers and Boosters
Boosters Explanation and Analysis Sources
1. Consistent
supply of
RUTF in
2017
-The facilities have received constant supply of RUTF in the previous 12 months between Dec 2016
and November 2017
-Only 1 centre (Jaac PHCU) that stated a delay in restocking in August as a result of the floods that
challenged transportation.
CWW, CNVs,
Community
facilitators
2 Incentivized
caregivers on
day of
admission
into program
-Most of the CNVs and HHPs interviewed said that they give the caregivers items such as treated
mosquito nets, jerricans, Bucket and soap on their first day of admission.
- Most of the caregivers of OTP beneficiaries reported that this encouraged them to come again to
the center and more caregivers to bring in their children to the site.
-There was however stock-out of the items in some facilities and so not all caregivers received the
items on admission.
CNVs, caregivers of
OTP beneficiaries.
HHP, concern
3 Positive
opinion of
the OTP
-Community facilitator stated that the admission criteria enable people to see the physical changes
on a malnourished child. That more children are coming in more moderately malnourished than
severe cases, a situation that has reversed through time.
-Caregivers of OTP beneficiary, Caregivers of children not in the program, Village elders and chiefs
said that door (malnutrition) in the community is reducing; “RUTF treatment of the malnourished
has “rescued” many children in the community”.
-Caregivers of the OTP beneficiaries and defaulters stated that their neighbors, with previously
malnourished children through the OTP/TSFP, referred them to the malnutrition treatment site
(panadoor).
-Interviews and group discussions with chiefs believed that the panadoor (malnutrition treatment
site) is for feeding and treating children who are very sick and also taking care of the pregnant women
and those breastfeeding young children below 6 months.
CNVs, caregiver of
OTP beneficiaries,
community
facilitator, chiefs,
caregivers of
defaulters, village
elders, caregiver of
children not in
program
4 Community
referrals
- The chiefs refer children to the OTP centers, in the previous 3 months a chief referred only 1
caregiver because they stated that many caregivers with sick children know to take them to hospital.
This was corroborated by CNVs and CFs in separate areas who cumulatively stated to have received
about 10 caregivers at their centres who stated to have been referred by chiefs.
Caregiver of OTP
beneficiaries, HHPs,
Chief, CNVs,
nutrition assistant,

14 | P a g e
-Nutrition assistant (also acting health centre in charge) stated that in the previous month, they have
collaborated with CWW to use lead mothers from 30 MTMSG (Some who are also in vegetable
farming groups living within the farmlands) by training and giving MUAC tapes to the lead mothers.
So far one (1) of the facilities in the intervened Payams had received 10-20 cases, all fitting the
criteria for admission.
-CWW collaborated with partners to train 39 lead mothers on IYCF, hygiene promotion and MUAC
screening of malnourished children. According to CWW, a total of 211 across Aweil west and North
were referred to the nutrition treatment centers for management of acute malnutrition.
-Caregivers of current OTP beneficiaries stated that they did not know of other children like their
children (malnourished) who should have been in the program because the HHPs and CNVs inform
the community to goto the centre to get screened for door.
-However, 6HHPs reported that some caregivers were insistent on their children being admitted into
the program even in absence of malnutrition. When it was declined by the HHPs, the caregivers
would not allow their children to be screened in the homes the next time they were visited for the
case finding exercise. Some HHPs reported to have been insulted previously by some caregivers as
a result of not being admitted into the program. The occurrence of those incidences was corroborated
by chiefs, CNVs and CWW.
CWW, MTMSG
lead mothers
5 Increased
number of
program staff
-Each OTP site had an average of 9 community resource persons (CNVs and HHPs) working under
the supervision of at least 1 CF (CWW staff)
Observation, CWW,
CFs, CNVs ad
HHPs
6 Some OPD-
OTP referrals
-Some caregivers of OTP beneficiaries say they went to hospital due to child’s other sickness and
was referred from consultation office to the OTP centre for further screening of malnutrition.
-The occurrence of OPD to OTP referrals was confirmed by CNVs, Health centre in charges, CNVs
and CWW
Caregiver of OTP
beneficiaries, health
centre in charges,
CFs, CNVs
7 Mass MUAC
screening
-CWW organizes period mass MUAC screening within the County of which the most recent exercise
was conducted between June-July 2017; the malnourished children were referred accordingly.
-Another Mass MUAC screening took place during the floods needs assessment conducted in
September 2017 in 3 Payams where children were also referred accordingly. A total of 903 children
<5 years were screened of which 1.99% had SAM while 19.9% had MAM (Rapid needs assessment
post floods in Aweil North 2017).
CWW, Caregivers
of children found to
be malnourished,
CFs, CNVs, Rapid
needs assessment
post flood report.
8 Quarterly
community
dialogue
meetings
-CWW organizes meetings with all community members for dialogue and malnutrition awareness;
use and sale of RUTF is one of the main agendas
-It was through the meetings that the BHC and chiefs took up the task to curb RUTF theft from the
facilities.
-BHC, CFs, CNVs and village elders conducted progress review meetings with some organized post
RUTF theft for strategies on investigation.
CWW, BHC,
organizational
security report,
caregivers of
beneficiary children,
CFs , CNVs, HHPs

15 | P a g e
-There were only 3 OTP site thefts (in Mayom Adhal, Peth and Ariath) between September 2017 and
October 2017 with approximately 7 cartons missing. None seemed to have occurred in November
2017. This is a noted reduction in recent reports of theft according to the program incident reports
that had been filled.
-The theft reduced significantly after arrests of the traders and caregivers who sell their children’s
ration.
9 Collaboratio
n between the
CNVS-HHPs
with the
Chiefs and
Boma Health
Committee
(BHC)
-A discussion group with chiefs reported that some CNVs and HHPs will inform them when some
caregivers become defaulters for follow up. Those found to be sharing are reminded not to continue
with the habit to enable the sick child get cured. This was corroborated by the nutrition assistant on
a more recent scenario where a caregiver was advised by the chief to stop selling the child’s RUTF.
-All centre theft of the program supplies are documented to have been communicated to BHC and
chiefs of the centre areas for investigation, since there exists a standard operating procedure for
incidents of theft. This was reiterated by the community centre facilitators.
-BHC help in cleanliness, community mobilization, witness Muguok adoor distribution, advice to
mothers against sale of RUTF, hold meetings with CF and CNVs once a month for progress
evaluation.
-Some chiefs are in the BHC and communicate the happenings to the rest of their colleagues.
However, a few chiefs said they felt excluded where the CNVs and HHPs seem to be working
together well with the health centre staff, but they are not informed on their own collaborative role.
Chiefs, female and
male elders,
community
facilitators, nutrition
assistant, Program
security records,
BHC, chiefs, CNVs
and HHPs
10 Community
could
identify some
signs of
malnutrition
-Village elders associated thin, weak and sick looking children with hunger and the result of diseases
especially malaria.
- Neighbors inform caregivers that their very thin and weak children have “door” (malnutrition).
-Caregivers of children not in any program pointed out a child very thin child and said the child has
door (malnutrition)
-When shown visual aids of malnourished children the respondents unanimously claimed not to have
seen such severely thin children in their community unless in the cultivation (farmlands) areas. As
well, some of the respondents (male) said to them the oedematous child looks healthy.
chiefs, Male and
Female village
elders, fathers with
children in the
program, fathers and
caregivers of
children not in the
program,
11 Many
incentivized
and trained
community
volunteers
-CWW noted that they have approximately 216 volunteers (average of 9 HHPs and CNVs per centre)
now who are incentivized and assigned households.
-Most of CNVs and HHPs have undergone a 3 days training conducted by CWW through the APOs;
and these training had been completed in December 2017.
CWW, Observation,
nutrition assistant,
CNVs, HHPs, Chiefs

16 | P a g e
12 Mitigation of
double
registration
strategies
-Facilities that were nearby one other and were suspected by CNVs to have had more instances of
double registration included: Rolngut, Manyiel and Majaak Bai including the Majaak Bol supported
by the partner (PUI).
-Ongoing strategies by CWW and PUI (as guided by the cluster) to reduce double registration of
beneficiaries within their facilities include; mapping for all organizations sites in the county, Finger
ink marking, harmonization of distribution days (organizational and inter-partners) to Monday and
Tuesday across the counties, bringing back their empty sachets on distribution day.
- Some BHC are within the health centres to witness the distribution exercise and manage instances
of caregivers using different names in-order to be registered in more than 1 centre.
-BHCs stated through interviews that they know all their area habitats even by clan and where BHC
is active they have caught double registration (not exceeding 5 caregivers in last month) culprits and
facilitated the caregivers selection of 1 health centre instead.
-Reports by CWW and the chiefs revealed some cases of caregivers who came to them after a deal
of using the same baby to get considered forRUTF distribution brought a disagreement. The chiefs
stated that it was a one of incident that had happened within 3 months of the assessment. The chiefs
counseled the caregivers on the intended use of the RUTF in relation to treatment of malnutrition
and directed them to exercise restraint towards such behavior.
CWW, PUI, chiefs,
BHC, CNVs, health
centre in-charge,
CFs
13 SC-OTP-
TSFP
interface
-In the registers, most children were cured to TSFP for continued treatment, within the same
centre/center
-CNVs interviewed stated that children who don’t fit in the OTP criteria they are admitted into the
TSFP while those with complications were referred to the SC,
CNVs, nutrition
assistant, health
centre in charges,
OTP and SC
registers
14 Prioritization
of CMAM
beneficiaries
for GFD
-Entry into the nutrition treatment programs is an automatic consideration for GFD in the hope of
reducing RUTF sharing.
-There was a notable increase in OTP admissions since the directive in March 2017.
-More caregivers were reported to be bringing in children with the knowledge that they will get food
for their families, especially in the lean season.
Chiefs, BHC, CWW,
CNVs, HHPs, CF,
Health centre in-
charge, fathers,
caregivers
15 Increased
number of
widespread
OTP sites
-There are currently 24 OTP sites under the support of CWW, serving Aweil North an increment
from the 16 facilities in the previous SQUEAC. 6 of the facilities were added between December
2016 and January 2017
OTP_TSFP sites list
and catchment map,
CWW, OTP
registers

17 | P a g e
Barriers Explanation and analysis Sources
1 RUTF as
food
-It was observed that RUTF, as well as CSB, is sold in the market as reported by shopkeepers, who reported
to have bought some of beneficiaries. Some caregivers exchange the RUTF for basic needs especially food
items such as madeca (silver fish), salt, sugar and tea leaves.
-According to a shopkeeper during an interview, he stated that he knows the muguok adoor (RUTF) is used
for adoor (people with malnutrition) but to him it is aprepared food item that can be used for survival.
- The shopkeeper’s reasons for choice of sale of RUTF by shopkeepers were revealed as: they are a quick
sale, it is sweet, rarely found in the market and finally buy cheap and get faster profit.
- A sub-chief revealed that she has seen 2 caregivers in the last 3 months exchanging the RUTF with the
traders in the market. She did not take any action as she said there was a team responsible for arresting such
individuals.
-Chief said areas without market are less likely to be selling the RUTF, as well; he formed a group of 4
people who monitor for theft and stealing.
-Even though the village elders said that the RUTF is used to treat children with malnutrition, some
complained why they (as elders) are not given the muguok adoor (RUTF). This was corroborated by CNVs
who said were asked for (CSB++ alias abik adoor) by the elders.
-3 RUTF theft incidences were reported (approximately 6.5 cartons) in 3 separate facilities supported by
CWW in Aweil North, between September and October (None in November 2017). Approximately 30
cartons were reported as missing from 7 facilities (Makuach Akec, Ariath, Warapei, Ajak wol and Maper
Ngok, Peth and Mayom Adhal) in year 2017.
-CNV reported that some caregivers (in SMART survey) who had been referred during the recently
completed SMART survey had their children already in the program hence, hoped to registered twice.
CWW, Theft
incidence
reports,
shopkeeper,
health centre in
charge,
Program
security reports,
Village elders,
caregiver who
of a non
respondent who
sells RUTF,
fathers of
children not in
program
2 Opportunit
y cost
among
primary
caregivers
(mothers)
-Caregivers of defaulters interviewed stated that they were either busy in the farms, had travelled to visit
relatives in the nearby counties or were taking care of their elderly or sick relatives with no one to leave to
them.
-interviews with fathers of Children below 5 years (in program and those not in the program) revealed that
it was the mother’s duty to take their children to the hospital. A few fathers prefer taking their children for
the one-time treatments only, not every time. Others said they can take their children to hospital only when
their mother is busy, and only those who can walk as they can’t be seen to carry children.
- Health centre in-charges of facilities with most defaulters stated that many children default due to the
caregivers being busy
Caregivers of
defaulters,
fathers of under
5 children in
program,
fathers of
children not in
program. CF,
CNVs
3 Weak
defaulter
tracing and
Poor active
case
-Some villages are mobilized to take their children to the centre for malnutrition screening set on certain
days (usually Thursdays and Fridays). This was revealed to result from caregiver insults when their referred
children are not admitted into the program after rescreening at the site; they later refuse their children being
screened by the HHPs and CNVs in the homes.
Chiefs, health
centre in-
charge,
community
facilitator CF,

18 | P a g e
finding in
far areas
-Most facilities have set aside 2 days a week for active case finding where each HHP is assigned a village
by the CF and for some facilities, once a month depending on their plan.
-Some caregivers of defaulters said they had not seen anyone going house-to-house screening where they
stay (about an hour walking distance from centre) the most recent time being June-July or September 2017
-Some CNVs and HHPs were not feeling motivated to work being that they receive only 20$ (given as
2280SSp instead of the dollar currency), which they felt was a low rate in comparison to the cumulative
work they do. It is the chiefs and BHC who encourage them to continue as they benefit their own
communities.
caregivers of
children not in
program, CNVs,
HHPs, nutrition
assistant, BHC
4 Distance -Homes that are “far” are not visited for active case finding and defaulter tracing being that the CNVs and
HHPs foot all the way. Some of the villages, ≥1 hour away, were lastly visited in June and July as revealed
during the assessment’s case finding.
-Chiefs stated that those living in the “farmlands” have no health centre and water points near them and so
may not know about the program nor malnutrition. Some families migrate to those areas from their home to
those areas for cultivation between April and May up-to post harvest, between September and December.
This was corroborated by some caregivers of defaulters, HHPs after unsuccessful defaulter tracing and the
constantly high (≥15%) defaulting rate in the county.
-Some caregivers will decline referrals to the OTP sites that are generally ≥ 1.5hours walking distance.
-Some of the caregivers of defaulters stated that they lived on the other side of the river and during the rainy
season it was impossible to cross the river; the alternative route was longer therefore missing out on the
distribution days.
Chiefs,
community
facilitators,
caregivers of
defaulters,
CNVs and
HHPs, health
centre in-
charges, CWW
5 Non-strict
conformity
of the
CMAM
(OTP)
guideline
-3 separate caregivers of defaulters were followed up to their homes (from the register) and they insisted
that after getting to their 3rd visit, the CNVs and HHPs told them their children were okay and therefore
should not continue coming for the visits. This was refuted by the CNVs who reported that OTP guidelines
are adhered to
-Health centre in-charge mentioned that for children that seem not to be improving by the 6th week they
discharge some as non respondent.
-A community facilitators and chiefs stated that some CNVs will favor some children (sometimes relatives)
to enter into the program so the community facilitator will have to confirm the measurements taken.
-Some children were admitted into the OTP registers and then discharged a few visits later as “wrong
admissions”
-Some beneficiaries were discharge when the MUAC was still below 11.5cm
- Use of one criteria (MUAC) as priority (apart from oedema), regardless of the weight for height Z-scores.
-MUAC measurement was taken for some Oedematous children.
-Some MUAC measurements were changing unrealistically through the visits
Observation,
caregivers of
defaulters,
community
facilitators,
CNVs, health
centre in-
charge,
caregivers of
malnourished
children, HHPs

19 | P a g e
-When asked what they do when they find a child with MUAC of ≥ 11.5cm, some CNVs from different
facilities stated that they refer to TSFP while some said they would just advice the caregiver on feeding and
good child care.
-A few caregivers with children found to be malnourished in the assessment stated that when they went to
the centre at the screening point only MUAC was measured and they were told their children were alright,
to go back home
6 Late
treatment
seeking for
malnutritio
n
-When children have other illnesses, diarrhea, malaria, vomiting, they are taken to the hospital for treatment
(mostly outside the government structures with no referral to the OTP) but malnutrition was not taken with
the same urgency as revealed through the some very low MUACs at admission. Some of the children were
identified through the assessment’s case finding.
CNVs, Health
centre in-
charge,
Caregiver of
children found
to be
malnourished
7 Poor OTP
record
keeping
and
documentat
ion
-The admission months do not follow chronologically with some skipped visit dates, there were blank spaces
with no indication of absenteeism then the measurements continue in the date the beneficiary returns, some
of the “returned defaulters” were recorded as either “new cases” or “returned referrals”, some admissions
have no indication of measurements nor village information, some admissions did not have admission dates
- There was improvement in documentation noted during the period
-Community facilitators and CNVs stated that it is the community facilitator who is supposed to be in-charge
of registration for admissions and discharge of beneficiaries as are trained for that. Even so, some facilities
allow for the CNVs and HHPs to take charge of the exercise.
OTP registers,
CNVs, CFs,
CWW

20 | P a g e
2.2 Stage 2
On completion of stage 1, a 2-part hypothesis was formed that “OTP coverage in villages
designated as farmlands for cultivation is low (below 50%)”, while “OTP coverage in villages
used for permanent settlement is high (above 50%)”32. These statements were directed by the
following information:
• Fathers of children NOT in the program, some village elders, chiefs and health
centre in-charges stated they had seen very thin and weak children, in the far
villages, especially the “farmlands” but not in their neighborhood areas33
• When asked, CNVs and HHPs stated that they see many of the very malnourished
admissions coming from the “farmlands”, which could probably be attributed to
distance
• SPHERE expectation of coverage for rural areas is at-least 50%34
2.2.1 Stage 2 Process
In order to test the hypotheses drawn after the completion of stage, four (4) villages were selected
purposively, 2 representing villages where people migrate into for cultivation and nearly all move
out after harvest (farmlands); these were Machar Abeer in the catchment of Mayen Ulem PHCU
and Mindiik village in the catchment of Jaac PHCU. The other 2 representing villages where
people call home even if may have chosen to do some kitchen gardens (Non-farmlands); these
were Makuach Kuol village in Pamat PHCU catchment and Kadiic village in Ariath PHCU
catchment. In the sampled villages, active SAM cases were to be identified in-order to confirm if
they were in the program or not. To identify the active SAM case, a door-to-door screening of all
children under five years was done by the team of enumerators. The screening was done using
MUAC and oedema.
Data Collection:
A short questionnaire as recommended by SQUEAC was administered to the caregivers of
malnourished children who were not in the program. The screening was done by a total of 4 CNVs
and 1 HHP from each facility catchment area, in addition to the 14 SQUEAC enumerators.
Identification of malnourished children through MUAC measurements and testing of bilaterally
pitting oedema was reemphasized prior to comment of the Stage 2 activity. Each team was
provided with a sachet of RUTF from the catchment facility to utilize during the door to door case
finding. As well, the caregivers who mentioned to being in the program were asked to describe the
32 Interviews with fathers with children below 5 years not in the program, Male and female village elders, chiefs, Health facility
in-charges, CNVs and HHPs, Caregivers of malnourished children identified during the assessment. 33 The areas designated as mainly farmlands for cultivation were said to have limited or no access to health services and clean
water. Some of such villages are up-to 5 hours walking distance from the nearest facility. 34 Sphere Project. (2011). The Sphere Handbook: Humanitarian Charter and Minimum Standards in Humanitarian Response (3rd
ed.). Practical Action Publishing. Retrieved from http://www.sphereproject.org/handbook-download

21 | P a g e
product and packaging they received and when they received it last. The CNVs and HHPs were
also paired with the SQUEAC enumerators for ease of the house to house activity as well as to
ascertain current beneficiaries.
2.2.2 Case Definition
The common terms used were “door” for the thin and weak (generally to mean malnutrition)
“nguet” for very thin, “weth” and “Buut” for the swollen, “panadoor” commonly used for
malnutrition treatment center, “muguok adoor-malual” for RUTF, “abik adoor” for the CSB++
while “muguok adoor-marol” for RUSF. The results were presented as either: SAM in OTP, SAM
not in OTP, Recovering SAM in OTP (Table 3).
Table 3: Stage 2 Results by Village
Area Village Health
centre
catchment
SAM in OTP
(MUAC
<11.5cm
or oedema)
SAM NOT in
OTP (MUAC
< 11.5cm
or oedema)
Recovering
SAM in OTP
MUAC
≥11.5cm
Farmlands Machar Abeer Mayen Ulem 5 1 3
Mindiik Jaac 6 1 11
Non-
farmlands
Makuach kuol Pamat 0 0 1
Kadiic Ariath 9 2 20
The results were analyzed using the simplified LQAS decision rule (d=n×p/100) where the
percentage Sphere coverage standard of 50% was used for the areas. “High” coverage was to be
labeled when the number of SAM covered cases (SAM in OTP) were higher than the decision rule
(d); and “low” coverage when the number of those SAM covered were less than the decision rule
(d) (Table 4).
Table 4: LQAS Decision Rule Results
Villages used as
farmlands
LQAS decision rule Conclusion
Coverage target 50% Since the number of covered cases (11) was
higher than the decision rule (6), The hypothesis
that “OTP coverage in villages designated as
farmlands is low (below 50%)” was rejected.
This meant that coverage within the villages
designated as farmland was more than 50%.
Sample total (SAM cases) 13
Decision rule 𝑑 = ⌊13 ×
50
100⌋ = 6
Number of SAM covered 11
Villages used as
permanent residence
LQAS decision rule Conclusion
Coverage target 50% Since the number of covered cases (9) was
higher than the decision rule (5), the hypothesis
“OTP coverage in villages used for permanent
settlement is high (above 50%)”was accepted. It
Sample total (SAM cases) 11
LQAS decision rule 𝑑 = ⌊11 ×
50
100⌋ = 5

22 | P a g e
Number of SAM covered 9 also meant that coverage in the villages that are
used as permanent residence was more than
50%.
Reasons for not being the program were sort from all the caregivers of the children found to be
malnourished and NOT in the program (Figure 11) and then referral forms were given in the
presence of a CNV or HHP to their nearest panadoor (malnutrition treatment center) or the site
preferred by the caregivers.
2.2.3 Prior Formation
Four (4) methods of estimating coverage were used considering the prior information acquired
through stage 1 and 2.
2.2.3.1 Un-weighted Barriers and Boosters
All the triangulated barriers and boosters were put in a list and taken to have same amount of effect
on coverage, 1% being the minimum effect and 5% being the maximum effect, each barrier and
booster was awarded the maximum effect (5%) being that most had been believed to have that
effect on the coverage. There were a total of 7 barriers and 15 boosters that added to 35.0% and
75.0% respectively. Boosters were added from 0 while barriers were subtracted from 100% and
the mean of the 2 results gave 70.0% (Table 5). (0+75) + (100-35) = 140; 140/2=70.0%.
2.2.3.2 Weighted Barriers and Boosters
Each barrier ad booster was taken to have a different amount of effect on coverage. Those thought
to have less effect were given a low weight while those with more effect were given a higher
weight, 1% was the least and 5% was the highest effect. The boosters had a total of 65.5% weight
while barriers 16.0%; boosters were added from 0 while barriers were subtracted from 100% and
the mean of 75.6% was achieved (Table 5).
(0+67.5) + (100-16.0) = 151.5; 151.5/2=75.6%
Table 5: Weighted and Un-Weighted Barriers and Boosters
Boosters Weighted Un-weighted
Consistent supply of RUTF 4.5% 5.0%
Incentivized caregivers on day of admission into program 4.5% 5.0%
Positive opinion of the OTP 5.0% 5.0%
Community referrals 4.5% 5.0%
Increase in number of program staff 4.5% 5.0%
Some OPD referrals to OTP 3.5% 5.0%
Mass MUAC screening 3.5% 5.0%
Quarterly community dialogue 4.0% 5.0%
Collaboration between the CNVS-HHPS and Chiefs-BHC 5.0% 5.0%
Community can identify some signs of malnutrition 4.5% 5.0%
Many incentivized and trained CNVs-HHPs 4.5% 5.0%
Mitigation of double registration 5.0% 5.0%
SC-OTP-TSFP interface 5.0% 5.0%

23 | P a g e
Prioritization of CMAM beneficiaries for GFD 5.0% 5.0%
Many widespread OTP centers 5.0% 5.0%
Total 67.5% 75.0%
Barriers Weighted Un-weighted
RUTF as food 3.0% 5.0%
Opportunity cost among caregivers’ 2.0% 5.0%
Weak defaulter tracing and active case 3.0% 5.0%
Distance 2.0% 5.0%
Non-strict conformity of the OTP guideline 2.5% 5.0%
Late treatment seeking for malnutrition 2.0% 5.0%
Poor OTP record keeping and documentation 1.5% 5.0%
Total 16.0% 35.0%
2.2.3.3 Concept Map
The list of all the well triangulated barriers and boosters were put in a diagram to expound on the
interrelation in the context of Aweil North (Annex 6). The arrows that represented the positive
effect on coverage (44) were taken as boosters while those that represented the negative effect on
coverage were (10) were taken as barriers. The boosters were added to 0 while the barriers were
subtracted from 100; the mean of the two 67.0% was achieved.
(0+44) + (100-10) = 134; 134/2=67.0%
2.2.3.4 Histogram Prior
The team of enumerators made 7 informed guesses on what the coverage was thought to have been
in Aweil North. The informed guess was based on their judgmental approach as per the program
data their own analysis of the program routine data. Information collected through stage 1 and 2
was used to inform the belief. The average achieved was coverage of 70.1% with the belief that
coverage was 65% to 80%
An average of the estimated coverage was attained a prior mode of 70.7% based on the 4 estimation
methods. (70.0+75.6+67.0+70.1)=282.7; 282.7/4=70.7%
A graphic curve that best represented the prior mode was drawn using the BayesSQUEAC
calculator
Figure 9: Prior Mode based on BayesSQUEAC calculator at β(12.5,5.9)

24 | P a g e
2.3 Stage 3
2.3.1 Sample Size Calculation
The BayesSQUEAC paramenters α of 12.5 and β of 5.9 and the prior mode of 70.7% in addition
to a precision of 10% were used in the calculation of minimum sample size 63.2 (rounded up to
64 children). The formula used was as shown:
Equation 1: Sample Size Calculation (SAM Cases)
𝑛 =𝑚𝑜𝑑𝑒(1−𝑚𝑜𝑑𝑒)
(𝑃𝑟𝑒𝑐𝑖𝑠𝑖𝑜𝑛 ÷1.96)2 − (𝛼 + 𝛽 − 2)
A total of 22 villages (21.5 villages rounded up) from where the assessment sample size was
derived, was calculated using the %SAM prevalence of 2.5%35; average village population of
654 36and 19.0% children below 5 years37 using the formula:
Equation 2: Sample Size Calculation (Number of Villages)
𝑛 𝑣𝑖𝑙𝑙𝑎𝑔𝑒𝑠 =𝑛
𝑎𝑣𝑒𝑟𝑎𝑔𝑒 𝑣𝑖𝑙𝑙𝑎𝑔𝑒 𝑝𝑜𝑝𝑢𝑙𝑎𝑡𝑖𝑜𝑛 × %𝑝𝑜𝑝𝑢𝑙𝑎𝑡𝑖𝑜𝑛 6 − 59𝑚 × %𝑆𝐴𝑀 𝑝𝑟𝑒𝑣𝑎𝑙𝑒𝑛𝑐𝑒
2.3.2 Sampling and Sampling Frame
As recommended by SQUEAC38, a 2-stage sampling approach was used. The first stage sampling
was the selection of the 22 villages, which was done systematically from the complete list of
villages which was sorted by health facilities catchment area. This list was provided by CWW and
contained all villages by catchment health facilities supported by CWW and it formed the sampling
35 Based on the 2017 (November) SMART survey based on MUAC 36 Based on the available village population estimates in the CWW mapped list 37 As used in the previous SQUEAC for Aweil North in 2014 38 https://www.fantaproject.org/sites/default/files/resources/SQUEAC-SLEAC-Tech-Reference-Oct2012-
SQUEAC.pdf

25 | P a g e
frame for stage one sampling. From the sampled 22 villages, exhaustive sampling was done which
was the 2nd stage, as also recommended by SQUEAC39. The justification for using exhaustive
sampling in stage 3 was to ensure that all malnourished children were captured from the sampled
villages as explained in the next sub-topic.
2.3.3 Data Collection
During the stage 1 qualitative data collection, 14 community members to include the female and
male village elders, fathers and mothers of children below 5 years not in the program were
independently shown pictures (used by the CWW during trainings) of a very thin child (nguet), an
oedematous and healthy child. As well, they unanimously stated to not have seen such thin children
in their villages, as well, some ad never come across an oedematous child (weth). It was therefore
eminent to use the house to house approach to confirm the claim. The CNVs and HHPs from each
sampled centre catchment were mobilized and formed part of the enumeration team to ease the
process. Referral forms were given to the caregivers of all though found to be malnourished, to
their nearest or preferred nutrition treatment site.
2.3.4 Quantitative Data Results
The results of the wide area survey were classified as either SAM in OTP, SAM not in OTP,
Recovering in OTP. No oedema cases were found throughout the assessment. The “recovering
out” (Rout) was calculated as required to derive the single coverage estimate, guided by the single
coverage estimate guideline40 (Table 6). On completion of the wide area survey, the results for
Gorayen village in Malual North were excluded from the coverage estimation on the realization
that PUI had an OTP center within that village. The results therefore were from 21 villages (Annex
2).
Table 6: Single Coverage Estimate Results
A single coverage estimate of 80.4% (73.2-86.3) was attained for Aweil North through the
Bayesian statistics. The P value of 0.2627 signifies that the belief of prior and the actual results
achieved through the wide area survey have some considerable overlap (Figure 10). This coverage
39 https://www.fantaproject.org/sites/default/files/resources/SQUEAC-SLEAC-Tech-Reference-Oct2012-
SQUEAC.pdf 40 www.ennonline.net/fex/49/singlecoverage 41 Single coverage estimation(A+D)/F; Point coverage (A/C); Period coverage (A+D)/(C+D)
Indicator Number
A SAM in OTP 58
B SAM not in OTP 18
C Total current SAM cases 76
D Recovering in program 41
E Recovering out (calculated) 4
F Total cases 12141

26 | P a g e
estimate was higher than the SPHERE expectation of 50% in a rural area and improvement from
the SQUEAC 2014 of 42.8%. Even so, the coverage was within the acceptable level (>50%) of
indicators for monitoring OTP 42 . Apart from the different timelines for the 2 SQUEAC
assessments, this coverage improvement was linked to strategies put in place to counteract the
barriers identified at the time43 (Annex 5). As well, the strategies that were identified and well
triangulated through this assessment were listed as boosters (Table 2).
Figure 10: Beta Binomial Conjugate Analysis using BayesSQUEAC calculator
2.3.5 Reasons for SAM Non-Attendance
Caregivers of children found to be severely malnourished (MUAC <11.5cm) were asked for their
reasons for non-attendance by means of a simple structured interview guide. These were then
tabulated and presented in a chart (Figure 11). Most caregivers were not aware that their children
were suffering from door despite nearly all of them being able to describe child’s thinness and
weakness and associate it with “door” (Local term to signify malnutrition). Most of the caregivers
believed that it was the illnesses (especially malaria and diarrhea) that their children are suffering
from it. Even though there were no defaulters found during the assessment, all the 4 caregivers of
identified relapsed children were not aware that their children had fallen back into “door”
(malnutrition). All had been discharged to home and on being discharged they were informed that
their children were okay. They believed that they would never get the disease again. Referral forms
were given to all of the children found to be malnourished by MUAC, in the presence of the HHPs
and CNVs involved in the exercise.
Figure 11: Reasons for SAM Non-Attendance
42 CMAM guidelines for the Republic of South Sudan dated December 2016; page 44 43 CWW action points updated January 2016

27 | P a g e
Conclusion
The CWW OTP program heavily relies of positive opinion of the program by community members
who then readily refer caregivers of malnourished children to the respective sites for treatment.
Furthermore, the increased number of incentivized CHVs and HHPs serving in the many
widespread OTP sites were essential in achievement of minimal late treatment seeking for
malnutrition and subsequent good outcome. The community aspect in this program, therefore,
seems to have made it possible for barriers such as distance from household to the site, not to deter
caregivers from seeking medical assistance in management of their children’s malnutrition.
These barriers, however, need to be addressed so as to avoid a negative affect the progress in
coverage; being that they mainly relate to service delivery. The suggested actions towards further
reduction of the identified factors that could pull the coverage down were highlighted as
recommendations (Annex 1).
0 1 2 3 4 5 6 7 8 9 10
Not aware of child's malnutrition
Not aware of program
Distance from OTP
Mother busy

28 | P a g e
Annexes
Annex 1 Recommendations
Section A Section B Section C Section D
Barrier Recommendations (Actions to be taken)
Indicators of progress Who is
responsible Timelines
What activities can be done to reduce the effect or
weight of barrier/ way forward?
RUTF as
food
Engage caregivers of OTP beneficiaries in support
groups that encourage income generating activities to
counter sale and sharing of the RUTF
-Number of caregiver supports of OTP
beneficiaries with income generating activities
CHD, BHC,
MoH,
CWW
Quarterly
Continuation of stern disciplinary action of traders and
caregivers found selling the RUTF as well as those
found stealing
-Availability of RUTF for sale in the market
-Number of individuals caught selling the
RUTF
CHD, BHC,
MoH,
CWW
Monthly
Incorporate market traders in the periodic community
sensitization meetings that emphasize on malnutrition
and its relation to RUTF
-Number of market traders sensitized on the
malnutrition and the proper use of RUTF
CHD, BHC,
MoH,
CWW
Quarterly
Opportunity
cost among
caregivers
-Identify and support health facilities with far village
catchment areas (≥1.5hours) to conduct Integrated
IMAM outreach services. (Prioritize on the Cultivation
villages/farms during cultivation season.)
-Number of operational health and nutrition
Integrated outreach sites by health facilities.
- Number of operational health and nutrition
Integrated outreach sites within the farmlands.
CHD, BHC,
MoH,
CWW,
donors
Quarterly
Inform and allow for caregivers of beneficiaries to
make their intentions of travel known to allow for
necessary transfer-out documentation possible.
-Number of beneficiaries who are transferred
out to other OTP sites.
CHD, BHC,
MoH,
CWW
Monthly
Weak
defaulter
tracing and
active case
Support the CHVs in mobility such as bicycles
protective gear (e.g gumboots and raincoats or
umbrellas) to enable them reach the far villages even
in the rainy season
-Number of CHVs supported with mobility
(such as bicycles’) and protective wear (such
as gumboots) for the rainy seasons.
CHD, BHC,
MoH,
CWW,
donor
Quarterly
Have a report mechanism for HHPs and CNVs for
Community activities conducted by Village
-Number of households visited per village.
-Number of malnourished children referred by
HHPs and CNVs
BHC,
CWW
Monthly
Distance -Identify villages that are about ≥1.5hours walk (far)
without readily available OTP services.
-Number of Villages that are ≥1.5hour walk
away from their nearest health facility
BHC,
CWW
Quarterly
-Offer support to PHCUs and PHCCs with the “far”
villages to carry out health and nutrition integrated outreach services
-Number of PHCUs and PHCCs (OTP sites)
with operational integrated outreach sites
BHC,
CWW
Quarterly

29 | P a g e
Non-strict
conformity
of the OTP
guideline
-Intensify the OJT sessions and trainings with
emphasis on the various admission and discharge
criteria.
-Number of wrong admissions
-Number of OJT of admission and discharge
criteria
-Number of discharges without proper criteria
-Number of admissions by Weight for Height
Z scores
CWW Weekly
Late
treatment
seeking for
malnutrition
Emphasize of importance of prompt treatment for
malnutrition to the caregivers
-Number of Admissions by MUAC that are
below 10.5cm
-Number of OTP beneficiaries who are referred
to the stabilization center on the first day of
admission.
-Number of community sensitization meetings
that emphasize of importance of seeking
treatment early for malnutrition..
CWW Monthly
Poor OTP
record
keeping and
documentati
on
-Identify and support individuals per site who will be
responsible for filling in the registers, for
accountability.
-Identified individuals per OTP site
responsible for filling in the registers
CWW MOnthly
-Intensify the OJT sessions on proper record keeping
using the OTP register for enhanced capacity
-Number of OJT sessions geared towards OTP
registers record keeping.
CWW Monthly
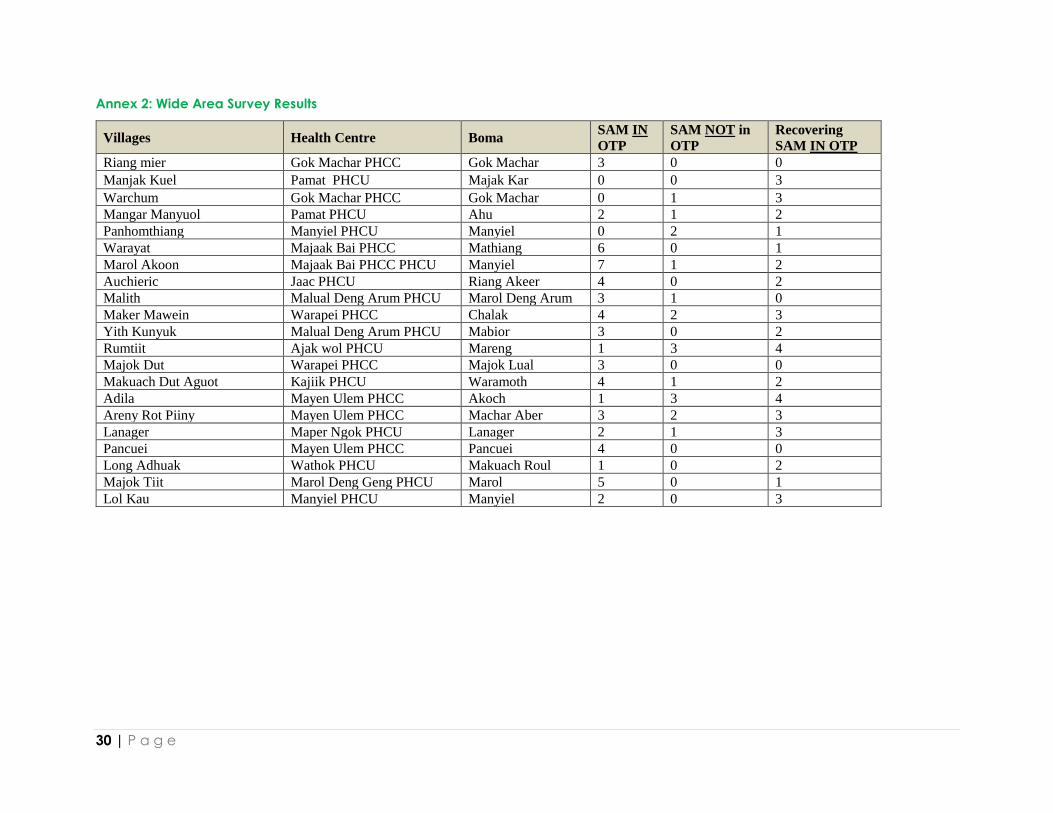
30 | P a g e
Annex 2: Wide Area Survey Results
Villages Health Centre Boma SAM IN
OTP
SAM NOT in
OTP
Recovering
SAM IN OTP
Riang mier Gok Machar PHCC Gok Machar 3 0 0
Manjak Kuel Pamat PHCU Majak Kar 0 0 3
Warchum Gok Machar PHCC Gok Machar 0 1 3
Mangar Manyuol Pamat PHCU Ahu 2 1 2
Panhomthiang Manyiel PHCU Manyiel 0 2 1
Warayat Majaak Bai PHCC Mathiang 6 0 1
Marol Akoon Majaak Bai PHCC PHCU Manyiel 7 1 2
Auchieric Jaac PHCU Riang Akeer 4 0 2
Malith Malual Deng Arum PHCU Marol Deng Arum 3 1 0
Maker Mawein Warapei PHCC Chalak 4 2 3
Yith Kunyuk Malual Deng Arum PHCU Mabior 3 0 2
Rumtiit Ajak wol PHCU Mareng 1 3 4
Majok Dut Warapei PHCC Majok Lual 3 0 0
Makuach Dut Aguot Kajiik PHCU Waramoth 4 1 2
Adila Mayen Ulem PHCC Akoch 1 3 4
Areny Rot Piiny Mayen Ulem PHCC Machar Aber 3 2 3
Lanager Maper Ngok PHCU Lanager 2 1 3
Pancuei Mayen Ulem PHCC Pancuei 4 0 0
Long Adhuak Wathok PHCU Makuach Roul 1 0 2
Majok Tiit Marol Deng Geng PHCU Marol 5 0 1
Lol Kau Manyiel PHCU Manyiel 2 0 3

31 | P a g e
Annex 3: Point and Period Coverage
Annex 4: List of Aweil North SQUEAC Participants
Name Sex Position Organization
Cecilia Adut Lual Female Enumerator Community member
Josephine Aguon Deng Female Enumerator Community member
Piol Thiep Piol Male Enumerator Community member
Deng Tong Deng Male Enumerator Community member
Peter Atak Athuai Male Enumerator Community member
Akok Deng Deng Male Enumerator Community member
Daniel Dau Dhieu Male Enumerator Community member
James Lual Ngor Male Enumerator Community member
John Garang Male Enumerator Community member
John Agany Male Enumerator Community member
Daniel Deng Male Enumerator Community member
Kuom James Kuol Male Enumerator Community member
Joseph Madut Male Enumerator Community member
Gabriel Garang Male Enumerator Community member
Jacqueline Macharia Female SQUEAC Expert Consultant
Indicator Number
A SAM in OTP 58
B SAM not in OTP 18
C Total current SAM cases 76
D Recovering in program 41
E Recovering out (calculated) 4
F Total cases 121
Point Coverage (A/C) 75.2%(65.5%-82.6%); p=0.5983
Period Coverage (A+D)/(C+D) 82.8%(75.5%-88.2%); p=0.145

32 | P a g e
Annex 5: Review of Selected Action Points Derived from the Previous SQUEAC
Previous SQUEAC Performance indicators CWW Status SQUEAC status
-Exhaustive mapping of all villages in the
catchment of each centre
Done -Documentation of mapped villages in nearly all facilities (16 of 24 North
sites) was available. -Some villages are unknown to the CNVs and HHPs some
of which are stated to be in different health centre catchment areas
Areas of intervention of all partners are
clearly delineated and duly documented
-All nutrition partners mapped all their sites to GPS coordinates level.
New Discharge criteria discussed, adopted
and duly communicated to all partners
Done; Admissions and
discharge done by MUAC
-MUAC is the most preferred admission criteria as observed in the OTP
registers and confirmed through intelligent interviews.
Number of trained personnel Training on OTP done in
September 2015 all topics
covered; OJT ongoing
-1 week trainings and 3 days training were conducted between November and
the duration of the SQUEAC 2017 assessment, on HHPs and CNVs, by CWW-
On job trainings were a continuous process as realized through the assessment.
Weekly progress review through field reports Ongoing -Review of weekly reports were observed within the course of this assessment,
as received through the M&E personnel. Personalized On Job training was
ongoing in areas that were noted to need improvement.
Number of persons coming for consultation
and screened passively
Ongoing -Children showing clinical signs of malnutrition are referred to the OTP shelters
for screening.-There was no evidence of anthropometric screening at the
consultation room. Clinical officers highlighted that due to understaffing they
can only manage to refer for screening. Others mentioned that they were not
provided with MUAC tapes.
Exhaustive mapping of all CHVs in the
catchment area of each health centre
Done and lastly updated in
2016
-Volunteers are mapped by OTP site, catchment area and village level. 16 out of
24 facilities had this section documented.
Each CHV is duly trained on all aspects of
his position, including voluntary work for
good of their communities
Done and Ongoing -During each of the trainings this far, the job description of the volunteers is
expounded on. This was revealed through interviews with CWW
Each CHV has necessary material to carry
out his or her work
-The CNVs and HHPs have MUAC tapes and referral slips even though some
complained that for about 2 months they had no referral slips.
Existence of a quarterly screening planning
calendar developed during the coordination
meeting at the health centre level.
Ongoing (CWW had
planned to conduct quarterly
mass screening
-There was evidence of widely conducted Mass MUAC screening in 2017
though the most recent one was conducted in June-July 2017
Sensitization meetings with BHC in each
health centre planned. Organized and duly
documented (sensitization modules, minutes
Ongoing although weak in
most facilities and needed to
be strengthened
-Several facilities represented through the health centre in-charge, CNVs, HHPs
and CFs stated to have either biweekly meetings or monthly meeting with the
BHC for progress review and planning depending on the OTP agenda
Sensitization meetings with Mother to mother
support groups (MTMSGs) planned ,
organized and duly documented
(sensitization modules, minutes, etc)
Ongoing - CWW is working with 0MTMSGs in Gok Machar and Ariath Payams in
Aweil North continually sensitized on IYCF, nutrition key messages and
hygiene mainly.
-In November 2017 the lead mothers were given MUAC tapes and sensitized n
MUAC screening within their villages.

33 | P a g e
Annex 6: Concept Map in the Context of Aweil North
Positive opinion of
the OTP
Consistent
RUTF supplies
Increase in
number of
program staff
Collaboration
between
CNVs-HHPs
and
Chiefs-BHC Mass
MUAC
screening
Poor OTP record
keeping and
documentation
Late
treatment
seeking for
malnutrition
Distance
from facility
to village
Non-conformity of the
OTP guideline
Incentivized caregivers on
admission day
Community referrals
Some OPD referrals to OTP
Many incentivized
and trained
CNVs-HHPs
SC-OTP-TSFP
interface
Prioritization of CMAM
beneficiaries for GFD
Mitigation of
double
registration
Community
can identify
some signs of
malnutrition
Quarterly
community dialogue
meetings
Increased
and
widespread
OTP
centers
Opportunity
cost among
caregivers
Weak
defaulter
tracing and
active case
finding
RUTF as food
Reduces
Reduces
ReducesReduces
Reduces
Enhances
Reduces
Enhances
Enhances
Enhances
Enhances
Increases
Enhances
Increases
Increases
Enhances
Increases
Reduces
Enhances
Increases
Enhances
Enhances
Enhances
Increases
Enhances
Enhances
Enhances
Enhances
Enhances
Reduces
Enhances
Reduces
Reduces
Affects Increases
Affects
Increases
Increases
Affects
Enhances
Increases
Affects
Enhances
Enhances
Reduces
Enhances
Enhances
Leads to
Enhances
Reduces
Reduces
Reduces
Leads to

34 | P a g e
Annex 7: Mapping of the Concern worldwide Nutrition Treatment Sites