Embed Size (px)
Citation preview

1
SQUEAC Assessment of CMAM services in
Fika LGA, Yobe, Nigeria
Semi-Quantitative Evaluation of Access and Coverage
APRIL 2016
Emily Hockenhull, Idris Abdulsalam, Akeem Odewale and Shuaibu Aliyu
Photograph 1; Focus Group with District Head

2
TABLE OF CONTENTS ACKNOWLEDGEMENTS ......................................................................................................................... 4
ACRONYMS ............................................................................................................................................. 5
EXECUTIVE SUMMARY ........................................................................................................................... 6
1. INTRODUCTION AND CONTEXT .................................................................................................... 7
1.1. NUTRITION SITUATION ........................................................................................................... 9
1.2. WINNN PROGRAMME ............................................................................................................. 9
1.3. OBJECTIVES ............................................................................................................................. 9
1.4. SQUEAC ASSESSMENT DESIGN ............................................................................................. 10
1.5. SQUEAC ORGANISATION ....................................................................................................... 11
1.6. CHALLENGES AND LIMITATIONS ........................................................................................... 11
2. STAGE 1: INVESTIGATION PROCESS ........................................................................................... 12
2.1 QUANTITATIVE DATA ................................................................................................................ 12
2.1.1 ADMISSION DATA ................................................................................................................. 12
2.1.2 SEASONAL CALENDAR .......................................................................................................... 14
2.1.3 DISCHARGE DATA ................................................................................................................. 15
2.1.4 DEFAULTER DATA ................................................................................................................. 18
2.1.5 REFERRAL DATA ................................................................................................................... 20
2.1.6 DISTANCE TO TRAVEL ........................................................................................................... 20
2.1.7 QUANTITATIVE DATA COLLECTION CONCLUSION ............................................................... 21
2.2 COLLECTION AND ANALYSIS OF QUALITATIVE DATA ................................................................ 21
2.3 ADDITIONAL INFORMATION ON COMMUNITY VOLUNTEERS ........................................................ 31
2.4 ADDITIONAL INFORMATION ON THE COMMUNITY PROFILE ..................................................... 32
2.5 CONCEPT MAP .......................................................................................................................... 33
3. STAGE 2 - DEVELOPING THE HYPOTHESIS ................................................................................. 34
3.1 JUSTIFICATION ............................................................................................................................ 34
3.2 HYPOTHESES ............................................................................................................................... 34
3.3 SAMPLING ................................................................................................................................... 34
3.4 METHODOLOGY .......................................................................................................................... 34
3.5 RESULTS....................................................................................................................................... 35
3.6 ANALYSIS ..................................................................................................................................... 35
3.7 QUESTIONNAIRE RESULTS .......................................................................................................... 36
3.8 UNCOVERED CASES ..................................................................................................................... 36

3
3.9 COVERED CASES .......................................................................................................................... 39
3.9 STAGE 2 CONCLUSION ................................................................................................................ 40
4. CONCLUSION ................................................................................................................................ 41
5. RECOMMENDATIONS .................................................................................................................. 43
FIGURE 1; MAP OF YOBE 7
FIGURE 2; MAP OF FIKA, (ORANGE DOTS SHOWING THE POSITION OF THE HEALTH FACILITIES OFFERING OTP
SERVICE) 8
FIGURE 3; SQUEAC ASSESSMENT DESIGN 10
FIGURE 4: ADMISSIONS OVER TIME 13
FIGURE 5; MUAC AT ADMISSION 14
FIGURE 6; DISCHARGES OVER TIME (ALL HEALTH CENTRES – ELECTRONIC DATASET) 15
FIGURE 7; DISCHARGES OVER TIME (DATA CARDS CHECKED AT HEALTH FACILITY) 16
FIGURE 8; DISCHARGE OUTCOMES PER HEALTH CENTRE (COLLECTED BY HAND AT HEALTH FACILITY) 16
FIGURE 9; WEEKS IN PROGRAMME BEFORE DISCHARGE CURED - ALL HEALTH CENTRES 17
FIGURE 10; DEFAULTERS OVER TIME 18
FIGURE 11; MUAC AT DEFAULT 19
FIGURE 12; REFERRALS BY SOURCE OVER PERIOD PIE CHART (%) (N=512) 20
FIGURE 13; DISTANCE FROM VILLAGES TO HEALTH FACILITIES (ONE WAY) 21
FIGURE 14; CONCEPT MAP OF COVERAGE 33
FIGURE 15; KNOWLEDGE AND AWARENESS OF MALNUTRITION 37
FIGURE 16; AWARENESS OF CMAM SERVICES 37
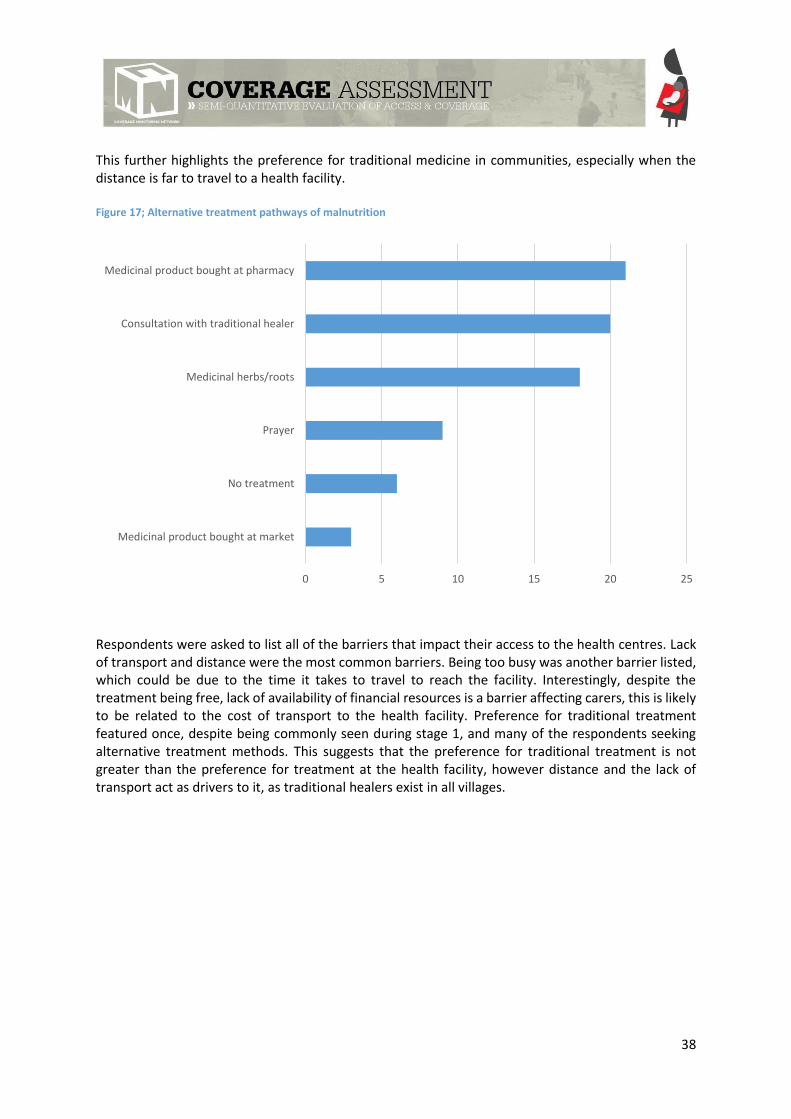
FIGURE 17; ALTERNATIVE TREATMENT PATHWAYS OF MALNUTRITION 38
FIGURE 18; BARRIERS TO ACCESS 39
FIGURE 19; FACTORS CONTRIBUTING TO PROGRAMME ADMISSION FOR COVERAGE CASES FOUND DURING
THE SMALL AREA SURVEY 40
TABLE 1 ADMISSION RECORDS ANALYSED ........................................................................................................... 12
TABLE 2; INTERVIEW BREAKDOWN ...................................................................................................................... 22
TABLE 3; BOOSTERS AND BARRIERS TO THE PROGRAMME ................................................................................. 23
TABLE 4; BOOSTERS TO THE PROGRAMME .......................................................................................................... 26
TABLE 5; BARRIERS TO THE PROGRAMME ........................................................................................................... 27
TABLE 6; CASE DEFINITIONS OF SAM CASES ......................................................................................................... 35
TABLE 7 RESULTS OF SMALL AREA SURVEY .......................................................................................................... 35
TABLE 8; DECISION RULINGS FOR STAGE 2 ........................................................................................................... 36
TABLE 9; RECOMMENDATIONS ............................................................................................................................ 43
APPENDIX 1; SQUEAC SURVEY TEAM 47
APPENDIX 2; INTERVIEW GUIDE: CARERS OF MALNOURISHED CHILDREN (BENEFICIARIES OF CMAM
PROGRAMME) 48
APPENDIX 3; CV SMALL STUDY INTERVIEW GUIDE 1
APPENDIX 4; COMMUNITY MAP 1
APPENDIX 5; DISTANCE SMALL STUDY INTERVIEW GUIDE 2
APPENDIX 6; QUESTIONNAIRE FOR CARERS OF CHILDREN ENROLLED IN THE CMAM PROGRAMME 3
APPENDIX 7; QUESTIONNAIRE FOR CARERS OF CHILDREN NOT ENROLLED IN THE CMAM PROGRAMME 4

4
ACKNOWLEDGEMENTS This assessment would not have been possible without the contributions of ACF-Nigeria. The ACF-Abuja team provided continuous support and oversaw the entirety of the process. I offer my sincere gratitude to the team in Dutse for aiding the training of the SQUEAC team, to the team in Maiduguri for supporting movement to Damaturu, and most importantly, to the team in Damaturu for contributing their time, effort and skill in ensuring this SQUEAC was made possible. Thank you Ben Allen, Martin Njenga and Diego Macias who provided technical support during this SQUEAC, and to Faith Nzioka and Julia Wight for sharing your experiences. Lastly, to Idris, Akeem, Kobi, the core team, who worked tirelessly, in difficult circumstances to deliver the assessment. They were joined by a constantly motivated and hard working group of enumerators who were the back bone to the assessment.

5
ACRONYMS
ACF Action Against Hunger (Action Contre la Faim)
BBQ Barriers, Boosters and Questions
CHW Community Health Worker
CMAM Community Based Management of Acute Malnutrition
CMN Coverage Monitoring Network
CV Community Volunteer
ECHO European Commission's Humanitarian aid and Civil Protection
FSMS Food Security and Monitoring System
GAM Global Acute Malnutrition
HF Health Facility
HV Home visits
IYCF Infant and Young Child Feeding Practices
LoS Length of Stay
LGA Local Government Areas
LQAS Lot Quality Assurance Sampling
MAM Moderate Acute Malnutrition
MCH Maternal and Child Health
MoH Ministry of Health
MUAC Mid-Upper Arm Circumference
OTP Out-patient Treatment Programme
PHC Primary Health Centre
RUTF Ready-to-use Therapeutic Food
SAM Severe Acute Malnutrition
SC Stabilisation Centre
SDU Service Delivery Unit
SDP Service Delivery Point
SLEAC Semi-quantitative LQAS Evaluation of Access and Coverage
SMART Standardized Monitoring for Relief and Transition
SPHERE Humanitarian Charter and Minimum Standards in Humanitarian Response
SQUEAC Semi-Quantitative Evaluation of Access and Coverage
UNICEF United Nations Children’s Fund
USAID United States Assistance for International Development
WHZ Weight-for-Height Z-scores
WINNN Working to Improve Nutrition in Northern Nigeria

6
EXECUTIVE SUMMARY A SQUEAC assessment (Semi Quantitative Evaluation of Access and Coverage) was conducted in April 2016 in Fika LGA, Yobe state, Nigeria. This was part of a series of evaluations conducted to evaluate the work of the WINNN consortium across three states in Northern Nigeria. Of these, Action Against Hunger is implementing CMAM services across 5 health centres, in Fika LGA, Yobe state, where this assessment took place. The quantitative and qualitative data collection and analysis during stage 1 revealed a series of boosters and barriers to access, providing information on positive and negative factors to coverage. Some factors were contradictory, with the same factors acting as both positive and negative influencers to coverage. In most areas, there was some awareness of malnutrition. Respondents were able to identify malnutrition when shown photographs, however when questioned more, understanding decreased, particularly among men. There was decidedly less knowledge on the effects of malnutrition in communities, but also amongst CVs and some health workers. Disparities occured in programme awareness, with many carers of children taking part in sensitisation sessions with CVs, yet men having little knowledge of the programme. Boosters include the positive perception of the CMAM programme, which results in peer-to-peer referrals. This links to good community cohesion, where a strong sense of community results in assistance by community members for carers to access clinics, and thus, increased referrals. As stated, there were several barriers to coverage. Distance is a major barrier, some communities are a 14 round trip on foot away from the health facilities. This is exacerbated during rainy season when villages become more isolated, the high cost of transport due to the motorcycle ban and fuel scarcities. Insecurity in villages and when travelling remains a barrier, preventing access to services, particularly in communities far away. High levels of defaulting were seen in February 2015, as a result of insecurity. Selling of RUTF and misuse of RUTF are common, demonstrating that RUTF is seen as food and not medicine. There is also a strong preference for traditional medicine, which is perceived as being cheaper than visiting the health facility because of transportation costs. At the facility level, long waiting times upwards of 4 hours create poor perceptions of the programme, leading to less referrals and increased rates of defaulting. Poor record keeping and inaccurate application of CMAM protocols, meant that records are difficult to analyse and cases were being discharged earlier than they should. The following recommendations were developed, by the Action Against Hunger – Nigeria team, to address these barriers and build on the boosters:
Expand CMAM sites and CMAM outreach to far and hard to reach communities
Discourage sharing and selling of RUTF
Improve sensitization, mobilisation and awareness of malnutrition in the community
Improve sensitization and awareness of CMAM programme protocols
Develop synergy with traditional healers on sensitisation, awareness and referral of SAM cases
Improve the ability to be able to monitor the quality of programmes through improving record keeping

7
1. INTRODUCTION AND CONTEXT Over the last 3 years, Nigeria has suffered from the escalation of the insurgency in the North East region, resulting in increased numbers of attacks. In April 2016, over 2.1 million Internally Displaced Persons (IDPs) were reported1 in Nigeria, with more than 1.6 million Borno State, around 200,000 IDPs in Yobe State and 115,000 in Adamawa State, which are the three most affected states. Yobe state is in the North East of Nigeria, it shares a border with the Republic of Niger to the North, and borders Jigawa and Bauchi states to the West, Borno to the East and Gombe in the South. The capital is Damaturu. It has a population of approximately 2.5 million, which comprises Manga, Kanuri, Fulani, Karai-karai, Bolewa, Bade, Ngizim, Ngamo, Babur, Maga, Hausa and several other ethnic groups from different parts of the country. The official language in the state is English, but Hausa, Kanuri and Fulani are widely spoken. Most of the people are peasant farmers, also engaged in livestock rearing and production, fishing and trading2.
Figure 1; Map of Yobe3
1 Nigeria Emergency Operations, International Organisation for Migration, (2016). Situation Report: April 2016. [online] Available at: http://nigeria.iom.int/sites/default/files/dtm/Nigeria%20Situation%20Report%20-%20April%202016.pdf [Accessed 10 May 2016]. 2 Yobestate.gov.ng. (2016). ABOUT « Official Website of Yobe State Government. [online] Available at: http://www.yobestate.gov.ng/about/ [Accessed 27 Apr. 2016]. 3 Nigeria Zip Codes. (2012). Yobe State Zip Code Map. [online] Available at: http://nigeriazipcodes.com/513/yobe-state-zip-code-map/ [Accessed 26 May 2016].

8
Most of the IDPs (92%) are living in host communities, while the other 8% are living in formal or informal camps. With the population already facing challenges to meet their basic needs, the situation prior to the insurgency was already complex. The large number of IDPs being hosted have widened these gaps, majorly impacting host populations. Most of the IDPs have been displaced for more than a year, increasing the burden on the host community. There are high levels of food insecurity throughout the North East, with significant impacts on the ability of farmers to grow crops, disrupted market activity and trade flows and high food prices4. Nutrition security has also deteriorated with Global Acute Malnutrition (GAM) increased in both Yobe and Borno State. While most of the IDPs in Yobe State are located in Damaturu and Potiskum, Fika LGA has also been hosting IDPs and suffered several attacks by insurgents in the past. Through informal exchanges, it emerged that Fika has also been identified by the local authorities as being vulnerable and in need for humanitarian assistance.
Figure 2; Map of Fika, (orange dots showing the position of the health facilities offering OTP service)
4 FEWSNET. (2016). Nigeria Food Security Outlook; October 2015 to March 2016.

9
1.1. NUTRITION SITUATION
The most recent official estimates of acute malnutrition are from a national health survey conducted from July-September 2015. The National Nutrition and Health Survey (NNHS) show Global Acute Malnutrition in Yobe state, to be at an emergency level at 10.9% (8.6-13.7%, 95% confidence interval), Moderate Acute Malnutrition (MAM) at 8.9% (7.0-11.3%) and Severe Acute Malnutrition (SAM) at 2% (1.1-3.5%)5. The data was collected during the peak of the lean season, and thus, more up to date data is required to more accurately reflect the situation in Fika LGA. This data is also non-specific to Fika, and prevalence of malnutrition is likely to differ in this LGA.
1.2. WINNN PROGRAMME
In partnership with the UK Department for International Development, the WINNN (Working to Improve Nutrition in Northern Nigeria) consortium (ACF, Save the Children and UNICEF) has been supporting community based management of acute malnutrition (CMAM) services since 2011. The objective of the WINNN is to improve nutrition by providing treatment for severe acute malnutrition, vitamin A supplementation and deworming, and promotion of improved infant and young child feeding (IYCF) practices. By the end of the project in 2017, 6.2 million children under five across five states (Kebbi, Katsina, Jigawa, Zamfara, and Yobe) in northern Nigeria will have benefitted from services. The WINNN project is composed of four components:
1. Integration of Micronutrient interventions into Routine primary health services 2. Delivery of effective IYCF interventions 3. Delivery of effective treatment of Severe acute malnutrition 4. Strengthening Advocacy and coordination at the State and National levels.
In terms of support to CMAM services, the partners are supporting three different Local Government Areas (LGAs) in each of the five states. In Yobe state, three LGAs, Fika, Machina and Yunusari LGAs, are supported by Action Against Hunger for SAM treatment. The programme in Fika supports CMAM services integrated in 5 health facilities, the stabilisation centre (SC) and support to f 125 CMAM community volunteers (CVs). These OTP sites can be seen in figure 2. Complimentary to the CMAM direct programming, are the 500 IYCF CVs that are present – some of the CMAM CVs are also the IYCF CVs. There are 25 CMAM CVs per health facility, and there are 50 IYCF CVs per ward. The gender breakdown of CMAM CVs is not available, with IYCF CVs being women and men in the ratio 3:2, due to the nature of the topics being discussed. CVs are unpaid, but are given t-shirts and bags to carry out their work. In one community (Godowoli), CVs are supported by other community members in the form of millet, sorghum and beans. The purpose of the assessment is to provide the WINNN partners with coverage information to determine the quality of services in areas of operation and to provide concrete recommendations in order to improve access and coverage SAM treatment.
1.3. OBJECTIVES
The purpose of the assessment was to provide the WINNN partners with coverage information to determine the level of met need in the areas of operation and to provide concrete recommendations in order to improve access and coverage SAM treatment.
5 National Bureau of Statistics. (2015). National Nutrition and Health Survey (NNHS) 2015.

10
Specific Objectives:
1. To estimate coverage of CMAM services in Fika LGA 2. To identify factors (boosters and barriers) affecting the uptake of the SAM treatment 3. To provide an in depth analysis of programme performance and factor affecting coverage
across Fika LGAs 4. To develop specific recommendations to improve acceptance and coverage of the programme
5. To enhance competencies of partner staff in coverage survey methodologies
1.4. SQUEAC ASSESSMENT DESIGN
A SQUEAC assessment is semi-quantitative, using a mixture of quantitative and qualitative data. Each type of data is collected throughout the assessment in the following three stages (See Figure 3). This culminates in the reliable estimation of coverage and a clear understanding of factors affecting coverage. Figure 3; SQUEAC assessment design
Stage 1:
Quantitative routine programme monitoring data (e.g. trends in admission, exit, recovery, in-programme deaths, and defaulting) and data collected on beneficiary record cards (e.g. MUAC on admission).
Existing contextual information: Agriculture, labour, disease, food-consumption, which may already be available from sources such as nutritional anthropometry surveys, agricultural assessments, livelihood surveys, food-security assessments.
Qualitative data collected through informal group discussions and interviews.
Stage 2:
Uses small studies, small surveys, and small-area surveys to confirm or deny hypotheses about programme coverage that arise from the analysis of programme and qualitative data.
Stage 3:
Uses Bayesian techniques to estimate overall programme coverage with a wide area survey6 (stage 3 was not included as part of this SQUEAC assessment).
6 Adapted from: Myatt. M et al, Semi-Quantitative Evaluation of Access and Coverage (SQUEAC)/ Simplified Lot Quality Assurance Sampling Evaluation of Access and Coverage (SLEAC) Technical Reference (http://www.fantaproject.org/publications/squeac-sleac.shtml)
STAGE 1: Quantitative
and qualitative data collection
and analysis
STAGE 2: Hypothesis
development and testing
boosters and barriers
STAGE 3: Estimation of
global coverage
SQUEAC Complete
understanding of +/- factors
affecting coverage
11
1.5. SQUEAC ORGANISATION
The SQUEAC investigation was implemented using 3 teams. There were three ACF-Ng members of staff involved in the process; the State Technical Advisor, the M&E Technical Advisor (WINNN programme) and the Fika LGA WINNN Technical Advisor. An ACF-Ng member of staff each lead a group of 2/3 enumerators. The 8 enumerators worked as quantitative and qualitative data collectors, as well as survey questionnaire providers. The gender breakdown was 4 women and 7 men, there was a female enumerator in each team. Training: All team members were trained over two days, to provide an overall introduction to SQUEAC methodology and practical hands-on technical training for quantitative and qualitative data collection techniques. They were trained on understanding OTP card information collected as well as data collection for quantitative data analysis, qualitative interview guides and techniques for interviews and focus-group discussions, and anthropometric measures of oedema and MUAC. The training included a brief introduction to CMAM programming, as well as key terminology necessary in the field. Supervisors played an integral part in the training days and were able to lead on sessions related to CMAM programming in Nigeria, and local words used. They were also present in the field and available for supervisions and course corrections; as well as leading data analysis and discussions. Field work: The field work was organised to ensure that relevant SQUEAC data was collected from all 5 health facilities with OTP, as well as interviews conducted in wards which did not have CMAM services. The teams were responsible for identifying the traditional leaders and making introductions prior to interviews with key informants and planned interviewees. Any questions or clarifications needed were discussed through telephone calls from the field, as such course corrections and direction was assured. Reporting: As the Action Against Hunger staff were present in Fika for the entirety of the data collection, and have first-hand field experience of the SQUEAC process, the SQUEAC reporting was a collaborative process. The State Technical Advisor, the M&E Technical Advisor (WINNN programme) and the Fika LGA WINNN Technical Advisor all contributed and collaborated with the report writing throughout.
1.6. CHALLENGES AND LIMITATIONS
Insecurity – The presence of insurgents in the North, and in Fika LGA meant that travel was extremely limited for the SQUEAC facilitator, and travel to Fika LGA was off limits. Curfews were adhered to for the team. Rather than the continuous training that usually takes place in a SQUEAC assessment, training was limited to 3 days class room training and half a day of field based training in in Dutse, Jigawa. An additional day of classroom training was given following stage 1, in Damaturu, Yobe. Remote support from Abuja was then provided to the team.
Connectivity – due to the rural location of Fika, internet and phone connectivity was sometimes disrupted, making the provision of remote support difficult at times.
Time Constraints – due to said security constraints, the team were not trained in Fika LGA, and instead were required to travel to Jigawa and Damaturu. Therefore, extra time was required for the team to travel, which resulted in more travel days for the team, putting pressure on the time allocated for data collection.
Remote support – Providing remote support from Abuja, through poor connections resulted in a lack of direct contact with the team. Due to this, some depth of qualitative analysis may have been affected, particularly in the BBQ (boosters, barriers, questions) stage, as close supervision was not possible.
12
Lack of information – there was a general lack of information regarding Community Volunteers and their activities at community level. This particular aspect of the CMAM programming was therefore difficult to analyse.
2. STAGE 1: INVESTIGATION PROCESS The objective of Stage 1 is to pinpoint areas of possible high and low coverage within the district and identify boosters and barriers affecting CMAM coverage using collected (or existing) quantitative data and additional qualitative data. Analysis of quantitative data aims to establish trends from routine monitoring data such as: admission rates, MUAC on admission, deaths, cured, defaulters and non- respondents. Where the quantitative data tells us what is happening in the programme, and the qualitative data explores why.
2.1 QUANTITATIVE DATA
Data was extracted from the routine monitoring data set for all OTP sites in the state nutrition database. Additional monitoring data had to be collated by hand from record books kept at health centres and OTP cards where available, including: MUAC on admission, MUAC on cure and MUAC on default, length of stay (LOS) for defaulter and LOS for cured exits. These are not collected on a routine basis, but are essential components for a full trend analysis of programme performance. Approximately 10% of all admissions were checked, by counting every tenth admission to provide seasonal reflectivity. This totalled 512 records:
Table 1 Admission Records analysed
Health Facility Number of records
Gadaka 192
Kurmi 81
Fika 118
Kukar gadu 45
Godowoli 76
Total 512
The data quality varied between health facilities, with the data collected from Fika MCH well arranged, organised and easy to read. Kurmi, Godowoli and Kukar Gadu health centres were cited as having poor data management and record keeping, whereby the records were disorganised, they were difficult to access and to extract data from. The outcome of the discharge was not recorded on any of the cards from all 5 OTPs, and so this had to be ascertained from the MUAC reading and the date. Registration number and referral source was not indicated on some cards, particularly in Kurmi and Godowoli. The data for the months of January and March were unavailable in Godowoli health centre, and only record was available for February as they had been taken for another assessment. In an unrelated case Kurmi health centre, only 4 records were found for the month of December.
2.1.1 ADMISSION DATA
Admissions to the OTPs were plotted over time in order to determine any abnormal changes and to investigate possible explanations. This was plotted against qualitative information from key

13
informants detailing a calendar of events including stock outs and a seasonal calendar. Data was extracted from electronic databases supplied by programme staff.
Figure 4: Admissions Over Time
A gradual increase in admissions is noted from March 2015 until September 2015, with small
fluctuations throughout. In January and February 2015, some health centres were closed due to
insecurity and increase in attacks in the area. This is reflected in the lower levels of admissions during
this period. There was an increase in admissions during the lean season, from when food stocks begin
to diminish (April) and when the main rains come and planting and harvesting begins (October). There
is some rain fall from May-June, and this starts in full from July-August. During this period,
communities give their full attention to planting crops, which explains the small decrease in
admissions. A sharp decrease in admissions can be seen from October, where the harvests are coming
in and as a result, SAM levels are expected to decrease. When triangulated with the qualitative data
collected in stage 1, the lower admissions in January and February can be linked to the insecurity that
was preventing communities from accessing services.
The red line, M3A3, is where medians of sets of three successive data points (M3) have been taken.
The results are then smoothed by taking the arithmetic means of sets of three successive smoothed
data points (A3). The more times you apply a moving average, the more smoothing is applied to the
data. This allows for a greater long term analysis of admissions. This way we can see variations over
the data period without the abnormal fluctuations distorting the data set.
0
100
200
300
400
500
600
700
Nu
mb
er o
f ad
mis
sio
n
Month
Total Admissions M3A3

14
2.1.2 SEASONAL CALENDAR
Figure 5; MUAC at admission
The admission criteria is a MUAC measurement of < 115mm. Carers of children that fall between
115mm and 125mm are given IYCF counselling. A number of admissions fall between 115mm and
125mm, indicating incorrect admission.
The median MUAC on admission is 112mm, this indicates that cases are admitted early in to the
programme. Due to the inconsistencies in admissions, and the high number of incorrect admissions,
it could be relevant to take the median of all cases at <115mm. There are also a high number of
admissions recorded at less than 100mm, indicating that case finding is less than effective and/or
knowledge of malnutrition is low so caregivers are unable to identify the condition before it develops
further. The result of both being that children are admitted later at a more developed stage of acute
malnutrition. The qualitative data provides further evidence that there is a lack of awareness of
Jan Feb Mar Apr May Jun Jul Aug Sep Oct Nov Dec
Rainy season I II III III
Temperature III III III
Malaria II II II III III
Measles II II II
RTI II II II II
Diarrheoa II II II II II III III III III II II II
Land clearing/preparation III III III
Planting III III
Harvesting III III
Food Availability II II I III III III
Food Prices II III III III III III
Diseases
Climate
Agriculture
≥125 123 121 119 117 115 113 111 109 107 105 103 101 99 97 95 93 91
0
20
40
60
80
100
120
MUAC (mm)
Nu
mb
er o
f ad
mis
sio
ns

15
malnutrition and of the CMAM programme, leading to a preference for traditional healers. Treatment
at the health facility is sought when the child’s condition deteriorates further. There is also a
preference for readings at 100mm and 105mm, indicating a further inconsistency in data recording.
2.1.3 DISCHARGE DATA
Figure 6; Discharges over time (all health centres – electronic dataset)
According to the electronic data, defaulting falls below the Sphere standard of 15%7. However, when
compared to the data collected by hand from records at health centres, there is a significant difference
in the two data sets, whereby defaulting is consistently above 15%. There are also fluctuations in
defaulting throughout the year, which is more pronounced in the data collected at the health facility.
Defaulting increased from February-April 2015, due to insecurity, as more attacks took place in Fika at
this time, and as a result, the beneficiaries restricted their movement. Defaulting also increased from
June to July, which can be attributed to the rains and planting season, and decreased from July to
August, at the peak of lean season. There are also high levels of non-respondents reported from
February to May, which as shown in figure 8 is only in Kurmi health centre.
7 Spherehandbook.org. (2016). The Sphere Handbook | Management of acute malnutrition and micronutrient deficiencies standard 1: Moderate acute malnutrition. [online] Available at: http://www.spherehandbook.org/en/management-of-acute-malnutrition-and-micronutrient-deficiencies-standard-1-moderate-acute-malnutrition/ [Accessed 13 May 2016].
0%
10%
20%
30%
40%
50%
60%
70%
80%
90%
100%
Cured Death Defaulter Non-response

16
Figure 7; Discharges over time (data cards checked at health facility)
Figure 8; Discharge outcomes per health centre (collected by hand at health facility)
When the electronic data was analysed, levels of defaulting were far lower than when data was
checked and verified directly from the 10 % sample of treatment cards across 12 months that were
0%
10%
20%
30%
40%
50%
60%
70%
80%
90%
100%
Cured Death Defaulter Non-response
0%
10%
20%
30%
40%
50%
60%
70%
80%
90%
100%
Kukar Gadu Kurmi MCPH Gadaka MPCH Fika MCH Godowoli MCH
Cured Death Defaulter Non-response

17
analysed. Godowoli health centre reported low defaulting levels which were verified through
collecting the data this way. Kurmi health centre presented defaulting levels at approximately 16%,
which is slightly above the Sphere standard of 15%. Through verification of the data at the health
centre, the sample presented a default rate of 22%. Moreover, there is a high non-response rate of
15%. It was noted that errors had been made in recording of data, and therefore it is suggested that
defaulters are being recorded as non-responders. It is also highlighted that many beneficiaries of
Kurmi health centre come from Gombe state, outside of Fika LGA and Yobe state, and therefore travel
back to their villages during planting season. Kukar Gadu has a very high default rate, as taken directly
from the records, this was correlated with qualitative data during stage 1.
Figure 9; Weeks in programme before discharge cured - all health centres
The median length of stay is 6 weeks, given the median MUAC on admission (112mm), 6 weeks is an
expected length of time for a child to stay in the programme, and is not considered to be excessively
long. A number of admissions fall above 8 weeks, which is considered a long length of stay. From the
qualitative data collection, we know that RUTF is both shared and sold, and so children are not getting
their full treatment course, and will take longer to recover.
1 2 3 4 5 6 7 8 9 10 11 12 13 14 15 16
0
10
20
30
40
50
60
Length of stay (weeks)
Co
un
t

18
2.1.4 DEFAULTER DATA
Figure 10; Defaulters over time
Tracking defaulting over time provides an insight of the impacts that seasonality has on default rates
of the CMAM programme. Figure 8 demonstrates the number of defaulters over the year, which is
largely reflective of the percentage discharge outcomes (figure 6). A small increase in defaulting is
seen from January to February 2015, where as previously stated, an increase in insecurity and violent
attacks prevented health services from being accessed. The rainy season begins in May, and starts in
full from July, during this period, a focus is placed on planting and harvesting, which is reflective of the
increase in defaulting during this period. Harvesting takes place in September and October, where a
spike in defaulting is seen. This could suggest that as the households are more food secure, they are
withdrawing their children from the programme.
0
5
10
15
20
25
30
35
40
45
50
Nu
mb
er o
f d
efau
lter
s
Month
Total Defaulters M3A3

19
Figure 11; MUAC at default
The median MUAC at default is 116mm. Although no longer SAM, these children are not considered
cured, as they are still MAM, and at risk of deteriorating back to SAM. This indicates a lack of
knowledge around treatment protocols, and admission and discharge criteria, whereby carers are
unaware of the continuation of treatment once the child’s MUAC is over 115mm. This is reflected in
the qualitative data, through which the lack of knowledge surrounding the programme is prevalent. A
large number of recordings are also seen at 120mm and 115mm, which indicates a possible
misreading, or a digit preference for readings at multiples of 5. There is some defaulter tracing in place,
through the CVs, however this is not established as part of the programme.
≥125 123 121 119 117 115 113 111 109 107 105 103 101 99 97 95 93 91
0
5
10
15
20
25
30
35
MUAC (mm)
Nu
mb
er o
f d
efau
lter
s

20
2.1.5 REFERRAL DATA
Figure 12; Referrals by source over period pie chart (%) (n=512)
There were challenges experienced in collecting referral by source as in 47% of the cards analysed,
this information was not provided. In 48% of cases, the referral came from community volunteers,
indicating active case finding within that proportion of referrals. Five percent of referrals, were either
self or peer referrals, indicating a good awareness of the programme within these populations.
2.1.6 DISTANCE TO TRAVEL
The distance of key villages from the health centres, and the time taken to travel to the health facility
by car (one way) was collected by asking key informants in these villages. If answers varied, an average
of responses was taken, and local knowledge of the team was used to verify. The data collected has
been presented graphically. Distances range from 2km to 46km, and time spent travelling varies from
10 minutes to over 2 hours by car, or 7 hours walking (one way), and so a 14 hour round trip.
48%
5%
47%Community healthvolunteers
Self or peer-to-peerreferrals
Not specified

21
Figure 13; Distance from villages to Health Facilities (one way)
2.1.7 QUANTITATIVE DATA COLLECTION CONCLUSION
The quality of data recording was largely poor, with inaccuracies and clear discrepancies noted in both
the electronic data and the data collected on OTP cards. The OTP cards were often missing important
information, such as referral source and the discharge outcome. Children were discharged as cured
when their MUAC reading was equal to or above 125mm, indicating adherence to discharge protocol.
However, it was noted that some cases had not been equal to or above 125mm for 2 consecutive visits
as per the protocol. Nevertheless, the data does provide a strong insight into the programme, and
when triangulated with qualitative data, consolidates the factors influencing programme coverage.
2.2 COLLECTION AND ANALYSIS OF QUALITATIVE DATA
Qualitative data was collected simultaneously to quantitative data. It is protocol to collect quantitative
data before qualitative data, as this is used to inform qualitative data collection. However, security
limitations lead to time constraints for stage 1, and thus data was collected concurrently. Care was
taken to ensure connectivity between the data, and time was allowed to return to collect more
qualitative data if necessary.
Action Against Hunger staff and enumerators were trained on interview techniques, and were able to
practice their skills under supervision of the facilitator in a training session at a health centre in Jigawa.
The remaining days of data collection were supervised by the Action Against Hunger team, due to
security restrictions imposed on the SQUEAC facilitator.
0
5
10
15
20
25
30
35
40
45
50
Distance (km) Time to travel with car (hours) Time to walk (hours)

22
During the training key informants were identified who were then targeted for interviews in the field.
These included mothers of children in the programme, women and men in the community, CVs and
key community figures such as, Imams, village leaders and traditional healers.
All health facilities were also visited, where mothers of children in the programme were interviewed,
as well as health centre staff and CVs at the health facility. Villages were selected randomly, with care
taken to visit a cross section of the district, including villages far from towns, and those closer.
Teams were given interview guides designed to collect information including knowledge and
awareness of malnutrition and the programme, the quality of services provided, and other issues
relating to coverage (example guide in annex A number of factors with both positive and negative
effects on coverage were identified.
In total 177 interviews were conducted, with various members of the community, health staff and
programme staff.
Table 2; Interview breakdown
Method Number
Key Informant Interview 81
Informal Interview 57
Focus Group Discussion 15
Informal Group Discussion 24
TOTAL 177
Information was collated by the team on a daily basis, by taking detailed notes throughout the interviews. The information on the different negative and positive factors that affect CMAM access and coverage – called the barriers and boosters of coverage – were recorded at the end of each day, and analysed thematically. Using the different sources of information as well as the different methods of data collection, the investigation was able to triangulate the different findings. Qualitative data collection was continued until no new information was found, thus assuring that information collected was exhaustive. It is usual practice to identify factors as either negative or positive, however, during stage 1, there were six significant factors that were appearing to contradict each other. Therefore, they have been included as both negative and positive factors, and reflected in the weighting by giving them relevant scores on both sides.

23
Table 3; Boosters and Barriers to the programme
Positive and
Negative Factors
Explanation Source Location Score for
booster
Score for
barrier
Awareness of
Malnutrition
Qualitative data collection demonstrated that
malnutrition was recognized in the communities, as
interviewees were able to identify ‘Tamowa’ or ‘Ciwon
Yinwa’ (Hausa for malnutrition) as the illness when
showed pictures of children suffering from malnutrition.
However, when further questioned to identify signs,
symptoms, causes and effects of malnutrition, the
understanding of malnutrition decreased significantly
among men as their understanding of malnutrition is
based on visible signs, which usually manifest when the
cases have deteriorated.
From the data analysis, signs and symptoms commonly
cited included ‘big head’, ‘swollen belly’, ‘loss of appetite’.
With causes including ‘poor personal hygiene’ or ‘women
were breastfeeding while pregnant’ (‘kunika’ in Hausa) or
‘women’s lack of breastmilk’ (‘baa nunu’ in Hausa). Lastly,
very few were able to identify the effects of malnutrition,
including some carers, health workers and CVs as ‘poor
growth’ and ‘death’.
Mothers of children
in the programme,
mothers of children
out of the
programme, men in
the community,
religious leaders,
health workers,
CVs, traditional
healers
Stage 2
questionnaires,
quantitative data
(referrals)
Dumbuluwa,
Ngalda, Mubi
Fusami, Dogo
Usaku, Dogo Abari,
Dogo Aba,
3 2
Awareness of
Programme
Communities were divided in their awareness of the
CMAM programme. Many carers of children (usually
Mothers of children
in the programme,
Kurmi, Dogon
Usaku, Godowoli,
3 2

24
female) had participated in sessions conducted by CVs on
IYCF and CMAM. Carers of children were able to identify
MUAC tapes, and explain the meaning of the different
colours on the MUAC tape. Some religious leaders had
also attended meetings with the health teams, and were
including health awareness and CMAM in Friday sermons,
encouraging men to care for their wives and children
through allowing them to access services.
On the whole however, there was poor levels of
awareness of CMAM programme with men in the
community, including fathers, and some leaders. Males
were not targeted for, and had not taken part in
sensitisation sessions in CMAM and IYCF, conducted by
CVs.
mothers of children
out of the
programme, men in
the community,
religious leaders,
health workers,
CVs.
Stage 2
questionnaires,
quantitative data
(referrals)
Garkuwa, Fika, Fika
Anze, Gadaka,
Maidwa, Zadawa,
Lewe, Mubi
Fusami, Garin Aba,
kukar gadu, Chana,
Maluri
Motivation of
CVs
CVs are unpaid, however they are provided with a food
and transport allowance for training and meetings. There
is dissatisfaction in the lack of financial support CVs
receive, as they stated that they cover their own transport
and food costs. There is also poor coordination of CVs by
partners, and so there is a lack of clarity in the active
numbers, their level of training and any follow up.
Consequently, there is little monitoring on the amount,
and quality of work done by CVs, in terms of community
Health workers,
CVs, community
members
Small study
Ngalda,
Dumbuluwa, Garin
Ari, Maluri, Kurmi,
Dogon Usaku,
Godowoli,
Garkuwa, Fika, Fika
Anze, Gadaka,
Maidwa, Zadawa,
Lewe, Mubi
2 3

25
sensitisation sessions, active case finding and MUAC
screening and referral.
Fusami, Garin Aba,
kukar gadu, Chana
Attitude of HWs The beneficiaries interviewed acknowledged that health
workers are polite and patient when attending to them. A
majority of the interviewees said the health workers give
them good advice on hygiene and IYCF practices.
Sometimes they help with the transport fare back home.
However, during the course of the interview some of the
carers complained of a poor attitude of the health
workers. This may be due to a lack of human resources
which has increased the work load.
Health workers,
beneficiaries in the
programme, stage 2
questionnaires
Observation
Ngalda,
Dumbuluwa, Garin
Ari, Maluri, Kurmi,
Dogon Usaku,
Godowoli,
Garkuwa, Fika, Fika
Anze, Gadaka,
Maidwa, Zadawa,
Lewe, Mubi
Fusami, Garin Aba,
kukar gadu, Chana
4 1
Stigmatization of
malnutrition in
the community
The qualitative interviews revealed that stigmatization is
mostly common in the rural areas like Lewe, Maiduwa,
Dogo ABari and some rural parts of Gadaka. Fathers often
feel shame of showing/talking about their malnourished
child in the community, as it is seen that they are unable
to provide for their family. In more urban areas, including
towns such as Fika, Gadaka town, Kurmi and Godowoli,
stigma is not an issue. Stigma was also not a common
barrier in the questionnaires from stage 2. Stigma may
result in late health seeking behaviour and/or late
Community leaders,
men in the
community, carers
of children in and
out of the
programme
Lewe, Maiduwa
and rural parts of
Gadaka
2 1

26
admission into the program, due to carers hiding cases of
malnutrition.
RUTF Stock out During the interview, it was revealed that two out of the
5 HFs visited have no experience of RUTF stock out,
especially Gadaka and Fika health facilities. However,
stock out of RUTF and other routine drugs have occurred
4-5 times in other HFs throughout the year. This was
triangulated through interviews with programme staff,
beneficiaries, CVs and health workers.
Health workers, programme staff, beneficiaries in the community
Gadaka, Fika, Kukar gadu, Kurmi and Godowoli, Fika Anze, Chana, Dogo Abari, Maidwa, Zadawa, Lewe, Mubi Fusami Garin Aba .
3 1
Table 4; Boosters to the programme
Booster Description Source Location Score
Positive perception of CMAM programme
There was a positive perception of the CMAM programme in the community. Community members acknowledged that it was free and effective in curing children from malnutrition. This leads to more of peer to peer referrals in the community, with 5% of recorded referrals through peer to peer.
Beneficiaries in the programme, community members, CVs, children
Gadaka, Kukar Gadu, Kurmi, Godowoli, Fika, Fika Anze, Chana
3
Conducive environment at the HF
Health facilities were observed to be clean, with handwashing facilities available. They were comfortable for beneficiaries and there were clear posters displayed within eye sight of visitors, depicting good IYCF practices.
CVs, health workers, beneficiaries of the programme
Gadaka and Fika 2

27
Good Community Cohesion
It was found in some villages there is a strong sense of community, whereby community members are supportive of each other. This leads to family, neighbours and friends looking after children whilst their mothers take the ill child to the health facility. Other instances include village heads assisting with transport costs to the health centre, for poorer members of the community.
Beneficiaries of the programme, CVs, community leaders, religious leaders
Ngalda, Dumbuluwa, Garin Ari, Maluri, Kurmi, Dogon Usaku, Godowoli, Garkuwa, Fika, Fika Anze, Gadaka, Maidwa, Zadawa Lewe, Mubi Fusami, Garin Aba, kukar gadu, Chana
3
Good sensitisation on CMAM programme
There is good sensitisation in the community, aided by CVs. The majority of the women (both in the programme and not in programme) acknowledged that CVs and HWs conduct health and nutrition education sessions in the community and at health facilities. A high awareness of health and nutrition amongst communities will increase treatment seeking behaviour and thus, coverage.
Beneficiaries of the programme, CVs, village leaders
Gadaka, Godowoli, Kukar gadu, Fika, Fika anze, Ngalda, Chana, Kurmi, Dumbuluwa, Maluri
2
Table 5; Barriers to the programme
Barrier Description Source Location Score
Long distances on poor
roads, exacerbated during
rainy season, combined
with the motorcycle ban,
It was noted, before data collection began, that the
geographical distribution of the health facilities offering
CMAM services across Fika, was focused in the west of the
Beneficiaries in the
programme,
beneficiaries out of
the programme,
community
Ngalda, Dumbuluwa,
Garin Ari, Maluri,
Dogo Usaku, Garkuwa,
Maidwa, Zadawa,
4

28
fuel scarcities and the high
cost of transportation
LGA, and in the East, there are no health facilities offering
CMAM.
During data collection, the majority of the interviewees cited
distance as a major challenge, some villages are up to 45km
away from the health centre, a journey taking 7 hours in one
direction. The banning of motorcycles makes poor roads
difficult to navigate by car, and in addition, fuel scarcity has
increased the cost of transport, making it unaffordable for
communities. Many interviewees stated that the rainy season
reduces accessibility, as there are rivers or waterlogs created,
blocking passageways or roads used during the rest of the
year.
leaders, CVs, health
workers
stage 2 additional
qualitative data
collection
Lewe, Mubi Fusami
and Garin Aba.
Selling of RUTF Despite efforts to prevent selling of RUTF, through enforcing
the return of empty sachets each week, RUTF is still being sold
in shops (40 naira for one or 3 for 100 naira). Incidences
whereby mothers take their child to the health centre to
collect rations, and then send the child back in different
clothing with a different mother to collect a double ration
were reported. The sold RUTF is used by women to flavour
soups.
Health workers,
children, mothers,
female community
members
Observation
Gadaka, Kukar gadu,
Dumbuluwa, Ngalda,
Fika
3
Misuse of RUTF Despite understanding that RUTF is for the SAM child only, it
was gathered from mothers with children in the programme
that sharing of RUTF still takes place within the household and
with neighbours. This was further triangulated through focus
groups with children.
Health workers,
carers of
beneficiaries,
children, CVs
Gadaka, Kurmi,
Ngalda, Dumbuluwa,
Fika, Garin Ari, Maluri,
Dogo Usaku, Garkuwa,
Kukar gadu
3

29
Long waiting time at the
health facility
Long waiting times at health facilities were reported, due to
staff shortages. Carers could be expected to wait for up to 4
hours. In some cases. Long waiting times lead to poor
perceptions of the programme, and can therefore lead to an
increase in defaulting and reduction in peer to peer referrals.
Beneficiaries in the
programme, CVs,
programme staff
Observation, stage
2 additional
qualitative data
collection
Gadaka, Kurmi,
Ngalda, Dumbuluwa,
Fika, Garin Ari, Maluri,
Dogo Usaku, Garkuwa,
Kukar gadu
4
Rejection at OTP site It was common for carers who have been referred to the HF
by the CVs to be rejected at the OTP site, with little
explanation. This is most likely due to misunderstanding of
the admission criteria or incorrect MUAC
measurement/readings by the CVs. This can lead to poor
perceptions of the programme, and a lack of attendance in
the future, leaving cases uncovered in the community.
Beneficaries in the
programme,
mothers in the
community, CVs
Ngalda, Dumbuluwa,
Garin Ari, Maluri,
Kurmi, Dogon Usaku,
Godowoli, Garkuwa,
Mubi Fusami, and
Dogo Abari
2
Insecurity Insecurity was also stated as a major barrier to access and
coverage. This has previously led to closure of HF in the past
and relocation of beneficiaries which also result in high level
of defaulting. This is also reflective in the quantitative data
with high defaulter rate recorded in the month of February
following series of attacks that happened in Fika in January,
2015.
Health workers,
beneficiaries in the
programme,
beneficiaries out of
the programme,
community
leaders, religious
leaders, CVs
Dumbuluwa, Garin Ari,
Maluri, Kurmi, Dogon
Usaku, Ngalda,
Garkuwa, Mubi
Fusami, and Dogo
Abari
4

30
stage 2 additional
qualitative data
collection
Carers of children have
poor decision making
power and men have little
involvement in treatment
The qualitative data collected shows that on a household
level, there is lack of support from a majority of the husbands.
The majority of the men are the decision makers in the family,
they restrict movement of mothers by not giving them money
for transportation or not allowing them to leave the home. As
such, the carers have very little power over decisions to
attend the HF, and often will sell their own possessions to
raise the finances to travel or to provide buy food or water
whilst at the HF, thus leading to many unnecessary and late
admissions.
Carers of children
in the programme,
carers of children
out of the
programme,
community
members, religious
leaders,
community leaders
Stage 2
questionnaires
Ngalda, Dumbuluwa,
Garin Ari, Maluri,
Kurmi, Dogon Usaku,
Godowoli, Garkuwa,
Fika, Fika Anze,
Gadaka, Maidwa,
Zadawa, Lewe, Mubi
Fusami, Garin Aba,
kukar gadu, Chana
4
Preference of traditional
medicine before going to
HF
The majority reported of carers of children reported that they
go to traditional healers, or use herbs to treat malnutrition
before attending the health facility. They perceive this as
cheaper than going to the health facility as they don’t have to
pay for transport costs, they also spend less time away from
home as traditional healers are more local. Some caregivers
paid as much as $40 for a course of traditional medicine prior
to attending the HF. Treatment includes wounding the child’s
mouth or back with a sharp object, and administering herbs.
When this fails, the child will be taken to the health facility, as
a last resort. This is reflected in the low MUAC on admission.
Carers of children
in the programme,
carers of children
out of the
programme,
community
members,
traditional healers,
CVs
Ngalda, Dumbuluwa,
Garin Ari, Maluri,
Kurmi, Dogon Usaku,
Garkuwa, Maidwa,
Zadawa, Lewe, Mubi
Fusami, Garin Aba,
and Chana
4

31
2.3 ADDITIONAL INFORMATION ON COMMUNITY VOLUNTEERS
In order to gain a more in depth understanding of the activity levels and motivation of community volunteers (CVs) a series of structured interviews were conducted. A copy of this interview guide can be found in appendix 2. Each interview aimed to collate the following information:
• The level of training received (which was verified by asking the methodology behind
screening for malnutrition and through observation)
• Activity (How many hours per week, how many children screened)
• Support (The amount of supervision received and if this is adequate)
• Motivation (Positive and negative experience of being a CV)
Eighteen CVs were interviewed, out of approximately 500 in total (IYCF & CMAM), in 5 different
locations across Fika LGA (Godowoli, Janga ward, Fika, Gadaka and Garu). It is recognised that
interviewing 18 CVs is insufficient to draw significant conclusions from the data collected, and only
introducing CVs about their own motivation will introduce bias. The CVs interviewed were spread
across various locations within the LGA, however it is acknowledged that they were usually based near
a health facility, and so this may reflect the levels of training and supervision they receive. However,
the information collected in this exercise is useful for monitoring motivation and performance of CVs,
and also for future programming and activities.
Training:
All CVs had attended at least 2 training sessions, in January and April 2016, each lasting for 2 days
covering CMAM and IYCF. The training covered understanding of malnutrition, causes of malnutrition,
management of malnutrition, the target population, length of the treatment, case finding, MUAC
measurements and referrals, sensitising communities, hygiene (including hand washing) and
administering RUTF.
Activity:
Activity levels within the CVs varied, 4 CVs work for 2-4 hours per week, and 30-60 children screened
per CV each week. Two CVs set up monthly screenings, whereby 40-60 children are screened, one CV
operates through house to house screening, the other sets up a location where children are measured.
Support:
Levels of supervision varies between CVs, with one CV receiving weekly supervision sessions. Others
receive monthly supervision sessions, and find this to be adequate and helpful. One CV stated that
this monthly supervision is inadequate and poor.
Motivation:
All CVs interviewed enjoy their role, through helping others in their community, and also through the
recognition they receive from their community. All CVs stated that they would like to receive more

32
supervision and training, and also the opportunity to engage with other CVs and exchange experiences
to further their learning.
2.4 ADDITIONAL INFORMATION ON THE COMMUNITY PROFILE
The roles and relationships of community actors were analysed in order to provide a clear picture of the communities of Fika LGA. The aim of conducting this exercise was to demonstrate the influence of the key figures, and examine the ways in which they can ultimately impact coverage of the CMAM programme, through utilising this influence for community mobilisation activities. Using the local knowledge of the SQUEAC team, and data from the qualitative data collection to triangulate, the various key figures and groups listed were identified. See appendix 3 for the full map diagram demonstrating the relationships of these actors.
Primary Health Care Coordinator (PHCC) and MCH (Maternal and Child Health in charge) – Based at
the health facility, these are part of the health care system of the community.
Community Leader - The roles of the community leader in the community are to settle differences
and to ensure peaceful coexistence among community members. They mobilise and sensitise the
community on developmental issues and programmes. They also represent them in different forums
and act as an intermediary between government, partners and the community. Community leaders
have links with the health facility which can be utilised for community mobilisation.
Religious Leader - They provide spiritual guidance to the people in the community through preaching
and sharing messages and information. They are highly respected and they have direct contact with
the community members, making them an essential component of mobilisation activities.
Women’s groups – There are three forms of women’s group in the community; Action Against Hunger
Mother to Mother Support Groups, religious based (Federation of Muslim Women Association of
Nigeria, FOMWAN) and Women’s Fellowship association. There are approximately 100 ACF groups in
Fika LGA, where topics discussed include IYCF practices, they have also formed links with the Union of
Road Transport Workers, whereby they have committed to provide reduced, or free transport to
carers attending OTP services, one free service per week is currently operational in Degubi village to
Kukar Gadu health facility. There is little data available on the activity levels of the women’s groups.
The FOMWAN and Women’s Fellowship association have little contact with the health facility,
however ACF has worked with them on CMAM sensitisation and IYCF. These links need to be
strengthened however to improve screening and awareness in the communities.
Union of Teachers/Community Based Organisations/Youth Association – Currently, none of these
groups have links with health facilities, or have undergone any sensitisation or awareness activities,
however, all groups have contact with the community, making them ideal networks to tap into to
increase screening and mobilisation.
Traditional Healers Association – Currently there are no formal links between the Traditional Healers
Association and the health facilities or ACF partners, these are links that can be utilised to sensitise
traditional healers on malnutrition and CMAM, and increase screening and referral of cases.

33
2.5 CONCEPT MAP
A concept map indicating negative and positive effects on coverage, and their relationship with each
other was constructed. The concept map highlights in particular, the barriers of insecurity, distance
and poor sensitisation and awareness in the community, leading to lack of adherence to CMAM
protocol. The positive factors demonstrate the contradictory nature of the qualitative data, with good
awareness and knowledge of the programme, and positive perception of the programme highlighted.
Figure 14; Concept map of coverage

34
3. STAGE 2 - DEVELOPING THE
HYPOTHESIS In order to validate findings in Stage 1, and provide a greater insight into programme activities, a
hypothesis was constructed and tested. Stage 1 data collection identified several factors that act as
boosters and barriers to coverage.
3.1 JUSTIFICATION
The team identified the barrier of distance, and barriers that exacerbated distance as having the
greatest impact on coverage. Distance was chosen as an important factor as informants frequently
cited this barrier as a reason for not going to the clinic. Barriers associated with distance were also
important, for example, the cost of travelling to the clinic, the ban on motorcycles in the state
promoting a heavier reliance on cars and trucks and insecurity of the more remote villages.
Quantitative data collected in villages demonstrated the distances that some beneficiaries were
required to travel, in some villages, the distance to the health facility is over 40km.
3.2 HYPOTHESES
1) Villages closer to health centres will have high coverage
2) Villages far away from health centres will have low coverage
In order to test this hypothesis, villages that are close to health facilities and villages that are far away
from facilities were purposefully sampled, based on existing information selected in stage 1. Two
methodologies were used; small area survey and small study.
3.3 SAMPLING
Sampling was done in 2 stages. First the sampling of villages and second the sampling of SAM in each
village. Villages were selected based on their distance from OTP sites, 4 were deemed to be near to
OTP sites (less than 3 hours walk) and 4 were deemed to be far from OTP sites (more than 3 hours
walk).
3.4 METHODOLOGY
The team sampled the eight villages over the course of two days. In each village, active and adaptive8
case finding was used. All team members were experienced in MUAC and oedema screening, however
8 Active and adaptive case-finding uses information obtained on the ground in order to find all SAM cases in a community. Rather than going door-to-door to screen all children 6-59 months, children that are suspected SAM cases are found and screened. At the outset case definition is identified (6-59 months, oedema, MUAC <115mm and children in the programme) and local definitions of malnutrition are highlighted, being careful also to identify derogatory terms associated with the condition, to ensure they are avoided. In each community key informants are identified at the beginning and used to identify where suspected malnourished cases are (using local terms) and to ensure no malnourished child is over-looked.

35
they were re-trained in these diagnostic measurements and also trained in how to ensure all cases are
found. Teams were also given photographs of children suffering from malnutrition to aid case finding,
and packets of RUTF to facilitate identification of recovering cases.
The case-definitions in Table 6 were used.
Table 6; Case definitions of SAM cases
SAM child Bilateral pitting oedema or MUAC <115mm
SAM recovering case* MUAC >125mm but still under-going OTP treatment
*Since the discharge criteria for OTP is 2 weeks MUAC ≥125mm some non-SAM cases may still be
receiving OTP treatment. This is referred to as a recovering cases.
3.5 RESULTS
Table 7 Results of small area survey
Village Near/Far SAM covered
SAM uncovered
SAM recovering
TOTAL SAM cases
Gadaka Near 8 1 4 13
Godowoli Near 23 0 5 28
Chana Near 11 7 1 19
Kurmi Near 8 1 9 18
Mubi Fusami Far 4 14 7 25
Dumbuluwa Far 9 22 5 36
Maluri Far 15 33 1 49
Lewa Far 0 0 3 3
3.6 ANALYSIS
For the analysis of the results simplified lot quality assurance sampling (LQAS) was done in order to
obtain a classification of coverage, and to determine whether the hypotheses were confirmed or
denied. The SPHERE standard for coverage of CMAM programmes in rural of 50% was used.
The following formula was used to determine the decision rule for the hypothesis:
𝒅 = ⌊𝒏 ×𝒑
𝟏𝟎𝟎⌋

36
d = decision rule n= number of cases found p= coverage standard defined Table 8; Decision rulings for stage 2
Village Decision Rule Conclusion
Close (Gadaka, Godowoli, Chana, Kurmi)
39 Hypothesis validated
Far (Mubi Fusami, Dumbuluwa, Maluri, Lewa)
56 Hypothesis validated
As expected, the results presented high coverage in villages close to the health facilities and three out of four villages far from health facilities presented low coverage. In Lewa, which was expected to have low coverage, there were no covered or uncovered SAM cases present, only 3 recovering cases, however this does not affect the classification of the hypothesis.
3.7 QUESTIONNAIRE RESULTS
In order to enrich the understanding of why cases were in, and were not in the programme short
questionnaires were conducted with carers of the covered and uncovered SAM children. Out of 78
carers of SAM children not in the programme, 56 were asked. These questionnaire templates can be
found in appendix 5 and 6.
3.8 UNCOVERED CASES
When carers were asked if their child was ill, 96% (n=54) of respondents were aware, and 4% (n=2) were unaware. However, when asked about the cause of this illness, there was a lack of understanding in this regard. Almost 40% of respondents (n=26) were unaware of the cause, a third attributed the illness to malnutrition, and others attributed the illness to other diseases such as malaria and diarrhoea (see figure 14). This triangulates with the qualitative data, where in some communities, typically the more rural, awareness of malnutrition was found to be low.

37
Figure 15; Knowledge and awareness of malnutrition
Out of the respondents interviewed, 84% were aware of the programme, 16% were not. However, when further questioned about their knowledge of the CMAM service, a large majority of the respondents were unable to provide details, indicating that knowledge of how the programme functions is lacking even though they are aware that it exists. Those who did provide answers stated that they knew it was a treatment for malnutrition, it has a good reputation, and one respondent mentioned a MUAC tape (see figure 15). Figure 16; Awareness of CMAM services
Treatment pathways varied between respondents, only 8% (n=6) of respondents had not sought treatment. The preferred treatments were either with medicine bought at a pharmacy (n=21) or a traditional healer (n=20), with a preference with traditional herbs and roots also prominent (n=18).
0 5 10 15 20 25 30
Spiritual
Weight Loss
Diarrhoea
Others
Malaria
Malnutrition
Unaware
0 5 10 15 20 25 30 35 40
MUAC
Good reputation
Treatment for malnutrition
Unable to provide answer
38
This further highlights the preference for traditional medicine in communities, especially when the distance is far to travel to a health facility. Figure 17; Alternative treatment pathways of malnutrition
Respondents were asked to list all of the barriers that impact their access to the health centres. Lack of transport and distance were the most common barriers. Being too busy was another barrier listed, which could be due to the time it takes to travel to reach the facility. Interestingly, despite the treatment being free, lack of availability of financial resources is a barrier affecting carers, this is likely to be related to the cost of transport to the health facility. Preference for traditional treatment featured once, despite being commonly seen during stage 1, and many of the respondents seeking alternative treatment methods. This suggests that the preference for traditional treatment is not greater than the preference for treatment at the health facility, however distance and the lack of transport act as drivers to it, as traditional healers exist in all villages.
0 5 10 15 20 25
Medicinal product bought at market
No treatment
Prayer
Medicinal herbs/roots
Consultation with traditional healer
Medicinal product bought at pharmacy

39
Figure 18; Barriers to Access
Others include; stigma, preference for traditional treatment, and the carer being ill.
3.9 COVERED CASES
Out of 78 covered cases found during the small area survey, 71 questionnaires were conducted, in order to determine how the case was admitted into the programme. The most prominent factors facilitating coverage are that ‘knowledge that the service is free’, followed by ‘knowledge that RUTF is available’. This indicates a positive perception of the programme, as previously found in the qualitative data collection in stage 1. Support of husbands, family members and community leaders are also boosters that featured heavily, indicating that sensitisation activities are impacting coverage. This triangulates with stage 1 data collection, as in some communities, where sensitisation activities have been focused at all community members, there is more knowledge and understanding of malnutrition and the programme amongst the whole community, and so community support is also increased. Distance was also highlighted, indicating that those who live close to health facilities do not experience distance as a barrier. The full set of boosters are depicted in figure 19.
0 5 10 15 20 25 30 35 40
Previous Rejection
Rejection of known child
Lack of conviction that programme can help child
Non availability of company for journey
Do not know
Fear of hospital stay
No one to look after other children
Husband/family refusal
Non availability of financial resources for treatment
Insecurity
Too busy
Too far
No transport

40
Figure 19; Factors contributing to programme admission for coverage cases found during the small area survey (n=71)
Others include: the availability of transport, they know other children that have been cured, the programme staff are friendly and patient, and they have company for the journey.
4.0 STAGE 2 CONCLUSION
In addition to the small area survey, it was decided to conduct further research into the barriers of
distance, lack of money for travel, insecurity and the motorcycle ban. A small questionnaire was
devised by the team to address these factors, this can be found in appendix 4. The data collected from
this is reflected in tables 4, 5 and 6 indicated.
Stage 2 concluded that there are areas of high and low coverage within Fika LGA due to the impact of distance to the health facility and availability of transport. The small area survey results, including the questionnaire responses, demonstrate that coverage is likely to be significantly different in villages close compared to villages far from health facilities. We would therefore say that coverage is patchy. In such situations, obtaining a unique coverage estimation is unadvisable, since it is unlikely to be representative of all areas. It was therefore decided by the SQUEAC team, that we would not proceed to stage 3. Time constraints and the limitations with the facilitator being unable to directly supervise the team, also influenced the decision of not continuing with conducting separate wide area surveys for areas that were considered to be high coverage, and areas considered to be low.
0 5 10 15 20 25 30
Financial resources for transport
Support and encouragement of a CHW
Programme staff are friendly and patient
Accessibility (no seasonal barriers)
Support and encouragement of parents SAM children
Program appreciated by the community
Efficiency of treatment (quick and visible results)
Disease diagnosed by health worker
Referral by traditional healer
Others
Community leaders supportive and encouraging
Support and encouragement of husband
Distance not far
Support and encouragement of family member or neighbors
Knowledge that RUTF is available
Knowledge that service is free

41
4. CONCLUSION Coverage was shown to be patchy across Fika LGA, which was unsurprising given the sparse
geographical distribution of the health facilities. In the furthest villages, communities are expected to
travel up to 45km to the closest health facility that offers CMAM services, and thus, the coverage in
these areas is lower. In addition, people in villages further away have less awareness of malnutrition
and the CMAM programme as a result of fewer sensitisation and mobilisation activities. These findings
indicate some key areas for programme reform that would improve coverage
The barrier of distance has been exacerbated by the ban on motorcycles and the increase in fuel prices
currently affecting Nigeria. Whilst steps have been taken by partners to include the Union of Road
Transport Workers to offer free or reduced transport to beneficiaries, this is extremely localised and
not available in all villages. Steps need to be taken to make this available to more beneficiaries, to
provide alternative options, including outreach clinics, or expand to more health facilities that are
closer to the areas far from facilities. As security becomes less of an issue, it should be easier to
conduct these changes.
There are two types of CV operating in Fika; those who are trained in CMAM and others in IYCF. They
receive monthly supervision, and training each year. Despite these systems being in place, there is still
a lack of clarity and the exact number of CVs, the location of them and their activity levels. In some
communities, they are well regarded, with the villagers supporting them with extra foodstuffs. In other
places, usually in the areas further from the health facilities, they are unmotivated, with poor
knowledge and little appreciation in the community. Due to this, the CV system requires significant
improvements, there is a need to identify respected and motivated individuals, who are chosen by the
communities in which they work. Incentives need to be increased, through more supervision,
knowledge sharing and rewards (not necessarily monetary) for hard work. A suggestion is to group
CVs together biannually, to reward them for their dedication, and to encourage knowledge and
experience sharing amongst them.
Given that men are the main decision makers both within the community and family units, they have
had little involvement and exposure to the CMAM programme. The few men who had awareness of
malnutrition and of the programme had been targeted at Friday mosque, whereby the Imam included
information in the sermon. This is a lesson to learn from as involving of men is crucial to improving
coverage. Activities could include strengthening partnerships between CVs and Imams across Fika (and
beyond), providing counselling sessions and encouraging them to spread the message during Friday
sermon, involving all community leaders across LGAs, conducting more research into men’s groups (if
there are any) and using this opportunity to conduct sessions in sensitisation.
Stage 1 data collection demonstrated that there are strong community structures already in place,
which are ideal to be targeted for improved community mobilisation activities. There are numerous
community groups who should all be provided with information on malnutrition and the CMAM
programme, they should also be invited for input into the CMAM programme, to increase ownership
and awareness. Alongside this, there is strong community cohesion, whereby family and neighbours

42
are supportive of each other, often helping financially or through means of child care, when a mother
is taking her child to the health centre.
Finally, the programme reporting system needs to improve. Poor record keeping is evident at nearly
all health centres. There is chronic misreporting of cured and defaulter cases, with the discharge
outcome not indicated on admission/discharge cards. This is reflected in the poor quality and
inaccuracies of the electronic datasets. Registration number and Referral source were not also clearly
indicated. Only data from Fika MCH was well arranged and organized, Kurmi, Godowoli and Kukar
gadu was poorly recorded, organised and stored. In general, data recording and storage was poor.
Whilst not directly impacting coverage among beneficiaries, incorrect recording of cured, default and
death rates will give an incorrect impression of the programme, and therefore limiting the ability of
the partners to take remedial action. As a result, data collection processes should be systematised to
avoid misplacing records and ensure accuracy in reporting. Health workers can benefit from engaging
CVs that are capable, into reporting duties, and both health facility staff and CVs would benefit from
refresher training in reporting. Without accurate reporting programme managers are unable to have
a clear view of the programme performance and therefore when to introduce reformative action.
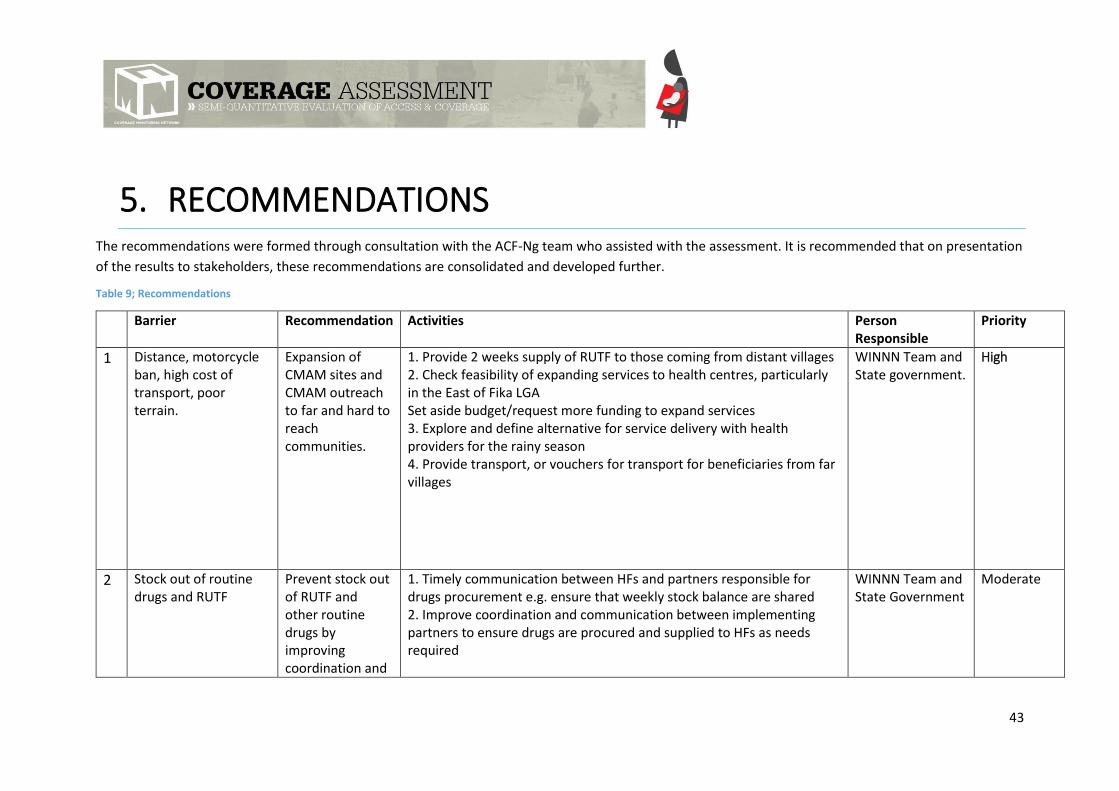
43
5. RECOMMENDATIONS The recommendations were formed through consultation with the ACF-Ng team who assisted with the assessment. It is recommended that on presentation
of the results to stakeholders, these recommendations are consolidated and developed further.
Table 9; Recommendations
Barrier Recommendation Activities Person Responsible
Priority
1 Distance, motorcycle ban, high cost of transport, poor terrain.
Expansion of CMAM sites and CMAM outreach to far and hard to reach communities.
1. Provide 2 weeks supply of RUTF to those coming from distant villages 2. Check feasibility of expanding services to health centres, particularly in the East of Fika LGA Set aside budget/request more funding to expand services 3. Explore and define alternative for service delivery with health providers for the rainy season 4. Provide transport, or vouchers for transport for beneficiaries from far villages
WINNN Team and State government.
High
2 Stock out of routine drugs and RUTF
Prevent stock out of RUTF and other routine drugs by improving coordination and
1. Timely communication between HFs and partners responsible for drugs procurement e.g. ensure that weekly stock balance are shared 2. Improve coordination and communication between implementing partners to ensure drugs are procured and supplied to HFs as needs required
WINNN Team and State Government
Moderate

44
communication with health facilities
3. Further explore and define mechanism to work with, and strengthen the local supply chain
3 Selling and Sharing of RUTF
Discourage sharing and selling of RUTF
1. Strengthen sensitisation in the community that RUTF is not a food but a medicine, meant only for the malnourished children 2. Sensitisation to include counselling sessions both from CVs and HWs, aimed at all community members and also high level government officials 3. Involve NAFDAC (National Agency for Food and Drug Administration and Control) in monitoring of RUTF in the market 4. Work with market vendors in particular, on the importance of not selling RUTF
WINNN Team and State Government
High
4 Poor awareness and knowledge of malnutrition
Improve sensitization, mobilisation and awareness of malnutrition in the community
1. Collaborate with CBOs and other community groups to improve awareness in the community through counselling sessions 2. Implement mother’s MUAC approach 3. Involvement of media in awareness creation through radio discussion, phone-in programme, jingles and airing of community drama
WINNN Team and State Government
High
5 Poor awareness of the CMAM programme and protocols.
Improve sensitization and awareness of CMAM programme protocols
1. Provide top up training to HWs on CMAM protocols, emphasising importance of adhering to the protocol 2. HWs to offer counselling sessions to mothers at the HF and CVs to offer sessions in the community about admission criteria and the programme, answering any questions and queries that may arise
WINNN Team and State Government
High
6 Poor environment and organisation at health facility, leading to long waiting time.
Provision of conducive environment at the HF (adequate seating, shelter,
1. Consult with and deliver training to HWs outlining organisational changes to be made at HFs 2. Sensitize community and advocate to government for provision of shelter, water supply, toilet facilities, and adequate sitting
State Government and WINNN team
High

45
water supply and availability of toilet facilities)
3. Where workload is high, the number of clinic days should be increased in order to reduce waiting times for patients and workload for the health workers
7 Inadequate number of health workers within teams also contributing to long waiting time
Increase the number of health workers
1. Work with YSPHMB to increase adequate qualified and dedicated health workers, which in turn will reduce the HW’s workload and waiting times for the patient
State government Moderate
8 Preference for traditional herbalists/healers
Develop synergy with traditional healers on sensitisation, awareness and referral of SAM cases.
1. Partnering with traditional healers/herbalists to encourage them to in identifying malnutrition and making appropriate referrals 2. Provide MUAC tapes to traditional healers and train them in how to use them
WINNN Team, CVs, HWs
High
9 Carers of children have little decision making power and a men have little involvement in treatment
Aim sensitisation activities at male members of the community, particularly husbands
1. Hold meetings with key community figures, such as religious leaders and village leaders 2. Encourage religious leaders to include messaging on malnutrition and CMAM in their weekly sermons, including follow-up of absentees/defaulters in liaising with the health facility 3. Develop and provide tailored sensitisation sessions aimed at men
WINNN Team, LTAs, CVs, religious leaders, community members
High
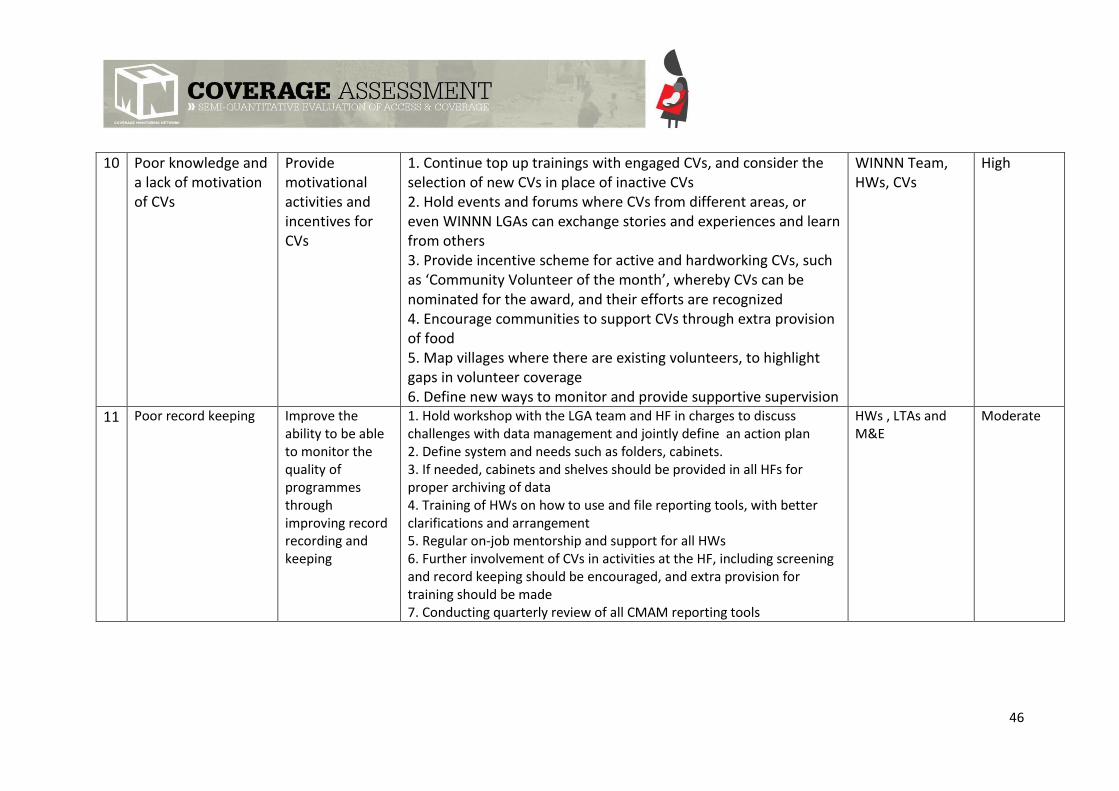
46
10 Poor knowledge and a lack of motivation of CVs
Provide motivational activities and incentives for CVs
1. Continue top up trainings with engaged CVs, and consider the selection of new CVs in place of inactive CVs 2. Hold events and forums where CVs from different areas, or even WINNN LGAs can exchange stories and experiences and learn from others 3. Provide incentive scheme for active and hardworking CVs, such as ‘Community Volunteer of the month’, whereby CVs can be nominated for the award, and their efforts are recognized
4. Encourage communities to support CVs through extra provision of food 5. Map villages where there are existing volunteers, to highlight gaps in volunteer coverage 6. Define new ways to monitor and provide supportive supervision
WINNN Team, HWs, CVs
High
11 Poor record keeping Improve the ability to be able to monitor the quality of programmes through improving record recording and keeping
1. Hold workshop with the LGA team and HF in charges to discuss challenges with data management and jointly define an action plan 2. Define system and needs such as folders, cabinets. 3. If needed, cabinets and shelves should be provided in all HFs for proper archiving of data 4. Training of HWs on how to use and file reporting tools, with better clarifications and arrangement 5. Regular on-job mentorship and support for all HWs 6. Further involvement of CVs in activities at the HF, including screening and record keeping should be encouraged, and extra provision for training should be made 7. Conducting quarterly review of all CMAM reporting tools
HWs , LTAs and M&E
Moderate

47
APPENDIX 1; SQUEAC SURVEY TEAM
Name Designation Email Address
Idris Abdulsalam State Technical Advisor nutsta-da.ng@acf-
international.org
Akeem Odewale M&E Technical Advisor
(WINNN programme)
mae-da.ng@acf-
international.org
Shuaibu Aliyu Fika LGA WINNN Focal Point nutlga2-da.ng@acf-
international.org
Abdullahi Alhaji Modu Enumerator [email protected]
Binta Ali Makinta Enumerator [email protected]
Micheal Afodiya Enumerator [email protected]
Magaret Victor Enumerator [email protected]
Muhammed Alhaji Gubo Enumerator [email protected]
Iliya Mathew Enumerator [email protected]
Agboola Tolulope Enumerator [email protected]
Muhammad Abdulkadir Talba Enumerator [email protected]

48
APPENDIX 2; INTERVIEW GUIDE: CARERS OF MALNOURISHED CHILDREN (BENEFICIARIES OF CMAM PROGRAMME)
AWARENESS OF CMAM PROGRAMME
How did you hear about CMAM programme?
What did you hear?
Do you hear about CMAM programme often? How often?
Why did you decide to come to the health
centre? If child’s illness is mentioned:
When did you notice that your child is ill?
What symptoms /problems did you notice?
Was your child measured at home?
If yes:
Who measured him? How? What was said?
After what time did you decide to come to the health
centre? If more than two weeks:
Why did you wait so long?
Since when have you been in the programme?
Have you noticed a difference in the condition of your child?
What difference?
Decision-making
Did someone encourage you to go to the health
centre? If yes:
Who encouraged you?
Does this person encourage you to continue the treatment? Why?
Does this person accompany you to the health
centre? If not, would you like to be accompanied? Why?
AWARENESS OF MALNUTRITION
Do you know causes of your child’s condition?
If yes, what are they?
Do you know effects of this condition?
If yes, what are they?
Do you think that it’s a disease like any other? Why? Why not?

49
How did you try to treat this condition before going to the health
centre?
Which words do people use to describe it?
Does the health centre staff use the same
words? If not, what words do they use?
Did the health centre staff explain your child’s condition?
If yes:
What did they tell you?
QUALITY OF CMAM PROGRAMME
How long do you have to wait before being served? Why?
What do you do while waiting? Is it comfortable?
How much time do you spend with the nurse during the
consultation?
Is he/she kind? Why? Why not?
What does the health centre staff give you to treat the disease?
Did they explain the reason for this treatment?
Have you always received a complete ration?
If not, why not? How many times?
Did the health centre staff explain how to use
it? If yes, do you observe their instructions?
Does your child like to eat it?
Does/did he/she display any symptoms after eating
it? If yes, what symptoms?
Do you continue the treatment?
Have you tasted the product?
Do you share it with other family members? Why?
What is an approximate duration of the treatment?
Will you continue the treatment until your child fully recovers?
Why? Why not?
APPRECIATION OF CMAM PROGRAMME
What do you think of CMAM programme (+/-)? Why?
Will you refer other children in your community? Why? Why not?
If positive answer given:
Have you already referred other children in your community?
When? Why?
What would you change to improve the quality of the
programme?
Is it easy to get to the health centre? If not, what makes it difficult?
What means of transport do you use?

50
RK
What is the price of the journey there and back?
How long does it take you?
Who takes care of your children during your absence?
COVERAGE / REJECTIONS / DEFAULTING
Do you know other children in your community who need the
treatment?
If yes, why aren’t they in the programme?
Are these children or their parents stigmatised by any
community members? Why?
Do you know about any children being rejected? Why?
Do you know about any children abandoning the treatment?
Why?
How could we motivate them to return?

APPENDIX 3; CV SMALL STUDY INTERVIEW GUIDE
Record the name of the village/ward.
How many hours a week do you go out and screen for SAM and MAM cases?
What is your process/system (get them to detailed a typical day)
How many kids do you screen per week?
What indicators do you use to find a SAM child?
If you find a SAM, what are the next steps?
What training have you received?
When was the training?
What did it consist of?
How long was the training for?
When was the last time you saw a supervisor?
What did they do?
How did you work change?
When will the next time be?
Do you feel like this is enough support?
What do you like about being a CV?
How would you improve your experience of being a CV?
APPENDIX 4; COMMUNITY MAP
The green arrows indicate relationships between community actors, and the orange arrows indicate potential communication channels that could be utilised, or utilised further for activities relating to CMAM awareness, screening and related activities.

APPENDIX 5; DISTANCE SMALL STUDY INTERVIEW GUIDE
1) How far is the closest health facility?
a. Detail how far in kms/time
2) Does this distance prevent you from accessing the health facility?
3) Is this a health facility that you are happy to use?
a. Why if yes, and why if no

4) How do you get to it?
a. Probe for more detail:
i. If they take a car, how much? Can they afford it?
5) Which other factors prevent you from/encourage you to access health facilities?
(If respondent finds this difficult) you can prompt, terrain/insecurity/financial
support/husband/child care
6) Has the motorbike ban affected you?
a. How?
If the motorbike was available (not banned) would you use this form of transport
instead of car/walking?
Does this prevent access to health services?
7) Do you feel secure in your community?
8) Do you feel secure on your way to the health facility?
a. Have you ever experienced insecurity whilst going to the health facility?
b. Does this prevent you from accessing health care?
9) Which health services do you use instead? (chemists/markets/herbalists)
APPENDIX 6; QUESTIONNAIRE FOR CARERS OF CHILDREN ENROLLED IN THE CMAM
PROGRAMME
Health district: Health facility:
Village:
Ethnic group:
Team:
Date:
2015
1. Is this the first time that your child has been enrolled in CMAM programme?
☐ Yes Q5 ☐ No Q2
2. How many times has your child been enrolled in CMAM programme?
☐ 1 ☐ 2 ☐ 3 ☐>3
3. Why has your child returned to the programme?

☐ a. Child has discontinued the programme and returned. a1. Why?
☐ b. Child was cured and relapsed. b1. Why?
4. Do you have other children enrolled in CMAM programme?
☐ Yes a1. How many? ☐ 1 ☐ 2 ☐ 3
☐ No
5. Why did you decide to enrol your child in CMAM programme?
☐ a. Recognition of the disease ☐ b. Disease diagnosed by health personnel
☐ c. Failed traditional treatment ☐ d. Referral by traditional healer
☐ e. Short distance; estimation in km How many minutes on foot?
☐ f. Minimal or non-existing security risks
☐ g. Accessibility (no seasonal barriers) ☐ h. Availability of transport
☐ i. Availability of financial resources for transport ☐ j. Availability of company during the journey to the health centre
☐ k. Support and encouragement of the husband ☐ l. Support and encouragement of another family member
☐ m. Support and encouragement of parents with SAM children ☐ n. Support and encouragement of a community health worker
☐ o. Support and encouragement of neighbours ☐ p. Support and encouragement of community leaders
☐ q. Programme appreciated by the community ☐ r. Programme staff is friendly and patient
☐ s. Availability of RUTF ☐ t. Availability of systematic treatment
☐ u. Free service ☐ v. Efficiency of treatment (quick and visible results)
☐ w. Known child cured ☐ x. Access to PlumpyNut®
☐ y Other, please specify
Thank you!
Comments:
APPENDIX 7; QUESTIONNAIRE FOR CARERS OF CHILDREN NOT ENROLLED IN THE CMAM
PROGRAMME
QUESTIONNAIRE FOR CARERS OF CHILREN NOT ENROLLED IN CMAM PROGRAMME
Health district: ___ Health facility:

Village:
Ethnic group:
Team:
Date:
2015
1. Do you think your child is ill?
☐ Yes ☐ No Q4
1a. What symptoms is your child suffering from?
☐ a. Vomiting ☐ b. Fever ☐ c. Diarrhoea
☐ d. Weight loss ☐ e. Loss of appetite ☐ f. Apathy
☐ g. Swelling ☐ h. Loss of hair ☐ i. Skin lesion
☐ j. Other, please specify:
1b. What illness has caused these symptoms?
☐ a. I don’t know ☐ b. Malnutrition ☐ c. Spiritual disease/witchcraft
☐ d. Weight loss ☐ e. Malaria ☐ f. Diarrhoea
☐ g. Other, please specify (in local language):
1c. How have you tried to treat this illness or how are you going to treat it?
☐ a. Medicinal herbs/roots ☐ b. Enriched meals ☐ c. Fast
☐ d. Medicinal products (bought at the market) ☐ e. Medicinal products (bought at the pharmacy) ☐ f. Prayer
☐ g. Consultation of a traditional healer ☐ h. Consultation at the health centre ☐ i. No treatment
☐ j. Other, please specify:
1d. Who made a decision about the choice of treatment?
2. Do you know that there is a service at the health facility dedicated to the treatment of malnutrition? What do you
know about this service?
☐ Yes, ☐ No STOP
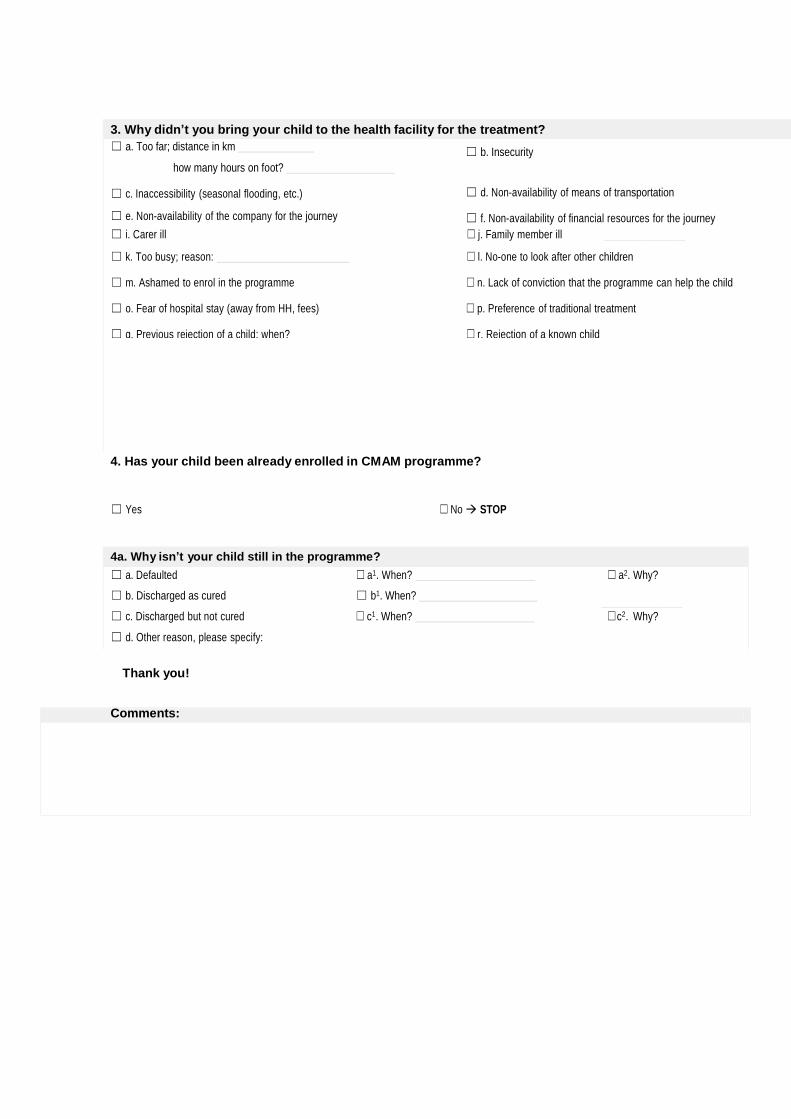
3. Why didn’t you bring your child to the health facility for the treatment?
☐ a. Too far; distance in km
how many hours on foot?
☐ c. Inaccessibility (seasonal flooding, etc.)
☐ e. Non-availability of the company for the journey
☐ g. Husband/family refusal
☐ b. Insecurity
☐ d. Non-availability of means of transportation
☐ f. Non-availability of financial resources for the journey
☐ h. Non-availability of financial resources for the treatment ☐ i. Carer ill ☐ j. Family member ill
☐ k. Too busy; reason: ☐ l. No-one to look after other children
☐ m. Ashamed to enrol in the programme ☐ n. Lack of conviction that the programme can help the child
☐ o. Fear of hospital stay (away from HH, fees) ☐ p. Preference of traditional treatment
☐ q. Previous rejection of a child; when? ☐ r. Rejection of a known child
☐ s. Quantity of PlumpyNut® is too little to justify the journey
4. Has your child been already enrolled in CMAM programme?
☐ Yes ☐ No STOP
4a. Why isn’t your child still in the programme?
☐ a. Defaulted ☐ a1. When? ☐ a2. Why?
☐ b. Discharged as cured ☐ b1. When?
☐ c. Discharged but not cured ☐ c1. When? ☐c2. Why?
☐ d. Other reason, please specify:
STOP
Thank you!
Comments: