Embed Size (px)
Citation preview
Understanding
The Alcohol Harm Paradox to focus the development of interventions
Professor Mark A. Bellis, Lisa Jones, Michela Morleo
Centre for Public Health Liverpool John Moores University
A"World"Health"Organiza2on"Collabora2ng"Centre"
0!
5!
10!
15!
20!
25!
0!
5!
10!
15!
20!
25!
30!
35!
40!
45!
50!
1! 2! 3! 4! 5!
%!
Rate
per
100
,000
pop
ulat
ion!
Deprivation quintile!
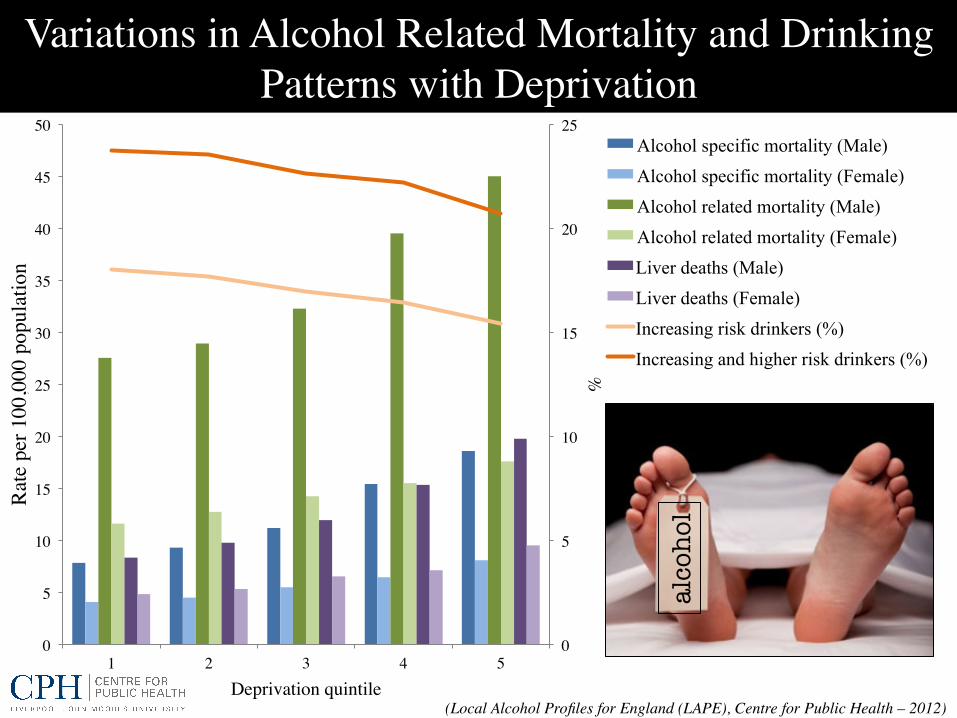
Alcohol specific mortality (Male) Alcohol specific mortality (Female) Alcohol related mortality (Male) Alcohol related mortality (Female) Liver deaths (Male) Liver deaths (Female) Increasing risk drinkers (%) Increasing and higher risk drinkers (%)
Variations in Alcohol Related Mortality and Drinking Patterns with Deprivation !
(Local Alcohol Profiles for England (LAPE), Centre for Public Health – 2012)!alco
hol
0!
5!
10!
15!
20!
25!
0!
500!
1000!
1500!
2000!
2500!
1! 2! 3! 4! 5!
%!
Rate
per
100
,000
pop
ulat
ion!
Deprivation quintile!
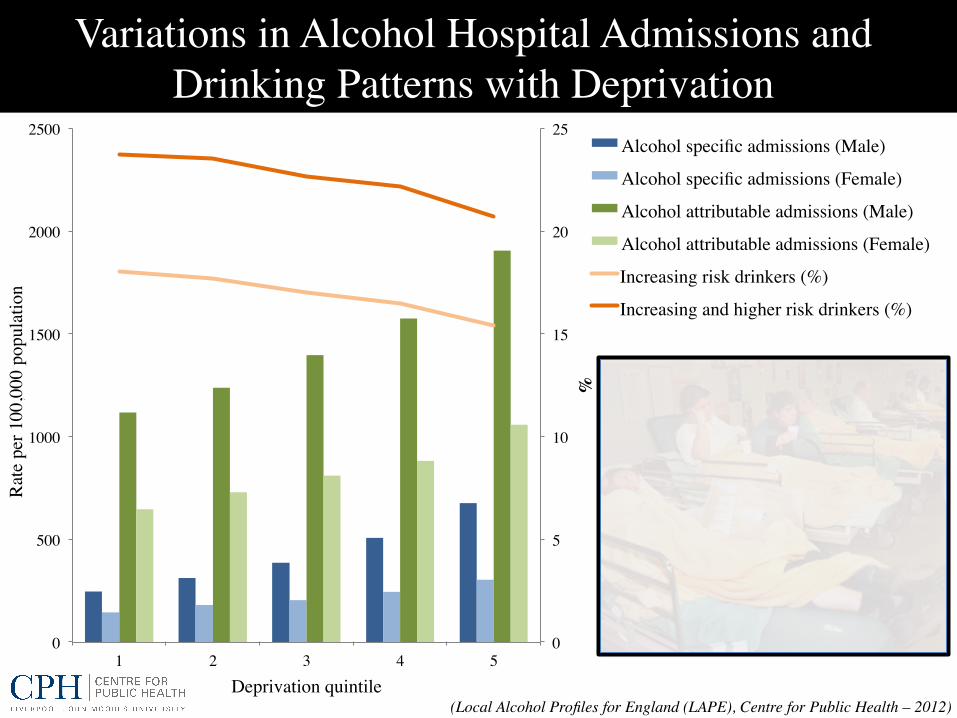
Alcohol specific admissions (Male)!
Alcohol specific admissions (Female)!
Alcohol attributable admissions (Male)!
Alcohol attributable admissions (Female)!
Increasing risk drinkers (%)!
Increasing and higher risk drinkers (%)!
Variations in Alcohol Hospital Admissions and Drinking Patterns with Deprivation !
(Local Alcohol Profiles for England (LAPE), Centre for Public Health – 2012)!
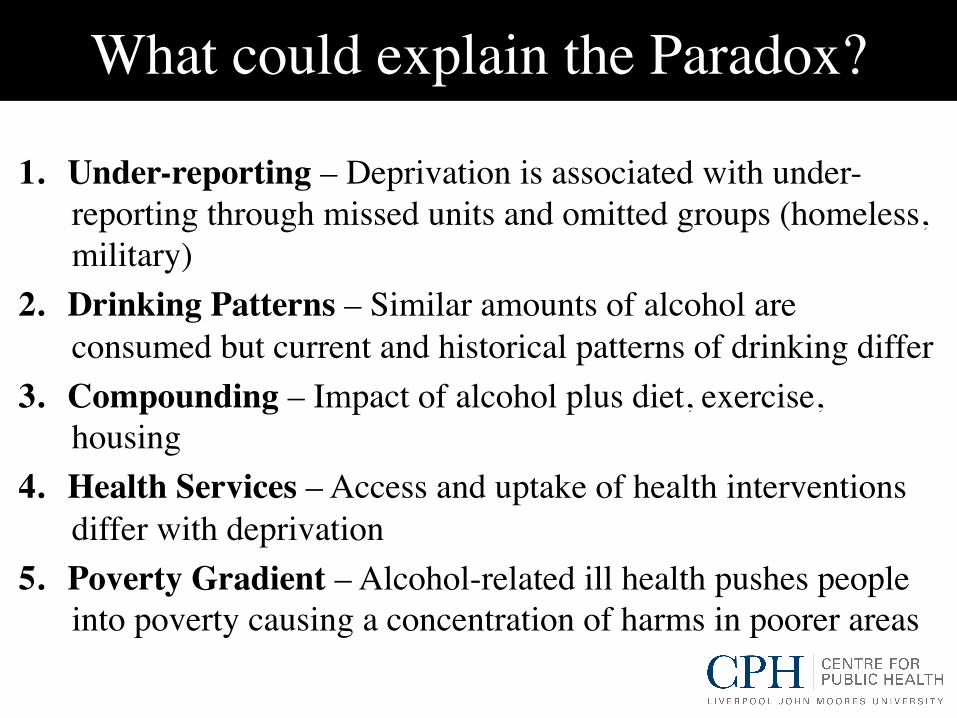
1. Under-reporting – Deprivation is associated with under-reporting through missed units and omitted groups (homeless, military)!
2. Drinking Patterns – Similar amounts of alcohol are consumed but current and historical patterns of drinking differ!
3. Compounding – Impact of alcohol plus diet, exercise, housing!
4. Health Services – Access and uptake of health interventions differ with deprivation!
5. Poverty Gradient – Alcohol-related ill health pushes people into poverty causing a concentration of harms in poorer areas!
What could explain the Paradox?!
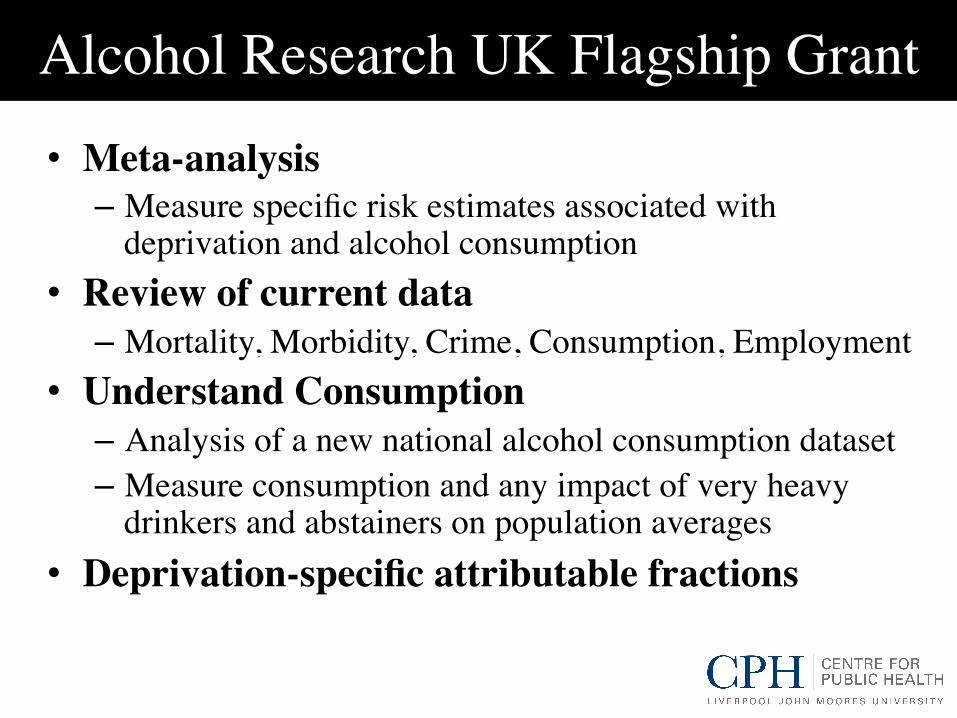
Alcohol Research UK Flagship Grant!• Meta-analysis !– Measure specific risk estimates associated with
deprivation and alcohol consumption!• Review of current data!– Mortality, Morbidity, Crime, Consumption, Employment !
• Understand Consumption!– Analysis of a new national alcohol consumption dataset !– Measure consumption and any impact of very heavy
drinkers and abstainers on population averages!• Deprivation-specific attributable fractions!
• Professor Mark A. Bellis !• Professor Sir Ian Gilmore !• Dr Nick Sheron !• Ms Lisa Jones !• Ms Michela Morleo !!
Alcohol Research UK Grant Applicants!
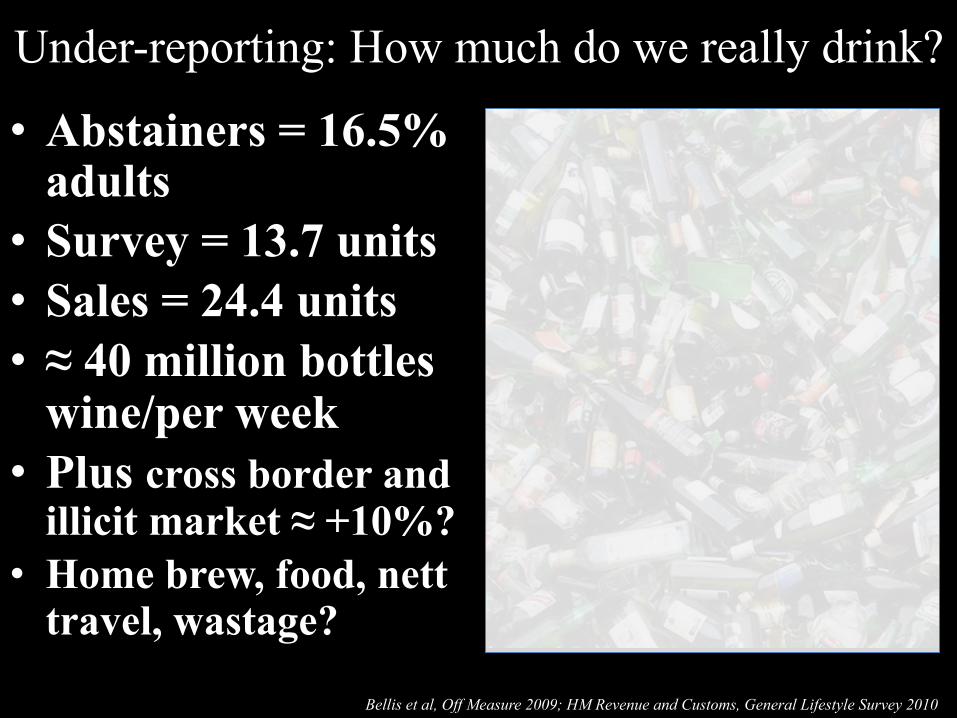
Under-reporting: How much do we really drink?
• Abstainers = 16.5% adults • Survey = 13.7 units • Sales = 24.4 units • ≈ 40 million bottles
wine/per week • Plus cross border and
illicit market ≈ +10%? • Home brew, food, nett
travel, wastage?
Bellis et al, Off Measure 2009; HM Revenue and Customs, General Lifestyle Survey 2010
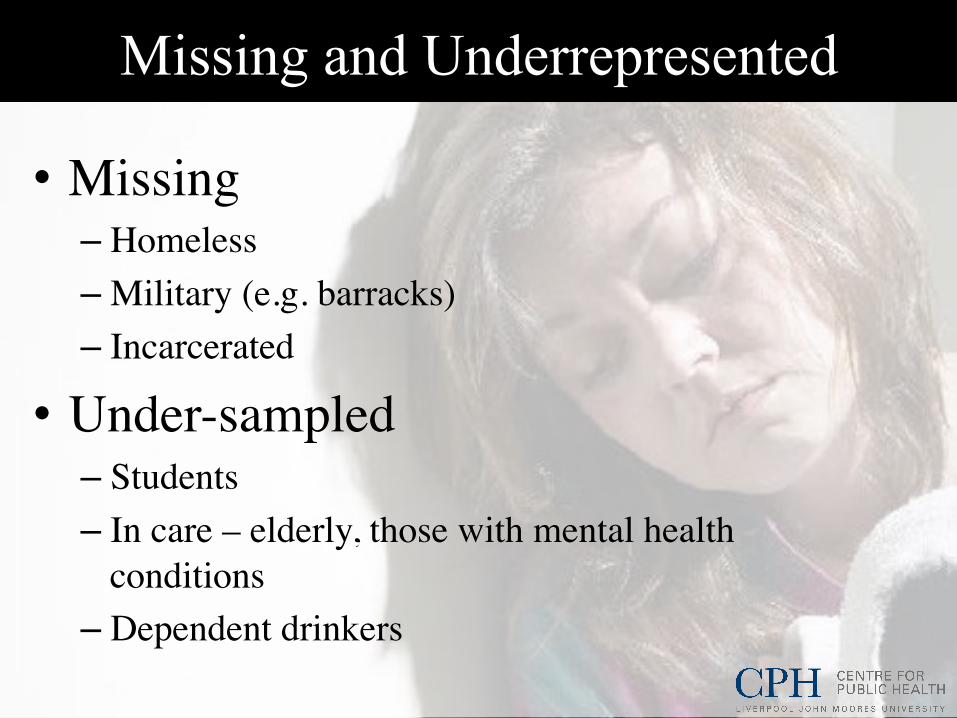
Missing and Underrepresented
• Missing!– Homeless!– Military (e.g. barracks)!– Incarcerated!
• Under-sampled!– Students!– In care – elderly, those with mental health
conditions!– Dependent drinkers !
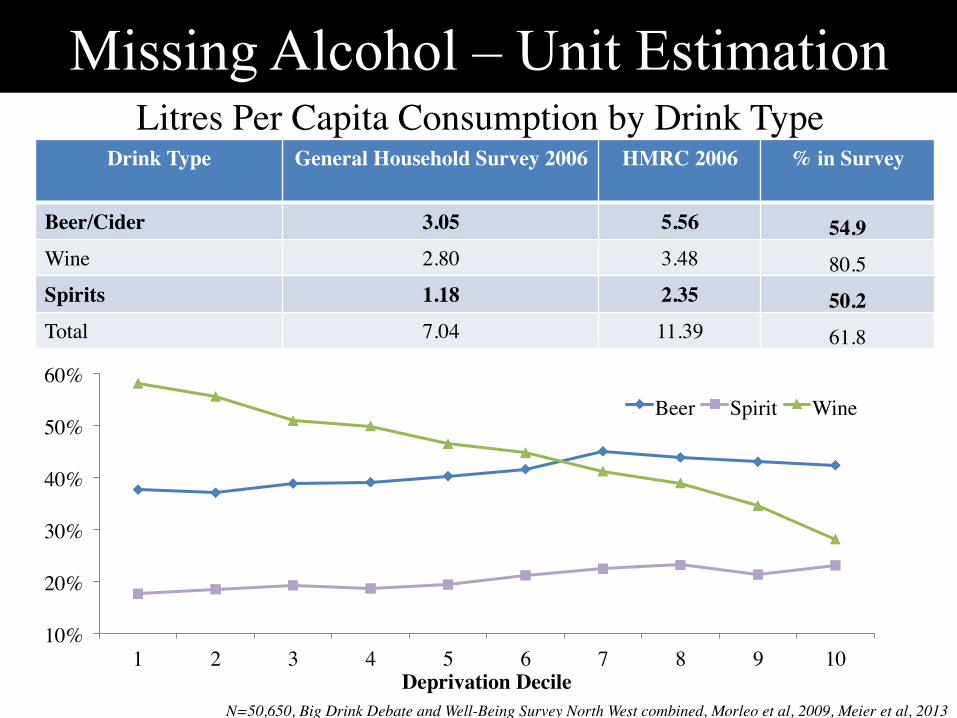
Missing Alcohol – Unit Estimation Drink Type! General Household Survey 2006! HMRC 2006! % in Survey!
Beer/Cider! 3.05! 5.56! 54.9!Wine! 2.80! 3.48! 80.5!Spirits! 1.18! 2.35! 50.2!Total! 7.04! 11.39! 61.8!
Alcohol&Type&Distribu2on&
N=50,650, Big Drink Debate and Well-Being Survey North West combined, Morleo et al, 2009, Meier et al, 2013!
Litres Per Capita Consumption by Drink Type!
10%!
20%!
30%!
40%!
50%!
60%!
1! 2! 3! 4! 5! 6! 7! 8! 9! 10!Deprivation Decile!
Beer! Spirit! Wine!
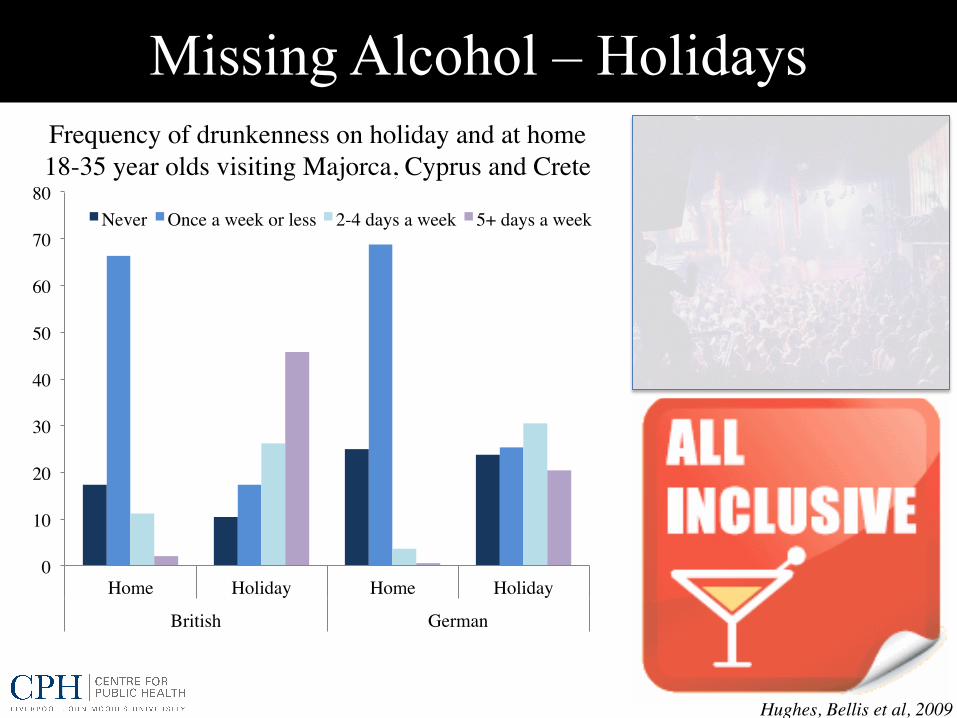
0!
10!
20!
30!
40!
50!
60!
70!
80!
Home! Holiday! Home! Holiday!
British! German!
Never! Once a week or less! 2-4 days a week! 5+ days a week!
Missing Alcohol – Holidays Frequency of drunkenness on holiday and at home!18-35 year olds visiting Majorca, Cyprus and Crete!
Hughes, Bellis et al, 2009!
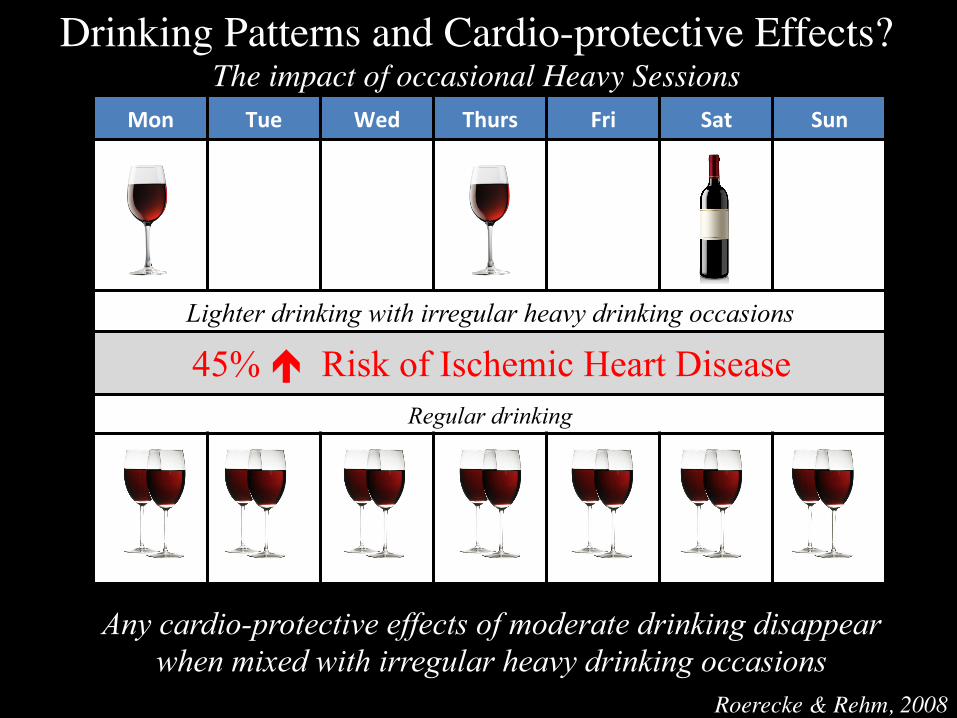
Mon$ Tue$ Wed$ Thurs$ Fri$ Sat$ Sun$
Lighter drinking with irregular heavy drinking occasions
Regular drinking
Roerecke & Rehm, 2008!
Drinking Patterns and Cardio-protective Effects?!The impact of occasional Heavy Sessions !
45% ! Risk of Ischemic Heart Disease
Any cardio-protective effects of moderate drinking disappear when mixed with irregular heavy drinking occasions
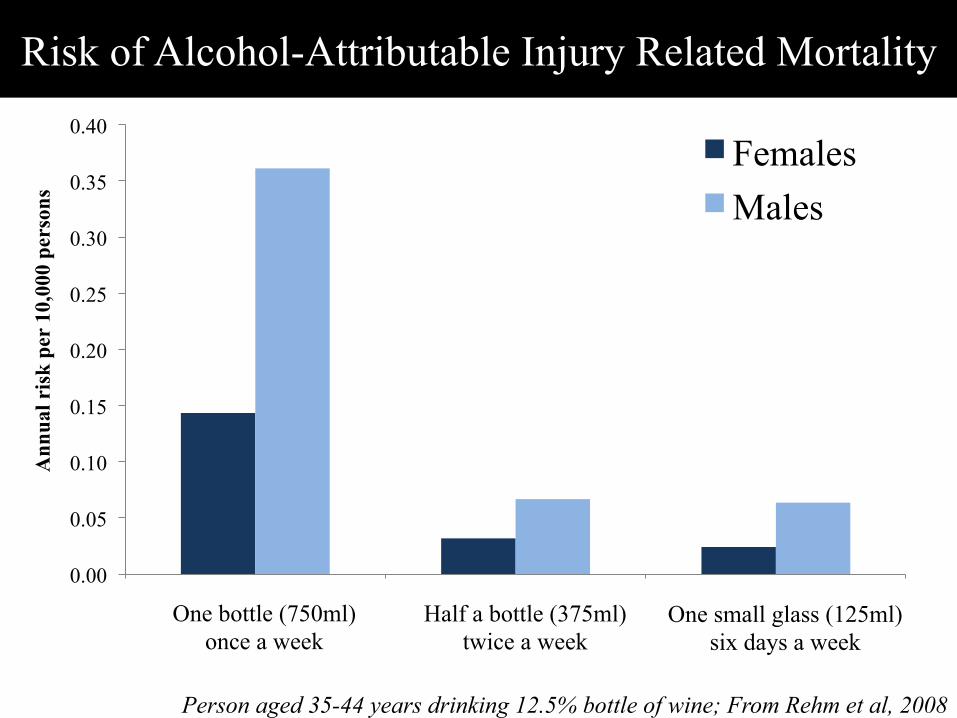
Risk of Alcohol-Attributable Injury Related Mortality
Person aged 35-44 years drinking 12.5% bottle of wine; From Rehm et al, 2008
0.00
0.05
0.10
0.15
0.20
0.25
0.30
0.35
0.40
Ann
ual r
isk
per
10,0
00 p
erso
ns
Females Males
One bottle (750ml) once a week
Half a bottle (375ml) twice a week
One small glass (125ml) six days a week
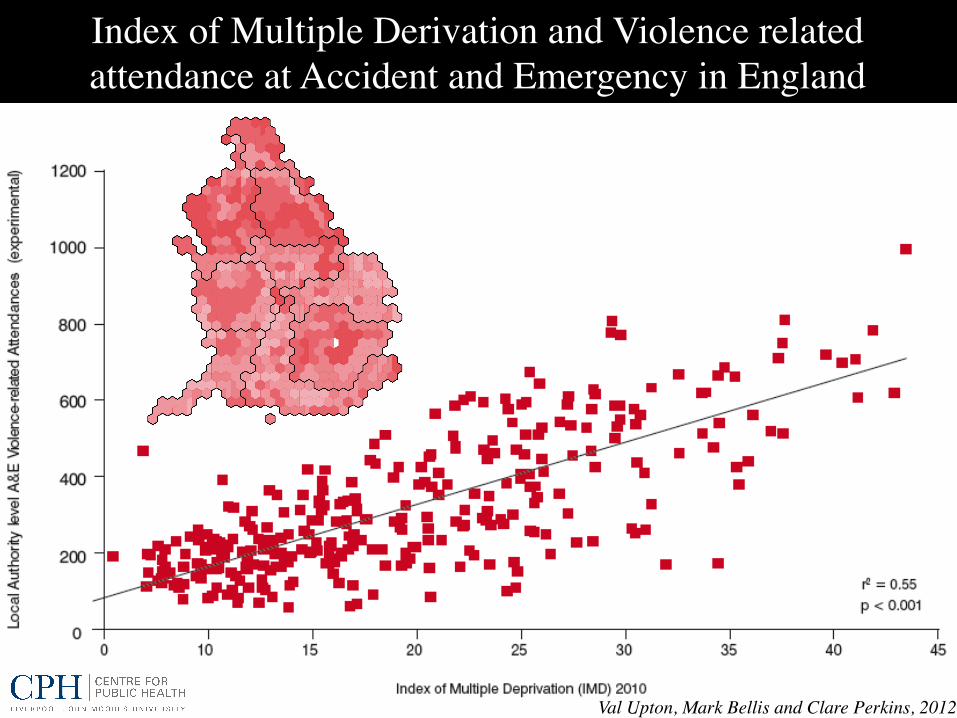
Index of Multiple Derivation and Violence related attendance at Accident and Emergency in England !
Val Upton, Mark Bellis and Clare Perkins, 2012!
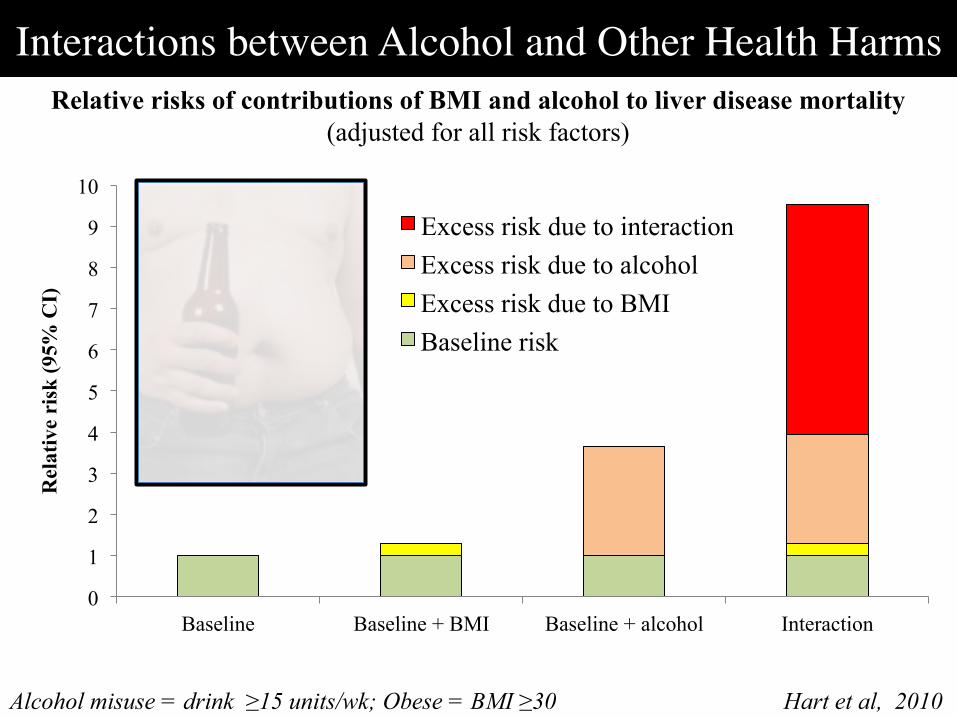
Interactions between Alcohol and Other Health Harms
0
1
2
3
4
5
6
7
8
9
10
Baseline Baseline + BMI Baseline + alcohol Interaction
Rel
ativ
e ri
sk (9
5% C
I)
Excess risk due to interaction Excess risk due to alcohol Excess risk due to BMI Baseline risk
Alcohol misuse = drink ≥15 units/wk; Obese = BMI ≥30 Hart et al, 2010
Relative risks of contributions of BMI and alcohol to liver disease mortality (adjusted for all risk factors)
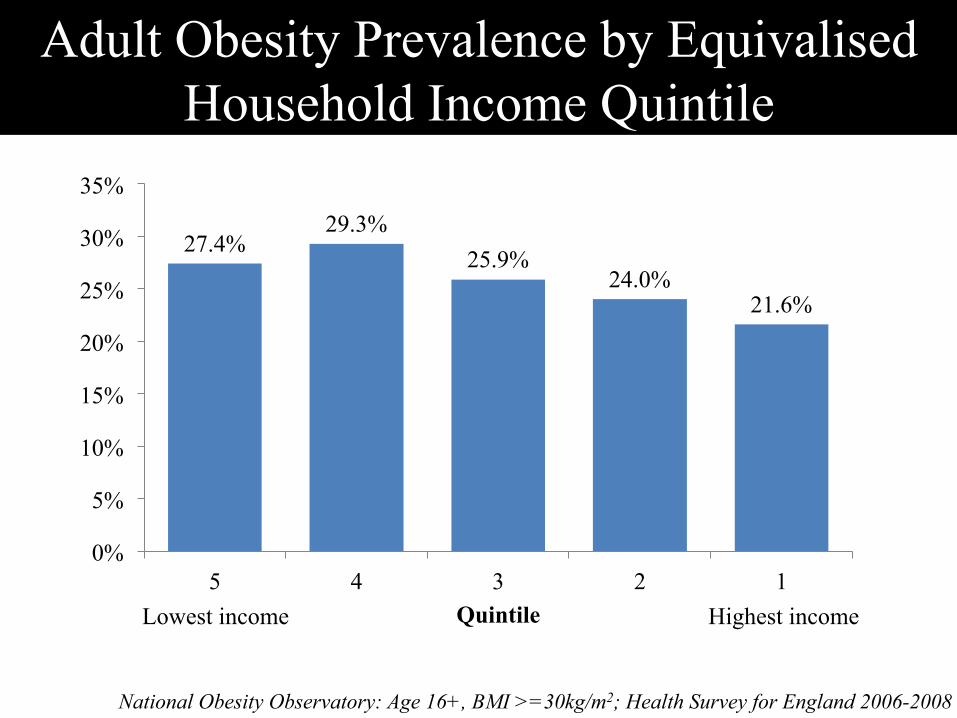
Adult Obesity Prevalence by Equivalised Household Income Quintile
Lowest income quintile
Highest income quintile
National Obesity Observatory: Age 16+, BMI >=30kg/m2; Health Survey for England 2006-2008
27.4% 29.3%
25.9% 24.0%
21.6%
0%
5%
10%
15%
20%
25%
30%
35%
5 4 3 2 1 Quintile Lowest income Highest income
0 50 100 150
1
2
3
4
5
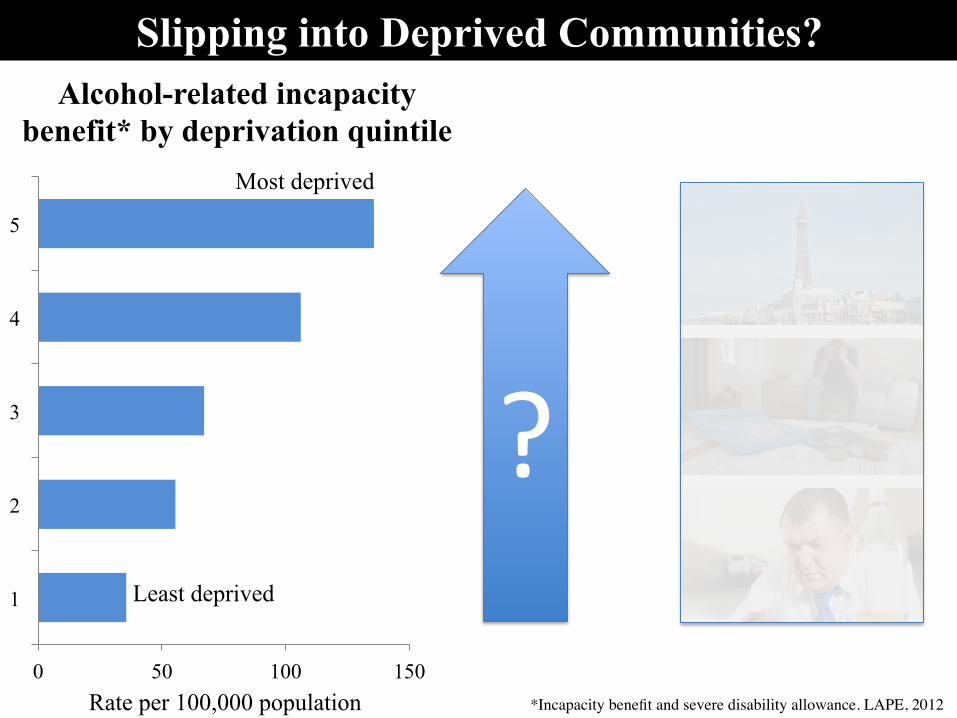
Alcohol-related incapacity benefit* by deprivation quintile
Least deprived
Most deprived
Rate per 100,000 population *Incapacity benefit and severe disability allowance. LAPE, 2012!
Slipping into Deprived Communities?
?&
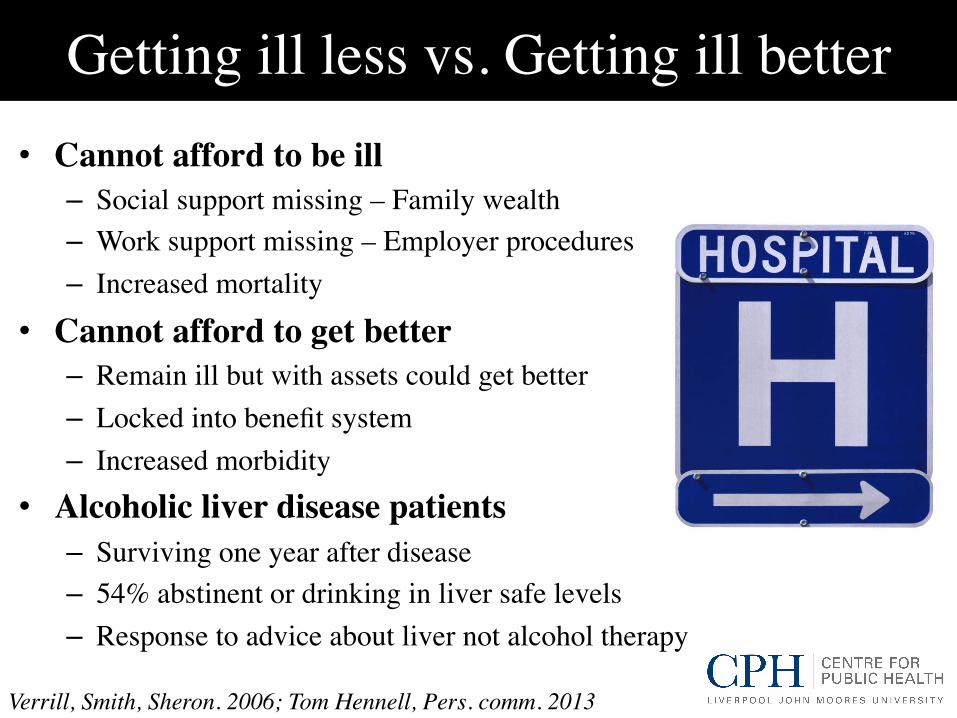
• Cannot afford to be ill!– Social support missing – Family wealth!– Work support missing – Employer procedures !– Increased mortality!
• Cannot afford to get better!– Remain ill but with assets could get better!– Locked into benefit system!– Increased morbidity!
• Alcoholic liver disease patients!– Surviving one year after disease !– 54% abstinent or drinking in liver safe levels!– Response to advice about liver not alcohol therapy!
Getting ill less vs. Getting ill better !
Verrill, Smith, Sheron. 2006; Tom Hennell, Pers. comm. 2013!
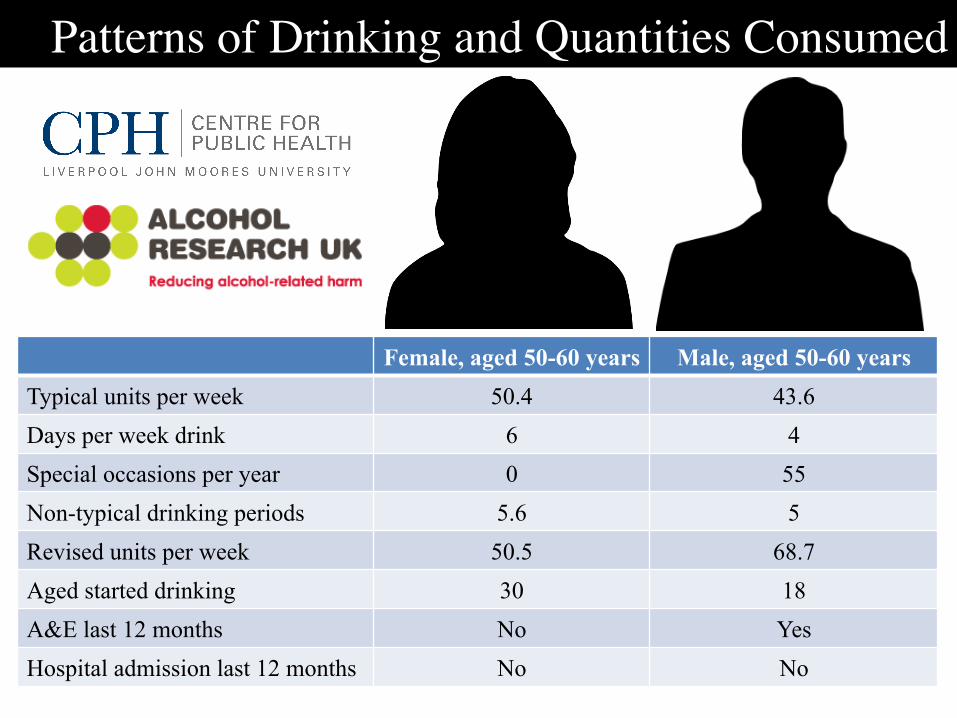
Female, aged 50-60 years Male, aged 50-60 years
Typical units per week 50.4 43.6 Days per week drink 6 4 Special occasions per year 0 55 Non-typical drinking periods 5.6 5 Revised units per week 50.5 68.7 Aged started drinking 30 18 A&E last 12 months No Yes Hospital admission last 12 months No No
Patterns of Drinking and Quantities Consumed!
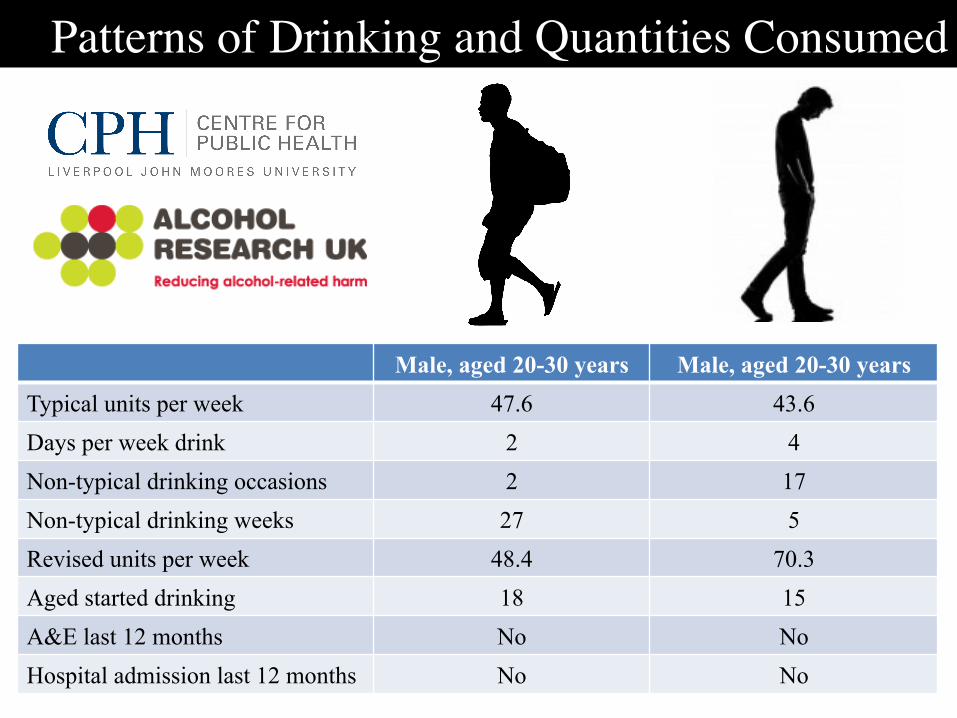
Male, aged 20-30 years Male, aged 20-30 years
Typical units per week 47.6 43.6 Days per week drink 2 4 Non-typical drinking occasions 2 17 Non-typical drinking weeks 27 5 Revised units per week 48.4 70.3 Aged started drinking 18 15 A&E last 12 months No No Hospital admission last 12 months No No
Patterns of Drinking and Quantities Consumed!
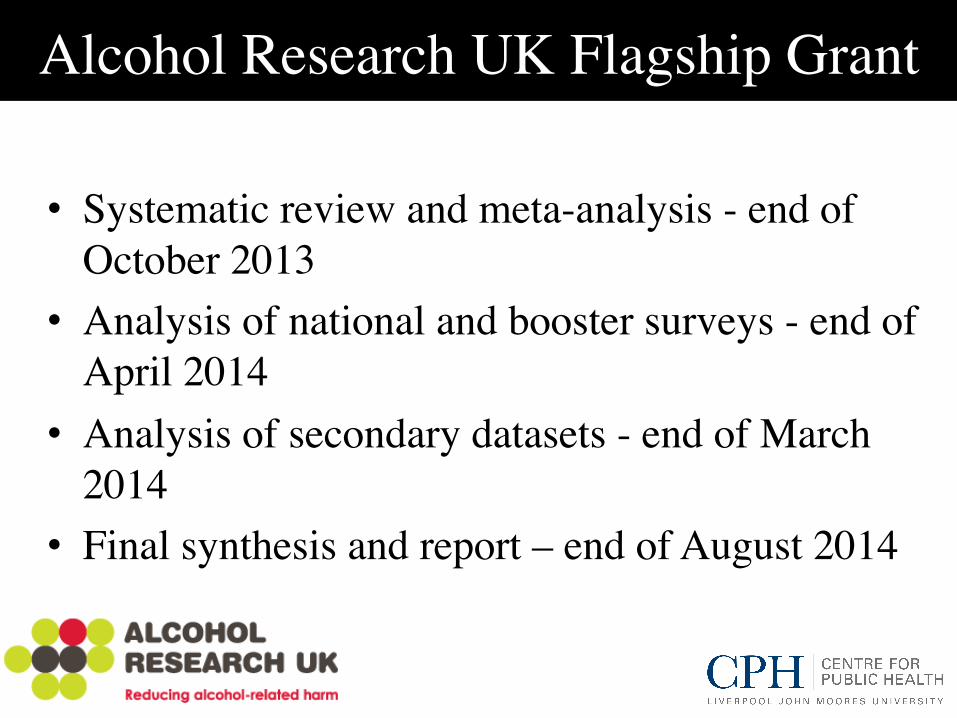
Alcohol Research UK Flagship Grant!
• Systematic review and meta-analysis - end of October 2013!
• Analysis of national and booster surveys - end of April 2014!
• Analysis of secondary datasets - end of March 2014!
• Final synthesis and report – end of August 2014!
A"World"Health"Organiza2on"Collabora2ng"Centre"
Study Contacts ""
Mark Bellis [email protected]"Lisa Jones [email protected] "
Michela Morleo [email protected]!


![Dr. Maurizia De Bellis · Professional experiences XIV. Publications I. Abstract Maurizia De Bellis (1980) is tenured Assistant Professor [ricercatrice confermata] in Administrative](https://img.pdfslide.net/doc/110x75/5fda56ad1a834d464a31d496/dr-maurizia-de-bellis-professional-experiences-xiv-publications-i-abstract-maurizia.jpg)