Embed Size (px)
Citation preview
Azizan Aziz School of Materials and Mineral Resources Engineering
Binary Phase Diagrams
Azizan Aziz Ph.D
by
Azizan Aziz School of Materials and Mineral Resources Engineering
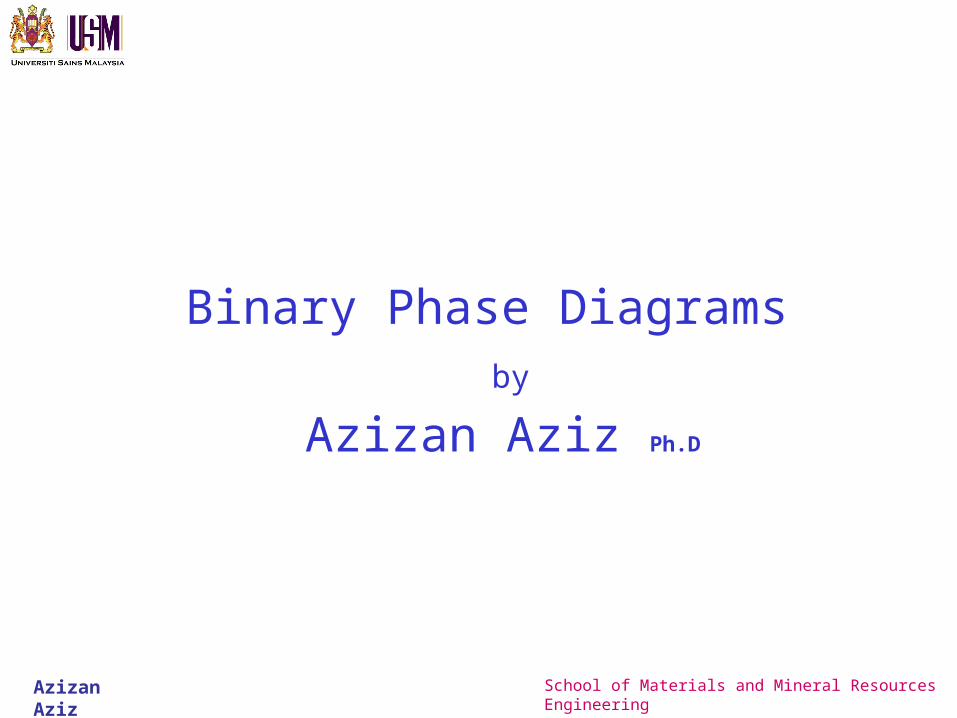
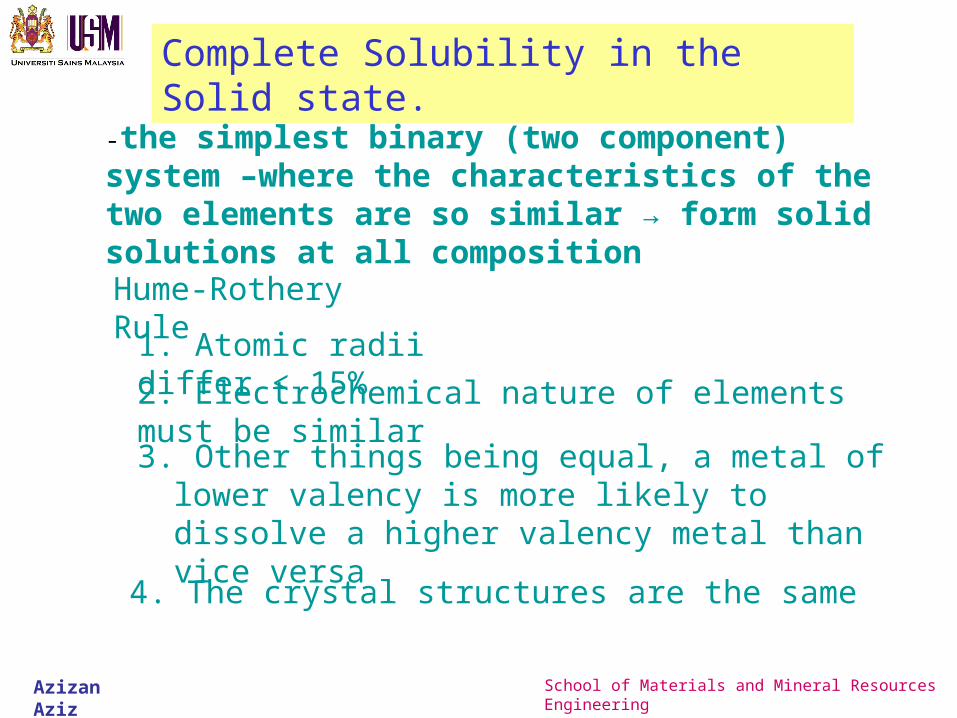
Complete Solubility in the Solid state.
-the simplest binary (two component) system –where the characteristics of the two elements are so similar → form solid solutions at all compositionHume-Rothery Rule
1. Atomic radii differ < 15%
2. Electrochemical nature of elements must be similar
3. Other things being equal, a metal of lower valency is more likely to dissolve a higher valency metal than vice versa
4. The crystal structures are the same
Azizan Aziz School of Materials and Mineral Resources Engineering
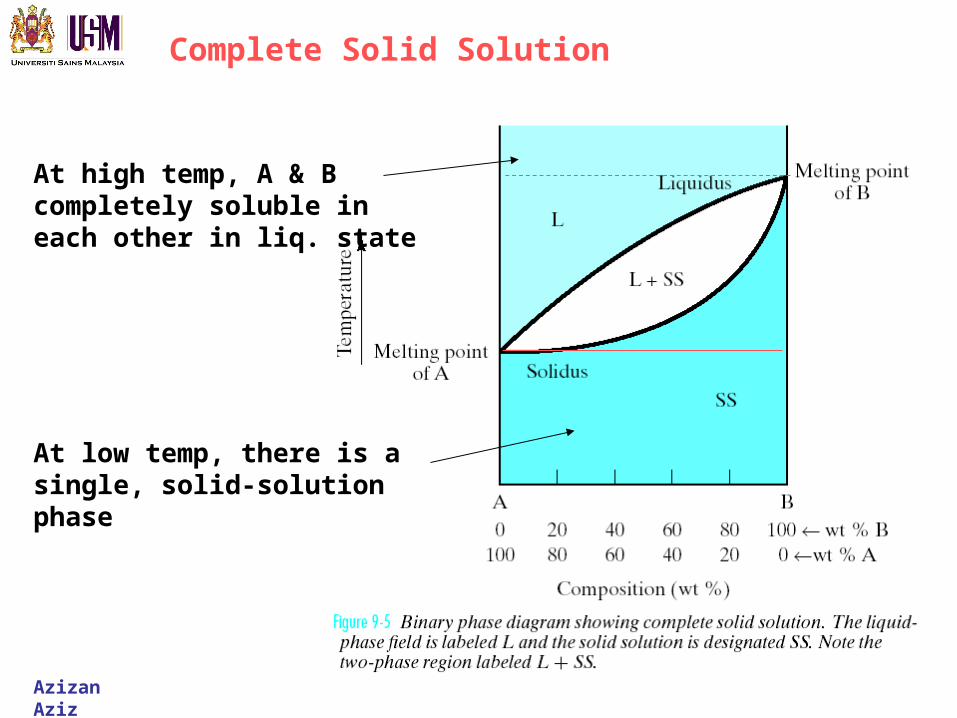
Complete Solid Solution
At high temp, A & B completely soluble in each other in liq. state
At low temp, there is a single, solid-solution phase
Azizan Aziz School of Materials and Mineral Resources Engineering
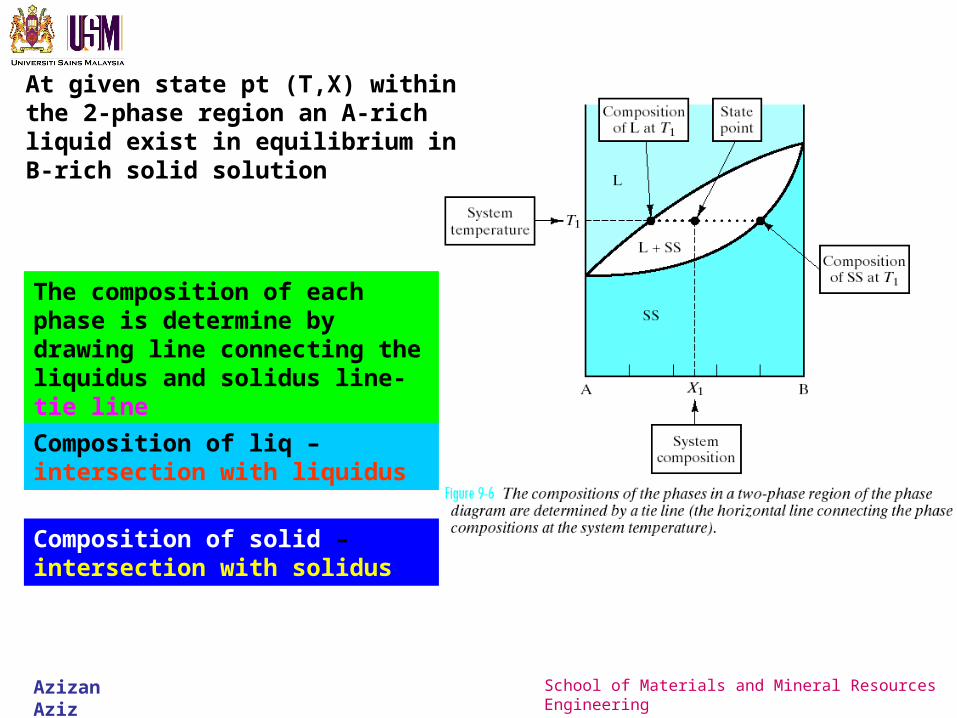
At given state pt (T,X) within the 2-phase region an A-rich liquid exist in equilibrium in B-rich solid solution
The composition of each phase is determine by drawing line connecting the liquidus and solidus line- tie line
Composition of liq – intersection with liquidus
Composition of solid – intersection with solidus
Azizan Aziz School of Materials and Mineral Resources Engineering
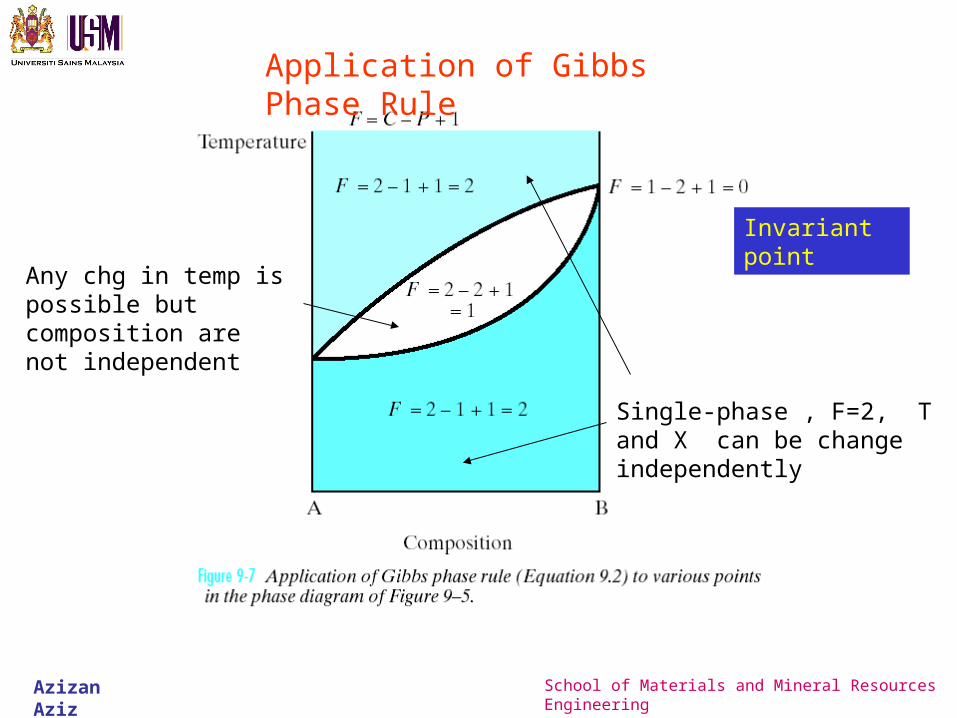
Application of Gibbs Phase Rule
Invariant point
Any chg in temp is possible but composition are not independent
Single-phase , F=2, T and X can be change independently
Azizan Aziz School of Materials and Mineral Resources Engineering
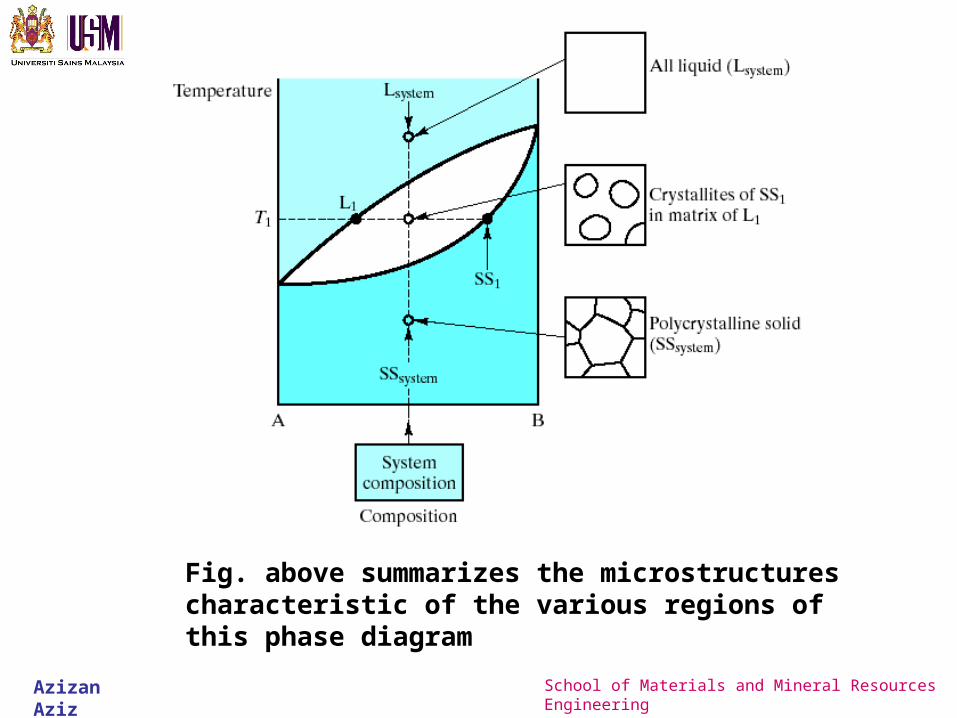
Fig. above summarizes the microstructures characteristic of the various regions of this phase diagram
Azizan Aziz School of Materials and Mineral Resources Engineering
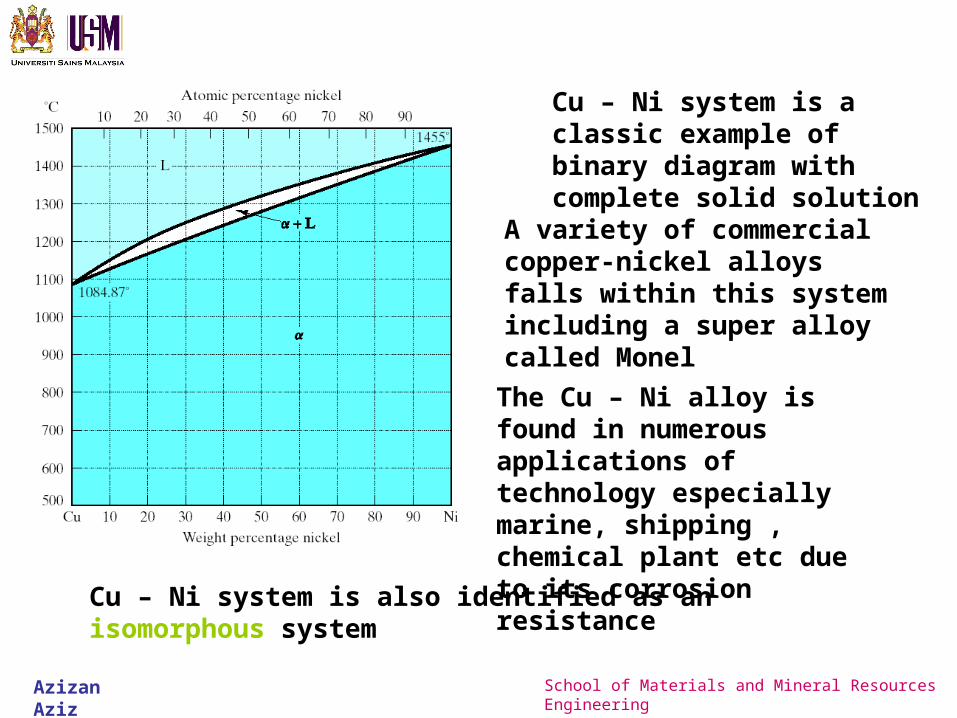
Cu – Ni system is a classic example of binary diagram with complete solid solution
A variety of commercial copper-nickel alloys falls within this system including a super alloy called Monel
The Cu – Ni alloy is found in numerous applications of technology especially marine, shipping , chemical plant etc due to its corrosion resistance
Cu – Ni system is also identified as an isomorphous system
Azizan Aziz School of Materials and Mineral Resources Engineering
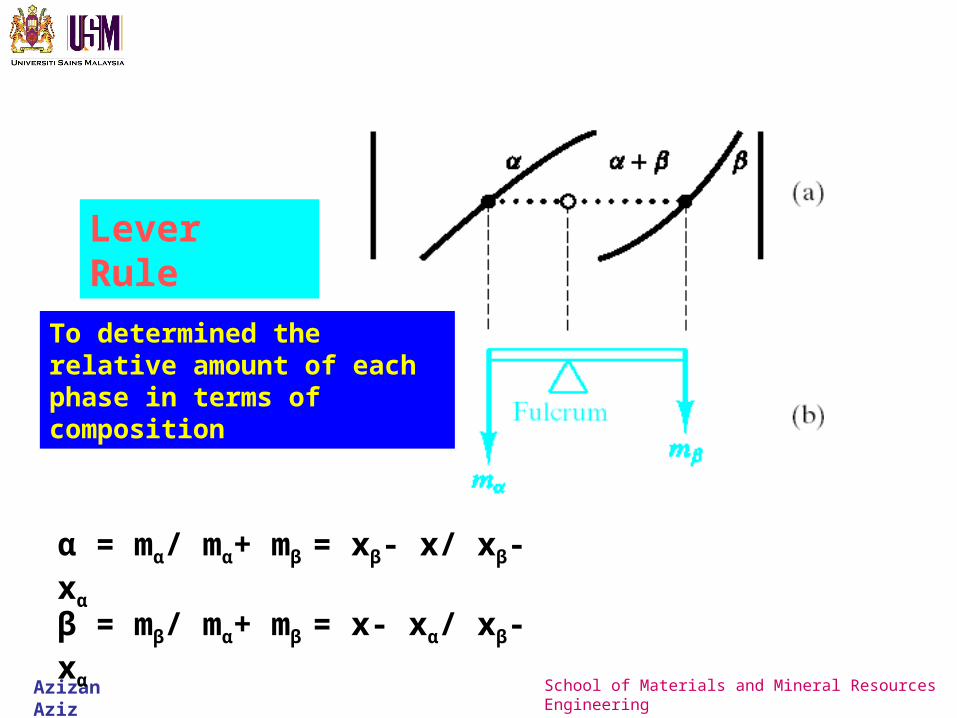
Lever Rule
To determined the relative amount of each phase in terms of composition
α = mα/ mα+ mβ = xβ- x/ xβ- xα
β = mβ/ mα+ mβ = x- xα/ xβ- xα
Azizan Aziz School of Materials and Mineral Resources Engineering
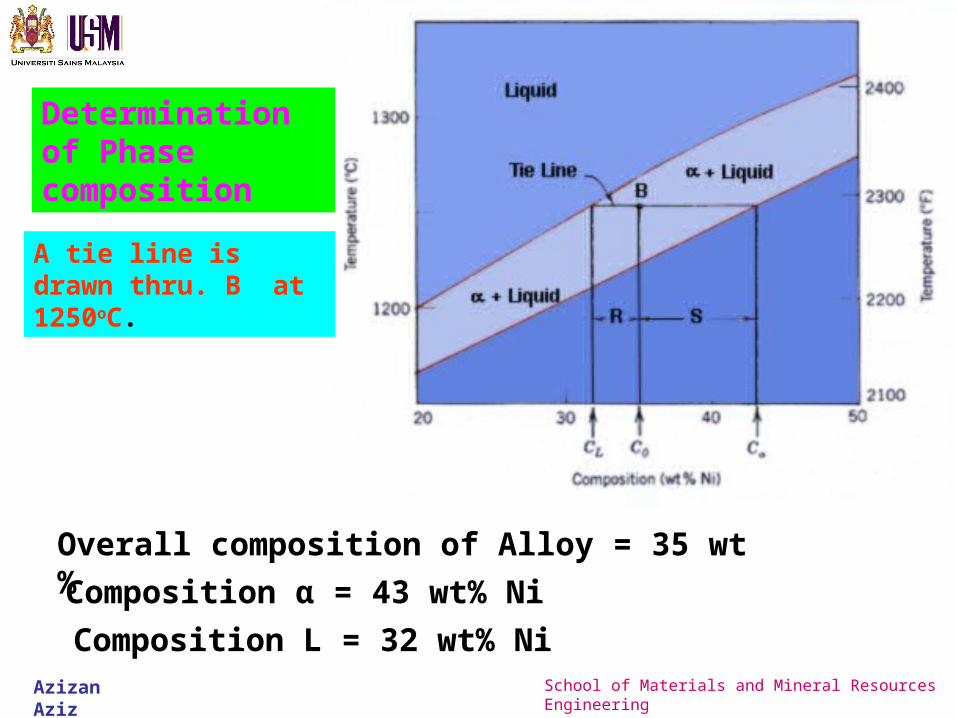
Determination of Phase composition
A tie line is drawn thru. B at 1250oC.
Overall composition of Alloy = 35 wt%
Composition α = 43 wt% Ni
Composition L = 32 wt% Ni
Azizan Aziz School of Materials and Mineral Resources Engineering
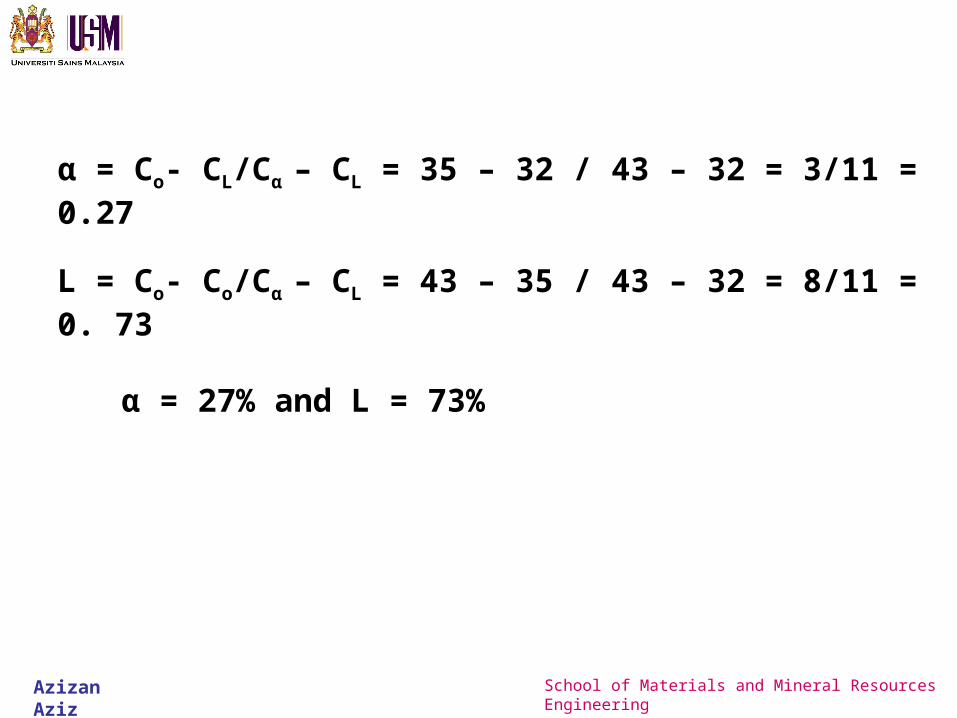
α = Co- CL/Cα – CL = 35 – 32 / 43 – 32 = 3/11 = 0.27
L = Co- Co/Cα – CL = 43 – 35 / 43 – 32 = 8/11 = 0. 73
α = 27% and L = 73%
Azizan Aziz School of Materials and Mineral Resources Engineering
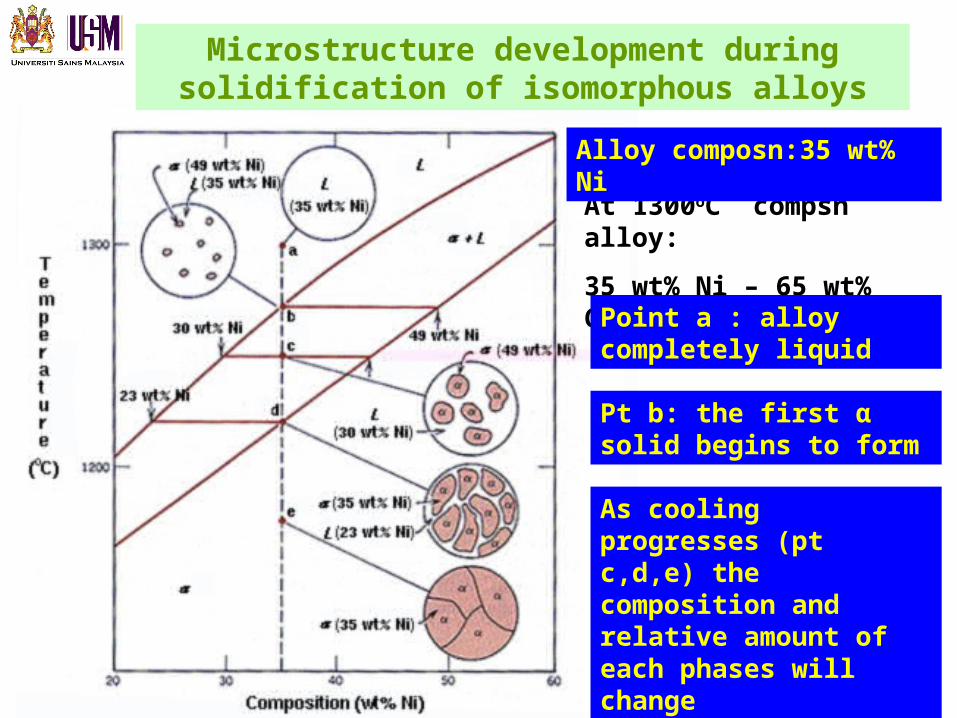
Microstructure development during solidification of isomorphous alloys
At 1300oC compsn alloy:
35 wt% Ni – 65 wt% Cu
Alloy composn:35 wt% Ni
Point a : alloy completely liquid
Pt b: the first α solid begins to form
As cooling progresses (pt c,d,e) the composition and relative amount of each phases will change
Azizan Aziz School of Materials and Mineral Resources Engineering
Solidification of a Solid-Solution Alloy
Azizan Aziz School of Materials and Mineral Resources Engineering
©20
03 B
rook
s/C
ole,
a d
ivis
ion
of T
hom
son
Lea
rnin
g, I
nc.
Tho
mso
n L
earn
ing ™
is a
trad
emar
k us
ed h
erei
n un
der
lice
nse.
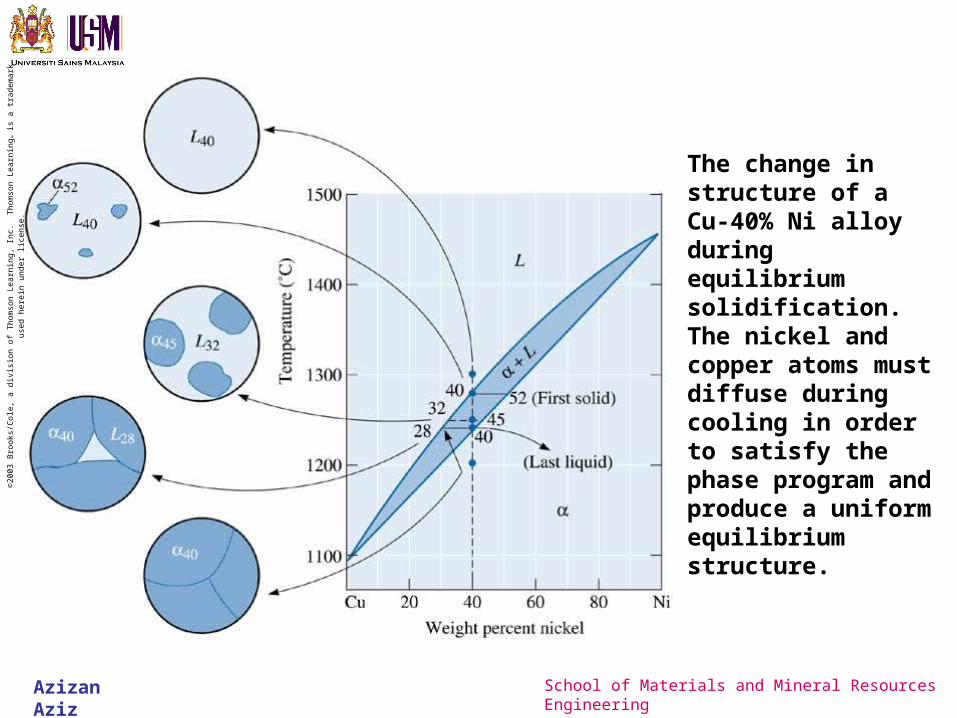
The change in structure of a Cu-40% Ni alloy during equilibrium solidification. The nickel and copper atoms must diffuse during cooling in order to satisfy the phase program and produce a uniform equilibrium structure.
Azizan Aziz School of Materials and Mineral Resources Engineering
©2003 Brooks/Cole, a division of Thomson Learning, Inc. Thomson Learning™ is a trademark used herein under license.
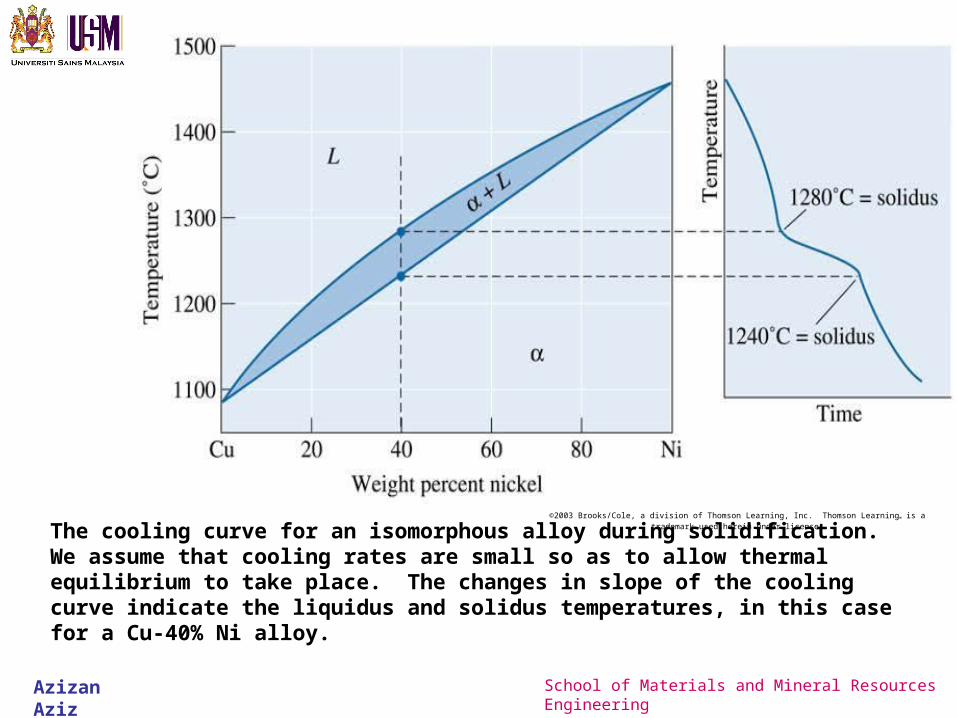
The cooling curve for an isomorphous alloy during solidification. We assume that cooling rates are small so as to allow thermal equilibrium to take place. The changes in slope of the cooling curve indicate the liquidus and solidus temperatures, in this case for a Cu-40% Ni alloy.
Azizan Aziz School of Materials and Mineral Resources Engineering
Nonequilibrium Solidification and Segregation
Coring - Chemical segregation in cast products, also known as microsegregation or interdendritic segregation.
Homogenization heat treatment - The heat treatment used to reduce the microsegregation caused during nonequilibrium solidification.
Macrosegregation - The presence of composition differences in a material over large distances caused by nonequilibrium solidification.
Spray atomization - A process in which molten alloys or metals are sprayed using a ceramic nozzle.
Azizan Aziz School of Materials and Mineral Resources Engineering
©20
03 B
rook
s/C
ole,
a d
ivis
ion
of T
hom
son
Lea
rnin
g, I
nc.
Tho
mso
n L
earn
ing ™
is a
trad
emar
k us
ed h
erei
n un
der
lice
nse.
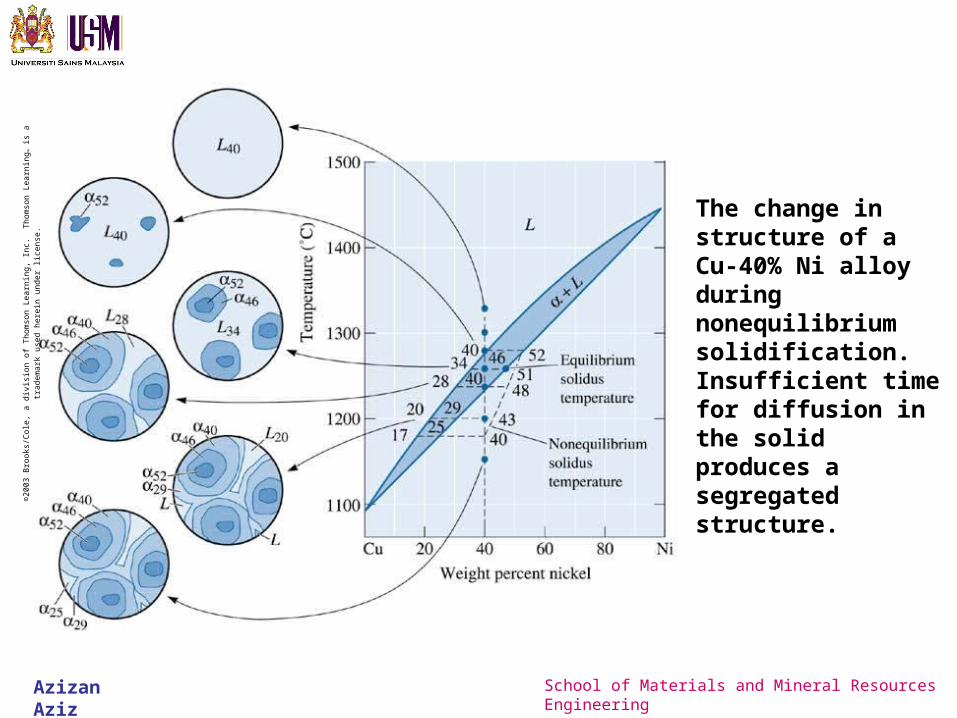
The change in structure of a Cu-40% Ni alloy during nonequilibrium solidification. Insufficient time for diffusion in the solid produces a segregated structure.
Azizan Aziz School of Materials and Mineral Resources Engineering
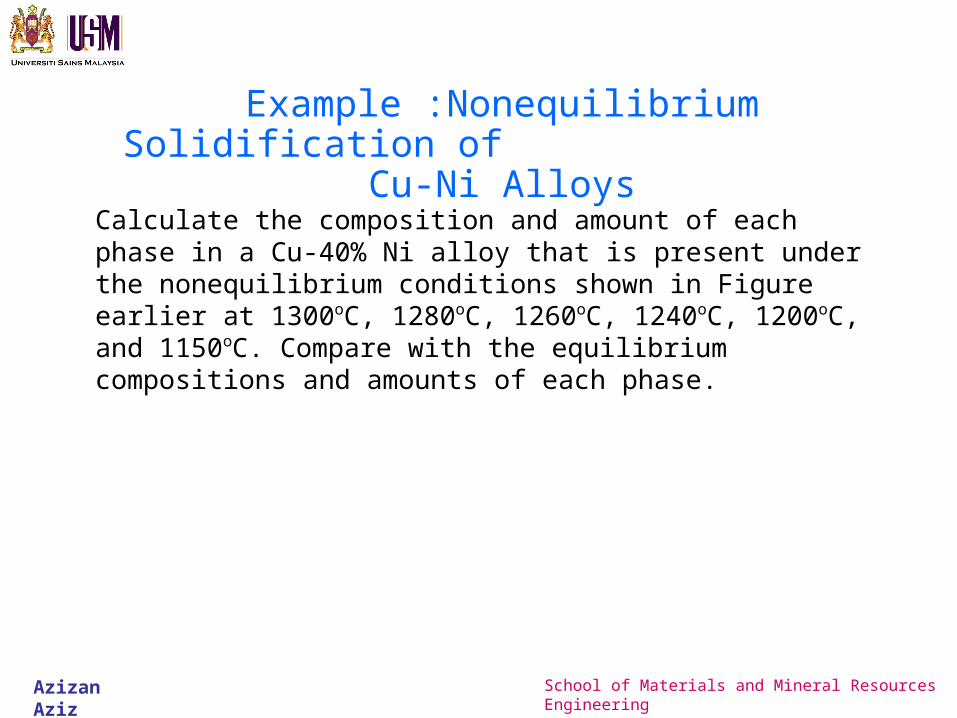
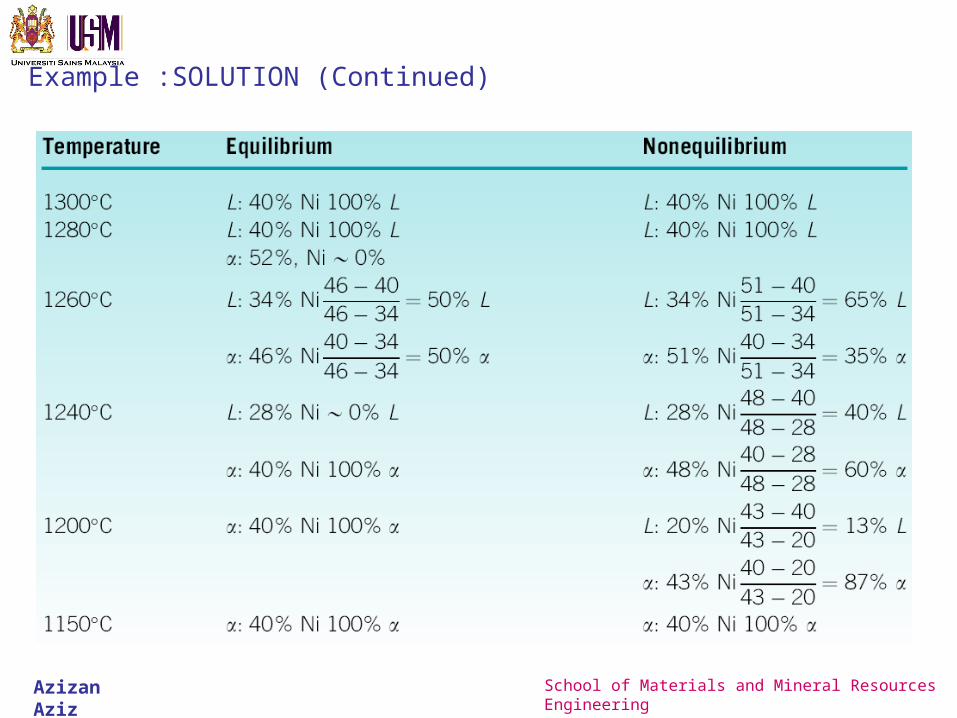
Calculate the composition and amount of each phase in a Cu-40% Ni alloy that is present under the nonequilibrium conditions shown in Figure earlier at 1300oC, 1280oC, 1260oC, 1240oC, 1200oC, and 1150oC. Compare with the equilibrium compositions and amounts of each phase.
Example :Nonequilibrium Solidification of Cu-Ni Alloys
Azizan Aziz School of Materials and Mineral Resources Engineering
©20
03 B
rook
s/C
ole,
a d
ivis
ion
of T
hom
son
Lea
rnin
g, I
nc.
Tho
mso
n L
earn
ing ™
is a
trad
emar
k us
ed h
erei
n un
der
lice
nse.
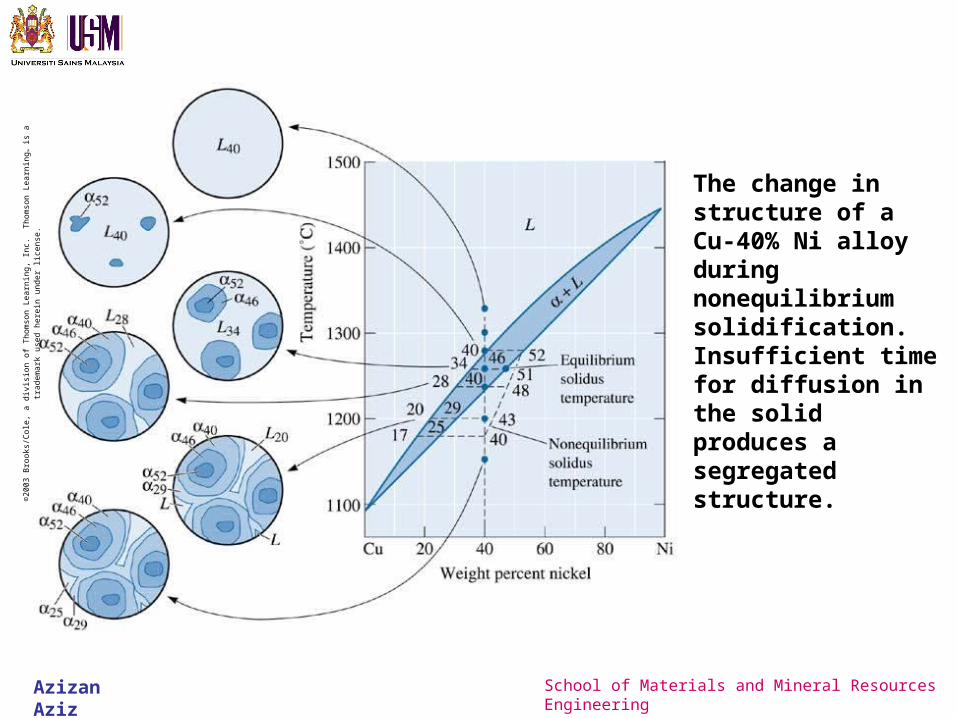
The change in structure of a Cu-40% Ni alloy during nonequilibrium solidification. Insufficient time for diffusion in the solid produces a segregated structure.
Azizan Aziz School of Materials and Mineral Resources Engineering
Example :SOLUTION
We use the tie line upto the equilibrium solidus temperature to calculate composition and percentages of phases as per the lever rule. Similarly, the nonequilibrium solidus temperature curve is used to calculate percentages and concentrations of different phases formed under nonequilibrium conditions.
Azizan Aziz School of Materials and Mineral Resources Engineering
Example :SOLUTION (Continued)
Azizan Aziz School of Materials and Mineral Resources Engineering
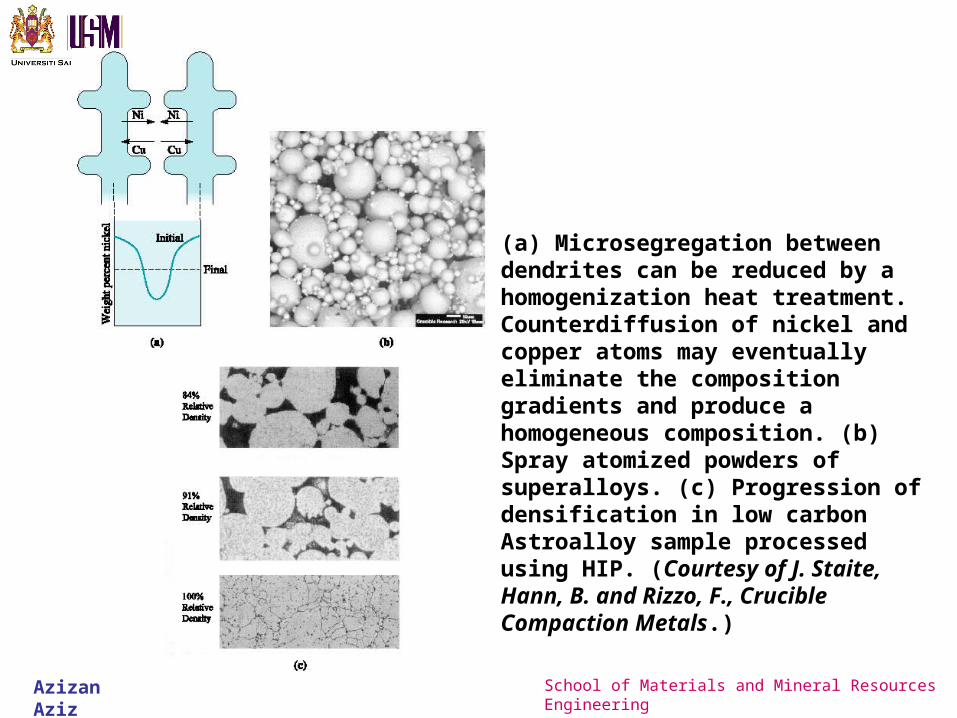
(a) Microsegregation between dendrites can be reduced by a homogenization heat treatment. Counterdiffusion of nickel and copper atoms may eventually eliminate the composition gradients and produce a homogeneous composition. (b) Spray atomized powders of superalloys. (c) Progression of densification in low carbon Astroalloy sample processed using HIP. (Courtesy of J. Staite, Hann, B. and Rizzo, F., Crucible Compaction Metals.)
Azizan Aziz School of Materials and Mineral Resources Engineering
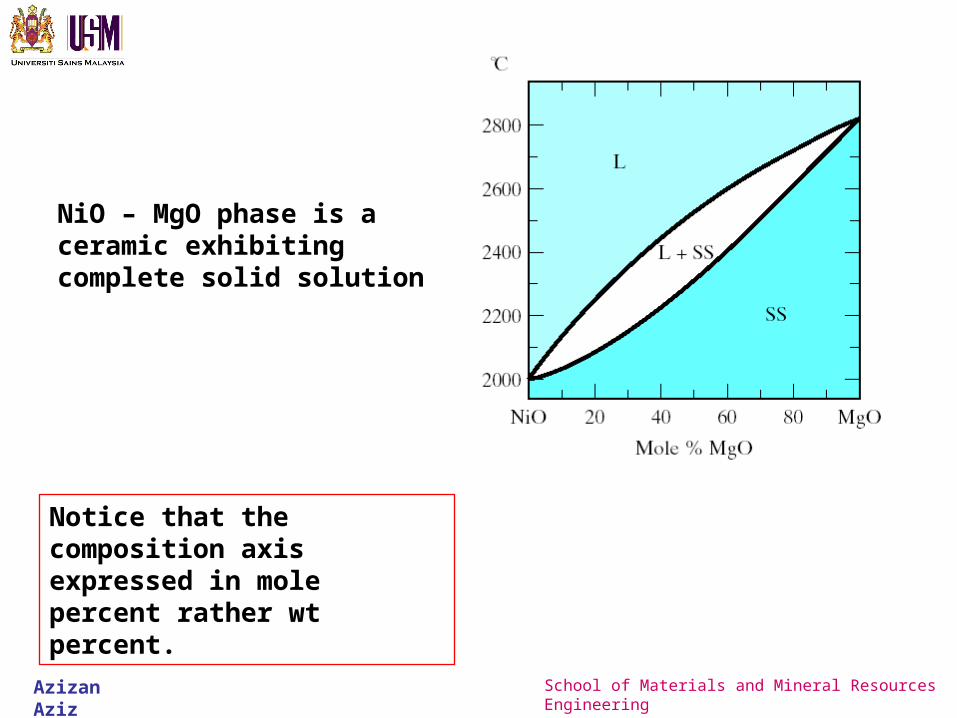
NiO – MgO phase is a ceramic exhibiting complete solid solution
Notice that the composition axis expressed in mole percent rather wt percent.
Azizan Aziz School of Materials and Mineral Resources Engineering
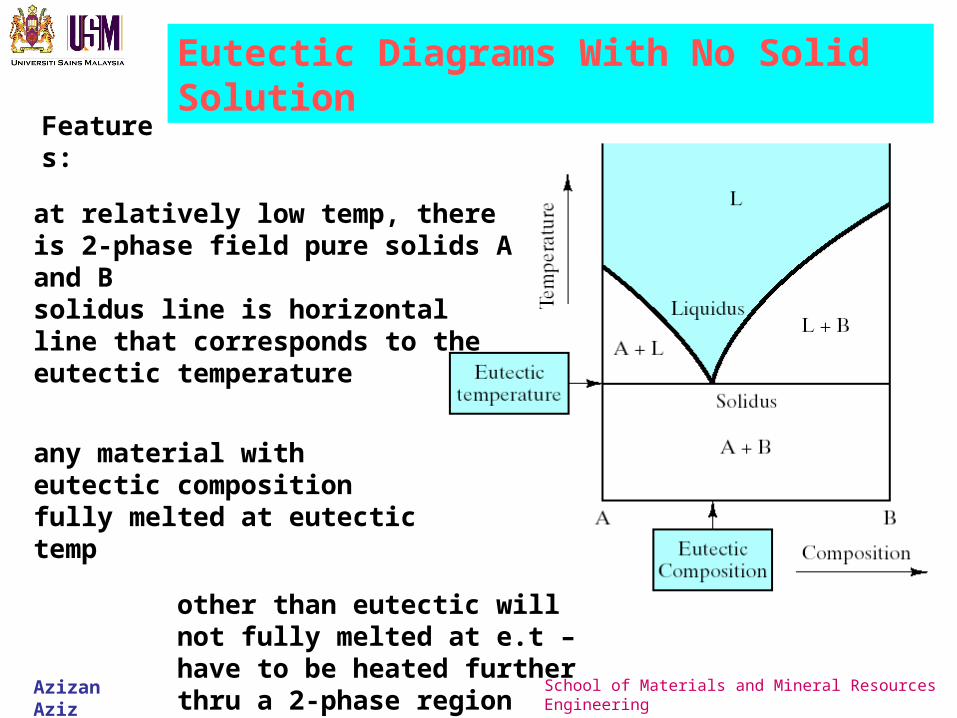
Eutectic Diagrams With No Solid Solution
at relatively low temp, there is 2-phase field pure solids A and B
solidus line is horizontal line that corresponds to the eutectic temperature
any material with eutectic composition fully melted at eutectic temp
other than eutectic will not fully melted at e.t – have to be heated further thru a 2-phase region
Features:
Azizan Aziz School of Materials and Mineral Resources Engineering
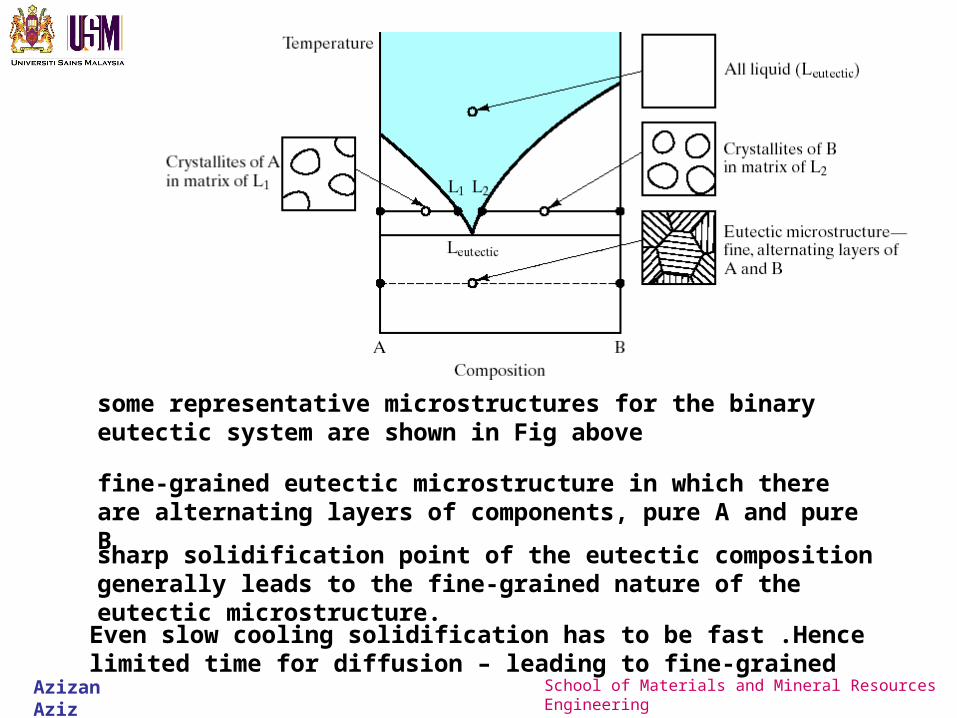
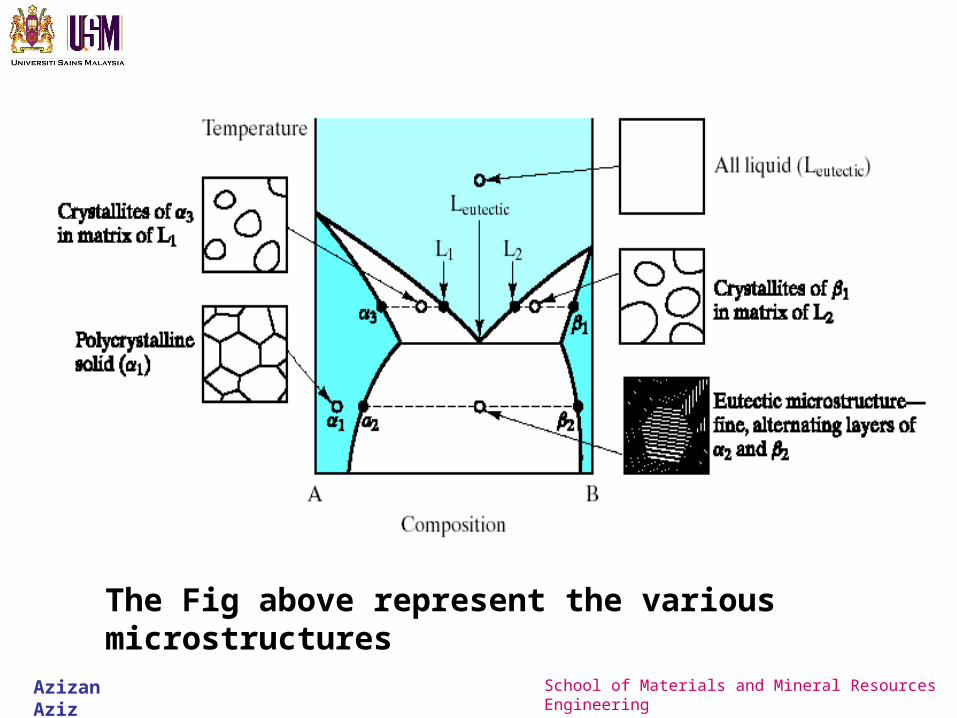
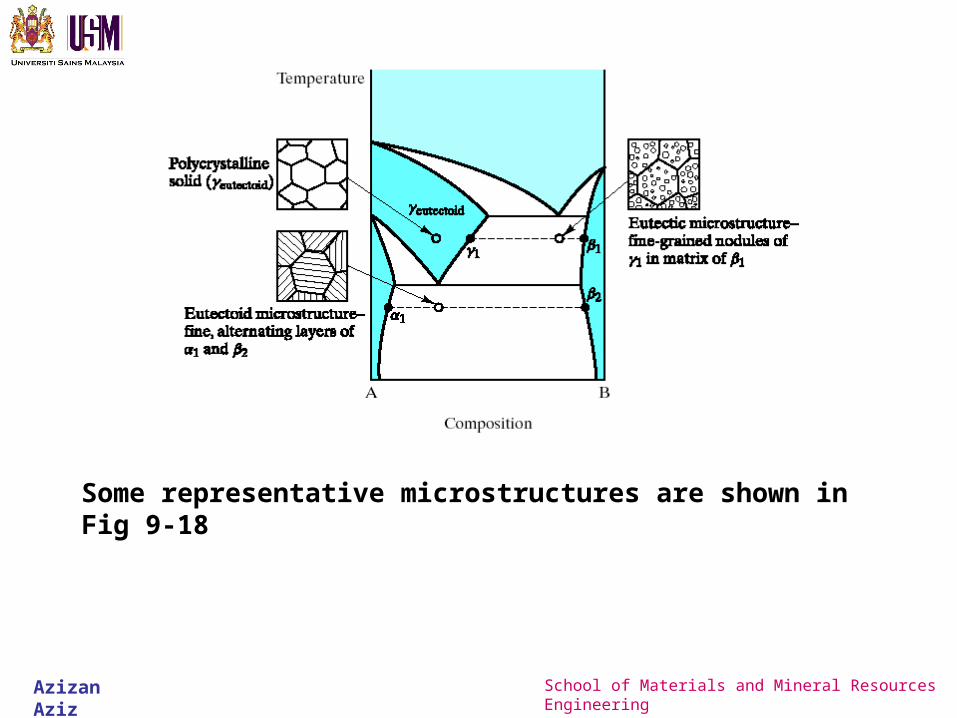
some representative microstructures for the binary eutectic system are shown in Fig above
fine-grained eutectic microstructure in which there are alternating layers of components, pure A and pure B
sharp solidification point of the eutectic composition generally leads to the fine-grained nature of the eutectic microstructure.
Even slow cooling solidification has to be fast .Hence limited time for diffusion – leading to fine-grained
Azizan Aziz School of Materials and Mineral Resources Engineering
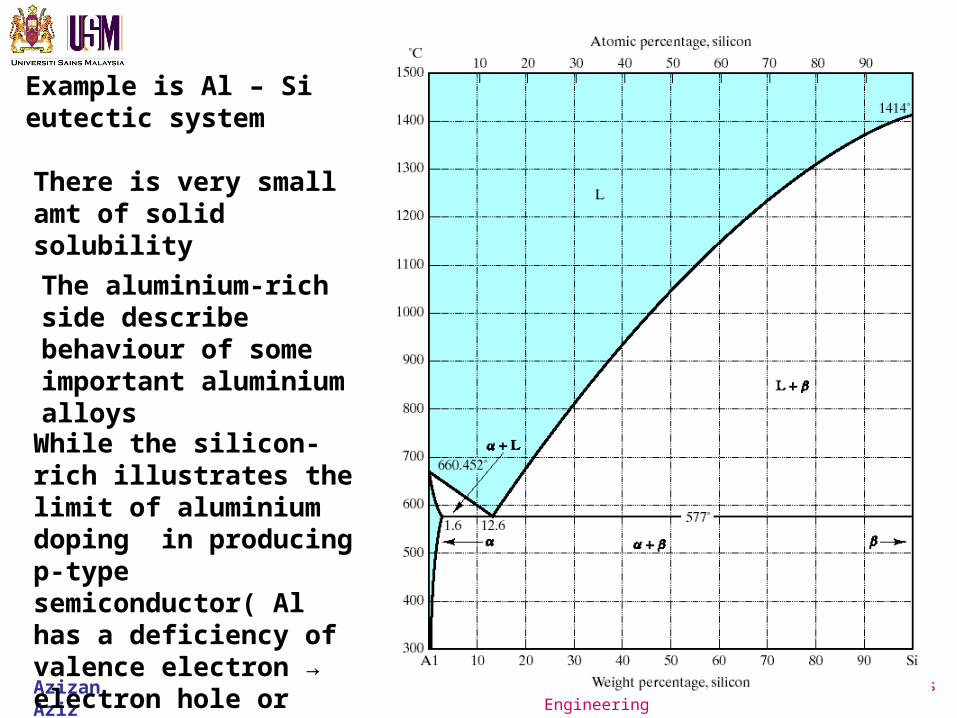
Example is Al – Si eutectic system
There is very small amt of solid solubility
The aluminium-rich side describe behaviour of some important aluminium alloys
While the silicon-rich illustrates the limit of aluminium doping in producing p-type semiconductor( Al has a deficiency of valence electron → electron hole or positive charge carrier.
Azizan Aziz School of Materials and Mineral Resources Engineering
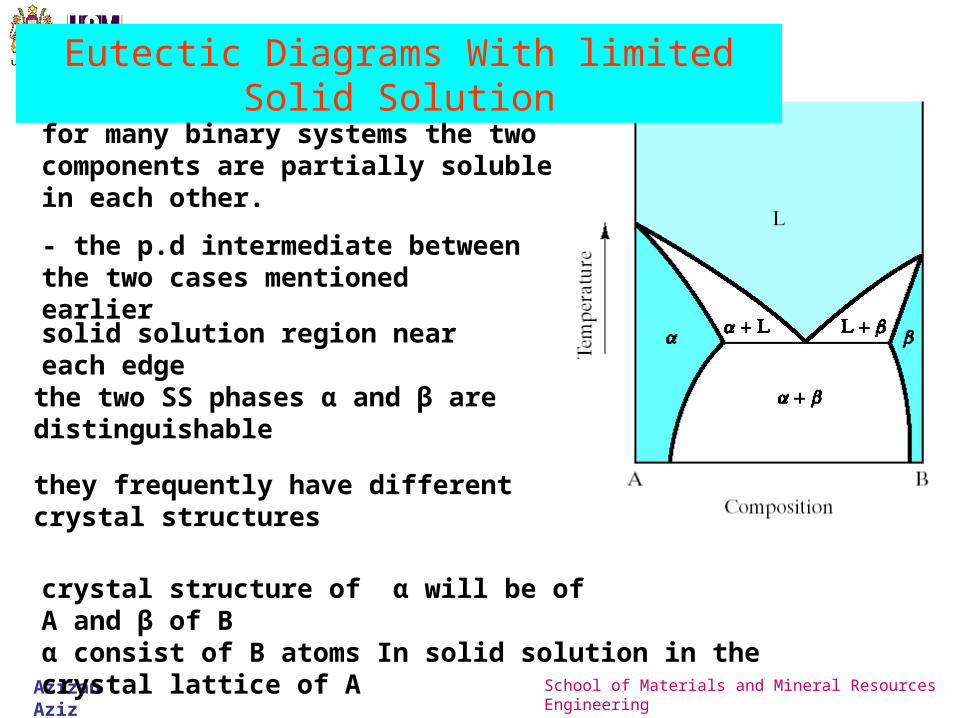
Eutectic Diagrams With limited Solid Solution
for many binary systems the two components are partially soluble in each other.
- the p.d intermediate between the two cases mentioned earlier
solid solution region near each edge
the two SS phases α and β are distinguishable
they frequently have different crystal structures
crystal structure of α will be of A and β of B
α consist of B atoms In solid solution in the crystal lattice of A
Azizan Aziz School of Materials and Mineral Resources Engineering
The Fig above represent the various microstructures
Azizan Aziz School of Materials and Mineral Resources Engineering
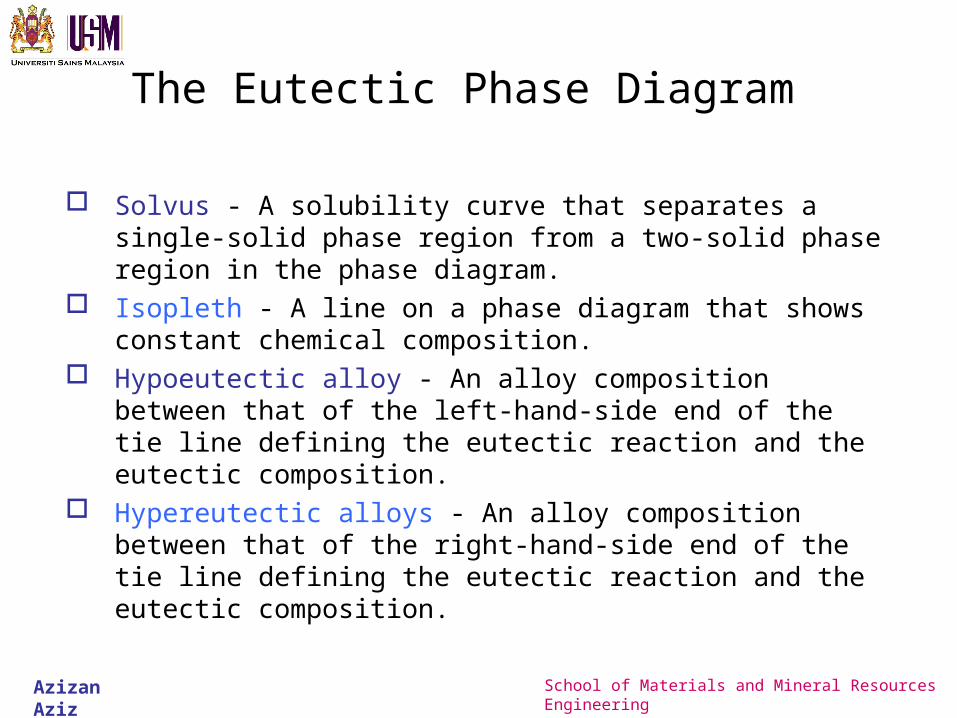
Solvus - A solubility curve that separates a single-solid phase region from a two-solid phase region in the phase diagram.
Isopleth - A line on a phase diagram that shows constant chemical composition.
Hypoeutectic alloy - An alloy composition between that of the left-hand-side end of the tie line defining the eutectic reaction and the eutectic composition.
Hypereutectic alloys - An alloy composition between that of the right-hand-side end of the tie line defining the eutectic reaction and the eutectic composition.
The Eutectic Phase Diagram
Azizan Aziz School of Materials and Mineral Resources Engineering
(c)2003 Brooks/Cole, a division of Thomson Learning, Inc. Thomson Learning™ is a trademark used herein under license.
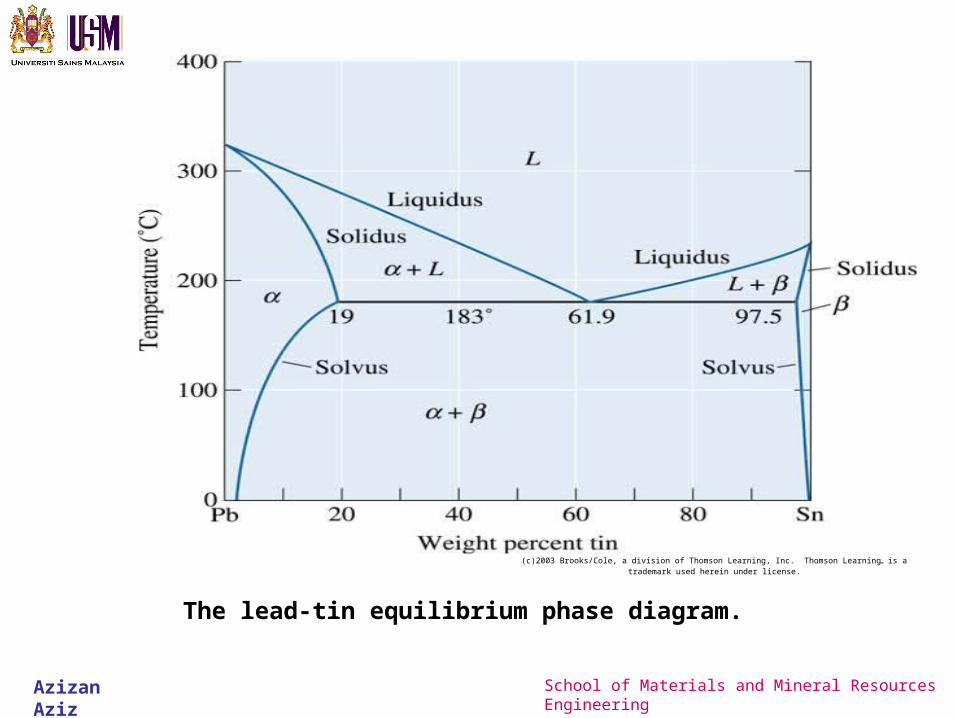
The lead-tin equilibrium phase diagram.
Azizan Aziz School of Materials and Mineral Resources Engineering
(c)2
003
Bro
oks/
Col
e, a
div
isio
n of
Tho
mso
n L
earn
ing,
Inc
. T
hom
son
Lea
rnin
g ™ is
a tr
adem
ark
used
her
ein
unde
r li
cens
e.
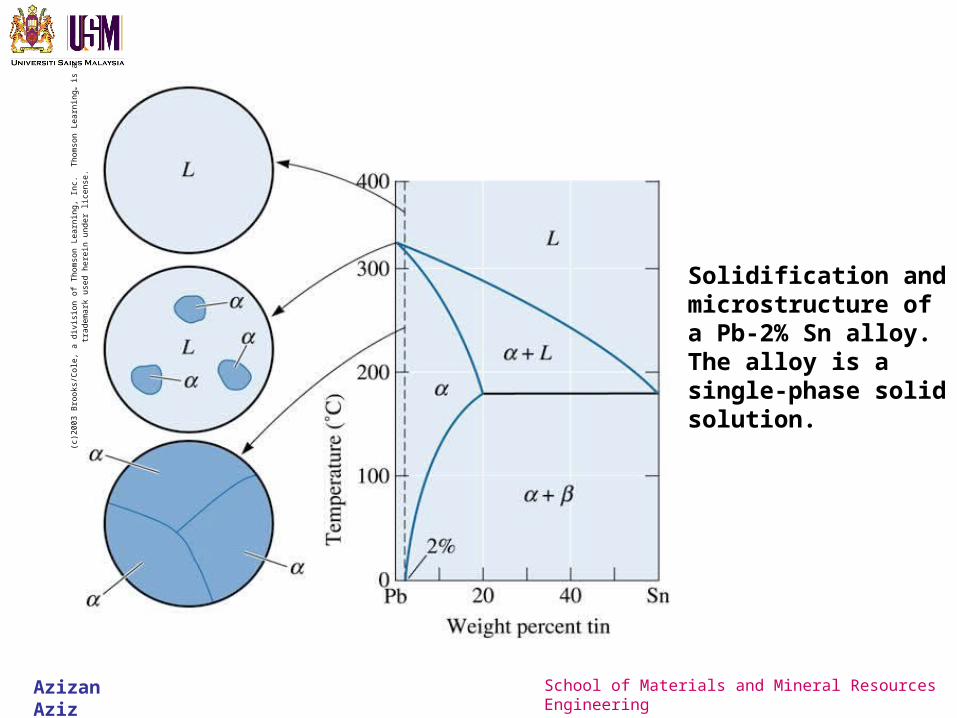
Solidification and microstructure of a Pb-2% Sn alloy. The alloy is a single-phase solid solution.
Azizan Aziz School of Materials and Mineral Resources Engineering
(c)2003 Brooks/Cole, a division of Thomson Learning, Inc. Thomson Learning™ is a trademark used herein under license.
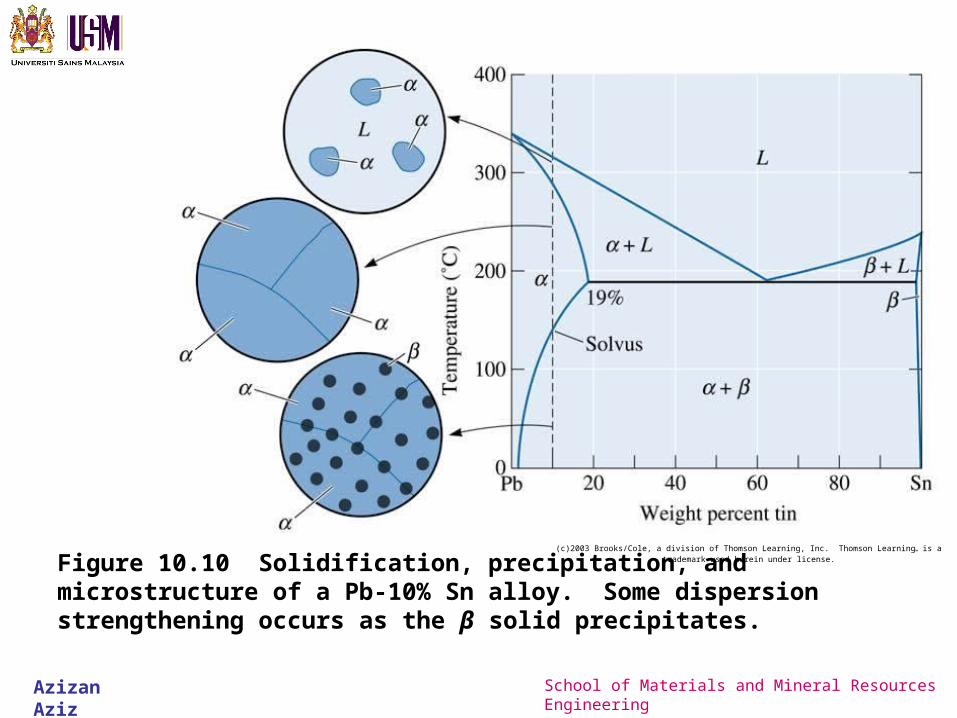
Figure 10.10 Solidification, precipitation, and microstructure of a Pb-10% Sn alloy. Some dispersion strengthening occurs as the β solid precipitates.
Azizan Aziz School of Materials and Mineral Resources Engineering
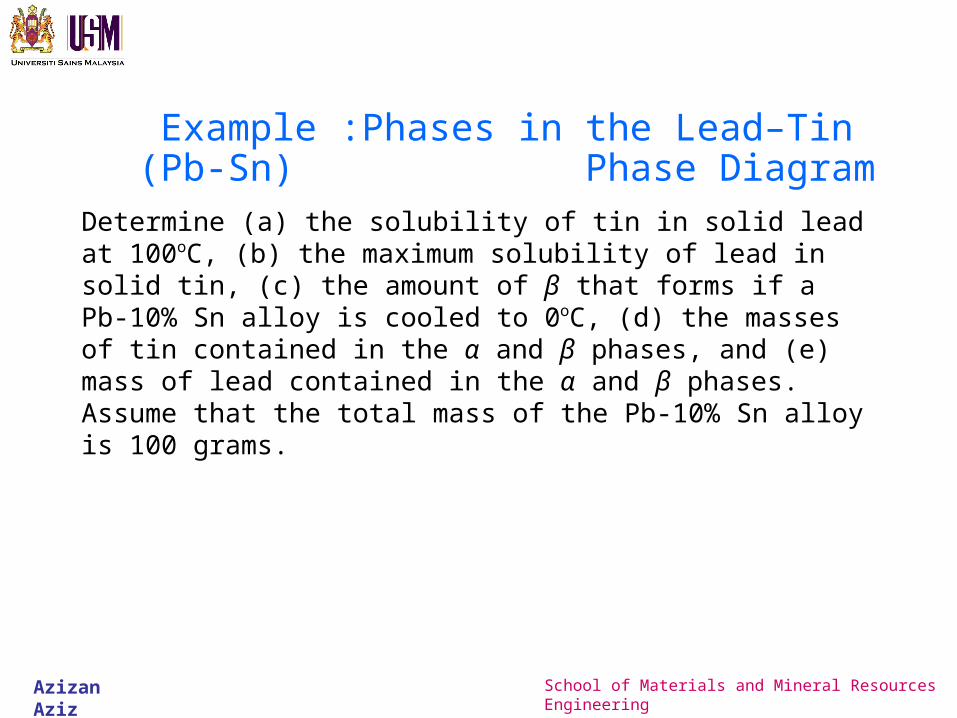
Determine (a) the solubility of tin in solid lead at 100oC, (b) the maximum solubility of lead in solid tin, (c) the amount of β that forms if a Pb-10% Sn alloy is cooled to 0oC, (d) the masses of tin contained in the α and β phases, and (e) mass of lead contained in the α and β phases. Assume that the total mass of the Pb-10% Sn alloy is 100 grams.
Example :Phases in the Lead–Tin (Pb-Sn) Phase Diagram
Azizan Aziz School of Materials and Mineral Resources Engineering
(c)2003 Brooks/Cole, a division of Thomson Learning, Inc. Thomson Learning™ is a trademark used herein under license.
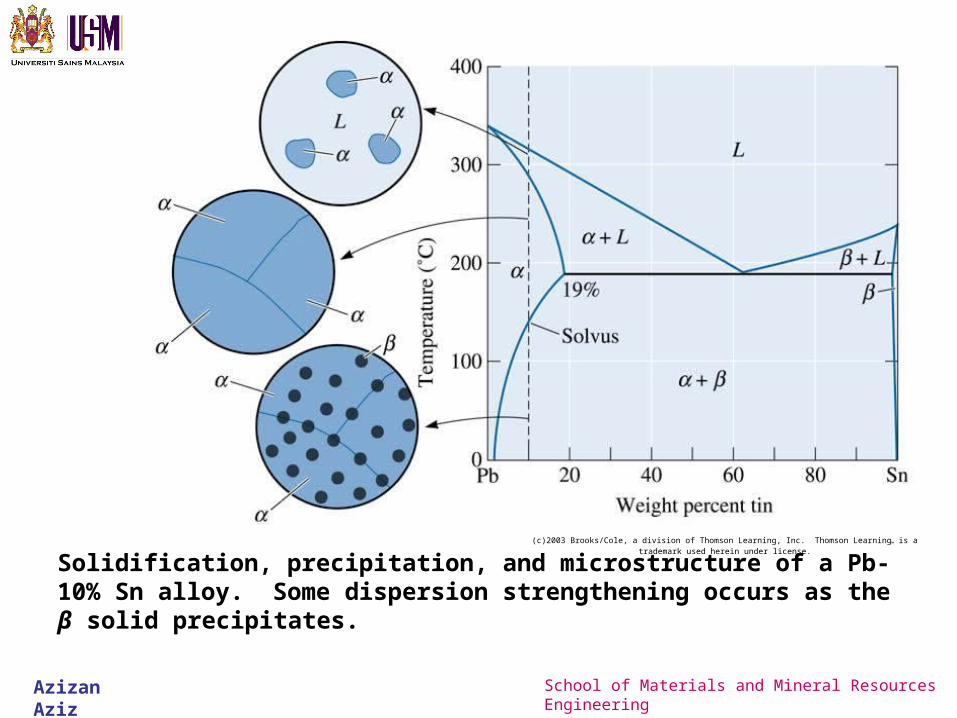
Solidification, precipitation, and microstructure of a Pb-10% Sn alloy. Some dispersion strengthening occurs as the β solid precipitates.
Azizan Aziz School of Materials and Mineral Resources Engineering
Example : SOLUTION
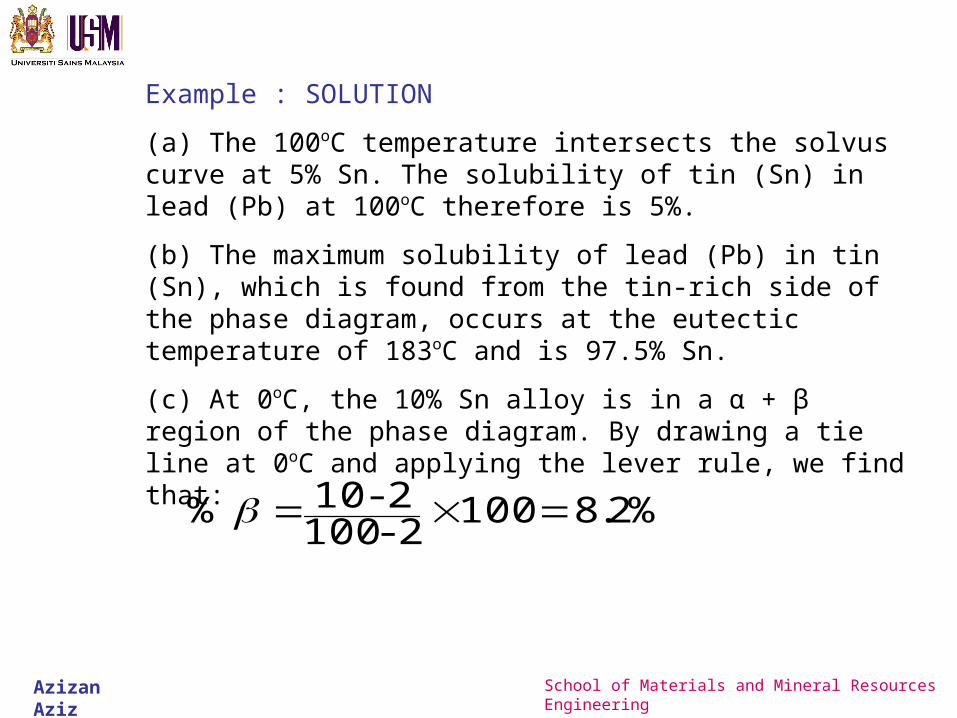
(a) The 100oC temperature intersects the solvus curve at 5% Sn. The solubility of tin (Sn) in lead (Pb) at 100oC therefore is 5%.
(b) The maximum solubility of lead (Pb) in tin (Sn), which is found from the tin-rich side of the phase diagram, occurs at the eutectic temperature of 183oC and is 97.5% Sn.
(c) At 0oC, the 10% Sn alloy is in a α + β region of the phase diagram. By drawing a tie line at 0oC and applying the lever rule, we find that:
%2.81002 - 1002 - 10 %
Azizan Aziz School of Materials and Mineral Resources Engineering
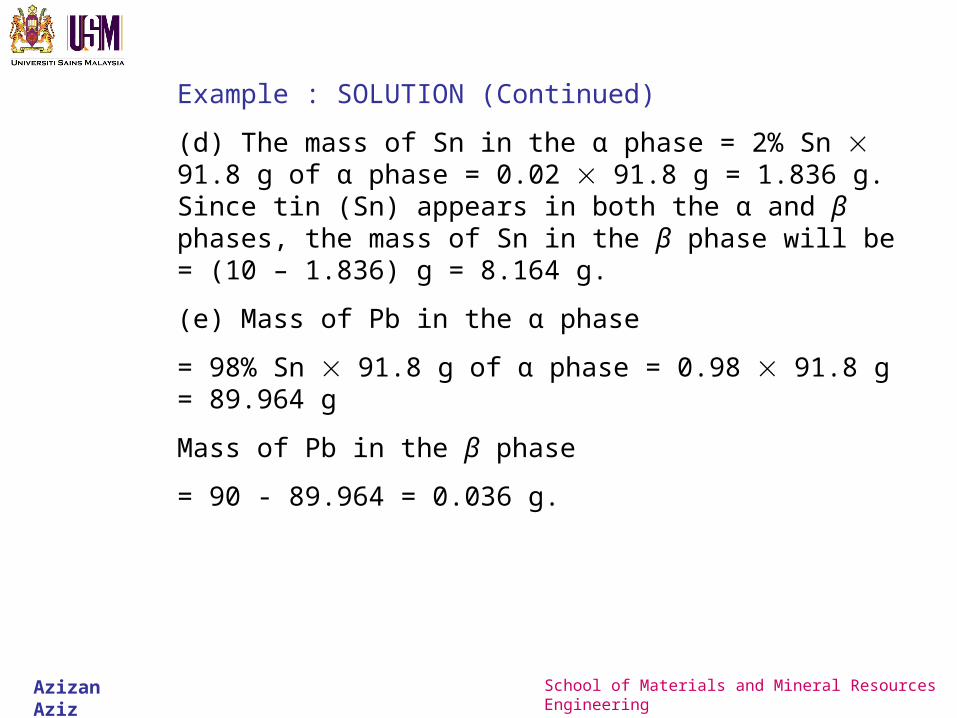
Example : SOLUTION (Continued)
(d) The mass of Sn in the α phase = 2% Sn 91.8 g of α phase = 0.02 91.8 g = 1.836 g. Since tin (Sn) appears in both the α and β phases, the mass of Sn in the β phase will be = (10 – 1.836) g = 8.164 g.
(e) Mass of Pb in the α phase
= 98% Sn 91.8 g of α phase = 0.98 91.8 g = 89.964 g
Mass of Pb in the β phase
= 90 - 89.964 = 0.036 g.
Azizan Aziz School of Materials and Mineral Resources Engineering
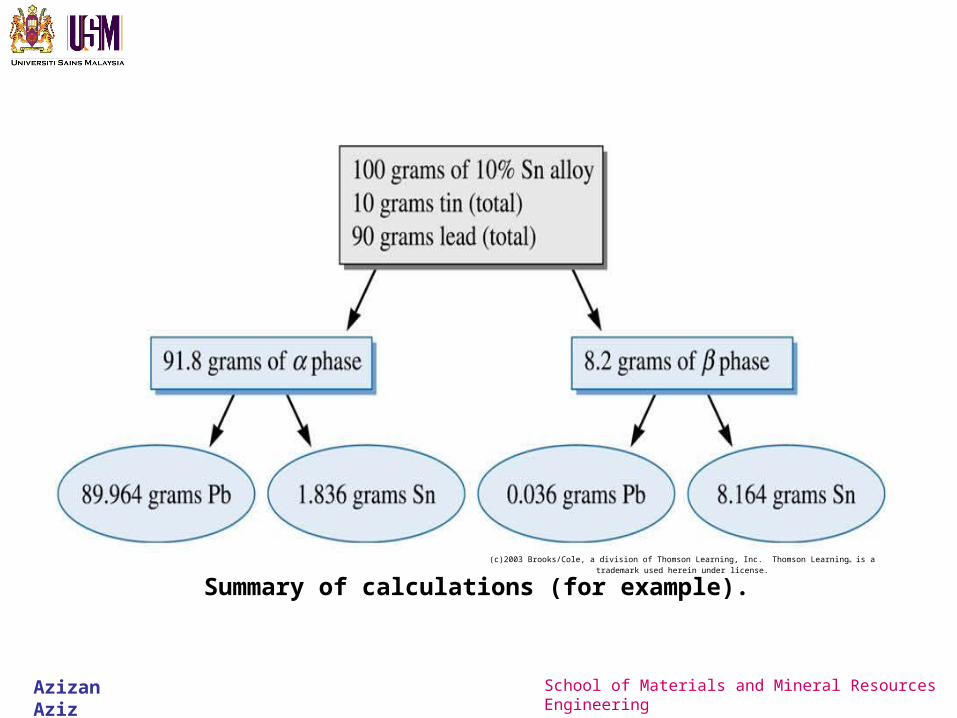
(c)2003 Brooks/Cole, a division of Thomson Learning, Inc. Thomson Learning™ is a trademark used herein under license.
Summary of calculations (for example).
Azizan Aziz School of Materials and Mineral Resources Engineering
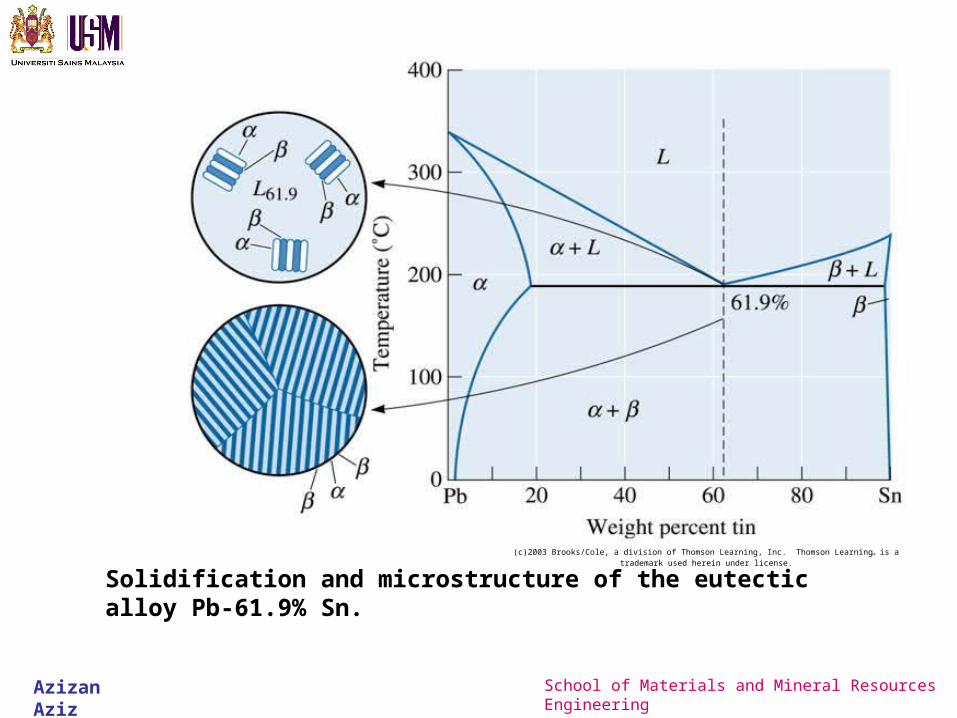
(c)2003 Brooks/Cole, a division of Thomson Learning, Inc. Thomson Learning™ is a trademark used herein under license.
Solidification and microstructure of the eutectic alloy Pb-61.9% Sn.
Azizan Aziz School of Materials and Mineral Resources Engineering
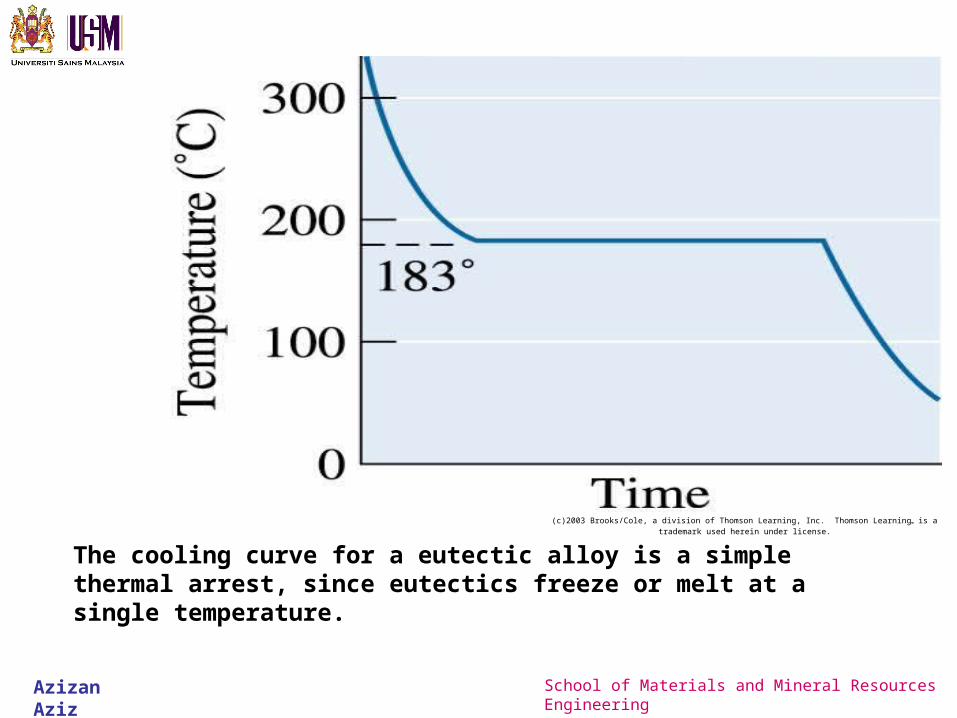
(c)2003 Brooks/Cole, a division of Thomson Learning, Inc. Thomson Learning™ is a trademark used herein under license.
The cooling curve for a eutectic alloy is a simple thermal arrest, since eutectics freeze or melt at a single temperature.
Azizan Aziz School of Materials and Mineral Resources Engineering
(c)2003 Brooks/Cole, a division of Thomson Learning, Inc. Thomson Learning™ is a trademark used herein under license.
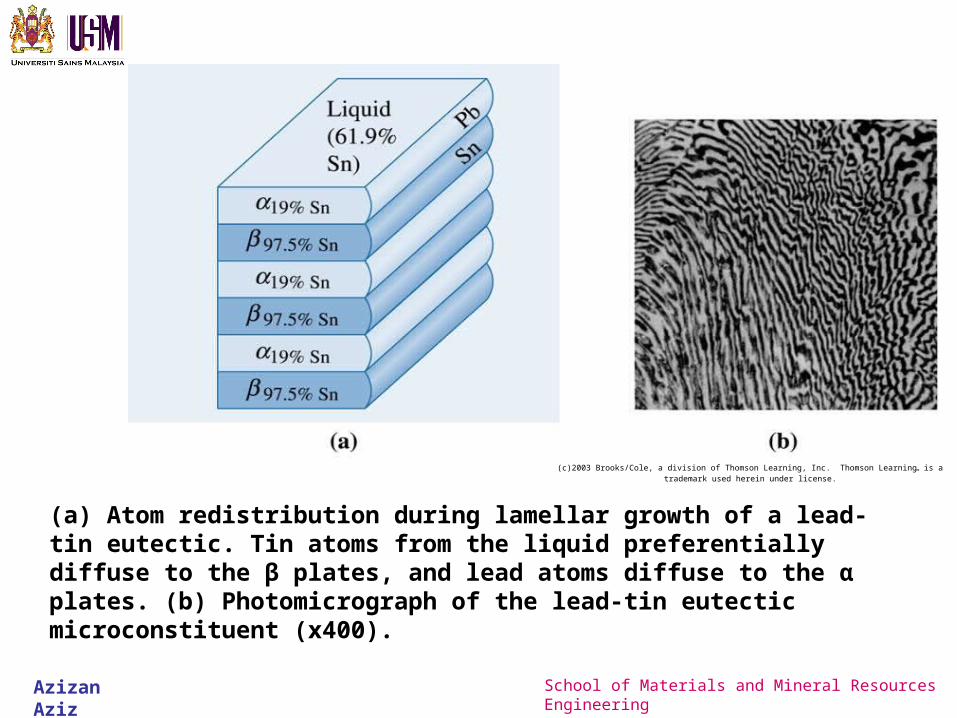
(a) Atom redistribution during lamellar growth of a lead-tin eutectic. Tin atoms from the liquid preferentially diffuse to the β plates, and lead atoms diffuse to the α plates. (b) Photomicrograph of the lead-tin eutectic microconstituent (x400).
Azizan Aziz School of Materials and Mineral Resources Engineering
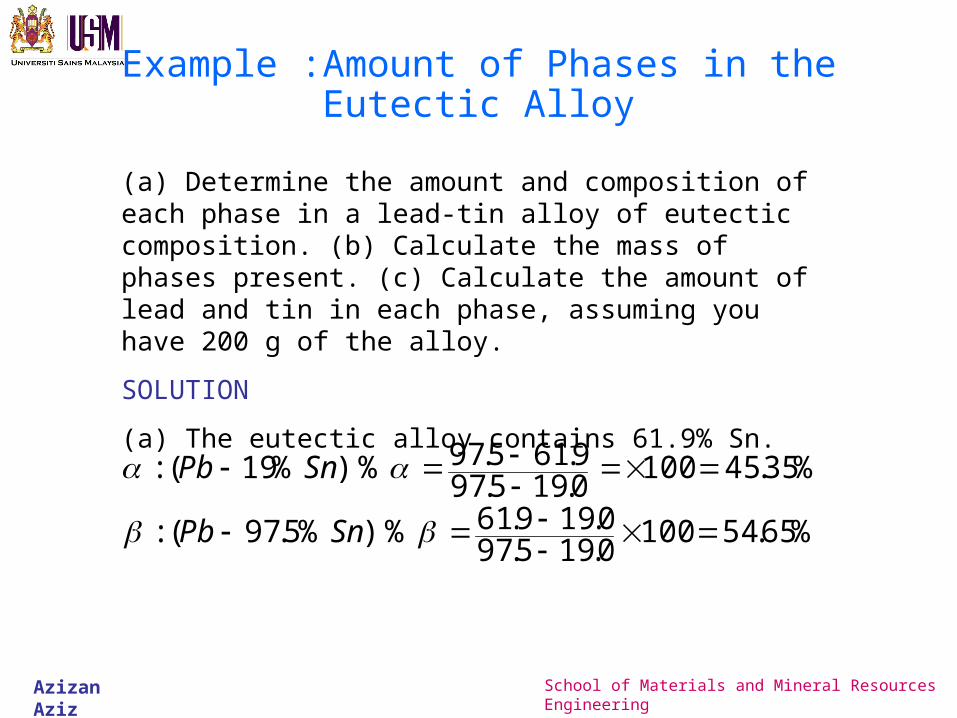
Example :Amount of Phases in the Eutectic Alloy
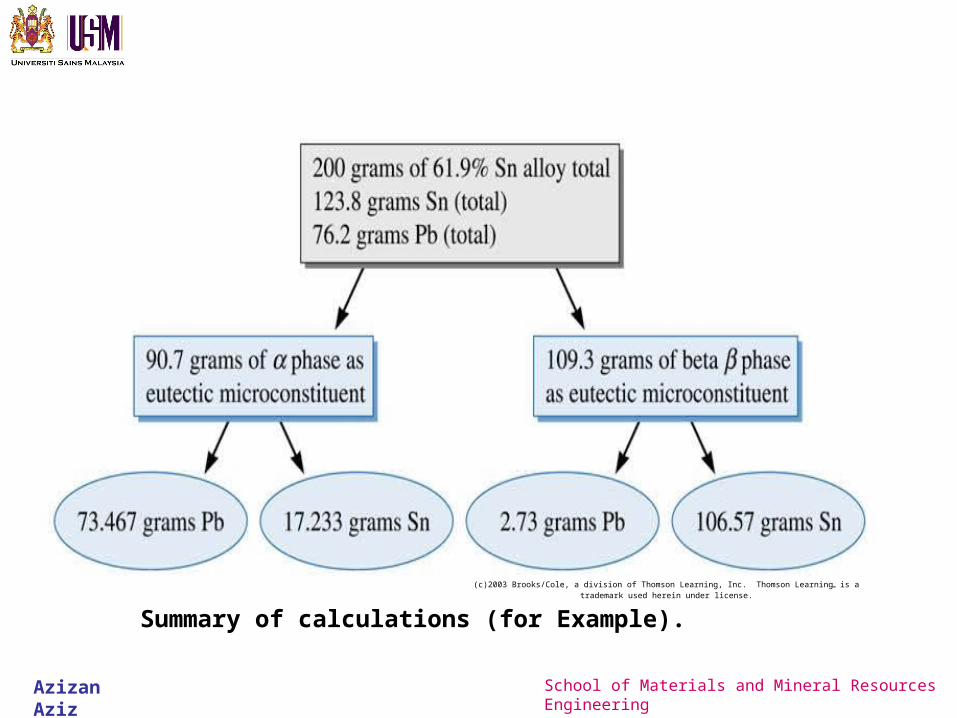
(a) Determine the amount and composition of each phase in a lead-tin alloy of eutectic composition. (b) Calculate the mass of phases present. (c) Calculate the amount of lead and tin in each phase, assuming you have 200 g of the alloy.
SOLUTION
(a) The eutectic alloy contains 61.9% Sn.
%65.541000.195.970.199.61 % ) %5.97(:
%35.451000.195.979.615.97 % ) %19(:
SnPb
SnPb
Azizan Aziz School of Materials and Mineral Resources Engineering
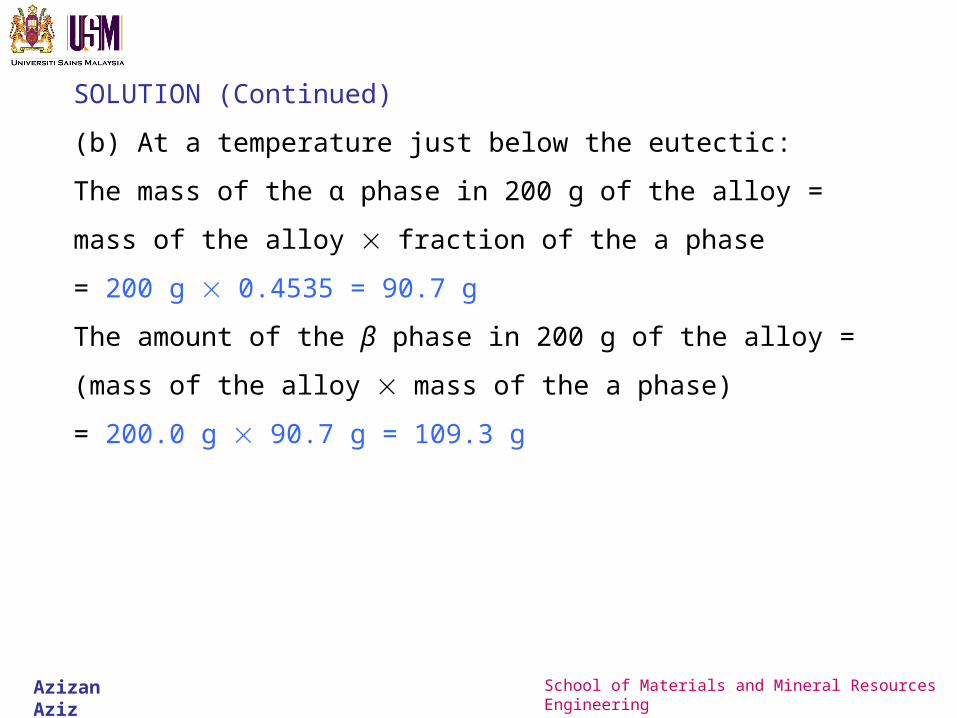
SOLUTION (Continued)
(b) At a temperature just below the eutectic:
The mass of the α phase in 200 g of the alloy =
mass of the alloy fraction of the a phase
= 200 g 0.4535 = 90.7 g
The amount of the β phase in 200 g of the alloy =
(mass of the alloy mass of the a phase)
= 200.0 g 90.7 g = 109.3 g
Azizan Aziz School of Materials and Mineral Resources Engineering
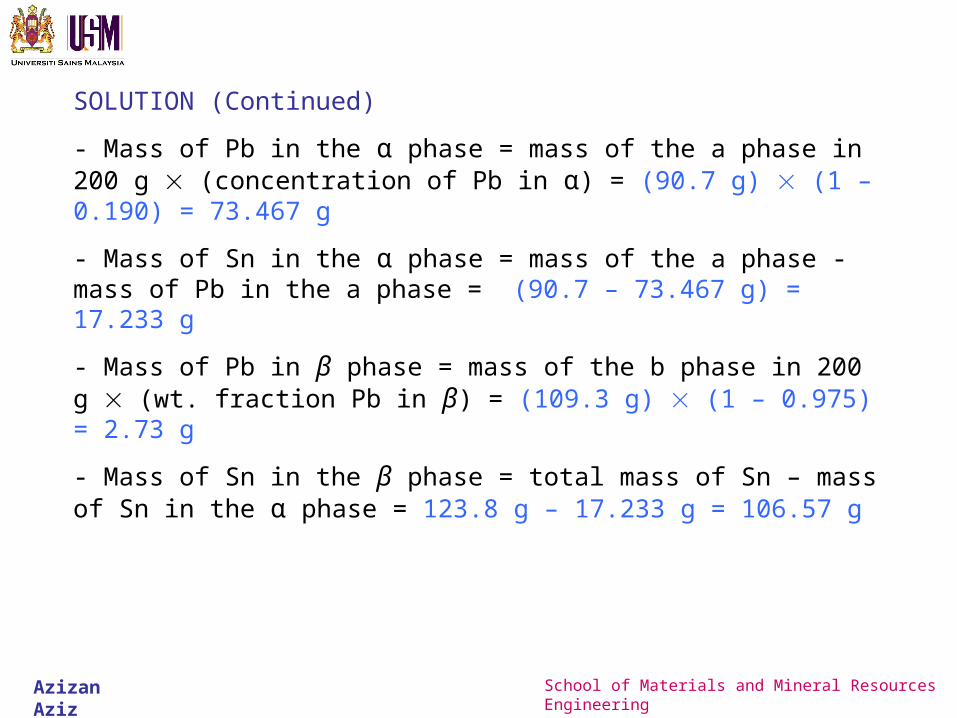
SOLUTION (Continued)
- Mass of Pb in the α phase = mass of the a phase in 200 g (concentration of Pb in α) = (90.7 g) (1 – 0.190) = 73.467 g
- Mass of Sn in the α phase = mass of the a phase - mass of Pb in the a phase = (90.7 – 73.467 g) = 17.233 g
- Mass of Pb in β phase = mass of the b phase in 200 g (wt. fraction Pb in β) = (109.3 g) (1 – 0.975) = 2.73 g
- Mass of Sn in the β phase = total mass of Sn – mass of Sn in the α phase = 123.8 g – 17.233 g = 106.57 g
Azizan Aziz School of Materials and Mineral Resources Engineering
(c)2003 Brooks/Cole, a division of Thomson Learning, Inc. Thomson Learning™ is a trademark used herein under license.
Summary of calculations (for Example).
Azizan Aziz School of Materials and Mineral Resources Engineering
(c)2003 Brooks/Cole, a division of Thomson Learning, Inc. Thomson Learning™ is a trademark used herein under license.
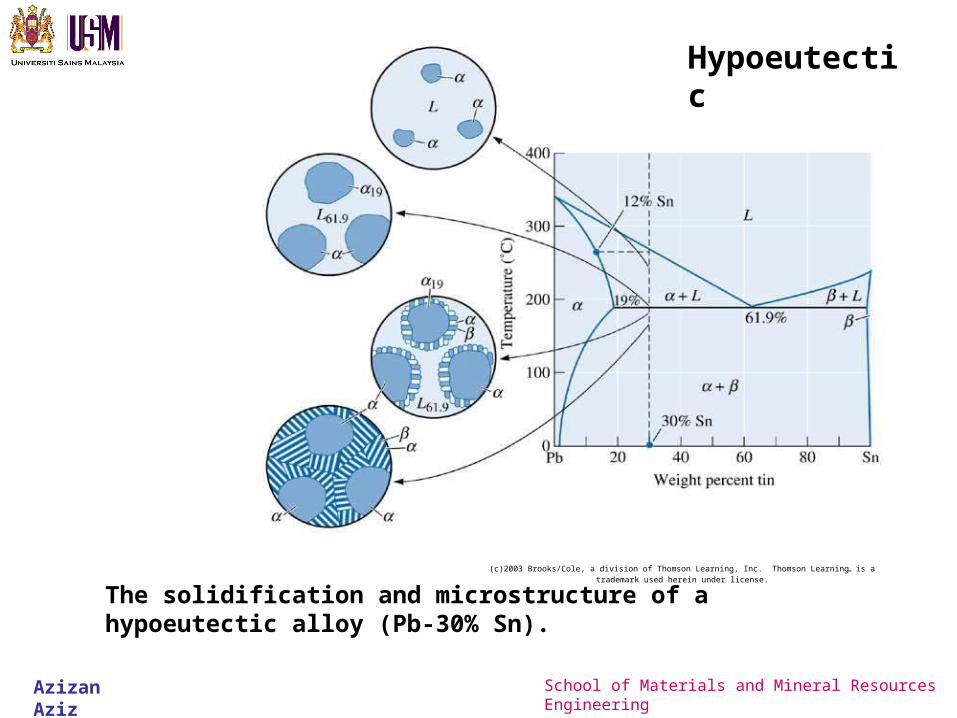
The solidification and microstructure of a hypoeutectic alloy (Pb-30% Sn).
Hypoeutectic
Azizan Aziz School of Materials and Mineral Resources Engineering
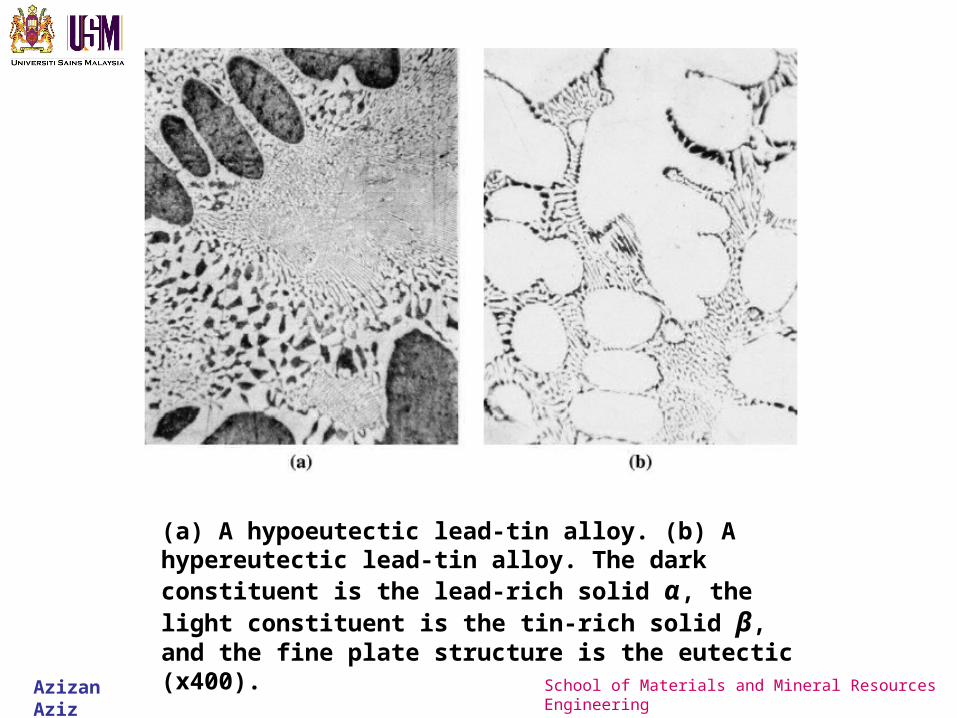
(a) A hypoeutectic lead-tin alloy. (b) A hypereutectic lead-tin alloy. The dark constituent is the lead-rich solid α, the light constituent is the tin-rich solid β, and the fine plate structure is the eutectic (x400).
Azizan Aziz School of Materials and Mineral Resources Engineering
Example :Determination of Phases and Amounts in a Pb-30% Sn Hypoeutectic
Alloy
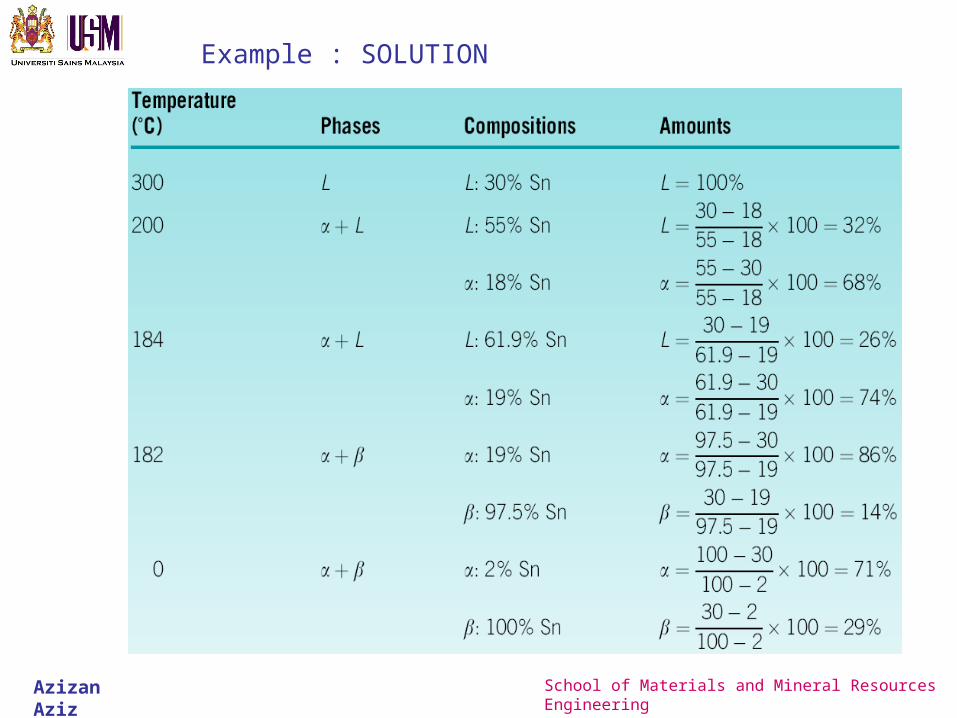
For a Pb-30% Sn alloy, determine the phases present, their amounts, and their compositions at 300oC, 200oC, 184oC, 182oC, and 0oC.
Azizan Aziz School of Materials and Mineral Resources Engineering
Example : SOLUTION
Azizan Aziz School of Materials and Mineral Resources Engineering
Example :Microconstituent Amount and Composition for a Hypoeutectic Alloy
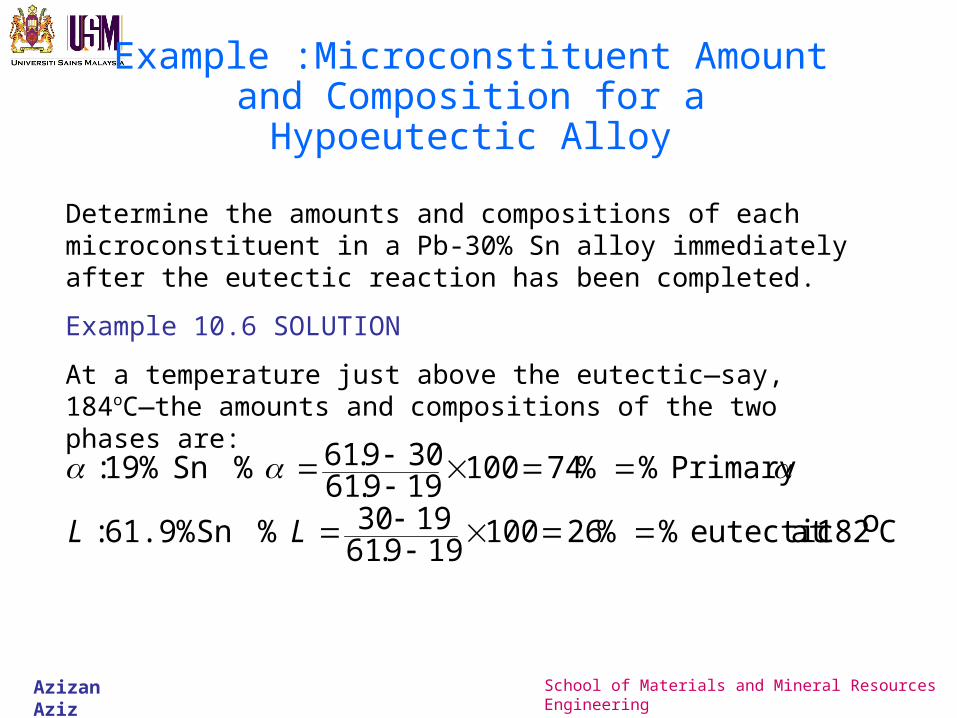
Determine the amounts and compositions of each microconstituent in a Pb-30% Sn alloy immediately after the eutectic reaction has been completed.
Example 10.6 SOLUTION
At a temperature just above the eutectic—say, 184oC—the amounts and compositions of the two phases are:
Co182at eutectic %%26100199.61
1930 %Sn 61.9% :
Primary %%74100199.61309.61 %Sn 19% :
LL
Azizan Aziz School of Materials and Mineral Resources Engineering
(c)2003 Brooks/Cole, a division of Thomson Learning, Inc. Thomson Learning™ is a trademark used herein under license.
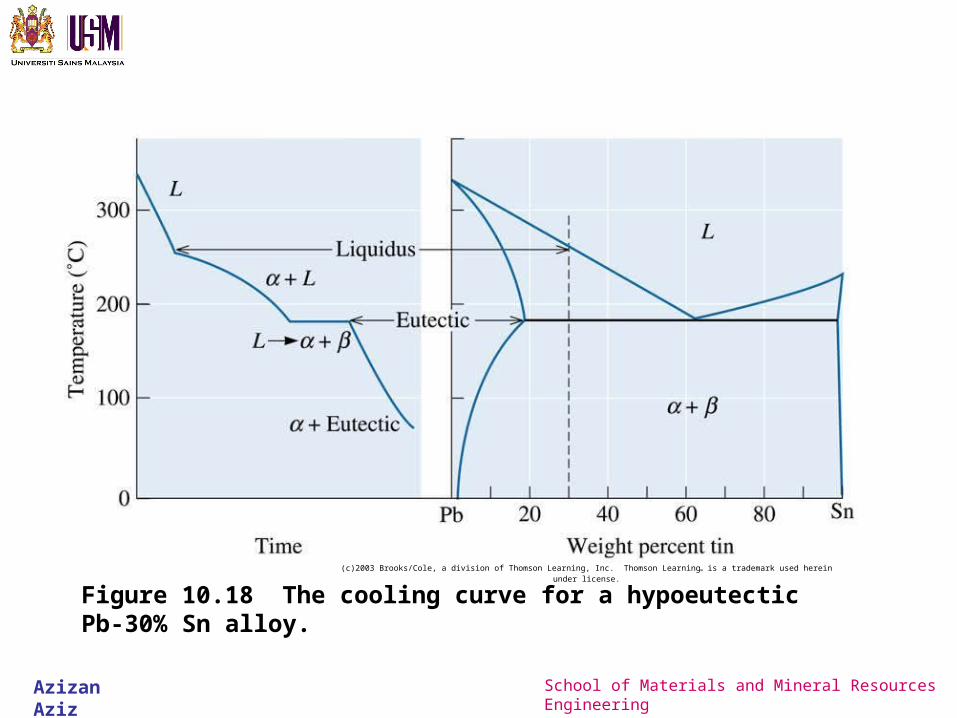
Figure 10.18 The cooling curve for a hypoeutectic Pb-30% Sn alloy.
Azizan Aziz School of Materials and Mineral Resources Engineering
Nonequilibrium Freezing in the Eutectic System
(c)2
003
Bro
oks/
Col
e, a
div
isio
n of
Tho
mso
n L
earn
ing,
Inc
. T
hom
son
Lea
rnin
g ™ is
a tr
adem
ark
used
her
ein
unde
r li
cens
e.
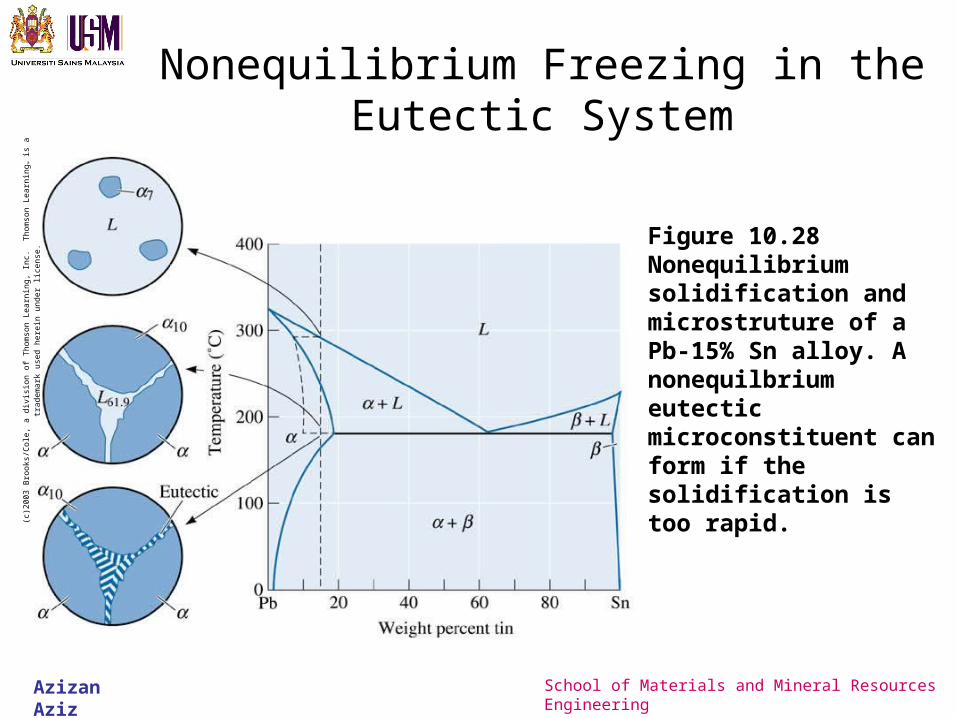
Figure 10.28 Nonequilibrium solidification and microstruture of a Pb-15% Sn alloy. A nonequilbrium eutectic microconstituent can form if the solidification is too rapid.
Azizan Aziz School of Materials and Mineral Resources Engineering
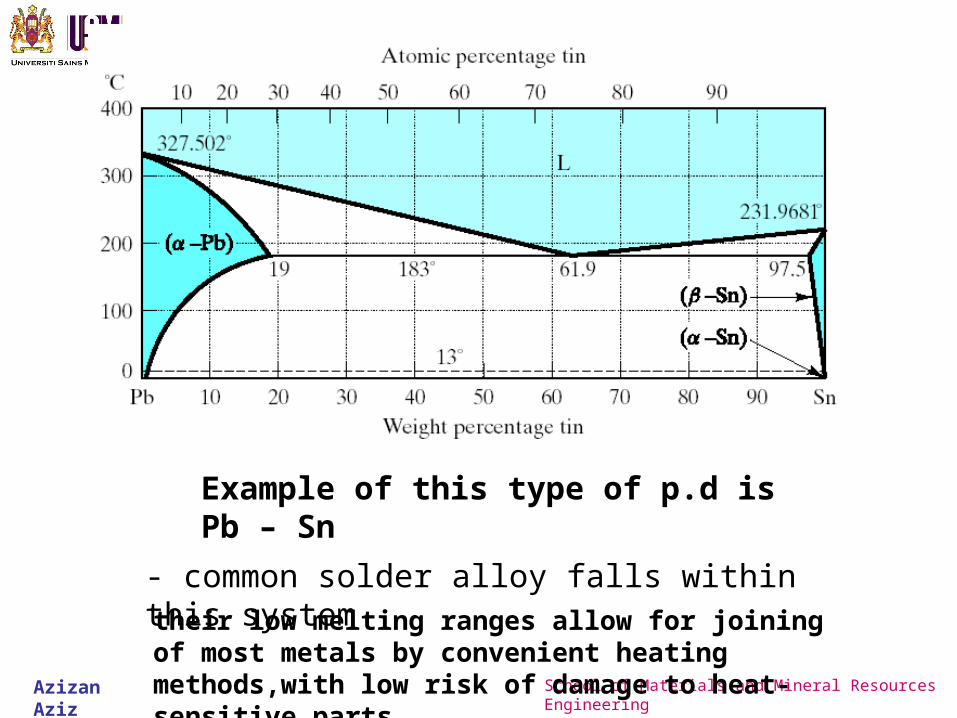
Example of this type of p.d is Pb – Sn
- common solder alloy falls within this system their low melting ranges allow for joining of most metals by convenient heating methods,with low risk of damage to heat-sensitive parts
Azizan Aziz School of Materials and Mineral Resources Engineering
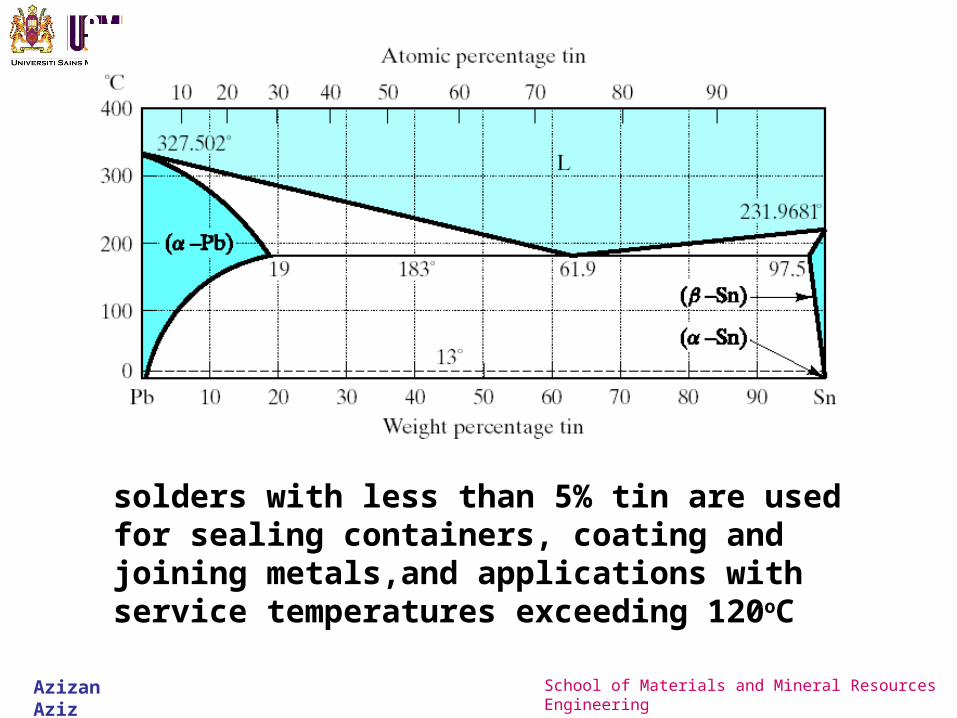
solders with less than 5% tin are used for sealing containers, coating and joining metals,and applications with service temperatures exceeding 120oC
Azizan Aziz School of Materials and Mineral Resources Engineering
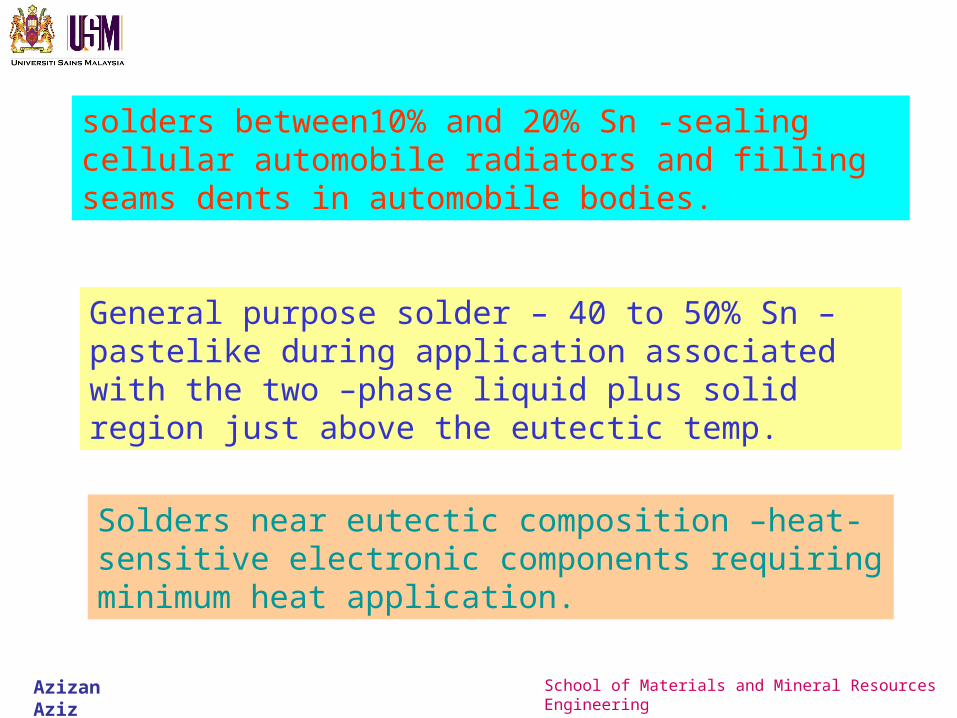
solders between10% and 20% Sn -sealing cellular automobile radiators and filling seams dents in automobile bodies.
General purpose solder – 40 to 50% Sn –pastelike during application associated with the two –phase liquid plus solid region just above the eutectic temp.
Solders near eutectic composition –heat- sensitive electronic components requiring minimum heat application.
Azizan Aziz School of Materials and Mineral Resources Engineering
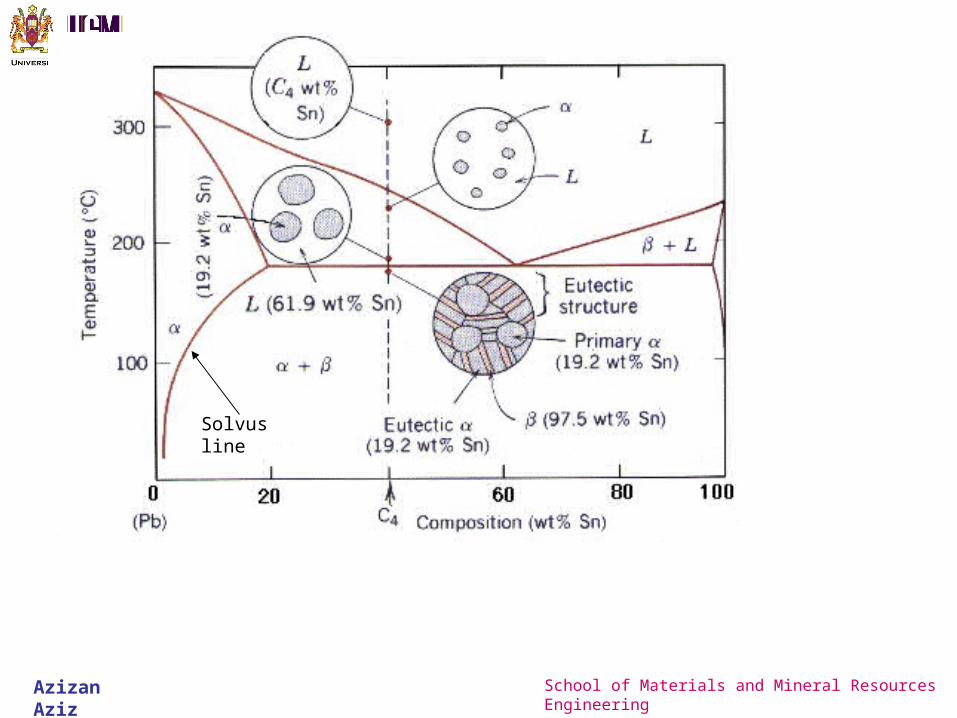
Solvus line
Azizan Aziz School of Materials and Mineral Resources Engineering
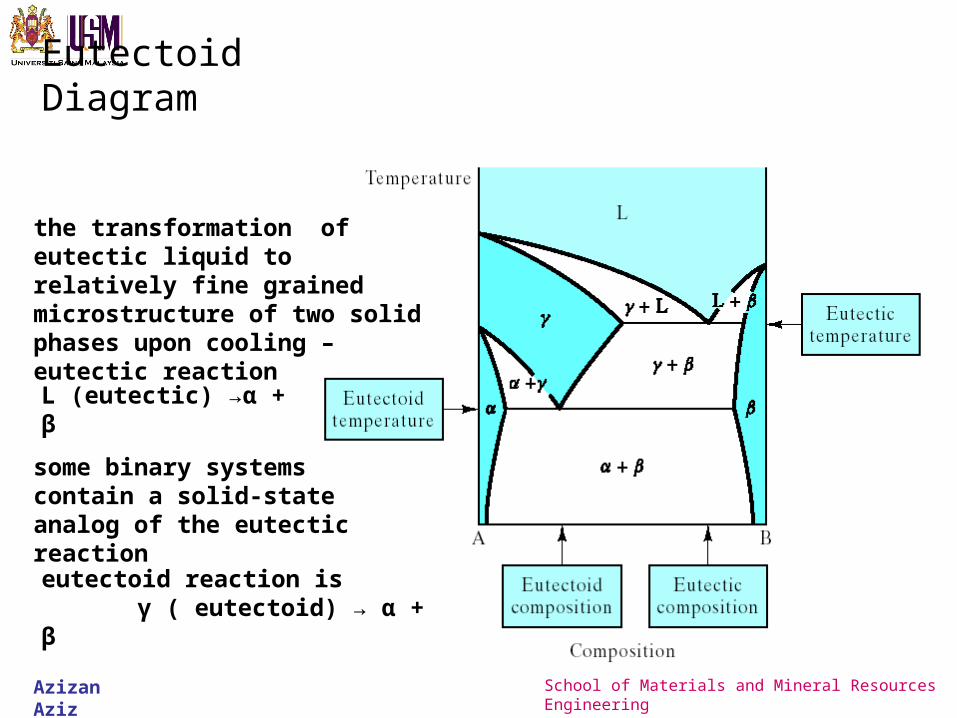
Eutectoid Diagram
the transformation of eutectic liquid to relatively fine grained microstructure of two solid phases upon cooling – eutectic reaction
L (eutectic) →α + β
some binary systems contain a solid-state analog of the eutectic reaction
eutectoid reaction is γ ( eutectoid) → α + β
Azizan Aziz School of Materials and Mineral Resources Engineering
Some representative microstructures are shown in Fig 9-18
Azizan Aziz School of Materials and Mineral Resources Engineering
Azizan Aziz School of Materials and Mineral Resources Engineering
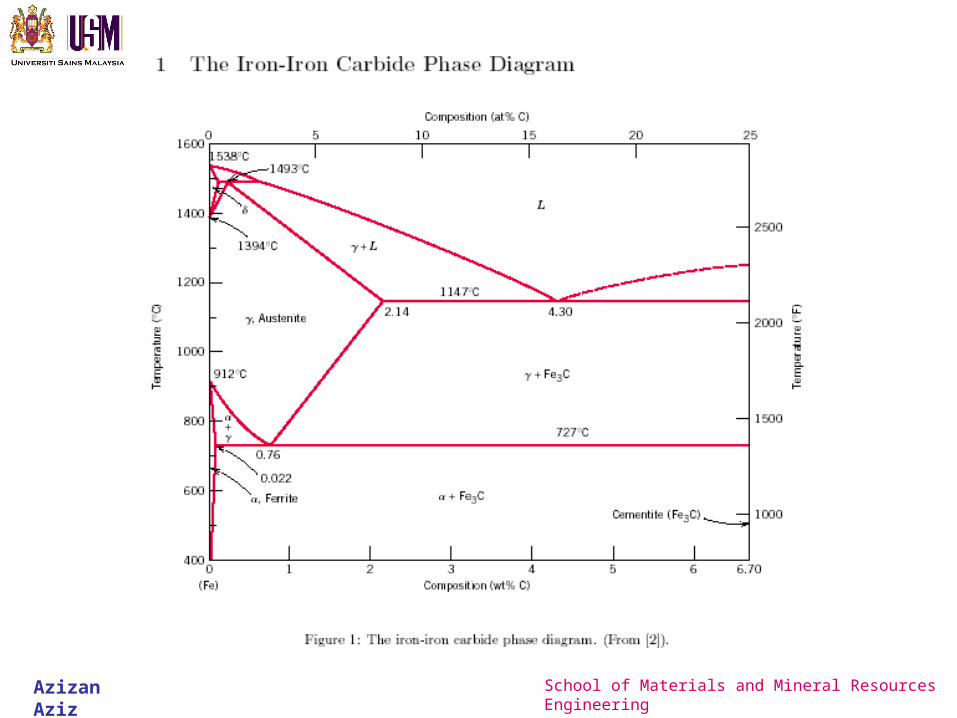
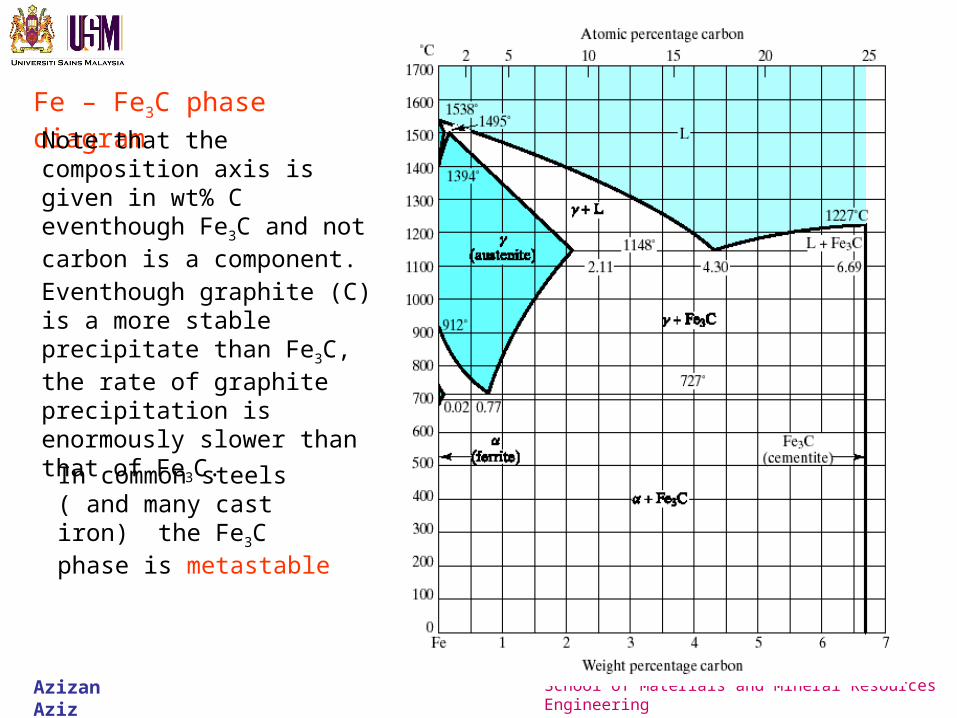
The Fe-Fe3C system –most important commercial phase diagram
Provides the major scientific basis for iron and steel industry
The boundary bet. Iron & steel will be identified as a carbon content of 2.0 wt%.
Roughly corresponds to the carbon solubility limit in the austenite γ phase
The most important areas of interest on this diagram around the eutectic and eutectoid rxns
Azizan Aziz School of Materials and Mineral Resources Engineering
Fe – Fe3C phase diagram
Note that the composition axis is given in wt% C eventhough Fe3C and not carbon is a component.
Eventhough graphite (C) is a more stable precipitate than Fe3C, the rate of graphite precipitation is enormously slower than that of Fe3C.
In common steels ( and many cast iron) the Fe3C phase is metastable
Azizan Aziz School of Materials and Mineral Resources Engineering
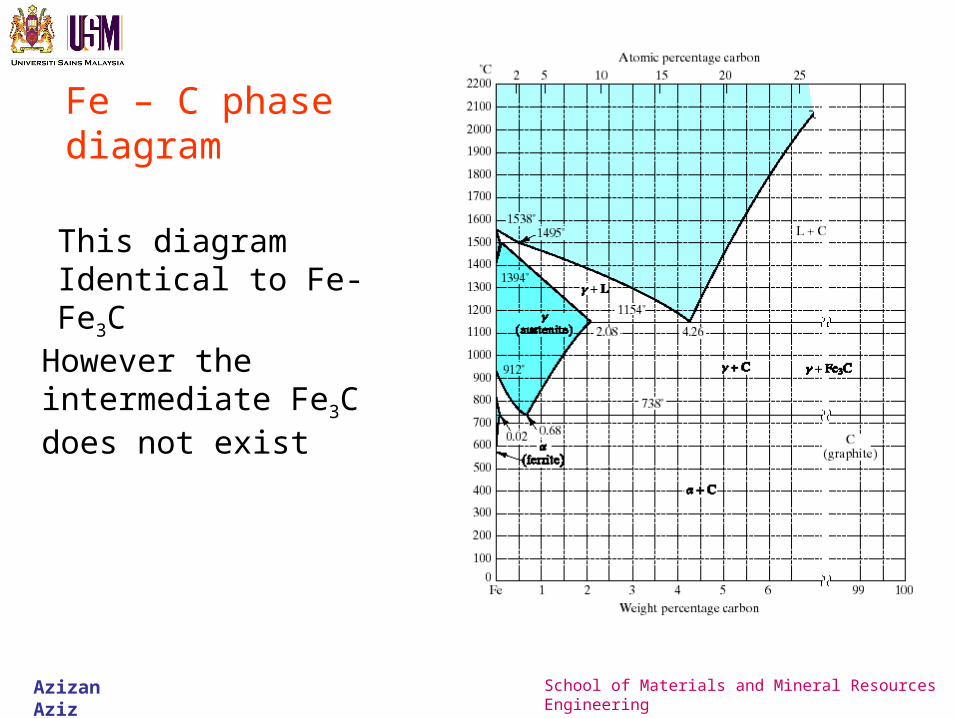
Fe – C phase diagram
This diagram Identical to Fe-Fe3C
However the intermediate Fe3C does not exist
Azizan Aziz School of Materials and Mineral Resources Engineering
PERITECTIC DIAGRAMOn heating, solid transform to liquid and another solid phase.
This is known as peritectic rxn
δ + L → ε ( on heating)
δ + L ← ε ( on cooling)
The peritectic rxn is another invariant rxn involving 3 phases at equilibrium
Azizan Aziz School of Materials and Mineral Resources Engineering
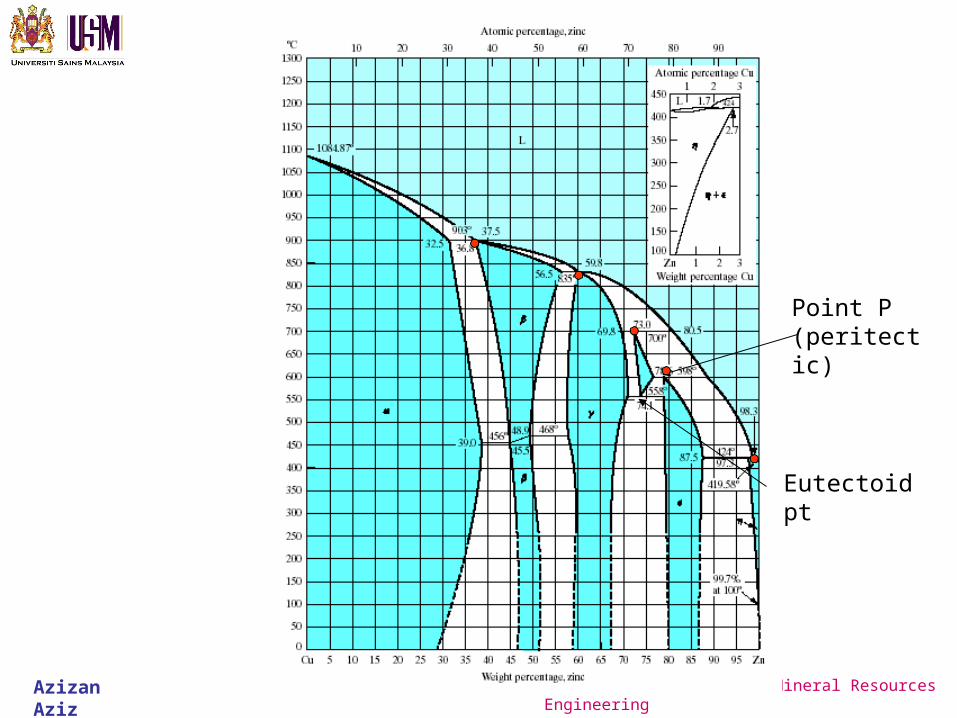
Referring to Cu-Zn system
A peritectic exist for this system (pt P) at 598oC and 78.6 wt%Zn – 21.4 wt%Cu.
There are altogether 5 peritectics in the Cu-Zn system
They involve intermediate solid solutions as low –temp phases that transform upon heating.
Azizan Aziz School of Materials and Mineral Resources Engineering
Point P (peritectic)
Eutectoid pt
Azizan Aziz School of Materials and Mineral Resources Engineering
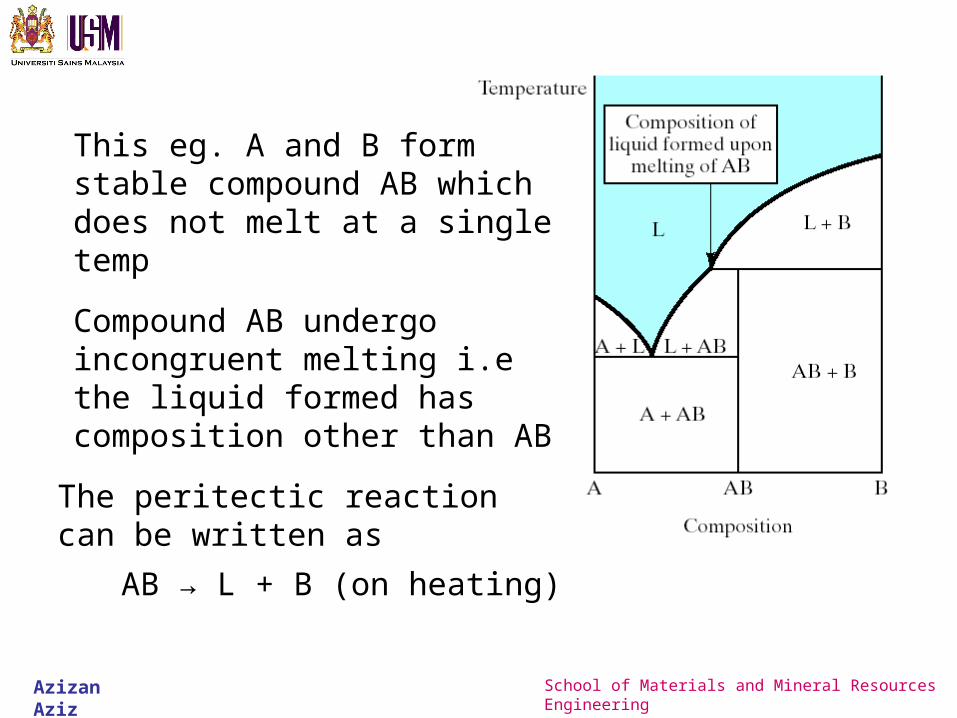
This eg. A and B form stable compound AB which does not melt at a single temp
Compound AB undergo incongruent melting i.e the liquid formed has composition other than AB
The peritectic reaction can be written as
AB → L + B (on heating)
Azizan Aziz School of Materials and Mineral Resources Engineering
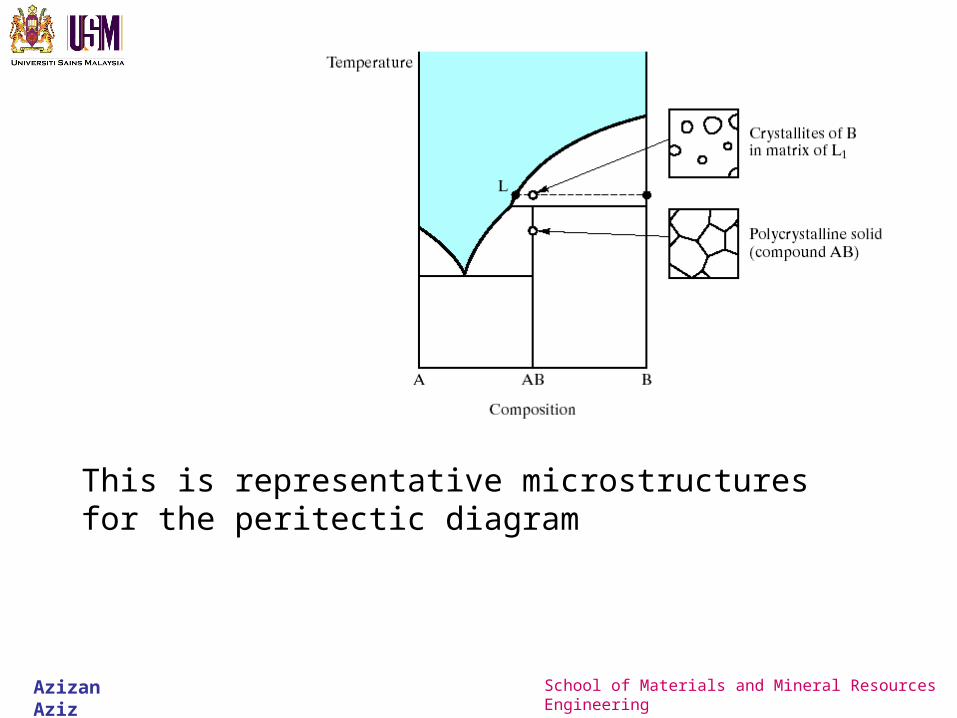
This is representative microstructures for the peritectic diagram
Azizan Aziz School of Materials and Mineral Resources Engineering
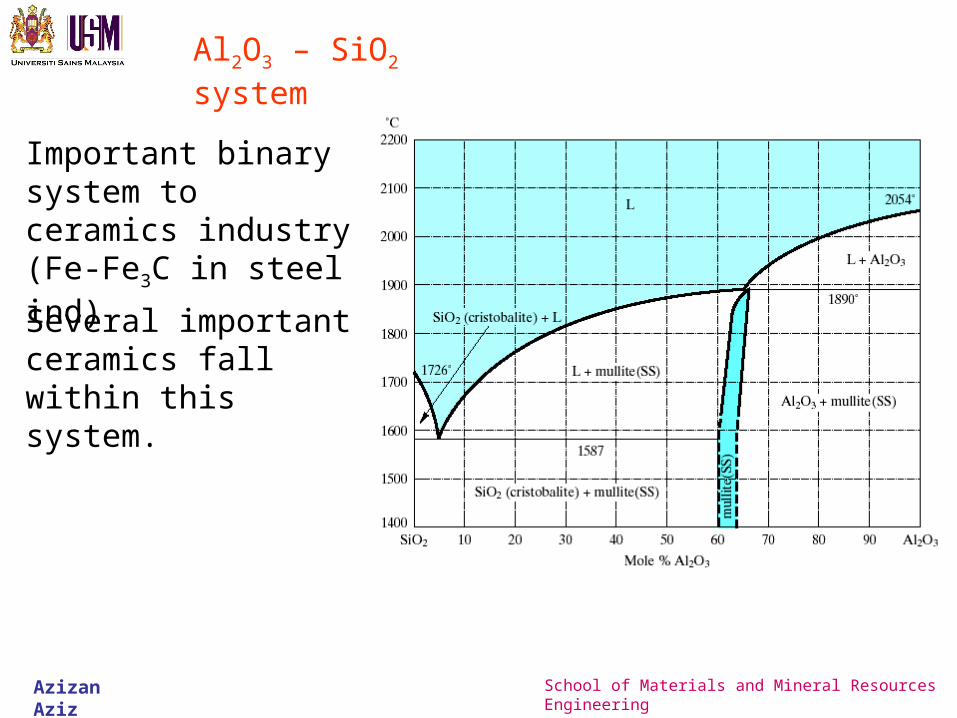
Al2O3 – SiO2 system
Important binary system to ceramics industry (Fe-Fe3C in steel ind)
Several important ceramics fall within this system.
Azizan Aziz School of Materials and Mineral Resources Engineering
Refractory silica bricks are nearly pure SiO2 having 0.1-0.6 mol% Al2O3.
For silica bricks operating at above 1600oC . Need to keep Al2O3 content as low as possible to minimize the amount of liq. phase
Common fireclay refractories having 16 – 32 mol% Al2O3
Their usefulness as structural elements in furnace limited by the solidus(eutectic) temperatures at 1587
Azizan Aziz School of Materials and Mineral Resources Engineering
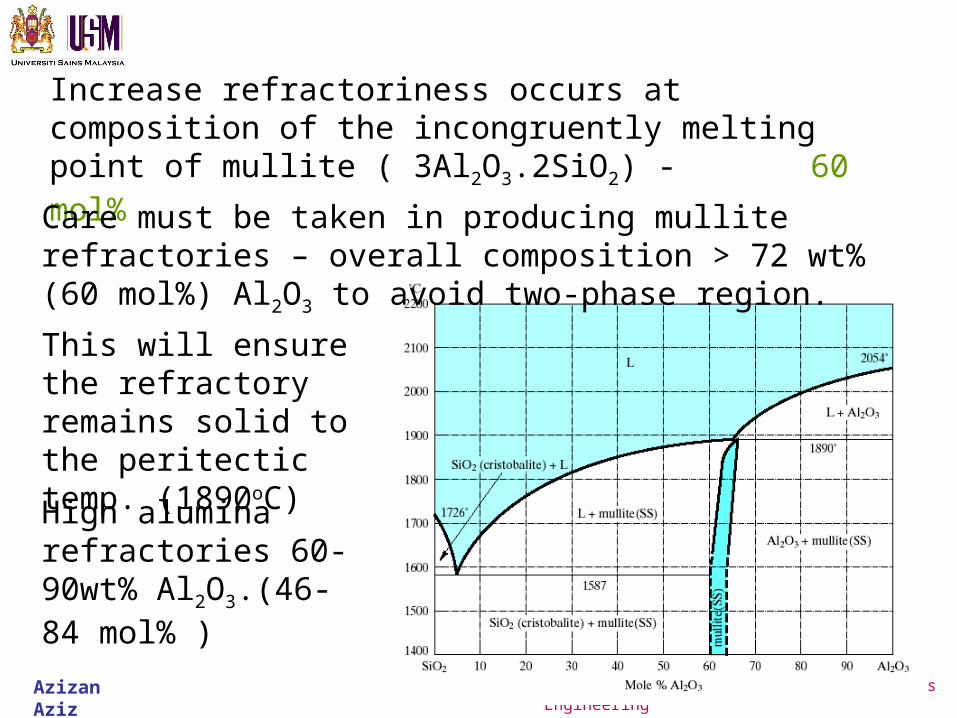
Increase refractoriness occurs at composition of the incongruently melting point of mullite ( 3Al2O3.2SiO2) - 60 mol%
Care must be taken in producing mullite refractories – overall composition > 72 wt% (60 mol%) Al2O3 to avoid two-phase region.
This will ensure the refractory remains solid to the peritectic temp. (1890oC)
High alumina refractories 60-90wt% Al2O3.(46-84 mol% )
Azizan Aziz School of Materials and Mineral Resources Engineering
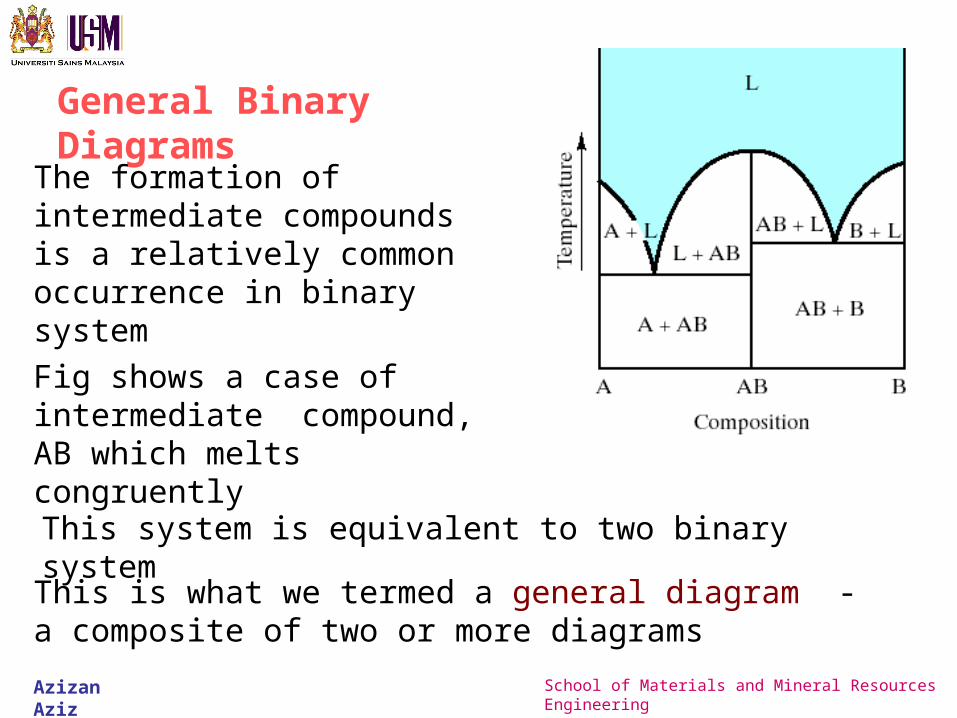
General Binary Diagrams
The formation of intermediate compounds is a relatively common occurrence in binary system
Fig shows a case of intermediate compound, AB which melts congruently
This system is equivalent to two binary system
This is what we termed a general diagram - a composite of two or more diagrams
Azizan Aziz School of Materials and Mineral Resources Engineering
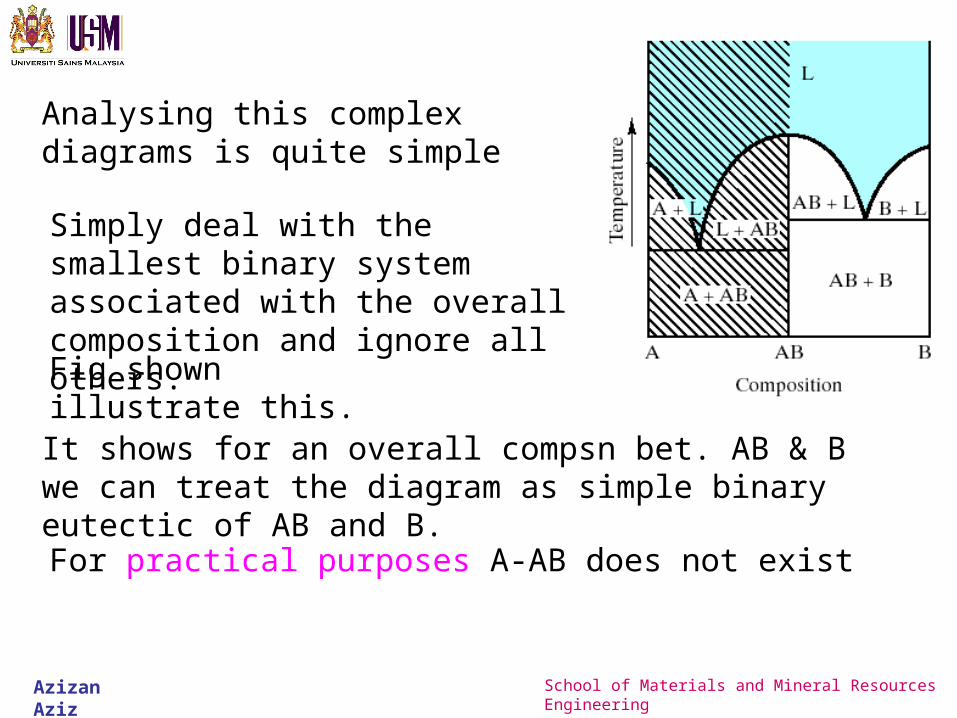
Analysing this complex diagrams is quite simple
Simply deal with the smallest binary system associated with the overall composition and ignore all others.
Fig shown illustrate this.
It shows for an overall compsn bet. AB & B we can treat the diagram as simple binary eutectic of AB and B.
For practical purposes A-AB does not exist
Azizan Aziz School of Materials and Mineral Resources Engineering
tem
pera
ture
Composition
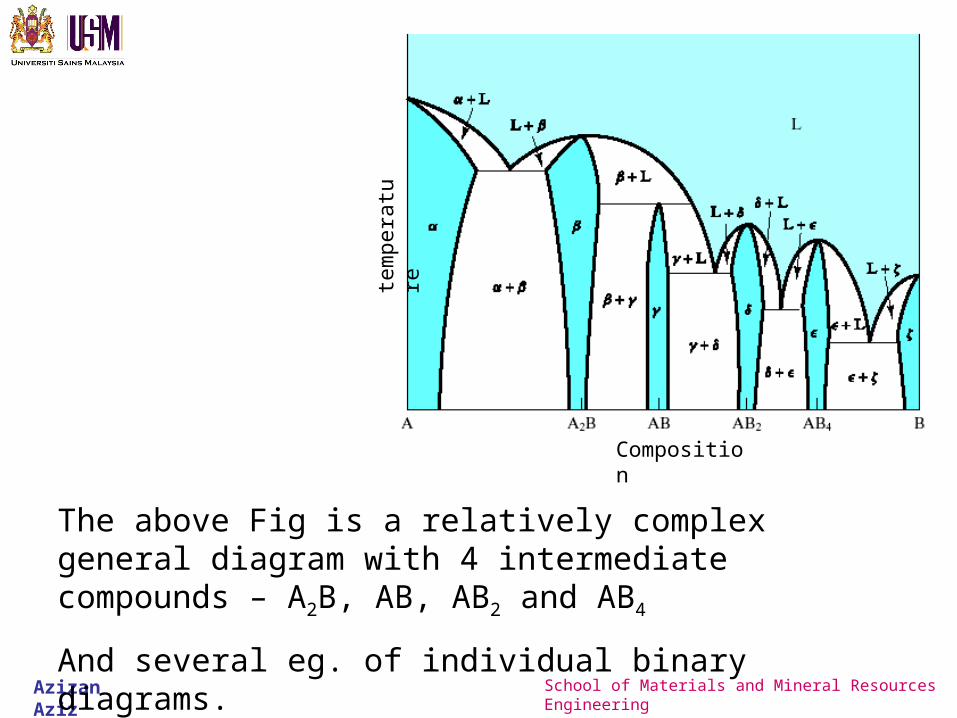
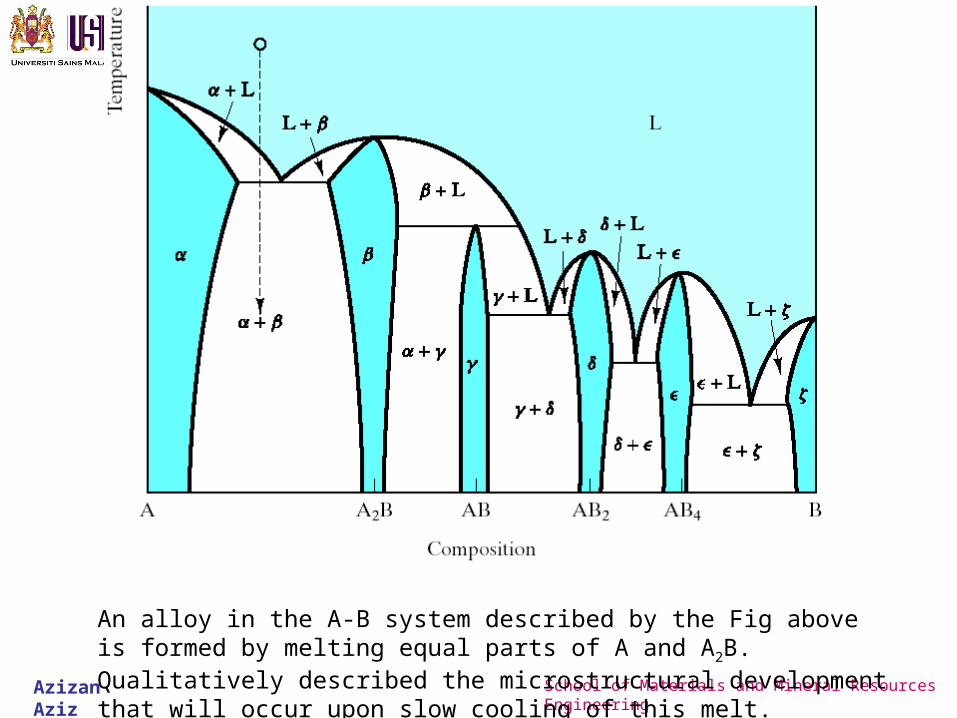
The above Fig is a relatively complex general diagram with 4 intermediate compounds – A2B, AB, AB2 and AB4
And several eg. of individual binary diagrams.
Azizan Aziz School of Materials and Mineral Resources Engineering
tem
pera
ture
composition
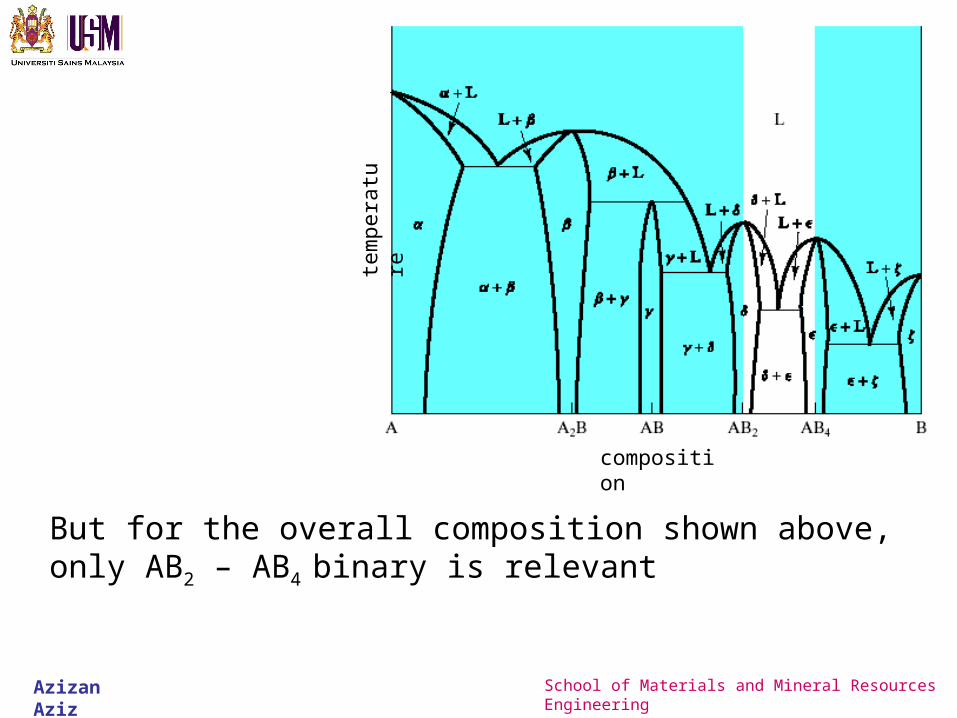
But for the overall composition shown above, only AB2 – AB4
binary is relevant
Azizan Aziz School of Materials and Mineral Resources Engineering
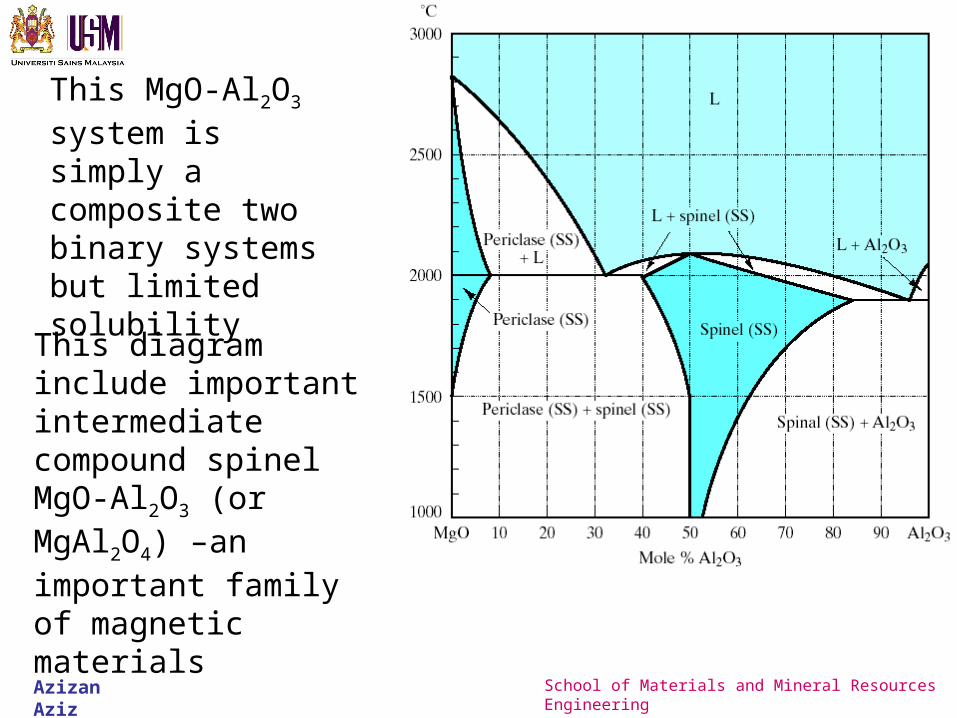
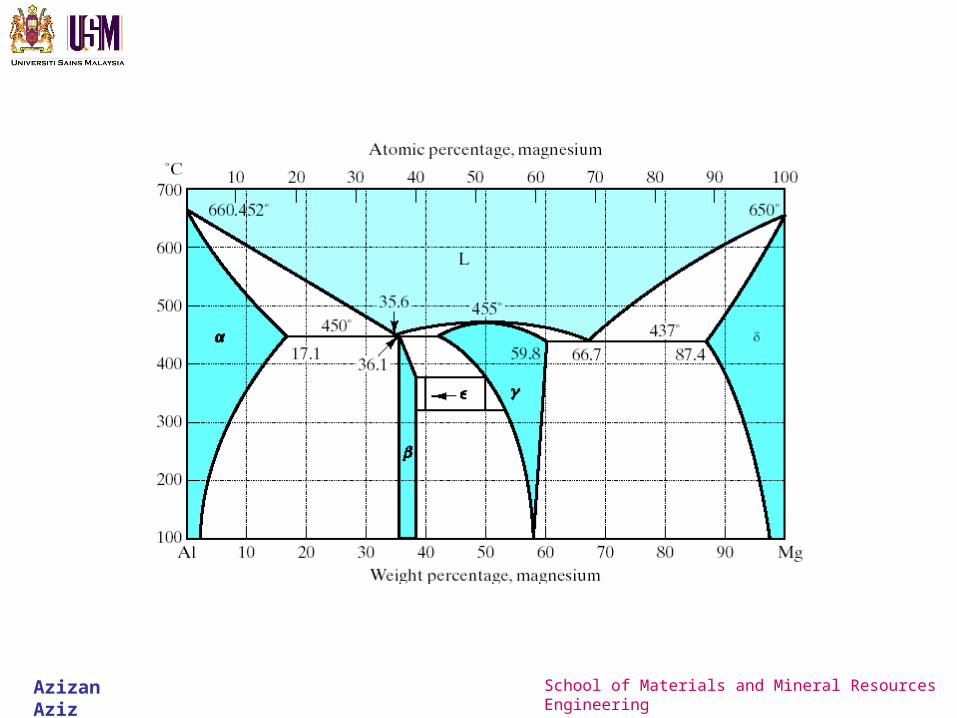
This MgO-Al2O3 system is simply a composite two binary systems but limited solubility
This diagram include important intermediate compound spinel MgO-Al2O3 (or MgAl2O4) –an important family of magnetic materials
Azizan Aziz School of Materials and Mineral Resources Engineering
Eventhough spinel is distinct compound (50mol%Al2O3-50mol%MgO), it is presented as a single phase rather than a single line.
Implies that spinel is stable over a range of composition. – nonstoichiometric for other than normal composition
There is limited solubility of Al2O3 in MgO below 1400oC (left-hand extremity)
Similarly the lack MgO solubility in Al2O3
Also two eutectics on either side and the stoichiometric spinels melt congruently at about 2100oC
Azizan Aziz School of Materials and Mineral Resources Engineering
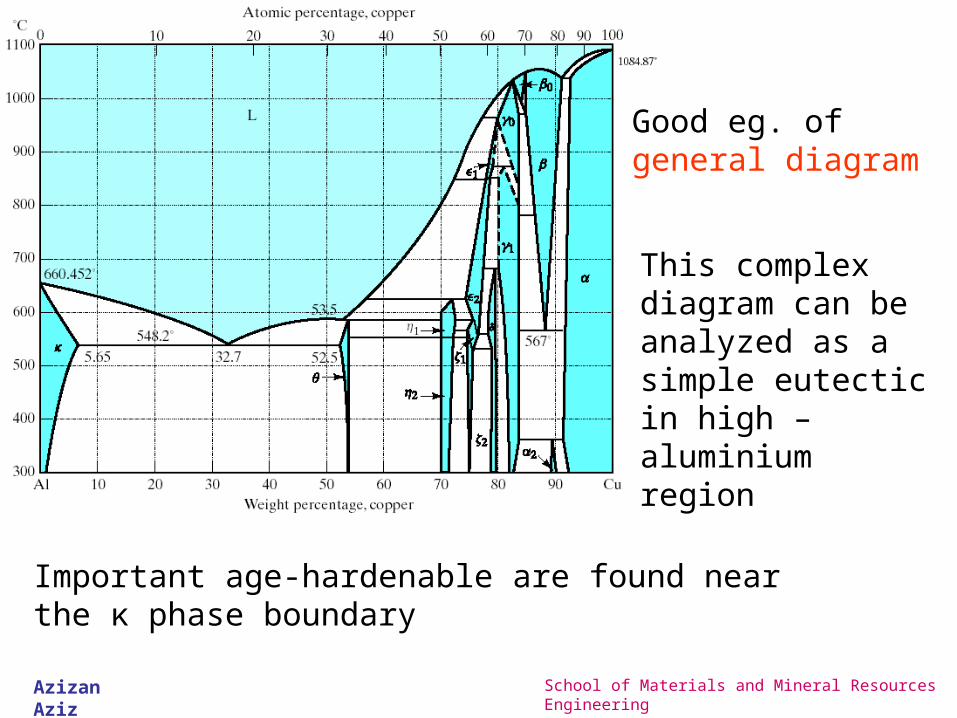
Good eg. of general diagram
This complex diagram can be analyzed as a simple eutectic in high – aluminium region
Important age-hardenable are found near the κ phase boundary
Azizan Aziz School of Materials and Mineral Resources Engineering
Azizan Aziz School of Materials and Mineral Resources Engineering
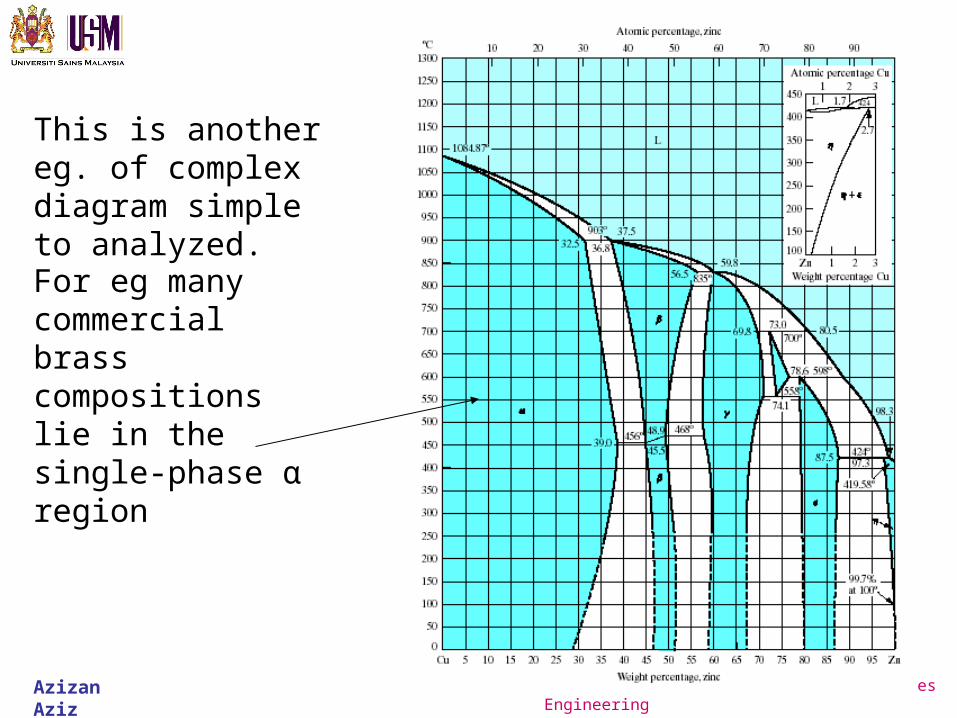
This is another eg. of complex diagram simple to analyzed.
For eg many commercial brass compositions lie in the single-phase α region
Azizan Aziz School of Materials and Mineral Resources Engineering
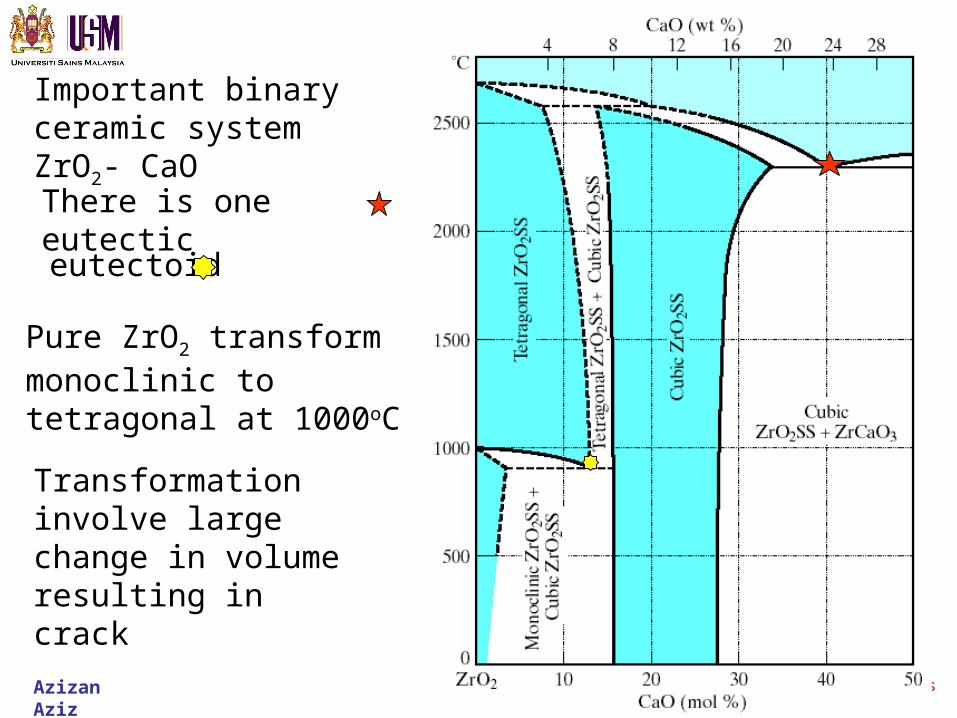
Important binary ceramic system ZrO2- CaO
There is one eutectic
eutectoid
Pure ZrO2 transform monoclinic to tetragonal at 1000oC
Transformation involve large change in volume resulting in crack
Azizan Aziz School of Materials and Mineral Resources Engineering
This problem is overcome by “stabilizing” the zirconia by adding bet. 3-7wt% CaO (18 mol%)
As shown by the phase diagram, this addition of CaO produces cubic and tetragonal crystal structure are retaine from room to melting point 2500oC and crack formation circumvented.
This partially stabilized zirconia (PSZ) is a very refractory,structural material.
Higher calcia content cubic phase may be retained – fully stabilized zirconia.
Azizan Aziz School of Materials and Mineral Resources Engineering
An alloy in the A-B system described by the Fig above is formed by melting equal parts of A and A2B. Qualitatively described the microstructural development that will occur upon slow cooling of this melt.
Azizan Aziz School of Materials and Mineral Resources Engineering
Microstructural development during slow cooling
Azizan Aziz School of Materials and Mineral Resources Engineering
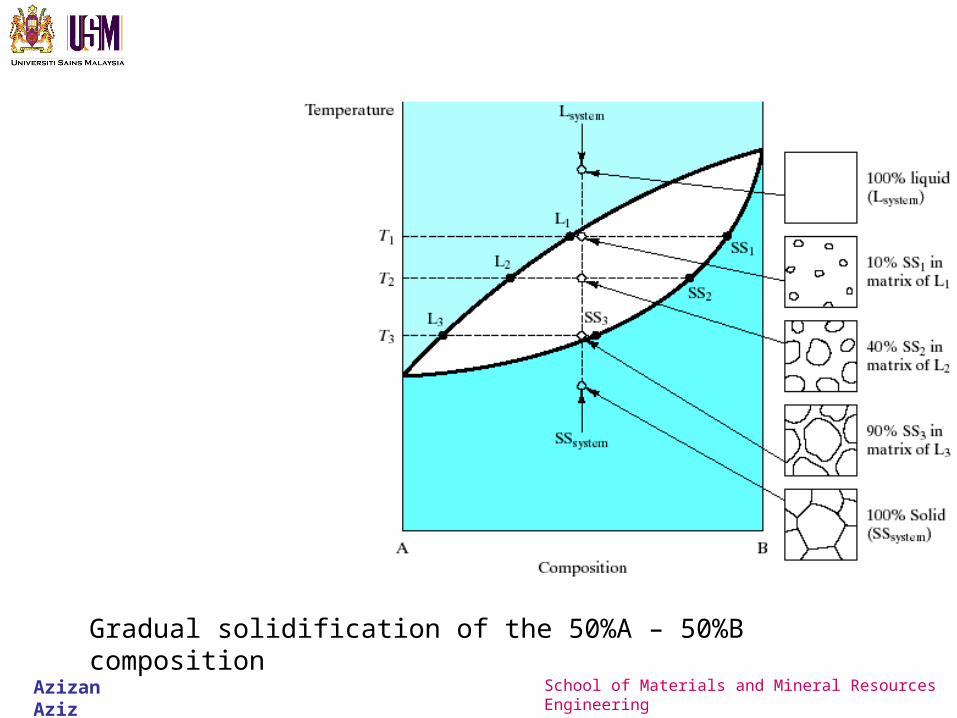
Gradual solidification of the 50%A – 50%B composition
Azizan Aziz School of Materials and Mineral Resources Engineering
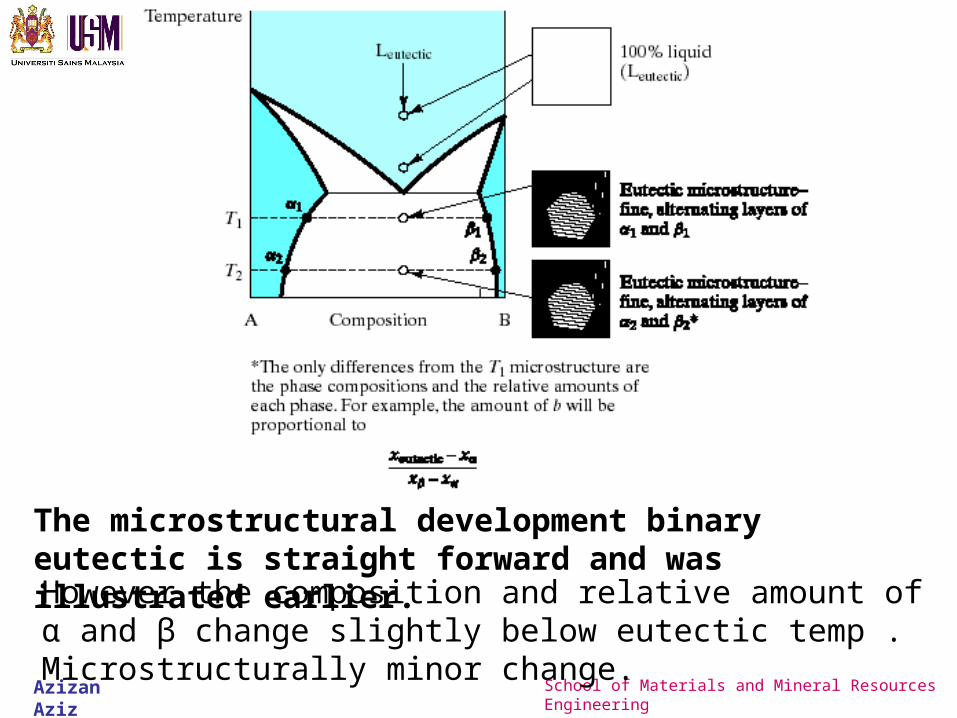
The microstructural development binary eutectic is straight forward and was illustrated earlier.However the composition and relative amount of α and β change slightly below eutectic temp . Microstructurally minor change.
Azizan Aziz School of Materials and Mineral Resources Engineering
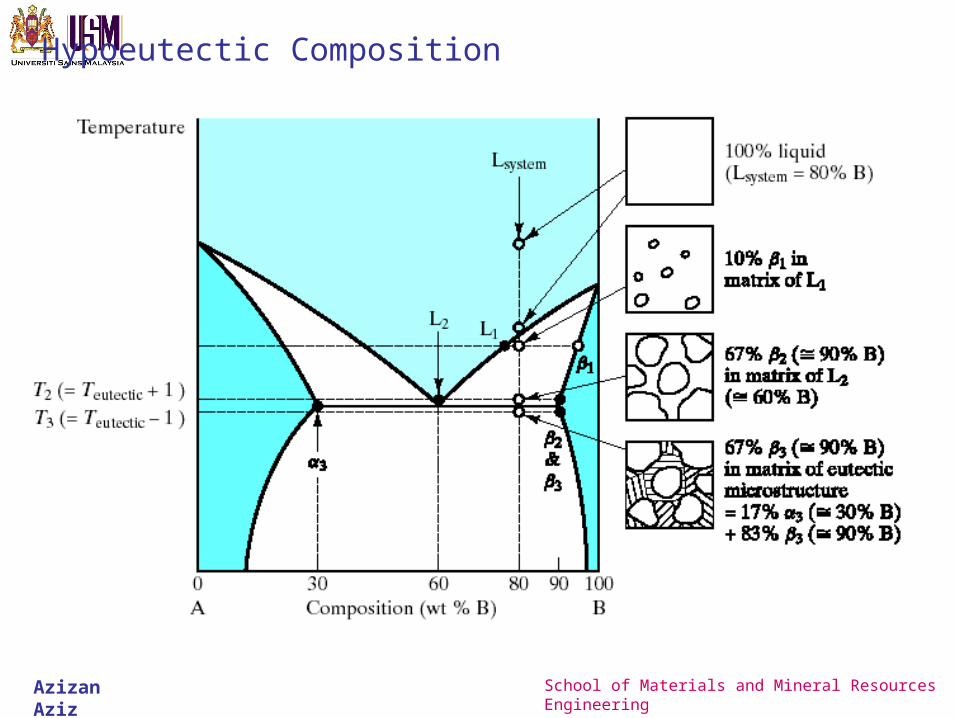
Hypoeutectic Composition
Azizan Aziz School of Materials and Mineral Resources Engineering
The gradual growth of β above eutectic temp is comparable to complete solid solution diagram
With one difference- crystallite growth stops at the eutectic temp with ~67% of the microstructure solidified
Remaining liq (w. eutectic compsn) transform suddenly to the eutectic microstructure upon cooling thru theuetectic temp.
Cooling of hypereutectic composition -2 forms of β phase
Large grains – (L + β) → proectectic β
Finer grain (in the lamellar eutectic) known as eutectic β
Azizan Aziz School of Materials and Mineral Resources Engineering
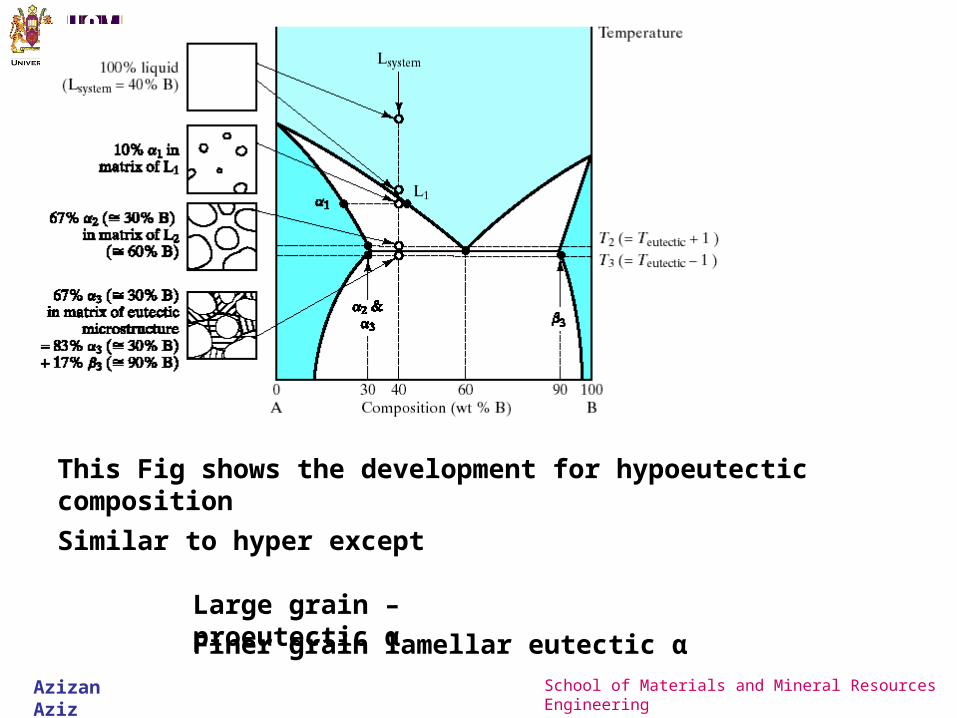
This Fig shows the development for hypoeutectic composition
Similar to hyper except
Large grain – proeutectic α
Finer grain lamellar eutectic α
Azizan Aziz School of Materials and Mineral Resources Engineering
tem
pe
ratu
re
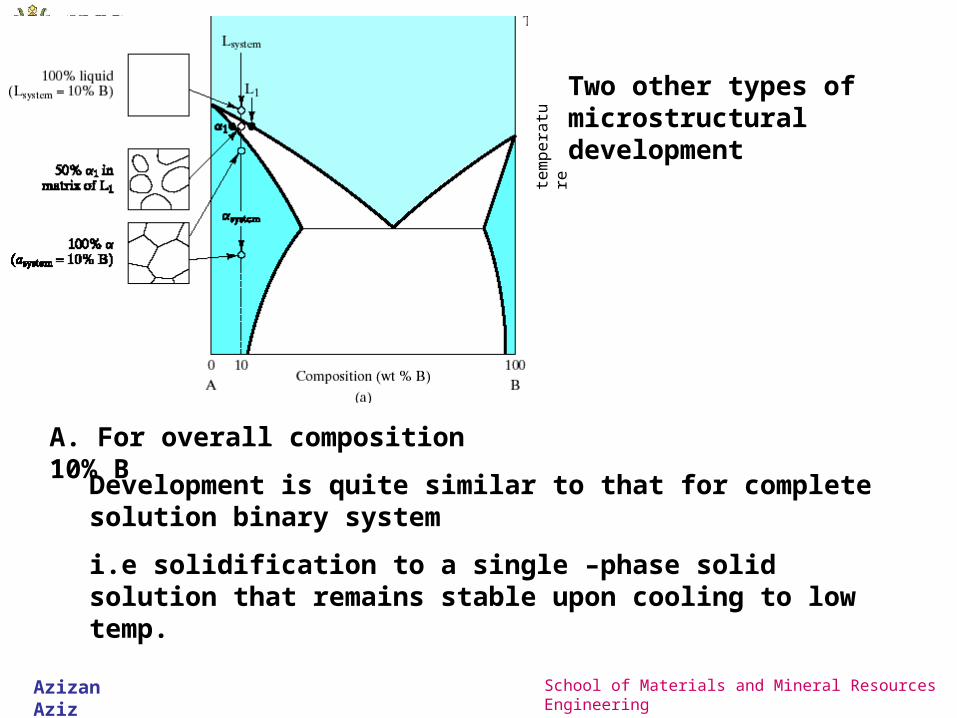
Two other types of microstructural development
A. For overall composition 10% B
Development is quite similar to that for complete solution binary system
i.e solidification to a single –phase solid solution that remains stable upon cooling to low temp.
Azizan Aziz School of Materials and Mineral Resources Engineering
tem
pe
ratu
re
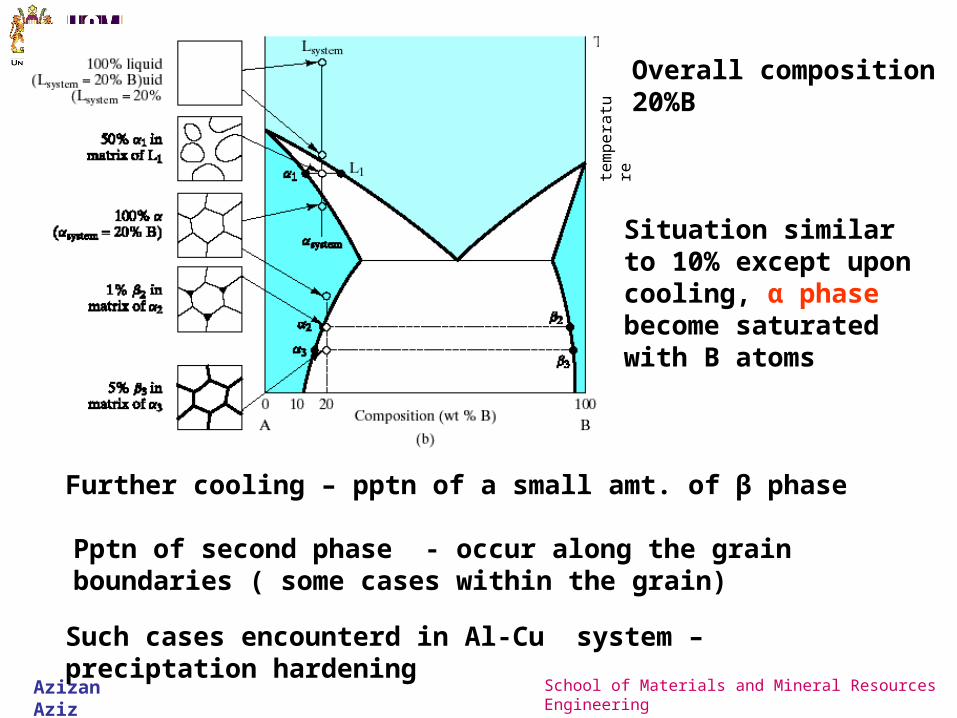
Overall composition 20%B
Situation similar to 10% except upon cooling, α phase become saturated with B atoms
Further cooling – pptn of a small amt. of β phase
Pptn of second phase - occur along the grain boundaries ( some cases within the grain)
Such cases encounterd in Al-Cu system –preciptation hardening
Azizan Aziz School of Materials and Mineral Resources Engineering
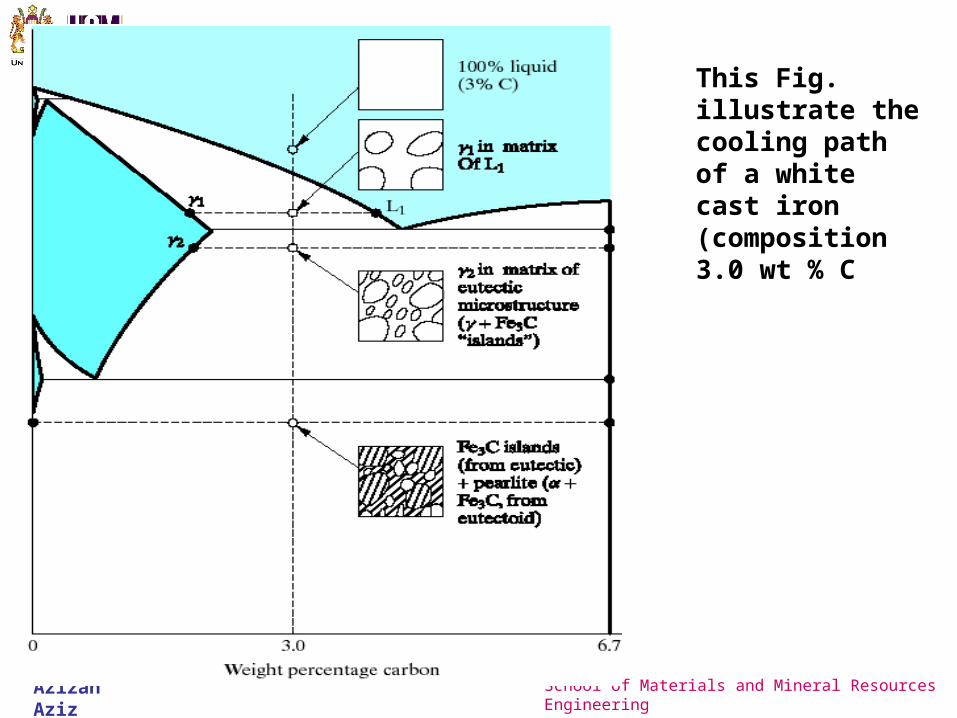
This Fig. illustrate the cooling path of a white cast iron (composition 3.0 wt % C
Azizan Aziz School of Materials and Mineral Resources Engineering
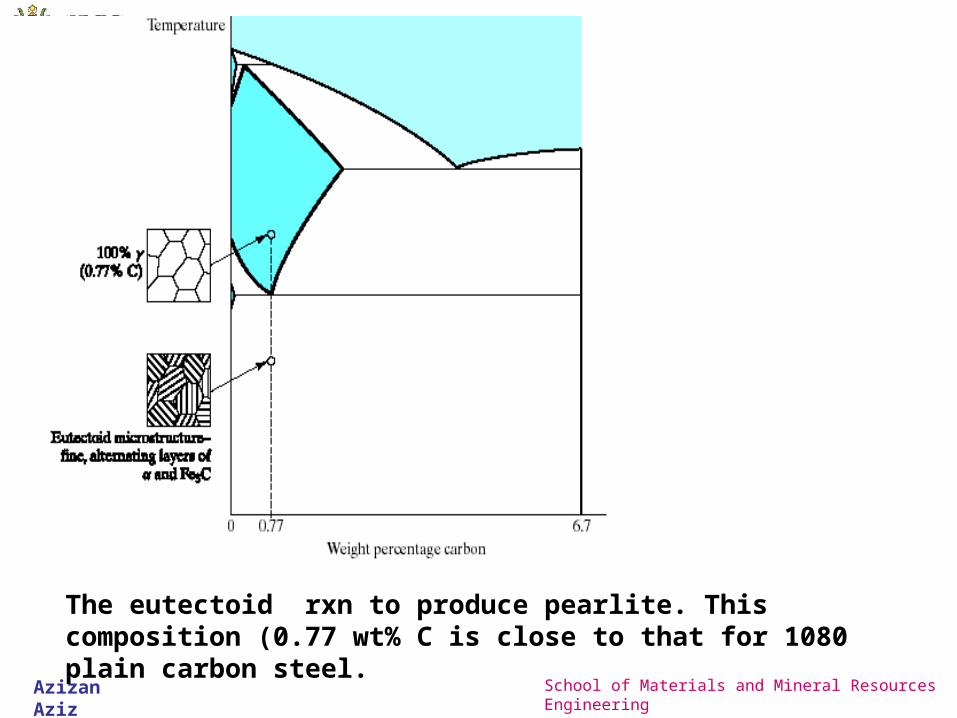
The eutectoid rxn to produce pearlite. This composition (0.77 wt% C is close to that for 1080 plain carbon steel.

Azizan Aziz School of Materials and Mineral Resources Engineering
Hypoeutectoid steel (containing < 0.77 wt% C)
overall compsn 0.5 wt% C
If austenite cools just below 750oC, ferrite nucleates and grow usually at austenite grain boundaries
Primary ferrite continues to grow until the temp falls to 727oC
Remaining austenite at that temp is now surrounded by ferrite and has change composition 0.5 to 0.77 wt% C
Subsequent cooling below 727oC causes all remaining austenite to transform to pearlite by eutectoid rxn
Final microstructure
Azizan Aziz School of Materials and Mineral Resources Engineering
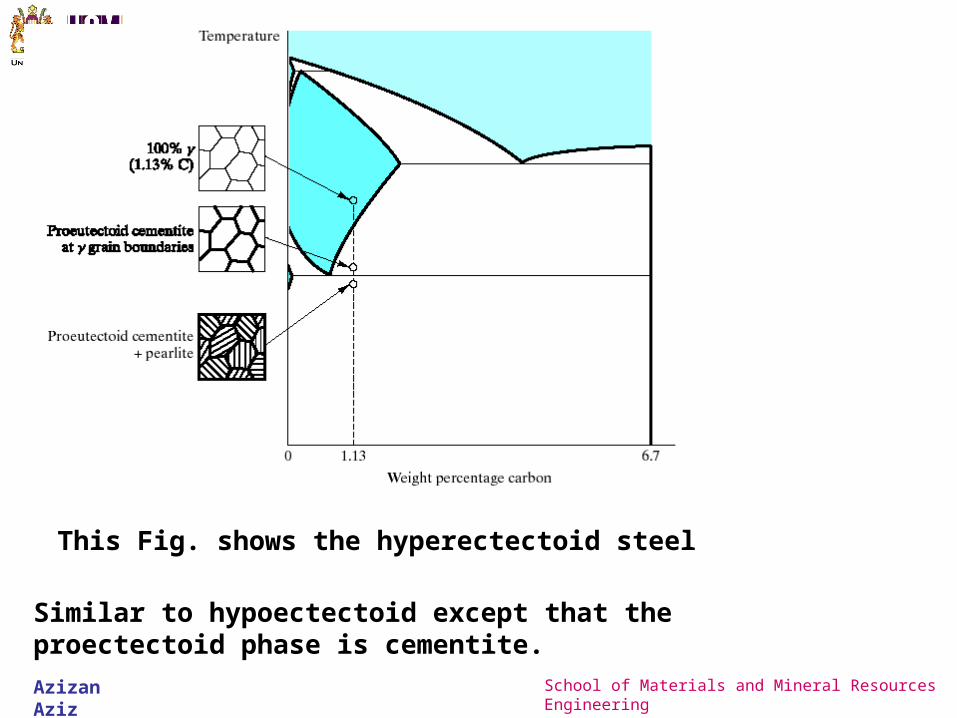
This Fig. shows the hyperectectoid steel
Similar to hypoectectoid except that the proectectoid phase is cementite.