Embed Size (px)
Citation preview
1
www.eu-footprint.org
Characterising Agricultural Areas in Europe
John Hollis
www.eu-footprint.org
> Sustainable use of pesticides within European agriculture is a stated goal.
> Requires a clear understanding of the routes by which pesticide residues can reach non-target areas.
> European agricultural conditions are diverse.- Clearly impractical to measure losses from every field.
> Need other methods – Numerical modelling
Background -1
www.eu-footprint.org
> Numerical models are difficult to parameterise –‘data hungry’
> Most current European risk assessment procedures use a limited number of ‘realistic worse-case scenarios’. (c.f. FOCUS tools)
> Recent suggested refinements include more probabilistic modelling with a broader range of soil and climate conditions (FOCUS L & M 2003).
> BUT, development has been hampered by the lack of harmonised data at the pan-European scale.
> FOOTPRINT has now addressed this issue.
Background - 2
www.eu-footprint.org
> Develop and apply a methodology for defining generic scenarios for characterising the complete spectrum of European agricultural environments(integrate crop, weather and soil characteristics).
- Scenarios must be capable of being applied anywhere inEurope at European/national/regional, catchment andfarm/holding level.
- Each scenario should have a default set of • long-term weather data• soil property data• agronomic data.
Objectives for creating Agro-Environmental Scenarios
www.eu-footprint.org
Methodology
>Climate: Identify zones in which the criticalweather variables are relatively similar.Define representative long term daily weather data foreach zone.
>Crop: Identify and map the different types ofagricultural land and the crops grown on them.Define crop growth characteristics for each crop.
>Soil: Identify the soil properties that are criticalfor pesticide transport and map their distribution.Define soil profile characteristics for each soil.
> Integrate all three data layers using GISintersection to create the scenarios.
www.eu-footprint.org
Creating the agricultural land & crop data layer
> Use CORINE 2000 to identify and map agricultural land.
> Use corrected European cropping statistics from the FATE Land Cover map (JRC) to quantify range of annual crops grown.
> Use GIS to intersect CORINE agricultural areas with FATE Land Cover data.
2
www.eu-footprint.org
CORINE 2000 Agricultural land cover
Example for Andalucia, Spain> Arable (non-permanently irrigated); 211
> Arable (permanently irrigated); 212
> Vineyards; 221
> Fruit trees & berry plantations; 222
> Olives; 223
> Pastures; 231
> Arable mixed with other uses; 2413
> Complex cultivation patterns; 242
> Agro-forestry; 244
All non-agricultural land is grouped together and un-attributed
www.eu-footprint.org
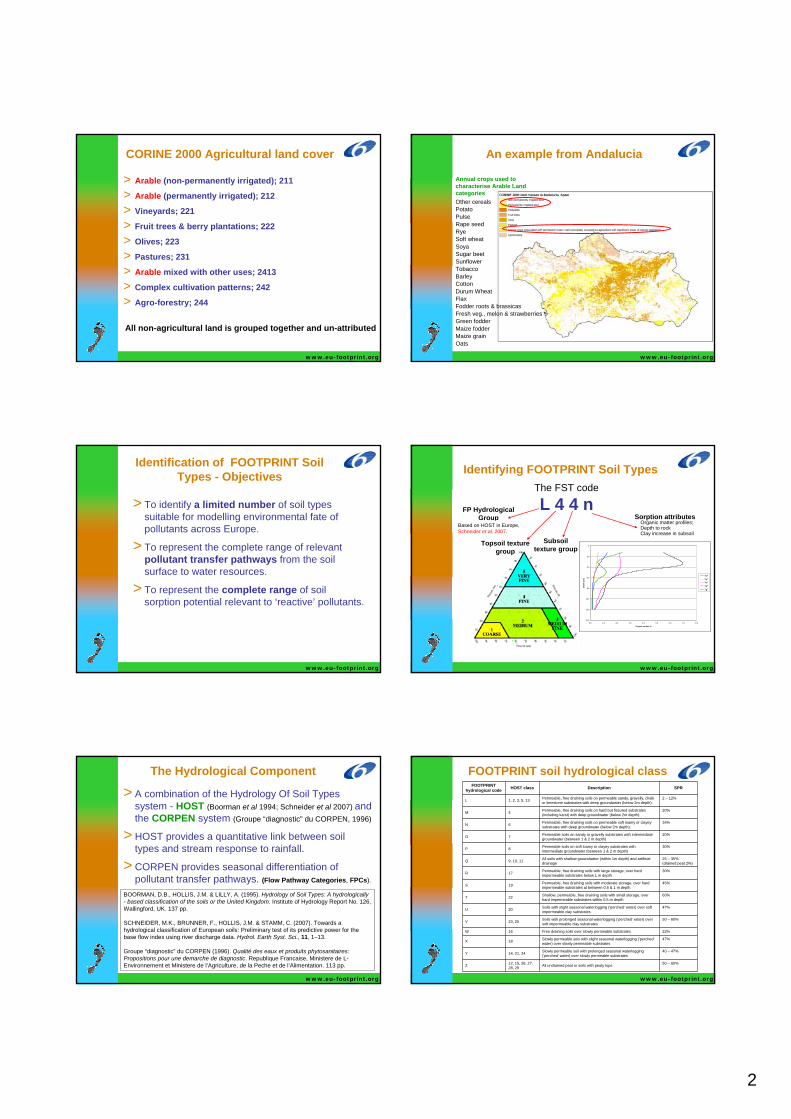
An example from Andalucia
Other cerealsPotatoPulseRape seedRyeSoft wheatSoyaSugar beetSunflowerTobaccoBarleyCottonDurum WheatFlaxFodder roots & brassicasFresh veg., melon & strawberriesGreen fodderMaize fodderMaize grainOats
Annual crops used to characterise Arable Land categories
www.eu-footprint.org
Identification of FOOTPRINT Soil Types - Objectives
> To identify a limited number of soil types suitable for modelling environmental fate of pollutants across Europe.
> To represent the complete range of relevant pollutant transfer pathways from the soil surface to water resources.
> To represent the complete range of soil sorption potential relevant to ‘reactive’ pollutants.
www.eu-footprint.org
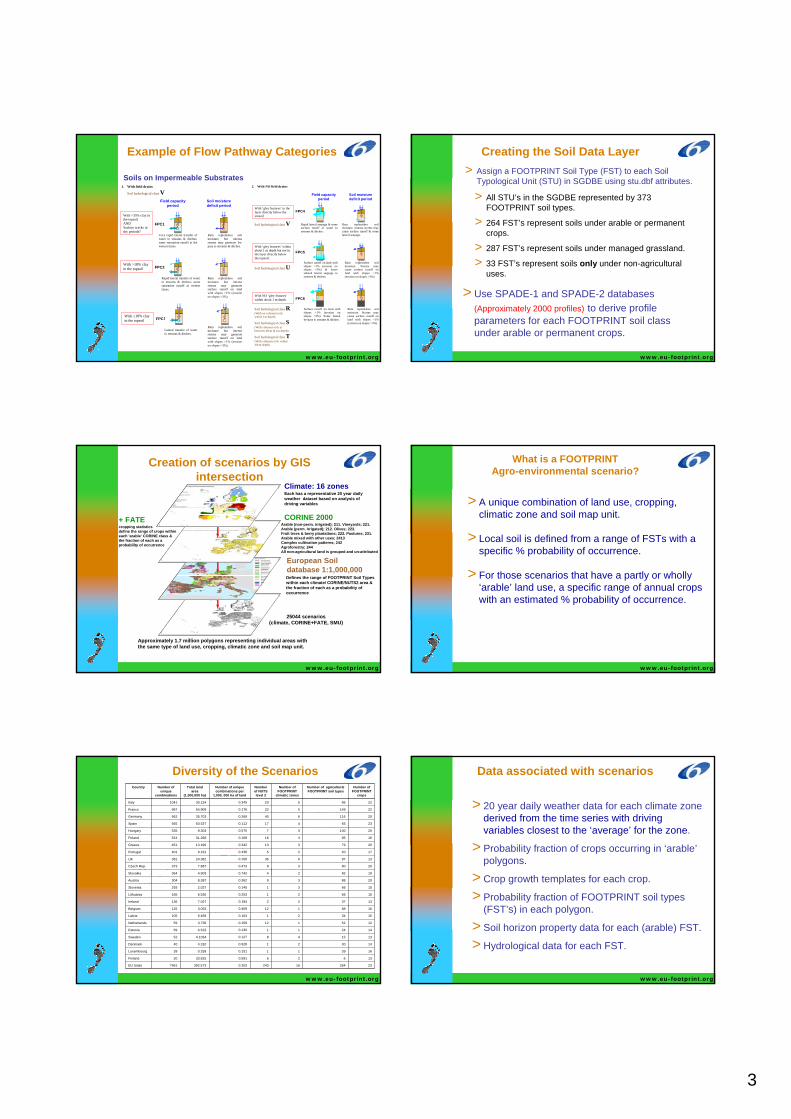
Identifying FOOTPRINT Soil TypesThe FST code
L 4 4 n
Subsoil texture group
Topsoil texture group
0
20
40
60
80
100
120
1400.0 1.0 2.0 3.0 4.0 5.0 6.0 7.0 8.0
Organic carbon %
Dep
th (c
m)
"n""u""h""p""g"
FP Hydrological Group
Based on HOST in Europe, Schneider et al, 2007.
Sorption attributesOrganic matter profiles;Depth to rockClay increase in subsoil
www.eu-footprint.org
The Hydrological Component
> A combination of the Hydrology Of Soil Types system - HOST (Boorman et al 1994; Schneider et al 2007) and the CORPEN system (Groupe “diagnostic” du CORPEN, 1996)
> HOST provides a quantitative link between soil types and stream response to rainfall.
> CORPEN provides seasonal differentiation of pollutant transfer pathways. (Flow Pathway Categories, FPCs).
BOORMAN, D.B., HOLLIS, J.M. & LILLY, A. (1995). Hydrology of Soil Types: A hydrologically - based classification of the soils or the United Kingdom. Institute of Hydrology Report No. 126, Wallingford, UK. 137 pp.
SCHNEIDER, M.K., BRUNNER, F., HOLLIS, J.M. & STAMM, C. (2007). Towards a hydrological classification of European soils: Preliminary test of its predictive power for the base flow index using river discharge data. Hydrol. Earth Syst. Sci., 11, 1–13.
Groupe “diagnostic” du CORPEN (1996). Qualité des eaux et produits phytosanitaires: Propositions pour une demarche de diagnostic. Republique Francaise, Ministere de L-Environnement et Ministere de l’Agriculture, de la Peche et de l’Alimentation. 113 pp.
www.eu-footprint.org
FOOTPRINT soil hydrological class
50 – 60%All undrained peat or soils with peaty tops 12, 15, 26, 27, 28, 29Z
40 – 47%Slowly permeable soil with prolonged seasonal waterlogging ('perched' water) over slowly permeable substrates14, 21, 24Y
47%Slowly permeable sois with slight seasonal waterlogging ('perched' water) over slowly permeable substrates18X
22%Free draining soils over slowly permeable substrates16W
50 – 60%Soils with prolonged seasonal waterlogging ('perched' water) over soft impermeable clay substrates23, 25V
47%Soils with slight seasonal waterlogging ('perched' water) over soft impermeable clay substrates20U
60%Shallow, permeable, free draining soils with small storage, overhard impermeable substrates within 0.5 m depth22T
45%Permeable, free draining soils with moderate storage, over hard impermeable substrates at between 0.5 & 1 m depth19S
30%Permeable, free draining soils with large storage, over hard impermeable substrates below 1 m depth17R
25 – 35%(drained peat 2%)
All soils with shallow groundwater (within 1m depth) and artificial drainage9, 10, 11Q
30%Permeable soils on soft loamy or clayey substrates with intermediate groundwater (between 1 & 2 m depth)8P
20%Permeable soils on sandy or gravelly substrates with intermediate groundwater (between 1 & 2 m depth)7O
34%Permeable, free draining soils on permeable soft loamy or clayeysubstrates with deep groundwater (below 2m depth).6N
20%Permeable, free draining soils on hard but fissured substrates (including karst) with deep groundwater (below 2m depth).4M
2 – 12%Permeable, free draining soils on permeable sandy, gravelly, chalk or limestone substrates with deep groundwater (below 2m depth).1, 2, 3, 5, 13L
SPRDescriptionHOST classFOOTPRINT hydrological code
3
www.eu-footprint.org
Example of Flow Pathway Categories
Soils on Impermeable Substrates 1. With field drains
Soil hydrological class V
With >35% clay in the topsoil AND Surface cracks in dry periods?
Field capacity period
Soil moisture deficit period
With >18% clay in the topsoil
FPC3
FPC1
FPC2
Rain replenishes soil moisture but intense storms may generate by-pass to streams & ditches.
Very rapid lateral transfer of water to streams & ditches; some saturation runoff at the wettest times.
Rain replenishes soil moisture but intense storms may generate surface runoff on land with slopes >1% (erosion on slopes >3%).
Rapid lateral transfer of water to streams & ditches; some saturation runoff at wettest times.
Rain replenishes soil moisture but intense storms may generate surface runoff on land with slopes >1% (erosion on slopes >3%).
Lateral transfer of water to streams & ditches.
With <18% clay in the topsoil
Field capacity period
Soil moisture deficit period
FPC6
Rain replenishes soil moisture. Intense storms may cause surface runoff & some lateral seepage.
Rapid lateral seepage & some surface runoff of water to streams & ditches.
Rain replenishes soil moisture. Storms may cause surface runoff on land with slopes >1% (erosion on slopes >3%).
Surface runoff on land with slopes >1% (erosion on slopes >3%) & lower subsoil lateral seepage to streams & ditches.
Rain replenishes soil moisture. Storms may cause surface runoff on land with slopes >1% (erosion on slopes >3%).
Surface runoff on land with slopes >1% (erosion on slopes >3%). Some lateral by-pass to streams & ditches.
FPC4
FPC5
2. With NO field drains
With ‘gley features’ in the layer directly below the topsoil
Soil hydrological class V
With ‘gley features’ within about 1 m depth but not in the layer directly below the topsoil.
Soil hydrological class U
With NO ‘gley features’ within about 1 m depth.
Soil hydrological class R (With no coherent rock within 1m depth)
Soil hydrological class S (With coherent rock at between 40cm & 1m depth)
Soil hydrological class T (With coherent rock within 40cm depth)
www.eu-footprint.org
Creating the Soil Data Layer> Assign a FOOTPRINT Soil Type (FST) to each Soil
Typological Unit (STU) in SGDBE using stu.dbf attributes.
> All STU’s in the SGDBE represented by 373 FOOTPRINT soil types.
> 264 FST’s represent soils under arable or permanent crops.
> 287 FST’s represent soils under managed grassland.
> 33 FST’s represent soils only under non-agricultural uses.
> Use SPADE-1 and SPADE-2 databases(Approximately 2000 profiles) to derive profile parameters for each FOOTPRINT soil class under arable or permanent crops.
www.eu-footprint.org
Creation of scenarios by GIS intersection
European Soil database 1:1,000,000Defines the range of FOOTPRINT Soil Types within each climate/ CORINE/NUTS2 area & the fraction of each as a probability of occurrence
25044 scenarios(climate, CORINE+FATE, SMU)
Approximately 1.7 million polygons representing individual areas with the same type of land use, cropping, climatic zone and soil map unit.
Climate: 16 zonesEach has a representative 20 year dailyweather dataset based on analysis ofdriving variables
CORINE 2000Arable (non-perm. irrigated); 211. Vineyards; 221.Arable (perm. Irrigated); 212. Olives; 223. Fruit trees & berry plantations; 222. Pastures; 231.Arable mixed with other uses; 2413Complex cultivation patterns; 242Agroforestry; 244All non-agricultural land is grouped and un-attributed
+ FATEcropping statisticsdefine the range of crops withineach ‘arable’ CORINE class &the fraction of each as a probability of occurrence
www.eu-footprint.org
What is a FOOTPRINTAgro-environmental scenario?
> A unique combination of land use, cropping, climatic zone and soil map unit.
> Local soil is defined from a range of FSTs with a specific % probability of occurrence.
> For those scenarios that have a partly or wholly ‘arable’ land use, a specific range of annual crops with an estimated % probability of occurrence.
www.eu-footprint.org
Diversity of the Scenarios
> None of the 25044 scenarios has the same fractions of soils and annual crops within the same climate zone
BUT> Many have the same range of soil/crop
combinations.
> The number of unique combinations of climate, soil and crop is therefore only 7961.
23264162430.203392.5737961EU totals
136260.59133.81520Finland
1639110.1510.25939Luxembourg
1430210.9284.31040Denmark
1315480.1274.103452Sweden
1424110.1304.52359Estonia
12521120.1583.73659Netherlands
1534210.1636.459105Latvia
16881120.4093.053125Belgium
1337220.1947.027136Ireland
1556210.253 6.530165Lithuania
1566310.1452.027293Slovenia
2088390.3628.387304Austria
1982240.7424.903364Slovakia
2080380.4737.887373Czech Rep.
13876360.15624.382381UK
1750250.4369.191401Portugal
20793130.34213.196451Greece
16954160.16831.268524Poland
20100370.5759.303535Hungary
23654170.112 50.537565Spain
201166400.26935.703962Germany
221495220.17654.909967France
22865200.34530.1341041Italy
Number of FOOTPRINT
crops
Number of agricultural FOOTPRINT soil types
Number of FOOTPRINT
climatic zones
Number of NUTS level 2
Number of unique combinations per
1,000, 000 ha of land
Total land area
(1,000,000 ha)
Number of unique
combinations
Country
www.eu-footprint.org
Data associated with scenarios
> 20 year daily weather data for each climate zone derived from the time series with driving variables closest to the ‘average’ for the zone.
> Probability fraction of crops occurring in ‘arable’polygons.
> Crop growth templates for each crop.
> Probability fraction of FOOTPRINT soil types (FST’s) in each polygon.
> Soil horizon property data for each (arable) FST.
> Hydrological data for each FST.
4
www.eu-footprint.org
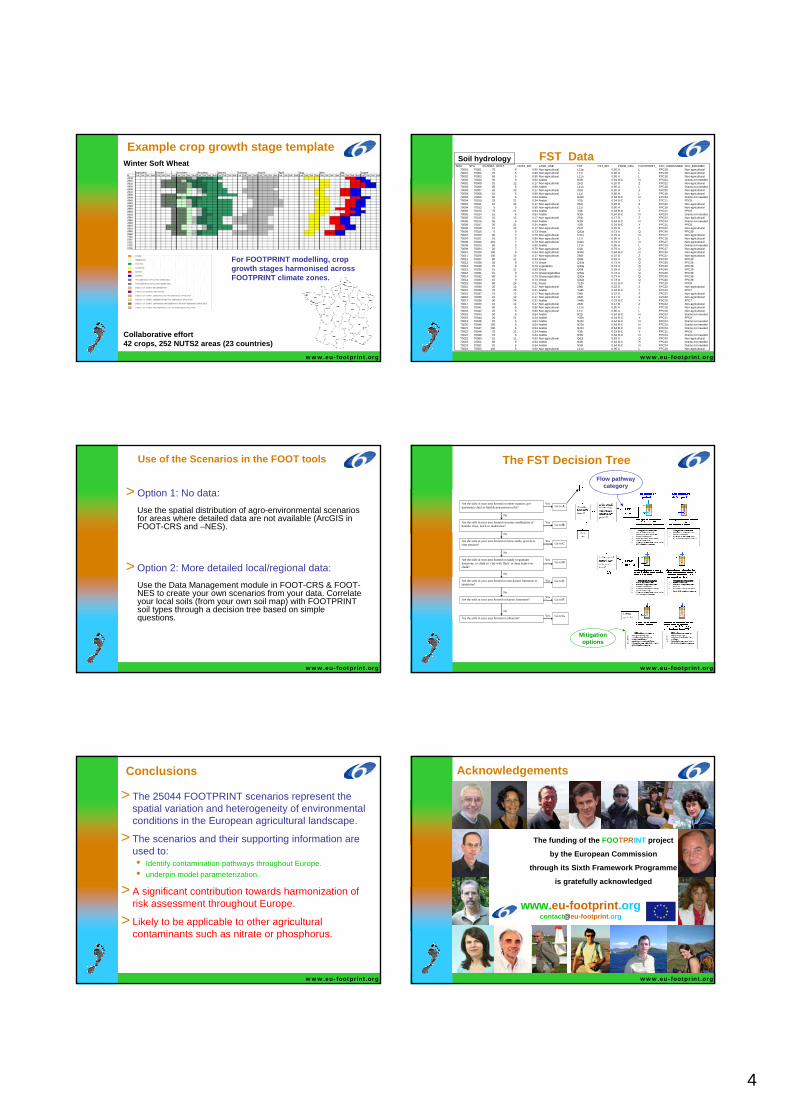
Example crop growth stage templateWinter Soft Wheat
Collaborative effort42 crops, 252 NUTS2 areas (23 countries)
For FOOTPRINT modelling, crop growth stages harmonised across FOOTPRINT climate zones.
www.eu-footprint.org
FST Data
FST PRZM_SHGHOST-CORHORIZON Hor sequenDEPTH_UPDEPTH_LOCLAY SILT SAND_TOTSAND_01 SAND_02 SAND_05 SAND_20 STONES PH_H2O OC DBL11g A C Aap 1 0 30 5 17 79 11 35 33 0 0 4.4 5.5 1.10L11g A C Ahb 2 30 40 4 16 80 11 35 34 0 0 4.2 6.9 1.04L11g A C Bhe 3 40 55 4 15 81 11 36 34 0 0 4.2 3.4 1.00L11g A C BC 4 55 70 4 10 86 11 38 36 0 0 4.5 1.5 1.03L11g A C Cg 5 70 120 3 12 85 11 38 36 0 0 4.5 0.9 1.27L11h A C Ap 1 0 30 11 25 63 29 8 9 18 3 4.8 2.2 1.10L11h A C A 2 30 60 14 32 54 27 7 7 13 3 6 2.2 1.15L11h A C B 3 60 100 7 33 60 28 8 9 16 3 6.2 0.9 1.20L11i A C Ap 1 0 26 8 15 77 27 20 16 14 1 6.6 1.4 1.44L11i A C E 2 26 51 6 15 79 31 23 14 12 1 6.5 0.5 1.51L11i A C Bt 3 51 85 16 14 70 25 20 14 12 1 6.7 0.3 1.60L11i A C BCt 4 85 100 10 12 78 16 23 22 17 5 7.4 0.1 1.50L11i A C C 5 100 150 7 9 85 18 26 21 20 5 6 0.1 1.26L11n A C Ap 1 0 25 9 16 76 23 14 14 24 19 6.5 1.3 1.43L11n A C Bw 2 25 60 8 15 77 22 14 15 26 22 6.5 0.5 1.46L11n A C BC 3 60 85 9 13 79 23 15 15 26 29 6.6 0.2 1.53L11n A C C 4 85 150 6 9 85 14 26 20 26 30 7.1 0.2 1.45
Profile parameters
SMU STU PCAREA HOST HOST_BFI LAND_USE FST FST_BFI PRZM_HSG FOOTPRINT_ FPC_UNDRAINED FPC_DRAINED70001 70001 75 5 0.90 Non-agricultural L11p 0.90 A L FPC18 Non-agricultural70001 70002 25 5 0.90 Non-agricultural L11i 0.90 A L FPC18 Non-agricultural70002 70003 60 5 0.90 Non-agricultural L11n 0.95 A L FPC18 Non-agricultural70002 70004 30 6 0.64 Arable N33i 0.64 B-C N FPC24 Drains not needed70002 70005 10 12 0.17 Non-agricultural Z61t 0.20 D Z FPC22 Non-agricultural70003 70006 65 5 0.90 Arable L11n 0.95 A L FPC18 Drains not needed70003 70007 25 12 0.17 Non-agricultural Z61t 0.20 D Z FPC22 Non-agricultural70003 70008 10 5 0.90 Non-agricultural L11i 0.90 A L FPC18 Non-agricultural70004 70009 60 6 0.64 Arable N22n 0.64 B-C N FPC24 Drains not needed70004 70010 25 21 0.34 Arable Y23i 0.34 B-C Y FPC11 FPC870004 70011 10 12 0.17 Non-agricultural Z61t 0.20 D Z FPC22 Non-agricultural70004 70012 5 5 0.90 Non-agricultural L11i 0.90 A L FPC18 Non-agricultural70005 70013 75 21 0.34 Arable Y34i 0.33 B-C Y FPC11 FPC870005 70014 15 6 0.64 Arable N33i 0.64 B-C N FPC24 Drains not needed70005 70015 10 12 0.17 Non-agricultural Z63t 0.17 D Z FPC22 Non-agricultural70006 70016 55 6 0.64 Arable N33i 0.64 B-C N FPC24 Drains not needed70006 70017 30 21 0.34 Arable Y23i 0.34 B-C Y FPC11 FPC870006 70018 10 12 0.17 Non-agricultural Z61t 0.20 D Z FPC22 Non-agricultural70006 70019 5 9 0.73 Grass Q32a 0.73 A Q FPC40 FPC3870007 70020 90 7 0.79 Non-agricultural O11n 0.79 A O FPC17 Non-agricultural70007 70021 10 5 0.90 Non-agricultural L11i 0.90 A L FPC18 Non-agricultural70008 70022 100 7 0.79 Non-agricultural O11n 0.79 A O FPC17 Non-agricultural70009 70023 80 5 0.90 Arable L11n 0.95 A L FPC18 Drains not needed70009 70024 20 7 0.79 Non-agricultural O11i 0.79 A O FPC17 Non-agricultural70010 70025 100 6 0.64 Non-agricultural N33n 0.64 B-C N FPC24 Non-agricultural70011 70026 100 12 0.17 Non-agricultural Z66t 0.22 D Z FPC22 Non-agricultural70012 70027 80 11 0.93 Grass Q66t 0.93 A Q FPC40 FPC3970012 70028 20 9 0.73 Grass Q33a 0.73 A Q FPC40 FPC3870013 70029 70 9 0.73 vegetables Q33a 0.73 A Q FPC40 FPC3870013 70030 15 11 0.93 Grass Q66t 0.93 A Q FPC40 FPC3970013 70031 15 9 0.73 Grassvegetables Q32a 0.73 A Q FPC40 FPC3870014 70032 85 9 0.73 Grassvegetables Q32a 0.73 A Q FPC40 FPC3870014 70033 15 9 0.73 Grass Q32a 0.73 A Q FPC40 FPC3870015 70034 80 24 0.31 Grass Y12h 0.31 B-C Y FPC10 FPC970015 70035 20 12 0.17 Non-agricultural Z66t 0.22 D Z FPC22 Non-agricultural70016 70036 70 24 0.31 Arable Y44h 0.33 B-C Y FPC10 FPC770016 70037 15 12 0.17 Non-agricultural Z66t 0.22 D Z FPC22 Non-agricultural70016 70038 15 12 0.17 Non-agricultural Z64t 0.17 D Z FPC22 Non-agricultural70017 70039 90 24 0.31 Arable Y44h 0.33 B-C Y FPC10 FPC770017 70040 10 12 0.17 Non-agricultural Z64t 0.17 D Z FPC22 Non-agricultural70018 70041 80 5 0.90 Non-agricultural L11n 0.95 A L FPC18 Non-agricultural70018 70042 20 5 0.90 Non-agricultural L11i 0.90 A L FPC18 Non-agricultural70019 70043 50 6 0.64 Arable N22i 0.64 B-C N FPC24 Drains not needed70019 70044 30 21 0.34 Arable Y33h 0.34 B-C Y FPC11 FPC870019 70045 20 6 0.64 Arable N22n 0.64 B-C N FPC24 Drains not needed70020 70046 100 6 0.64 Arable N22n 0.64 B-C N FPC24 Drains not needed70021 70047 100 6 0.64 Arable N22n 0.64 B-C N FPC24 Drains not needed70022 70048 75 21 0.34 Arable Y33i 0.33 B-C Y FPC11 FPC870022 70049 15 6 0.64 Arable N33i 0.64 B-C N FPC24 Drains not needed70022 70050 10 11 0.93 Non-agricultural Q62t 0.83 A Q FPC40 Non-agricultural70023 70051 80 6 0.64 Arable N33i 0.64 B-C N FPC24 Drains not needed70023 70052 20 6 0.64 Arable N33i 0.64 B-C N FPC24 Drains not needed70024 70053 100 5 0.90 Non-agricultural L11n 0.95 A L FPC18 Non-agricultural
Soil hydrology
www.eu-footprint.org
> Option 1: No data:Use the spatial distribution of agro-environmental scenarios for areas where detailed data are not available (ArcGIS in FOOT-CRS and –NES).
> Option 2: More detailed local/regional data:Use the Data Management module in FOOT-CRS & FOOT-NES to create your own scenarios from your data. Correlate your local soils (from your own soil map) with FOOTPRINT soil types through a decision tree based on simple questions.
Use of the Scenarios in the FOOT tools
www.eu-footprint.org
The FST Decision Tree
Are the soils in your area formed on some combination of boulder clays, marls or mudstones?
Are the soils in your area formed on loose sands, gravels or river terraces?
Are the soils in your area formed on either massive, pre-quaternary clays or hard & non-porous rocks?
Are the soils in your area formed on sandy or granular limestone, or chalk or ‘clay with flints’ or deep loam over chalk?
Are the soils in your area formed on non-karstic limestone or sandstone?
Are the soils in your area formed on karstic limestone?
Go to A
Go to B
Go to C
Go to D
Go to E
Go to F
Yes
Yes
Yes
Yes
Yes
Yes
No
No
No
No
No
Are the soils in your area formed on alluvium? Go to G
No Yes
Flow pathwaycategory
Mitigationoptions
www.eu-footprint.org
> The 25044 FOOTPRINT scenarios represent the spatial variation and heterogeneity of environmental conditions in the European agricultural landscape.
> The scenarios and their supporting information are used to:• Identify contamination pathways throughout Europe.• underpin model parameterization.
> A significant contribution towards harmonization of risk assessment throughout Europe.
> Likely to be applicable to other agricultural contaminants such as nitrate or phosphorus.
Conclusions
www.eu-footprint.org
Acknowledgements
The funding of the FOOTPRINT project
by the European Commission
through its Sixth Framework Programme
is gratefully acknowledged