Embed Size (px)
Citation preview
Characterization of Pseudomonas Aeruginosa Growth Patterns Under Varying Gravitational Regimes
Shilpi Ganguly B.S.B.E
Capstone Mentor: Luis Zea, PhD BioServe Space Technologies Capstone Chair: Ernesto Salcedo, PhD Cell and Developmental Biology Committee Member: Tom Finger, PhD Cell and Developmental Biology
Capstone thesis submitted in partial fulfillment of the requirements for the degree of Master of Science in Modern Human Anatomy
May 2018
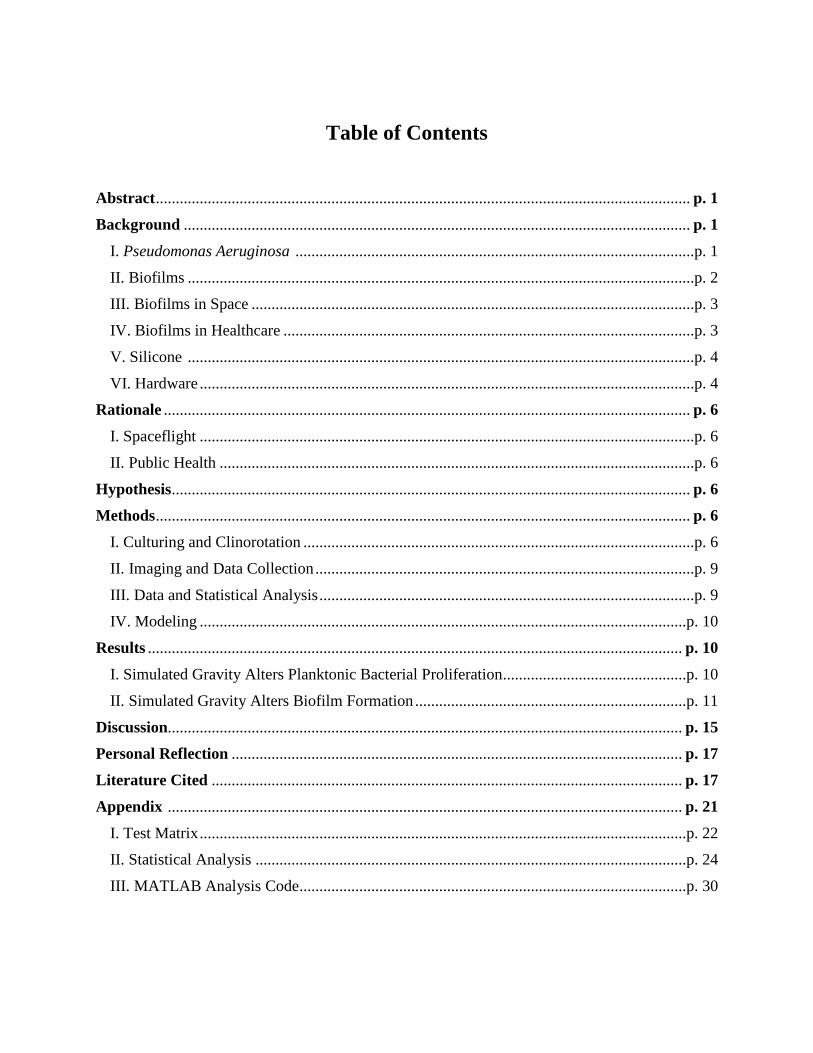
Table of Contents
Abstract ...................................................................................................................................... p. 1
Background ............................................................................................................................... p. 1
I. Pseudomonas Aeruginosa ....................................................................................................p. 1
II. Biofilms ...............................................................................................................................p. 2 III. Biofilms in Space ...............................................................................................................p. 3
IV. Biofilms in Healthcare .......................................................................................................p. 3
V. Silicone ...............................................................................................................................p. 4
VI. Hardware ............................................................................................................................p. 4 Rationale .................................................................................................................................... p. 6
I. Spaceflight ............................................................................................................................p. 6
II. Public Health .......................................................................................................................p. 6
Hypothesis .................................................................................................................................. p. 6 Methods ...................................................................................................................................... p. 6
I. Culturing and Clinorotation ..................................................................................................p. 6
II. Imaging and Data Collection ...............................................................................................p. 9
III. Data and Statistical Analysis ..............................................................................................p. 9 IV. Modeling ..........................................................................................................................p. 10
Results ...................................................................................................................................... p. 10
I. Simulated Gravity Alters Planktonic Bacterial Proliferation ..............................................p. 10
II. Simulated Gravity Alters Biofilm Formation ....................................................................p. 11
Discussion................................................................................................................................. p. 15 Personal Reflection ................................................................................................................. p. 17
Literature Cited ...................................................................................................................... p. 17
Appendix ................................................................................................................................. p. 21
I. Test Matrix ..........................................................................................................................p. 22 II. Statistical Analysis ............................................................................................................p. 24
III. MATLAB Analysis Code .................................................................................................p. 30
P a g e | 1
Abstract Human presence in space will always come with the risk of pathogenesis. Exacerbating the situation, spaceflight has been shown to suppress the immune responses in crew members. Since Pseudomonas aeruginosa can cause serious life-threatening infections in immunocompromised persons, it remains vital to understand how gravity alters this bacterial species in order to combat this pathogen more effectively. The overall goal of this project aimed to determine whether P. aeruginosa demonstrates altered growth patterns when exposed to varying gravitational regimes. To test this research question, pre-determined amounts of P. aeruginosa were injected into BioServe’s 12-well BioCells, a cell culture system developed to be used in space, with 8 of the 12 wells loaded with sterilized silicone coupons, a commonly used substrate in both spaceflight and hospital environments. Prepared BioCells were then placed on a clinostat, a device which causes continuous reorientation of the gravitational vector surrounding the cells, producing a simulated “weightlessness”, and cultured for a 1-week period. Planktonic P. aeruginosa samples were analyzed over time to determine the effects of simulated gravitational regime on bacterial cell proliferation. P. aeruginosa biofilm samples grown on silicone were analyzed to determine the effects of simulated gravitational regime on biofilm morphology. As simulated gravitational regime decreased, planktonic P. aeruginosa began to proliferate with statistically significant increased rates of growth, beginning just shortly after the acceleration phase of bacterial proliferation. Differences in final cell counts between regimes was statistically significant, with simulated microgravity demonstrating greatest final cell counts. P. aeruginosa biofilms demonstrated statistically significant trends with biomass, mean thickness, and substratum coverage following an increasing trend with decreasing simulated gravitational regime and biofilm roughness following a decreasing trend with decreasing simulated gravitational regime. Having identified that the absence of simulated gravity plays a positive role in the proliferation of planktonic P. aeruginosa and the formation of biofilms, there now exists further need in exploring whether any of these identified changes play a role in bacterial pathogenesis and virulence. A greater understanding of the phenotypic and genotypic markers associated with bacterial pathogenesis and resistance will allow for the more targeted production of treatment modalities to attenuate these risks. It is imperative we understand the effects of these changes on human health and work towards developing the appropriate tools necessary to combat the formation of these biofilms if we ever hope to make our dreams of interplanetary travel and extraterrestrial colonization a reality. Background
I. Pseudomonas aeruginosa
Pseudomonas aeruginosa is a gram-negative bacterium known for its ability to proliferate and establish biofilm-related infections which are difficult to eradicate. This opportunistic pathogen is responsible for over 11% of all nosocomial infections (Khan et al., 2015) and has been implicated in a variety of infections including chronic wounds, cystic fibrosis, COPD, urinary tract infections, etc. The persistence of P. aeruginosa in these infections is enabled by its extensive metabolic diversity and its ability to form biofilms which enables it to thrive in a variety of stressful environments (Labauve et al., 2012). P. aeruginosa is observed in a vast range of environments, inhabiting soil, water, and vegetation here on Earth, as well as in space, where it has been collected from the human body (Taylor, 1974) and demonstrated to proliferate
P a g e | 2
onboard the space station despite stressors associated with the spaceflight environment (Bruce et al., 2005).
II. Biofilms
A biofilm is a conglomeration of microbial cells which irreversibly attach to a biotic or abiotic surface and enclose themselves in a complex extracellular polymeric substance (EPS) matrix (Donlan, 2002).
Figure 1. Biofilm Development – Biofilm formation allows for single celled organisms to assume a momentary multicellular lifestyle. The conversion of planktonic cells to biofilm occurs secondary to environmental factors, which initiates the initial attachment of planktonic cells to an abiotic or biotic surface. As further planktonic cells attach these cells begin to secrete an extracellular polymeric substance (EPS) within which the biofilm remains embedded. EPS accounts for up to 90% of a biofilms biomass. As the biofilm matures and develops, planktonic cells detach from the biofilm to undergo surface attachment, creating a circular biofilm life cycle (Vasudevan, 2014).
Biofilm formation is considered a survival strategy where microbes create an optimal environment in which they can maximize their abilities to thrive and survive. Bacteria within biofilms are protected from a wide range of environmental stressors including temperature changes, immune responses, and biocides (Kostakioti, 2013). The formation of a biofilm is associated with enhanced bacterial growth, biocide resistance, increased virulence, and greater microbial activity (Kostakioti, 2013). These characteristics are regulated by the expression of unique sets of genes which result in phenotypes drastically different than those of their free standing planktonic counterparts (Donlan, 2002). Biofilms have been observed on a wide variety of surfaces including living tissues, indwelling medical devices, industrial or portable water-system piping, and other organic/inorganic material surfaces (Characklis et al., 1990).
PLANKTONIC BIOFILM
Adhesion to surface
Formation of monolayer and production of
“slime”
Microcolony formation, with
multilayering cells
Mature biofilm with characteristic “mushroom” formed of
polysaccharide Note cells starting to detach, reverting to planktonic
cells and completing the cycle
Detachment and reversion to planktonic growth
P a g e | 3
III. Biofilms in Space
Biofilms in the spaceflight environment have the capacity to cause significant damage to both the spacecraft and crew. There have been numerous documented problems associated with biofilm formation both on the Russian space station Mir as well as on International Space Station (Novikova, 2004). Bacteria in microgravity have been observed to have increased growth phases and higher proliferation rates compared to 1g-controls conducted in parallel on the ground (Kim et al., 2013).
Health hazards linked with biofilm formation in space are of heightened concern due to the suppression of crew member immune responses (Levine et al. 1998) and likely altered levels of virulence in biofilm forming pathogens when exposed to the spaceflight environment (Wilson et al., 2007). Biofilm forming pathogens in immunocompromised persons can be especially deadly, causing severe symptoms, and in many cases death (Hall-Stoodley et al., 2009).
Spacecraft risk hazards linked with biofilms are also associated with material degradation. Biofilms observed on a wide range of surface materials used in the spaceflight environment exhibited greater biocide resistance and often precipitated material degradation (Gu, 1998). If biofilm associated risks are not attenuated there could be serious implications regarding the ability of humans to survive long term spaceflight.
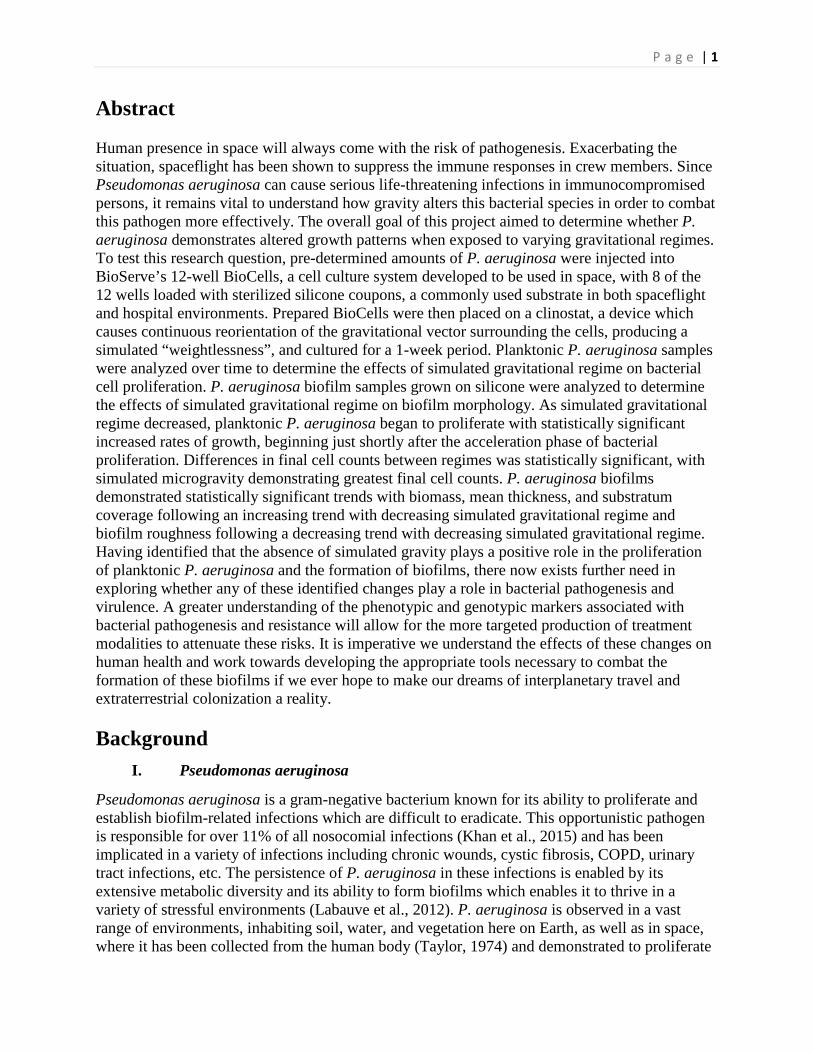
Studies of P. aeruginosa conducted in spaceflight demonstrated novel biofilm architecture, increased number of viable cells, and greater biomass compared to controls conducted in parallel on the ground (Kim et al., 2013).
IV. Biofilms in Healthcare
Biofilms are of great interest in the public health arena due to their role in many infectious diseases and device-related infections (Donlan, 2001). It has been recorded that biofilms develop
Figure 2. Influence of gravity and hydrodynamics on P. aeruginosa biofilm formation – P. aeruginosa biofilms cultured during Space Shuttle Atlantis missions STS-132 and STS-135 demonstrated a unique column-and-canopy structure which had never been seen on Earth before. (Kim et al., 2013)
P a g e | 4
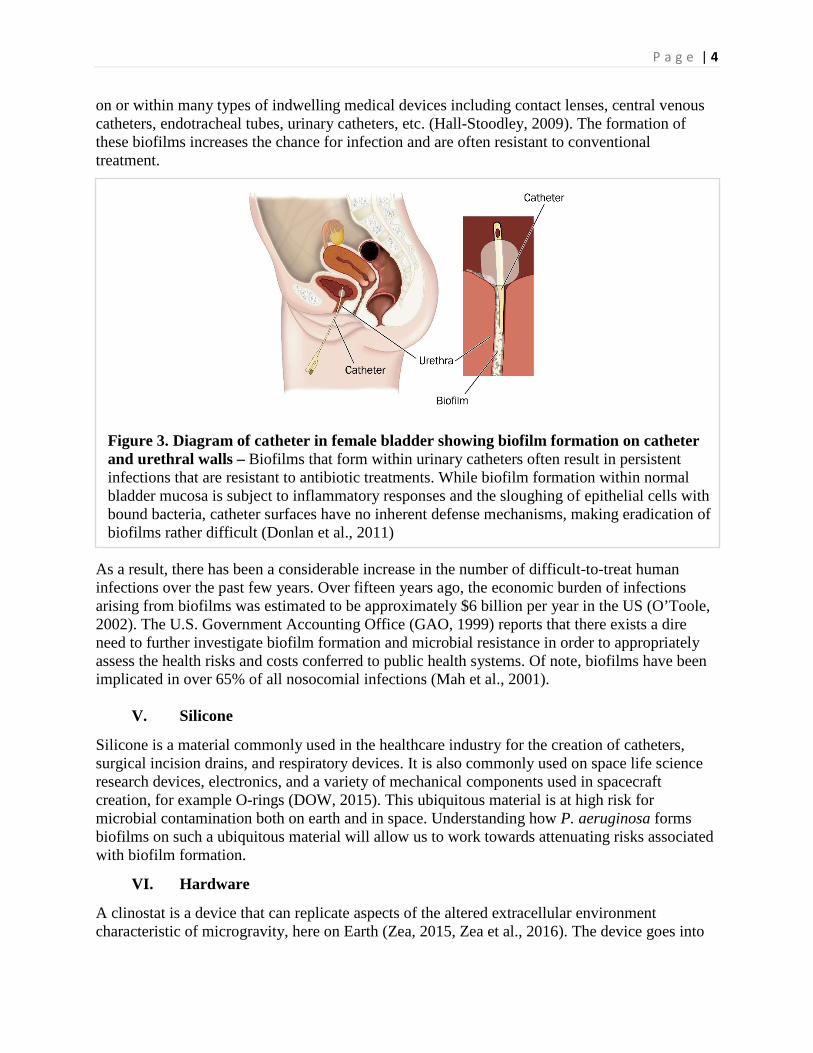
on or within many types of indwelling medical devices including contact lenses, central venous catheters, endotracheal tubes, urinary catheters, etc. (Hall-Stoodley, 2009). The formation of these biofilms increases the chance for infection and are often resistant to conventional treatment.
Figure 3. Diagram of catheter in female bladder showing biofilm formation on catheter and urethral walls – Biofilms that form within urinary catheters often result in persistent infections that are resistant to antibiotic treatments. While biofilm formation within normal bladder mucosa is subject to inflammatory responses and the sloughing of epithelial cells with bound bacteria, catheter surfaces have no inherent defense mechanisms, making eradication of biofilms rather difficult (Donlan et al., 2011)
As a result, there has been a considerable increase in the number of difficult-to-treat human infections over the past few years. Over fifteen years ago, the economic burden of infections arising from biofilms was estimated to be approximately $6 billion per year in the US (O’Toole, 2002). The U.S. Government Accounting Office (GAO, 1999) reports that there exists a dire need to further investigate biofilm formation and microbial resistance in order to appropriately assess the health risks and costs conferred to public health systems. Of note, biofilms have been implicated in over 65% of all nosocomial infections (Mah et al., 2001).
V. Silicone
Silicone is a material commonly used in the healthcare industry for the creation of catheters, surgical incision drains, and respiratory devices. It is also commonly used on space life science research devices, electronics, and a variety of mechanical components used in spacecraft creation, for example O-rings (DOW, 2015). This ubiquitous material is at high risk for microbial contamination both on earth and in space. Understanding how P. aeruginosa forms biofilms on such a ubiquitous material will allow us to work towards attenuating risks associated with biofilm formation.
VI. Hardware
A clinostat is a device that can replicate aspects of the altered extracellular environment characteristic of microgravity, here on Earth (Zea, 2015, Zea et al., 2016). The device goes into
P a g e | 5
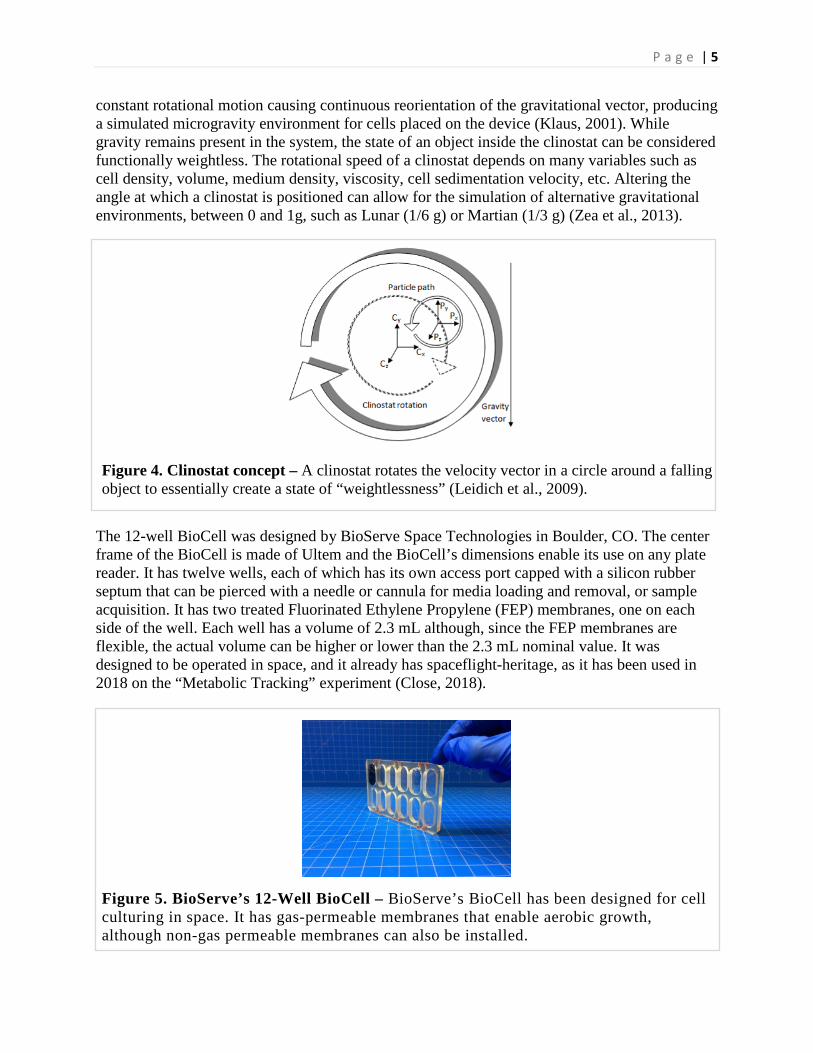
constant rotational motion causing continuous reorientation of the gravitational vector, producing a simulated microgravity environment for cells placed on the device (Klaus, 2001). While gravity remains present in the system, the state of an object inside the clinostat can be considered functionally weightless. The rotational speed of a clinostat depends on many variables such as cell density, volume, medium density, viscosity, cell sedimentation velocity, etc. Altering the angle at which a clinostat is positioned can allow for the simulation of alternative gravitational environments, between 0 and 1g, such as Lunar (1/6 g) or Martian (1/3 g) (Zea et al., 2013).
Figure 4. Clinostat concept – A clinostat rotates the velocity vector in a circle around a falling object to essentially create a state of “weightlessness” (Leidich et al., 2009).
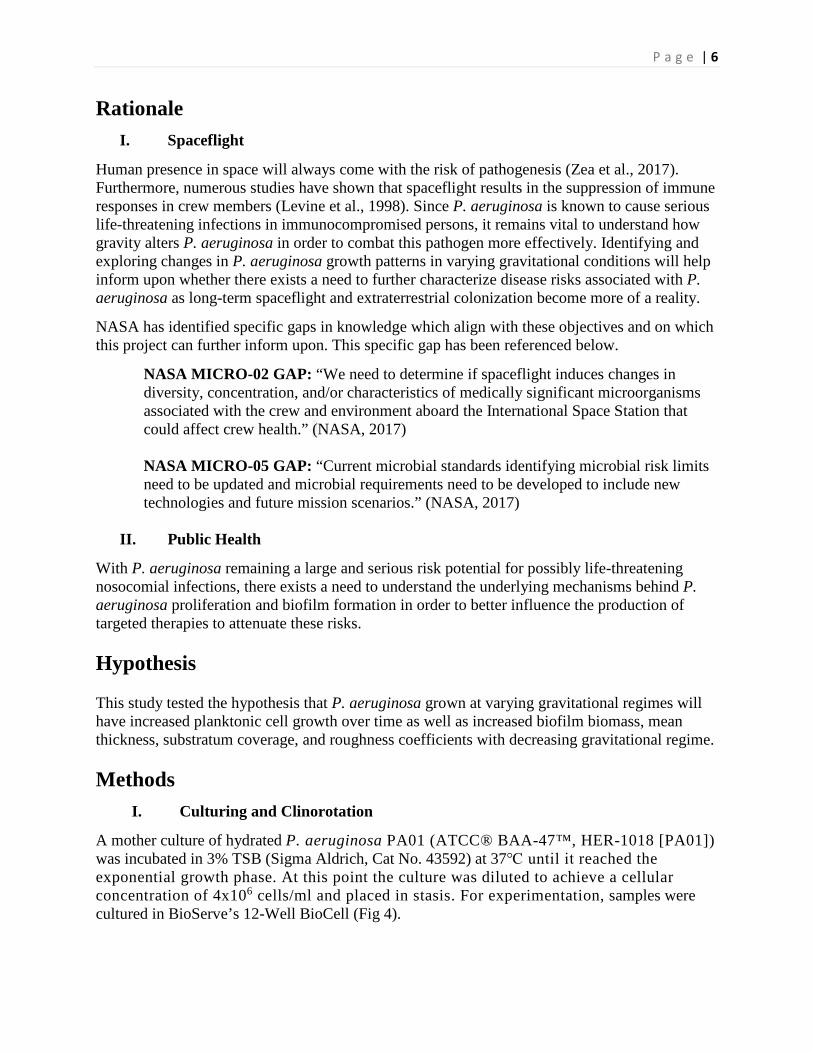
The 12-well BioCell was designed by BioServe Space Technologies in Boulder, CO. The center frame of the BioCell is made of Ultem and the BioCell’s dimensions enable its use on any plate reader. It has twelve wells, each of which has its own access port capped with a silicon rubber septum that can be pierced with a needle or cannula for media loading and removal, or sample acquisition. It has two treated Fluorinated Ethylene Propylene (FEP) membranes, one on each side of the well. Each well has a volume of 2.3 mL although, since the FEP membranes are flexible, the actual volume can be higher or lower than the 2.3 mL nominal value. It was designed to be operated in space, and it already has spaceflight-heritage, as it has been used in 2018 on the “Metabolic Tracking” experiment (Close, 2018).
Figure 5. BioServe’s 12-Well BioCell – BioServe’s BioCell has been designed for cell culturing in space. It has gas-permeable membranes that enable aerobic growth, although non-gas permeable membranes can also be installed.
P a g e | 6
Rationale
I. Spaceflight
Human presence in space will always come with the risk of pathogenesis (Zea et al., 2017). Furthermore, numerous studies have shown that spaceflight results in the suppression of immune responses in crew members (Levine et al., 1998). Since P. aeruginosa is known to cause serious life-threatening infections in immunocompromised persons, it remains vital to understand how gravity alters P. aeruginosa in order to combat this pathogen more effectively. Identifying and exploring changes in P. aeruginosa growth patterns in varying gravitational conditions will help inform upon whether there exists a need to further characterize disease risks associated with P. aeruginosa as long-term spaceflight and extraterrestrial colonization become more of a reality.
NASA has identified specific gaps in knowledge which align with these objectives and on which this project can further inform upon. This specific gap has been referenced below.
NASA MICRO-02 GAP: “We need to determine if spaceflight induces changes in diversity, concentration, and/or characteristics of medically significant microorganisms associated with the crew and environment aboard the International Space Station that could affect crew health.” (NASA, 2017) NASA MICRO-05 GAP: “Current microbial standards identifying microbial risk limits need to be updated and microbial requirements need to be developed to include new technologies and future mission scenarios.” (NASA, 2017)
II. Public Health
With P. aeruginosa remaining a large and serious risk potential for possibly life-threatening nosocomial infections, there exists a need to understand the underlying mechanisms behind P. aeruginosa proliferation and biofilm formation in order to better influence the production of targeted therapies to attenuate these risks. Hypothesis
This study tested the hypothesis that P. aeruginosa grown at varying gravitational regimes will have increased planktonic cell growth over time as well as increased biofilm biomass, mean thickness, substratum coverage, and roughness coefficients with decreasing gravitational regime. Methods
I. Culturing and Clinorotation
A mother culture of hydrated P. aeruginosa PA01 (ATCC® BAA-47™, HER-1018 [PA01]) was incubated in 3% TSB (Sigma Aldrich, Cat No. 43592) at 37℃ until it reached the exponential growth phase. At this point the culture was diluted to achieve a cellular concentration of 4x10⁶ cells/ml and placed in stasis. For experimentation, samples were cultured in BioServe’s 12-Well BioCell (Fig 4).
P a g e | 7
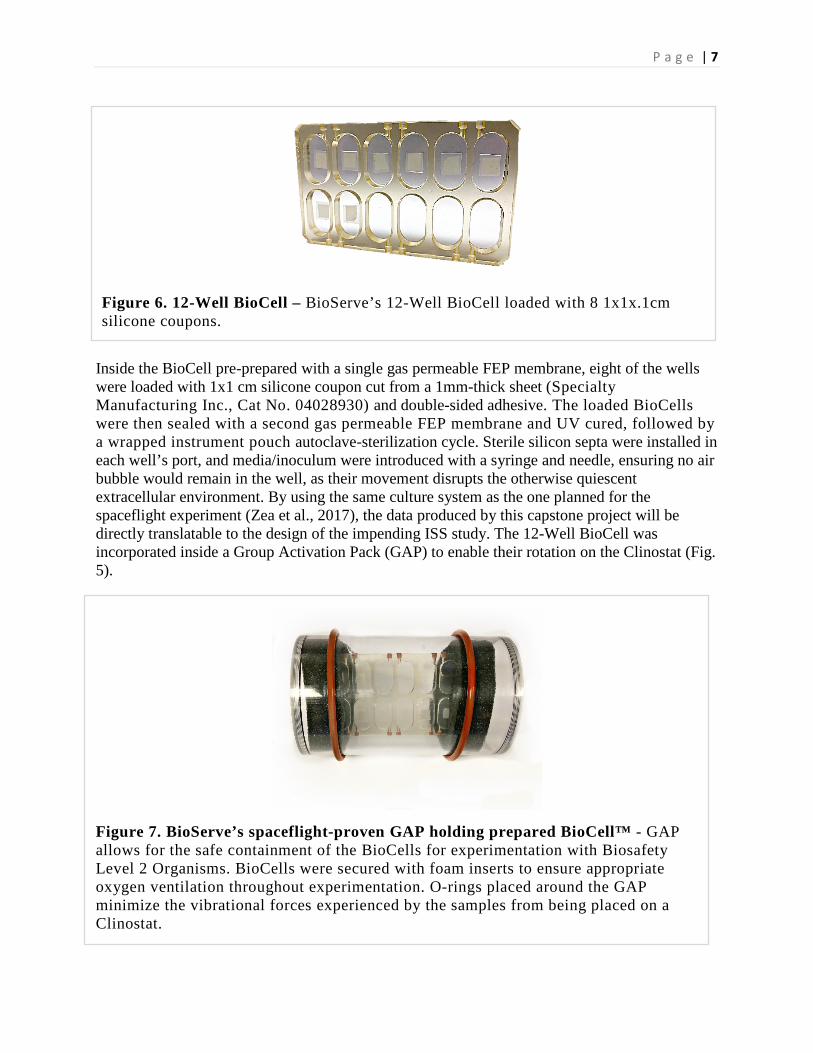
Figure 6. 12-Well BioCell – BioServe’s 12-Well BioCell loaded with 8 1x1x.1cm silicone coupons.
Inside the BioCell pre-prepared with a single gas permeable FEP membrane, eight of the wells were loaded with 1x1 cm silicone coupon cut from a 1mm-thick sheet (Specialty Manufacturing Inc., Cat No. 04028930) and double-sided adhesive. The loaded BioCells were then sealed with a second gas permeable FEP membrane and UV cured, followed by a wrapped instrument pouch autoclave-sterilization cycle. Sterile silicon septa were installed in each well’s port, and media/inoculum were introduced with a syringe and needle, ensuring no air bubble would remain in the well, as their movement disrupts the otherwise quiescent extracellular environment. By using the same culture system as the one planned for the spaceflight experiment (Zea et al., 2017), the data produced by this capstone project will be directly translatable to the design of the impending ISS study. The 12-Well BioCell was incorporated inside a Group Activation Pack (GAP) to enable their rotation on the Clinostat (Fig. 5).
Figure 7. BioServe’s spaceflight-proven GAP holding prepared BioCell™ - GAP allows for the safe containment of the BioCells for experimentation with Biosafety Level 2 Organisms. BioCells were secured with foam inserts to ensure appropriate oxygen ventilation throughout experimentation. O-rings placed around the GAP minimize the vibrational forces experienced by the samples from being placed on a Clinostat.
P a g e | 8
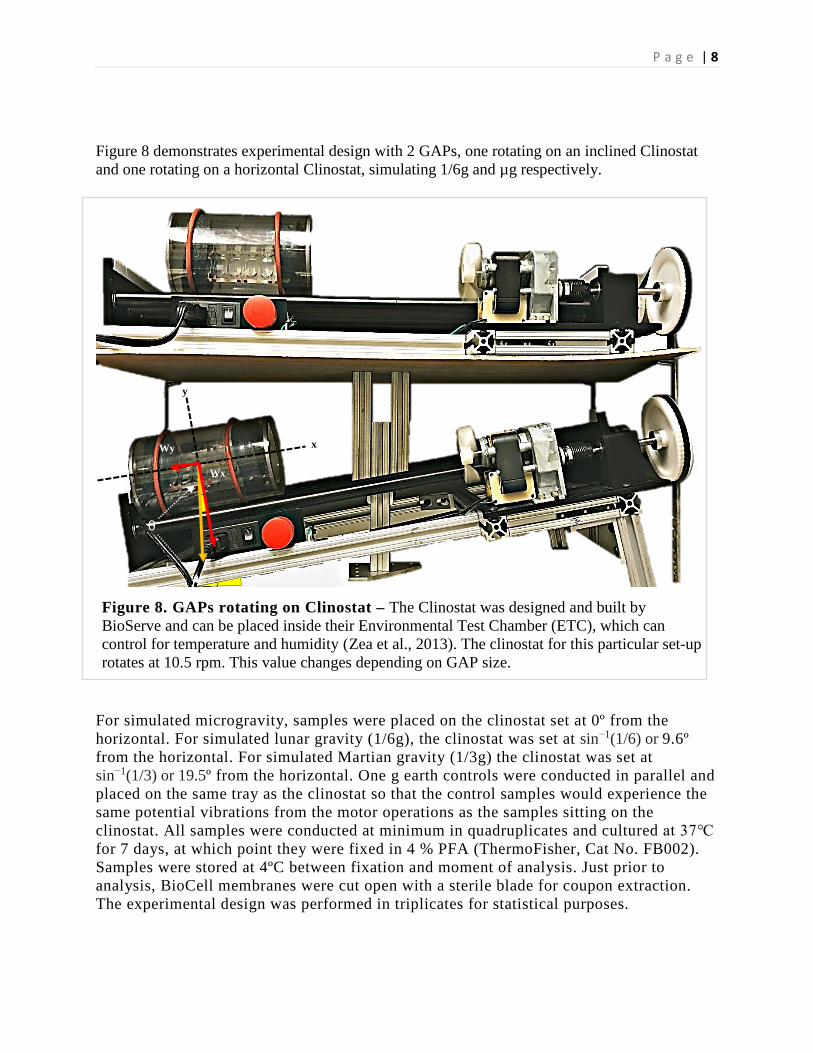
Figure 8 demonstrates experimental design with 2 GAPs, one rotating on an inclined Clinostat and one rotating on a horizontal Clinostat, simulating 1/6g and µg respectively.
Figure 8. GAPs rotating on Clinostat – The Clinostat was designed and built by BioServe and can be placed inside their Environmental Test Chamber (ETC), which can control for temperature and humidity (Zea et al., 2013). The clinostat for this particular set-up rotates at 10.5 rpm. This value changes depending on GAP size.
For simulated microgravity, samples were placed on the clinostat set at 0º from the horizontal. For simulated lunar gravity (1/6g), the clinostat was set at sin−1(1/6) or 9.6º from the horizontal. For simulated Martian gravity (1/3g) the clinostat was set at sin−1(1/3) or 19.5º from the horizontal. One g earth controls were conducted in parallel and placed on the same tray as the clinostat so that the control samples would experience the same potential vibrations from the motor operations as the samples sitting on the clinostat. All samples were conducted at minimum in quadruplicates and cultured at 37℃ for 7 days, at which point they were fixed in 4 % PFA (ThermoFisher, Cat No. FB002). Samples were stored at 4ºC between fixation and moment of analysis. Just prior to analysis, BioCell membranes were cut open with a sterile blade for coupon extraction. The experimental design was performed in triplicates for statistical purposes.
θ
Wy
Wx
x
y
P a g e | 9
II. Imaging and Data Collection
After fixation, all biofilm samples were stained with a solution containing 10 µg/mL DAPI diluted in dH2O (ThermoFisher, Cat No. D1306) and SYPRO Ruby matrix stain (ThermoFisher, Cat No. F10318) and analyzed via Nikon A1 laser scanning confocal with 2x standard PMT and 2x high sensitivity GaAsP Detectors at 100x. Z-stacks were acquired for each sample at varying z-distances and analyzed on MATLAB (The Mathworks, Natick, MA) utilizing a code adapted from COMSTAT (Vorregaard, M, 2008). Z-stacks were processed to remove noise and converted from an RGB stack to a binary stack, which was used to then calculate biofilm biomass, substratum coverage, mean thickness, and roughness coefficients. Mean thickness measures the spatial dimension of the biofilm. Dimensionless roughness coefficient measures biofilm heterogeneity. Substratum coverage indicates how well a strain colonizes a substratum. Biomass measures the gross amount of bacteria within the biofilm.
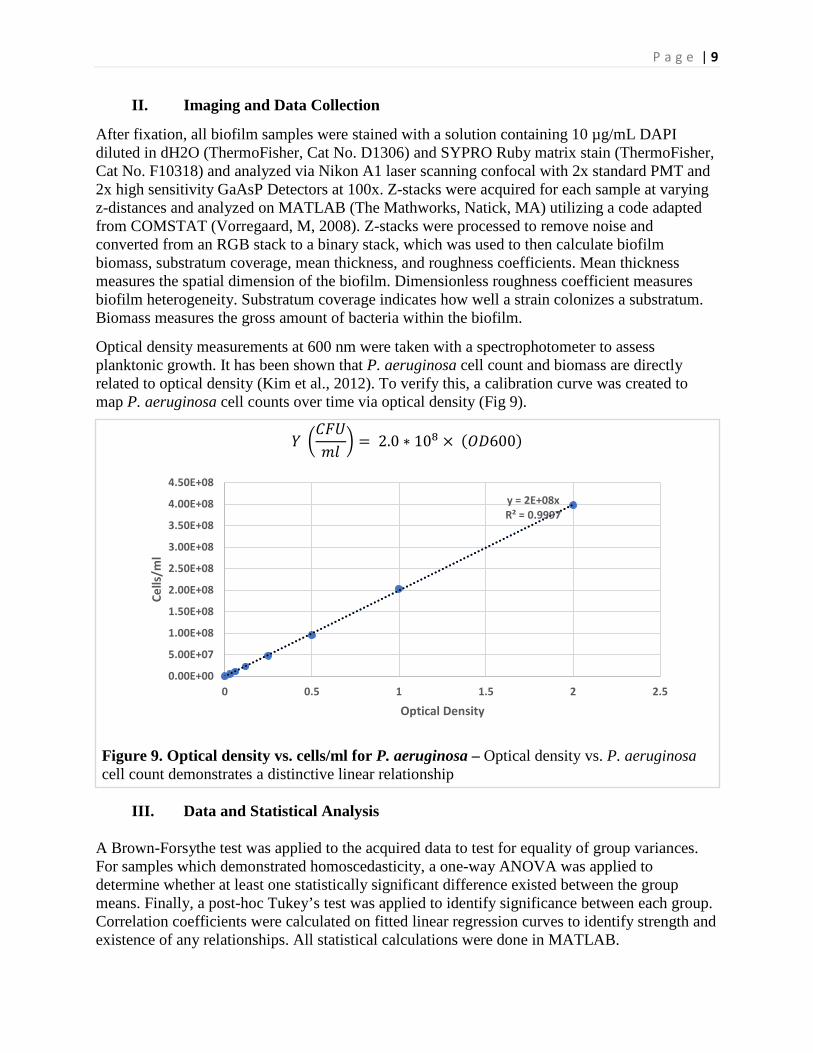
Optical density measurements at 600 nm were taken with a spectrophotometer to assess planktonic growth. It has been shown that P. aeruginosa cell count and biomass are directly related to optical density (Kim et al., 2012). To verify this, a calibration curve was created to map P. aeruginosa cell counts over time via optical density (Fig 9).
𝑌𝑌 �𝐶𝐶𝐶𝐶𝐶𝐶𝑚𝑚𝑚𝑚
� = 2.0 ∗ 108 × (𝑂𝑂𝑂𝑂600)
Figure 9. Optical density vs. cells/ml for P. aeruginosa – Optical density vs. P. aeruginosa cell count demonstrates a distinctive linear relationship
III. Data and Statistical Analysis
A Brown-Forsythe test was applied to the acquired data to test for equality of group variances. For samples which demonstrated homoscedasticity, a one-way ANOVA was applied to determine whether at least one statistically significant difference existed between the group means. Finally, a post-hoc Tukey’s test was applied to identify significance between each group. Correlation coefficients were calculated on fitted linear regression curves to identify strength and existence of any relationships. All statistical calculations were done in MATLAB.
y = 2E+08xR² = 0.9997
0.00E+00
5.00E+07
1.00E+08
1.50E+08
2.00E+08
2.50E+08
3.00E+08
3.50E+08
4.00E+08
4.50E+08
0 0.5 1 1.5 2 2.5
Cells
/ml
Optical Density
P a g e | 10
IV. Modeling
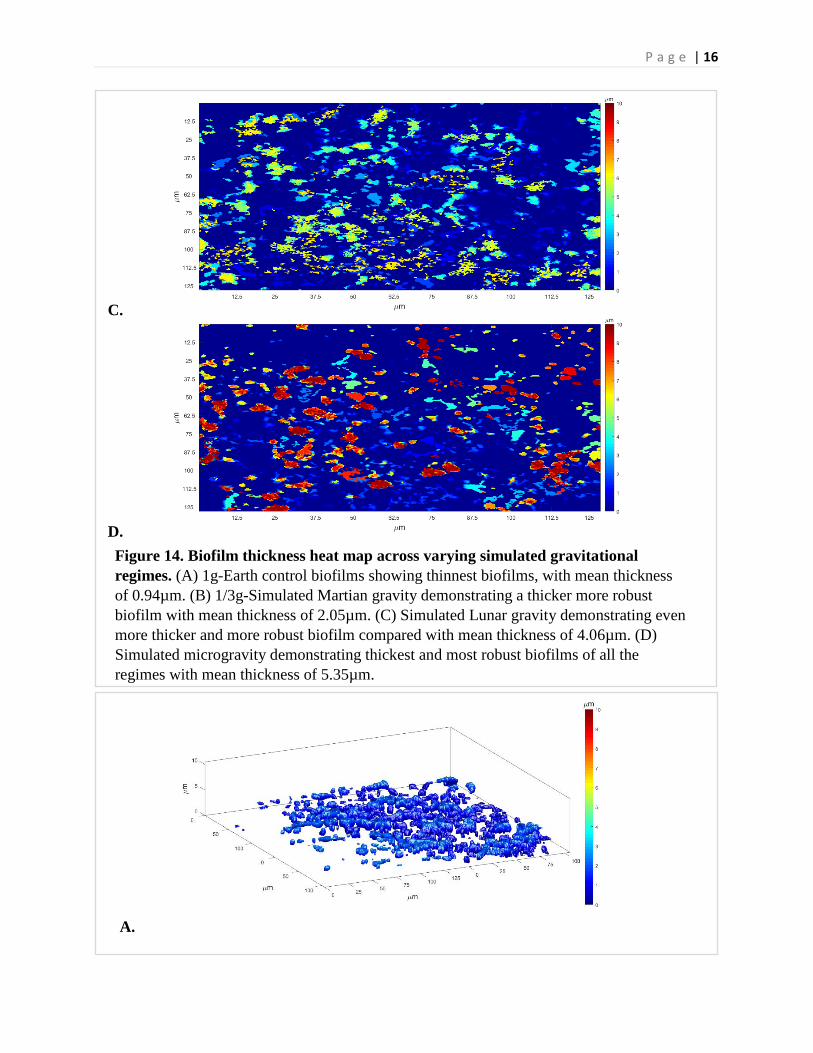
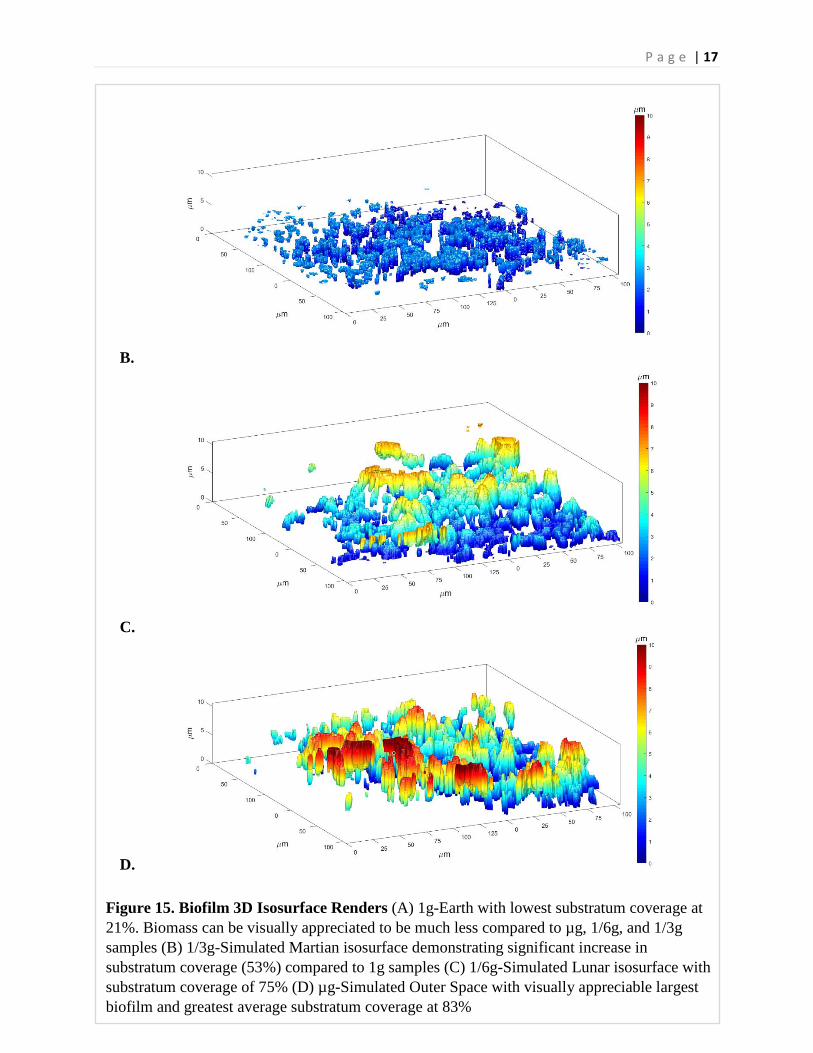
3D visualizations of biofilm surface properties were rendered utilizing the acquired z-stacks in MATLAB (Mathworks). A 3D biofilm centroid plot was created by plotting the centroid location of each cell within the biofilm on a 3-dimensional axis. A thickness heat map of the biofilm was rendered to demonstrate the overall thickness distribution of the biofilm on a 2-dimensional axis. Finally, a 3D isosurface render was created to allow for the qualitative appreciation of the biofilms.
Results
I. Simulated Gravitational Regime Alters Planktonic Bacterial Proliferation
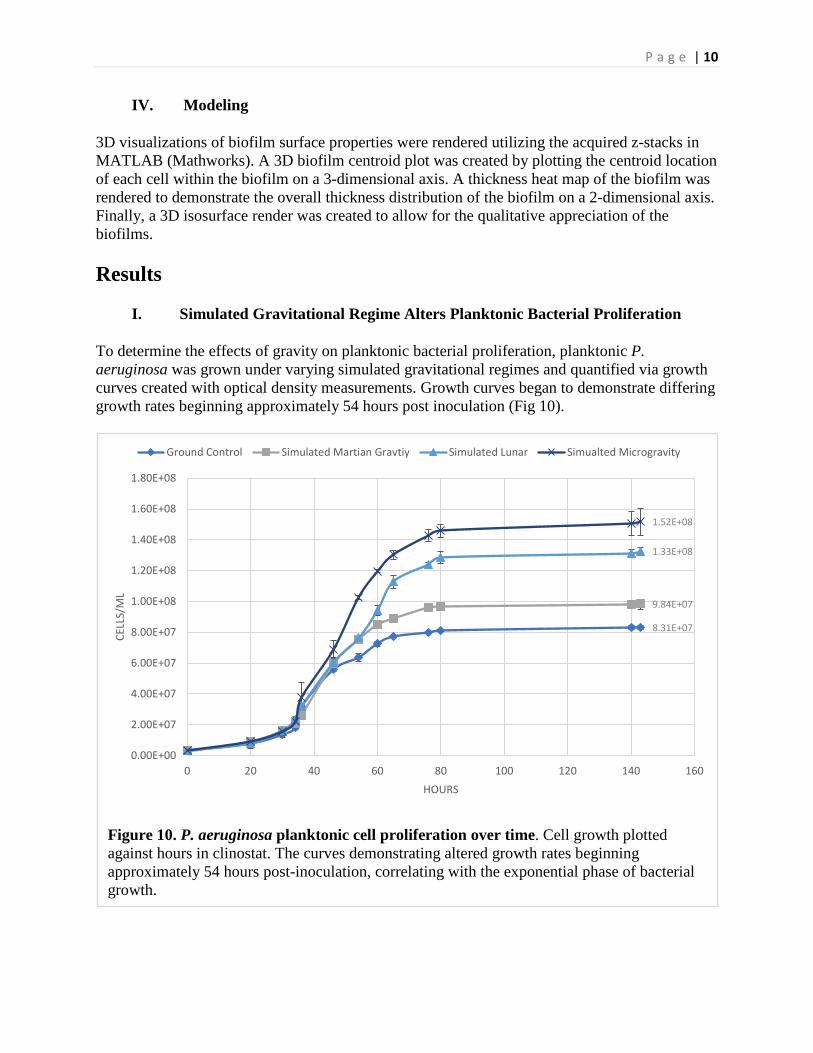
To determine the effects of gravity on planktonic bacterial proliferation, planktonic P. aeruginosa was grown under varying simulated gravitational regimes and quantified via growth curves created with optical density measurements. Growth curves began to demonstrate differing growth rates beginning approximately 54 hours post inoculation (Fig 10).
Figure 10. P. aeruginosa planktonic cell proliferation over time. Cell growth plotted against hours in clinostat. The curves demonstrating altered growth rates beginning approximately 54 hours post-inoculation, correlating with the exponential phase of bacterial growth.
8.31E+07
9.84E+07
1.33E+08
1.52E+08
0.00E+00
2.00E+07
4.00E+07
6.00E+07
8.00E+07
1.00E+08
1.20E+08
1.40E+08
1.60E+08
1.80E+08
0 20 40 60 80 100 120 140 160
CELL
S/M
L
HOURS
Ground Control Simulated Martian Gravtiy Simulated Lunar Simualted Microgravity
P a g e | 11
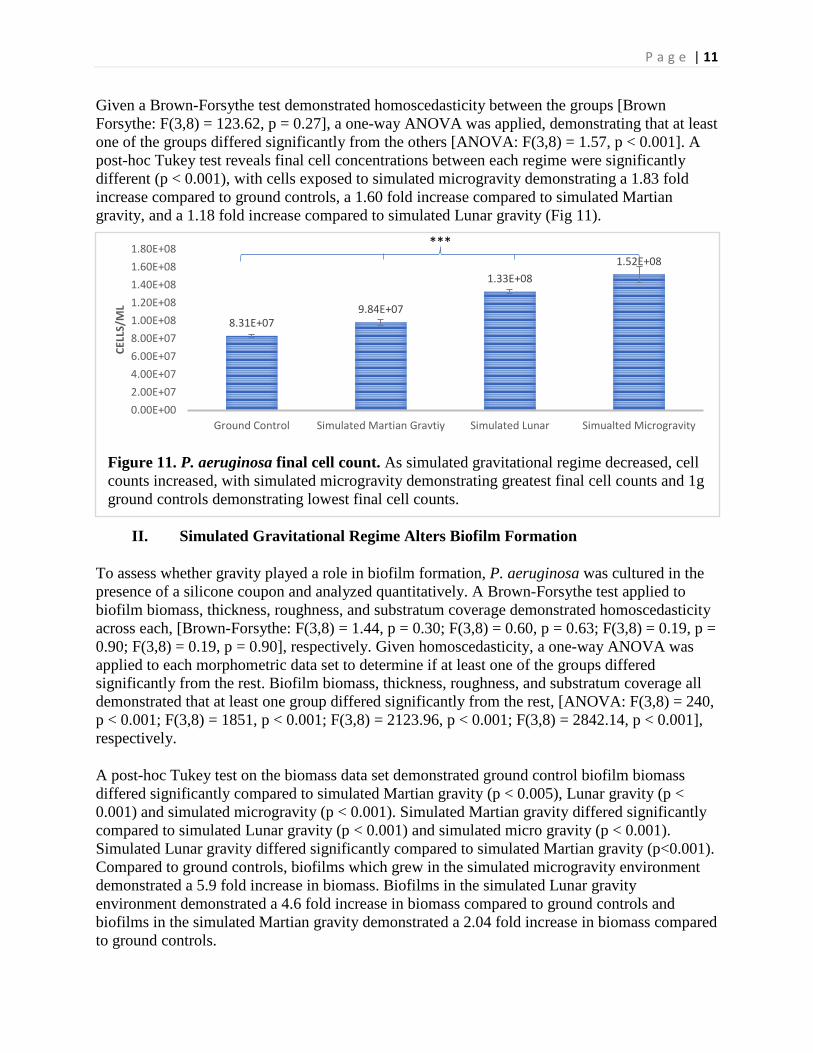
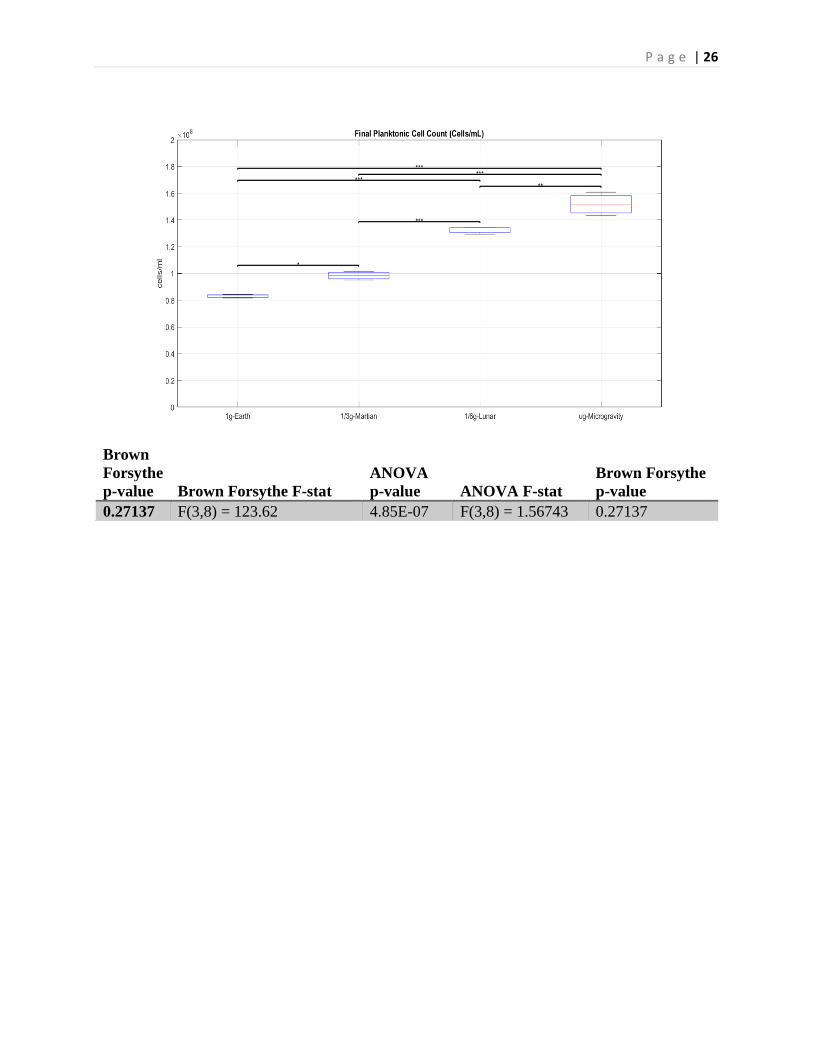
Given a Brown-Forsythe test demonstrated homoscedasticity between the groups [Brown Forsythe: F(3,8) = 123.62, p = 0.27], a one-way ANOVA was applied, demonstrating that at least one of the groups differed significantly from the others [ANOVA: F(3,8) = 1.57, p < 0.001]. A post-hoc Tukey test reveals final cell concentrations between each regime were significantly different (p < 0.001), with cells exposed to simulated microgravity demonstrating a 1.83 fold increase compared to ground controls, a 1.60 fold increase compared to simulated Martian gravity, and a 1.18 fold increase compared to simulated Lunar gravity (Fig 11).
Figure 11. P. aeruginosa final cell count. As simulated gravitational regime decreased, cell counts increased, with simulated microgravity demonstrating greatest final cell counts and 1g ground controls demonstrating lowest final cell counts.
II. Simulated Gravitational Regime Alters Biofilm Formation
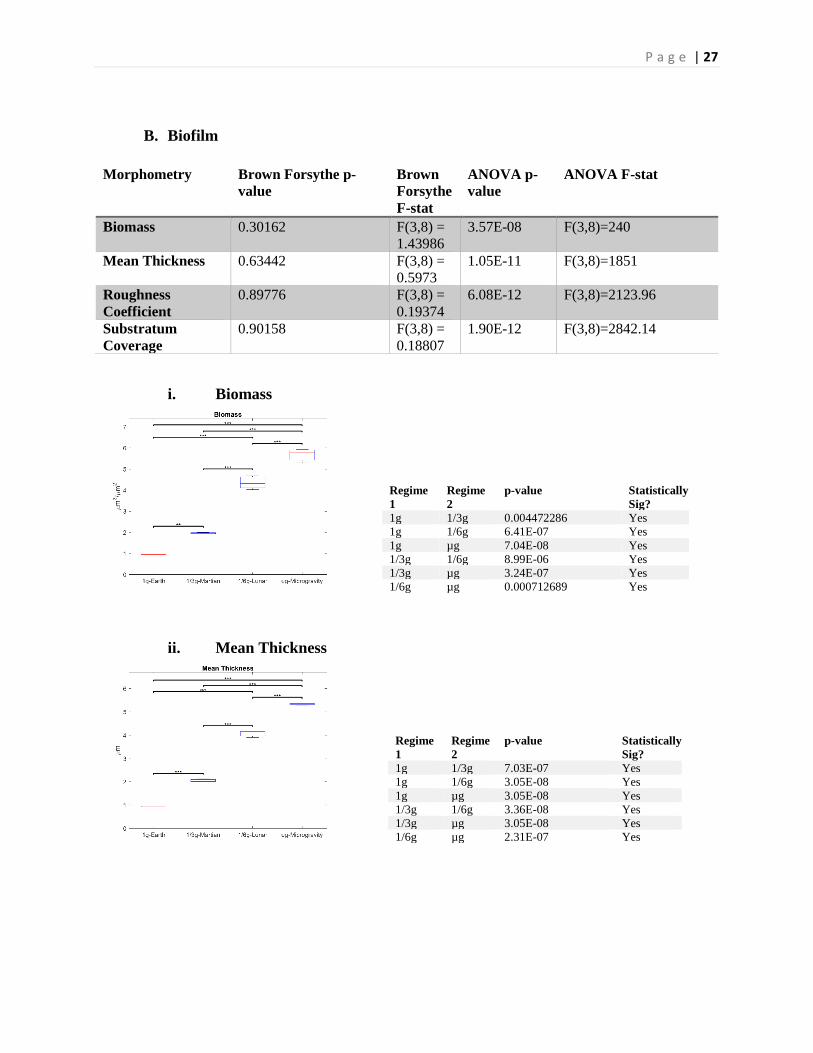
To assess whether gravity played a role in biofilm formation, P. aeruginosa was cultured in the presence of a silicone coupon and analyzed quantitatively. A Brown-Forsythe test applied to biofilm biomass, thickness, roughness, and substratum coverage demonstrated homoscedasticity across each, [Brown-Forsythe: F(3,8) = 1.44, p = 0.30; F(3,8) = 0.60, p = 0.63; F(3,8) = 0.19, p = 0.90; F(3,8) = 0.19, p = 0.90], respectively. Given homoscedasticity, a one-way ANOVA was applied to each morphometric data set to determine if at least one of the groups differed significantly from the rest. Biofilm biomass, thickness, roughness, and substratum coverage all demonstrated that at least one group differed significantly from the rest, [ANOVA: F(3,8) = 240, p < 0.001; F(3,8) = 1851, p < 0.001; F(3,8) = 2123.96, p < 0.001; F(3,8) = 2842.14, p < 0.001], respectively.
A post-hoc Tukey test on the biomass data set demonstrated ground control biofilm biomass differed significantly compared to simulated Martian gravity (p < 0.005), Lunar gravity (p < 0.001) and simulated microgravity (p < 0.001). Simulated Martian gravity differed significantly compared to simulated Lunar gravity (p < 0.001) and simulated micro gravity (p < 0.001). Simulated Lunar gravity differed significantly compared to simulated Martian gravity (p<0.001). Compared to ground controls, biofilms which grew in the simulated microgravity environment demonstrated a 5.9 fold increase in biomass. Biofilms in the simulated Lunar gravity environment demonstrated a 4.6 fold increase in biomass compared to ground controls and biofilms in the simulated Martian gravity demonstrated a 2.04 fold increase in biomass compared to ground controls.
8.31E+079.84E+07
1.33E+081.52E+08
0.00E+002.00E+074.00E+076.00E+078.00E+071.00E+081.20E+081.40E+081.60E+081.80E+08
Ground Control Simulated Martian Gravtiy Simulated Lunar Simualted Microgravity
CELL
S/M
L
***
P a g e | 12
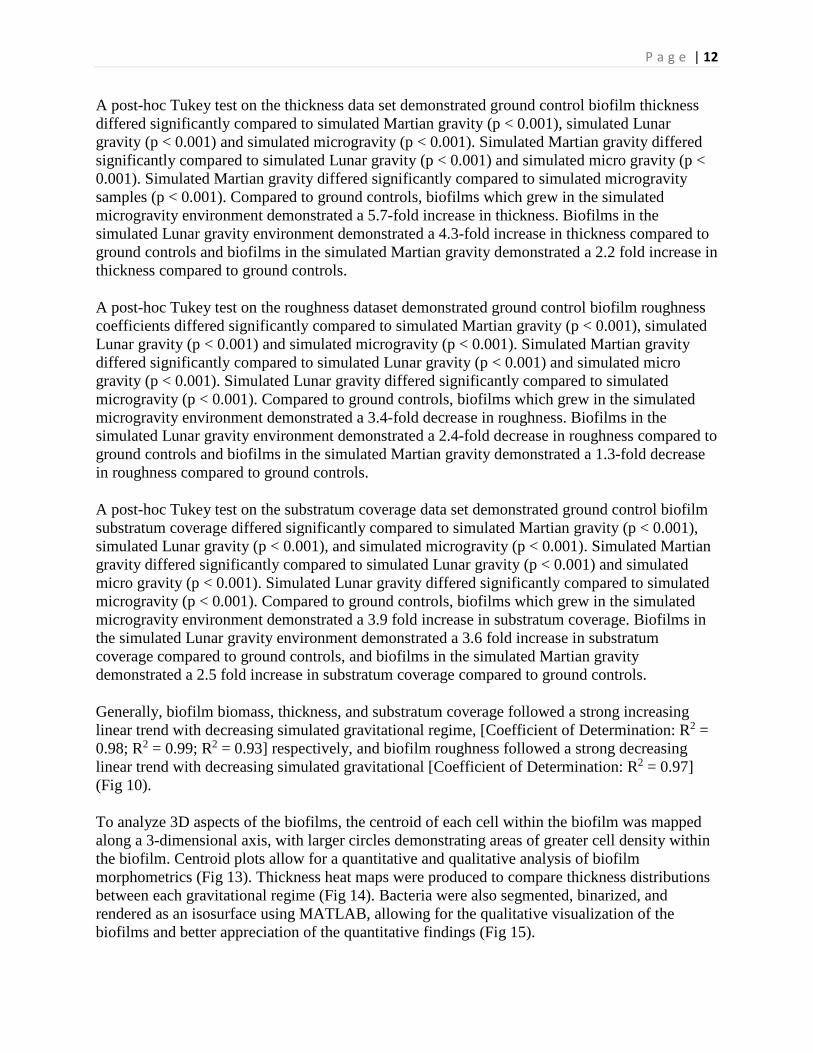
A post-hoc Tukey test on the thickness data set demonstrated ground control biofilm thickness differed significantly compared to simulated Martian gravity (p < 0.001), simulated Lunar gravity (p < 0.001) and simulated microgravity (p < 0.001). Simulated Martian gravity differed significantly compared to simulated Lunar gravity (p < 0.001) and simulated micro gravity (p < 0.001). Simulated Martian gravity differed significantly compared to simulated microgravity samples (p < 0.001). Compared to ground controls, biofilms which grew in the simulated microgravity environment demonstrated a 5.7-fold increase in thickness. Biofilms in the simulated Lunar gravity environment demonstrated a 4.3-fold increase in thickness compared to ground controls and biofilms in the simulated Martian gravity demonstrated a 2.2 fold increase in thickness compared to ground controls.
A post-hoc Tukey test on the roughness dataset demonstrated ground control biofilm roughness coefficients differed significantly compared to simulated Martian gravity (p < 0.001), simulated Lunar gravity (p < 0.001) and simulated microgravity (p < 0.001). Simulated Martian gravity differed significantly compared to simulated Lunar gravity (p < 0.001) and simulated micro gravity (p < 0.001). Simulated Lunar gravity differed significantly compared to simulated microgravity (p < 0.001). Compared to ground controls, biofilms which grew in the simulated microgravity environment demonstrated a 3.4-fold decrease in roughness. Biofilms in the simulated Lunar gravity environment demonstrated a 2.4-fold decrease in roughness compared to ground controls and biofilms in the simulated Martian gravity demonstrated a 1.3-fold decrease in roughness compared to ground controls.
A post-hoc Tukey test on the substratum coverage data set demonstrated ground control biofilm substratum coverage differed significantly compared to simulated Martian gravity (p < 0.001), simulated Lunar gravity (p < 0.001), and simulated microgravity (p < 0.001). Simulated Martian gravity differed significantly compared to simulated Lunar gravity (p < 0.001) and simulated micro gravity (p < 0.001). Simulated Lunar gravity differed significantly compared to simulated microgravity (p < 0.001). Compared to ground controls, biofilms which grew in the simulated microgravity environment demonstrated a 3.9 fold increase in substratum coverage. Biofilms in the simulated Lunar gravity environment demonstrated a 3.6 fold increase in substratum coverage compared to ground controls, and biofilms in the simulated Martian gravity demonstrated a 2.5 fold increase in substratum coverage compared to ground controls.
Generally, biofilm biomass, thickness, and substratum coverage followed a strong increasing linear trend with decreasing simulated gravitational regime, [Coefficient of Determination: R2 = 0.98; R2 = 0.99; R2 = 0.93] respectively, and biofilm roughness followed a strong decreasing linear trend with decreasing simulated gravitational [Coefficient of Determination: R2 = 0.97] (Fig 10).
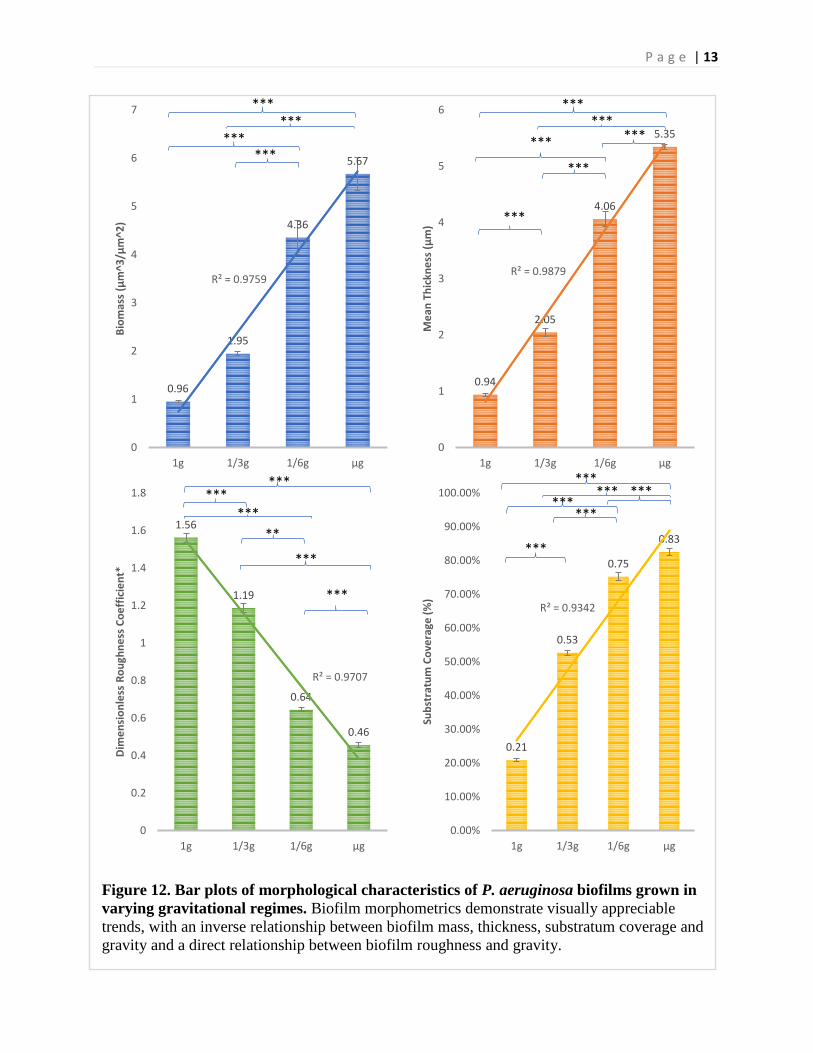
To analyze 3D aspects of the biofilms, the centroid of each cell within the biofilm was mapped along a 3-dimensional axis, with larger circles demonstrating areas of greater cell density within the biofilm. Centroid plots allow for a quantitative and qualitative analysis of biofilm morphometrics (Fig 13). Thickness heat maps were produced to compare thickness distributions between each gravitational regime (Fig 14). Bacteria were also segmented, binarized, and rendered as an isosurface using MATLAB, allowing for the qualitative visualization of the biofilms and better appreciation of the quantitative findings (Fig 15).
P a g e | 13
Figure 12. Bar plots of morphological characteristics of P. aeruginosa biofilms grown in varying gravitational regimes. Biofilm morphometrics demonstrate visually appreciable trends, with an inverse relationship between biofilm mass, thickness, substratum coverage and gravity and a direct relationship between biofilm roughness and gravity.
0.96
1.95
4.36
5.67
R² = 0.9759
0
1
2
3
4
5
6
7
1g 1/3g 1/6g µg
Biom
ass
(µm
^3/µ
m^2
)
0.94
2.05
4.06
5.35
R² = 0.9879
0
1
2
3
4
5
6
1g 1/3g 1/6g µg
Mea
n Th
ickn
ess (
µm)
1.56
1.19
0.64
0.46
R² = 0.9707
0
0.2
0.4
0.6
0.8
1
1.2
1.4
1.6
1.8
1g 1/3g 1/6g µg
Dim
ensi
onle
ss R
ough
ness
Coe
ffic
ient
*
0.21
0.53
0.75
0.83
R² = 0.9342
0.00%
10.00%
20.00%
30.00%
40.00%
50.00%
60.00%
70.00%
80.00%
90.00%
100.00%
1g 1/3g 1/6g µg
Subs
trat
um C
over
age
(%)
*** ***
*** ***
*** ***
*** ***
***
*** ***
***
***
*** ***
**
***
***
***
***
***
***
P a g e | 14
A.
B.
C.
P a g e | 15
D.
A.
B.
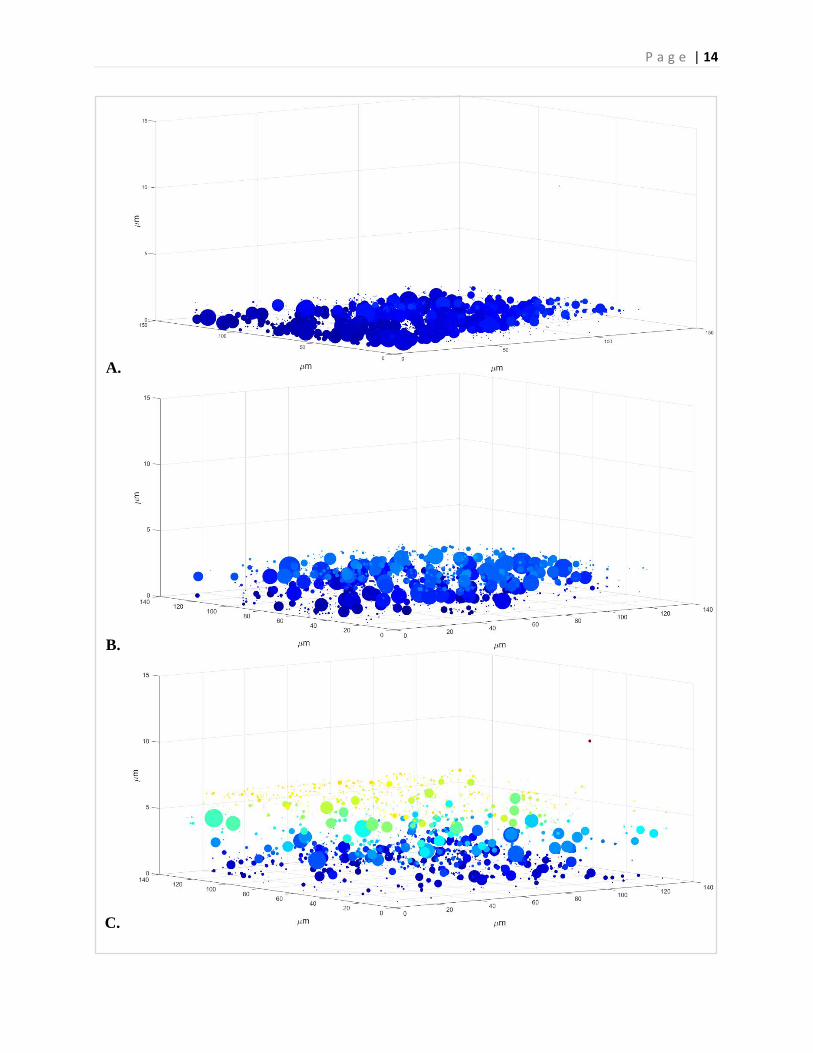
Figure 13. Biofilm centroid plot across varying simulated gravitational regimes. (A) 1g-Earth control biofilms showing smallest biofilms, with biomass of 0.96µm3/µm2. (B) 1/3g-Simulated Martian gravity demonstrating a more robust biofilm with biomass of 1.95µm3/ µm2. (C) Simulated Lunar gravity demonstrating an even greater biofilm with biomass of 4.36µm3/µm2. (D) Simulated microgravity demonstrating most robust biofilm of all the regimes with biomass of 5.57µm3/µm2.
P a g e | 16
C.
D.
A.
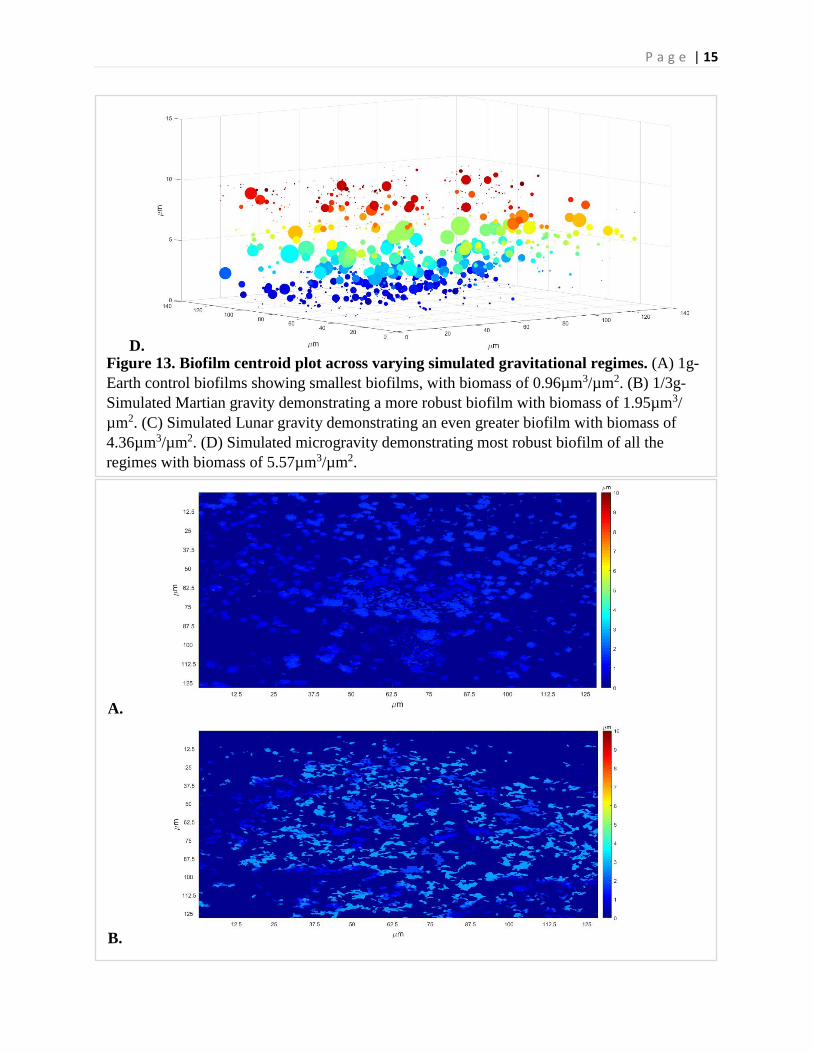
Figure 14. Biofilm thickness heat map across varying simulated gravitational regimes. (A) 1g-Earth control biofilms showing thinnest biofilms, with mean thickness of 0.94µm. (B) 1/3g-Simulated Martian gravity demonstrating a thicker more robust biofilm with mean thickness of 2.05µm. (C) Simulated Lunar gravity demonstrating even more thicker and more robust biofilm compared with mean thickness of 4.06µm. (D) Simulated microgravity demonstrating thickest and most robust biofilms of all the regimes with mean thickness of 5.35µm.
P a g e | 17
Figure 15. Biofilm 3D Isosurface Renders (A) 1g-Earth with lowest substratum coverage at 21%. Biomass can be visually appreciated to be much less compared to µg, 1/6g, and 1/3g samples (B) 1/3g-Simulated Martian isosurface demonstrating significant increase in substratum coverage (53%) compared to 1g samples (C) 1/6g-Simulated Lunar isosurface with substratum coverage of 75% (D) µg-Simulated Outer Space with visually appreciable largest biofilm and greatest average substratum coverage at 83%
B.
C.
D.
P a g e | 18
Discussion
In this project, we have clearly demonstrated that simulated gravitational regime plays a major role in the proliferation of bacteria and the formation of biofilms. The incremental reduction of simulated gravity from the1g standard of Earth positively correlates with the promotion of both planktonic proliferation and biofilm formation. This behavior is hypothesized to be the result of the loss of a convection process driven by gravitational forces. The loss of this process results in a reduction in extracellular nutrient availability and accumulation of bacterial waste products near the cell. Given both these effects are considered stressors within the immediate bacterial environment, certain stress response pathways within the bacterium are upregulated, altering bacterial behavior, including improved biofilm formation and proliferation (Zea et al., 2016).
The data from this study suggests that the specific opportunistic pathogen P. aeruginosa could proliferate with greater capacity both in the Lunar and Martian environments, but that the microgravity environment would be by far the worst when considering human health implications, with final cell concentrations increasing by nearly 72% compared to 1g-Earth controls. It should be noted that there were no statistically significant differences observed between regimes during lag and acceleration phases. These findings have been demonstrated in previous spaceflight experiments, where E.Coli cultured in space demonstrated statistically significant differences in final cell counts compared to Earth controls, but there appeared to be no statistically significant differences when comparing cell count values during the lag and acceleration phases of bacterial growth (Zea et al., 2017). The molecular mechanism by which these phenotypic changes are induced remains to be determined.
With increased planktonic proliferation capacities under decreased simulated gravitational conditions, it comes as no surprise that biofilm biomass and thickness morphometrics were increased in a similar fashion, given planktonic cells play a key role in the biofilm maturation cycle. It is generally assumed that cells found deep within thick biofilms are able to proliferate despite decreased nutrient access, and are less accessible for antibiotic penetration, allowing them to continue proliferating despite aggressive treatment regimens and ultimately making them incredibly difficult to eradicate (Ito et al., 2009). With thicker more robust biofilms forming in the absence of gravity comes the greater chance of antibiotic resistance and eradication difficulties. While this has yet to be demonstrated with the opportunistic pathogen P. aeruginosa, it has been demonstrated that E. Coli, a similar gram-negative pathogen, when exposed to the spaceflight environment, upregulated their stress response pathways related to antibiotic stress, resulting in increased antibiotic resistance (Zea et al., 2016).
In an attempt to combat the formation of biofilms here on Earth, especially in the hospital environment, medical device manufacturers have been utilizing substrates, such as silicone, that are known to be resistant to bacterial attachment, the initiating step of biofilm formation. Unfortunately, compared to 1g-Earth controls, all 3 decreased simulated gravitational regimes demonstrated significantly increased substratum coverage, indicating an increased affinity for the substrate and perhaps an alteration in bacterial adhesion pathways. Interestingly, with increasing substratum coverage in conjunction with decreasing roughness coefficients, it appears that the simulated absence of gravity hinders the formation of microcolonies (Heydorn, 2000), a hallmark characteristic of traditional biofilms, where groups of 50 cells or more spontaneously aggregate
P a g e | 19
(Zhao et al.,2013). While previous microgravity studies have reported greater cell aggregation in spaceflight samples with respect to Earth, for example S. typhimurium exhibiting clear differences in cell aggregation and clumping (Wilson et al., 2007), Pseudomonas aeruginosa cultured in spaceflight did not demonstrate cell clustering (Kim et al., 2013), consistent with the findings in this study, and alludes to the importance of studying a wide variety of microorganisms in the spaceflight environment secondary to extensive and varied responses. Although the precise mechanism and importance of microcolonies is yet to be determined, whether the decrease of microcolonies plays a role in P. aeruginosa virulence and pathogenesis remains vital to be explored should we hope to fully understand how to eradicate these super-biofilms.
To the best of our knowledge, the findings from this study are the first to demonstrate with certainty that simulated gravitational regime does in fact play a direct role in the proliferation and formation of P. aeruginosa, having explored not only microgravity, but also 1/3g and 1/6g, Martian and Lunar gravitational regimes respectively. With a successful ground control phase, the next step involves finalizing the experimental design to be sent up to space. The spaceflight portion of this biofilm study is scheduled to launch to the International Space Station early to mid-2019.
Given the novel nature of this study, many further studies are needed to elucidate the underlying mechanisms of these changes to determine how/if these changes pose threats to long-term space flight missions and eventual Lunar and Martian colonies. A greater understanding of the phenotypic and genotypic markers which are associated with bacterial pathogenesis and resistance will allow for the more targeted production of treatment modalities. It is imperative we understand the effects of these changes on human health and work towards developing the appropriate tools necessary to combat the formation of these biofilms if we ever hope to make our dreams of interplanetary travel and extraterrestrial colonization a reality.
References 1. Brown, M. B., and Forsythe, A. B. (1974). Robust tests for the equality of variances. J.
Am. Stat. Assoc. 69, 364–367. doi: 10.1080/01621459.1974.10482955 2. Bruce, R. J., C. M. Ott, V. M. Skuratov, and D. L. Pierson. 2005. Microbial surveillance
of potable water sources of the International Space Station. SAE Trans. 114:283-292. 3. Characklis WG, McFeters GA, Marshall KC, “Physiological ecology in biofilm systems”.
Biofilms. New York: John Wiley & Sons; 1990. p. 341–394. 4. Close, Dan. “Comparative Real-Time Metabolic Activity Tracking for Improved
Therapeutic Assessment Screening Panels (Metabolic Tracking).” NASA, 2018. www.nasa.gov/mission_pages/station/research/experiments/2487.html.
5. Donlan, Rodney. “Biofilms and Device-Associated Infections.” Emerging Infectious Diseases, vol. 7, no. 2, 2001, pp. 277–281., doi:10.3201/eid0702.010226.
6. Donlan, Rodney M. “Biofilms: Microbial Life on Surfaces.” Emerging Infectious Diseases, vol. 8, no. 9, 2002, pp. 881–890., doi:10.3201/eid0809.02006
7. DOW. (2015). Medical & Healthcare Silicone Solutions. Retrieved from: http://www.dowcorning.com/content/discover/discovershowcase/healthcare.aspx
P a g e | 20
8. Government Accounting Office (GAO). (1999). Antimicrobial resistance: Data to assess public health threat from resistant bacteria are limited. GAO Report. Washington, DC: GAO/HEHS/NSIAD/RCED-99/132.
9. Gu, J. “The Role of Microbial Biofilms in Deterioration of Space Station Candidate Materials.” International Biodeterioration & Biodegradation, vol. 41, no. 1, 1998, pp. 25–33., doi:10.1016/s0964-8305(97)00070-x.
10. Hall-Stoodley, Luanne, and Paul Stoodley. “Evolving Concepts in Biofilm Infections.” Cellular Microbiology, vol. 11, no. 7, 2009, pp. 1034–1043., doi:10.1111/j.1462-5822.2009.01323.xz
11. Heydorn, Arne, et al. “Quantification of Biofilm Structures by the Novel Computer Program COMSTAT.” Microbiology, vol. 146, 26 July 2000, pp. 2395–2407.
12. Ito, A., et al. “Increased Antibiotic Resistance of Escherichia Coli in Mature Biofilms.” Applied and Environmental Microbiology, vol. 75, no. 12, 2009, pp. 4093–4100., doi:10.1128/aem.02949-08.
13. James, Hakeem, et al. “The Story of Biofilms.” Journal of Invasive Fungal Infections, vol. 5, no. 2, 2011.
14. Khan, Hassan Ahmed, et al. “Nosocomial Infections and Their Control Strategies.” Asian Pacific Journal of Tropical Biomedicine, vol. 5, no. 7, 2015, pp. 509–514., doi:10.1016/j.apjtb.2015.05.001.
15. Kim, Dong-Ju, et al. “Relation of Microbial Biomass to Counting Units for Pseudomonas Aeruginosa.” African Journal of Microbiology Research, vol. 6, no. 21, Sept. 2012, doi:10.5897/ajmr10.902.
16. Kim, Wooseong, et al. “Spaceflight Promotes Biofilm Formation by Pseudomonas Aeruginosa.” PLoS ONE, vol. 8, no. 4, 2013, doi:10.1371/journal.pone.0062437.
17. Klaus, David M. “Clinostats and Bioreactors.” American Society for Gravitational and Space Biology, June 2001.
18. Klaus, D., Simske, S., Todd, P., & Stodieck, L. (1997a). Investigation of space flight effects on Escherichia coli and a proposed model of underlying physical mechanisms. Microbiology, 143(2), 449–455. doi:10.1099/00221287-143-2-449
19. Kostakioti, M., et al. “Bacterial Biofilms: Development, Dispersal, and Therapeutic Strategies in the Dawn of the Postantibiotic Era.” Cold Spring Harbor Perspectives in Medicine, vol. 3, no. 4, Jan. 2013, doi:10.1101/cshperspect.a010306.
20. Leidich, J., Thomas, E., Klaus, D., “A Novel Testing Protocol for Evaluating Particle behavior in Fluid Flow Under Simulated Reduced Gravity Conditions”, ICES, 2009-01-2359
21. Levine, D S, and J E Greenleaf. “Immunosuppression during Spaceflight Deconditioning.”Aviation, Space, and Environmental Medicine Journal, Feb. 1998.
22. Mah, T. F., & O’Toole, G. A. (2001). Mechanism of biofilm resistance to antimicrobial agents. Trends in Microbiology, 9, 34-39.
23. Mahami, T., and A. Adu-Gyamfi. “Biofilm-Associated Infections: Public Health Implications.” International Research Journal of Microbiology, Nov. 2011.
24. Mclean, R. “Bacterial Biofilm Formation under Microgravity Conditions.” FEMS Microbiology Letters, vol. 195, no. 2, 2001, pp. 115–119., doi:10.1016/s0378-1097(00)00549-8.
25. NASA. (2017) Human Research Roadmap, Retrieved from: https://humanresearchroadmap.nasa.gov/
P a g e | 21
26. Novikova ND. Review of the knowledge of microbial contamination of the Russian manned spacecraft. Microb Ecol. 2004;47(2):127–132.
27. O’Toole GA (2002). A resistance switch. Nature, 416: 695-696. 28. O'Toole GA, Kolter R (1998). Flagellar and twitching motility are necessary for
Pseudomonas aeruginosa biofilm development. Molecular Microbiology, 30: 295–304 29. Raad I. Intravascular-catheter-related infections. Lancet, 351: 893-898, 1998 30. Stoodley, P., et al. “Biofilms as Complex Differentiated Communities.” Annual Review of
Microbiology, vol. 56, no. 1, 2002, pp. 187–209., doi:10.1146/annurev.micro.56.012302.160705.
31. Storrs-Mabilat M (2001) Study of a Microbial Detection System for Space Applications. Noordwijk, Netherlands.
32. Taylor GR, “Recovery of medically important microorganisms from Apollo astronauts” Aerospace Medicine. 1974 Aug; 45(8):824-8.
33. Vasudevan, Ranganathan. “Biofilms: Microbial Cities of Scientific Significance.” Journal of Microbiology & Experimentation, vol. 1, no. 3, 2014, doi:10.15406/jmen.2014.01.00014.
34. Vital-Lopez, Francisco G., et al. “Biofilm Formation Mechanisms of Pseudomonas Aeruginosa Predicted via Genome-Scale Kinetic Models of Bacterial Metabolism.” PLOS Computational Biology, vol. 11, no. 10, Feb. 2015, doi:10.1371/journal.pcbi.1004452.
35. Vorregaard, M., Comstat2 - a modern 3D image analysis environment for biofilms, in Informatics and Mathematical Modelling. 2008, Technical University of Denmark: Kongens Lyngby, Denmark
36. Wilson J. W., Ott C. M., Zu Bentrup K. H., Ramamurthy R., Quick L., Porwollik S., et al. “Space flight alters bacterial gene expression and virulence and reveals a role for global regulator Hfq.” Proc. Natl Acad. Sci. 104, 16299–16304 (2007). doi:10.1073/pnas.0707 155104 PMID: 17901201
37. Zea L, Larsen M, Estante F, Qvortrup K, Moeller R, Dias de Oliveira S, Stodieck L and Klaus D (2017) “Phenotypic Changes Exhibited by E. coli Cultured in Space.” Front. Microbiol. 8:1598. doi: 10.3389/fmicb.2017.01598
38. Zea, L., Phenotypic and Gene Expression Responses of E. coli to Antibiotics during Spaceflight, Ph.D. Thesis, University of Colorado, Boulder, CO, 2015
39. Zea, L., Luo, J., Moeller, R., Klaus, D., Mueller, D., Muecklich, F., Stodieck, L., Design of a Spaceflight Biofilm Experiment, IAC-17.A1.6.8x36309, 68th International Astronautical Congress (IAC), Adelaide, Australia, 25-29 September 2017
40. Zea, L., Stodieck, L., Klaus, D.M., Bacterial Growth and Susceptibility to Antibiotics in Simulated Reduced Levels of Gravity, ASGSR Conference, Orlando, FL November 3-8, 2013
41. Zhao, K, Tseng,B.S., Beckerman,B, F. Jin, M. L. Gibiansky, J. J. Harrison, E. Luijten, M. R. Parsek and G. C. L. Wong, “Psl trails guide exploration and microcolony formation in early P. aeruginosa biofilms”, Nature 497, 388-392(2013).
P a g e | 22
Appendix
P a g e | 23
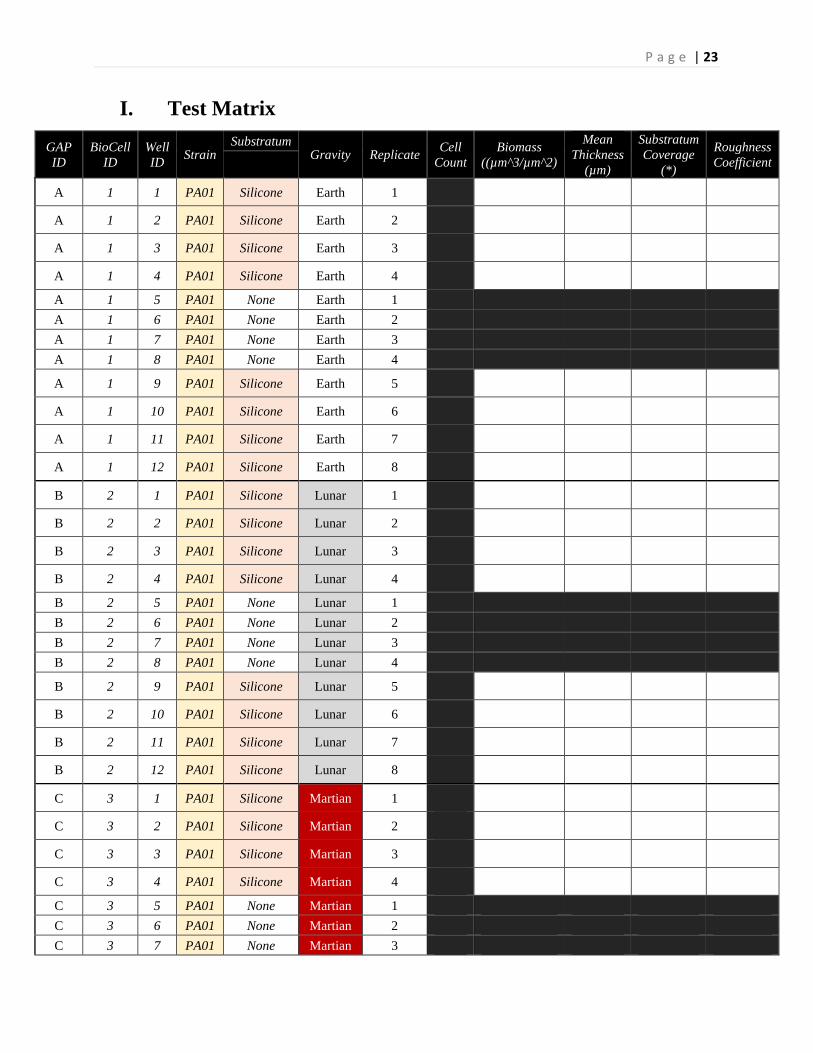
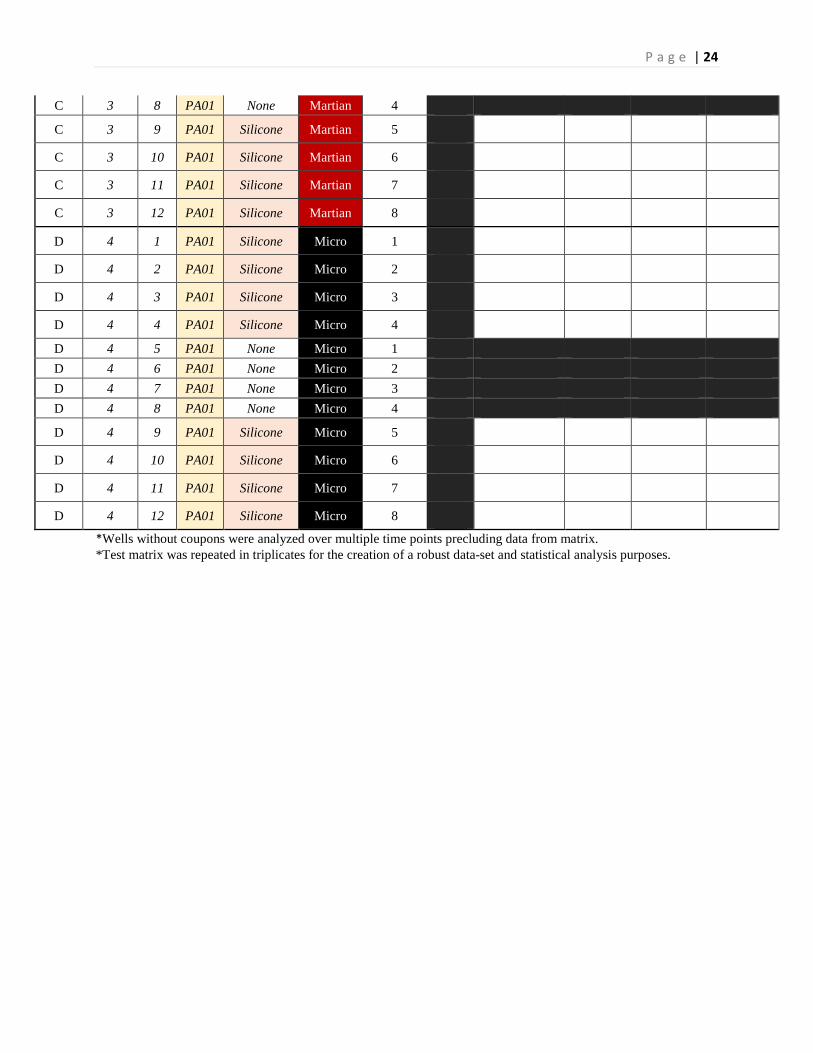
I. Test Matrix
GAP ID
BioCell ID
Well ID Strain
Substratum Gravity Replicate Cell
Count Biomass
((µm^3/µm^2)
Mean Thickness
(µm)
Substratum Coverage
(*)
Roughness Coefficient
A 1 1 PA01 Silicone Earth 1
A 1 2 PA01 Silicone Earth 2
A 1 3 PA01 Silicone Earth 3
A 1 4 PA01 Silicone Earth 4
A 1 5 PA01 None Earth 1 A 1 6 PA01 None Earth 2 A 1 7 PA01 None Earth 3 A 1 8 PA01 None Earth 4
A 1 9 PA01 Silicone Earth 5
A 1 10 PA01 Silicone Earth 6
A 1 11 PA01 Silicone Earth 7
A 1 12 PA01 Silicone Earth 8
B 2 1 PA01 Silicone Lunar 1
B 2 2 PA01 Silicone Lunar 2
B 2 3 PA01 Silicone Lunar 3
B 2 4 PA01 Silicone Lunar 4
B 2 5 PA01 None Lunar 1 B 2 6 PA01 None Lunar 2 B 2 7 PA01 None Lunar 3 B 2 8 PA01 None Lunar 4
B 2 9 PA01 Silicone Lunar 5
B 2 10 PA01 Silicone Lunar 6
B 2 11 PA01 Silicone Lunar 7
B 2 12 PA01 Silicone Lunar 8
C 3 1 PA01 Silicone Martian 1
C 3 2 PA01 Silicone Martian 2
C 3 3 PA01 Silicone Martian 3
C 3 4 PA01 Silicone Martian 4
C 3 5 PA01 None Martian 1 C 3 6 PA01 None Martian 2 C 3 7 PA01 None Martian 3
P a g e | 24
C 3 8 PA01 None Martian 4 C 3 9 PA01 Silicone Martian 5
C 3 10 PA01 Silicone Martian 6
C 3 11 PA01 Silicone Martian 7
C 3 12 PA01 Silicone Martian 8
D 4 1 PA01 Silicone Micro 1
D 4 2 PA01 Silicone Micro 2
D 4 3 PA01 Silicone Micro 3
D 4 4 PA01 Silicone Micro 4
D 4 5 PA01 None Micro 1 D 4 6 PA01 None Micro 2 D 4 7 PA01 None Micro 3 D 4 8 PA01 None Micro 4 D 4 9 PA01 Silicone Micro 5
D 4 10 PA01 Silicone Micro 6
D 4 11 PA01 Silicone Micro 7
D 4 12 PA01 Silicone Micro 8
*Wells without coupons were analyzed over multiple time points precluding data from matrix. *Test matrix was repeated in triplicates for the creation of a robust data-set and statistical analysis purposes.
P a g e | 25
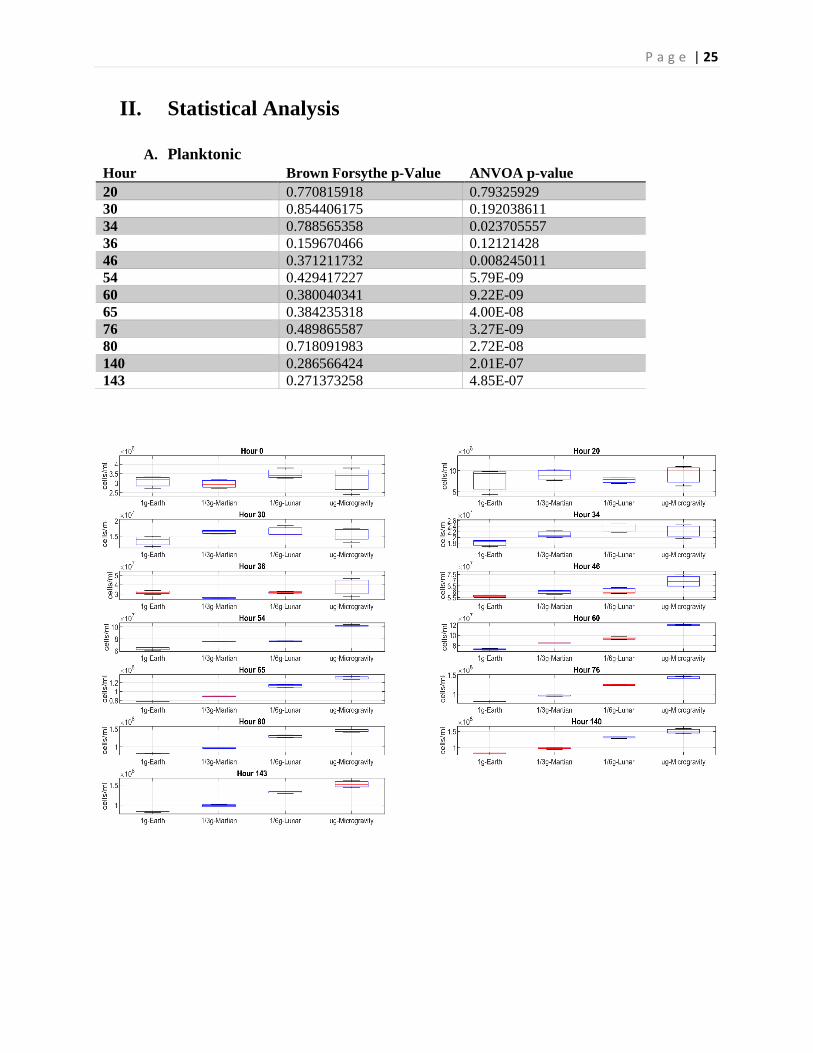
II. Statistical Analysis
A. Planktonic Hour Brown Forsythe p-Value ANVOA p-value 20 0.770815918 0.79325929 30 0.854406175 0.192038611 34 0.788565358 0.023705557 36 0.159670466 0.12121428 46 0.371211732 0.008245011 54 0.429417227 5.79E-09 60 0.380040341 9.22E-09 65 0.384235318 4.00E-08 76 0.489865587 3.27E-09 80 0.718091983 2.72E-08 140 0.286566424 2.01E-07 143 0.271373258 4.85E-07
P a g e | 26
Brown Forsythe p-value Brown Forsythe F-stat
ANOVA p-value ANOVA F-stat
Brown Forsythe p-value
0.27137 F(3,8) = 123.62 4.85E-07 F(3,8) = 1.56743 0.27137
P a g e | 27
B. Biofilm
Morphometry Brown Forsythe p-value
Brown Forsythe F-stat
ANOVA p-value
ANOVA F-stat
Biomass 0.30162 F(3,8) = 1.43986
3.57E-08 F(3,8)=240
Mean Thickness 0.63442 F(3,8) = 0.5973
1.05E-11 F(3,8)=1851
Roughness Coefficient
0.89776 F(3,8) = 0.19374
6.08E-12 F(3,8)=2123.96
Substratum Coverage
0.90158 F(3,8) = 0.18807
1.90E-12 F(3,8)=2842.14
i. Biomass
ii. Mean Thickness
Regime 1
Regime 2
p-value Statistically Sig?
1g 1/3g 0.004472286 Yes 1g 1/6g 6.41E-07 Yes 1g µg 7.04E-08 Yes 1/3g 1/6g 8.99E-06 Yes 1/3g µg 3.24E-07 Yes 1/6g µg 0.000712689 Yes
Regime 1
Regime 2
p-value
Statistically Sig?
1g 1/3g 7.03E-07 Yes 1g 1/6g 3.05E-08 Yes 1g µg 3.05E-08 Yes 1/3g 1/6g 3.36E-08 Yes 1/3g µg 3.05E-08 Yes 1/6g µg 2.31E-07 Yes
P a g e | 28
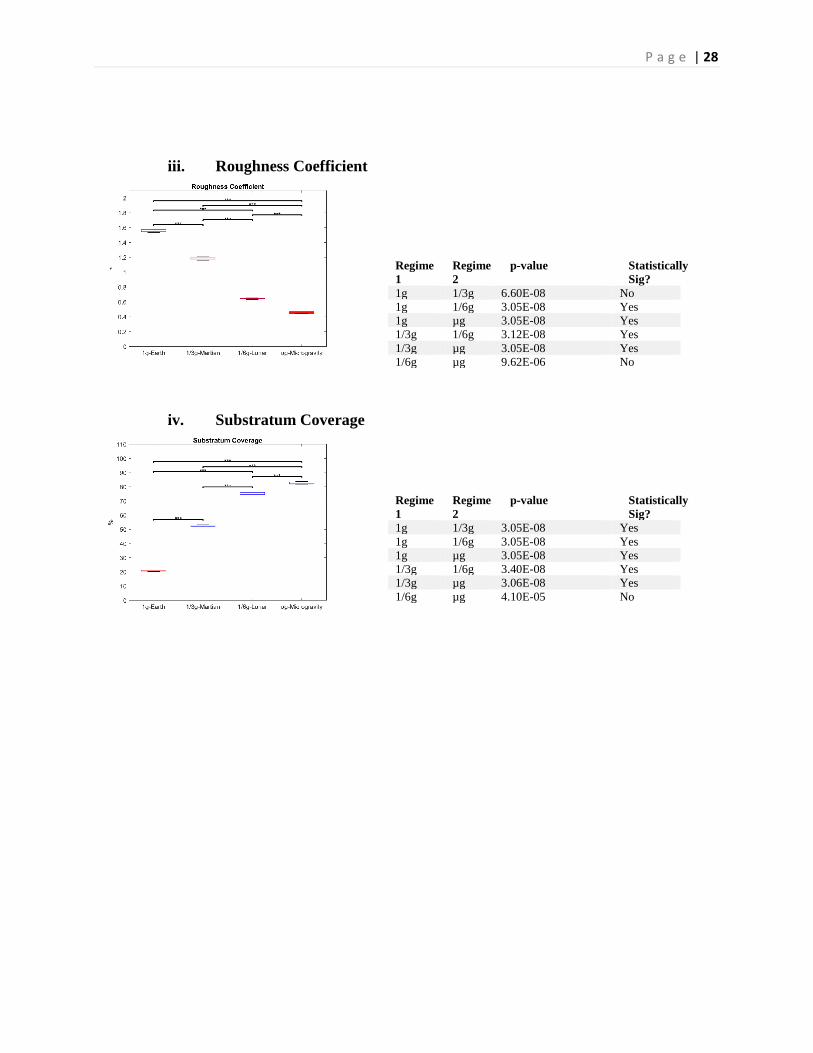
iii. Roughness Coefficient
iv. Substratum Coverage
Regime 1
Regime 2
p-value Statistically Sig?
1g 1/3g 6.60E-08 No 1g 1/6g 3.05E-08 Yes 1g µg 3.05E-08 Yes 1/3g 1/6g 3.12E-08 Yes 1/3g µg 3.05E-08 Yes 1/6g µg 9.62E-06 No
Regime 1
Regime 2
p-value Statistically Sig?
1g 1/3g 3.05E-08 Yes 1g 1/6g 3.05E-08 Yes 1g µg 3.05E-08 Yes 1/3g 1/6g 3.40E-08 Yes 1/3g µg 3.06E-08 Yes 1/6g µg 4.10E-05 No