Embed Size (px)
Citation preview
Background Report Reference
AP-42 Section Number: 10.6.1
Background Report Section: 4
Reference Number: 100
Title: Emissions Testing of a Thermal Oil Heater, Louisiana-Pacific Corp. Houlton, Maine
TRC Environmental Corporation
January 1996
m e Environmental cofpofafion
REPORT
EMISSIONS TESTING OF A THERMAL OIL HEATER
Presented to
Louisiana-Pacific Corporaltiorr Houlton, Maine
Prepared by .-
3 2 TRC Environmental Corporation . . . .
Windsor, Connecticut . . , . . . . .
.. . . . .
. . .
.. , .
January, 1996
4. . . . .._ . . \- ... . . . . . . ... ,
. . - .I . ., . . .f I
1; - ,, , ,.,~,
IRc Environmental Corporation
5 Waterside Crossing Windrar, Connecticut 06095 Telephone 860-289.863 1 Facsimile 860.298-6399
...
L
January24, 1996
Ms. Sue Somers Louisiana-Pacific Corporation Engineering Office Route 8, Box 8263 - Gehrts Road Hayward, Wisconsin 54843
Re: Engineering Report of Particulate Emissions from the Two Thermal Oil Heaters TRC Project No. 19624
Dear Sue:
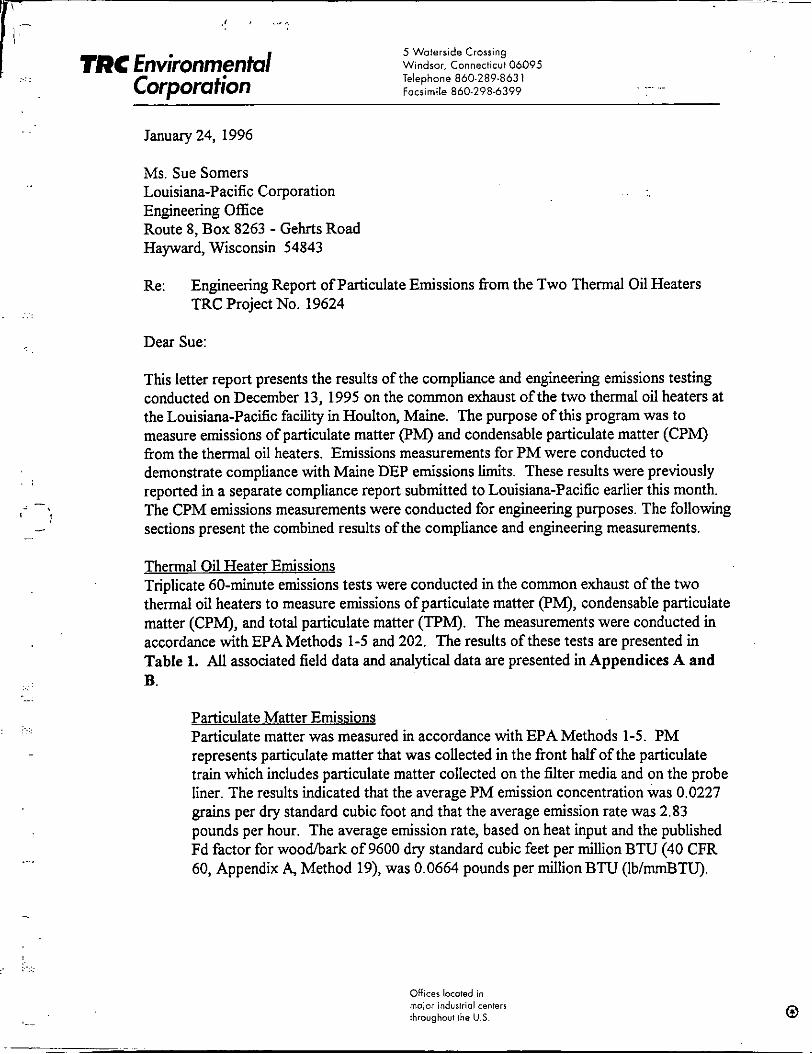
This letter report presents the results of the compliance and engineering emissions testing conducted on December 13, 1995 on the common exhaust of the two thermal oil heaters at the Louisiana-Pacific faciliq in Houlton, Maine. The purpose of this program was to measure emissions of particulate matter (PM) and condensable particulate matter (CPM) ftom the thermal oil heaters. Emissions measurements for PM were conducted to demonstrate compliance with Maine DEP emissions limits. These results were previously reported in a separate compliance report submitted to Louisiana-Pacific earlier this month. The CPM emissions measurements were conducted for engineering purposes. The following sections present the combined results of the compliance and engineering measurements.
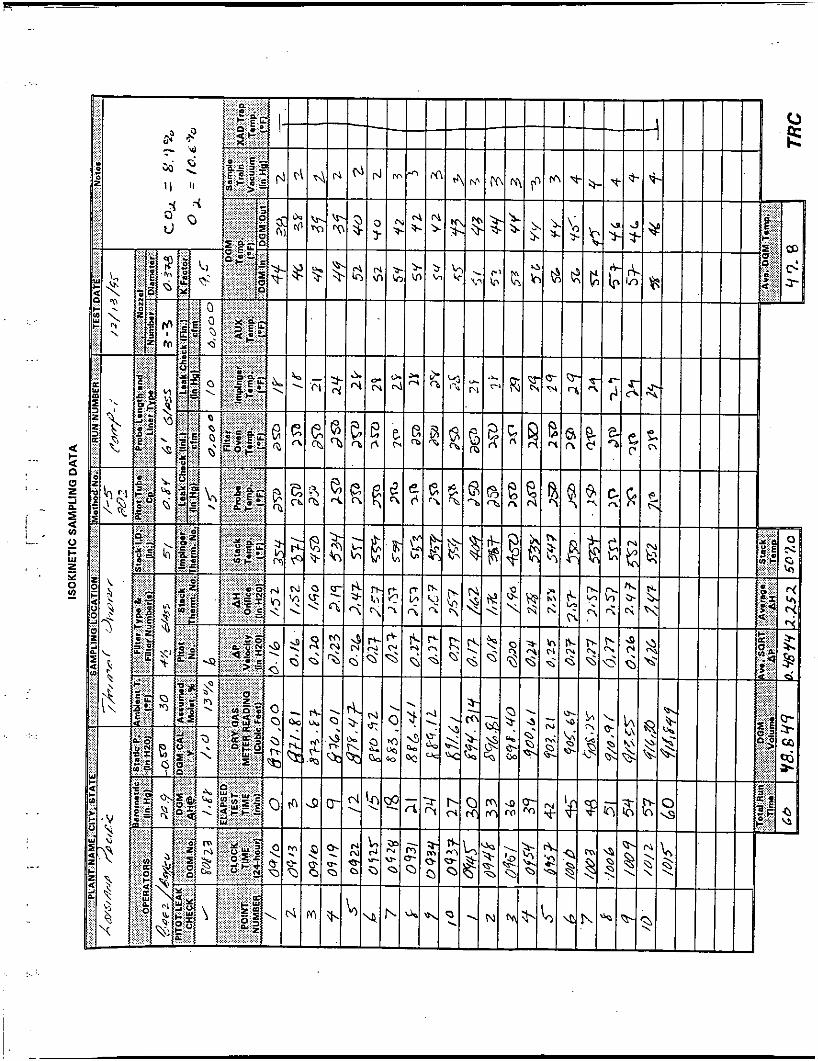
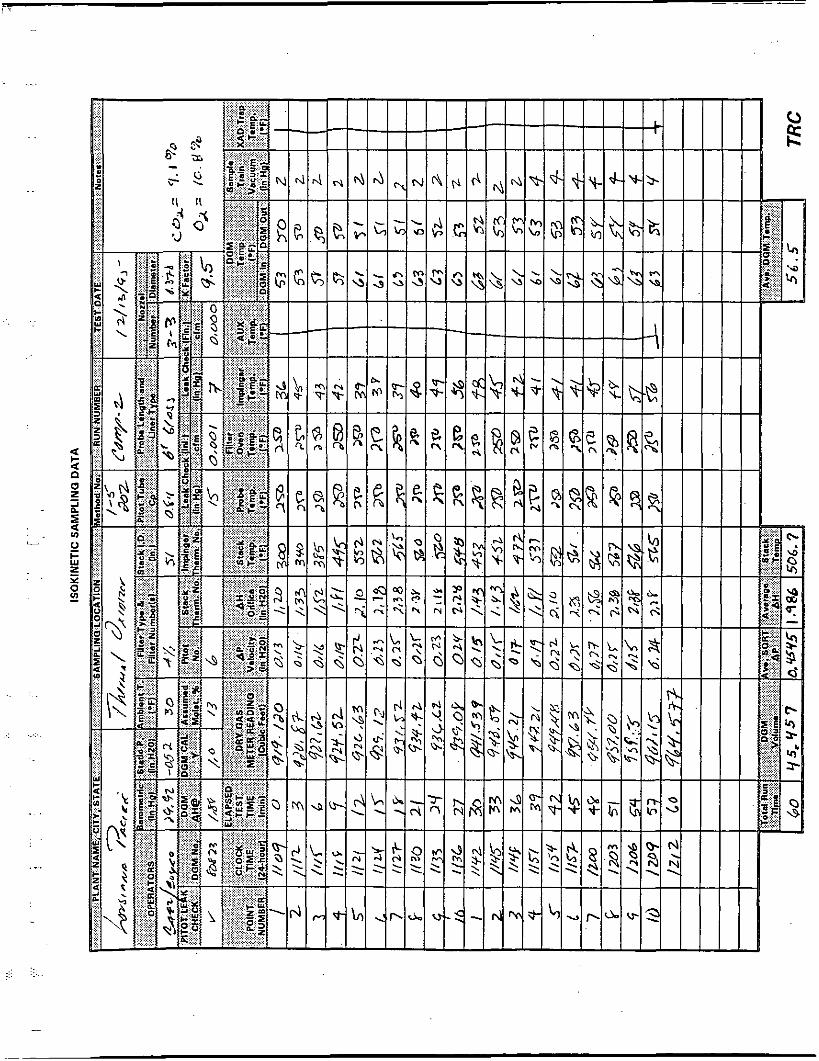
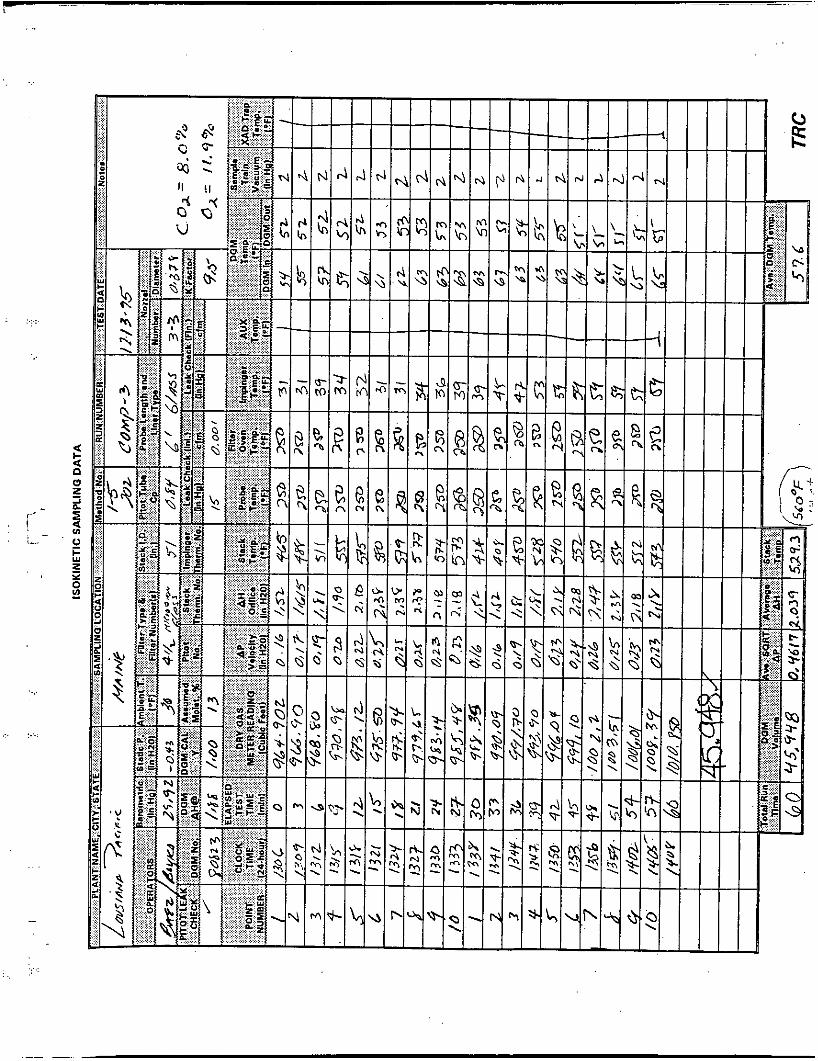
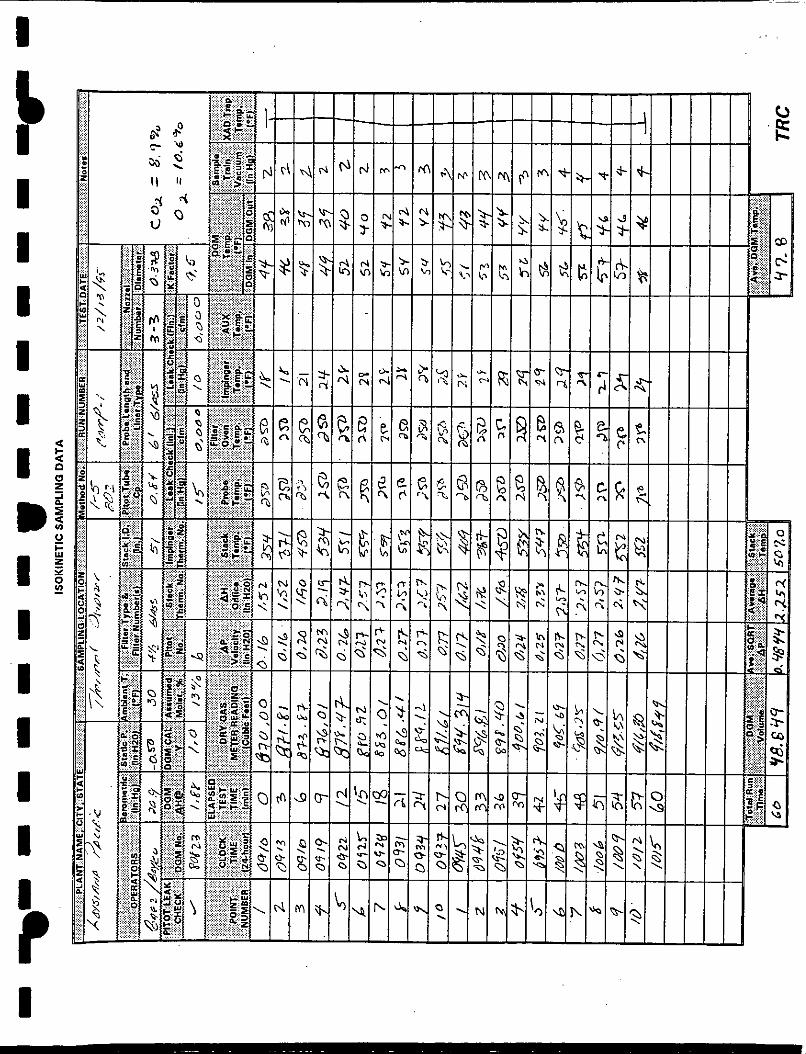
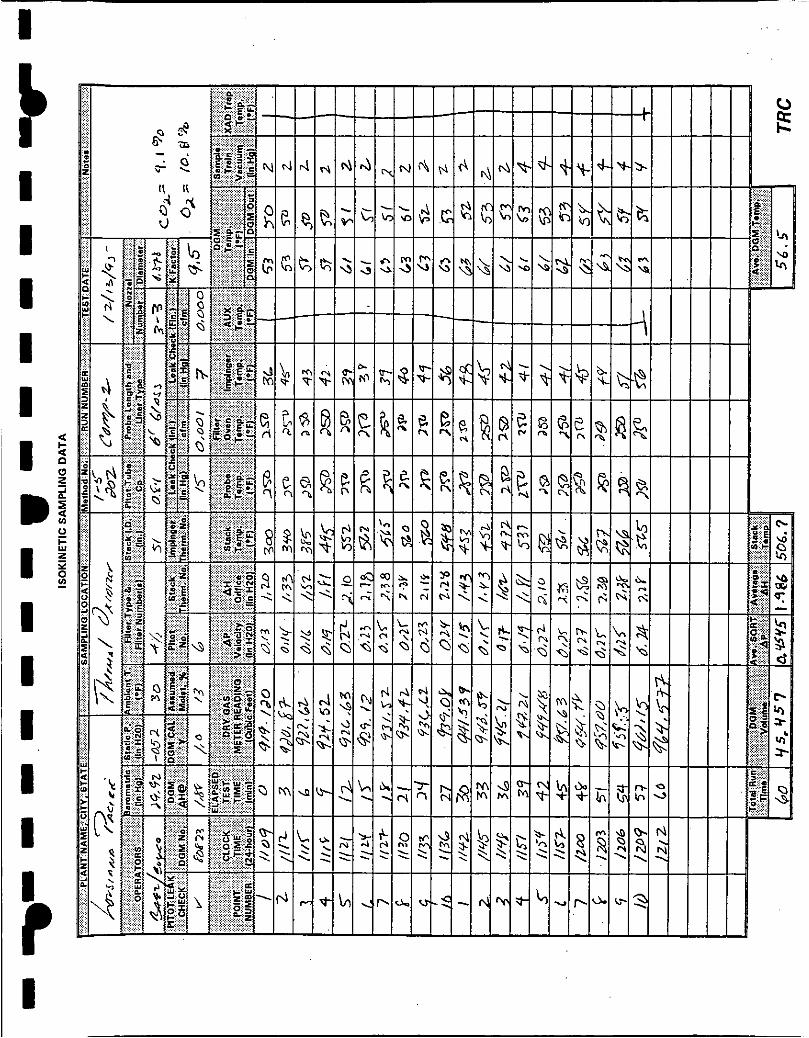
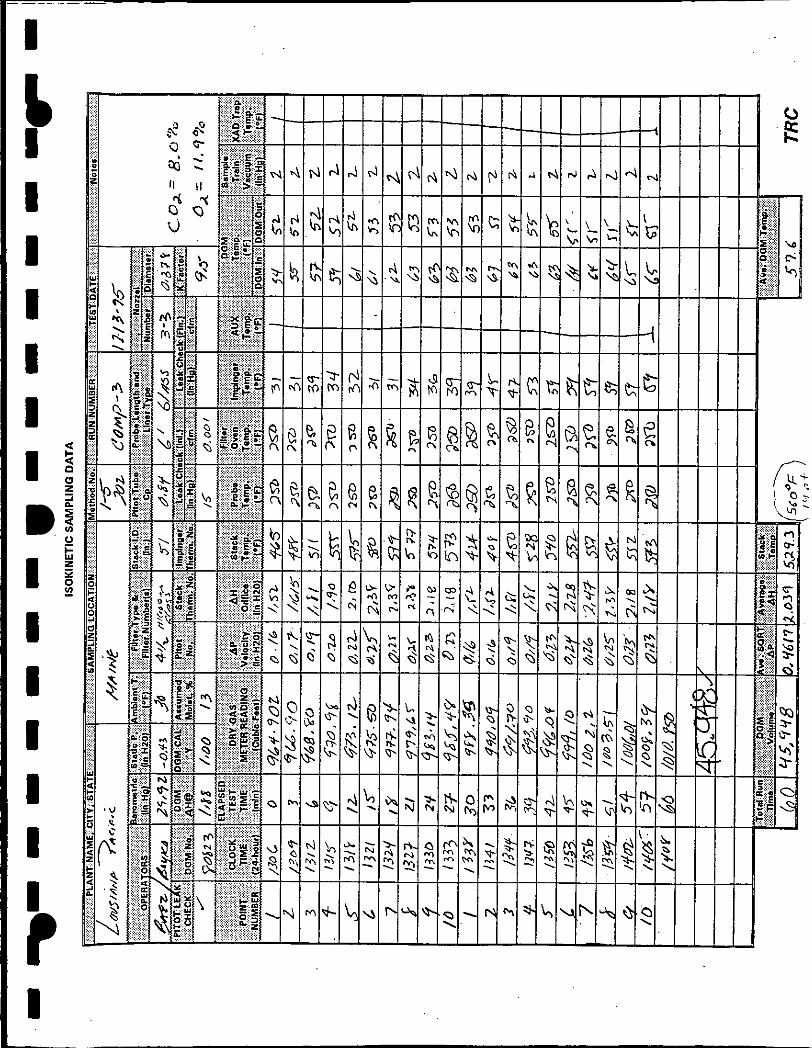
Thermal Oil Heater Emissions Triplicate 60-minute emissions tests were conducted in the common exhaust of the two thermal oil heaters to measure emissions of particulate matter (PM), condensable particulate matter (CPM), and total particulate matter (TPM). The measurements were conducted in accordance with EPA Methods 1-5 and 202. The results of these tests are presented in Table 1. All associated field data and analytical data are presented in Appendices A and B.
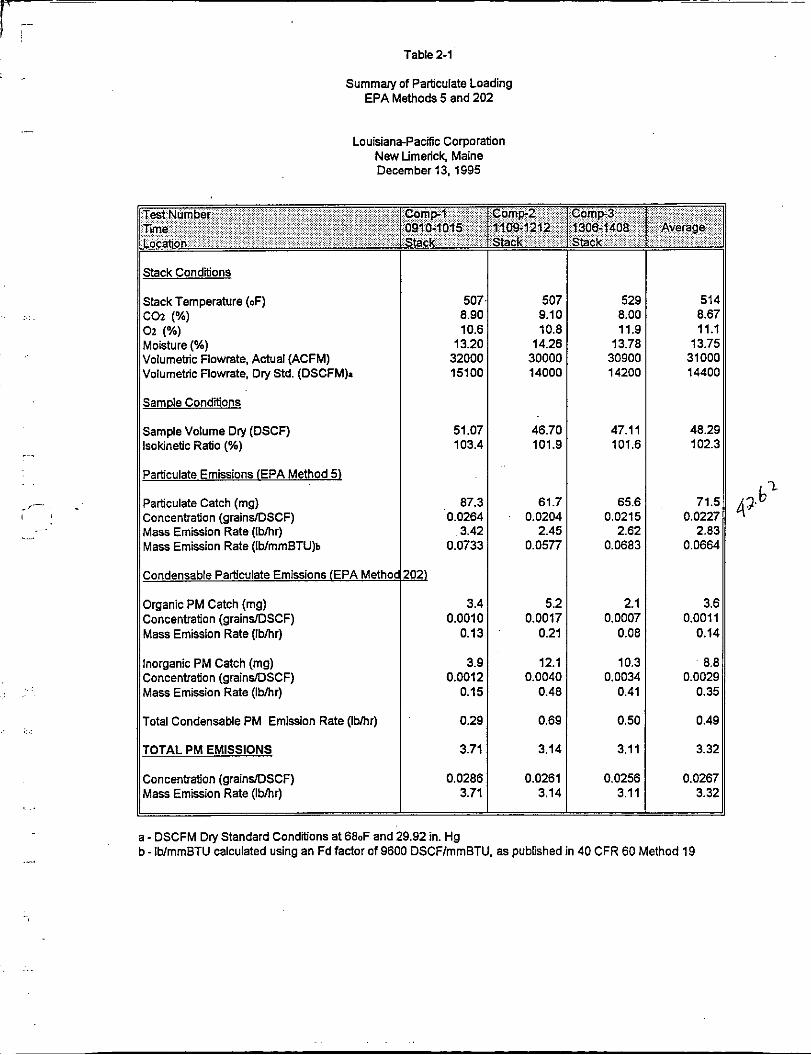
Particulate Matter Emissions Particulate matter was measured in accordance with EPAMethods 1-5. PM represents particulate matter that was collected in the front half of the particulate train which includes particulate matter collected on the filter media and on the probe liner. The results indicated that the average PM emission concentration was 0.0227 grains per dry standard cubic foot and that the average emission rate was 2.83 pounds per hour. The average emission rate, based on heat input and the published Fd factor for woodhark of 9600 dry standard cubic feet per million BTU (40 CFR 60, Appendix 4 Method 19), was 0.0664 pounds per million BTU (lb/mmBTU).
Officer locoted in m+ industrial centers throughout the U.S. 0
TRC Environmental Corporation
...
Condensable Particulate Matter Emissions Condensable particulate matter was measured in accordance with EPA Method 202. CPM represents particulate matter that was collected in the impinger solutions of the particulate train and includes both organic and inorganic material. The results indicated that the average CPM emission concentration was 0.0040 grains/DSCF and the average emission rate was 0.49 I b h .
Total Particulate Matter Emissions Total particulate matter was measured in accordance with EPAMethods 1-5, and 202. TPM represents the sum of the PM and CPM. The results indicated that the average emission concentration was 0.0267 grains per dry standard cubic foot (gr/DSCF) and the average emission rate was 3.32 I b h .
\
It has been a pleasure for TRC to provide these services to Louisiana-Pacific and we look forward to working with you in the future. Should you have any questions please do not hesitate to contact me at (860) 289-8631.
Sincerely,
TRC ENVIRONhENTAL CORPORATION
Raymond botter Manager, Emissions Measurement Group
attachments
.,. . . ...
1 ;-
. .
. ,'- .~
I .
Particulate Emissions (EPA Method 51
Particulate Catch (mg) Concentration (grainslDSCF) Mass Emission Rate (Ibhr) Mass Emission Rate (Ib/mmBTU)b
Condensable Particulate Emissions (EPA Metho'
Organic PM Catch (mg) Concentration (grains/DSCF) Mass Emission Rate (Ibhr)
Table 2-1
Summary of Particulate Loading EPA Methods 5 and 202
Louisiana-Pacific Corporation New Limerick, Maine December 13.1995
Stack Conditions
Stack Temperature (OF) c02 (%) 0 2 (%) Moisture (%) Volumetric Flowrate. Actual (ACFM) Volumetric Flowrate, Dry Std. (DSCFM).
SamDle Conditions
Sample Volume Dry (DSCF) lsokinetic Ratio (%)
Inorganic PM Catch (mg) Concentration (grainmSCF) Mass Emission Rate (Ibhr)
Total Condensable PM Emission Rate (Ibhr)
TOTAL PM EMISSIONS
Concentration (grainslDSCF) Mass Emission Rate (Ibhr)
507 8.90 10.6
13.20 32000 15100
51.07 103.4
87.3 0.0264
3.42 0.0733
m 3.4
0.0010 0.13
3.9 0.0012
0.15
0.29
3.71
0.0286 3.71
:omp2 Comp3
;tack
1 507 9.10 10.8
14.26 30000 14000
46.70 101.9
61.7 0.0204
2.45 0.0577
5.2 0.0017
0.21
12.1 0.0040
0.48
0.69
3.14
0.0261 3.14
529 8.00 11.9
13.78 30900 14200
47.11 101.6
65.6 0.0215
2.62 0.0683
2.1 0.0007 0.08
10.3 0.0034
0.41
0.50
3.11
0.0256 3.11
a - DSCFM Dry Standard Conditions at 680F and 29.92 in. Hg b - Ib/mmBTU calculated using an Fd factor of 9600 DSCFlmmBTU. as published in 40 CFR 60 Method 19
I '
. .
APPENDIX A
FIELD DATA
....
. . .
. . .
. .
...
i .
- i i - -.
.. ..:
. .
.. . ..
...
. . ;;: ::.
..
I
. ..
. .. .
.. ::.
.-
1 - ..
APPENDIXB
ANALYTICAL DATA AND DATA SUMMARTES
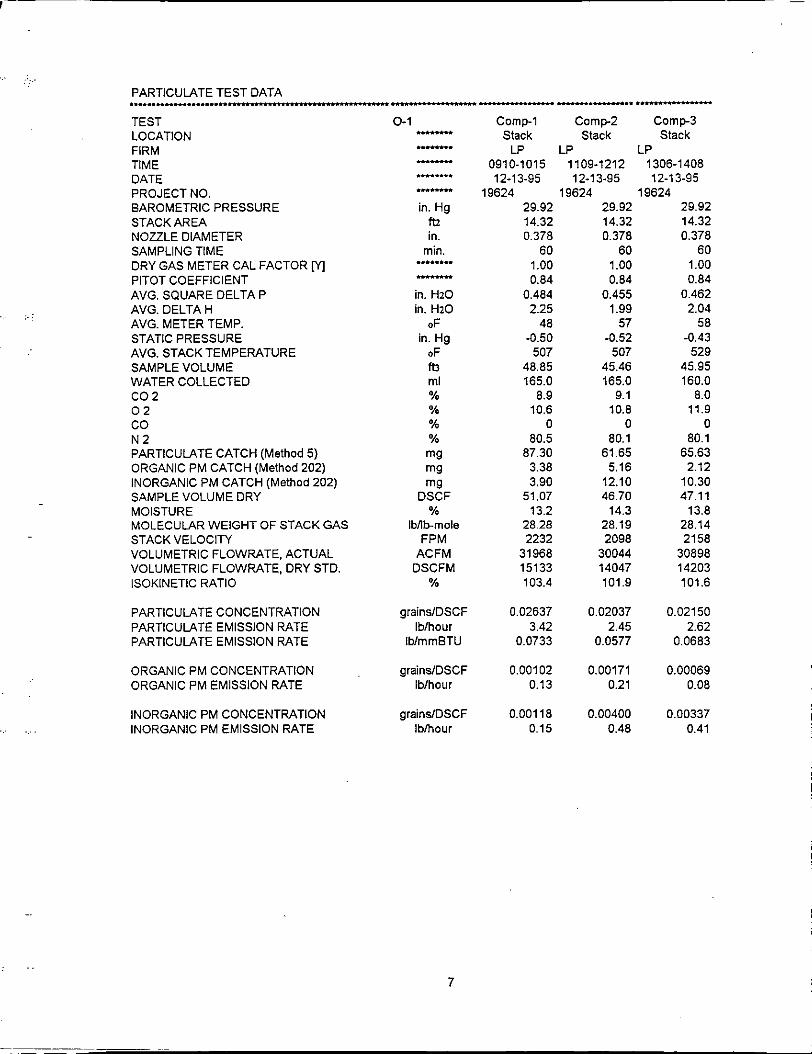
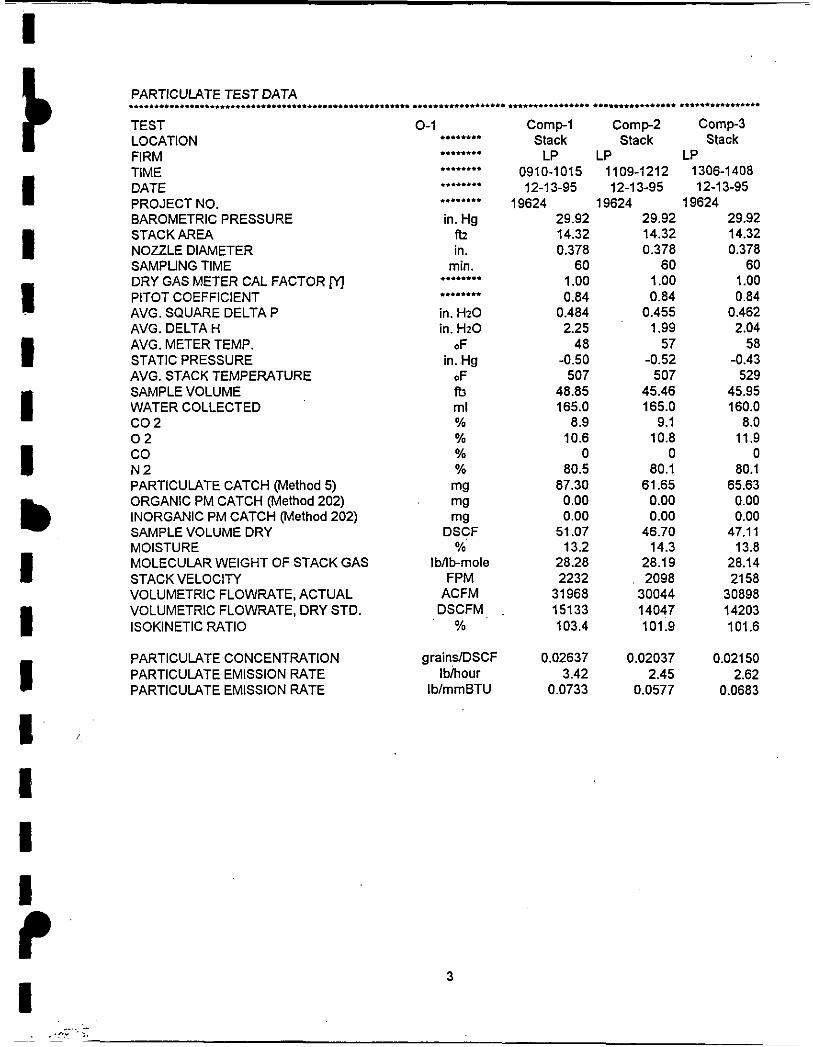
--_____._---.- PARTICUIATE TEST DATA
TEST LOCATION FIRM TIME DATE PROJECT NO. BAROMETRIC PRESSURE STACK AREA NOZZLE DIAMETER SAMPLING TIME DRY GAS METER CAL FACTOR M PITOT COEFFICIENT AVG. SQUARE DELTA P AVG. DELTA H AVG. METER TEMP. STATIC PRESSURE AVG. STACKTEMPERATURE SAMPLE VOLUME WATER COLLECTED co 2 0 2 co N 2 PARTICULATE CATCH (Method 5 ) ORGANIC PM CATCH (Method 202) INORGANIC PM CATCH (Method 202) SAMPLE VOLUME DRY MOISTURE MOLECULAR WEIGHT OF STACK GAS STACK VELOCITY VOLUMETRIC FLOWRATE, ACTUAL VOLUMETRIC FLOWRATE, DRY STD. ISOKINETIC RATIO
PARTICULATE CONCENTRATION PARTICULATE EMISSION RATE PARTICULATE EMISSION RATE
ORGANIC PM CONCENTRATION ORGANIC PM EMISSION RATE
INORGANIC PM CONCENTRATION INORGANIC PM EMISSION RATE
0-1 - _I_ - .-..*. __.I
in. Hg ftz in.
rnin. _I_ - in. HzO in. Hz0
O F
in. Hg OF
ml % % % %
m
mg mg rng
DSCF %
Ibflbrnole FPM
ACFM DSCFM
%
grains/DSCF Ibhour
Ib/mmBTU
grains/DSCF lblhour
grains/DSCF
Comp-1 Comp-2 Comp-3 Stack Stack Stack
0910-1015 1109-1212 1306-1408 12-13-95 12-13-95 12-1 3-95
LP LP LP
19624 19624 19624 29.92 14.32 0.378
60 1 .oo 0.84
0.484 2.25
48 -0.50
507 48.85 165.0
8.9 10.6
0 80.5
87.30 3.38 3.90
51.07 13.2
28.28 2232
31968 15133 103.4
0.02637 3.42
0.0733
0.00102 0.13
0.001 18 lbihour 0.15
29.92 14.32 0.378
60 1 .oo 0.84
0.455 1.99
57 -0.52
507 45.46 165.0
9.1 10.8
0 80.1
61.65 5.16
12.10 46.70
14.3 28.19 2098
30044 14047 101.9
0.02037 2.45
0.0577
0.00171 0.21
0.00400 0.48
29.92 14.32 0.378
60 1 .oo 0.84
0.462 2.04
58 -0.43
529 45.95 160.0
8.0 11.9
0 80.1
65.63 2.12
10.30 47.11
13.8 28.14 21 58
30898 14203 101.6
0.02150 2.62
0.0683
0.00069 0.08
0.00337 0.41
. .. 7
I _ I
.:.
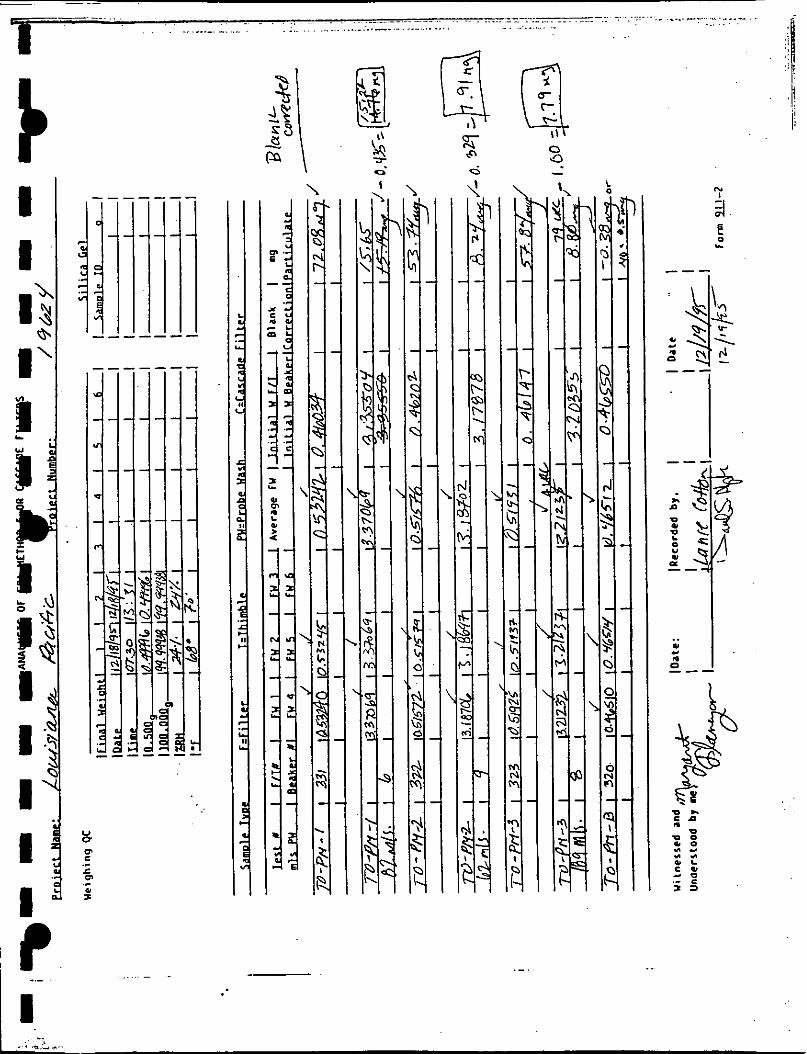
Sample Number
TO-PM-I
TO-PM-1
TO-PM-2
TO-PM-2
T 0 - P M - 3
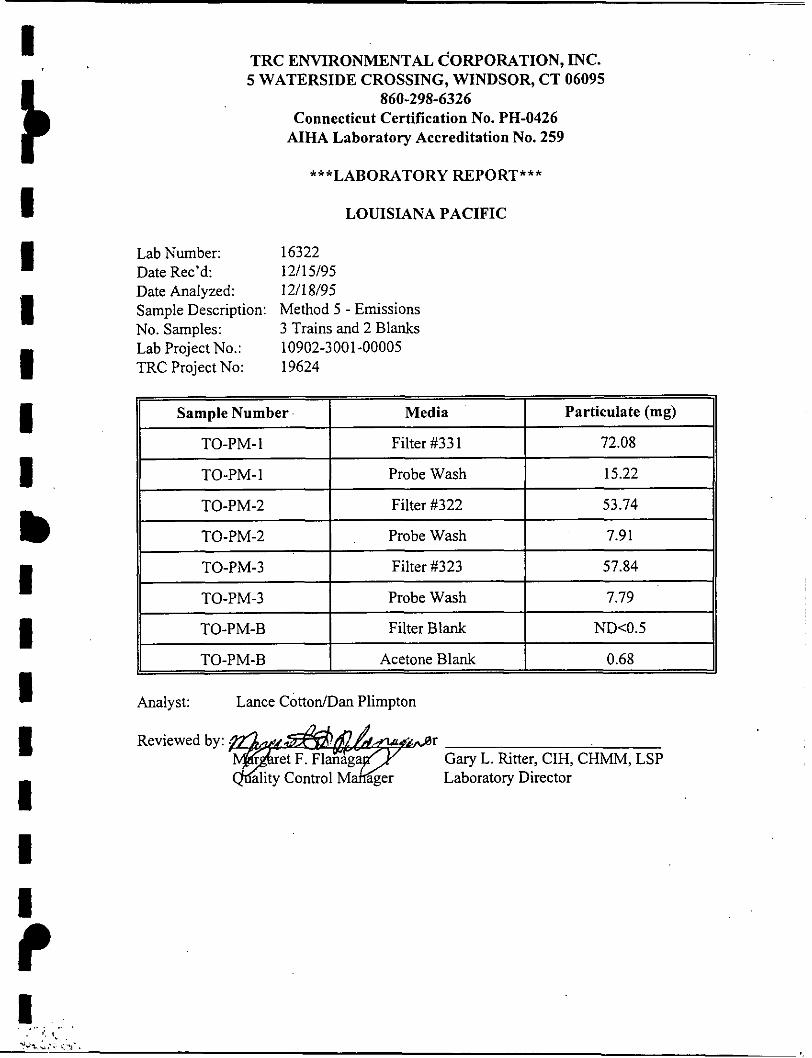
TRC ENVIRONMENTAL CORPORATION, INC. 5 WATERSIDE CROSSING, WINDSOR, CT 06095
Connecticut Certification No. PH-0426 AIHA Laboratory Accreditation No. 259
***LABORATORY REPORT***
860-298-6326
Media Particulate (mg)
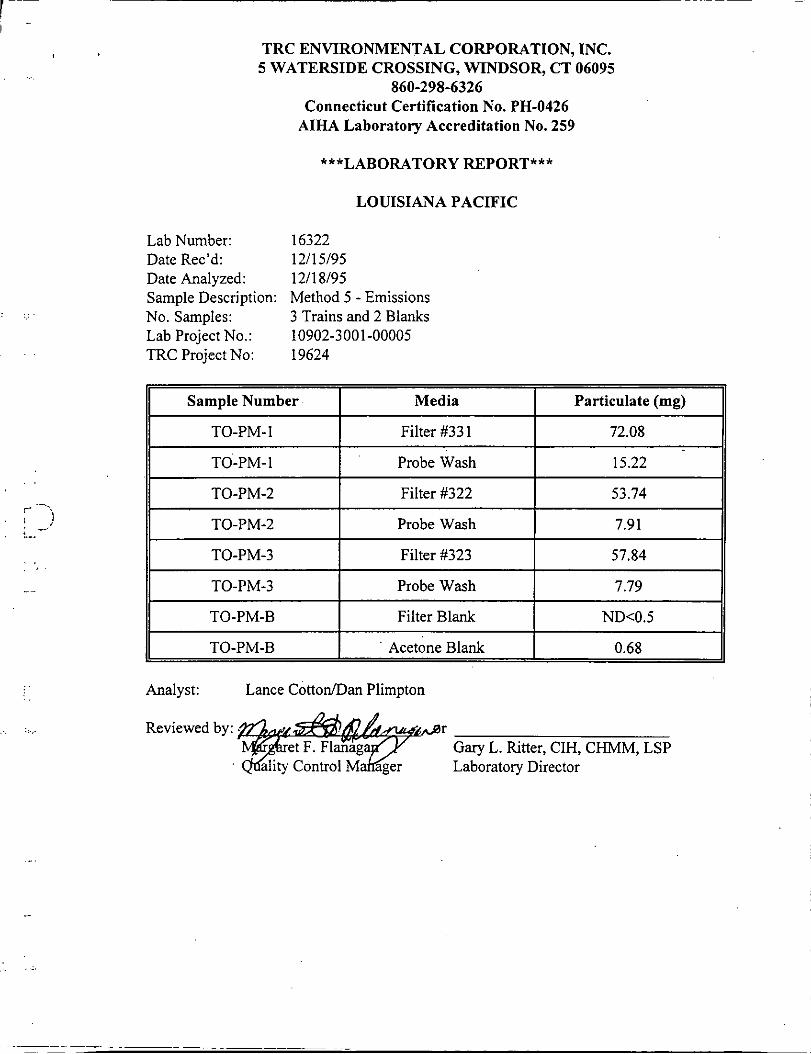
Filter #33 1 72.08
Probe Wash 15.22
Filter #322 53.74
Probe Wash 7.91
Filter #323 57.84
LOUISIANA PACIFIC
TO-PM-B
. . . . . ..
Acetone Blank 0.68
.:.
Lab Number: 16322 Date Rec’d: 12/15/95 Date Analyzed: 12/18/95 Sample Description: Method 5 - Emissions No. Samples: 3 Trains and 2 Blanks
TRC Project No: 19624 Lab Project No.: 10902-3001 -00005
II T 0 - P M - 3 I Probe Wash I 7.79 II II TO-PM-B I Filter Blank I ND<0.5 I1
r
. . .
-
: .:..
!
, . .. . : S ! . _-
i_.
: .::.
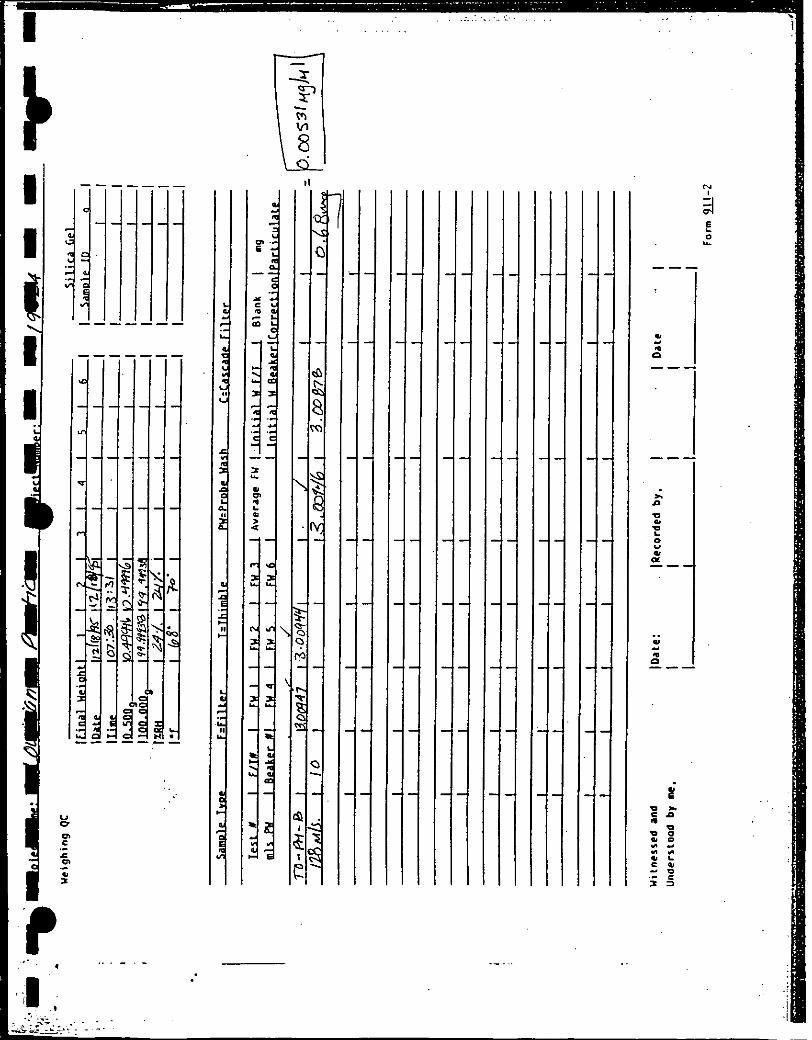
Sample Number
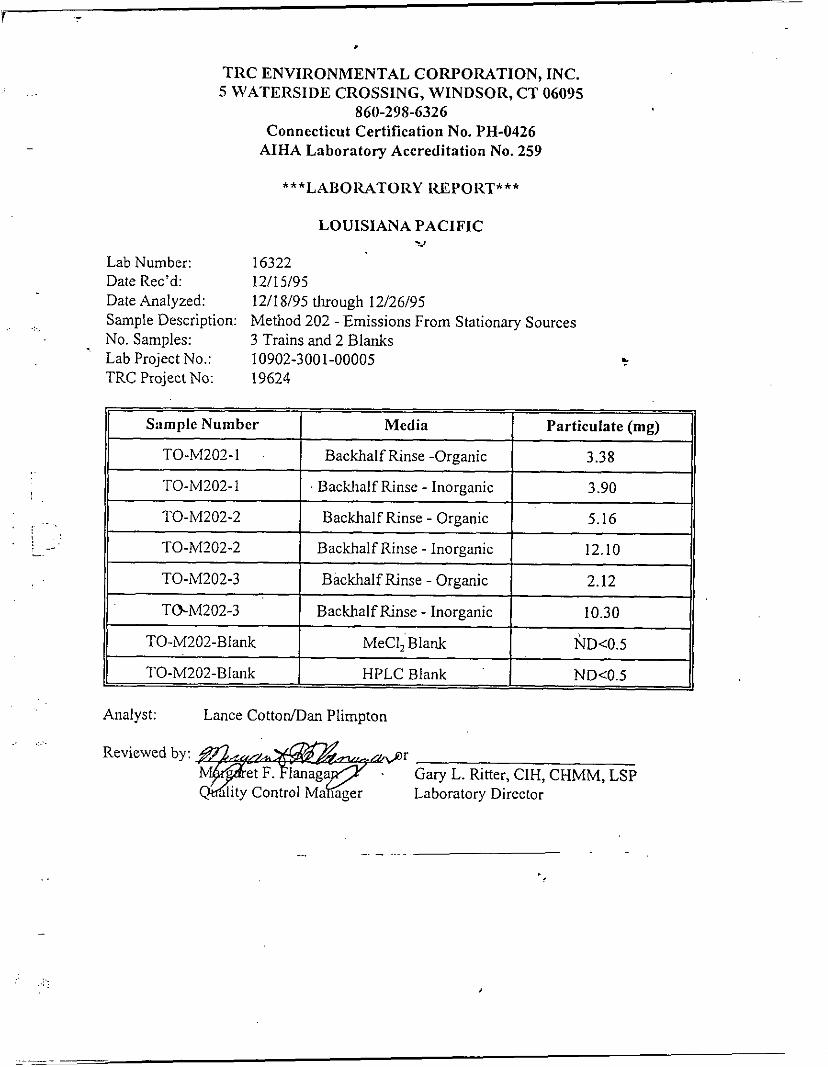
TO-M202-1
.
Media Particulate (mg)
Backhalf Rinse -0reanic 3.38
TRC ENVIRONMENTAL CORPORATION, INC. 5 WATERSIDE CROSSING, WINDSOR, CT 06095
Connecticut Certification No. PH-0426 AIHA Laboratory Accreditation No. 259
***LAB 0 RAT0 RY REP 0 RT* * *
860-298-6326
TO-M202-3
TBM202-3
TO-M202-Blank
TO-M202-Blank
~~
Backhalf Rinse - Organic 2.12
Backhalf Rinse - Inorganic 10.30
MeCI, Blank ND<0.5
HPLC Blank NDCO.5
II TO-M202-1 I Backhalf Rinse - Inoreanic I 3.90 II I1 TO-M202-2 I Backhalf Rinse - Organic 1 5.16 II II TO-M202-2 1 Backhalf Rinse - Inorganic I 12.10 ~ II
r--- ~ --- r-.
1
.. .:.
. . , . ..
. . . ... ..:
rRC Environmental
EMISSIONS TESTING OF A THERMAL OIL HEATER
Presented to
Louisiana-Pacific Corporation Houlton. Maine
Prepared by
TRC Environmental Corporation Windsor, Connecticut
Raymond Potter Manager, Emissions Measurement Group
TRC Project No. 19624 January, 1996
TRC Environmental Corvoration 5 Waterside Crossing Windsor. CT 06095 TeleDhone: (8601 289-8631 F a c h e : (8601 298-6399
. .
:. :.:
Table of Contents
. . , i : ' I..,
.~
. . . .:. .>::
. .
...
...
SEcTmN EaGE
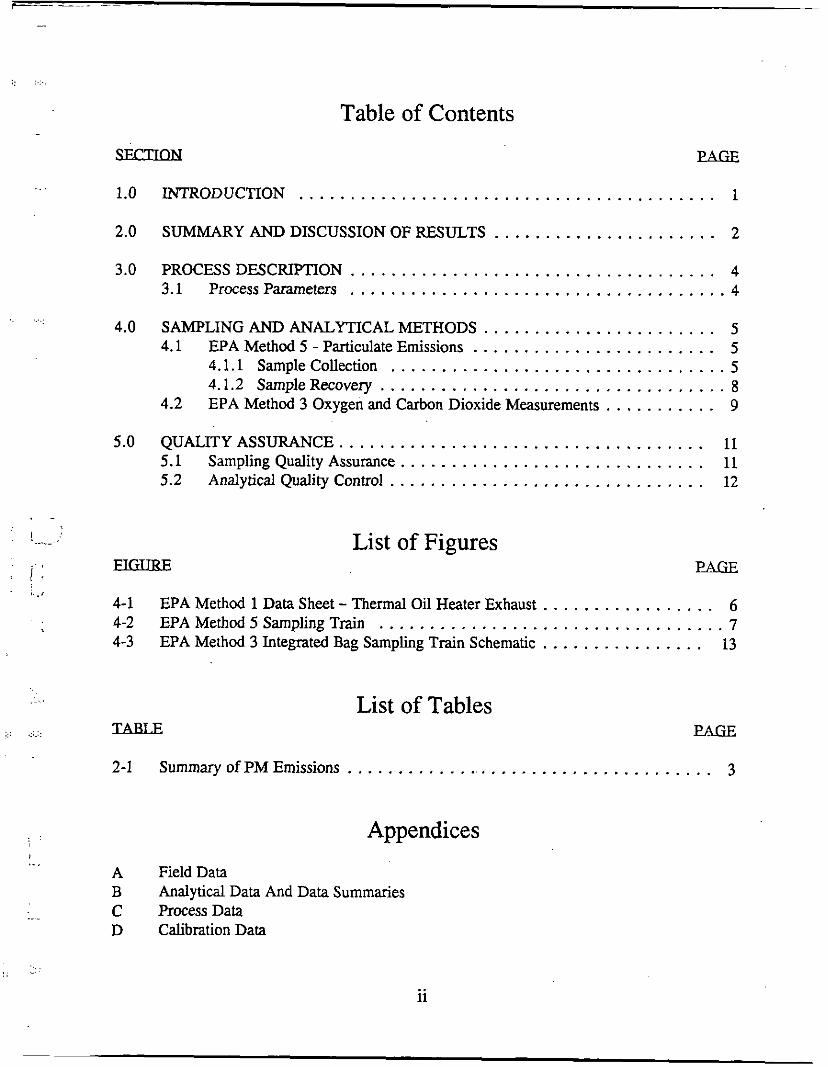
1.0 INTRODUCTION . . . . . . . . . . . . . . . . . . . . . . . . . . . . . . . . . . . . . . . . . 1
2.0 SUMMARY AND DISCUSSION OF RESULTS ...................... 2
3.0 PROCESSDESCRIPTION . . . . . . . . . . . . . . . . . . . . . . . . . . . . . . . . . . . . 4 3.1 Process Parameters . . . . . . . . . . . . . . . . . . . . . . . . . . . . . . . . . . . . . 4
4.0 SAMPLING AND ANALYTICAL METHODS . . . . . . . . . . . . . . . . . . . . . . . 5 4.1 EPA Method 5 - Particulate Emissions . . . . . . . . . . . . . . . . . . . . . . . . 5
4.1.1 Sample Collection . . . . . . . . . . . . . . . . . . . . . . . . . . . . . . . . . 5 4.1.2 Sample Recovery . . . . . . . . . . . . . . . . . . . . . . . . . . . . . . . . . . 8 EPA Method 3 Oxygen and Carbon Dioxide Measurements . . . . . . . . . . . 9 4.2
5.0 QUALITY ASSURANCE. . . . . . . . . . . . . . . . . . . . . . . . . . . . . . . . . . . . I1 5.1 Sampling Quality Assurance . . . . . . . . . . . . . . . . . . . . . . . . . . . . . . 11 5.2 Analytical Quality Control ............................... 12
List of Figures PAGE
4-1 EPA Method 1 Data Sheet - Thermal Oil Heater Exhaust . . . . . . . . . . . . . . . . . 6 4-2 EPA Method 5 Sampling Train . . . . . . . . . . . . . . . . . . . . . . . . . . . . . . . . . . 7 4-3 EPA Method 3 Integrated Bag Sampling Train Schematic . . . . . . . . . . . . . . . . 13
List of Tables EAGE
2-1 Summary of PM Emissions ..................................... 3
Appendices
A Field Data B C Process Data D Calibration Data
Analytical Data And Data Summaries
.. 11
. .. ..
-
1.0 INTRODUCTION
TRC Environmental Corporation (TRC) was retained by Louisiana-Pacific Corporation to
conduct a compliance emissions measurement test program at its facility inNew Limerick, Maine.
The purpose of this program was to demonstrate that the combined emissions from the thermal oil
heaters (TOHs) are in compliance with United States Environmental Protection Agency (USEPA)
regulations and the State of Maine Department of Environmental Protection Agency (MEDEP)
permit number A-327-72-A-R. Emissions measurements were performed in the common TOH
exhaust stack to determine the combined emission rate of particulate matter from the TOHs. All
testing was conducted in accordance with accepted USEPA test methodologies.
The test program was conducted on December 13, 1995 and was supervised by Mr. Raul Baez of
TRC. Ms. Sue Somers, of Louisiana-Pacific provided the process and logistical support during
the program. Mr. Robert Hartley, of the Maine' State Department of Environmental Protection, . >
i 1 ; observed the test program. I .
,. . . Section 2.0 of this test report presents a summary and discussion of the test results. Section 3.0
provides a brief description of the process and the parameters that were monitored during testing.
Section 4.0 details the test methods to be used, and Section 5.0 presents TRC's quality control
plan for this program.
-
I i..
1
. . ..
. . . . . .: ....
2.0
Triplicate 60-minute emissions tests were conducted in the common TOH exhaust stack to
determine the emission rate of PM. Sampling was conducted in accordance with EPA Methods
1-5. Both TOH units were in operation during testing.
SUMMARY AND DISCUSSION OF RESULTS
.:.:.
The results of the PM tests are presented in Table 2-1. The results indicate that the average PM
'emission concentration was 0.0227 grains per dry standard cubic foot and that the average
emission rate was 2.83 pounds per hour. The average emission rate based on heat input and the
published Fd factor for woodhark of 9600 dry standard cubic feet per million BTU (40 CFR 60,
Appendix A, Method 19) was 0.0064 pounds per million BTU (lb/mmBTU). The average
emission rate of 0.0664 lb/mmBTU is less than the permit limit of 0.15 lb/mmBTU.
2
I . .. .
! ', I
- . .
. . ... .....
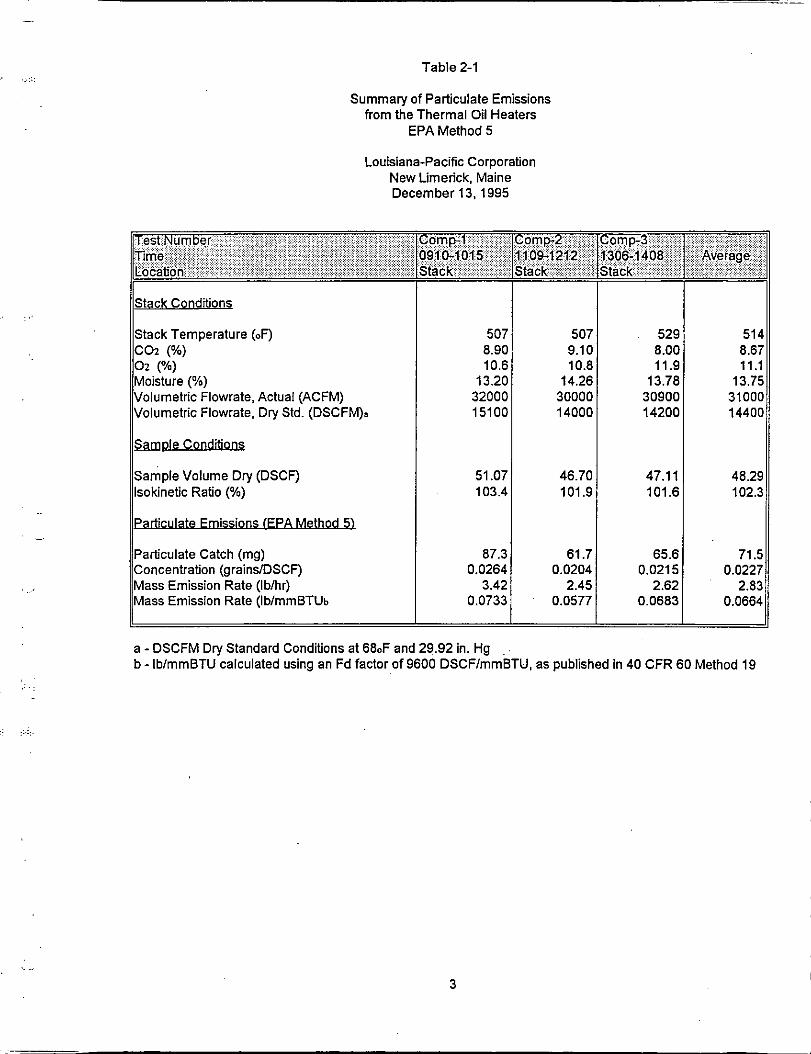
,, ... ::: Table 2-1
Summary of Particulate Emissions from the Thermal Oil Heaters
EPA Method 5
Louisiana-Pacific Corporation New Limerick, Maine December 13,1995
,. :
.. ..:. , ,..:
Location
Stack Conditions
Stack Temperature (OF) coz (%) 0 2 ( O h )
Moisture (%) Volumetric Flowrate, Actual (ACFM) Volumetric Flowrate, Dry Std. (DSCFM).
Con ditions
Sample Volume ~ r y (DSCF) lsokinetic Ratio (%)
Particulate Catch (mg) Concentration (grains/DSCF) Mass Emission Rate (Ibihr) Mass Emission Rate (Ib/mmBTUb
:ompl Comp-2 Comp-3-
;tack Stack Stack 1910-1015 1109-1212 1306-1408
507 8.90 10.6 13.20 32000 15100
51.07 103.4
87.3 0.0264 3.42
0.0733
52s 8.0C 1 1 5 13.78 3090C 1420C
47.1 1 101.6
65.6 0.0215 2.62
0.0683
a - DSCFM Dry Standard Conditions at 68.F and 29.92 in. Hg b - Ib/mmBTU calculated using an Fd factor of 9600 DSCF/mmBTU, as published in 40 CFR 60 Method 19
.. ., 3
.. . . . ... . .
.. . .
3.0 P
The thermal oil heaters (TOHs) are used to supply hot thermal oil to the board process, hot ponds,
building space heat, and other miscellaneous loads. The TOHs are fired with bark and wood
wastes that are generated from the debarking operation and waferboard production areas. Each
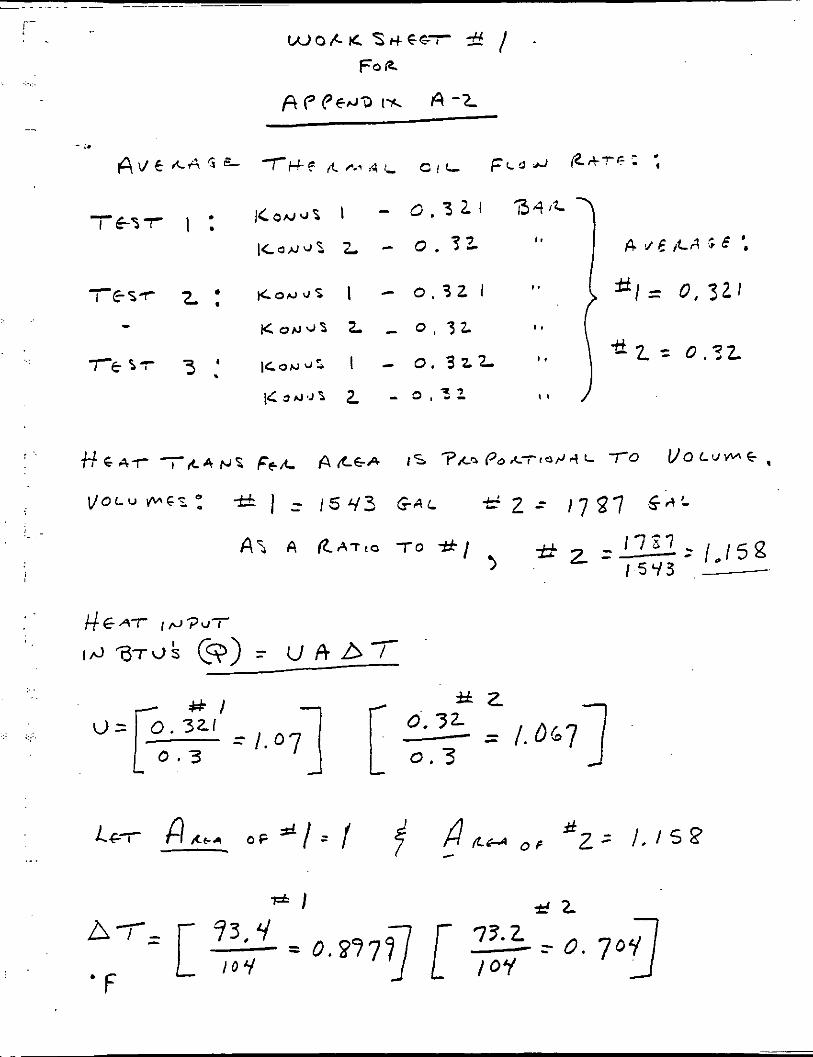
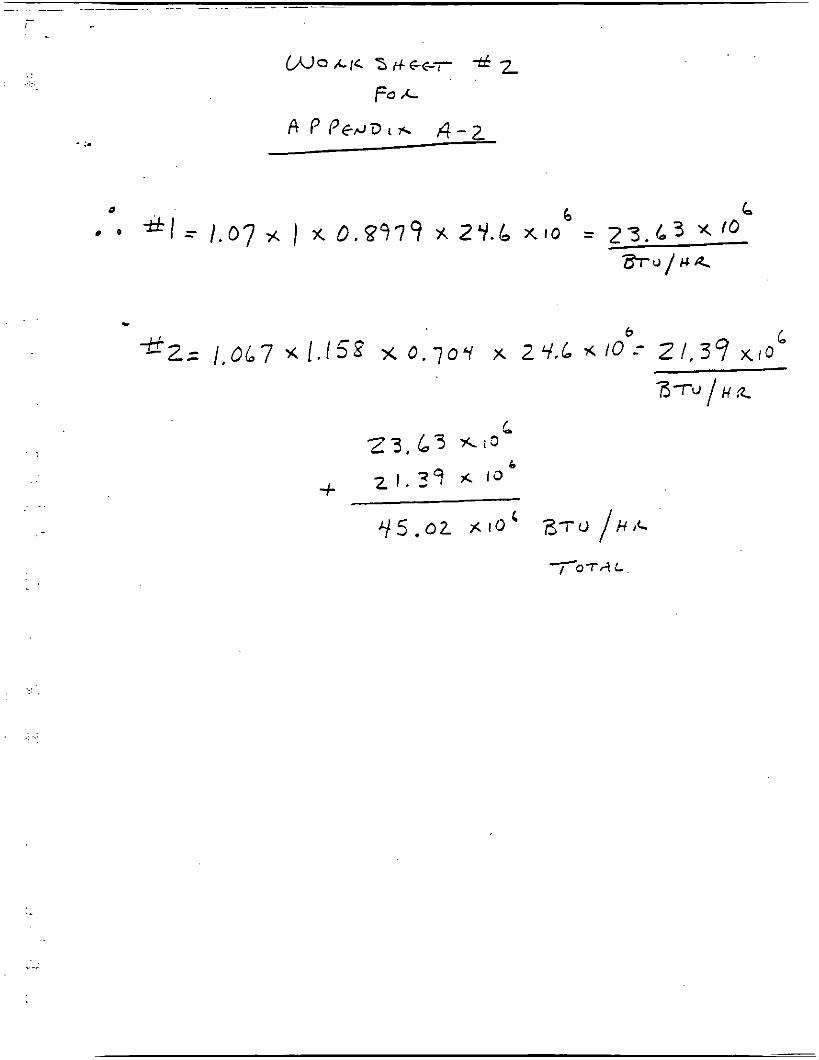
TOH is rated at 24.6 X 10⁶B'ITJ per hour input. The TOHs can also be fued on #2 fuel oil when
the wood delivery system is off line.
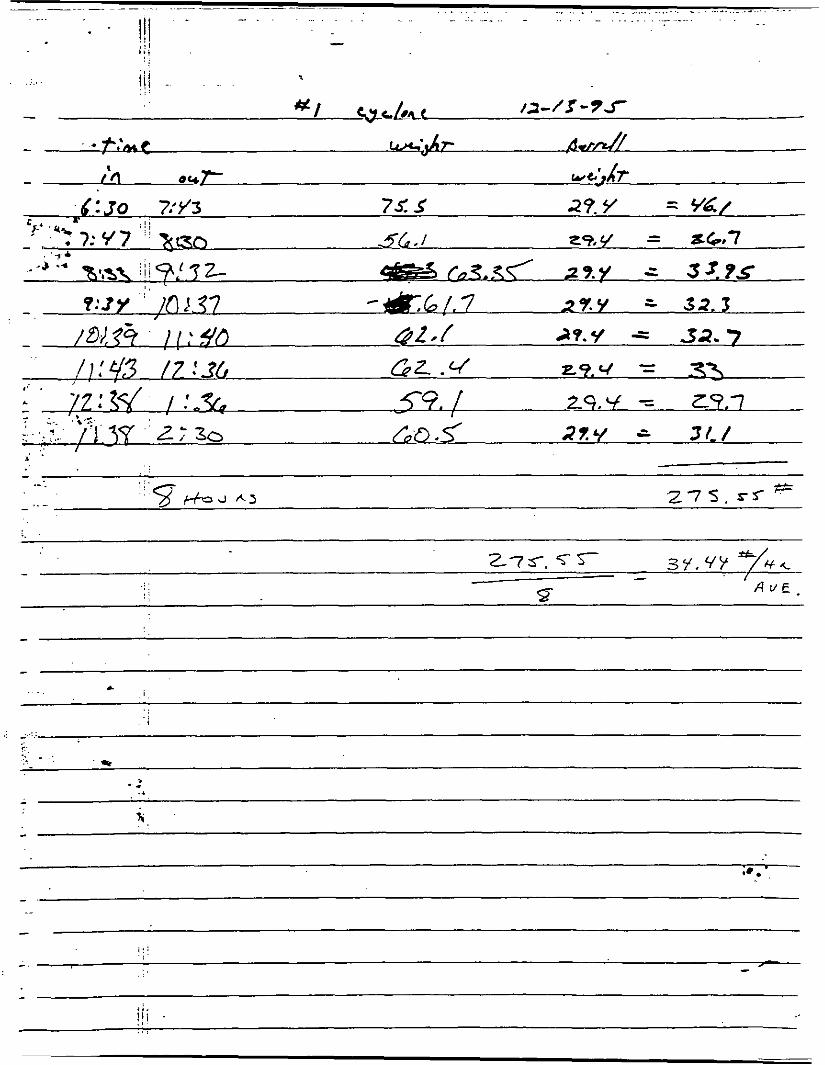
Exhaust gases from the TOHs are cleaned by a multi-clone unit and separate dry electrostatic
precipitators (ESP) before being exhausted through a common 100 foot tall stack.
The multi-clone is a multi-tubular mechanical dust collection system, manufactured by Hutch
Engineering, Model #lo, size 36-6. It is equipped with 24 operating 9" cast iron tubes, and
energy recovery cones. Each multi-clone is designed to collect 78% or more of the dust in the
flue gas providing that not more than 25% of the dust is under 10 microns in size.
. .:. . ...
. . . . . . : ....
' . - Each ESP is composed of a single chamber curtain array of one collector and one ionizer section,
designed to collect dust. The ESPs were manufactured by Joy Technologies and have a rated
efficiency of approximately 75% at an inlet loading rate of 14.8 pounds per hour. Five external
air operated rappers remove the accumulated dusdash from the TOHs, which then falls into a
collection hopper with an attached air lock. The ionizer operates from a 55 Kv. 400 ma. oil immersed high voltage transformer and full wave rectifier.
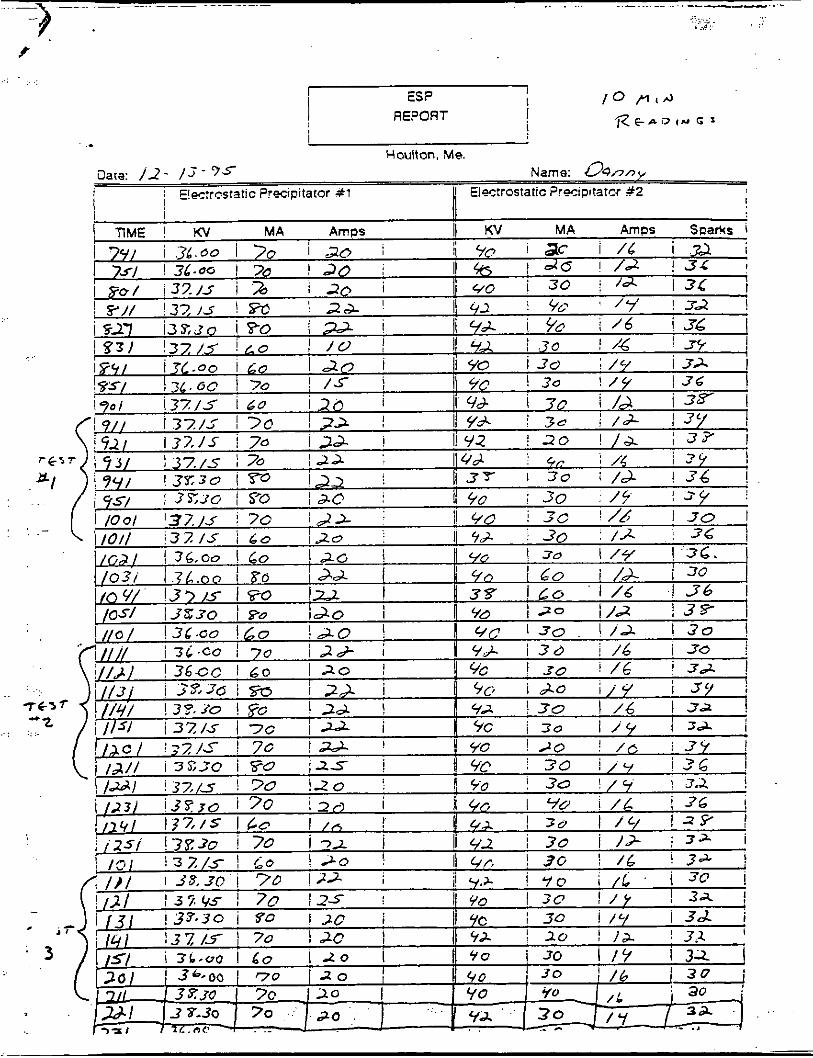
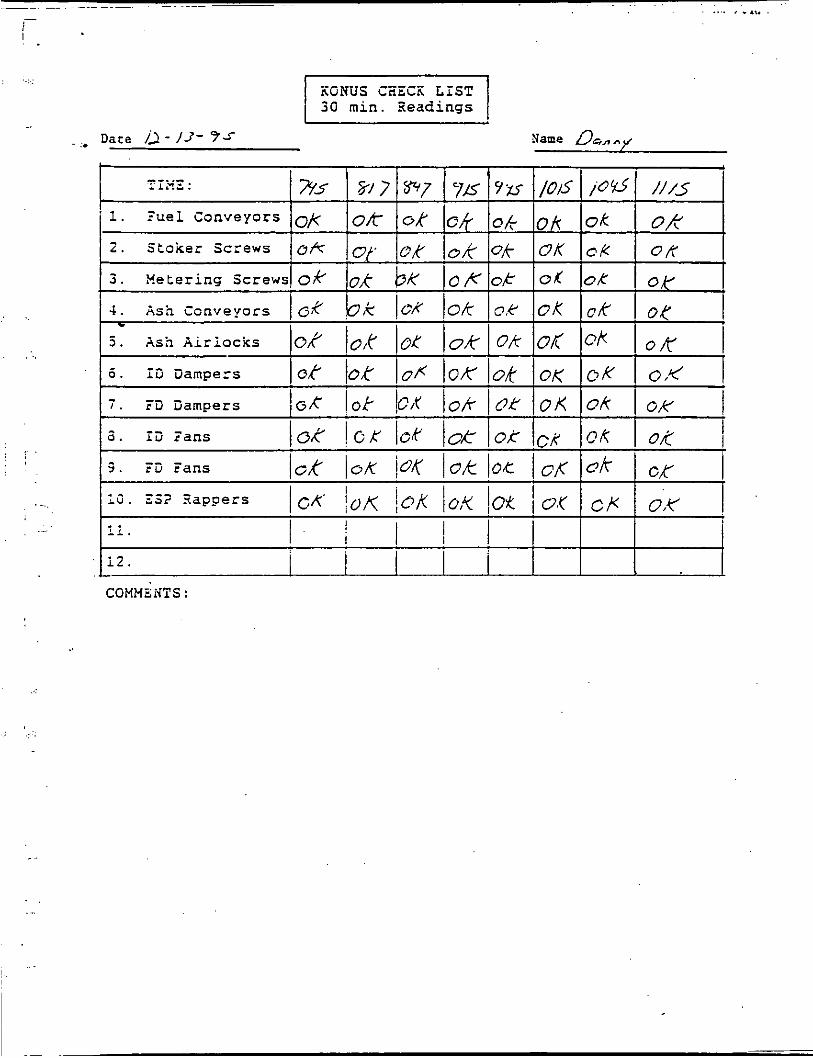
3.1 Qixatin-
During testing the following parameters were recorded:
EEE
Fuel Consumption Collector Voltage
Incoming Oil Temperature Collector Current
Outgoing Oil Temperature Input Amperage
Sparks per Minute
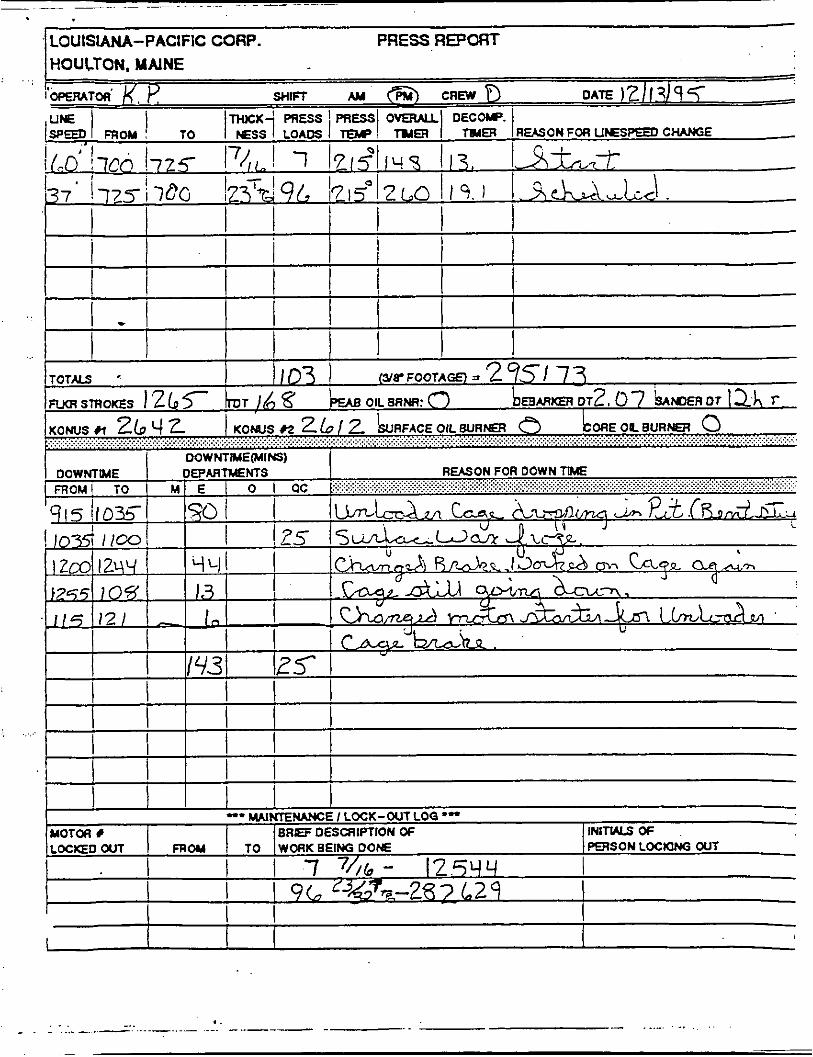
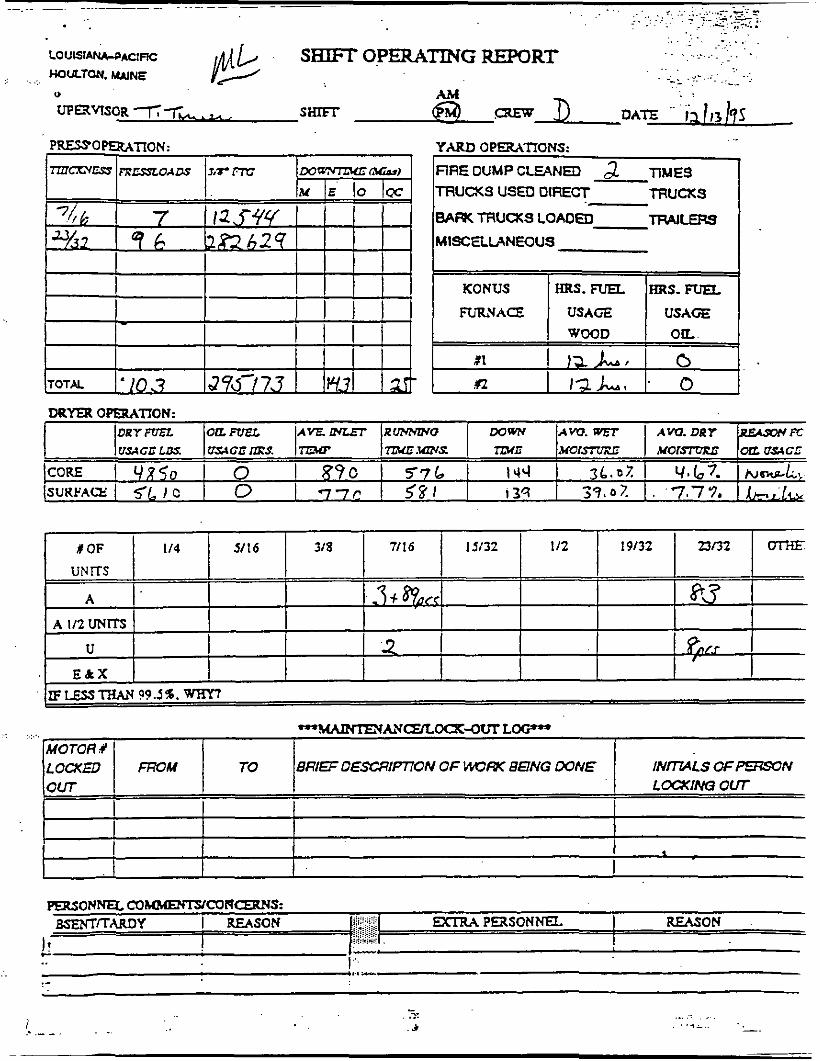
Copies of the recorded process data are presented in Appendix C.
4
EresS
PanelslHour
Panel Weight
Press Temp.
TonslHour
. . . . .
.. i
., :..:.
.. .
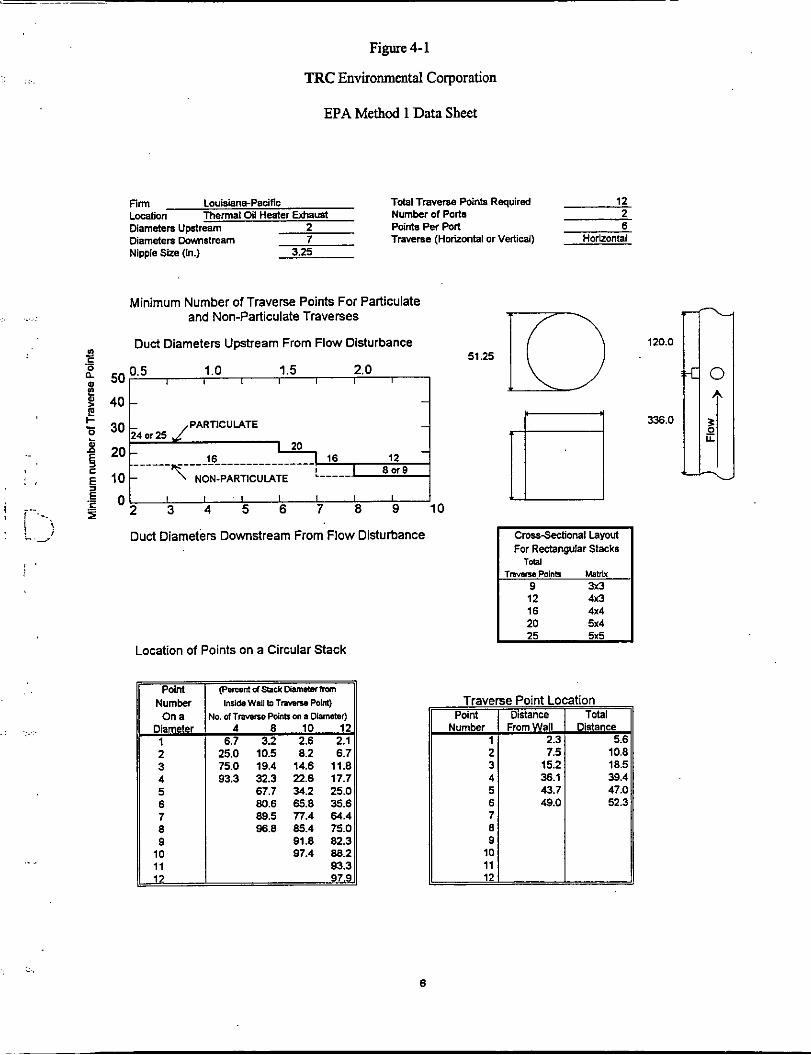
4.0 A N A 1 .- PM sampling was conducted in the common 51.25 inch diameter exhaust of the thermal oil heaters
in accordance with EPA Methods 1-5. The sampling location was located at least 2 diameters
upstream and 7 diameters downstream from flow disturbances. Twelve traverse points were
sampled with each iwkinetic sampling train. The sampling point locations are presented in Figure
4-1.
The following sections describe the various methods that were used.
4.1'
Emission concentrations of PM were measured at the exhaust of the thermal oil heater in
accordance with EPA Methods 1-5.
4.1.1 S-
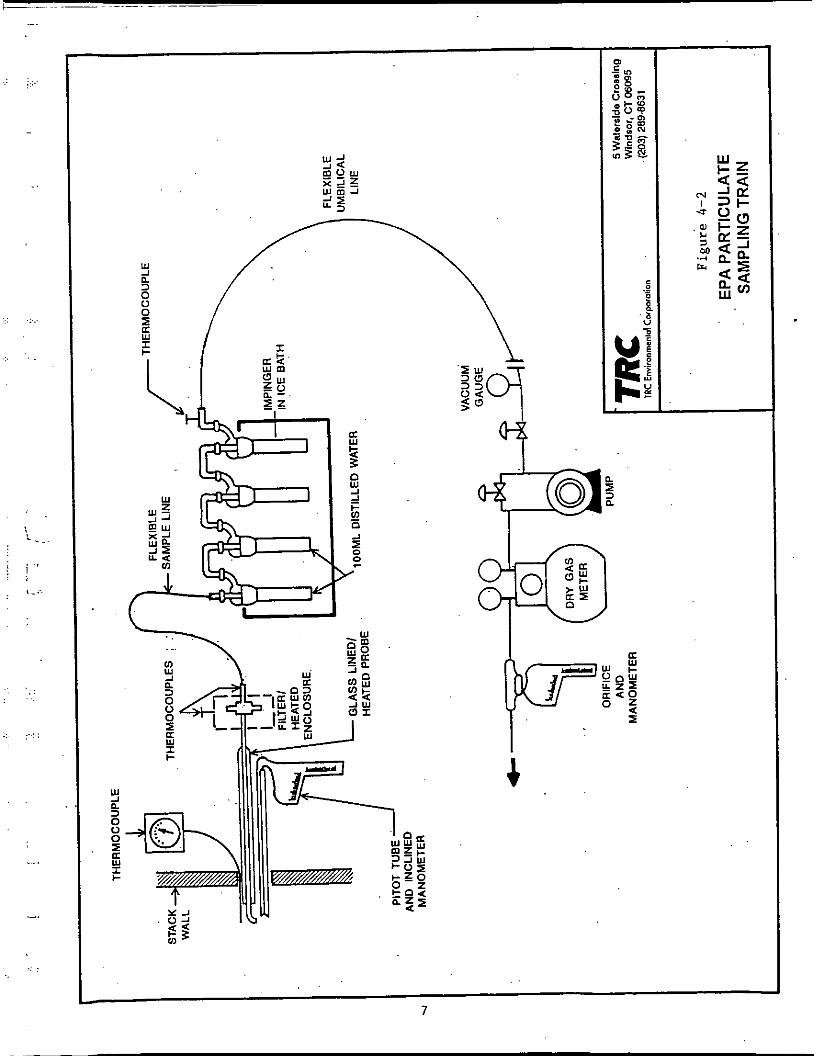
PM sampling was accomplished by use of an EPA Method 5 train. The sample train is
shown schematically in Figwe 4 2 and consisted of a nozzle, probe, filter, four impingers,
a vacuum pump, dry-gas meter, and an orifice flow meter.
A stainless steel nozzle was attached to a glass-lined stainless steel probe which was heated
to prevent condensation. Teflon mat filter papers supported in 4%-inch glass filter holders
were used as the particulate collection media. The filter assembly was enclosed in a heated
box to maintain temperatures at 248°F f 25°F. A thermocouple located inside the back
half of the filter holder monitored the gas stream temperature and verified that the
temperature was kept at 248°F f 25°F.
An ice bath containing four impingers was attached to the back end of the filter. The fxst
and second impingers contained 100 milliliters (m!) each of deionized water. The third
impinger was empty, and the fourth impinger contained silica gel to remove any remaining
moisture. Flexible tubing, a vacuum gauge, a needle valve, a leakless vacuum pump, a
bypass valve, a dry-gas meter calibration orifice, and an inclined manometer completed
the sampling train. The stack velocity pressure and temperature were monitored by an S-
5
n c 0 a
- - c t 8 0
Figure 4-1
TRC Environmental Corporation
EPA Method 1 Data Sheet
Firm LouisianbPaciflc Total Travene Points Required 12 Location Thermal Oil Heater Emaust Number of Ports 2 Diameters upaream 2 Points Pef port 6 Diameters Downstream 7 Traverse (Horizontal or Vertical) Horizontal Nipple Ske (In.) 3.25
Minimum Number of Traverse Points For Particulate and Non-Particulate Traverses
Duct Diameters Upstream From Flow Disturbance
1.0 1.5 2.0 5 o P 5 , I I I I I I I
4 0 t
Duct Diameters Downstream From Flow Disturbance
51.25
For Rengutar Stacks
Location of Points on a Circular Stack
(Pemmtc4Sack-m inrids wau m ~nmv pow
6.7 3.2 2.6 2.1 25.0 10.5 8.2 6.7 75.0 19.4 14.6 11.8 93.3 32.3 22.6 17.7 /I ! 1 67.7 34.2 25.0
10 11
Traverse Point Location
15.2 18.5 36.1 39.4 43.7 47.0 49.0 52.3
10 11 12
6
120.0
336.0
..
.. .
1 I ..
I j ' . . .
L . :.
...
. . . .
3
B E
n 3 0 0 0
Y
* 7
. . ..:.:
type pitot and a thermocouple connected to a potentiometer. A check valve was not used
in the TRC sampling train.
A nomograph was used to quickly determine the orifice pressure drop required for the
measured pitot velocity pressure and stack temperature in order to maintain isokinetic
sampling conditions. Sampling flow was adjusted by means of the bypass valve. Before
and after each particulate test run, the sampling train was leak checked to meet the 0.02
cfm limit. All pertinent test data were recorded on the appropriate field data sheets. . .:::.
-. : - .
. ..
!.<.
4.1.2 Three sample containers were used, as follows:
ContainerNo. 1: The filter was sealed with Para-film in the field, and recovered at the TRC on-site trailer into a clean petri dish.
The nozzle, probe, and filter housing were rinsed in triplicate with acetone and deposited into a clean sample container.
Container No. 2:
Container No. 3: Silica gel from the fourth impinger was transferred to its original container and weighed to the nearest 0.5 milligram (mg).
4.1.3 The samples were transported to TRC’s laboratory, where the following analyses were
performed:
Container No. 1: The filter and any loose PM from the sample container was transferred to a tared glass weighing dish. The sample was then oven dried at 320°F f 10°F for six hours, cooled in a desiccator for two hours, and weighed to constant weight. Results were reported to the nearest 0.1 mg.
The acetone wash was transferred to a tared beaker and evaporated to dryness at ambient temperature and pressure. The sample was
Container No. 2:
8
::. ''
..
then oven dried at 320°F 10°F for six hours, cooled in a desiccator for two hours, and weighed to constant weight. Results were reported to the nearest 0.1 mg.
Container No. 3: Silica gel was weighed to the nearest 0.5 mg. The weight of the moisture entrapped in the silica gel, along with the impingers, was used to calculate the moisture content of the stack gas.
d 3 - 0 X O . .
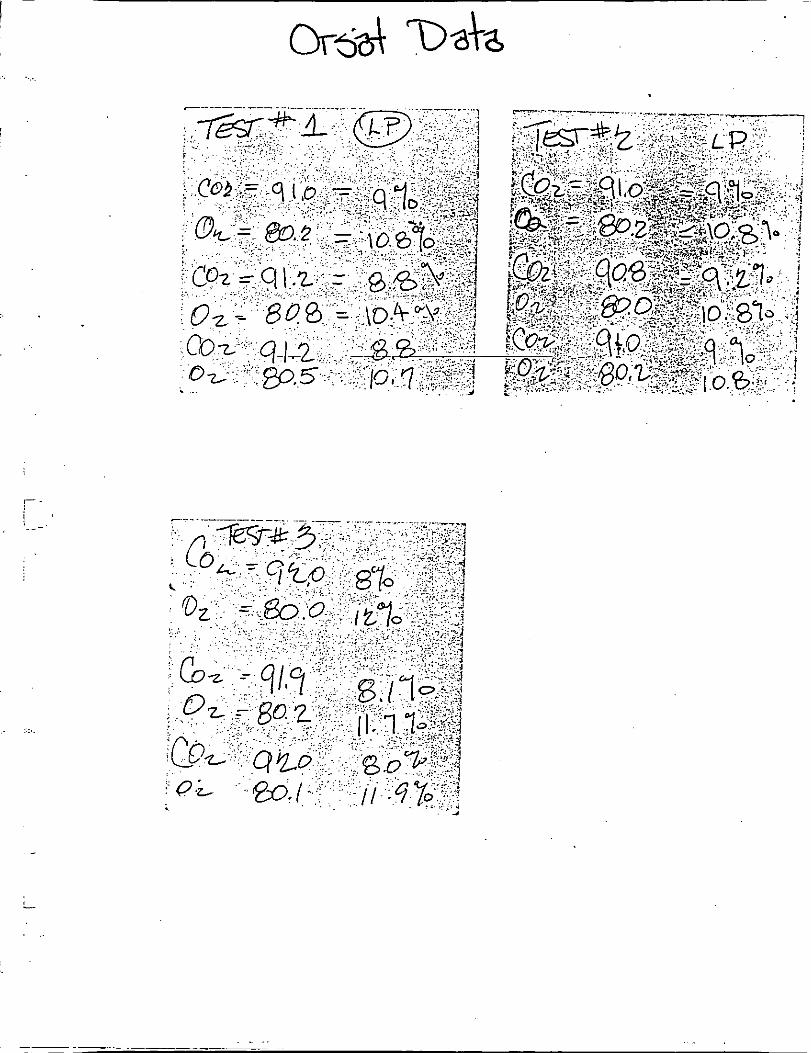
4.2
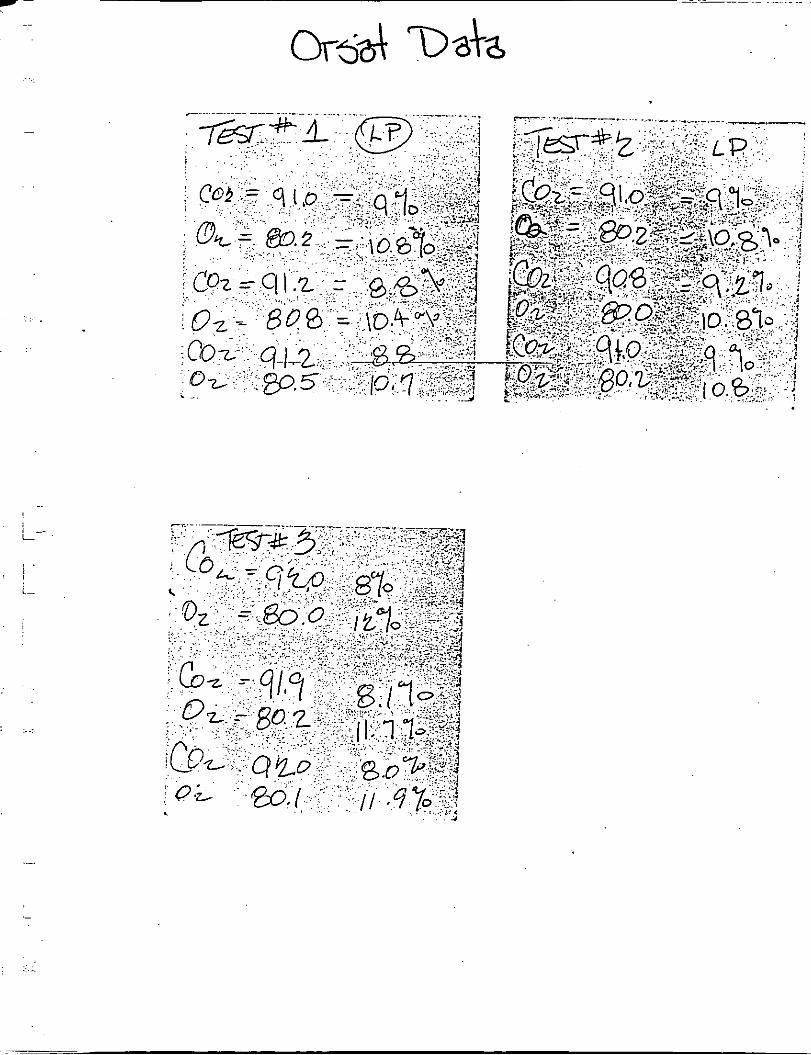
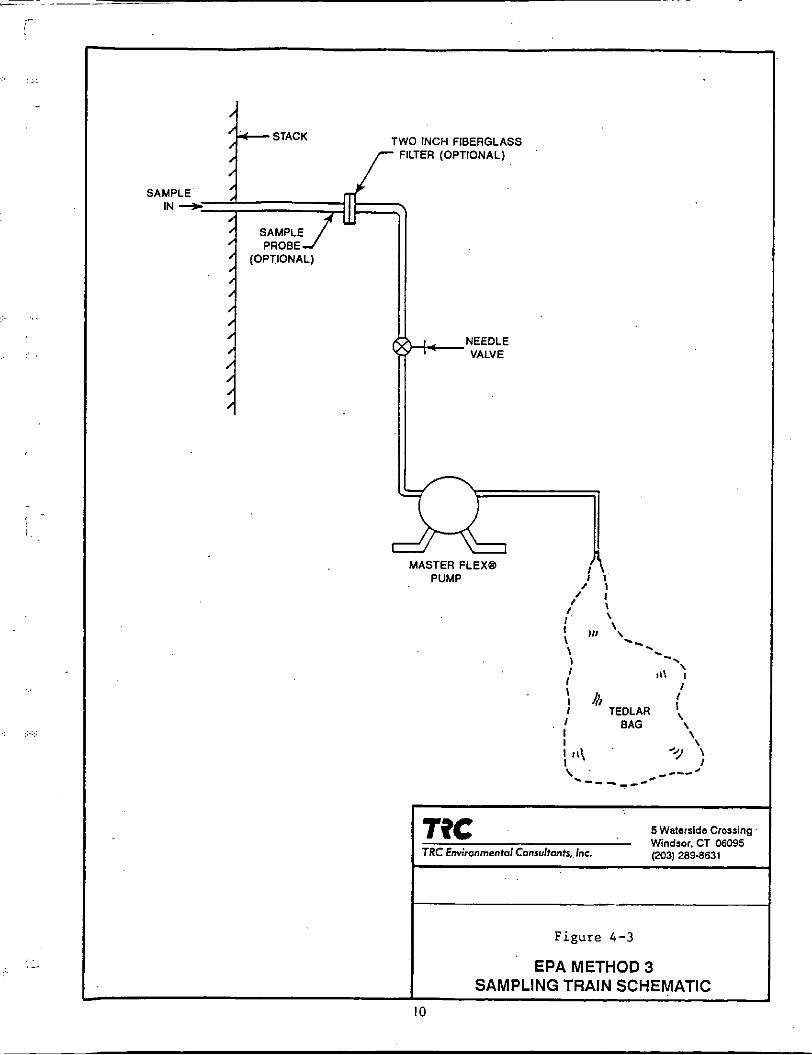
An integrated Tedlar bag sample was collected concurrent with each PM test run and analyzed in
accoIdance with EPA Method 3 for 0, and COP Figure 4-3 presents a schematic of the sampling
train. Concentrations of 0, and CO, were measured using an Orsat flue gas analyzer. Each bag
sample was analyzed in triplicate.
-.
. ... . . .
. .
I I.
...
. . . ...:. . .
1 .
5 Waterside Crossing Windsor. CT 06W5 0 3 1 289-8631 TRC Environmental Consultonis, Inc.
Figure 4 - 3
EPA METHOD 3 SAMPLING TRAIN SCHEMATIC
10
. . . . .
5.0
The project manager will.be responsible for implementation of the TRC quality assurance (QA)
program as applied to this project. The program is designed to ensure that emission measurement
work is performed by qualified people using proper equipment following written procedures in
order to provide accurate, defensible data.
,.:.:.
. . . ...
... .. . . ...
At the beginning of the test day, a meeting will be held to orient TRC and Louisiana-Pacific
personnel to the activities scheduled for that day and to determine if any special considerations are
appropriate for the day’s work.
5.1
The TRC quality assurance program for source measurements is designed so that the work done
by competent, trained individuals experienced on the specific metrologies being used; using
properly calibrated equipment; and using approved procedures for sample handling and
documentation.
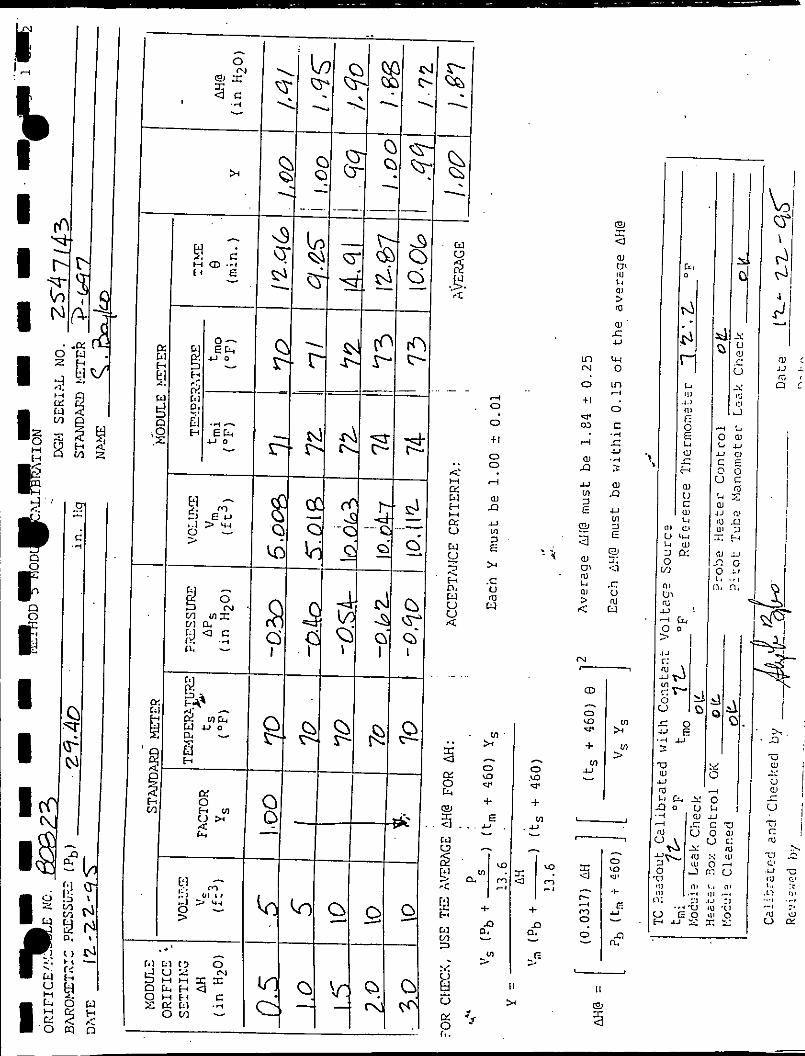
TRC’s measurement devices, pitot tubes, dry-gas meters, thermocouples, and portable gas
analyzers are uniquely identified and calibrated with documented procedures and acceptance
criteria before and after each field effort. Records of all calibration data are maintained in TRC
files.
Data are recorded on standard forms. Bound field notebooks are used to record observations and
miscellaneous elements affecting data, calculations, or evaluation. Specific details of TRC’s QA
program for stationary air pollution sourm may be found in QuuZify Assurance Handbookfor Air
Pollution Measurement Systems, Volume III (EPA-60014-77-02%).
In the mobile laboratory, analysts record calibration and analysis data in notebooks and summarize
specific data on prepared data sheets. Notebooks, data sheets, and calculations will be reviewed
by the project manager.
11
.. ~
. . ..: , ... . .
5.2
Compressed gases used as fuels and carriers are purchased at specific purities, according to
application. Compressed gases used as calibration standards are always National Institute for
Standards and Technology traceable, either directly or indirectly.
., .... . .
. ,...
12
I
I I I I I I
I I I I I I
Appendix A
Field Data Sheets
I I I I I
I I I I I
i I
J
I
I I I I I I
I I I I I I
R
6 h
1 F
,---.
I
.:. . . .
: J i
II I 1 I I I
I P I 1 I I
i
Appendix B
Analytical Data and Data Summaries
I
1 I I 1 1 I I
I 1 I I I I
k I
/
PARTICULATE TEST DATA . . . . . . . . . . . . . . . . . . . . . . . . . . . . . . . . . . . . . . . . . . . . . . . . . . . . . . . . . . . . . . . . . . . . . . . . . . . . . . . . . . . . . . . . . ..........*.*................. t.
TEST LOCATION FIRM TIME DATE PROJECT NO. BAROMETRIC PRESSURE STACK AREA NOZZLE DIAMETER SAMPLING TIME DRY GAS METER CAL FACTOR M PITOT COEFFICIENT AVG. SQUARE DELTA P AVG. DELTA H AVG. METER TEMP. STATIC PRESSURE AVG. STACK TEMPERATURE SAMPLE VOLUME WATER COLLECTED co 2 0 2 co N 2 PARTICULATE CATCH (Method 5) ORGANIC PM CATCH (Method 202) INORGANIC PM CATCH (Method 202) SAMPLE VOLUME DRY MOISTURE MOLECULAR WEIGHT OF STACK GAS STACK VELOCITY VOLUMETRIC FLOWRATE, ACTUAL VOLUMETRIC FLOWRATE, DRY STD. ISOKINETIC RATIO
PARTICULATE CONCENTRATION PARTICULATE EMISSION RATE PARTICULATE EMISSION RATE
...** ff. ........ ... f.... ... tt.*. f.. .Of..
0-1
in. Hg fh in.
min. .I.... .I..
..*.***.
in. HzO in. Hz0
O F
in. Hg OF
ml % % % %
m
mg mg mg
OSCF %
IbAbmole FPM
ACFM DSCFM
%
grains/DSCF lbihour
IblmmBTU
3
C o m p l Comp2 Comp3 Stack Stack Stack
LP LP LP 0910-1015 11 09-1212 1306-1408 12-13-95 12-13-95 12-13-95
19624 19624 19624 29.92 14.32 0.378
60 1 .oo 0.84
0.484 2.25
48 -0.50
507 48.85 165.0
8.9 10.6
0 80.5
87.30 0.00 0.00
51.07 13.2
28.28 2232
31968 15133 103.4
0.02637 3.42
0.0733
29.92 14.32 0.378
60 1 .oo 0.84
0.455 1.99
57 -0.52
507 45.46 165.0
9.1 10.8
0 80.1
61.65 0.00 0.00
46.70 14.3
28.19 2098
30044 14047 101.9
0.02037 2.45
0.0577
29.92 14.32 0.378
60 1 .oo 0.84
0.462 2.04
58 -0.43
529 45.95 160.0
8.0 11.9
0 80.1
65.63 0.00 0.00
47.1 1 13.8
28.14 2158
30898 14203 101.6
0.02150 2.62
0.0683
I
1 I I I I I 1 b I 1 I I I I
k I
~~ ~
Sample Number Media Particulate (mg)
TO-PM-1 Filter #33 1 72.08
TO-PM-I Probe Wash 15.22
T 0 - P M - 2 Filter #322 53.74
TO-PM-2 Probe Wash 7.91
TO-PM-3 Filter #323 57.84
TRC ENVIRONMENTAL CORPORATION, INC. 5 WATERSIDE CROSSING, WINDSOR, CT 06095
Connecticut Certification No. PH-0426 AIHA Laboratory Accreditation No. 259
860-298-6326
TO-PM-B
***LABORATORY REPORT***
Acetone Blank 0.68
LOUISIANA PACIFIC
Lab Number: 16322 Date Rec'd: 1211 5/95 Date Analyzed: 1211 8/95 Sample Description: Method 5 - Emissions No. Samples: 3 Trains and 2 Blanks
TRC Project No: 19624 Lab Project No.: 10902-3001 -00005
II T 0 - P M - 3 I Probe Wash I 7.79 II I1 TO-PM-B I Filter Blank I ND<0.5 II
- ......... ~ ....... . . . . . . . . . . . . . . . ............... ............... _.. ............... . . . ......... ...... . . . . . . . ~ .
I
z .C 5
.r e"
e"
L
(Y 3
....... ...... . . . . . . . . . .
'i I/
N I
id e 0 L
1
. . .. . . . .
. .: . j . . . . . . . . ... ..,., .
. . I ..,., , . . . . . . . .
VI
I- I - YI I- < 0
.. 3. .. . . .. :.
. : .
::. .
,-. - , I ._ .-
. .
. .
. . ... . . .
!...
!
Appendix C
Process Data
.:.::
_ - ! ..
., :.:::.
. _.
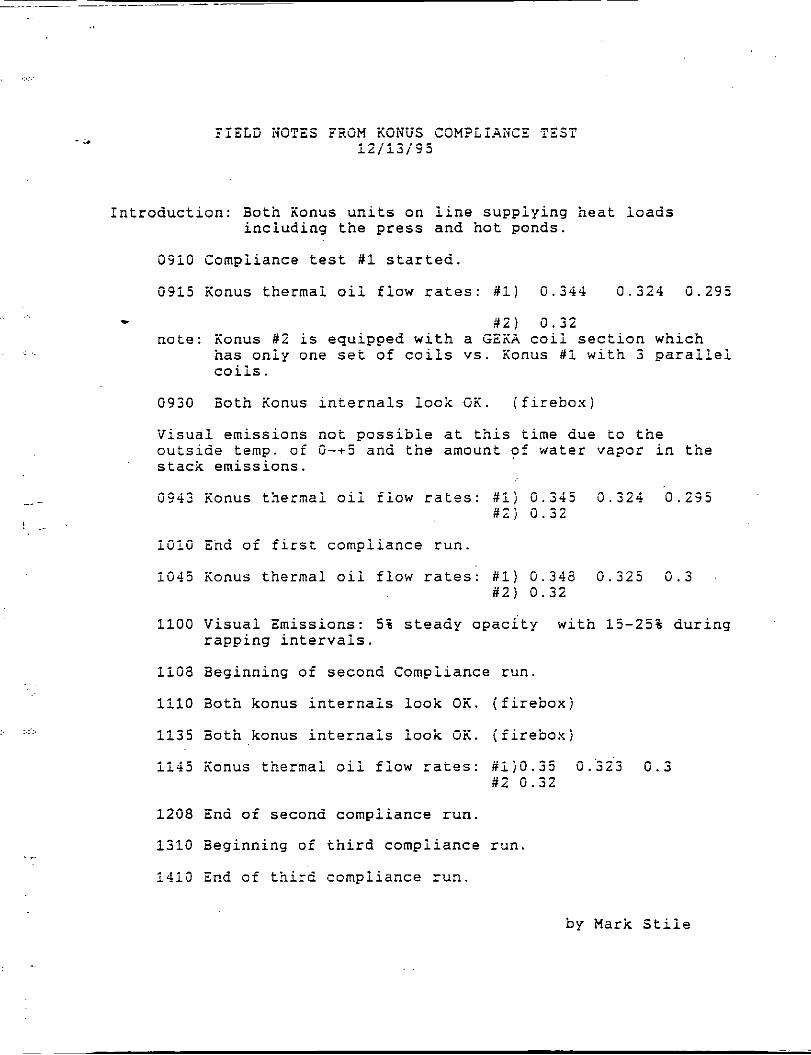
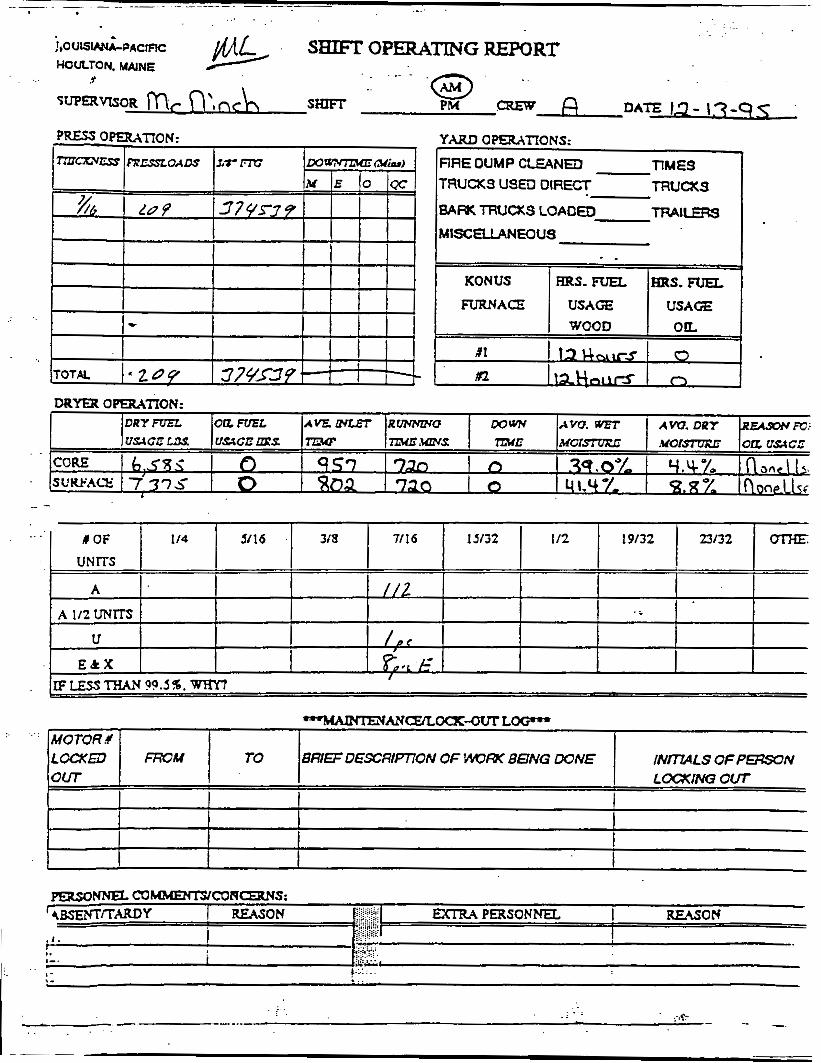
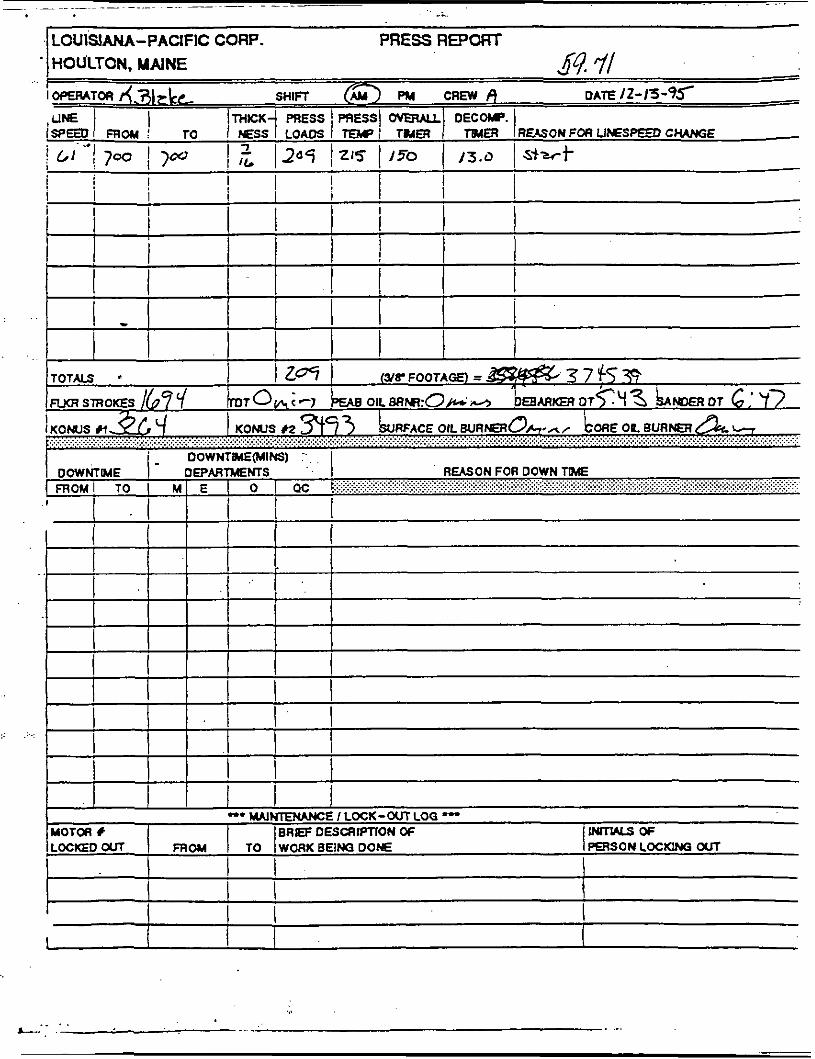
Introduction: 30th iionus units on line supplying heat ioads including the press and hot ponds.
09i0 tompiiance test #i started.
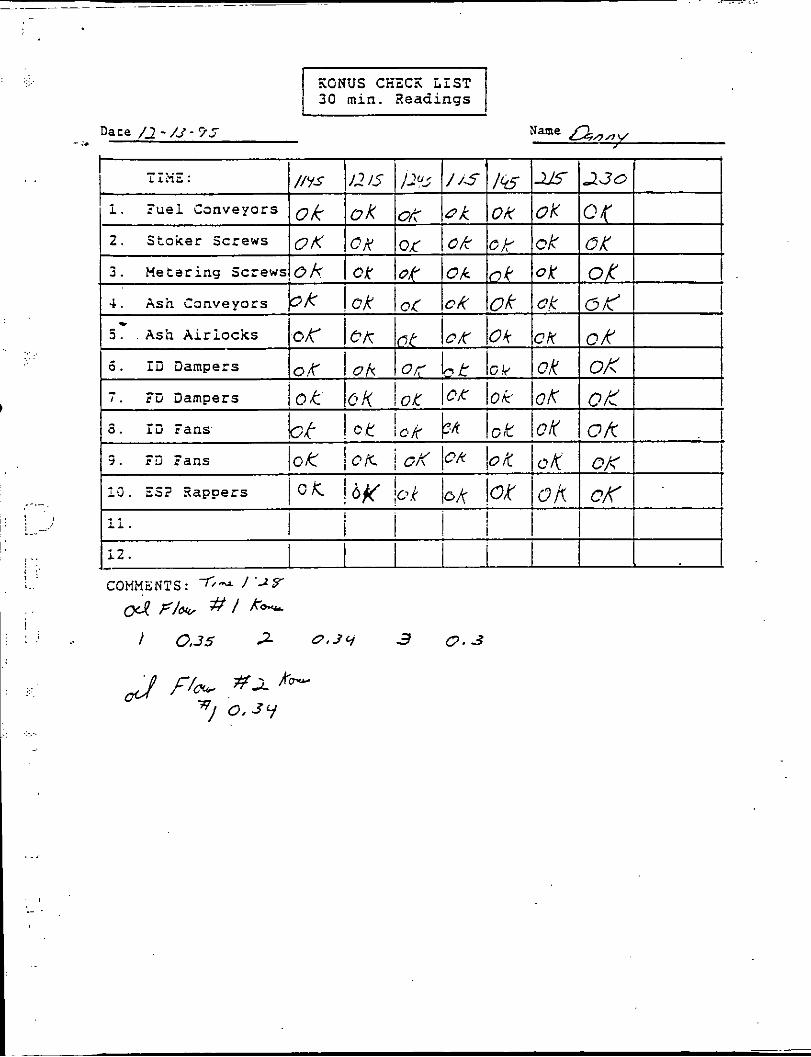
09i5 iionus thermai oii fiow rates: #i) 0 . 3 4 4 0.324 0.295
- # 2 ) 0.32 note: iionus # 2 is equipped with a G E M coii section which
has oniy one set of coiis vs. iionus ti with 3 paraiiei coiis.
0930 Both iionus internais iook G i i . (firebox;
Visuai emissions not possible at this time due to the outside temp. of 0-+5 and the amount of water vasor in the stack emissions.
0943 iionus thermai oii fiow rates: #ij 9.345 0.324 0.295 #Zj 5 . 3 2
i0l0 End of first compiiance run
io45 Konus thermai oil flow rates: #i) 0.348 0 . 2 2 5 0 . 3 i 2 j 0.32
iiO0 Visuai Emissions: 5% steady opacity with ij-253 during rapping intervais.
ii0a aeginning of second tompiiance run.
iil0 30th konus internais look OK. (firebox;
ii35 Both konus internais iook OX. (fireboxj
ii45 iionus thermai oii fiow rates: #ij0.35 0.523 0.3 # 2 0.32
1208 End of second compiiance run.
i310 Beginning of third compiiance run.
i4i9 End of third compliance run.
by Mark Stiie
- . . . .. . . . . ._ ' . . . . _. . - . - . _,_ ... - ~ -
. . :. -': .. . . . . . . . . . . . ..... . . . . , . ~ ........ :. : .;, . - :._ :.+'G: . . . - .: .e,..;,;<.:.:' . . _ _ -~ - _ _ ~~
.. . . . . . . . . . . . . . . .
.. . . . . . . . . ~ . . . . . . . .
. . . . . . . . . . . . . . . . , . .
-. . S € 3 I l T OPEMTING REPORT
:. ... :. molprw. WINE -L .-. - . LOUISIANASACIFIC
I , I
KONUS
FURlVACE
HRS. RIEL RRS. F U a
USAGE USAGE WOOD O I L
I
X I I ) 3 . J . . A I
.n I r7L9
- .... . . . . . . . . .. - . ._ . ._ . J . . / .. ._ - .
0 ' 0
I I l l 1
d OF I14 5/16 13/32 I12 19/32 23/32
@3 A .? t gp,,<
U 2 %I
UNITS
A 1/2 UNITS
E k X
m
~ - - _.-_I- .
.. ... . .
'4BSENTflrnY I REASON EXlTU PERSONNEL I REASON
..
.. ..
I ~~
I I I I ~~ I I I I r -
. _. ~
._ . . L-.., .
- :.
- - .-
.: . . . . ..:.
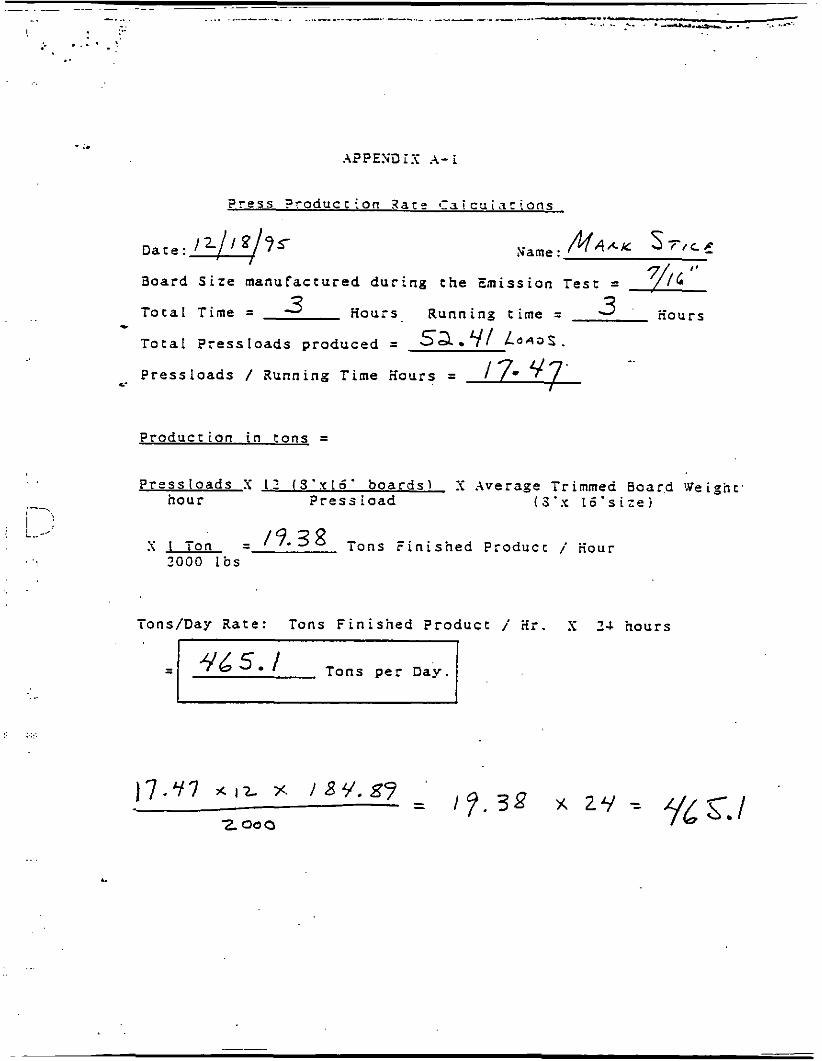
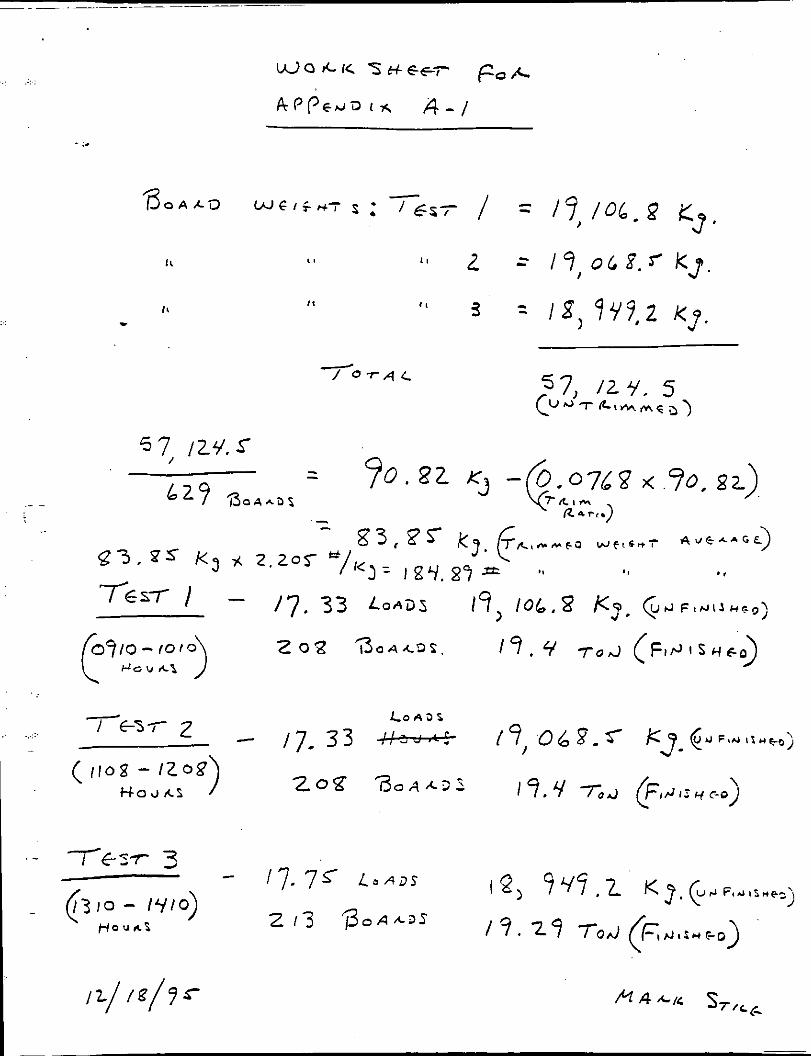
4 6 5 . 1 Tons p e r Day.1 I
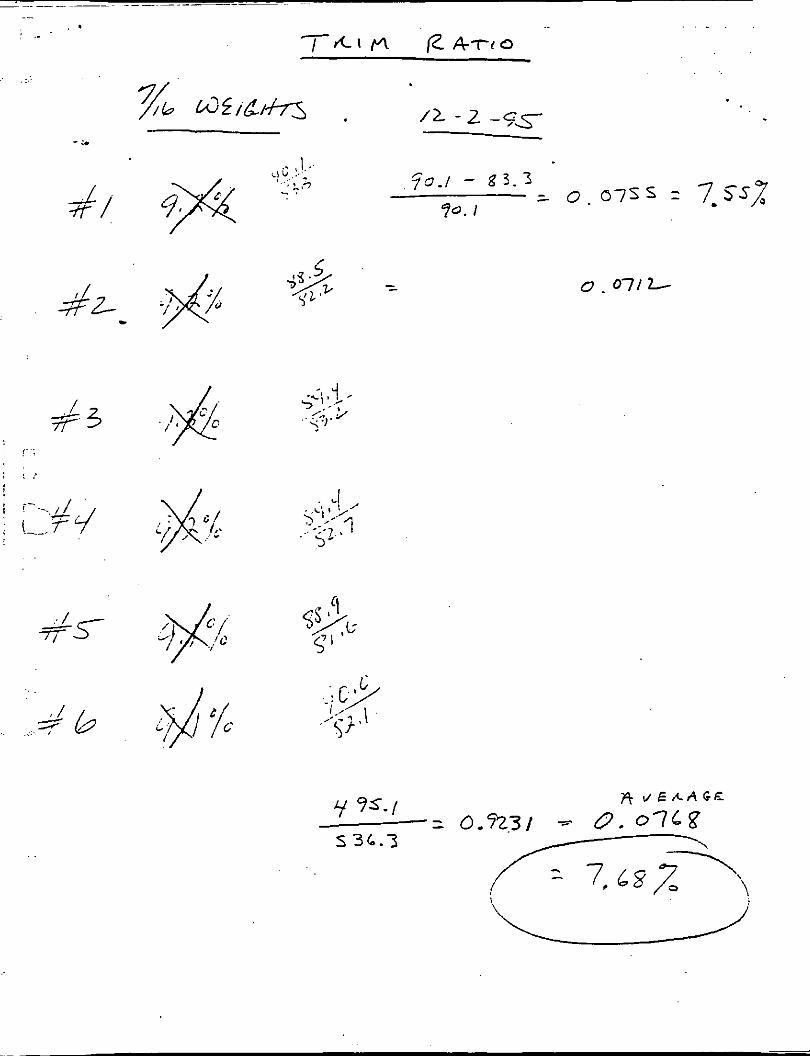
aoard Size manufactured during the Zmission Test = 7 / / L ' I -
3 . ._ Houis Running time = nours Total Time = 3 - Total Pressloads produced = 52-71 L e 4 J 5 .
Pressloads / Running Time iiours = r
Production in tons =
Pressloads S Jar sl :< Average Trimme- B0;lr.d 1Veighc' hour Press Load i S ' x t6.si:ej
S I Ton = / 9 .38 i o n s Finished Product ; Hour 2000 l b s
TonsIDay Xate: Tons Finished Product iir. S 24 hours
L
. . . .
20% 3 .a .cos
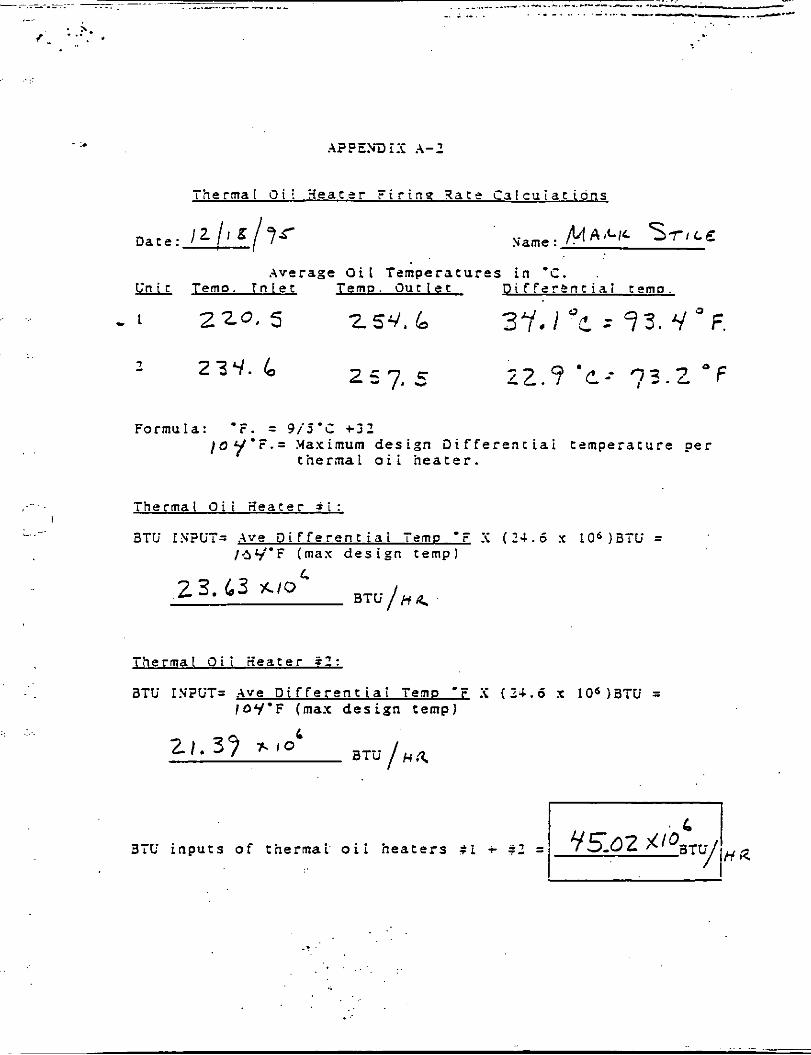
Thermal t J i ! iiear5r Pirino 3ace C~lcuiacions
Average Oil Temperatures in 'C. Temo. InIec Temo. Ouclec Diffcr2nrial remo.
.-.- Formula: 'F. = 91a c c32 / a y - P . = Maximum design Differenciai temperature per
thermal oii nearer.
. -. Thermal Oii iieacer i t : I
-. aT% INPUT= Ave Differentiai TcmD - - r S (24.6 x 10⁶)aTiu = L . I-3V.F (max design temp1
. . . . .,..
Thermal Oii Xeater 5 2 :
aTL' I?i?OT= .4ve Differentiai TemD ' P S ( 2 4 . 6 x 10⁶)aTti = fOY'F (max design temp)
.. . . . . . .
,
: ..:
:.
..: , .
. . . ,:.., . .
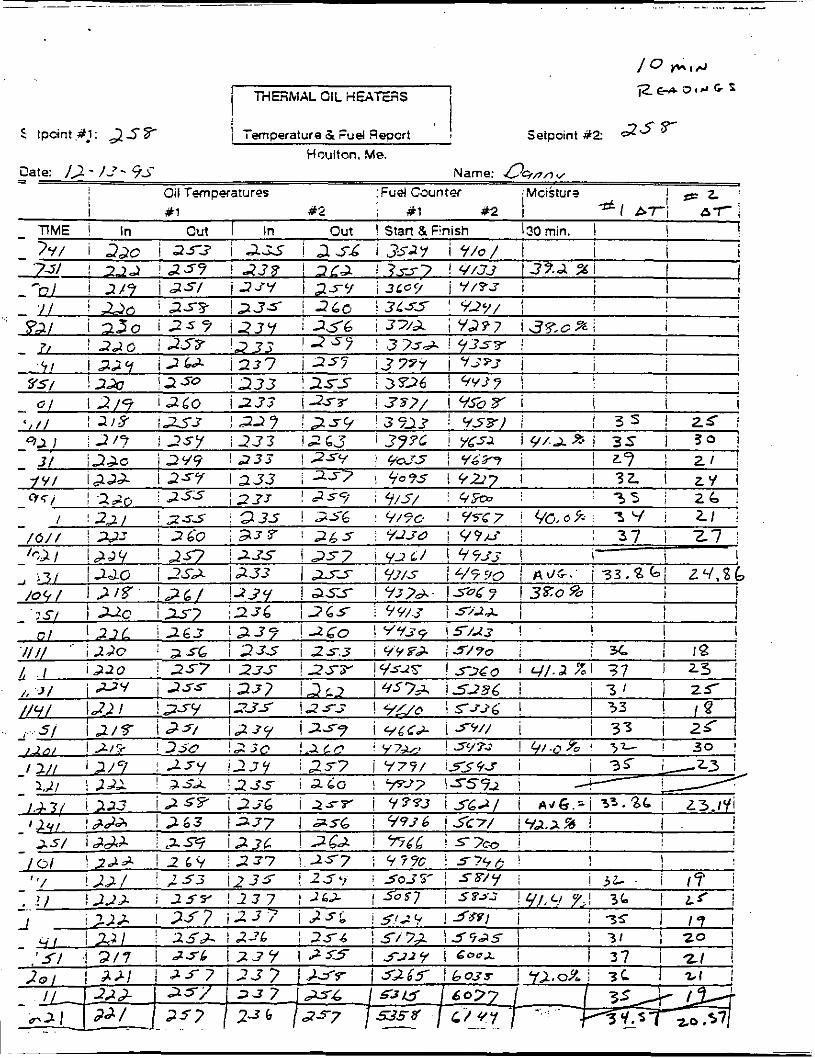
I I ' MFn&lAL OIL H W m S I
Oare: i1- 1; - 75- Name: 0 9 n n y
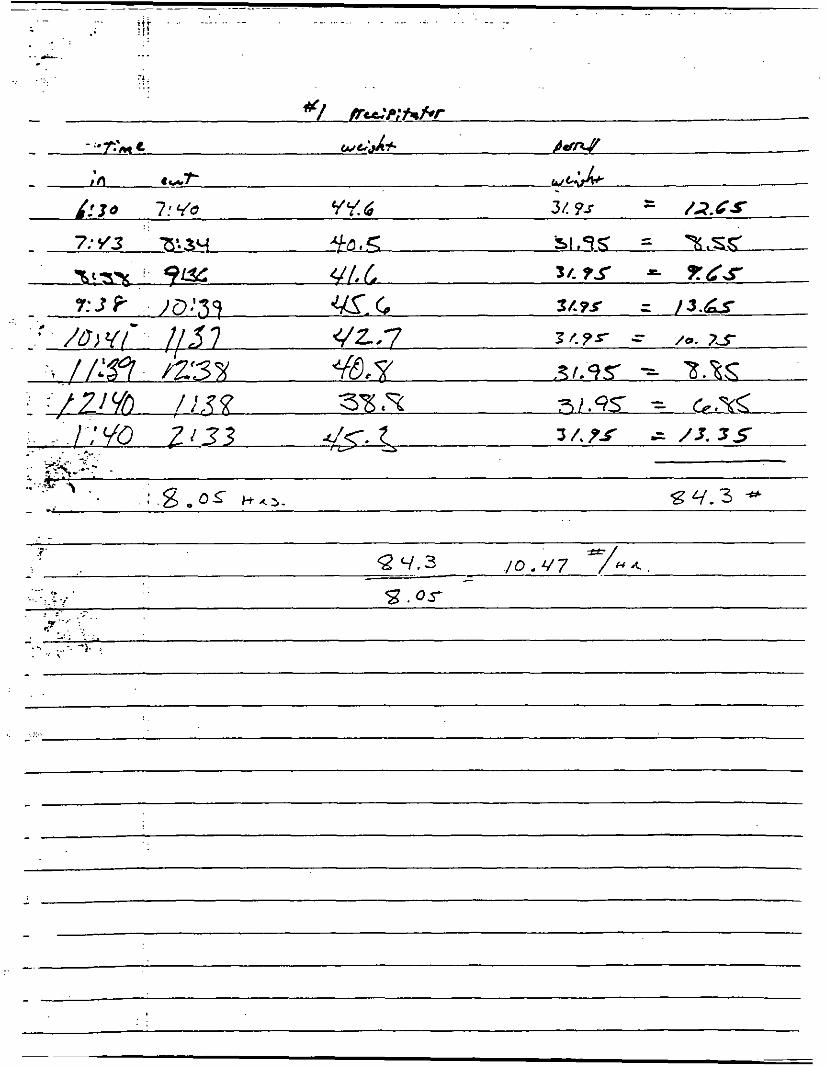
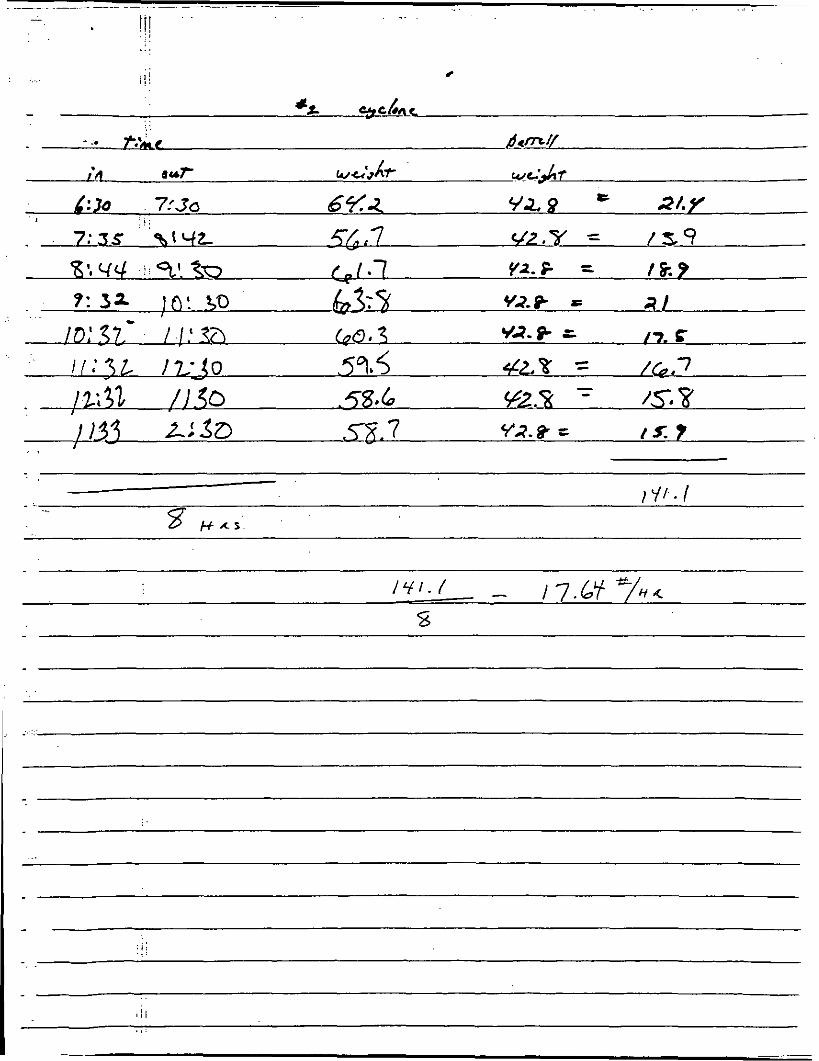
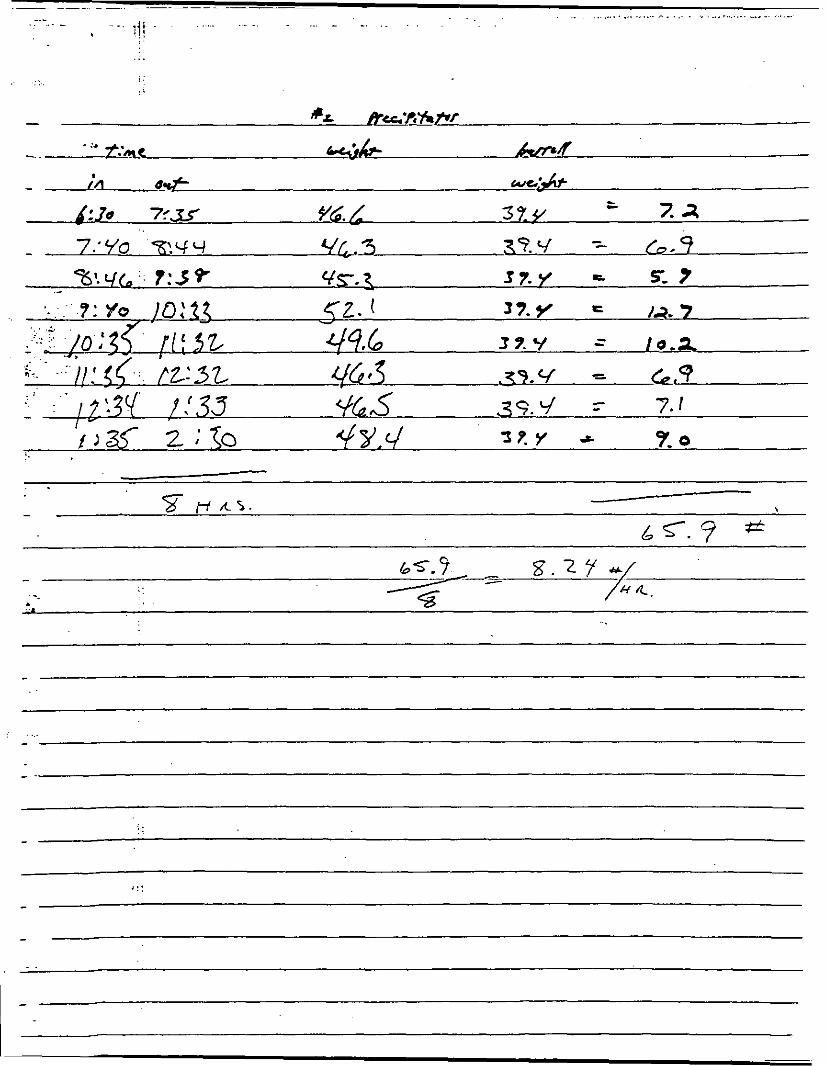
! ~ E!ec:rostatic Precipitator A1 I Electrostatic Precipitator +‘2
.. . .
.. .
. _ . .
^2 . . .. ..
.
30 min. 3eadings
.. ... . .
30 min. ileadings
... .. . . .
, .
. ., ! 1
I ....
I . .
Xame an,, , - :.
i2.
. ..
.. .
.. ., . . .............. ..., . . . . . . . . ~ ... . .
- .
.. . . .. .. . .. . . - . . . . . . . ~
L
. i I .. 2:. ..
*:
/ji . . . /
-
... !'i . .. ... . .. . . ... . . . . . .. .. . . . - i l !
. :
4 Y 6 3 l ?S = / 2 C S
r.' :.. ... i. . - . . . - .. ..:. 3. >, .; I
.. . . . .. . .., , -
I -
.~ ~~
......................................... -. ........ . .
. . .. . . . . . . . . . . . . . . - -. . . . . . -_
a - - ' .i' ! . ! , . ...
. . . . . . . .
l -
t I I I I I I b
I I I
i
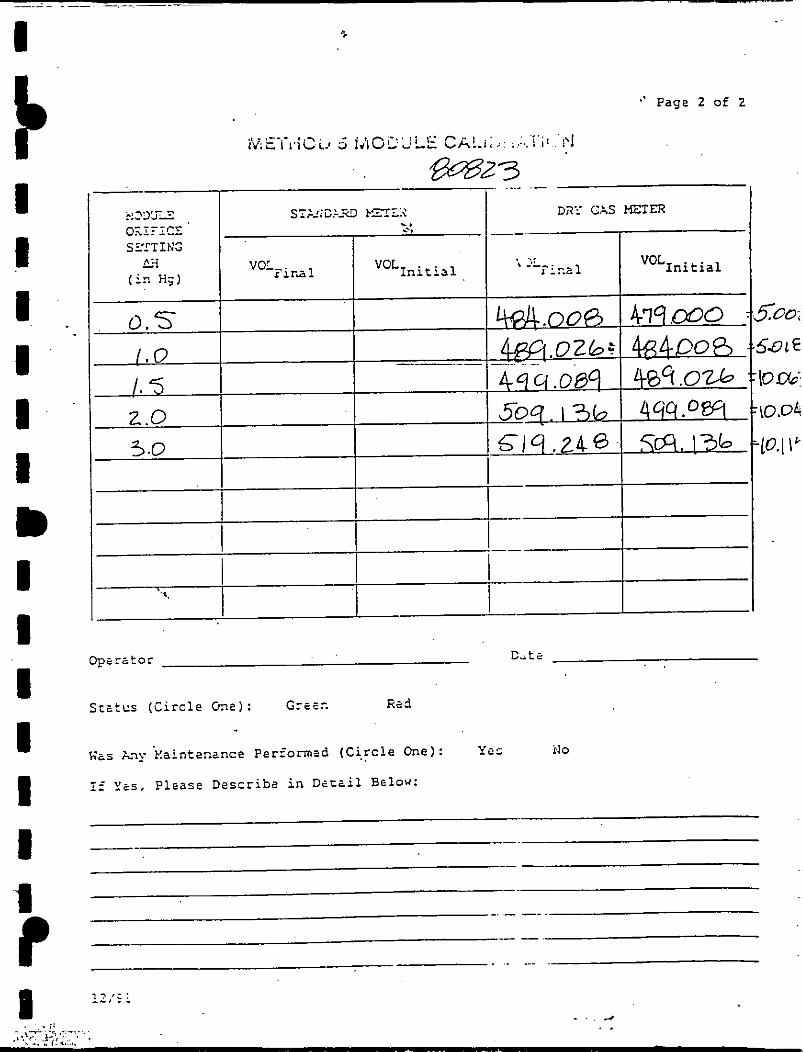
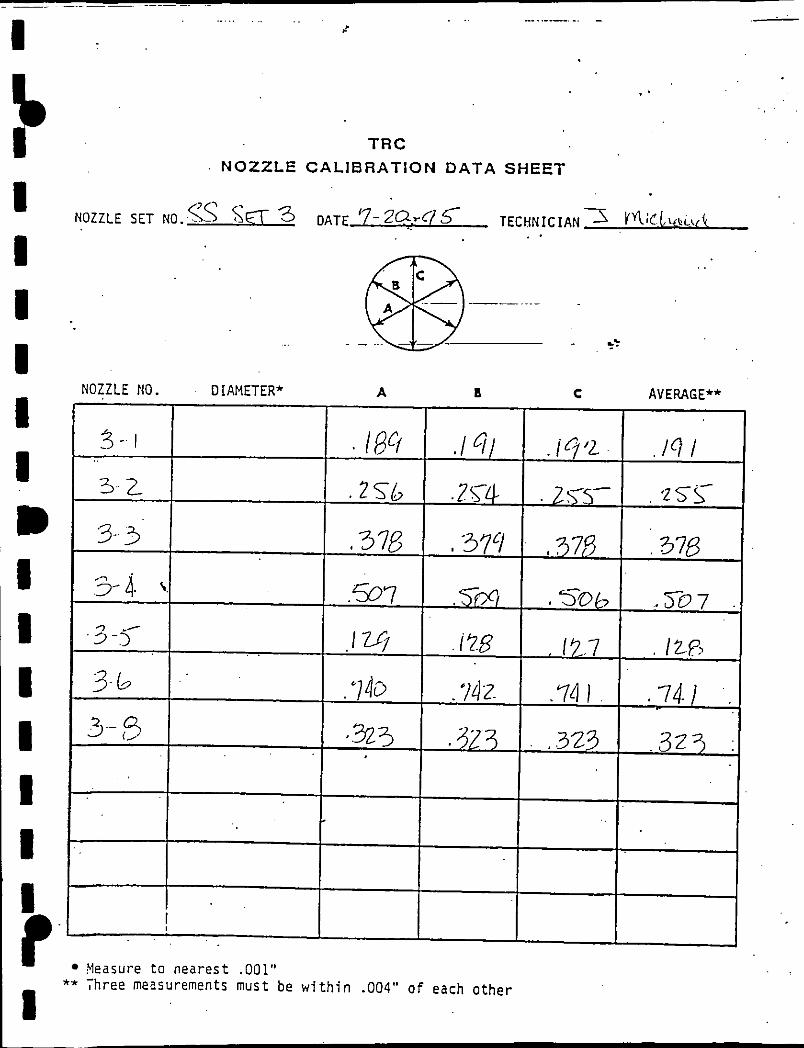
Appendix D
Calibration Data
-I
I
I
1 I I I I I I I)
I I I I I I 1
1 ?
Page 2 of 2
C-te o p e r a t o r
S c a t c s ( C i r c l e h e ) : Gr- FS. . - - Rtd
YES il o Gas b y Kaintenance P e r f o m s d ( C i r c l e .. One):
15 Y e s , P l e a s e Descr iba i n Derail B E ~ o ~ :
.. . . . . .. .. . . .. __ . -. - .- >*
I I 1 I I I I D I I I I I I
. * . .
TRC . NOZZLE C A L I B R A T I O N D A T A SHEET
NOZZLE SET NO.<^ SCT 3 DATE '7-Ze.rclC TECHNICIAN 3 rv\iCLYQLII1 . .
NOZZLE NO. DIAMETER*
3 - ' I
3.. 3' -7
3' 4- . ? _-- J 3
3- G
. .
A B C AV
-+ .5m
I
. "749
I GE**
.lcf I I
, I I
Yeasure t o nearest .001" ** Three measurements must be w i t h i n .004" o f each o the r
I


![Supplementary Material for “Heavy Rain Image Restoration ... · Input Ours DSC [8] LP [7] DDN [3] Figure 2: LP [7] and DDN [3] render blur results on background grass. Ours is able](https://img.pdfslide.net/doc/110x75/5f66a1e048431014d9441797/supplementary-material-for-aoeheavy-rain-image-restoration-input-ours-dsc-8.jpg)