Embed Size (px)
Citation preview

The Faculty of Natural Resources and Agricultural Sciences
Bacteria in Biofuel Production
Afsar Ali
Department of Microbiology
Master´s thesis • 30 hec • Second cycle, A2E
Biotechnology, Master Programme • Examensarbete/Sveriges lantbruksuniversitet,
Institutionen för mikrobiologi: 2012:12 • ISSN 1101-8151
Uppsala 2012

Bacteria in Biofuel Production
Afsar Ali
Supervisors: Ievgeniia Tiukova, Swedish University of Agricultural Sciences,
Department of Microbiology
Yumiko Sakuragi, Copenhagen University,
Department of Plant Biology and Biotechnology
Examiner: Volkmar Passoth, Swedish University of Agricultural Sciences,
Department of Microbiology
Credits: 30 hec
Level: Second cycle, A2E
Course title: Independent Project in Biology - Master's thesis
Course code: EX0565
Programme/education: Biotechnology, Master Programme
Place of publication: Uppsala
Year of publication: 2012
Title of series: Examensarbete/Sveriges lantbruksuniversitet, Institutionen för mikrobiologi:
no: 2012:12
ISSN: 1101-8151
Online publication: http://stud.epsilon.slu.se
Key Words: Rubisco, Cyanobacteria, RBC operon, pDF-Trc plasmid, infusion cloning, Carbon
fixation, Lactobacillus vini, Saccharomyces cerevisiae, Dekkera bruxellensis, ethanol
production, Tranformation, coculture, ethanol tolerance
Sveriges lantbruksuniversitet
Swedish University of Agricultural Sciences
The Faculty of Natural Resources and Agricultural Sciences
Uppsala BioCenter
Department of Microbiology

Abstract
In this work, bacteria are regarded either as production organisms or as interacting organisms with another production organism, namely yeast. The aim of using bacteria as a production organism was, to optimize Rubisco activity by introducing additional gene cassettes of Rubisco in Cyanobacteria. At first, RBC operon was tried to clone in pDF-Trc plasmid, using infusion cloning, but did not obtained E. coli transformants containing the RBC operon, when E.coli was transformed with infusion cloning reaction. This might be because of the plasmid concentration that was used, which was less than the recommended concentration. When cloning the RBC operon by conventional restriction/ligation, E. coli transformants containing the operon were obtained. Further characterisation of the cloned operon could not be performed during this project. In the second part of the project, the ethanol tolerant lactic acid bacterium Lactobacillus vini was investigated, with a special focus on its interaction with ethanol producing organisms, Saccharomyces cerevisiae and Dekkera bruxellensis. Lower ethanol concentrations did not have any considerable effect on the growth of L. vini. However, at higher ethanol concentration, a continuous decrease in cell numbers of L. vini was observed. The study shows, that L. vini can tolerate and survive higher ethanol concentrations, as compared to other microorganisms. L. vini had better growth rate, when it was co-cultured separately with Saccharomyces cerevisiae and Dekkera bruxellensis compared to, when it was co-cultured with both the yeasts. Ethanol production in batch was relatively higher when L. vini was co-cultured with S. cerevisiae compared to co-cultivation with D. bruxellensis and with both yeasts, which is most probably due to the rapid growth of S. cerevisiae compared to D. bruxellensis


Contents
1. Introduction 7 1.1.1. Bacteria as Production organism 7 1.1.2. Development of Biofuel resources 8 1.1.3. Biofuels from photosynthetic microorganisms 8 1.1.4. Biology of Cyanobacteria 9 1.1.5. Rubisco 9
1.2. Bacteria as an interacting organism 10 1.2.1. Biofuels: Ethanol production 10 1.2.2. Yeasts for ethanol production 11 1.2.3. Lactic acid bacteria 11 1.2.4. Ethanol production habitat 12
2. Materials and methods 13
2.1. Materials (as prod. Organism) 13 2.2. Methods (as prod. Organism) 13
2.2.1. Verification of plasmid 13 2.2.2. Infusion primer designing 14 2.2.3. Transformation 14 2.2.4. Liquid culture 14 2.2.5. Miniprep 14 2.2.6. Amplification Rubisco operon 15 2.2.7. Gel purification of PCR product 15 2.2.8. Restriction digestion to linearize plasmid 15 2.2.9. Infusion cloning 15 2.2.10. Conventional cloning 15 2.2.11. PCR amplification of RBC operon 16 2.2.12. Restriction digestion of plasmid DNA 16 2.2.13. Purification of PCR product and digested plasmid 16 2.2.14. Heat inactivation of restriction enzymes 16 2.2.15. Ligation 16 2.2.16. Transformation 17 2.2.17. Colony PCR 17
2.3. Materials (as an interacting Organism) 17 2.3.1. Strains 17 2.3.2. Media 17 2.3.3. Culture conditions 18
2.4. Methods (as an interacting Organism) 18 2.4.1. Pre-culture 18 2.4.2. Response of L.vini 18 2.4.3. Co-culture 18 2.4.4. Analytical methods 18
3. Results 19
3.1. Bacteria as production organism 19 3.1.1. Plasmid verification 19 3.1.2. Linearization of plasmid 19 3.1.3. Purified plasmid 20 3.1.4. PCR amplification of RBC operon 21

3.1.5. Purified RBC operon 21 3.1.6. Amplified RBC operon using restriction sites integrated
primers 22 3.1.7. Linearized plasmid and purified RBC operon 23 3.1.8. Gel purified RBC operon and linearized vector 24 3.1.9. Colony PCR 25
3.2. Results (Bacteria as an interacting organism) 26 3.2.1. Effect of ethanol on growth of L. vini 26 3.2.2. Co-culture of L. vini with S. cerevisiae and D. bruxellensis 28
3.2.2.1. Co-culture of L.vini with S.cerevisiae 28 3.2.2.2. Co-culture of L.vini with D. bruxellensis 29 3.2.2.3. Co-culture of L. vini with S. cerevisiae and
D. bruxellensis 30
4. Discussion 30 4.1. Bacteria as production organism 30
4.1.1 Work need to be done 31 4.2. Bacteria as an interacting organism 31
4.2.1. Effect of ethanol on L. vini growth 31 4.2.2. Co-culture of L. vini with S.cerevisiae and D. bruxellensis 31
5. Acknowledgements 32
6. References 32

7
1. Introduction
International Energy Agency (IEA) estimates that eighty five percent of global fossil fuel reservoirs are used for combustion purpose only. Every day, European Union imports oil worth approx 1 billion euro to cover a part of this consumption. The US Energy Information Administration (EIA) estimates that the global energy usage is increasing approximately at a rate of 1 GW per day. In order to meet this growing energy demand with nuclear technology alone, we need to build one new power plant every day. Therefore the development of renewable fuel production is very important on a global and local scale. Mature and large scale technologies already exist for renewable electricity but the biggest challenge is to sustainably produce fuels (1).
Dependence on conventional fossil fuels as the only significant source of transportation energy can create risk- of economy deteoration, disruption of fuel supplies and of engagement of force and military to safeguard access to oil. Biomass converted into transportation fuel is an alternative to conventional fossil fuel. These renewable fuels are known as biofuels. Increasing the production of biofuels and using them for transportation can significantly reduce the dependency on oil. Creating a significant biofuel supply would guarantee a secure and prosperous future; and will also play a significant role in reducing global warming by generating fewer pollutants that are the cause of acid rain and smog (2).
In this work, bacteria are regarded as either production organisms or as interacting organisms with another production organism, namely yeast. As a production organism, the aim was to genetically manipulate Cyanobacteria to enhance their capability to fix CO2 through optimizing Rubisco activity. The aim of using bacteria as an interacting organism was to study the effect of L. vini on ethanol production, the impact of cultivation condition and increasing ethanol concentration on its growth and also to study the impact of yeast on the growth of L. vini in a co-culture.
1.1. Bacteria as Production organism (Genetic manipulation of
Cyanobacteria)
CO2 emission from fossil fuel combustion also poses great threat to global sustainability. Different technologies that are currently available for CO2
removal include injection into deep sea and geological formation, physicochemical absorbents and enhanced biological fixation. Adsorbent materials such as LiOH are non-renewable and require a large storage space. Other abiotic procedures are based on injection of CO2 directly into deep oceans, old coal mines, geological strata, saline aquifers or oil wells and mineral carbonation of CO2. These methods present great challenges because of potential CO2 leakage and high space requirements. Hence, biological carbon fixation is the only technology which is both economically feasible and environmentally sustainable in long term. Carbon fixation does not provide complete removal of CO2 but instead relies on a cycle whereby carbon is taken up during photosynthesis and no additional CO2 is created, to go along sustained energy production and nutrient utilization (3).
8
1.1.1. Development of Biofuels resources
In recent time, there has been a rapid growth worldwide in using liquid fuels in the transport sector, driven by policies that are focused to achieve energy security and diminishing green house gas emissions. First generation biofuels have been mostly produced from oil and food crops including rapeseed oil, sugar beet, sugarcane, maize, animal fats and vegetable oil using conventional technology. It is projected that production and consumption of biofuels will keep growing but their role towards meeting the energy requirements in transport sector will remain limited because of competition with the production of food and fibre for arable land, high requirements of water and fertilizers, lacking of well managed agricultural practices and a requirement for conservation of bio diversity (4). There have been controversies associated with the use of first generation biofuels, mainly because of their impact on world food market and food security, which has raised significant questions on their potential as a substitute to the fossil fuels and their sustained production (5). The commencement of second generation biofuels aims to produce fuels from the whole plant material of dedicated energy crops or forest harvesting residues, agricultural residues or wood processing waste rather than from food crops (5). However the technology for converting these crops into Biofuel has not been developed to the scale for commercial exploitation (7).
An economically and technically feasible Biofuel resource should cost the same or less than petroleum fuels, use a minimum land area, improve atmospheric air (carbon fixation) and also should require less water (7). Therefore with advancing technology and current knowledge, third generation biofuel specifically extracted from microorganisms are considered to be technically feasible and can be used as an alternative source of energy bypassing major issues associated with the previous generations biofuel (4).
1.1.2. Biofuels from photosynthetic microorganisms
Some of the potential advantages associated with the use of biofuels derived from photosynthetic microorganisms are: they are capable of production all year round; therefore, their cultures exceed the yield of the best oilseed crops in yield (8). They grow in liquid media but require less water than terrestrial crops and therefore can reduce the burden on fresh water sources (9). They can be cultivated on non-arable land and in brackish water and may not acquire land use change and thus minimize environmental impacts (10) without compromising food production, fodder and other crop derived products (11). Biomass production of photosynthetic organisms can also effect biofixation of waste CO2 when it comes to maintenance and improvement in air quality (11).
Certain challenges have impeded the photosynthetic organisms’ biofuel technology development to be commercially feasible and allow its sustainable production and utilization. They include, for instance the selection of species which must balance the need for biofuels production and the extraction of other important co-products (12), continued development of technology in order to attain improved photosynthetic efficiencies (13), development of technology for evaporation reduction, single species cultivation and CO2 diffusion losses (14).

9
1.1.3. Biology of Cyanobacteria
Cyanobacteria also called blue green bacteria, are gram negative photosynthetic prokaryotes and are one of the most ancient organisms existing on earth; they are apparently the first organism capable of oxygenic photosynthesis, utilizing water as electron source to generate reductant in photosynthesis. The associated release of oxygen was one of the most important events in the history of planet. It has gradually changed the early reducing atmosphere into an oxidizing one, enabling the development of aerobic mode of life in the world. Oxygenic photosynthesis, evolved in Cyanobacteria and apparently inherited by green plants is the most important process for capturing the light energy from sun on earth (15). The chemical energy and reductant produced in the light reactions are used for CO2 fixation. Photosynthesis is main factor in the cyclic transformation of oxygen and carbon and maintaining very important gaseous composition of the atmosphere (15).
Basically, a Cyanobacterium’s cellular organization is characterized by the presence of massive intracellular membranes, thylakoids, which constitute the photosynthetic apparatus and hold the photosynthetic pigments. Cytoplasm contains different kinds of granular inclusions with diverse functions and compositions cytoplasm. The planktonic form of Cyanobacteria contains gas vacuoles in their cells, which provide buoyancy to the cells and enable Cyanobacteria to occupy a certain position within the water body (15).
The conversion of photosynthetic energy in Cyanobacteria involves the action of two different photosystems, Photosystem I and II. These two systems are linked in a series and interact through an electron carrier chain. Phycobiliproteins (allophycocyanin, phycocyanin and phycoerythrin) which are the main light harvesting pigments and contribute to the colour of Cyanobacteria are organized as complexes called phycobilisomes and are attached to the thylakoid’s membranes in regular arrays. Excitation energy is transferred through phycobiliproteins to chlorophyll a in the reaction centers (15).
The assimilation of CO2 (photoautotrophy) in light is the main important mode of metabolism in cyanobacteria. The primary path by which carbon is assimilated is the Calvin cycle involving the two most important enzymes phosphoribulokinase and Rubisco (ribulose-1, 5-bisphosphate carboxylase/oxygenase) (15).
1.1.4. Rubisco
Rubisco is one of the most abundant proteins in nature; this enzyme catalyzes the first step of the Calvin cycle that converts atmospheric CO2 into organic compounds such as glucose in photosynthesis. Rubisco is considered particularly inefficient because of its ability to catalyze both the carboxylation and oxygenation of RuBP. The carboxylation of RuBP produces two phosphoglycerate molecules that enter Calvin cycle, finally to form starch and sucrose and to regenerate RuBP. The oxygenation of ribulose-1, 5-bisphosphate produces one molecule each of phosphoglycerate and phosphoglycolate (16). The reaction of Rubisco with oxygen competes with the carboxylation reaction in which carbon dioxide is fixed and supports a pathway called photorespiration. Photorespiration results in a loss of up to 25% of carbon fixed by carboxylation reaction. The loss is expected to increase in future, because of
10
increase in temperature due to global warming, which likely favours oxygenation over carboxylation. The catalytic rate of Rubisco is very low as it only fixes three to ten carbon dioxide molecules per second per enzyme molecule. Many attempts were made to improve the efficiency of Rubisco by genetic manipulation but they failed. One problem is that cyanobacterial and plants’ Rubisco is a large oligomer which consists of eight large (RbcL, 50k Da) catalytic subunits bound to eight small (RbcS, 15k Da) structural subunits. When isolated, the large subunits form insoluble and non functional aggregates with one another. That is why Rubisco is never been successfully reconstituted into an active enzyme in vitro from its unfolded subunits (17). The chaperone RbcX, has recently been shown to promote the assembly of RbcL subunits from a number of cyanobacterial species. It is a 15k Da protein and it acts as an arc shape homodimer that binds the carboxyl end sequence (EIKFEFD) of RbcL in a central hydrophobic cleft (18).
Cyanobacteria are responsible for nearly 70% of CO2 assimilation in the aquatic environment. The aim of the project was to optimize the activity of Rubisco by introducing additional gene cassettes of Rubisco in Cyanobacteria in order to increase its capacity to fix CO2, and to increase the yield of the final product i.e. carbohydrate. It has been previously shown that Rubisco activity was increased upto 45% by introducing an additional cassette of RbcL and RbcS genes into an engineered cyanobacterium Synechococcus elongatus (19). We intended to increase the Rubisco activity even more by introducing an additional cassette of RbcX gene along with the RbcL and RbcS in cyanobacterium.
1.2. Bacteria as an interacting organism (LAB in ethanol production interacting with yeast)
1.2.1. Biofuels: Ethanol production
During the 1970s, world fuel crises triggered awareness amongst many countries of their susceptibility to oil interdiction and shortage. Much attention was concentrated on alternative fuel sources with a special emphasis on ethanol. In recent time, the economics of ethanol production became more feasible and it can now compete with standard diesel. One important factor that makes ethanol more attractive as a fuel is that it is a renewable resource (20). The Environmental Protection Agency (EPA) in United States has made it mandatory to use oxygenated fuel in certain areas in order to meet standards of air quality for carbon monoxide (21).
Biomass conversion to biofuels has been the area of very intense research since 1970s. Due to concerns about global energy security, climate change and petroleum supply, this work has gained significant scientific and political momentum. In the next two decades, global energy usage is projected to nearly two-fold and biofuel production might serve as a carbon-neutral and sustainable energy source (22).
In US, almost all of the fuel ethanol is produced by fermenting corn starch and in Brazil by sugar cane sucrose. Technology for the production of ethanol from non-food sources has been developed now so that large scale production of ethanol from such sources would be a reality in few years (23).

11
A number of reviews and reports show the capability of microorganisms to produce ethanol by fermentation, and several microorganisms, such as yeasts, bacteria, and fungi have been reported to be used for ethanol production (23).
The production of industrially important compounds, using microbial systems has increased substantially during the last decade due to the genomic revolution. Further research and advances in the fields of gene regulations, synthetic biology, protein engineering, metabolic engineering and pathway portability will drive the development of cost efficient systems for the production of biofuels (22).
1.2.2. Yeast for ethanol production
Yeasts have been the most commonly used microorganisms throughout history for the production of ethanol. S. cerevisiae can produce ethanol to a concentration of 18% of the fermentation broth and it is the preferred microorganisms for most ethyl alcohol fermentation. It can be grown on simple sugars and also on disaccharide sucrose. It is recognized as safe and is used as food additives in human food and is therefore also suitable for producing bread and alcoholic beverages. It uses Embden-Doudoroff (ED) pathway to metabolize glucose (23).
Yeasts, which can accumulate ethanol even in the presence of oxygen for instance, Schizosaccharomyces pombe and Saccharomyces cerevisiae are known as Crabtree-positive yeasts whereas others known as Crabtree-negative yeasts degrade sugar to carbon dioxide under aerobic conditions (24). This Crabtree effect in Saccharomyces provides the background for the `make-accumulate-consume` strategy (25). This helps Saccharomyces in competing with other microorganisms in natural habitat (26).
Dekkera bruxellensis, which separated from Saccharomyces lineage more than 200 mya ago is also a Crabtree positive and facultative anaerobe (26), it is often isolated in wineries and is known as wine spoilage yeast (27). It has been shown in an ethanol plant with yeast cells recirculation that D. bruxellensis is a production organism (28) producing ethanol, aldehydes and other by-products (29). It out competed the original inoculant S. cerevisiae strain without affecting the productivity or ethanol yield. Likewise, its presence has also been reported in bioethanol industrial processes in Brazil, which run continuously with cell recycling similar to the Swedish ethanol plant (30).
1.2.3. Lactic acid bacteria (Lactobacillus vini)
Lactic acid bacteria (LAB) are frequently used in different fermentation processes at industrial scale. They are gram-positive cocci, acid tolerant, have a low GC content, and are non-respiring. LAB are associated by their common physiological and metabolic characteristics. They can be found in lactic acid containing products and in decomposing plants, producing lactic acid as the major metabolic product of carbohydrate fermentation. Their special characteristic to show high tolerance to low pH range makes them different from other species of bacteria (31).
LABs follow two fermentation patterns i.e. homo fermentation and hetero fermentation. When glucose is in excess with limited availability of oxygen,
12
homo fermentative LABs convert one molecule of glucose to yield two pyruvate molecules using the Embden Meyerhof pathway (EMP). Hetero fermentative LABs using pentose phosphate pathway, dehydrogenate one molecule of glucose-6-phosphate to 6-phosphogluconate and subsequently decarboxylate it to one molecule of carbon dioxide while reducing Pentose-5-phosphate to one molecule of glyceraldehydes phosphate (GAP) and one acetyl phosphate molecule. Glyceraldehyde phosphate is further cleaved into lactate and acetyl phosphate is reduced to ethanol, producing acetyl-CoA and acetaldehyde as intermediates (32).
Scientist presumed that Lactobacillus possesses the properties to affect the industrial ethanol fermentation processes positively (33). It has been observed that the pH of the fermentation process decreases by the addition of lactic acid bacteria to the fermenter containing single yeast species. Some of the Lactobacillus species are adapted to the nutritional and alcoholic conditions of the ethanol fermentation process. It can create the problem of yeast flocculation during alcoholic fermentation. The lactic acid produced by lactobacilli inhibits yeast metabolism and decreases ethanol yield (34).
Lactobacillus vini are gram positive, motile and non-spore-forming rod shaped bacteria. They are found as single cells, in pairs and as short chains (35). They are physiologically versatile, having the ability to ferment pentoses and hexoses to lactic acid, having facultative anaerobic homofermentative metabolism and can grow between 25oC and 45oC (36). Dekkera bruxellensis and Lactobacillus vini may act as potential stable consortium for the industrial production of bioethanol (28).
1.2.4. Ethanol production habitat
Normally when the ethanol concentration in fermenter increases, most of the microorganisms experience impairment of membrane and the response to ethanol stress is related to the type of cellular membrane’s lipids (37). It has been shown that pH has no significant effect on ethanol fermentation while substrate concentration and temperature have significant effect on alcohol fermentation and the fermentation ability greatly reduced at higher temperatures (38). In addition some metabolites such as acetic acid, acetaldehyde, and medium chain fatty acids may also have negative effects on S. cerevisiae, which is the principal yeast in alcohol fermentation (39). Ethanol fermentation process provides an ecosystem where there is a potential for yeast to create yeast-yeast and yeast-bacteria interactions. The different kinds of interactions between microorganisms are commensalism, neutralism, synergism, antagonism, parasitism or predation and competition. In ethanol fermentation, yeast can influence the growth of other yeast or bacteria by a number of mechanisms. Early growth of yeast can reduce the nutrients making it less favourable for other microorganisms to grow and can also produce a number of metabolites that maybe toxic to other species. The production of carbon dioxide can eliminate or reduce oxygen and in this way can limit the growth of aerobic species. Some species may produce inhibitory proteins, enzymes or peptides that can destroy other species by breaking down their cell wall. However there are also numerous mechanisms that can positively affect the growth of other microorganisms for instance; the yeast produces biomass and dies during fermentation releasing vitamins and amino acids that may be useful for the growth of other species later in the process (40).

13
It has been observed in an ethanol producing plant that D. bruxellensis is not a contaminant in the ethanol fermentation but it is instead the production organism and it does not impair the production process. It has also been observed that L. vini forms a stable consortium with D. bruxellensis and it may be function to stabilize the population and production of ethanol in the fermenter (28).
In this work we are studying the impact of cultivation conditions on the growth of L.vini. YPD medium with different ethanol concentrations were used to study the impact of ethanol on the growth of L.vini. Furthermore, L.vini was co-cultured with yeasts S. cerevisiae and D. bruxellensis to study, to study the specific interaction of the bacteria with both the yeasts, the impact of these two yeasts on the growth of L.vini and on the overall ethanol production.
2. Material and methods (Bacteria as production and interacting organism)
2.1. Materials
Strains: cyanobacterium Synechocystis strain PCC 6803, Escherichia coli TOPO 10 competent cells (Invitrogen), pDF-Trc plasmid vector, spectomycin, 1.5% LB agar plates: 1.0% Tryptone (Invitrogen), 0.5% yeast extracts (Invitrogen), 1.5% agar (Invitrogen), 1.0% NaCl.
Primers:
Table 1: Primers, used in this experiment.
Primer Sequence
Infusion forward 5`‐GGAAACAGACCATGGTACAAGCCAAAGCA‐3`
Infusion reverse 5`‐AGGTCGACTCTAGAGTTAGTAACGGCCTTGG‐3`
Forward Primer with EcoR1 restriction site
5`‐GGGGGGGAATTCATGGTACAAGCCAAAGCA‐3`
Reverse Primer with Pst1 restriction site
5`‐GGTTCCGGCAATGATTCTGCAGGGGGGG‐3`
Primers used as negative controls 537 F and 1177 R.
Table 1: shows the primers and their sequences, used in this experiment.
2.2. Methods
2.2.1. Verification of plasmid pDF-Trc with restriction enzymes
Reaction mixture was prepared using 1 µl of 1242.13 ng/µl of plasmid DNA, 2 µl each of 20 units/micro litre restriction enzyme BsrG1 and Sac1

14
(Invitrogen), 3 µl of 10X NEB Buffer 4, 3 µl of 10X BSA and the total volume was made 30 µl with 19 µl of distilled water. The reaction was incubated for five hours at 37oC.
2.2.2. Infusion primer designing using CLC workshop
A forward primer was designed such that its 5’ end contains an 11 base pair sequence just upstream of the restriction site EcoR1 of the vector and 3’ end contains an 18 base pair sequence of the Rbc operon including start codon. Similarly the reverse primer was also designed the same way except that the 5’ end contains a 15 base pair sequence just downstream of the restriction site BamH1 of the vector and its 3’ end contains 16 bases complementary to the Rbc operon including the stop codon. All primers were purchased from Integrated DNA Technologies (IDT), Leuven, Belgium.
2.2.3. Transformation
pDF-Trc is a low copy number plasmid. To get a stock of plasmid, E. coli TOPO 10 competent cells were transformed with it following chemical transformation protocol: 2 µl plasmid was added to the competent E. coli cells and the cells were put on ice for 30 minutes and then heat shocked at 42oC for 30 seconds. The cells were again put on ice immediately and 250 µl of LB medium was added to it and finally the cells were shaken for one hour at 250 rpm and 37 oC. 150 µl of the transformation solution was plated onto LB agar plates containing 30 µg/ml antibiotics (spectomycin) and were incubated overnight at 37 oC (41).
2.2.4. Liquid culture
5 ml of LB medium in a culture tube containing 30 µg/ml of spectomycin was inoculated with E. coli colonies from the antibiotics plates and was incubated overnight at 37 oC with shaking at 250 rpm.
2.2.5. Miniprep (based on Qiagen Miniprep procedure) using isopropanol
4 ml of cell culture from the overnight culture was spun down at maximum speed in a table top centrifuge and was resuspended in 300 µl P1 solution (Qiagen) with added RNAse plus lysozyme (10 mg/ml). Then 300 µl of each P2 and P3 was added and mixed by inverting the tubes each time. The tubes were then spun down for 30 minutes at maximum speed in a table top centrifuge and 800 µl of supernatant was transferred to new tubes. 600 µl of isopropanol was added to it, mixed by inverting and the mixture was spun down for 15 minutes at maximum speed in a table top centrifuge. The supernatant was poured off, 1 ml of 70% ethanol was added and tubes were spun down for 5 minutes at maximum speed in a table top centrifuge. The supernatant was poured off and the tubes were spun down for additional two minutes to remove the residual supernatant. The pellet was left to air dry for 10 minutes. Finally the pellet was resuspended in 30 µl elution buffer (Qiagen).

15
2.2.6. Amplifying Rubisco operon
The Rubisco operon was PCR-amplified to be used in infusion cloning. PCR was prepared as: 5 µl of 5 µM forward infusion primer, 5 µl of 5 µM reverse infusion primer, 5 µl of 10 µM dNTP, 10 µl of X5 buffer, the reaction was made for 5 reactions each with different template volume i.e. 1 µl, 2 µl, 3 µl and 4 µl and one positive control with different forward and reverse primers other then infusion ones, 0.5 µl of phusion polymerase (Clontech) and total volume was set up to 50 µl with 23.5 µl of distilled water. The PCR was programmed as 95 oC for 2 minutes, 30 cycles of 95 oC for 30 sec, 56 oC for 30 sec and 7 oC for three minutes. The final extension was performed at 72 oC for 10 minutes.
2.2.7. Gel purification of PCR product
PCR product was gel purified using Qiagen Gel purification kit following the procedure described in the manual provided with the kit. To confirm the size of the fragment, 5 µl of the DNA solution was analysed by gel electrophoresis.
2.2.8. Restriction digestion to Linearize Plasmid
The plasmid DNA was linearized using restriction enzymes BamH1 and EcoR1 (Invitrogen) to be used for infusion cloning. Digestion reaction was set for plasmid minipreped with isopropanol. The reaction was set as: 5 µl of plasmid, 1 µl of BamH1 (20 units/micro litre), 1 µl of EcoR1 (20 units/micro liter), 3 µl of NEB2 buffer, 3 µl of BSA (10X) and the final volume was set to 30 µl with distilled water and the reactions were incubated at 37 oC for 5 hours. The products were analysed by gel electrophoresis to confirm that the plasmid was linearized.
2.2.9. Infusion cloning
Purified PCR insert and linearized vector were mixed together in a 2:1 molar ratio and the infusion cloning reaction was set up as: 5X In-Fusion reaction buffer 2 µl, In-Fusion enzyme 1 µl, vector (50 ng/ µl) 3 µl, PCR insert (36 ng/ µl) 4 µl. Also a negative reaction was set as: 5 X In-Fusion reaction buffers 2 µl, In-Fusion enzyme 1 µl, vector (50 ng/ µl) 3 µl and the total volume was adjusted to 10 µl with 4 µl distilled water and the reactions were mixed. They were first incubated at 37 oC for 15 minutes, followed by incubation at 50 oC for 15 minutes and then were placed on ice. The reaction volumes were bring to 50 µl with TE buffer and mixed well. 2.5 µl of this 50 µl solution was taken to later on transform E. coli and then 50 µl of TE buffer was added to the remaining 47.5 µl solution and the total volumes were adjusted to 97.5 µl, also 2.5 µl of this solution was taken to transform E. coli.
2.2.10. Conventional cloning
For conventional cloning new primers were designed such that EcoR1 and Pst1 restriction sites were introduced in the forward and reverse primers respectively with GGGGGG overhang in both primers. The forward primer was designed such that it had a short gene specific sequence of 16 bp including start codon, whereas, the reverse primer had a stretch of 16 bp gene specific reverse
16
complement sequence. Liquid culture was performed the same way as before, inoculating LB medium containing (30 µg/ml) spectomycin with pDF-Trc and was incubated overnight at 37 oC, with shaking at 250 rpm. The Miniprep was performed with the overnight liquid with Qiagen kit using isopropanol and the DNA was resuspended in 50 µl TE + RNAse (20 µg/ml).
2.2.11. PCR amplification of RBC operon
RBC operon was amplified by PCR using the new primers. A PCR was made for 4 reactions and was run as described earlier.
2.2.12. Restriction digestion of Plasmid DNA
Plasmid DNA was digested with restriction enzymes EcoR1 and Pst1. The digestion reaction was set as:
10 µl of plasmid DNA
1 µl of each 20 units/micro litre restriction enzymes EcoR1 and Pst1(Invitrogen)
3 µl of NEB3
3 µl of (10X) BSA
The final volume was adjusted to 30 µl with 12 µl of distilled water; the reaction was kept at 37 oC for 5 hours. The plasmid DNA was extracted using QIAquick gel extraction kit, following the protocol provided with the kit and gel resolved.
2.2.13. Purification of PCR product and digested plasmid DNA
Amplified PCR product and digested plasmid DNA was purified to remove impurities and background using QIAquick PCR purification kit and following protocol, described in the manual provided with the kit.
2.2.14. Heat inactivation of restriction enzymes
To inactivate restriction enzymes the sample was incubated at 80 oC for 20 minutes to avoid further degradation of the plasmid DNA.
2.2.15. Ligation
Two ligation reactions were set up; one using heat inactivated digested plasmid DNA and another without heat inactivated digested plasmid DNA. With PCR purified digested PCR product, also a negative reaction was set for each ligation reaction. Ligation reaction was set as, 6 µl of PCR product, 1 µl each of heat inactivated and without heat inactivated plasmid, 1 µl (10X) T4 DNA ligase buffer, 1 µl T4 DNA ligase and the total volume was adjusted to 10 µl with 1 µl of distilled water, the negative reaction was the same except that it did not have the PCR product and the volume was adjusted to 10 µl with 7 µl of

17
distilled water. The ligation mixtures were incubated at room temperature for two hours (42).
2.2.16. Transformation
TOP 10 competent cells (chemical) were transformed with the ligation reaction solutions as: 2.5 µl of 10 µl total ligation solutions were added to competent cells. The cells were kept on ice for 30 min and were then heat shocked for 30 sec at 42 oC, after heat shock the cells were immediately transferred on to ice for a few minutes and 250 µl of LB medium was added to each tube. The cells were then kept on shaker for one hour at 37 oC and 300 rpm. 290 µl of each reaction was spread on spectomycin plates and were incubated overnight at 37 oC (41).
2.2.17. Colony PCR
There were sixteen colonies on the plate, all the colonies were transferred to a tube and 10 µl of water was added to it and they were heated for 1 min, this water inoculated with single colony was used as template in colony PCR. PCR was performed for each of the 16 colonies separately. PCR was made and run as described earlier.
2.3. Material
2.3.1. Strains Yeast strains of D. bruxellensis, S. cerevisiae and the bacterial strain of L. vini were used.
2.3.2. Media Yeast-Peptone-Dextrose (YPD), MRS liquid media, MRS agar media and Mineral Medium (MM).
i. YPD liquid media: YPD liquid medium was prepared by weighing 20 g Peptone (OXOIDE); 20 g Glucose (OXOIDE) and 10 g yeast extract (OXOIDE). The final volume was adjusted to one liter with distilled water and was autoclaved.
ii. YPD agar media: YPD agar media was prepared by weighing 20 g Peptone (OXOIDE); 20 g Glucose (OXOIDE); 10 g Yeast extract (OXOIDE) and 10 g agar. The final volume was adjusted to one liter with distilled water and was autoclaved.
iii. MRS liquid medium: 52 grams of MRS broth (OXOIDE) was weighted and added to distilled water and the volume was adjusted to one liter and autoclaved.
iv. Mineral Medium (MM): Mineral medium was prepared by weighing 10 g of Yeast extracts (OXOIDE), 10 g of Glucose (OXOIDE) and 10 g of salt and the final volume was adjusted to 1 liter with distilled water and autoclaved.
v. MM + 20 g/l Peptone (OXIODE). vi. MM with all twenty amino acids in concentration 100 mg/l. vii. MM with all amino acids except cystein in concentration 100 mg/l
of each. viii. MM with cystein in concentration of 100 mg/l. ix. YPD ethanol medium: YPD with different ethanol concentrations,
i.e. 10 g/l, 50 g/l and 100 g/l.

18
2.3.3. Culture conditions
Culture samples with D. bruxellensis and S. cerevisiae were kept in vials under limited aeration at 30 oC and culture samples with L. vini cells were kept under anaerobic conditions at 30 oC.
2.4. Methods
2.4.1. Pre-culture
Yeast: S. cerevisiae and D. bruxellensis were inoculated in YPD liquid medium and incubated for three days at 30 oC with continuous shaking.
Lactobacillus vini (L. vini): L. vini was inoculated in MRS liquid medium and incubated at 30 oC with continuous shaking for three days.
2.4.2. Response of L. vini
Triplet cultures of L. vini were carried out in a batch culture by inoculating vials containing 100 ml YPD medium having three different ethanol concentrations, i.e. 10 g/l, 50 g/l and 100 g/l. pH was adjusted at 5 with a pH meter and the culture was inoculated with 1 ml of pre-culture having initial OD 1. Samples were taken at different time intervals i.e. 0 h, 24 h, 48 h, 72 h and 96 h for viability count using dilutions of 10-4, 10-5, and 10-6 and for HPLC analysis.
2.4.3. Co-culture
Triplet co-cultures were carried out by inoculating vials containing 200 ml of MRS medium. The first three vials contained all the three microorganisms i.e. L. vini, D. bruxellensis and S. cerevisiae. The second triplet contained L. vini and D. bruxellensis and the third triplet had L. vini and S. cerevisiae. The cultures were inoculated with1 ml of pre-cultures having initial O.D 1 and pH 5. Samples were taken at different time intervals i.e. 0 h, 12 h, 24 h, 36 h, 48 h, 72 h, 96 h and 120 h for viability count using dilutions of 10-4 and HPLC analysis.
2.4.4. Analytical methods
OD, viability count, HPLC analysis for sugar, acid and ethanol determination were performed by the staff at the department of microbiology, SLU.

19
3. Results
3.1. Bacteria as Production organism
3.1.1. Plasmid verification
Plasmid pDF-Trc was digested with restriction enzymes BsrG1 and Sac1. The fragments were separated on 1.5% agarose gel. pDF-Trc is a 9227 bp plasmid and the size of the fragment, which is approximately 9000 bp (Figure 1) indicates that it is pDF-Trc. There are some additional fragments of approximately 5,000 bp, 1,650 bp and 1,000 bp in lengths, which is because pDF-Trc is a supercoiled plasmid. The verified plasmid was then Minipreped and linearized for downstream process.
Figure 1: Verification of pDF-Trc plasmid with restriction digestion. The gel was loaded with 1 kb plus ladder in the 1st place and plasmid pDF-Trc in wells designated as 1 and 2.
3.1.2. Linearization of plasmid
Plasmid pDF-Trc was linearized using restriction enzymes BamH1 and EcoR1. The plasmid was linearized, so that it can be used as a vector in infusion cloning. The fragments were separated on 1.5 % agarose gel. There is a fragment of approximately 9 kb in length which is equal to the size of pDF-Trc 9227 bp, this fragment was extracted from the gel and was purified (Figure 2). There were some impurities and unexpected fragments of different lengths and reason might be supercoiled nature of the plasmid.

20
Figure 2: Linearization of pDF-Trc plasmid. The gel was loaded with 1 kb plus ladder in the 1st well and plasmid pDF-Trc in the wells designated as 1, 2 and 3. The desired fragment corresponds to the 9 kb mark on the ladder. The fragments correspond to the 5 kb mark 2.5 kb are not the desired fragments.
3.1.3. Purified plasmid
Figure 3 shows the pDF-Trc plasmid after the plasmid was purified from the gel. The size of the fragments correspond to 9 kb mark on the ladder indicating that is the desired pDF-Trc plasmid, as the size of this plasmid is 9227 bp. Later, this purified plasmid was used for infusion cloning.
Figure 3: Gel purified plasmid. The gel was loaded with 1 kb plus ladder in the 1st well and gel purified plasmid in the wells named as 3 and 4. The size of the fragment corresponds to the 9kb mark on the ladder.

21
3.1.4. PCR amplification of RBC operon
Figure 4 shows a PCR amplified RBC operon using in-fusion primers. For PCR amplification, different volumes of the template DNA was used i.e. 1, 2, 3 and 4 µl. The result shows the presence of different length fragments, RBC operon is 2427 bp in size and the length of one fragment corresponds to this size. There are some unexpected length fragments of the size approximately 1300 bp and less for some unknown reason.
Figure 4: PCR amplified RBC operon. The gel was loaded with 1 kb plus ladder in the 1st well, negative control in the 2nd well. The PCR products with different volumes of template DNA i.e. 1 µl, 2 µl, 3 µl and 4 µl were loaded in the 3rd, 4th, 5th and 6th well respectively. The fragment that corresponds above 2 kb and slightly below 3 kb mark on the ladder is the expected length fragment. The fragment that corresponds slightly above 1 kb mark and the other light colour fragments less than 1 kb in lengths is the unexpected fragments.
3.1.5. Purified RBC operon
Figure 5 shows the gel purified PCR product. RBC operon is 2427 bp in size; the result shows that the purified PCR product is the RBC operon. The fragment corresponds to the area between the 2 kb and 3 kb mark on the ladder and shows that it is the expected length fragment.
Note: this purified RBC operon and purified pDF-Trc vector (Figure 3) were used to transform TOP 10 competent cells, using in infusion cloning method, the transformed cells were spread on antibiotic plates and were incubated overnight at 37oC. Next day, colonies appeared on the antibiotic plates. In order to increase cell density, colonies from these plates were used to inoculate the LB medium in culture tubes and were incubated overnight at 37 oC with continuous shaking at 250 rpm, but no growth was observed in the culture tubes next day. The experiment was repeated but again it was not successful, so we decide to use the conventional cloning method i.e. ligation and transformation, using new primers with integrated restriction sites.

22
Figure 5: Gel extracted and purified RBC operon. The gel was loaded with 1 kb plus ladder in 1st well and purified PCR product in the 2nd well. The fragment that is approximately 2400 bp in length is the expected fragment.
3.1.6. Amplified RBC operon using restriction sites integrated primers
Figure 6 shows a PCR amplified RBC operon using restriction sites integrated primers. The fragments were separated on 1.5% agarose gel. The PCR product was amplified using four sets of reaction each with different volumes of the template DNA i.e. 1 µl, 2 µl, 3 µl and 4 µl. The result shows that the length of the fragment amplified with 1 µl of template DNA corresponds to the size of the RBC operon, while we did not get the expected length fragments with the rest of the amplified products.

23
Figure 6: PCR amplified RBC operon, using restriction sites integrated primers. The gel was loaded with 1 kb plus ladder in 1st well, a negative control (NC) in 2nd well. PCR products amplified using different volumes of template DNA i.e. 1 µl, 2 µl, 3 µl and 4 µl were loaded in the 3rd, 4th, 5th and 6th well respectively. The length of the fragment obtained with PCR product in 3rd well is the expected one and did not get the expected result with the rest of the PCR products.
3.1.7. Linearized plasmid and purified RBC operon
Linearized pDF-Trc plasmid and purified RBC operon were separated by gel electrophoresis (Figure 7). The plasmid was linearized using EcoR1 and Pst1 restriction enzymes. The result shows, that although the expected length fragments of plasmid DNA and RBC operon were obtained but still there is some background and impurities and the products need to be further purified.

24
Figure 7: Purified RBC operon and linearized pDF-Trc plasmid. The gel was loaded with ladder in 1st well and linearized plasmid in 2nd, 3rd, 4th and 5th well. The PCR product was loaded in the 6th well.
3.1.8. Gel purified RBC operon and linearized vector
Figure 8 shows linearized pDF-Trc plasmid and gel purified RBC operon, separated on gel electrophoresis. Two digestion reactions were set to linearize pDF-Trc plasmid with EcoR1 and Pst1. One of the digestion reactions was heated to inactivate digestion enzyme and the 2nd reaction was purified using purification kit. The result shows a clear expected length fragment that corresponds to the 9 kb mark on the ladder, with the digestion reaction that was heated. While, there is a very light and unclear band with the purified digestion reaction. The result also shows the expected length fragment in case of Gel purified RBC operon. Later on, this gel purified operon and the expected linearized vector with heated digestion reaction were used in ligation reaction and to transform E. coli.
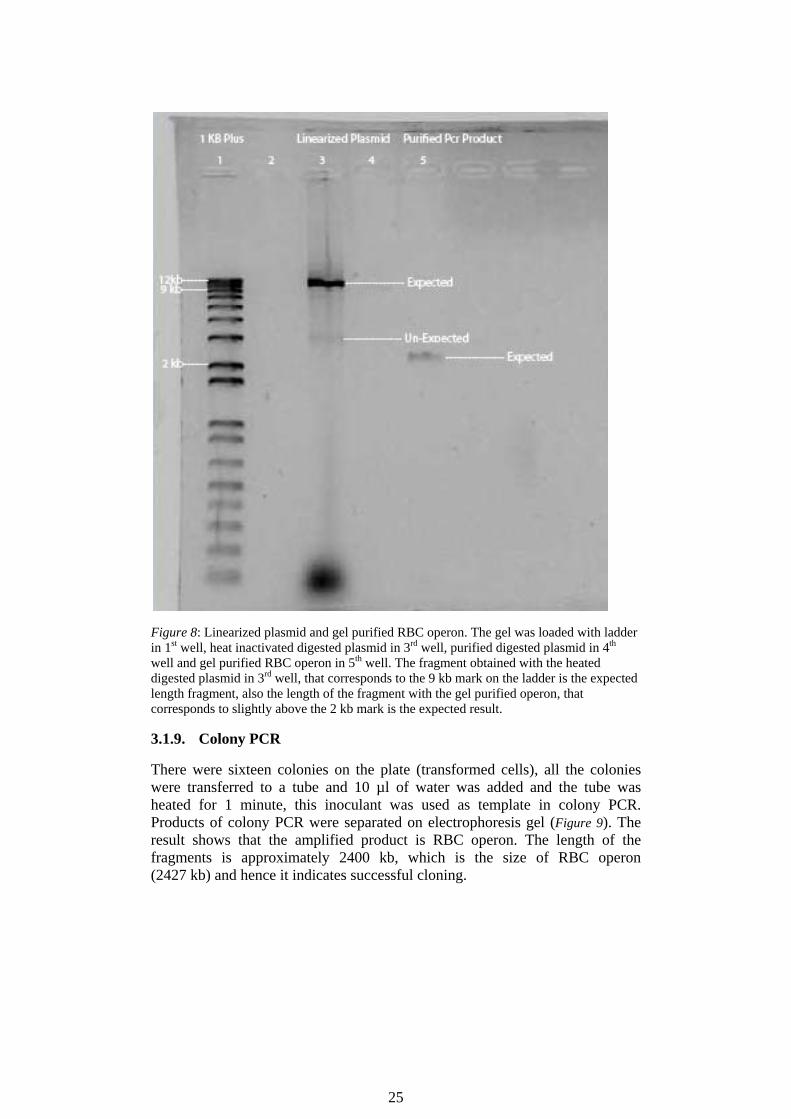
25
Figure 8: Linearized plasmid and gel purified RBC operon. The gel was loaded with ladder in 1st well, heat inactivated digested plasmid in 3rd well, purified digested plasmid in 4th well and gel purified RBC operon in 5th well. The fragment obtained with the heated digested plasmid in 3rd well, that corresponds to the 9 kb mark on the ladder is the expected length fragment, also the length of the fragment with the gel purified operon, that corresponds to slightly above the 2 kb mark is the expected result.
3.1.9. Colony PCR
There were sixteen colonies on the plate (transformed cells), all the colonies were transferred to a tube and 10 µl of water was added and the tube was heated for 1 minute, this inoculant was used as template in colony PCR. Products of colony PCR were separated on electrophoresis gel (Figure 9). The result shows that the amplified product is RBC operon. The length of the fragments is approximately 2400 kb, which is the size of RBC operon (2427 kb) and hence it indicates successful cloning.

26
Figure 9: The figure above shows the PCR products of a colony PCR. The gel was loaded with 1 kb plus ladder in the first well and the PCR products of colony PCR with each of the sixteen colonies in the following sixteen wells, the size of the fragment indicating that it is RBC operon.
3.2. Results (Bacteria as an interacting organism)
3.2.1. Effect of ethanol on growth of L.vini
The effect of ethanol on the growth of L. vini was assessed in a batch culture using YPD medium with different ethanol concentrations. Three different ethanol concentration were used i.e. 10 g/l, 50 g/l and 100 g/l with initial pH adjusted to 5.
An ethanol concentration of 10 g/l had no considerable effect on the growth of L. vini (Figure 10). The cell numbers were increasing as soon as the culture was inoculated with an initial cell number of 3x10⁷ to over 7x 10⁷ at the end of the experiment. The glucose consumption and lactate production also indicate that L. vini is present in the culture, consuming glucose while producing lactate.

27
Figure 10: Effect of 10 g/l ethanol on growth of L. vini. Viable cell numbers are shown as triangles at different time points. The diamonds and rectangles shows glucose consumption and lactate production respectively in gram per litre [g/l] and the time is shown in hours [h].
An ethanol concentration of 50 g/l as compared to ethanol concentration of 10 g/l had a slightly negative effect on the growth of L. vini (Figure 11). The cell were increasing in numbers with the time as soon as the culture was inoculated with L. vini with the initial cell number 3x10⁷ to above 7x10⁷ at the end of experiment, which was the same as in case with 10 g/l concentration, but glucose consumption and lactate production were relatively low as compared to 10 g/l ethanol.
Figure 11: Effect of 50 g/L ethanol on growth of L. vini. Viable cell numbers are shown as triangles at different time points. The diamonds show the glucose consumption while the rectangles indicate lactate production in gram per litre [g/l]. The time is shown in hours [h].
An ethanol concentration of 100 g/l had a considerable effect on the growth of L. vini, as compared to 10 g/l and 50 g/l ethanol concentrations (Figure 12). Viable cell numbers were continuously decreasing at different time points and finally decreased below detection level at 100 h. This was accompanied by decreased glucose consumption and lactate production.

28
Figure 12: Effect of 100 g/L ethanol on growth of L. vini in a batch culture. Viable cell numbers are shown as triangles; glucose consumption and lactate production are shown as diamonds and rectangles respectively in gram per litre [g/l]. Time is shown in hours [h].
3.2.2. Co-culture of L. vini with S. cerevisiae and D. bruxellensis
L. vini was co-cultured with S. cerevisiae and D. bruxellensis separately and with both in another experiment, to assess the effects of these microorganisms on each other’s growth since they actively compete for the energy source and produce different metabolites.
3.2.2.1. Co-culture of L. vini with S. cerevisiae
The result (Figure13) shows that both the microorganisms had continuous growth in number as long as glucose was available but entered a stationary phase as soon as glucose was depleted, which was accompanied by a halt in ethanol production and lactate production. The cell numbers of L. vini and S. cerevisiae finally reached 7x10⁷ and 4.5x10⁷ respectively, before stationary phase. Ethanol concentration reached to a concentration of 6 g/l before a halt in its production. There was a slight increase in lactate production in the beginning but then it started to decrease below the detection level. There were also some other certain metabolites such as, glycerol and acetate in a concentration below detection level.

29
Figure 13: Co-culture of L. vini and S. cerevisiae producing various metabolites. Viable cell numbers of L. vini and S. cerevisiae are shown as dots at the top and second from the top respectively. Ethanol concentration and lactate concentration in gram per litre are shown as crosses and double crosses respectively. The experiment time is shown in hours [h].
3.2.2.2. Co-culture of L.vini with D.bruxellensis
The result (Figure 14) shows that both the microorganisms were continuously growing in number as long as glucose was available for consumption, but both the organisms stopped growing in number and entered a stationary phase as soon as glucose was depleted. This was also accompanied by a halt in metabolites production including lactate and ethanol. The cell numbers of L. vini and D. bruxellensis reached to a final of 7x10⁷ and 5x10⁷ respectively, before stationary phase. Ethanol concentration reached to a concentration of 5 g/l before a halt in its production. There was a slight increase in lactate production in the beginning but then its production stopped and there was no gain or lost in lactate concentration and a final concentration of approximately 2.5 g/l was reached. There were also some other certain metabolites glycerol and acetate in a concentration below detection level.
Figure 14: Co-culture of L. vini and D. bruxellensis. Viable cell numbers of L. vini and D. bruxellensis are shown as dots at the top and second from the top respectively. Ethanol concentration and lactate concentration in gram per litre are shown as crosses and double crosses respectively. The experiment time is shown in hours [h].
30
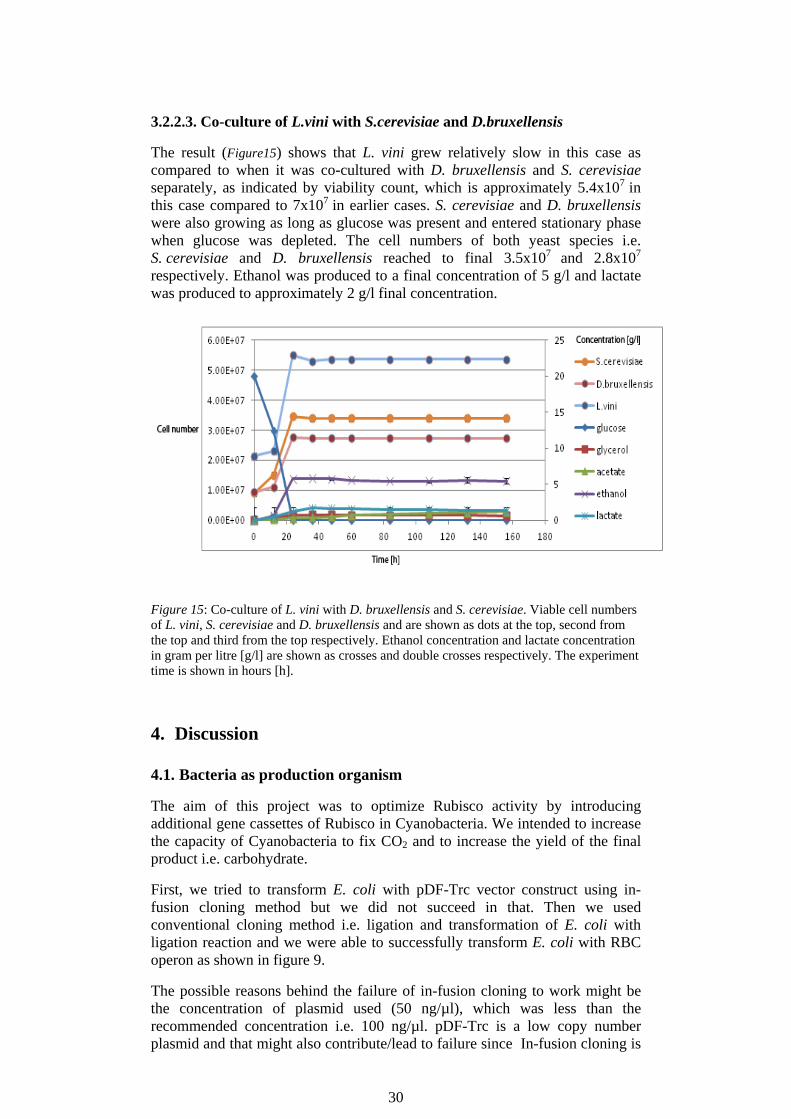
3.2.2.3. Co-culture of L.vini with S.cerevisiae and D.bruxellensis
The result (Figure15) shows that L. vini grew relatively slow in this case as compared to when it was co-cultured with D. bruxellensis and S. cerevisiae separately, as indicated by viability count, which is approximately 5.4x10⁷ in this case compared to 7x10⁷ in earlier cases. S. cerevisiae and D. bruxellensis were also growing as long as glucose was present and entered stationary phase when glucose was depleted. The cell numbers of both yeast species i.e. S. cerevisiae and D. bruxellensis reached to final 3.5x10⁷ and 2.8x10⁷
respectively. Ethanol was produced to a final concentration of 5 g/l and lactate was produced to approximately 2 g/l final concentration.
Figure 15: Co-culture of L. vini with D. bruxellensis and S. cerevisiae. Viable cell numbers of L. vini, S. cerevisiae and D. bruxellensis and are shown as dots at the top, second from the top and third from the top respectively. Ethanol concentration and lactate concentration in gram per litre [g/l] are shown as crosses and double crosses respectively. The experiment time is shown in hours [h].
4. Discussion
4.1. Bacteria as production organism
The aim of this project was to optimize Rubisco activity by introducing additional gene cassettes of Rubisco in Cyanobacteria. We intended to increase the capacity of Cyanobacteria to fix CO2 and to increase the yield of the final product i.e. carbohydrate.
First, we tried to transform E. coli with pDF-Trc vector construct using in-fusion cloning method but we did not succeed in that. Then we used conventional cloning method i.e. ligation and transformation of E. coli with ligation reaction and we were able to successfully transform E. coli with RBC operon as shown in figure 9.
The possible reasons behind the failure of in-fusion cloning to work might be the concentration of plasmid used (50 ng/µl), which was less than the recommended concentration i.e. 100 ng/µl. pDF-Trc is a low copy number plasmid and that might also contribute/lead to failure since In-fusion cloning is

31
not that efficient with low copy number plasmids. A possible explanation for the fact that we got colonies on antibiotic plates but the cells did not grow in liquid culture might be that while making plates the antibiotic was not completely mixed in the plates and the cells formed colonies on the plates with minimal or no antibiotic concentration and when the cells were cultured in liquid medium with evenly mixed antibiotic, they did not grow due to high sensitivity to the antibiotic.
A successful cloning with conventional method as indicated by colony PCR suggests that conventional cloning is the method of choice for cloning low copy plasmids, also heat inactivation after restriction digestion seems to avoid further degradation of plasmid and had a positive impact on the cloning reaction.
4.1.1. Work need to be done
Further work that needs to be done is transformation of Synechocystis PCC 6803 with the construct and to evaluate the expression of Rubisco and carbon fixation capacities through Rubisco activity assay and biomass characterization.
4.2. Bacteria as an interacting organism
4.2.1. Effect of ethanol on L. vini growth
We used different concentrations of ethanol to assess its effects on the growth of L. vini; we conclude that lower concentrations i.e. 10 g/l and 50 g/l have no considerable effect on the growth of L.vini since it was continuously growing in cell numbers, the glucose consumption and lactate production also suggested that L. vini was still growing. However at higher concentration of ethanol 100 g/L, there was a continuous decrease in L. vini cell number close to detection limit. The study shows that L. vini can tolerate and survive high ethanol concentration as compared to other microorganisms. It has been shown that Lactobacillus sp. can tolerate and grow at as much as 16 % ethanol concentration (43). It has also been shown that Lactobacillus species are capable of growing at 150 g/l to 200 g/l ethanol concentration and can survive at 250 g/l (44).The exact mechanism behind it is unknown but it might be due to ethanol-induced changes in fatty acid composition of plasma membrane lipids, producing a more ‘fluid’ membrane. This fluidization can be explained as a counterbalance to the physico-chemical effect of ethanol on plasma membrane (45).
4.2.2. Co-culture of L. vini with S. cerevisiae and D. bruxellensis
The results for co-culture show that, L. vini has better growth when it is co-cultured separately with S. cerevisiae and D. bruxellensis as compare to, when it was co-cultured with both the yeasts. The microorganisms show an increase in cell number until glucose was present in the batch culture and entered a stationary phase when glucose was depleted, which negatively prove the hypothesis that these microorganisms might interact in such a way that they produce some secondary metabolites and promote the growth of one another. However, if we compare the production of ethanol, we conclude that, it is relatively similar in cases where L. vini is co-cultured with D. bruxellensis and

32
with both the yeasts, but it is relatively higher in the case, where L. vini was cultured with S. cerevisiae, suggesting that, S. cerevisiae is a fast growing yeast consuming glucose more fast and make it less available for L. vini. The growth curves of both yeast species also show that, the growth of S. cerevisiae was not affected when it was co-cultured with L. vini alone or together with D. bruxellensis, however the growth of D. bruxellensis was relatively lower when it was co-cultured with other two microorganisms than the one where it was cultured with L. vini, that might be because of, that D. bruxellensis is slow growing compared to S. cerevisiae and that S. cerevisiae consumed glucose faster as compared to D. bruxellensis, making it less available for D. bruxellensis to grow fast in cell numbers.
5. Acknowledgements
I am thankful, from all my heart to my examiner and supervisors, Volkmar Passoth (SLU), Yumiko Sakuragi (KU) and Ievgeniia Tiukova, whose encouragement, supervision and support from the preliminary to the concluding level enabled me to develop an understanding of the project.
Lastly, I offer my regards to Lisa Rosgaard, Christian, Catherine, Anne, Maria, Casper, Majse, Rizwan, Tariq, Ishaq and Khaled who supported me in any respect during the completion of the project.
Last but not least, I would like to thank my loving parents for their unconditional love and continuous support throughout my life.
6. References
1. Patrik, R. Direct biological conversion of solar energy to volatile hydrocarbon fuels by engineered cyanobacteria, direct fuel, http://www.directfuel.eu/DFrenewFuel3.html (access on 5th October 2011).
2. Energy future coalition, energy future coalition, http://www.energyfuturecoalition.org/biofuels/index.html (access on 13th October 2011).
3. Kumar, A., Ergas, S., Yuan, X., Sahu, A., Zhang, Q., Dewulf, J., Malcata, F. X., and van Langenhove, H. (2010). Enhanced CO(2) fixation and biofuel production via microalgae: recent developments and future directions. Trends Biotechnol. 28, 371-380.
4. Brennan, L, Owende, P. (2010). Biofuels from microalgae—A review of technologies for production,processing, and extractions of biofuels and co-products, s. Renew Sustain Energy Rev. 14, 557-577.
5. Moore, A. (2008) Biofuels are dead: long live biofuels(?) - part one. New Biotechnogyl. 25(1): 6-12.
6. FAO. (2008).The state of food and agriculture 2008. New York: Food and Agriculture Organization.
7. Wang, B., Li, Y., Wu, N., and Lan, C. Q. (2008). CO2 bio-mitigation using microalgae. Applied Microbiology Biotechnology. 79(5), 707-18.
8. Schenk, P., Thomas-Hall, S., Stephens, E., Marx, U., Mussgnug, J., Posten, C et al. (2008). Second generation biofuels: high-efficiency microalgae for biodiesel production. BioEnergy Research.,1(1):20–43.
9. Dismukes, G. C., Carrieri, D., Bennette, N., Ananyev, G. M., and Posewitz, M. C. (2008) Aquatic phototrophs: efficient alternatives to land-based crops for biofuels. Current Opinion in Biotechnology. 19, 235-240.

33
10. Searchinger, T., Heimlich, R., Houghton, R. A., Dong, F., Elobeid, A., Fabiosa, J., Tokgoz, S., Hayes, D., and Yu, T. H. (2008) Use of U.S. croplands for biofuels increases greenhouse gases through emissions from land-use change. Science.319, 1238-1240.
11. Chisti, Y. (2007). Biodiesel from microalgae. Biotechnol Advances. 25(3), 294-306. 12. Ono, E., Cuello, J,L. (2006). Feasibility assessment of microalgal carbon dioxide
sequestration technology with photobioreactor and solar collector. Biosystems, Engineering. 95(4):597–606.
13. Pulz, O., Scheinbenbogan K. (1998). Photobioreactors: design and performance with respect to light energy input. Advances in Biochemical Engineering/Biotechnology. 59:123– 52.
14. Ugwu, C. U., Aoyagi, H., and Uchiyama, H. (2008). Photobioreactors for mass cultivation of algae. Bioresource Technology. 99(10), 4021-4028.
15. Fay, P. (1992). Oxygen relations of nitrogen fixation in cyanobacteria. Microbiological Review. 56(2), 340-373.
16. Kebeish, R., Niessen, M., Thiruveedhi, K., Bari, R., Hirsch, H. J., Rosenkranz, R., Stabler, N., Schonfeld, B., Kreuzaler, F., and Peterhansel, C. (2007). Chloroplastic photorespiratory bypass increases photosynthesis and biomass production in Arabidopsis thaliana. Nature Biotechnology. 25(5), 593-599.
17. Ellis, R. J. (2010). Biochemistry: Tackling unintelligent design. Nature . 463(14), 164-165.
18. Liu, C., Young, A. L., Starling-Windhof, A., Bracher, A., Saschenbrecker, S., Rao, B. V., Rao, K. V., Berninghausen, O., Mielke, T., Hartl, F. U., Beckmann, R., and Hayer-Hartl, M. (2010). Coupled chaperone action in folding and assembly of hexadecameric Rubisco. Nature. 463(14), 197-202.
19. Atsumi, S., Higashide, W., and Liao, J. C. (2009). Direct photosynthetic recycling of carbon dioxide to isobutyraldehyde. Nature Biotechnology. 27(12), 1177-1180.
20. Hansen, A. C., Zhang, Q., and Lyne, P. W. (2005). Ethanol-diesel fuel blends -- a review. Bioresource Technology. 96, 277-285.
21. Myers, R.L., (2007).The 100 most important chemical compounds. Greenwood Publishing group, USA.
22. Fortman, J. L., Chhabra, S., Mukhopadhyay, A., Chou, H., Lee, T. S., Steen, E., and Keasling, J. D. (2008). Biofuel alternatives to ethanol: pumping the microbial well. Trends in Biotechnology. 26(7), 375-381.
23. Lin, Y., and Tanaka, S. (2006). Ethanol fermentation from biomass resources: current state and prospects. Applied Microbiology Biotechnology .69, 627-642.
24. Piskur, J., Rozpedowska, E., Polakova, S., Merico, A., and Compagno, C. (2006) How did Saccharomyces evolve to become a good brewer? Trends Genet. 22, 183-186.
25. Thomson, J. M., Gaucher, E. A., Burgan, M. F., De Kee, D. W., Li, T., Aris, J. P., and Benner, S. A. (2005). Resurrecting ancestral alcohol dehydrogenases from yeast. Nature Genetics. 37, 630-635.
26. Prochazka, E., Polakova, S., Piskur, J., and Sulo, P. (2010). Mitochondrial genome from the facultative anaerobe and petite-positive yeast Dekkera bruxellensis contains the NADH dehydrogenase subunit genes. FEMS Yeast Res. 10(5), 545-557.
27. Hellborg, L., and Piskur, J. (2009). Complex nature of the genome in a wine spoilage yeast, Dekkera bruxellensis. Eukaryotic Cell 8(11), 1739-1749.
28. Passoth, V., Blomqvist, J., and Schnurer, J. (2007). Dekkera bruxellensis and Lactobacillus vini form a stable ethanol-producing consortium in a commercial alcohol production process. Applied Environment Microbiology. 73, 4354-4356.
29. Dato, M. C. F., J. M. Pizauro, and M. J. R. Mutton. (2005). Analysis of the secondary compounds produced by Saccharomyces cerevisiae and wild yeast strains during the production of “cachaca.” Brazilian Journal of Microbiology. 36:70–74.
30. Blomqvist, J., Eberhard, T., Schnurer, J., and Passoth, V. (2010). Fermentation characteristics of Dekkera bruxellensis strains. Applied Microbial and Cell Biologyl. 87, 1487-1497.
31. Gottshalk, G. (1986). Bacterial Metabolism. New york: Springer-Verlag, Edition 2. 214-224.
32. Ljungh.Å, Wadström.T.,(2009). Lactobacillus molecular biology: from genomics to probiotics, Caister Academic Press. Norfolk, UK. (p.14-18).
33. Kandler O., and Weiss N., Genus Lactobacillus,. In, P. H. A. Sneath, N. S. Mair, M. E. Sharpe, and J. G. Holt (eds.),(1986) Bergey's Manual of Systematic Bacteriology, vol. 2, 9th edition. Williams and Wilkins, USA. (p. 1063-1065).

34
34. Oliva-Neto P.; Yokoya F.( 2001) Susceptibility of Saccharomyces cerevisiae and lactic acid bacteria from alcohol industry to several antimicrobial compounds; Brazilian Journal of Microbiology. Vol.32 (1).
35. Rodas AM, Chenoll E, Macian MC, Ferrer S, Pardo I, Aznar R. (2006) Lactobacillus vini sp. nov., a wine lactic acid bacterium homofermentative for pentoses. Int J Syst Evol Microbiol , 56:513-517.
36. Lucena BTL, dos Santos BM, Moreira JLS, Moreira APB, Nunes AC, Azevedo V, Miyoshi A, Thompson FL, Morais MA.(2010). Diversity of lactic acid bacteria of the bioethanol process. BMC Microbiology 10:298.
37. Zaldivar, J., Nielsen, J., and Olsson, L. (2001) Fuel ethanol production from lignocellulose: a challenge for metabolic engineering and process integration. Applied Microbiology Biotechnology. 56, 17-34.
38. S.V. Ramakrishna, T. S. Ratnakumari and P. S. T. Sai, (1991) Optimization of process parameters for the continuous production of alcohol with a cell immobilized bioreactor, Bioprocess Engineering. 6. 141-144.
39. Torija, M.J, Beltran, G., Novo, M., Poblet, M., Guillamon, J.M., Mas, A., Rozes, N., (2002) Effects of fermentation temperature and Saccharomyces species on the cell fatty acid composition and presence of volatile compounds in wine, International Journal of Food Microbiology. 85. 127– 136.
40. Fleet, G. H. (2003) Yeast interactions and wine flavour. Internationalj ournalof Food Microbiology. 86, 11-22.
41. Transformation Protocol described in the Invitrogen manual provided with kit. 42. http://www.invitrogen.com/site/us/en/home/References/protocols/cloning/ligation-
protocol/cloning-of-a-tailed-pcr-fragments-using-conventional-ligase-method.html 43. Gold, R.S, Meagher, M.M, Hutkins, R., Conway, T., (1992). Ethanol tolerance and
carbohydrate metabolism in lactobacilli, Journal of Industrial Microbiology, 10. 45-54.
44. Jones, R.P, (1989) Biological principles for the effects of ethanol; Enzyme Microb. Technol., vol. 11(March), 130-153.
45. Couto, J.A., Rozes, N., Hogg, T. (1996) Ethanol-induced changes in the fatty acid composition of Lactobacillus hilgardii, its effects on plasma membrane fluidity and relationship with ethanol tolerance, Journal of Applied Bacteriology, 81. 126-132.