Embed Size (px)
Citation preview
CEP Discussion Paper No 658
November 2004
Motivating Employee-Owners in ESOP Firms:
Human Resource Policies and Company Performance
Douglas Kruse, Richard B. Freeman, Joseph Blasi,
Robert Buchele, Adria Scharf,
Loren Rodgers and Chris Mackin
Abstract What enables some employee ownership firms to overcome the free rider problem and motivate employees to improve performance? This study analyzes the role of human resource policies in the performance of employee ownership companies, using employee survey data from 14 companies and a national sample of employee-owners. Between-firm comparisons of 11 ESOP firms show that an index of human resource policies, nominally controlled by management, is positively related to employee reports of co-worker performance and other good workplace outcomes (including perceptions of fairness, good supervision, and worker input and influence). Within-firm comparisons in three ESOP firms, and exploratory results from a national survey, show that employee-owners who participate in employee involvement committees are more likely to exert peer pressure on shirking co-workers. We conclude that an understanding of how and when employee ownership works successfully requires a three-pronged analysis of: 1) the incentives that ownership gives; 2) the participative mechanisms available to workers to act on those incentives; and 3) the corporate culture which battles against tendencies to free ride. Keywords: human resources, industrial relations, employee ownership, JEL Classifications: M5, M40, O15 This paper was produced as part of the Centre’s Labour Markets Programme. The Centre for Economic Performance is financed by the Economic and Social Research Council. Acknowledgements This paper is part of the National Bureau of Economic Research’s Shared Capitalism Research Project, funded by the Russell Sage and Rockefeller Foundations. We appreciate the useful comments of participants at an Industrial Relations Research Association session in January 2003. Amy Smith-Boden provided valuable assistance in helping to conduct and analyze company surveys. Published by Centre for Economic Performance London School of Economics and Political Science Houghton Street London WC2A 2AE All rights reserved. No part of this publication may be reproduced, stored in a retrieval system or transmitted in any form or by any means without the prior permission in writing of the publisher nor be issued to the public or circulated in any form other than that in which it is published. Requests for permission to reproduce any article or part of the Working Paper should be sent to the editor at the above address. © D. Kruse, R. B. Freeman, J. Blasi, R. Buchele, A. Scharf, L. Rodgers and C. Mackin, submitted 2004 ISBN 0 7530 1788 1
1
Over one-fifth of US private-sector employees – 24 million workers – own stock in their own
companies. Eight million participate in Employee Stock Ownership Plans (ESOPs) (Blasi,
Kruse, and Bernstein, 2003: 249). The growth of ESOPs over the past 25 years is part of a
general growth in compensation arrangements linking worker pay to company performance,
including profit sharing, gain-sharing, and broad-based stock options in addition to the various
methods of employee ownership (Kruse, 1993; Freeman and Dube, 2000; Sesil et al, 2002; Blasi,
Kruse, and Bernstein, 2003). Existing research shows that employee ownership firms tend to
match or exceed the performance of other similar firms on average (Kruse and Blasi, 1997; Blasi,
Kruse, and Bernstein, 2003: 153-184), but with considerable dispersion of outcomes. The
bankruptcy of United Airlines highlights that employee ownership can fail to deliver on its
promises in some circumstances (Mackin, 2002), while the continued success of firms like
Science Applications International Corporation (a Fortune 500 research and engineering
company with multiple forms of employee ownership and profit sharing), and the centrality of
employee ownership to firms like Microsoft and Cisco Systems, show that ownership can
produce long term growth in highly competitive technological industries.
The dispersion of outcomes among employee-owned firms indicates that there is much to
learn about the ways in which employee ownership can affect firm performance. In this chapter
we use new data to analyze how policies in ESOP companies may help to combat free riding
behavior and increase firm performance. Our data are particularly well-suited to explore this
issue: one dataset includes employee surveys matched to information on company policies in
ESOP firms, while the other two datasets provide the first direct measures of mutual monitoring
among employee-owners. This paper is organized as follows: the next two sections review
theory and literature on this topic and develop our hypotheses, followed by a brief introduction to
our three datasets. The first dataset uses between-firm comparisons to examine human resource
policies and employee-rated performance using employee surveys in 11 ESOP companies.
Following a validation of the employee-rated performance measures, we use regression analysis
to see how human resource policies help predict firm performance and other important
workplace outcomes. The second dataset presents within-firm comparisons using employee
surveys in three ESOP companies, seeing how productivity-enhancing peer pressure is related to
employee involvement and training. Finally, we present preliminary results from a third dataset,
seeing how peer pressure is related to employee involvement in a national survey of employee-
owners in the United States. A summary of the main results and our interpretation is in the
conclusion.
2
Theory and Prior Literature
In principle, by tying worker pay more closely to firm performance and involving workers in
decision-making, employee ownership arrangements can help reduce the principal-agent problem
in the workplace and increase performance. The most common theoretical objection to positive
effects of employee ownership and other group incentive plans is the “free rider” or “1/N”
problem, which arises due to the weak link between an individual’s performance and financial
payoff as the workgroup grows larger (if there are N workers, an individual will get on average
only 1/N of the extra surplus that he or she generates). As standard economic analysis provides
no way to resolve the free rider problem, many researchers agree with Weitzman and Kruse that
“something more may be needed—something akin to developing a corporate culture that
emphasizes company spirit, promotes group cooperation, encourages social enforcement
mechanisms, and so forth” (1990: 100). A three-pronged combination of i) incentives, which
must be sufficiently meaningful to workers to motivate them; ii) participation, which must be
sufficiently meaningful for workers to make critical decisions; and iii) a workplace environment
or company ethos that resolves, or at least diminishes, the free rider problem appears to be the
key to improving performance through employee ownership.
Econometric studies of employee ownership and participation compare firms with
different ownership and incentive structures (ownership through pension plans such ESOPs,
profit-sharing, broad-based stock options, worker cooperatives, and direct stock ownership) or
different participative mechanisms (employee involvement committees, teams, etc) to firms
lacking these systems. Most of the studies rely on administrative or company data, leaving to
case investigations analysis of how an ownership or participation scheme works in practice.
Meta-analyses estimate that the average increase in productivity associated with ESOP adoption
is between 4% and 5%, and give comparable effects for other forms of ownership incentive
structures.1 But around the average effect is a wide band of outcomes that makes it clear that
giving employees an ownership stake is by no means a cure-all to company or workplace
problems.
1 There have been 32 large-sample studies on firm performance under employee ownership (Kruse and Blasi, 1997; Kruse, 1999). While many make cross-sectional comparisons between firms with and without plans, some compare firms before and after the adoption of such plans, and some look within firms to measure the effects of different features. While the majority of studies do not establish a statistically significant positive link between employee ownership and performance, meta-analyses strongly point toward a significant positive link overall (there are far more positive results than would be expected if there is in fact no true relationship). These positive results also generally appear in research on profit-sharing and gain-sharing plans (Bullock and Tubbs, 1990; Kruse, 1993; Collins, 1998: 16-17).
3
Consistent with this, studies that compare employee attitudes and self-assessed work
behavior under employee ownership give a mixed picture (Kruse and Blasi, 1997; Kruse, 1999;
2002). Several studies find higher satisfaction, commitment, and motivation among employee-
owners, but others find no significant differences between owners and non-owners, or before and
after an employee buyout. Most studies find that organizational commitment and identification
are higher under employee ownership, but have results that vary from favorable to neutral on job
satisfaction, motivation, and such important forms of behavior as turnover, absenteeism,
grievances, tardiness, and injuries.
Productivity studies rarely link employee reports on how ownership plans actually work
to company output, in part because employee surveys lack the quantitative output data necessary
for such a productivity analysis. Employees in worker owned and participative firms report that
their firms perform better than do employees in other firms (Freeman and Dube, 2000), but the
workers may not be giving a sufficiently accurate assessment of their firm’s actual performance.
It is only by combining evidence from workers and firms – matched employee-employer data
files – that we are likely to make progress in understanding what makes some ownership plans
work while others fail, and thus to explain the diversity of outcomes from companies choosing at
least nominally similar ownership structures.2
Hypotheses: Complementarity and Three Prongs
What might explain the variation in the employee-reported measures of employee work activity
among employee owned firms? Does the historical genesis of ownership affect outcomes? Do
employee-owned firms adopt different human resource policies with ensuing differential effects
on outcomes?
We offer two hypotheses to explain the variation in employee-reported work effort. The
first is the “complementarity hypothesis” that greater participation/influence in decisions, in
addition to the economic incentives of an ownership stake per se, are necessary to generate
2 Even matched data will not resolve some problems in interpreting results. There may be selection bias in the firms that adopt these plans or workers who work under them, although existing work does not support the notion that selectivity explains results. Studies that adjust for the potential endogeneity of employee ownership find little impact. Studies on the types of workers who choose to work in employee ownership and profit-sharing companies indicate that both high and low performers tend to avoid pay plans tied to group performance; average worker quality is not very different under these plans, so that issues of worker quality are not likely to bias the firm-based estimates. Still, absent a genuine experiment, there will always be some uncertainty about whether results generalize to firms that have not chosen employee ownership.
4
productive employee attitudes and behavior beyond those in other firms (Ben-Ner and Jones,
1995). The logic for the complementarity of participation and incentives is impeccable. Why
should employee ownership without participation have a substantial effect on worker effort if
workers have no way to respond to the incentives of ownership? Similarly, why should
opportunities to participate without incentives – say through teams of quality circles, where there
is no economic payoff to additional effort – generate the types of behavior that will substantially
improve company outcomes? As Ben-Ner and Jones (1995) argue, both ownership without
participation, and participation without ownership, can even decrease performance by frustrating
worker expectations and increasing conflict. Firms need incentives and opportunities working
together for employee ownership or any other form of organization to yield improved
performance. There is evidence that employee ownership and participation are positively
correlated (Freeman and Dube, 2000; Conyon and Freeman, 2001), so that employee-owned
firms are more likely to have participative structures than other firms, and conversely. But the
evidence that this produces superior outcomes is less clear. Freeman and Dube found that
employee reports of productive behaviors were higher in companies that combined employee
ownership or profit sharing with employee participation in decision-making and concluded that
“the impact of compensation practices appears to be contingent on such decision making
structures” (2000: 18). But, lacking matched firm data, they had no evidence that the employee
reports translate into actual superior company performance.
The “three prong hypothesis” is that complementarity of incentives and participation is
itself not enough to produce the best outcomes. This is because the opportunity to free ride on
the efforts of others can undermine even the best ownership incentive. Firms, or workers, must
do something more to prevent free riding behavior from destroying employee morale and the
potential of an ownership incentive system. They must set in motion forces that lead employees
to view themselves as critical contributors to output even though each individual’s contribution
is modest, much as democracies must motivate voters to go the polls even though it is rare that
any single vote determines any election. Economists understand less about the ways in which
employee-owned organizations and their employees or other firms accomplish this than they
understand responses to individual incentives.
Human resource policies may be a part of the “something more” that establishes a
cooperative solution. These policies include not just worker participation in decisions, but also
other policies that draw more fully on worker skills and information about the work process, and
increase workers’ sense of participation, security, and fair treatment. Such policies in employee
5
ownership companies may help to create a more cooperative culture that leads to greater effort,
commitment, worker co-monitoring (reducing central monitoring by supervisors), and
information sharing. A growing number of studies of human resource practices show that
innovative human resource practices can improve business productivity, primarily through the
use of systems of related work practices designed to enhance worker participation and flexibility
in the design of work and decentralization of managerial tasks and responsibilities (Ichniowski et
al., 1996: 322).
Ichniowski et al (1996), Appelbaum et al. (2000), and Becker, Huselid, and Ulrich
(2001) all find that new systems of participatory work practices have substantial effects on
business performance while isolated changes in individual work practices do not generally
improve performance. These studies relate to diverse firms, rather than the employee ownership
firms on which we focus. The three-pronged hypothesis is that these policies and practices have
larger effects on employee owned firms than on firms that lack the ownership incentive and
accompanying modes of participation. With our data, however, we can only explore the possible
link between these policies and worker efforts among the employee-owned firms.
Data
This paper uses survey data from 14 ESOP companies to examine the factors that affect the
differential impact of employee ownership on productivity and work behavior. The surveys were
conducted at different periods of time by Ownership Associates, a consulting firm3, and by our
research team. The Ownership Associates (OA) survey (Ownership Culture Survey) covers
employees and managers in eleven ESOP companies over the period 1996-2002. The OA survey
asked employees about their views and attitudes toward various aspects of their workplace,
including the effort employees gave, their level of involvement in decision making, and their
feelings about ownership of the firm. The managers filled out a survey on human resource
policies, firm performance, and ESOP characteristics.4 The firms in this survey are relatively
small: the number of employees range from 27 to 1800, with a mean of 396 and median of 181.
Seven of the companies had between 100 and 300 employees. There are a total of 2139 survey
3 Ownership Associates, Inc. is a Cambridge, MA consulting firm “providing strategic and technical advice to groups exploring employee ownership.” See www.ownershipassociates.com
6
respondents from the 11 companies, giving a response rate for workers of 71% across all
companies. Because the survey obtained both worker reports on participation, effort, and
ownership, and company data on actual outcomes, these data provide a check on the extent to
which worker reports of effort show up in actual firm performance.
Our second data set contains information on employees in three firms that the NBER’s
shared capitalism research project surveyed in 2001 and 2002. Here the focus is on individual
variation in the ways workers try to prevent free riding behavior from undoing the potential
positive effects of ownership and participation. In particular, we ask workers how they would
respond to employees who are not carrying their weight in the firm and relate their responses to
the position of the employees in participative structures.
These samples are small and thus give results that should be viewed only as suggestive.
The National Opinion Research Center (NORC) has completed the 2002 General Social Survey
using questions that we devised analogous to those in the current study. This survey has both a
representative sample of workers and data that match workers with firms. Some of the questions
on this survey mimic those on our company surveys. We present initial results using data on
employee-owners in the national survey, providing a check on the company survey results.
Despite the comparisons with national data on some of the results, some readers may
worry that our samples are overly selective, and could produce results that do not generalize to
other ESOP companies, much less to firms more generally. But the OA sample is well-suited to
assess the variation in outcomes among firms with a similar ownership structure, and the NBER
shared capitalism sample is well-suited to examine the variation of workers within them. On the
one side, by basing our analysis on comparisons within these groups, we potentially avoid errors
in interpretation due to selectivity. On the other side, a set of fairly similar firms with
comparable ownership structure provides just the right sample to assess variation within the
employee ownership structure.
Variation in Employee-reported and Company Performance Measures
The starting point for our analysis is the variation in outcomes among employee-owned firms.
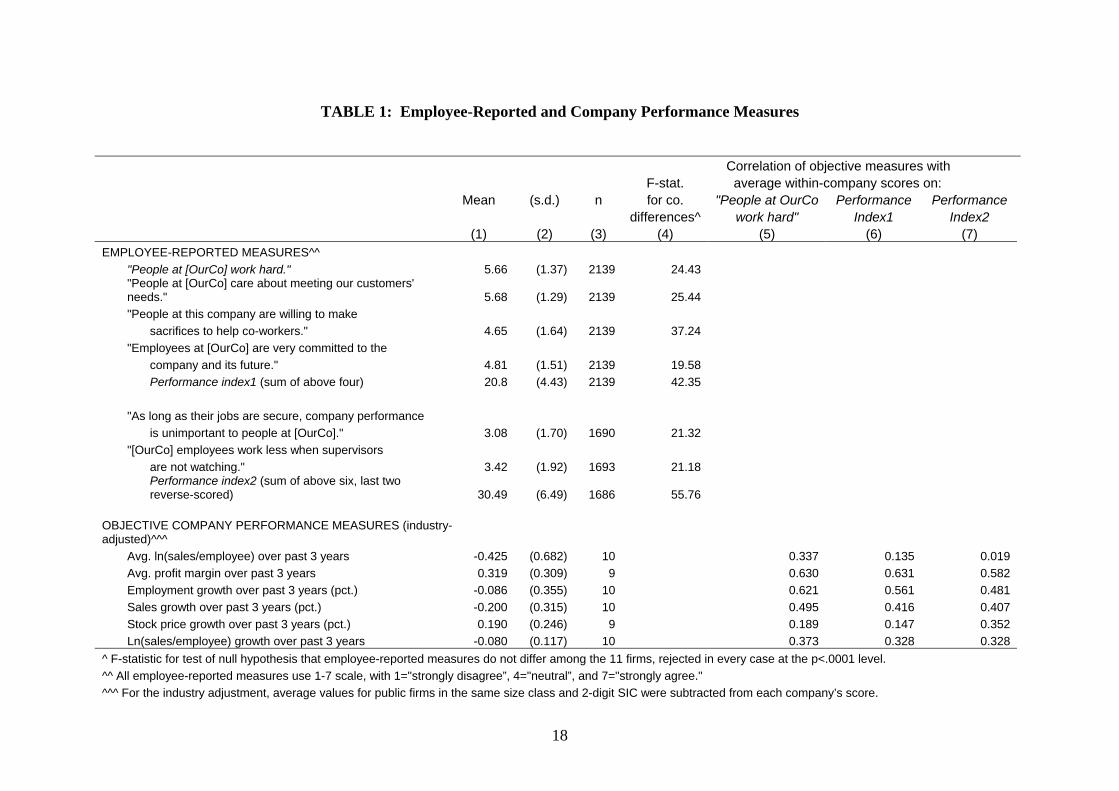
Table 1 shows wide variation in employee-reported measures of work outcomes in the 11 firm
4 Most of the companies in the Ownership Associates survey converted to employee ownership when the principal owner of the firm retired. None of the firms were having serious performance difficulties before conversion and
7
OA sample; wide variation in objective company measures of outcomes; and, critical for our
research strategy, a substantive positive relation between the two measures. The top half of
Table 1 gives the mean and standard deviation of employee responses to 6 statements about work
activity at the firm on a seven point scale. It shows whether employees agree with 4 positive
statements—“People at [OurCo] work hard … care about meeting customer needs … are willing
to make sacrifices to help co-workers; are very committed to the company and its future”—as
well as with 2 negative statements—“As long as jobs are secure, company performance is
unimportant … and [OurCo] employees work less when supervisors are not watching.”5 In
addition, we have formed summary indices of the positive statements, and of all six statements,
reverse coding the negative statements so that the summary statistic reflects positive reports
overall. While the data show considerable variation in the responses in the entire sample,
indicating that employees have a wide range of views, the general pattern is for workers to agree
with the more positive statements. The critical statistics are the F-statistics in column 4, which
test whether there are consistent firm-level differences within this variation. These statistics
show sizable firm differences, which increase in significance as we form the summary statistics.
The implication is that workers at different ESOP firms have consistently different views of
worker performance at their firms.
The bottom of Table 1 gives the firm-reported performance measures. Because the firms
are in different industries, we adjusted the reported measures for industry levels or trends over
the past three years, using data on public companies from Standard and Poor’s Compustat. Since
the ESOP companies are all privately-held and relatively small companies, they tend to have
lower productivity than the larger Standard and Poor’s firms (thus the negative value for average
ln(sales/employee)). In addition, their employment and sales growth is lower than the average in
the industry in which they operate. At the same time, their profit margin and stock price growth
exceeded industry averages. What is important for our purposes, however, is not the difference
between these firms and others in their given sector, but the variation among the firms
themselves (relative to their given sector). The standard deviation of each of the industry-
adjusted objective company performance measures exceeds the absolute value of the mean of all
but one of the measures, implying a huge disparity in outcomes.
Are the employee reports of productive behaviors related to the objective firm-reported
measures? Since the worker-reported measures and the objective company measures relate to
none required workers to give concessions for ownership. 5 The two negative statements were asked at only 8 of the 11 companies, so the sample size is smaller.
8
different aspects of performance, we expect some variation even if the employee reports are
accurate. The correlation between company performance and “people at our company work
hard,” for instance, need not be high even if workers report correctly on work effort, since there
are many influences upon company performance apart from employee behaviors. Nonetheless to
the extent that employee behaviors influence performance, there should be a positive link
between reported productive behaviors and company performance if the employee reports are
meaningful. Columns 4-6 of Table 1 report firm-level correlations between the objective
company measures and the average within-company scores of three employee-reported measures
(People at [OurCo] work hard,” which has the greatest face validity among the employee
measures, plus the 4-item and a 6-item summary indices.6) All of the correlations are positive,
though they vary greatly in magnitude. The highest correlations are with the profit margin (.582
to .630) and 3-year employment growth (.481 to .621). Correlations with productivity levels
(measured as ln(sales/employee)) vary (.019 to .337), while correlations with productivity
growth over the past three years show a consistent pattern (.328 to .373). While the sample of
firms is too small to make any strong statistical statement, the consistent positive correlations
provide some validation for the employee-reported measures.
Specific Human Resource Policies
As noted earlier, human resource policies may be key to establishing a cooperative culture in
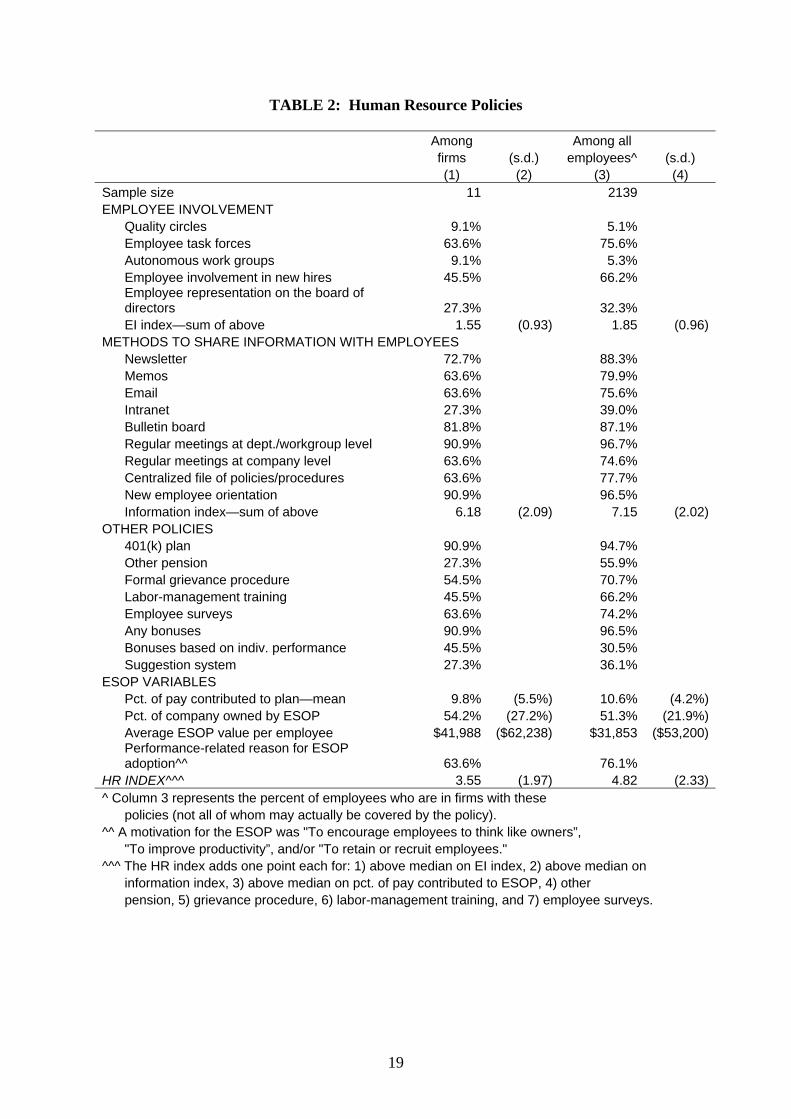
employee ownership firms. Table 2 shows the diversity of human resource policies among the
eleven OA companies. Column 1 reports the percentage of practices across the companies, while
column 2 reports the percentage weighted by employment. Only two firms use techniques that
clearly increase involvement in job-level decisions (quality circles and autonomous workgroups),
though seven firms have employee task forces, five have employee involvement in new hires,
and three have employee representation on the board of directors. Summing these involvement
activities, the “EI index” in the table shows that the average company in the sample used only
1.55 of these five techniques.
The survey also asked about nine methods of sharing information with employees. The
most common methods are new employee orientations and regular meetings at the department or
6 The alpha scores, measuring the correlation between the index and the underlying factor, are .75 and .78, respectively.
9
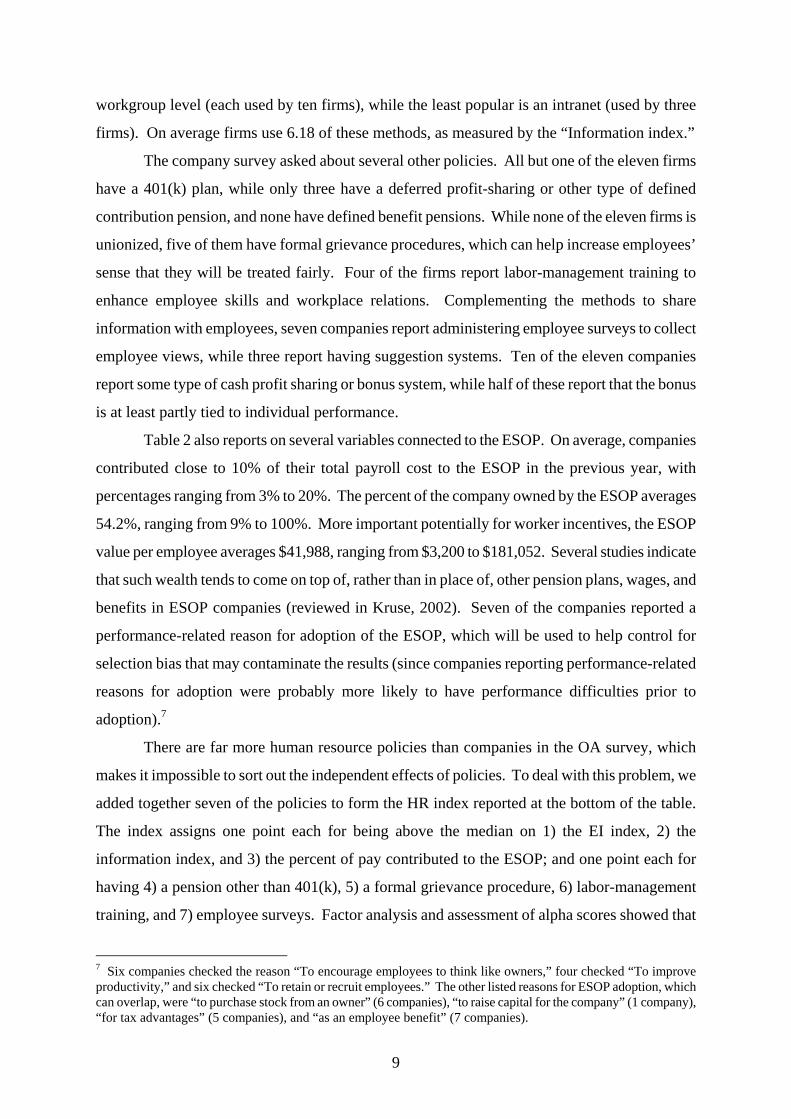
workgroup level (each used by ten firms), while the least popular is an intranet (used by three
firms). On average firms use 6.18 of these methods, as measured by the “Information index.”
The company survey asked about several other policies. All but one of the eleven firms
have a 401(k) plan, while only three have a deferred profit-sharing or other type of defined
contribution pension, and none have defined benefit pensions. While none of the eleven firms is
unionized, five of them have formal grievance procedures, which can help increase employees’
sense that they will be treated fairly. Four of the firms report labor-management training to
enhance employee skills and workplace relations. Complementing the methods to share
information with employees, seven companies report administering employee surveys to collect
employee views, while three report having suggestion systems. Ten of the eleven companies
report some type of cash profit sharing or bonus system, while half of these report that the bonus
is at least partly tied to individual performance.
Table 2 also reports on several variables connected to the ESOP. On average, companies
contributed close to 10% of their total payroll cost to the ESOP in the previous year, with
percentages ranging from 3% to 20%. The percent of the company owned by the ESOP averages
54.2%, ranging from 9% to 100%. More important potentially for worker incentives, the ESOP
value per employee averages $41,988, ranging from $3,200 to $181,052. Several studies indicate
that such wealth tends to come on top of, rather than in place of, other pension plans, wages, and
benefits in ESOP companies (reviewed in Kruse, 2002). Seven of the companies reported a
performance-related reason for adoption of the ESOP, which will be used to help control for
selection bias that may contaminate the results (since companies reporting performance-related
reasons for adoption were probably more likely to have performance difficulties prior to
adoption).7
There are far more human resource policies than companies in the OA survey, which
makes it impossible to sort out the independent effects of policies. To deal with this problem, we
added together seven of the policies to form the HR index reported at the bottom of the table.
The index assigns one point each for being above the median on 1) the EI index, 2) the
information index, and 3) the percent of pay contributed to the ESOP; and one point each for
having 4) a pension other than 401(k), 5) a formal grievance procedure, 6) labor-management
training, and 7) employee surveys. Factor analysis and assessment of alpha scores showed that
7 Six companies checked the reason “To encourage employees to think like owners,” four checked “To improve productivity,” and six checked “To retain or recruit employees.” The other listed reasons for ESOP adoption, which can overlap, were “to purchase stock from an owner” (6 companies), “to raise capital for the company” (1 company), “for tax advantages” (5 companies), and “as an employee benefit” (7 companies).
10
these were the policies that best fit together, appearing to measure the intensity of a common
approach to human resources. The average score on the 0-7 HR index, as shown in Table 2, is
3.55.8
HR Policies and Performance
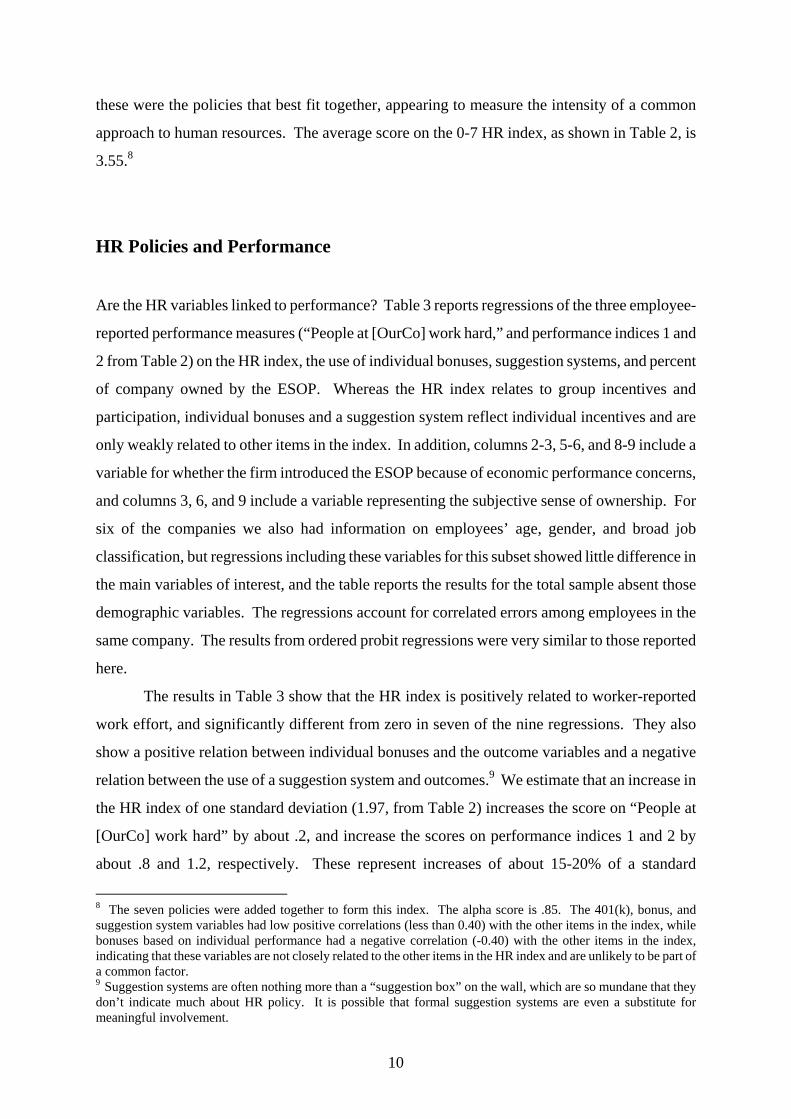
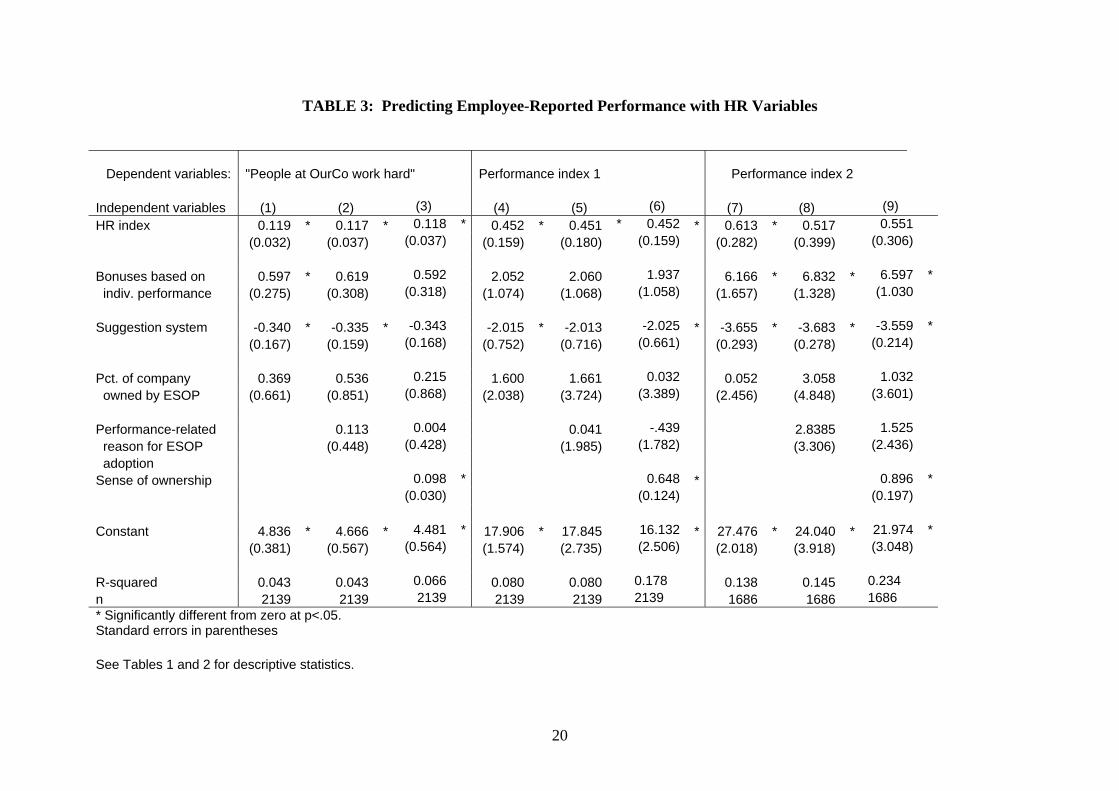
Are the HR variables linked to performance? Table 3 reports regressions of the three employee-
reported performance measures (“People at [OurCo] work hard,” and performance indices 1 and
2 from Table 2) on the HR index, the use of individual bonuses, suggestion systems, and percent
of company owned by the ESOP. Whereas the HR index relates to group incentives and
participation, individual bonuses and a suggestion system reflect individual incentives and are
only weakly related to other items in the index. In addition, columns 2-3, 5-6, and 8-9 include a
variable for whether the firm introduced the ESOP because of economic performance concerns,
and columns 3, 6, and 9 include a variable representing the subjective sense of ownership. For
six of the companies we also had information on employees’ age, gender, and broad job
classification, but regressions including these variables for this subset showed little difference in
the main variables of interest, and the table reports the results for the total sample absent those
demographic variables. The regressions account for correlated errors among employees in the
same company. The results from ordered probit regressions were very similar to those reported
here.
The results in Table 3 show that the HR index is positively related to worker-reported
work effort, and significantly different from zero in seven of the nine regressions. They also
show a positive relation between individual bonuses and the outcome variables and a negative
relation between the use of a suggestion system and outcomes.9 We estimate that an increase in
the HR index of one standard deviation (1.97, from Table 2) increases the score on “People at
[OurCo] work hard” by about .2, and increase the scores on performance indices 1 and 2 by
about .8 and 1.2, respectively. These represent increases of about 15-20% of a standard
8 The seven policies were added together to form this index. The alpha score is .85. The 401(k), bonus, and suggestion system variables had low positive correlations (less than 0.40) with the other items in the index, while bonuses based on individual performance had a negative correlation (-0.40) with the other items in the index, indicating that these variables are not closely related to the other items in the HR index and are unlikely to be part of a common factor. 9 Suggestion systems are often nothing more than a “suggestion box” on the wall, which are so mundane that they don’t indicate much about HR policy. It is possible that formal suggestion systems are even a substitute for meaningful involvement.
11
deviation in the performance measures.
The percent of company owned by the ESOP is not a significant predictor of the
performance measures. The size of an individual’s ownership stake may provide a better
measure of the ownership incentive facing an employee, but similar results obtain when average
ownership stake per employee is used as a predictor. This supports the idea that it is not
ownership per se, but the cooperative culture that can be fostered by employee ownership, that
drives better workplace performance in ESOP firms.
Are these coefficients affected by selection bias due to the types of firms that
implemented HR policies? Firms with low productivity may be more likely to adopt HR policies
to enhance performance, which would cause a downward bias in the HR index coefficient. One
way to partially address this possibility is to use information on the reasons for ESOP adoption.
As noted earlier, seven of the firms listed a performance-related reason for ESOP adoption,
which may indicate a higher likelihood of pre-existing performance problems. Inclusion of this
variable in regressions 2, 5, and 8 does not reduce the effect of the HR variables on the “people
at our company work hard” outcome measure nor on the summary performance index 1, though
it does slightly weaken the link between performance index 2 and the HR index. (We return to
discuss regressions 3, 6, and 9 after a description of Table 4.)
HR Policies and Cooperative Solutions
Do the HR policies affect other workplace outcomes that might make it easier to sustain a high
participation/outcome solution against tendencies to free ride?
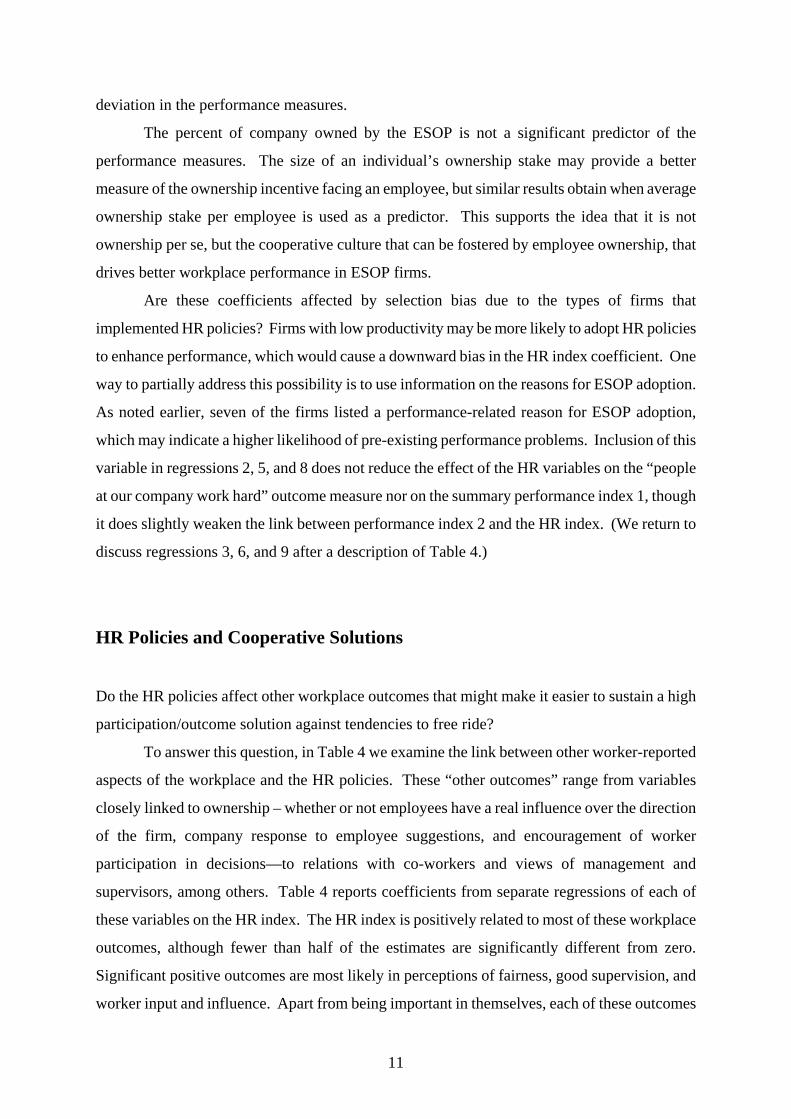
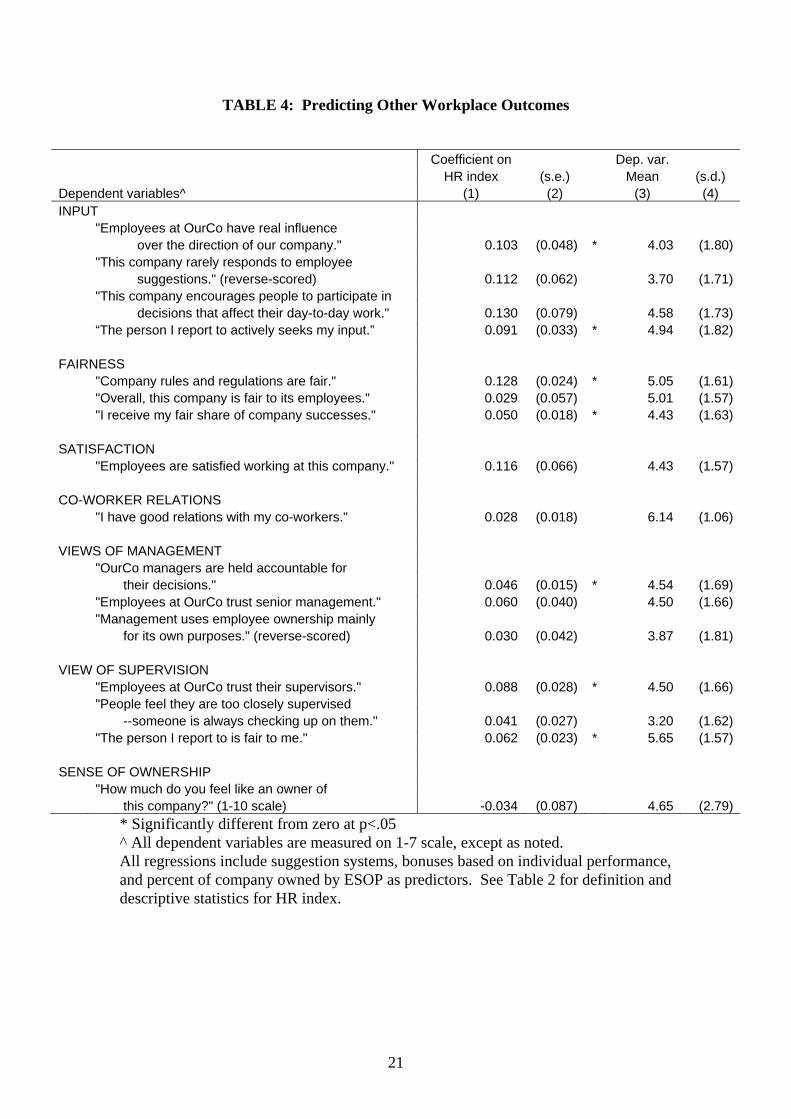
To answer this question, in Table 4 we examine the link between other worker-reported
aspects of the workplace and the HR policies. These “other outcomes” range from variables
closely linked to ownership – whether or not employees have a real influence over the direction
of the firm, company response to employee suggestions, and encouragement of worker
participation in decisions—to relations with co-workers and views of management and
supervisors, among others. Table 4 reports coefficients from separate regressions of each of
these variables on the HR index. The HR index is positively related to most of these workplace
outcomes, although fewer than half of the estimates are significantly different from zero.
Significant positive outcomes are most likely in perceptions of fairness, good supervision, and
worker input and influence. Apart from being important in themselves, each of these outcomes
12
may be important in company performance (and are in fact correlated with perceptions of better
performance). Two results, however, go against expectation. Employee ownership and
employee involvement may, as noted, help increase performance by decreasing centralized
supervision. Workers with higher scores of the HR index were actually slightly (but not
significantly) more likely to say that “People feel they are too closely supervised—someone is
always checking up on them.” While this might indicate that supervision is higher in firms with
more HR policies (because managers or fellow employees have a greater stake in ensuring that
workers work hard) it may also indicate that workers who are covered by more HR policies do
not think they need to be supervised as much, and may somewhat resent the supervision they do
receive. This suggests that supervisors and middle managers may have particular problems in
adapting to employee ownership plans and other group incentive plans.
A second result that is relevant to company performance concerns feelings of
ownership. One of the key questions on the OA survey asks workers “How much do you feel
like an owner of this company?” While one might expect that HR policies help create a
cooperative culture that leads to or reinforces a sense of ownership in ESOP firms, we instead
find that sense of ownership is essentially uncorrelated with the HR policy index. There are two
possible explanations. The first is that the feeling of ownership is irrelevant to actual work
performance and thus is unaffected by policies designed to improve workplace performance. If
this were the case, there would be no correlation between employee feelings of ownership and
employee reports on work outcomes. In fact, Table 3 shows a positive correlation between the
sense of ownership and our three outcome measures with the inclusion of the nearly independent
HR index (columns 3, 6, and 9). The most sensible interpretation of these results is that both
ownership and participation enter workers’ work effort, but that workers judge their ownership
by the actual economic incentives and not by the policies that firms of all sorts use to be “good
employers.” The implication is that neither the workers nor the researchers should expect a
sense of ownership from the standard array of advanced HR policies. To test this notion, we
examined the relation between workers’ feelings of ownership and two measures of actual
ownership – the average ESOP value for employees in the firm and the percentage of the
company that the ESOP owned. Both of these factors are positively correlated with workers’
feelings about ownership (the correlation with ln(average ESOP value) is .125, and with percent
of company owned is .136, both significant at p<.001). How much equity employees actually
have would appear to be more important in judging ownership than HR policies that do not affect
the ownership stake of workers. It may, however, be the case that much depends on how the
13
policies are presented to workers: a company could talk about participation or information
sharing as a policy which is worthwhile in its own right, or as a policy which is tightly linked to
employee ownership. It could be this linkage that has an effect on ownership identity, not the
policies themselves.
The NBER Sample and Employee Response to Free-Riding
In 2002 the NBER Shared Capitalism research project undertook a set of surveys of firms with
particular employee ownership structures and commissioned NORC to ask a set of questions of a
nationally representative sample of workers regarding ownership, participation, and company
culture, and to develop a matched employer-employee data set as well. Here we present data
from the first three case studies of employee owned firms. These three firms are in the 250-500
employee category, and have an average response rate from workers of 60%. Two of the firms
are 100% employee owned, while the other firm is one-third owned by employees, so these are in
the upper tail of ESOP firms in terms of ownership. We concentrate on how employee
participation on EI committees and involvement in group decision-making affects responses to
free riding behavior.
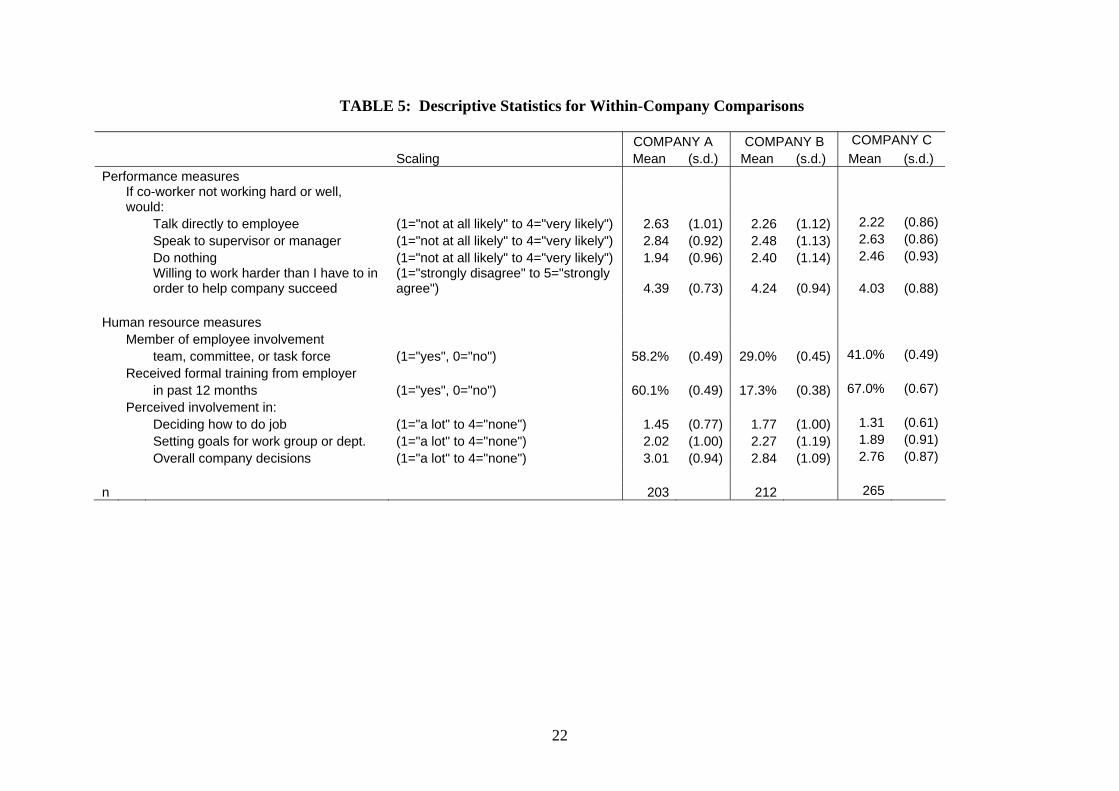
Table 5 provides descriptive data on our key variables from the surveys in these three
firms. The principal question on our survey relating to employee response to free-riding
behavior is:
If you were to see a fellow employee not working as hard or well as he or she should,
how likely would you be to:
Talk directly to the employee
Speak to your supervisor or management
Do nothing
The responses were given on a four point scale, running from (1) not at all likely, to (2)
not very likely, to (3) somewhat likely, to (4) very likely. For ease of presentation and to allow
for a relatively simple difference-in-difference analysis of the data, we summarize the responses
as the mean of the coded answers. The descriptive statistics in the upper panel of Table 5 show
that workers at each of the firms were likely to talk directly to the employee or speak to the
supervisor, though there is considerable variation among individuals with a standard deviation of
about one unit (the difference between two categories). The bottom panel of Table 5 gives three
14
indicators of the role of the worker in the firm: whether the worker served on an employee
involvement committee or team or task force; whether the employee received training in the past
year and the employee’s perceived involvement in three activities: doing their own job; setting
goals for their work group or department; and participating in overall company decisions. In
company A, where the workers are more skilled, approximately half of the work force serves on
EI committees and 60% received some training. By contrast, in firm B just 29% serve on some
EI committee and 17% received some training. Company C has 41% on an EI committee and
67% who received some training. In all three firms, workers report having greater involvement
in deciding to do their own jobs than in setting goals for their work group, and least involvement
in overall company decisions.
Under which of these situations is a worker more likely to intervene actively when they
see someone not working up to speed? We expect workers to be more likely to respond against
free riding when they are involved in a group work activity than when they are in a more
individualistic work situation. If this is the case, workers on EI teams should be more prone to
actively intervene against free riding than other workers. Similarly, workers who are more
involved in setting goals for their work group or department should be more likely to intervene
actively than other workers. Do the data show such patterns, and if so, to what extent, if at all,
can we interpret them as being causally related to the workers’ position in the organization as
opposed to some unobserved individual characteristic?
EI Committees, Involvement in Decisions, and Response to Free-Riding
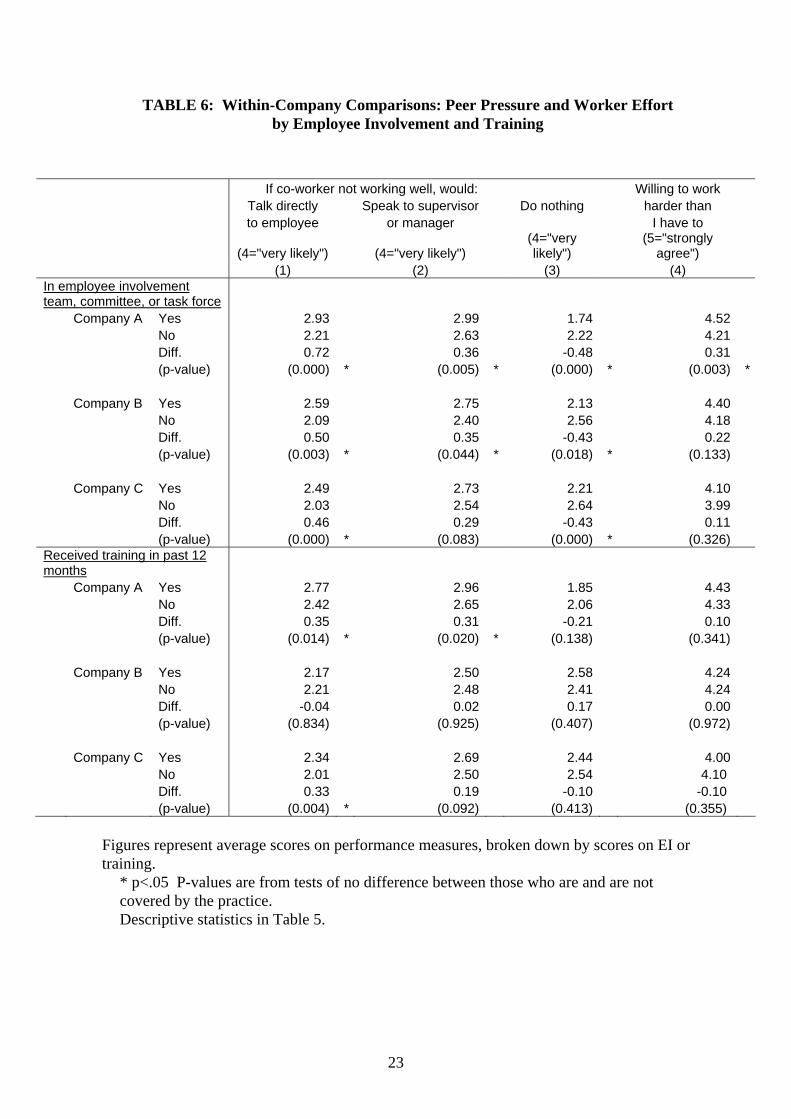
The evidence in Table 6 shows that workers on EI committees are far more likely to talk directly
to the employee and much less likely to do nothing than workers who are not on such
committees. The mean score for the response of “talk directly” for workers in company A who
are on committees is 2.93 compared to a mean score of 2.21 for those who are not on
committees, giving a statistically significant difference of 0.72 in company A. The comparable
significant differences in companies B and C are 0.50 and 0.46, respectively. The differences
between EI members and other workers in speaking to a supervisor about a worker not doing his
or her job are smaller though still significant in two firms, while the differences in doing nothing
are significant in the opposite direction for all three firms. These results are consistent with the
notion that the position of workers on EI committees leads them to intervene more than other
15
workers when they see someone not doing their job and, most important, to intervene directly to
a greater extent than going to a supervisor. The difference between talking to the employee
directly and speaking to the supervisor or manager is a substantial 0.36 in company A (0.72-
0.36), 0.15 in company B (0.50-0.35), and 0.17 in company C (0.46-0.29).
It is possible that some of the differences attributed to employee involvement and training
in Table 6 are actually due to their positions in the firm. To check for this, we re-estimated the
differences, controlling for job categories (which range from production jobs to top management)
and pay categories (hourly, salaried-nonexempt and salaried-exempt). With these controls, many
differences (not reported here) become smaller in absolute value, but there were no sign
reversals, and most of the differences remain statistically significant.
Absent a before/after experiment of placing employees on EI committees and seeing how
they react to this group responsibility, we probe for causality in the observed relation by
comparing worker responses to slackers by participation on committees versus other differences
in their work lives. We do this in two ways. First, we contrast the difference in response to free
riding between workers serving on EI committees and workers not serving on EI committees to
the workers’ assessment of their willingness to work hard for the company. We derive this
variable from a question: “I am willing to work harder than I have to in order to help the
company I work for succeed,” which we scaled on a five-point scale, including the neutral
response “neither agree nor disagree.” Persons on EI committees in all three companies report
that they are more likely to work hard than do workers who are not on those committees, but the
magnitude of the difference is markedly smaller than the difference in their likelihood of talking
directly to the employee who is doing poorly. That is, the EI/non-EI difference in opposing free
riding behavior is greater than the personal difference in work effort between EI and non-EI
workers.
Second, we compare the difference in responses to free riding between persons with and
without EI to the difference in responses between workers who did and did not receive training.
Workers given training by the firm are likely to be valued employees, and thus might be
expected to intervene when other employees are not doing their job. The results in the bottom
panel of Table 6 show such a pattern (at least for companies A and C). But once again the
training/no training differences are smaller than the EI/non-EI differences in the likelihood of
talking to a shirking co-worker, strongly suggesting that EI is playing a positive role.
Our surveys contain multiple other questions from which we can derive differences for
comparison with those from the EI committee contrast. All those we have examined show
16
smaller differences than the ones found for the EI committee involvement, which is consistent
with the notion that there is a real impact from the role that workers play in organizational
decision-making.
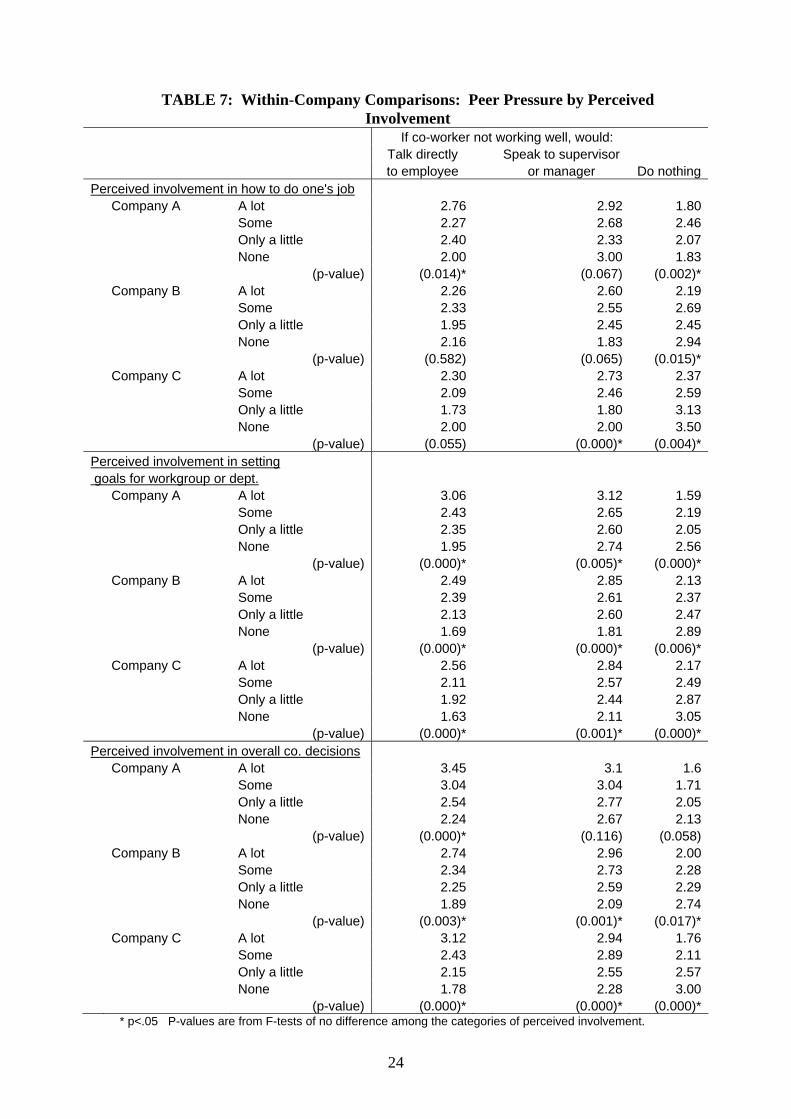
Table 7 examines this pattern using a different set of questions. It uses responses to
questions about workers’ perceived involvement on their own jobs, in setting goals for their work
groups, and in overall company decisions, to see whether group activity produces greater worker
efforts to police free riding behavior than other forms of involvement. The table gives the
average scores of workers on their likelihood of responding to a co-worker who is not doing his
or her job right, by their level of perceived involvement in each specified activity. In virtually all
cases, workers who are more involved in some activity are more likely to talk directly to
employees who are performing poorly, more likely to speak to supervisors, and less likely to do
nothing about the poorly performing employee, than employees who feel no sense of
involvement in the specified area. These differences are generally maintained in exploratory
regressions that control for job category and pay category.
A key question is whether these differences vary by type of involvement. Involvement in
workgroup decisions with one’s day-to-day co-workers is more likely to generate knowledge of
and concern for co-worker performance, which should increase worker willingness to apply peer
pressure. The data in the table show this pattern. The P-values reflecting the difference in
responses among categories compared to a null hypothesis of no difference are markedly smaller
for “perceived involvement in setting goals for work group” than for either of the other
categories. In companies B and C, there are no significant differences by involvement in one’s
own job in the likelihood of talking directly to the poor performer compared to highly significant
differences by involvement in setting workplace goals.
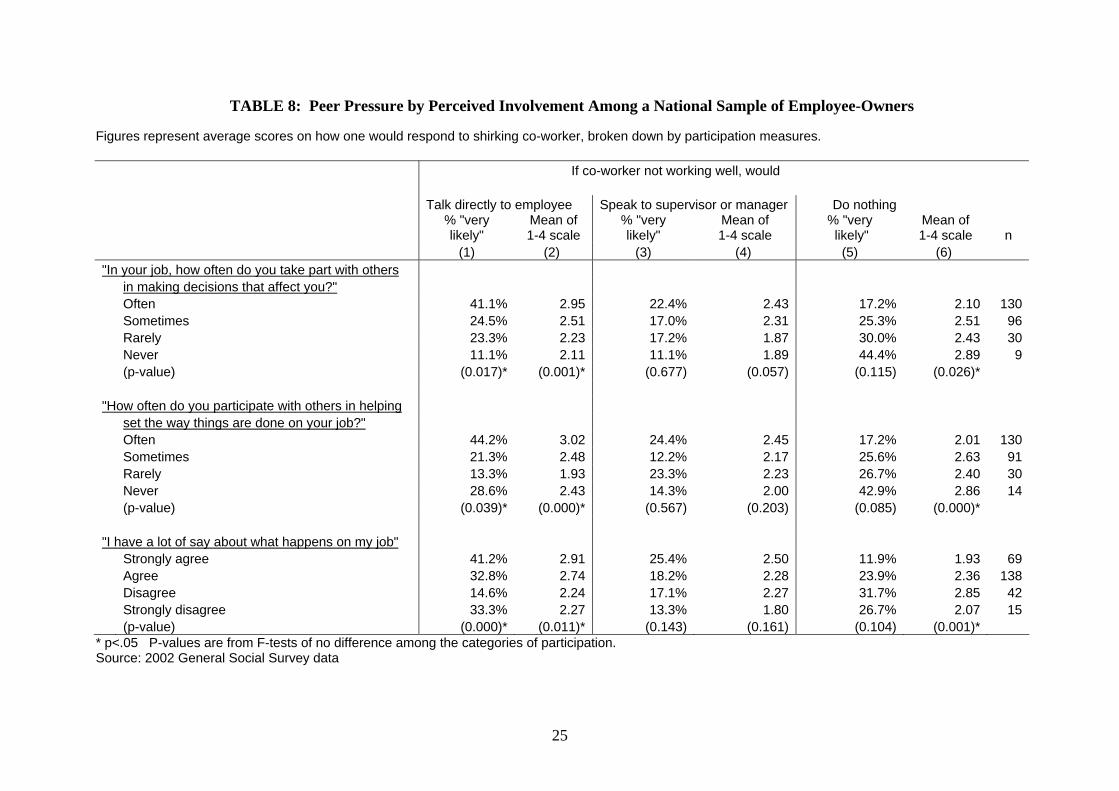
As a check on these results, we also present data from NORC’s 2002 General Social
Survey, on which we placed the questions concerning how one would respond to a shirking co-
worker. Table 8 presents figures comparable to those in Table 7, breaking down the average
responses to shirking co-workers according to participation in workplace decisions by employee-
owners (using different participation questions than in the case study surveys). The survey found
that 265 of the 1134 workers in for-profit firms, or 23.4%, reported owning stock in their
companies. As shown in Table 8, the results from this representative sample of employee-
owners are very consistent with the results from our case study surveys: those who report greater
participation in decisions are significantly more likely to talk to shirking co-workers, and
significantly less likely to do nothing. These data provide a useful initial picture of how
17
workers’ participation in decision-making in employee ownership firms is associated with their
efforts to reduce free riding behavior. In future work we will examine whether employee owners
make a greater effort to police poor performance than other workers, whether the proportion of
the employee ownership incentive to the worker’s salary or overall wealth influences this
behavior, and whether serving on an EI committee or being more involved in setting workgroup
goals has a greater or lesser effect in an employee-owned enterprise than in another enterprise.
Conclusion
Economic theory suggests that, by itself, employee ownership is unlikely to have a large effect
on worker effort and performance. Ownership must be combined with employee involvement
and other policies that give workers the power to act on the incentives; and employee ownership
firms and other organizations that rely on group incentives must battle against the tendency to
free ride. Our analysis of variation in worker-reported effort across eleven ESOP firms, and of
employee-owners in three ESOP firms and a representative national sample, tends to support the
need to combine the incentive of ownership with the involvement of participation. We find
significant differences in worker assessment of work effort across ESOP firms, indicating that
even in firms with substantial employee ownership, other factors influence outcomes. Relating
worker-reported outcomes to their sense of ownership and an index of HR policies shows that
ownership and HR policies are both positively linked to employee reports of workplace
performance, which is itself related to company performance. Our analysis of employee
response to co-workers who are failing to do a good job shows that workers on employee
involvement committees or who otherwise report being involved in setting goals for their work
group are more likely to talk directly with a non-performing worker and are less likely to do
nothing. Conceptually, an understanding of how employee ownership works successfully, or not,
requires a three-pronged analysis of: the incentives that ownership gives, the participative
mechanisms available to workers to act on those incentives, and incentives/corporate culture that
battles against tendencies to free ride. All firms, whether employee owned or not, have to
combine these three elements in some fashion to motivate workers to perform as best they can.
Employee ownership provides a distinct solution to the incentive problem, but must still deal
with the participation and free-riding problems.
18
TABLE 1: Employee-Reported and Company Performance Measures
Correlation of objective measures with F-stat. average within-company scores on: Mean (s.d.) n for co. "People at OurCo Performance Performance differences^ work hard" Index1 Index2 (1) (2) (3) (4) (5) (6) (7)
EMPLOYEE-REPORTED MEASURES^^ "People at [OurCo] work hard." 5.66 (1.37) 2139 24.43
"People at [OurCo] care about meeting our customers' needs." 5.68 (1.29) 2139 25.44
"People at this company are willing to make sacrifices to help co-workers." 4.65 (1.64) 2139 37.24 "Employees at [OurCo] are very committed to the company and its future." 4.81 (1.51) 2139 19.58 Performance index1 (sum of above four) 20.8 (4.43) 2139 42.35 "As long as their jobs are secure, company performance is unimportant to people at [OurCo]." 3.08 (1.70) 1690 21.32 "[OurCo] employees work less when supervisors are not watching." 3.42 (1.92) 1693 21.18
Performance index2 (sum of above six, last two reverse-scored) 30.49 (6.49) 1686 55.76
OBJECTIVE COMPANY PERFORMANCE MEASURES (industry-adjusted)^^^ Avg. ln(sales/employee) over past 3 years -0.425 (0.682) 10 0.337 0.135 0.019 Avg. profit margin over past 3 years 0.319 (0.309) 9 0.630 0.631 0.582 Employment growth over past 3 years (pct.) -0.086 (0.355) 10 0.621 0.561 0.481 Sales growth over past 3 years (pct.) -0.200 (0.315) 10 0.495 0.416 0.407 Stock price growth over past 3 years (pct.) 0.190 (0.246) 9 0.189 0.147 0.352 Ln(sales/employee) growth over past 3 years -0.080 (0.117) 10 0.373 0.328 0.328 ^ F-statistic for test of null hypothesis that employee-reported measures do not differ among the 11 firms, rejected in every case at the p<.0001 level. ^^ All employee-reported measures use 1-7 scale, with 1="strongly disagree”, 4="neutral”, and 7="strongly agree." ^^^ For the industry adjustment, average values for public firms in the same size class and 2-digit SIC were subtracted from each company’s score.
19
TABLE 2: Human Resource Policies Among Among all firms (s.d.) employees^ (s.d.) (1) (2) (3) (4) Sample size 11 2139 EMPLOYEE INVOLVEMENT Quality circles 9.1% 5.1% Employee task forces 63.6% 75.6% Autonomous work groups 9.1% 5.3% Employee involvement in new hires 45.5% 66.2%
Employee representation on the board of directors 27.3% 32.3%
EI index—sum of above 1.55 (0.93) 1.85 (0.96)METHODS TO SHARE INFORMATION WITH EMPLOYEES Newsletter 72.7% 88.3% Memos 63.6% 79.9% Email 63.6% 75.6% Intranet 27.3% 39.0% Bulletin board 81.8% 87.1% Regular meetings at dept./workgroup level 90.9% 96.7% Regular meetings at company level 63.6% 74.6% Centralized file of policies/procedures 63.6% 77.7% New employee orientation 90.9% 96.5% Information index—sum of above 6.18 (2.09) 7.15 (2.02)OTHER POLICIES 401(k) plan 90.9% 94.7% Other pension 27.3% 55.9% Formal grievance procedure 54.5% 70.7% Labor-management training 45.5% 66.2% Employee surveys 63.6% 74.2% Any bonuses 90.9% 96.5% Bonuses based on indiv. performance 45.5% 30.5% Suggestion system 27.3% 36.1% ESOP VARIABLES Pct. of pay contributed to plan—mean 9.8% (5.5%) 10.6% (4.2%) Pct. of company owned by ESOP 54.2% (27.2%) 51.3% (21.9%) Average ESOP value per employee $41,988 ($62,238) $31,853 ($53,200)
Performance-related reason for ESOP adoption^^ 63.6% 76.1%
HR INDEX^^^ 3.55 (1.97) 4.82 (2.33)^ Column 3 represents the percent of employees who are in firms with these policies (not all of whom may actually be covered by the policy). ^^ A motivation for the ESOP was "To encourage employees to think like owners”, "To improve productivity”, and/or "To retain or recruit employees." ^^^ The HR index adds one point each for: 1) above median on EI index, 2) above median on information index, 3) above median on pct. of pay contributed to ESOP, 4) other pension, 5) grievance procedure, 6) labor-management training, and 7) employee surveys.
20
TABLE 3: Predicting Employee-Reported Performance with HR Variables
Dependent variables: "People at OurCo work hard" Performance index 1
Performance index 2
Independent variables (1) (2) (3) (4) (5) (6) (7) (8) (9) HR index 0.119 * 0.117 * 0.118 * 0.452 * 0.451 * 0.452 * 0.613 * 0.517 0.551 (0.032) (0.037) (0.037) (0.159) (0.180) (0.159) (0.282) (0.399) (0.306) Bonuses based on 0.597 * 0.619 0.592 2.052 2.060 1.937 6.166 * 6.832 * 6.597 * indiv. performance (0.275) (0.308) (0.318) (1.074) (1.068) (1.058) (1.657) (1.328) (1.030 Suggestion system -0.340 * -0.335 * -0.343 -2.015 * -2.013 -2.025 * -3.655 * -3.683 * -3.559 * (0.167) (0.159) (0.168) (0.752) (0.716) (0.661) (0.293) (0.278) (0.214) Pct. of company 0.369 0.536 0.215 1.600 1.661 0.032 0.052 3.058 1.032 owned by ESOP (0.661) (0.851) (0.868) (2.038) (3.724) (3.389) (2.456) (4.848) (3.601) Performance-related 0.113 0.004 0.041 -.439 2.8385 1.525 reason for ESOP (0.448) (0.428) (1.985) (1.782) (3.306) (2.436) adoption Sense of ownership 0.098 * 0.648 * 0.896 * (0.030) (0.124) (0.197) Constant 4.836 * 4.666 * 4.481 * 17.906 * 17.845 16.132 * 27.476 * 24.040 * 21.974 * (0.381) (0.567) (0.564) (1.574) (2.735) (2.506) (2.018) (3.918) (3.048) R-squared 0.043 0.043 0.066 0.080 0.080 0.178 0.138 0.145 0.234 n 2139 2139 2139 2139 2139 2139 1686 1686 1686 * Significantly different from zero at p<.05. Standard errors in parentheses
See Tables 1 and 2 for descriptive statistics.
21
TABLE 4: Predicting Other Workplace Outcomes
Coefficient on Dep. var. HR index (s.e.) Mean (s.d.) Dependent variables^ (1) (2) (3) (4) INPUT "Employees at OurCo have real influence over the direction of our company." 0.103 (0.048) * 4.03 (1.80) "This company rarely responds to employee suggestions." (reverse-scored) 0.112 (0.062) 3.70 (1.71) "This company encourages people to participate in decisions that affect their day-to-day work." 0.130 (0.079) 4.58 (1.73) “The person I report to actively seeks my input.” 0.091 (0.033) * 4.94 (1.82) FAIRNESS "Company rules and regulations are fair." 0.128 (0.024) * 5.05 (1.61) "Overall, this company is fair to its employees." 0.029 (0.057) 5.01 (1.57) "I receive my fair share of company successes." 0.050 (0.018) * 4.43 (1.63) SATISFACTION "Employees are satisfied working at this company." 0.116 (0.066) 4.43 (1.57) CO-WORKER RELATIONS "I have good relations with my co-workers." 0.028 (0.018) 6.14 (1.06) VIEWS OF MANAGEMENT "OurCo managers are held accountable for their decisions." 0.046 (0.015) * 4.54 (1.69) "Employees at OurCo trust senior management." 0.060 (0.040) 4.50 (1.66) "Management uses employee ownership mainly for its own purposes." (reverse-scored) 0.030 (0.042) 3.87 (1.81) VIEW OF SUPERVISION "Employees at OurCo trust their supervisors." 0.088 (0.028) * 4.50 (1.66) "People feel they are too closely supervised --someone is always checking up on them." 0.041 (0.027) 3.20 (1.62) "The person I report to is fair to me." 0.062 (0.023) * 5.65 (1.57) SENSE OF OWNERSHIP "How much do you feel like an owner of this company?" (1-10 scale) -0.034 (0.087) 4.65 (2.79)
* Significantly different from zero at p<.05 ^ All dependent variables are measured on 1-7 scale, except as noted. All regressions include suggestion systems, bonuses based on individual performance, and percent of company owned by ESOP as predictors. See Table 2 for definition and descriptive statistics for HR index.
22
TABLE 5: Descriptive Statistics for Within-Company Comparisons COMPANY A COMPANY B COMPANY C Scaling Mean (s.d.) Mean (s.d.) Mean (s.d.) Performance measures
If co-worker not working hard or well, would:
Talk directly to employee (1="not at all likely" to 4="very likely") 2.63 (1.01) 2.26 (1.12) 2.22 (0.86) Speak to supervisor or manager (1="not at all likely" to 4="very likely") 2.84 (0.92) 2.48 (1.13) 2.63 (0.86) Do nothing (1="not at all likely" to 4="very likely") 1.94 (0.96) 2.40 (1.14) 2.46 (0.93)
Willing to work harder than I have to in order to help company succeed
(1="strongly disagree" to 5="strongly agree") 4.39 (0.73) 4.24 (0.94)
4.03
(0.88)
Human resource measures Member of employee involvement team, committee, or task force (1="yes", 0="no") 58.2% (0.49) 29.0% (0.45) 41.0% (0.49) Received formal training from employer in past 12 months (1="yes", 0="no") 60.1% (0.49) 17.3% (0.38) 67.0% (0.67) Perceived involvement in: Deciding how to do job (1="a lot" to 4="none") 1.45 (0.77) 1.77 (1.00) 1.31 (0.61) Setting goals for work group or dept. (1="a lot" to 4="none") 2.02 (1.00) 2.27 (1.19) 1.89 (0.91) Overall company decisions (1="a lot" to 4="none") 3.01 (0.94) 2.84 (1.09) 2.76 (0.87) n 203 212 265
23
TABLE 6: Within-Company Comparisons: Peer Pressure and Worker Effort by Employee Involvement and Training
Figures represent average scores on performance measures, broken down by scores on EI or training.
* p<.05 P-values are from tests of no difference between those who are and are not covered by the practice. Descriptive statistics in Table 5.
If co-worker not working well, would: Willing to work Talk directly Speak to supervisor Do nothing harder than to employee or manager I have to
(4="very likely") (4="very likely") (4="very likely")
(5="strongly agree")
(1) (2) (3) (4) In employee involvement team, committee, or task force Company A Yes 2.93 2.99 1.74 4.52 No 2.21 2.63 2.22 4.21 Diff. 0.72 0.36 -0.48 0.31 (p-value) (0.000) * (0.005) * (0.000) * (0.003) * Company B Yes 2.59 2.75 2.13 4.40 No 2.09 2.40 2.56 4.18 Diff. 0.50 0.35 -0.43 0.22 (p-value) (0.003) * (0.044) * (0.018) * (0.133) Company C Yes 2.49 2.73 2.21 4.10 No 2.03 2.54 2.64 3.99 Diff. 0.46 0.29 -0.43 0.11 (p-value) (0.000) * (0.083) (0.000) * (0.326) Received training in past 12 months Company A Yes 2.77 2.96 1.85 4.43 No 2.42 2.65 2.06 4.33 Diff. 0.35 0.31 -0.21 0.10 (p-value) (0.014) * (0.020) * (0.138) (0.341) Company B Yes 2.17 2.50 2.58 4.24 No 2.21 2.48 2.41 4.24 Diff. -0.04 0.02 0.17 0.00 (p-value) (0.834) (0.925) (0.407) (0.972) Company C Yes 2.34 2.69 2.44 4.00 No 2.01 2.50 2.54 4.10 Diff. 0.33 0.19 -0.10 -0.10 (p-value) (0.004) * (0.092) (0.413) (0.355)
24
TABLE 7: Within-Company Comparisons: Peer Pressure by Perceived Involvement
If co-worker not working well, would: Talk directly Speak to supervisor to employee or manager Do nothing Perceived involvement in how to do one's job Company A A lot 2.76 2.92 1.80 Some 2.27 2.68 2.46 Only a little 2.40 2.33 2.07 None 2.00 3.00 1.83 (p-value) (0.014)* (0.067) (0.002)* Company B A lot 2.26 2.60 2.19 Some 2.33 2.55 2.69 Only a little 1.95 2.45 2.45 None 2.16 1.83 2.94 (p-value) (0.582) (0.065) (0.015)* Company C A lot 2.30 2.73 2.37 Some 2.09 2.46 2.59 Only a little 1.73 1.80 3.13 None 2.00 2.00 3.50 (p-value) (0.055) (0.000)* (0.004)*Perceived involvement in setting goals for workgroup or dept. Company A A lot 3.06 3.12 1.59 Some 2.43 2.65 2.19 Only a little 2.35 2.60 2.05 None 1.95 2.74 2.56 (p-value) (0.000)* (0.005)* (0.000)* Company B A lot 2.49 2.85 2.13 Some 2.39 2.61 2.37 Only a little 2.13 2.60 2.47 None 1.69 1.81 2.89 (p-value) (0.000)* (0.000)* (0.006)* Company C A lot 2.56 2.84 2.17 Some 2.11 2.57 2.49 Only a little 1.92 2.44 2.87 None 1.63 2.11 3.05 (p-value) (0.000)* (0.001)* (0.000)*Perceived involvement in overall co. decisions Company A A lot 3.45 3.1 1.6 Some 3.04 3.04 1.71 Only a little 2.54 2.77 2.05 None 2.24 2.67 2.13 (p-value) (0.000)* (0.116) (0.058) Company B A lot 2.74 2.96 2.00 Some 2.34 2.73 2.28 Only a little 2.25 2.59 2.29 None 1.89 2.09 2.74 (p-value) (0.003)* (0.001)* (0.017)* Company C A lot 3.12 2.94 1.76 Some 2.43 2.89 2.11 Only a little 2.15 2.55 2.57 None 1.78 2.28 3.00 (p-value) (0.000)* (0.000)* (0.000)*
* p<.05 P-values are from F-tests of no difference among the categories of perceived involvement.
25
TABLE 8: Peer Pressure by Perceived Involvement Among a National Sample of Employee-Owners
Figures represent average scores on how one would respond to shirking co-worker, broken down by participation measures. If co-worker not working well, would Talk directly to employee Speak to supervisor or manager Do nothing
% "very likely"
Mean of 1-4 scale
% "very likely"
Mean of 1-4 scale
% "very likely"
Mean of 1-4 scale n
(1) (2) (3) (4) (5) (6) "In your job, how often do you take part with others in making decisions that affect you?" Often 41.1% 2.95 22.4% 2.43 17.2% 2.10 130 Sometimes 24.5% 2.51 17.0% 2.31 25.3% 2.51 96 Rarely 23.3% 2.23 17.2% 1.87 30.0% 2.43 30 Never 11.1% 2.11 11.1% 1.89 44.4% 2.89 9 (p-value) (0.017)* (0.001)* (0.677) (0.057) (0.115) (0.026)* "How often do you participate with others in helping set the way things are done on your job?" Often 44.2% 3.02 24.4% 2.45 17.2% 2.01 130 Sometimes 21.3% 2.48 12.2% 2.17 25.6% 2.63 91 Rarely 13.3% 1.93 23.3% 2.23 26.7% 2.40 30 Never 28.6% 2.43 14.3% 2.00 42.9% 2.86 14 (p-value) (0.039)* (0.000)* (0.567) (0.203) (0.085) (0.000)* "I have a lot of say about what happens on my job" Strongly agree 41.2% 2.91 25.4% 2.50 11.9% 1.93 69 Agree 32.8% 2.74 18.2% 2.28 23.9% 2.36 138 Disagree 14.6% 2.24 17.1% 2.27 31.7% 2.85 42 Strongly disagree 33.3% 2.27 13.3% 1.80 26.7% 2.07 15 (p-value) (0.000)* (0.011)* (0.143) (0.161) (0.104) (0.001)*
* p<.05 P-values are from F-tests of no difference among the categories of participation. Source: 2002 General Social Survey data
26
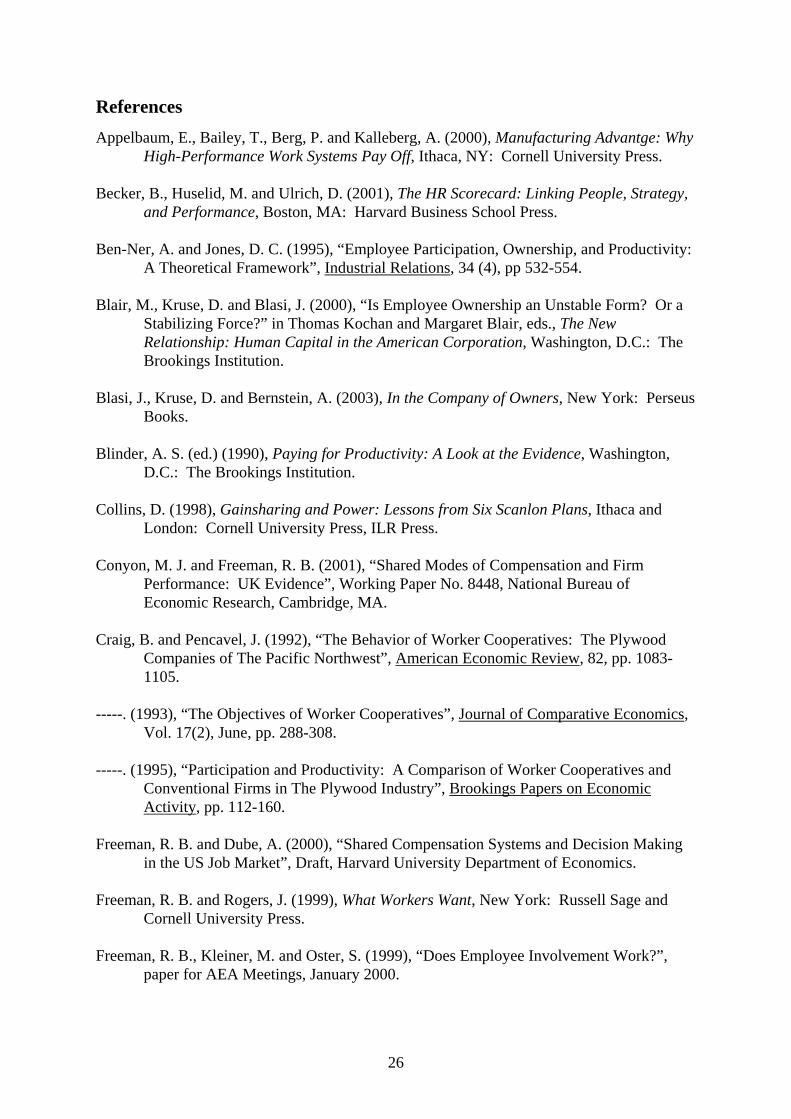
References Appelbaum, E., Bailey, T., Berg, P. and Kalleberg, A. (2000), Manufacturing Advantge: Why
High-Performance Work Systems Pay Off, Ithaca, NY: Cornell University Press. Becker, B., Huselid, M. and Ulrich, D. (2001), The HR Scorecard: Linking People, Strategy,
and Performance, Boston, MA: Harvard Business School Press.
Ben-Ner, A. and Jones, D. C. (1995), “Employee Participation, Ownership, and Productivity: A Theoretical Framework”, Industrial Relations, 34 (4), pp 532-554.
Blair, M., Kruse, D. and Blasi, J. (2000), “Is Employee Ownership an Unstable Form? Or a
Stabilizing Force?” in Thomas Kochan and Margaret Blair, eds., The New Relationship: Human Capital in the American Corporation, Washington, D.C.: The Brookings Institution.
Blasi, J., Kruse, D. and Bernstein, A. (2003), In the Company of Owners, New York: Perseus
Books. Blinder, A. S. (ed.) (1990), Paying for Productivity: A Look at the Evidence, Washington,
D.C.: The Brookings Institution. Collins, D. (1998), Gainsharing and Power: Lessons from Six Scanlon Plans, Ithaca and
London: Cornell University Press, ILR Press. Conyon, M. J. and Freeman, R. B. (2001), “Shared Modes of Compensation and Firm
Performance: UK Evidence”, Working Paper No. 8448, National Bureau of Economic Research, Cambridge, MA.
Craig, B. and Pencavel, J. (1992), “The Behavior of Worker Cooperatives: The Plywood
Companies of The Pacific Northwest”, American Economic Review, 82, pp. 1083-1105.
-----. (1993), “The Objectives of Worker Cooperatives”, Journal of Comparative Economics,
Vol. 17(2), June, pp. 288-308. -----. (1995), “Participation and Productivity: A Comparison of Worker Cooperatives and
Conventional Firms in The Plywood Industry”, Brookings Papers on Economic Activity, pp. 112-160.
Freeman, R. B. and Dube, A. (2000), “Shared Compensation Systems and Decision Making
in the US Job Market”, Draft, Harvard University Department of Economics. Freeman, R. B. and Rogers, J. (1999), What Workers Want, New York: Russell Sage and
Cornell University Press. Freeman, R. B., Kleiner, M. and Oster, S. (1999), “Does Employee Involvement Work?”,
paper for AEA Meetings, January 2000.
27
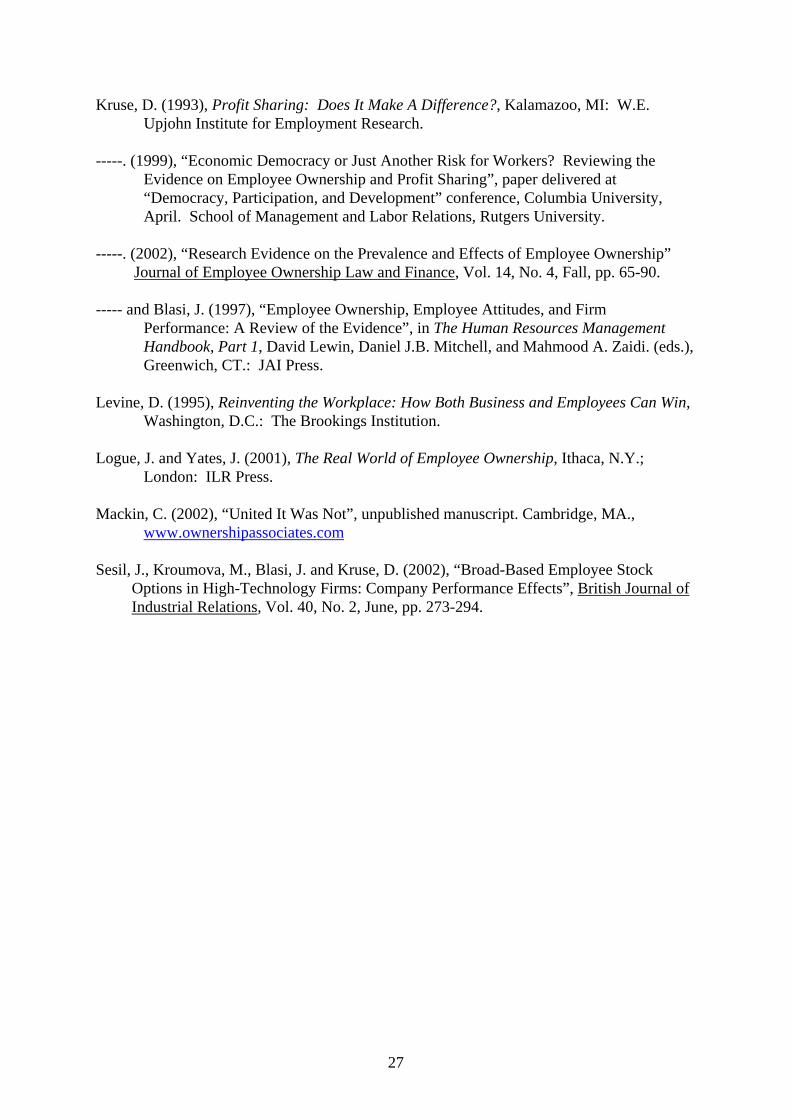
Kruse, D. (1993), Profit Sharing: Does It Make A Difference?, Kalamazoo, MI: W.E. Upjohn Institute for Employment Research.
-----. (1999), “Economic Democracy or Just Another Risk for Workers? Reviewing the
Evidence on Employee Ownership and Profit Sharing”, paper delivered at “Democracy, Participation, and Development” conference, Columbia University, April. School of Management and Labor Relations, Rutgers University.
-----. (2002), “Research Evidence on the Prevalence and Effects of Employee Ownership”
Journal of Employee Ownership Law and Finance, Vol. 14, No. 4, Fall, pp. 65-90. ----- and Blasi, J. (1997), “Employee Ownership, Employee Attitudes, and Firm
Performance: A Review of the Evidence”, in The Human Resources Management Handbook, Part 1, David Lewin, Daniel J.B. Mitchell, and Mahmood A. Zaidi. (eds.), Greenwich, CT.: JAI Press.
Levine, D. (1995), Reinventing the Workplace: How Both Business and Employees Can Win,
Washington, D.C.: The Brookings Institution. Logue, J. and Yates, J. (2001), The Real World of Employee Ownership, Ithaca, N.Y.;
London: ILR Press. Mackin, C. (2002), “United It Was Not”, unpublished manuscript. Cambridge, MA.,
www.ownershipassociates.com Sesil, J., Kroumova, M., Blasi, J. and Kruse, D. (2002), “Broad-Based Employee Stock
Options in High-Technology Firms: Company Performance Effects”, British Journal of Industrial Relations, Vol. 40, No. 2, June, pp. 273-294.
CENTRE FOR ECONOMIC PERFORMANCE Recent Discussion Papers
657 Christopher Crowe Inflation, Inequality and Social Conflict
656 James Banks Richard Disney Alan Duncan John Van Reenen
The Internationalisation of Public Welfare Policy
655 Eran Yashiv The Self Selection of Migrant Workers Revisited
654 Hilary Steedman Sheila Stoney
Disengagement 14-16: Context and Evidence
653 Ralf Martin Globalisation, ICT and the Nitty Gritty of Plant Level Datasets
652 Jörn-Steffen Pischke Labor Market Institutions, Wages and Investment
651 Anthony J. Venables Evaluating Urban Transport Improvements: Cost Benefit Analysis in the Presence of Agglomeration and Income Taxation
650 John Van Reenen Is There a Market for Work Group Servers? Evaluating Market Level Demand Elasticities Using Micro and Macro Models
649 Rachel Griffith Stephen Redding Helen Simpson
Foreign Ownership and Productivity: New Evidence from the Service Sector and the R&D Lab
648 Fredrik Andersson Simon Burgess Julia I. Lane
Cities, Matching and the Productivity Gains of Agglomeration
647 Richard B. Freeman Douglas Kruse Joseph Blasi
Monitoring Colleagues at Work: Profit-Sharing, Employee Ownership, Broad-Based Stock Options and Workplace Performance in the United States
646 Alberto Bayo-Moriones Jose E. Galdon-Sanchez Maia Güell
Is Seniority-Based Pay Used as a Motivation Device? Evidence from Plant Level Data
645 Stephen Machin Olivier Marie
Crime and Benefit Sanctions
644 Richard B. Freeman Are European Labor Markets As Awful As All That?
643 Andrew B. Bernard Stephen Redding Peter K. Schott
Comparative Advantage and Heterogeneous Firms
642 Patricia Rice Anthony J. Venables
Spatial Determinants of Productivity: Analysis for the Regions of Great Britain
641 Kwok Tong Soo Zipf’s Law for Cities: A Cross Country Investigation
640 Alan Manning We Can Work it Out: the Impact of Technological Change on the Demand for Low Skill Workers
639 Bianca De Paoli Monetary Policy and Welfare in a Small Open Economy
638 Kimberly Ann Elliott Richard B. Freeman
White Hats or Don Quixotes? Human Rights Vigilantes in the Global Economy
637 Barbara Petrongolo Gender Segregation in Employment Contracts
636 Ann Bartel Richard B. Freeman Casey Ichniowski Morris Kleiner
Can a Work Organization Have an Attitude Problem? The Impact of Workplaces on Employee Attitudes and Economic Outcomes
635 Paul Gregg Rosanna Scutella Jonathan Wadsworth
Reconciling Workless Measures at the Individual and Household Level: Theory and Evidence from the United States, Britain, Germany, Spain and Australia
634 Stephen Nickell Employment and Taxes
633 Fabiano Schivardi Roberto Torrini
Threshold Effects and Firm Size: the Case of Firing Costs
The Centre for Economic Performance Publications Unit Tel 020 7955 7673 Fax 020 7955 7595 Email [email protected]
Web site http://cep.lse.ac.uk


![Goal Goodness Truth Justice Responsibility Protecting Balance “With great power comes great responsibility” [Stan Lee, Marvel Comics]](https://img.pdfslide.net/doc/110x75/56649eaa5503460f94baedd5/goal-goodness-truth-justice-responsibility-protecting-balance-with-great.jpg)