Embed Size (px)
Citation preview

Bond UniversityResearch Repository
Balanced carbohydrate ratios are associated with improved diet quality in Australia: Anationally representative cross-sectional study
Blumfield, Michelle; McConnell, Andrew; Cassettari, Tim; Petocz, Peter; Warner, Molly;Campos, Vanessa; Lê, Kim-Anne; Minehira, Kaori; Marshall, Skye; Fayet-Moore, FlaviaPublished in:PLoS One
DOI:10.1371/journal.pone.0253582
Licence:CC BY
Link to output in Bond University research repository.
Recommended citation(APA):Blumfield, M., McConnell, A., Cassettari, T., Petocz, P., Warner, M., Campos, V., Lê, K-A., Minehira, K.,Marshall, S., & Fayet-Moore, F. (2021). Balanced carbohydrate ratios are associated with improved diet qualityin Australia: A nationally representative cross-sectional study. PLoS One, 16(7), [e0253582].https://doi.org/10.1371/journal.pone.0253582
General rightsCopyright and moral rights for the publications made accessible in the public portal are retained by the authors and/or other copyright ownersand it is a condition of accessing publications that users recognise and abide by the legal requirements associated with these rights.
For more information, or if you believe that this document breaches copyright, please contact the Bond University research repositorycoordinator.
Download date: 01 Mar 2022
RESEARCH ARTICLE
Balanced carbohydrate ratios are associated
with improved diet quality in Australia: A
nationally representative cross-sectional
study
Michelle BlumfieldID1, Andrew McConnell1, Tim Cassettari2, Peter Petocz1,
Molly WarnerID1, Vanessa Campos3, Kim-Anne Lê3, Kaori Minehira4, Skye Marshall1,5,
Flavia Fayet-Moore6*
1 Department of Science, Nutrition Research Australia, Sydney, New South Wales, Australia, 2 Department
of Translational Science, Nutrition Research Australia, Sydney, New South Wales, Australia, 3 Nestle
Institute of Health Sciences, Nestle Research, Societe des Produits Nestle S.A., Lausanne, Switzerland,
4 Nestle Research, Societe des Produits Nestle S.A., Vers-chez-les-Blanc, Lausanne, Switzerland, 5 Bond
University Nutrition and Dietetics Research Group, Faculty of Health Sciences and Medicine, Bond University,
Gold Coast, Queensland, Australia, 6 Nutrition Research Australia, Sydney, New South Wales, Australia
Abstract
Background
Carbohydrate quality influences major health outcomes; however, the best criteria to assess
carbohydrate quality remain unknown.
Objective
The objectives were to: i) evaluate whether a diet that meets a carbohydrate ratio (simple,
modified or dual ratio) is associated with higher nutrient intakes and diet quality, and ii)
model the impact of substituting carbohydrate foods that meet the proposed ratios in place
of foods that do not, on nutrient intakes.
Design
A secondary analysis of cross-sectional data from the 2011–12 Australian National Nutrition
and Physical Activity Survey.
Participants/Setting
National data from participants aged 2 years and older (n = 12,153).
Main outcome measures
Ratios were defined as (i) simple ratio, 10:1 (10g carbohydrate:�1g dietary fiber); (ii) modi-
fied ratio, 10:1:2 (10g carbohydrate:�1g dietary fiber:�2g free sugars); and (iii) dual ratio,
10:1 & 1:2 (10g carbohydrate:�1g dietary fiber &�2g free sugars per 1g dietary fiber).
PLOS ONE
PLOS ONE | https://doi.org/10.1371/journal.pone.0253582 July 9, 2021 1 / 19
a1111111111
a1111111111
a1111111111
a1111111111
a1111111111
OPEN ACCESS
Citation: Blumfield M, McConnell A, Cassettari T,
Petocz P, Warner M, Campos V, et al. (2021)
Balanced carbohydrate ratios are associated with
improved diet quality in Australia: A nationally
representative cross-sectional study. PLoS ONE
16(7): e0253582. https://doi.org/10.1371/journal.
pone.0253582
Editor: Walid Elfalleh, Higher Institute of Applied
Sciences and Technology of Gabes University of
Gabes, TUNISIA
Received: January 27, 2021
Accepted: June 9, 2021
Published: July 9, 2021
Copyright: © 2021 Blumfield et al. This is an open
access article distributed under the terms of the
Creative Commons Attribution License, which
permits unrestricted use, distribution, and
reproduction in any medium, provided the original
author and source are credited.
Data Availability Statement: The methodology of
this study involved the secondary analysis of a de-
identified dataset published by the Australian
Bureau of Statistics. Therefore, the current study
authors do not own the data; but the data are
available for use to other researchers if they make a
request to the Australian Bureau of Statistics.
Applications to access microdata products can be
made here: https://www.abs.gov.au/websitedbs/
D3310114.nsf/home/MicrodataDownload. All
Ratios were compared to nutrient intakes obtained via automated multiple-pass 24-hour die-
tary recall and diet quality calculated using the Australian Healthy Eating Index.
Statistical analyses performed
Substitution dietary modelling was performed. Data were analyzed using paired and inde-
pendent sample t-tests.
Results
Ratio adherence was highest for simple (50.2% adults; 28.6% children), followed by dual
(40.6% adults; 21.7% children), then modified (32.7% adults; 18.6% children) ratios. Partici-
pants who met any ratio reported higher nutrient intake and diet quality compared to those
who failed to meet the respective ratio (P < .001 for all), with the greatest nutrient intakes
found for those who met modified or dual ratios. Dietary modelling improved nutrient intakes
for all ratios, with the greatest improvement found for the dual ratio.
Conclusions
All carbohydrate ratios were associated with higher diet quality, with a free sugars constraint
in the dual ratio providing the greatest improvements.
Introduction
Carbohydrate (CHO) quality is known to highly influence major health outcomes [1]. Com-
pelling evidence from randomized controlled trials, prospective studies, and dose-response
effects suggest a causal relationship between high dietary fiber and a reduced risk of non-com-
municable diseases [1]. High intakes of dietary fiber, which is the non-digestible edible compo-
nent of plants, can reduce the risk of cardiometabolic risk factors, including obesity, high
cholesterol, high blood pressure and insulin resistance [1–4]. Dietary fiber has also been posi-
tively associated with improved gastrointestinal function, and the prevention of diverticular
disease and colorectal cancer [5–7]. Conversely, high dietary intake of free sugars promotes
adverse health outcomes including dental carries and weight gain [8]. Reflecting the impor-
tance of CHO quality for human health, as well as a high prevalence of diets characterized by
low CHO quality internationally [9–14], in 2015 the World Health Organization (WHO) rec-
ommended diets contain less than 10% of total energy from free sugars, with greater health
benefits achievable when free sugars are reduced to less than 5% of total energy [15]. There-
fore, developing a metric to assess dietary CHO quality may be an important strategy to moni-
tor nutritional-related health risk for populations and assist in identifying, guiding and
promoting healthier CHO food choices and products.
Many different indicators exist to assess CHO quality of foods such as the amount of dietary
fiber, wholegrains, free sugars, nutrient density, glycemic index (GI), and glycemic load (GL)
[1, 16–18]. These markers can differ in how accurately they represent a high-quality food
choice and can be misunderstood by consumers [19–21]. While it is mandatory in some coun-
tries to report the total CHO, sugars and dietary fiber content of packaged foods and beverages
[22–25], research confirms that consumers find nutrition information on packaging challeng-
ing to interpret and are thus rarely used effectively [19–21]. Different criteria have been pro-
posed to help consumers to identify healthier carbohydrate foods based on their wholegrain
PLOS ONE Balanced carbohydrate ratios improve diet quality
PLOS ONE | https://doi.org/10.1371/journal.pone.0253582 July 9, 2021 2 / 19
National Nutrition and Physical Activity Survey
2011-12 microdata are available to approved users
from the Australian Bureau of Statistics. URL:
https://www.abs.gov.au/Ausstats/[email protected]/0/
CA5C45B822514D94CA257C44001902AF?
OpenDocument Any questions regarding access to
microdata can be forwarded to microdata.
[email protected] or phone (+612) 6252 7714.
Funding: This project has been funded by Nestle
Research. The funder contributed to the initial
study concept and provided support in the form of
salaries for authors (MB, AM, MW, SM, TC and
FFM) and direct research costs (e.g., software,
overheads), but did not have any additional role in
the study design, data collection, data analysis,
decision to publish, or preparation of the
manuscript. The specific roles of the authors
affiliated with the funder (VC, KAL, KC) are
articulated in the author contributions’ section.
Competing interests: This study was conducted
and led by Nutrition Research Australia (NRAUS),
as represented by authors MB, AM, MW, SM, TC
and FFM. NRAUS is an independent research
company which received funding from
government, not-for-profits, industry and
professional associations. NRAUS strictly adheres
to a research integrity and independence policy,
available upon request. NRAUS affiliated authors
declare no competing interests. Nestle Research,
as represented by authors VC, KAL and KC,
developed the concept, provided top line
suggestions to the draft analysis plan, and critically
reviewed the manuscript for clarity and
completeness. The funder and affiliated authors did
not have any role in the data collection, data
analysis, results interpretation, nor conclusion of
the manuscript. Nestle Research affiliated authors
declare they received paid employment from the
funder. This research does not directly relate to any
patent, marketed product, nor product in
development at Nestle Research. The affiliations of
authors do not alter our adherence to the PLOS
ONE policies on sharing data and materials.
Abbreviations: AUSNUT, Australian Food and
Nutrient Database; BMI, body mass index; CHO,
carbohydrate; FSANZ, Food Standards Australia
New Zealand; GI, glycaemic index; GL, glycaemic
load; g, grams; HEI-2010, Healthy Eating Index;
HEIFA-2013, Australian Healthy Eating Index; kJ,
kilojoules; kg, kilogram; m, meter; μg, micrograms;
NNPAS, National Nutrition and Physical Activity
Survey; SACN, Scientific Advisory Committee on
Nutrition; WHO, World Health Organisation.
content. However, there is no universally accepted definition for a wholegrain product [26],
and some products that feature a front-of-package wholegrain claim can include a range of
wholegrain and refined grain contents in conjunction with higher calories and added sugars
[21]. The GI metric has a physiological basis and may offer a simpler alternative to reading
nutrition information on packaging; however, there is controversy surrounding the effective-
ness of using GI to guide food choices [27, 28], as low GI foods may be high in fructose and/or
saturated fat (e.g. fruit muffin) and conversely, high GI foods may also be rich in micronutri-
ents (e.g. boiled potatoes eaten with skin) [1, 29]. Systematic reviews indicate the certainty of
evidence for a relationship between GI and GL metrics and cardiometabolic health is of very
low to low quality [1], while others found probable to convincing evidence for strength and
causality of relationships between GL and type 2 diabetes [30, 31]. The GI and GL metric may
not be readily available to manufacturers or consumers for labelling and decision purposes,
respectively. Therefore, due to the public health impact of CHO quality [1], the development
of an alternative metric to measure CHO quality, considering total CHO, dietary fiber, and
free sugars, is warranted.
Based on dietary recommendations and scientific evidence, three simplified ratios to
express a balanced CHO composition of foods have been previously developed [32]. A 10:1
ratio, of at least 1g of dietary fiber per 10g of total CHO, was developed based on the composi-
tion of whole wheat. The American Heart Association [33] has recommended the 10:1 ratio as
it has been linked to foods with higher dietary fiber and lower free sugars, sodium, and trans
fats, without increased energy [21], as well as decreased risk of type 2 diabetes in adults [34].
To further improve the 10:1 ratio, a 10:1:2 ratio, of at least 1 g of dietary fiber per 10g of CHO
and less than 2g of free sugars, was developed based on an interpretation of the WHO and Sci-
entific Advisory Committee on Nutrition guidelines [15, 32, 35, 36]. Finally, a 10:1 & 1:2 ratio,
of at least 1g of dietary fiber per 10g of CHO and per each 1g of dietary fiber less than 2g of
free sugars, limits free sugars intake based on dietary fiber content rather than total CHO was
also tested [32, 35]. These carbohydrate ratios were named the simple (10:1), modified (10:1:2)
and dual (10:1 & 1:2) ratios. Previous work has applied these ratios at the food product level
[32], and demonstrated that products that meet these ratios have higher nutritional quality
[32, 37]. No research has yet established if these ratios are associated with overall diet quality,
thereby reducing translation to public health and clinical practice.
Therefore, in pediatric and adult populations, the aims of this study were to: i) evaluate
whether a diet that meets one of three CHO ratios (simple ratio, modified ratio, dual ratio) is
associated with higher nutrient intakes and overall diet quality, and ii) model the impact of
substituting CHO foods that meet the proposed ratios in place of foods that do not. We
hypothesize that Australian diets that include a free sugars constraint [i.e., modified ratio(10:1:2) or dual ratio (10:1 and 1:2)] will report the most favorable improvements in diet qual-
ity compared to diets that do not satisfy these metrics.
Materials and methods
This study was reported according to the Strengthening the Reporting of Observational Stud-
ies in Epidemiology (STROBE) checklist for cross-sectional studies [38]. The interview compo-
nents of the survey were conducted under the Census and Statistics Act 1905; thus, ethics
approval was not required. Informed consent was sought from adults and parents/legal guard-
ians of children through completion of a written consent form. Individuals were approached
by mail explaining the study and how information would be kept confidential in accordance
with the Census and Statistics Act 1095. Individuals willing to participate completed informed
consent forms and kept a copy for their records.
PLOS ONE Balanced carbohydrate ratios improve diet quality
PLOS ONE | https://doi.org/10.1371/journal.pone.0253582 July 9, 2021 3 / 19

Survey methodology
This study was a secondary analysis of cross-sectional data collected in the 2011–12 National
Nutrition and Physical Activity Survey (NNPAS). The NNPAS is a nationally representative
survey carried out by the Australian Bureau of Statistics (ABS) that forms part of the 2011–
2013 Australian Health Survey [39]. Data were weighted to represent the Australian popula-
tion with weightings provided by the ABS. Detailed dietary information and physical activity
data were collected for the NNPAS during face-to-face interviews by trained interviewers. An
automated multiple-pass 24-hour dietary recall method was used to capture all foods and bev-
erages consumed by respondents within the 24 hours prior to the interview day. For children
aged 2–14 years, an adult was interviewed on the child’s behalf, although children aged 6–14
years were invited to also participate in the interview. Data were collected from 9,341 adults
aged 19 years and over, and 2,812 children aged 2–18 years who completed the dietary assess-
ment. Although approximately 65% participants were assessed for dietary intake on a subse-
quent day, to maximize the sample size and ensure it was nationally representative, this study
only used dietary intake data from the initial dietary intake assessment. Nutrient analysis was
performed using the survey specific 2011–13 Australian Food and Nutrient Database (AUS-
NUT) [40]. Further survey details including sampling methodology and response rates are
available in the Australian Health Survey: Users’ Guide, 2011–13 [41].
Carbohydrate quality ratios
Three CHO quality ratios were examined: the simple ratio was defined as at least 1g of dietary
fiber per 10g of CHOs; the modified ratio referred to at least 1g of dietary fiber and less than
2g of free sugars per 10g of CHOs; the dual ratio was at least 1g of dietary fiber per 10g of
CHOs and less than 2g of free sugars per 1g of dietary fiber. These ratios have been recently
tested at the food product level and validated as carbohydrate quality metrics [32]. Participants
were defined as having ‘satisfied’ or ‘not satisfied’ each ratio based on total daily nutrient
intakes.
Participant charactersitics
Participant characteristics used to describe the sample and interpret the findings included age,
sex, anthropometry, and socio-economic status. Physical measurements including weight and
height were measured for all respondents by trained interviewers during the face-to-face inter-
view. Interviewers used digital scales to measure weight (maximum 150kg) and a stadiometer
to measure height (maximum 210cm) [41]. Participants were encouraged to remove their
shoes and any heavy clothing (e.g. jackets) prior to being measured; however, this was volun-
tary and may not have occurred [41]. Physical measurements were taken once, with a random
sample of participants (10%) selected for repeat measurement to ensure the validity of data col-
lected [41]. For children, body mass index (BMI) z-score was calculated using the child’s age,
sex, height, and weight, and the WHO growth reference standards for 2–4 and 5-19-year-old
children [42]. The standard normal distribution was used to categorize children as: “recom-
mended weight” (<85%), “at risk for overweight” (�85% to<95%) or “overweight” (�95%)
[43]. For adults, BMI was calculated using the measured weight and height (kg/m2), and par-
ticipants were categorized according to their BMI as underweight (<18.5 kg/m2), recom-
mended weight (�18.5 kg/m2, <25 kg/m2), overweight (�25 kg/m2,<30 kg/m2), or obese
(�30 kg/m2) [44]. Socio-economic status was defined by the Socio-Economic Indexes for
Areas, a product by the ABS [45] which ranks areas in Australia into quintiles according to rel-
ative socio-economic advantage or disadvantage.
PLOS ONE Balanced carbohydrate ratios improve diet quality
PLOS ONE | https://doi.org/10.1371/journal.pone.0253582 July 9, 2021 4 / 19
Nutrient intakes
The macronutrients analyzed were energy, protein, total fat, saturated fat, monounsaturated
fat, polyunsaturated fat, total CHO, added sugars, free sugars, starch, and dietary fiber. Free
sugars were defined as added sugars plus the sugar component of honey and fruit juice, and
excluded the naturally occurring sugars in fruits, vegetables, and dairy [15]. The micronutri-
ents analyzed were iron, magnesium, folic acid, zinc, sodium, potassium, and vitamins B1, B2,
B3, B6, B12, and E. The other fat-soluble vitamins (A, K) were excluded as CHO-rich foods are
not known to be a source of these vitamins and vitamin D data were not available in food com-
position tables. Energy-standardized nutrient intakes were determined by calculating the daily
nutrient intake per 239 kcal (1000 kJ) of energy intake for each participant.
Healthy Eating Index for Australian adults
Overall diet quality for adults was quantified by the validated Healthy Eating Index for Austra-
lian Adults (HEIFA-2013) [17]. The HEIFA-2013 was modelled on the Healthy Eating Index
(HEI) [46] but modified for the Australian population to reflect the updated Dietary Guide-
lines for Australian Adults and the Australian Guide to Healthy Eating [47]. The HEIFA-2013
is calculated based on an 11-component system of five core food groups (vegetables, fruits,
grains, dairy and dairy alternatives, and meat and meat alternatives), three negative nutrients
(fats, added sugars, and sodium), water intake, and alcohol intake. The components also
included discretionary foods and beverages, which are those high in saturated fat and/or
added sugars, added salt, or alcohol [47].
The HEIFA-2013 was used to give Australian adults a score between 0 (worst diet quality)
and 100 (best diet quality). A score from 1 to 10 was allocated to the following nine compo-
nents: five core food groups, discretionary foods and beverages, and the negative nutrients sat-
urated fat, added sugar and sodium. A score from 0 to 5 was allocated to the two components
water and alcohol. Scores for each component corresponded to how close the respondent was
to the recommended number of servings based on their age and sex. HEIFA-2013 is not vali-
dated for use in children and adolescents and was therefore applied to those aged�18-years
only [17].
Substitution model
Diet modelling analyses were conducted to identify the impact of consuming carbohydrate-
rich foods that satisfy the CHO quality ratios on estimated nutrient intakes. Foods in the AUS-
NUT database were given unique 8-digit codes by the ABS, which are subdivided into major
(2-digit), sub-major (3-digit), and minor (5-digit) food groups. Only foods from the two
CHO-based major food groups were substituted: cereals and cereal products, and cereal based
products and dishes [40]. The ‘cereal and cereal products’ major food group included grains,
flours, bread and bread rolls, breakfast cereals, plain pasta, noodles and rice, while the ‘cereal
based products and dishes’ food group included biscuits, cakes, pastries, pies, dumplings,
pizza, hamburgers, hot dogs, and pasta and rice mixed dishes [40]. There were 1,241 CHO-
based foods consumed by survey participants, and each food was classified based on its nutri-
ent profile as either satisfying or not satisfying each of the three CHO quality ratios. For each
food that did not satisfy a ratio, the ‘closest’ food was substituted in the model. To determine
the closest food, food pairs were given a ‘closeness’ score from 1 to 3 as follows: if the pair of
foods were in the same minor (5-digit) food group the closeness score was 1; if they were in
the same sub-major (3-digit) food group but different minor group, the score was 2; if they
were in the same major (2-digit) food group but different sub-major food group, the score was
3. Where possible, foods that did not meet a ratio were substituted with foods that did which
PLOS ONE Balanced carbohydrate ratios improve diet quality
PLOS ONE | https://doi.org/10.1371/journal.pone.0253582 July 9, 2021 5 / 19

had a closeness score of 1. If there were no ‘1’s, a food with a closeness score of 2 was substi-
tuted, and if there were no ‘2’s a food with a score of 3 was substituted.
In cases with more than one ‘closest’ food, the substitution food was selected at random.
The randomness was weighted according to the popularity of the foods. For example, if there
were two foods (A and B) both with a closeness of 1, if eight participants in the NNPAS con-
sumed food A and four consumed food B, food A would have a 67% chance of being selected
and food B a 33% chance. The above substitutions were applied to all survey participants,
regardless of whether the participant satisfied the CHO quality ratio in their daily intake, i.e. if
a participant met the simple ratio but consumed a CHO-based cereal product that did not sat-
isfy the simple ratio, that product was still substituted in the model.
Statistical analyses
Prevalence of children and adults meeting each of the three CHO quality ratios was deter-
mined among the entire sample, and broken down by age group, sex, BMI category, and
socio-economic status. Mean and standard error of daily energy intake was calculated for
adults and children, as well as mean and standard error of energy-standardized nutrient
intakes (intake per 239 kcal [1000 kJ]). Mean and standard error of each component and the
total score of the HEIFA-2013 was determined for adults. The mean and standard error of
daily energy and nutrient intakes was calculated for the three substitution models among chil-
dren and adults.
Independent sample t-tests were used to interpret the differences between nutrient intakes
and HEIFA-2013 scores among those who did and did not meet each CHO quality ratio.
Paired sample t-tests were used to examine the differences between modelled and reported
data. Chi-squared tests were used to investigate association between categorical or ordinal vari-
ables. The statistical package IBM SPSS version 26.0 was used for all statistical analyses [48].
Due to the large sample size (n = 12,153) and the number of tests, p-values<0.001 were treated
as significant. All variables and data analyses performed were confirmed for accuracy by an
independent statistician.
Results
The ratio met by most participants was the simple ratio (50.2% of adults, 28.6% of children),
followed by the dual ratio (40.6% of adults, 21.7% of children), then the modified ratio (32.7%
of adults, 18.6% of children).
Carbohydrate quality ratios according to participant characteristics
Among adults, approximately 10% more females than males satisfied each ratio. In children,
girls also satisfied each ratio more than boys, but the difference between sexes was only 1 to 2%
(Table 1). More older adults satisfied each ratio than younger adults, where 40 to 64% of those
71+ year-olds met each ratio compared to only 22 to 36% of 19- to 30-year-olds. Among chil-
dren, more 2- to 3-year-olds (26 to 38%) met each ratio than 14- to 18-year-olds (13 to 23%).
There were no clinically relevant differences in those meeting the CHO ratios according to
BMI category for adults and children except for underweight adults in which 10–15% fewer
participants met each ratio (Table 1). Ratio adherence was greatest for adults and children in
the highest quintile for socio-economic status (Table 1). Having an adult health condition
(e.g., high cholesterol, hypertension and diabetes) was associated with achieving the simple
ratio (p<0.001 for all), while having high cholesterol or hypertension was associated with
achieving the modified ratio (p<0.001 for all). More adults and children met each CHO ratio
PLOS ONE Balanced carbohydrate ratios improve diet quality
PLOS ONE | https://doi.org/10.1371/journal.pone.0253582 July 9, 2021 6 / 19
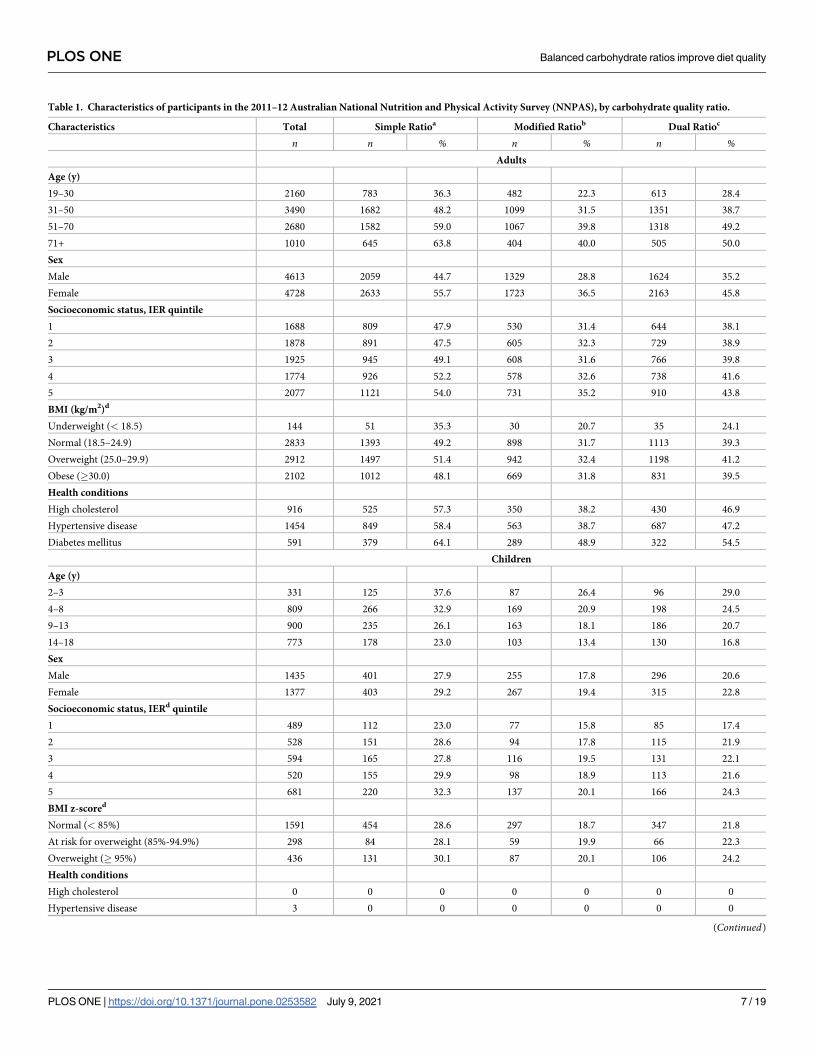
Table 1. Characteristics of participants in the 2011–12 Australian National Nutrition and Physical Activity Survey (NNPAS), by carbohydrate quality ratio.
Characteristics Total Simple Ratioa Modified Ratiob Dual Ratioc
n n % n % n %Adults
Age (y)
19–30 2160 783 36.3 482 22.3 613 28.4
31–50 3490 1682 48.2 1099 31.5 1351 38.7
51–70 2680 1582 59.0 1067 39.8 1318 49.2
71+ 1010 645 63.8 404 40.0 505 50.0
Sex
Male 4613 2059 44.7 1329 28.8 1624 35.2
Female 4728 2633 55.7 1723 36.5 2163 45.8
Socioeconomic status, IER quintile
1 1688 809 47.9 530 31.4 644 38.1
2 1878 891 47.5 605 32.3 729 38.9
3 1925 945 49.1 608 31.6 766 39.8
4 1774 926 52.2 578 32.6 738 41.6
5 2077 1121 54.0 731 35.2 910 43.8
BMI (kg/m2)d
Underweight (< 18.5) 144 51 35.3 30 20.7 35 24.1
Normal (18.5–24.9) 2833 1393 49.2 898 31.7 1113 39.3
Overweight (25.0–29.9) 2912 1497 51.4 942 32.4 1198 41.2
Obese (�30.0) 2102 1012 48.1 669 31.8 831 39.5
Health conditions
High cholesterol 916 525 57.3 350 38.2 430 46.9
Hypertensive disease 1454 849 58.4 563 38.7 687 47.2
Diabetes mellitus 591 379 64.1 289 48.9 322 54.5
Children
Age (y)
2–3 331 125 37.6 87 26.4 96 29.0
4–8 809 266 32.9 169 20.9 198 24.5
9–13 900 235 26.1 163 18.1 186 20.7
14–18 773 178 23.0 103 13.4 130 16.8
Sex
Male 1435 401 27.9 255 17.8 296 20.6
Female 1377 403 29.2 267 19.4 315 22.8
Socioeconomic status, IERd quintile
1 489 112 23.0 77 15.8 85 17.4
2 528 151 28.6 94 17.8 115 21.9
3 594 165 27.8 116 19.5 131 22.1
4 520 155 29.9 98 18.9 113 21.6
5 681 220 32.3 137 20.1 166 24.3
BMI z-scored
Normal (< 85%) 1591 454 28.6 297 18.7 347 21.8
At risk for overweight (85%-94.9%) 298 84 28.1 59 19.9 66 22.3
Overweight (� 95%) 436 131 30.1 87 20.1 106 24.2
Health conditions
High cholesterol 0 0 0 0 0 0 0
Hypertensive disease 3 0 0 0 0 0 0
(Continued)
PLOS ONE Balanced carbohydrate ratios improve diet quality
PLOS ONE | https://doi.org/10.1371/journal.pone.0253582 July 9, 2021 7 / 19
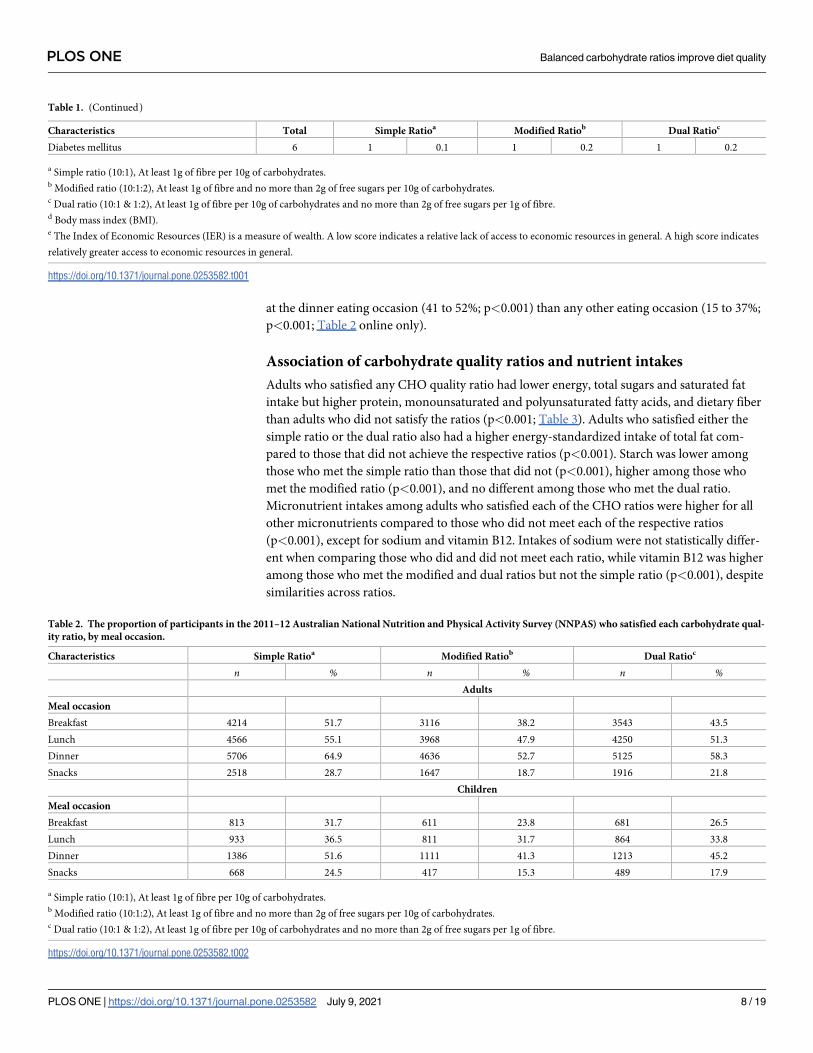
at the dinner eating occasion (41 to 52%; p<0.001) than any other eating occasion (15 to 37%;
p<0.001; Table 2 online only).
Association of carbohydrate quality ratios and nutrient intakes
Adults who satisfied any CHO quality ratio had lower energy, total sugars and saturated fat
intake but higher protein, monounsaturated and polyunsaturated fatty acids, and dietary fiber
than adults who did not satisfy the ratios (p<0.001; Table 3). Adults who satisfied either the
simple ratio or the dual ratio also had a higher energy-standardized intake of total fat com-
pared to those that did not achieve the respective ratios (p<0.001). Starch was lower among
those who met the simple ratio than those that did not (p<0.001), higher among those who
met the modified ratio (p<0.001), and no different among those who met the dual ratio.
Micronutrient intakes among adults who satisfied each of the CHO ratios were higher for all
other micronutrients compared to those who did not meet each of the respective ratios
(p<0.001), except for sodium and vitamin B12. Intakes of sodium were not statistically differ-
ent when comparing those who did and did not meet each ratio, while vitamin B12 was higher
among those who met the modified and dual ratios but not the simple ratio (p<0.001), despite
similarities across ratios.
Table 1. (Continued)
Characteristics Total Simple Ratioa Modified Ratiob Dual Ratioc
Diabetes mellitus 6 1 0.1 1 0.2 1 0.2
a Simple ratio (10:1), At least 1g of fibre per 10g of carbohydrates.b Modified ratio (10:1:2), At least 1g of fibre and no more than 2g of free sugars per 10g of carbohydrates.c Dual ratio (10:1 & 1:2), At least 1g of fibre per 10g of carbohydrates and no more than 2g of free sugars per 1g of fibre.d Body mass index (BMI).e The Index of Economic Resources (IER) is a measure of wealth. A low score indicates a relative lack of access to economic resources in general. A high score indicates
relatively greater access to economic resources in general.
https://doi.org/10.1371/journal.pone.0253582.t001
Table 2. The proportion of participants in the 2011–12 Australian National Nutrition and Physical Activity Survey (NNPAS) who satisfied each carbohydrate qual-
ity ratio, by meal occasion.
Characteristics Simple Ratioa Modified Ratiob Dual Ratioc
n % n % n %Adults
Meal occasion
Breakfast 4214 51.7 3116 38.2 3543 43.5
Lunch 4566 55.1 3968 47.9 4250 51.3
Dinner 5706 64.9 4636 52.7 5125 58.3
Snacks 2518 28.7 1647 18.7 1916 21.8
Children
Meal occasion
Breakfast 813 31.7 611 23.8 681 26.5
Lunch 933 36.5 811 31.7 864 33.8
Dinner 1386 51.6 1111 41.3 1213 45.2
Snacks 668 24.5 417 15.3 489 17.9
a Simple ratio (10:1), At least 1g of fibre per 10g of carbohydrates.b Modified ratio (10:1:2), At least 1g of fibre and no more than 2g of free sugars per 10g of carbohydrates.c Dual ratio (10:1 & 1:2), At least 1g of fibre per 10g of carbohydrates and no more than 2g of free sugars per 1g of fibre.
https://doi.org/10.1371/journal.pone.0253582.t002
PLOS ONE Balanced carbohydrate ratios improve diet quality
PLOS ONE | https://doi.org/10.1371/journal.pone.0253582 July 9, 2021 8 / 19
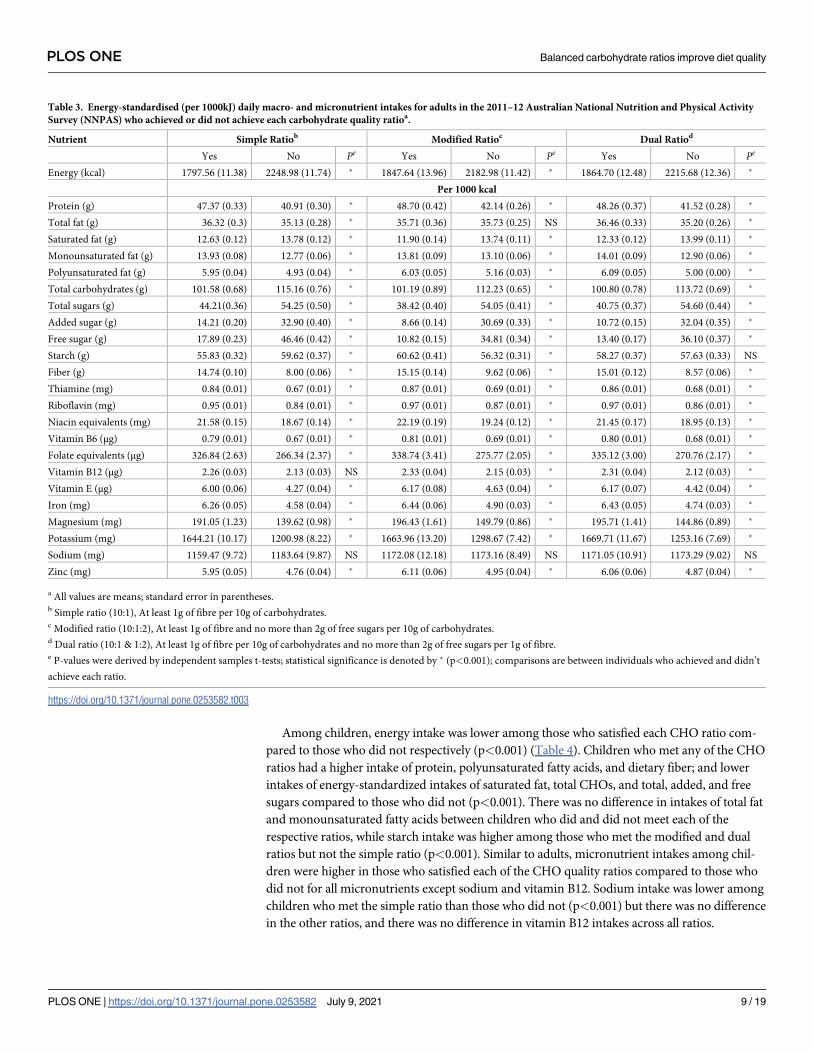
Among children, energy intake was lower among those who satisfied each CHO ratio com-
pared to those who did not respectively (p<0.001) (Table 4). Children who met any of the CHO
ratios had a higher intake of protein, polyunsaturated fatty acids, and dietary fiber; and lower
intakes of energy-standardized intakes of saturated fat, total CHOs, and total, added, and free
sugars compared to those who did not (p<0.001). There was no difference in intakes of total fat
and monounsaturated fatty acids between children who did and did not meet each of the
respective ratios, while starch intake was higher among those who met the modified and dual
ratios but not the simple ratio (p<0.001). Similar to adults, micronutrient intakes among chil-
dren were higher in those who satisfied each of the CHO quality ratios compared to those who
did not for all micronutrients except sodium and vitamin B12. Sodium intake was lower among
children who met the simple ratio than those who did not (p<0.001) but there was no difference
in the other ratios, and there was no difference in vitamin B12 intakes across all ratios.
Table 3. Energy-standardised (per 1000kJ) daily macro- and micronutrient intakes for adults in the 2011–12 Australian National Nutrition and Physical Activity
Survey (NNPAS) who achieved or did not achieve each carbohydrate quality ratioa.
Nutrient Simple Ratiob Modified Ratioc Dual Ratiod
Yes No Pe Yes No Pe Yes No Pe
Energy (kcal) 1797.56 (11.38) 2248.98 (11.74) � 1847.64 (13.96) 2182.98 (11.42) � 1864.70 (12.48) 2215.68 (12.36) �
Per 1000 kcal
Protein (g) 47.37 (0.33) 40.91 (0.30) � 48.70 (0.42) 42.14 (0.26) � 48.26 (0.37) 41.52 (0.28) �
Total fat (g) 36.32 (0.3) 35.13 (0.28) � 35.71 (0.36) 35.73 (0.25) NS 36.46 (0.33) 35.20 (0.26) �
Saturated fat (g) 12.63 (0.12) 13.78 (0.12) � 11.90 (0.14) 13.74 (0.11) � 12.33 (0.12) 13.99 (0.11) �
Monounsaturated fat (g) 13.93 (0.08) 12.77 (0.06) � 13.81 (0.09) 13.10 (0.06) � 14.01 (0.09) 12.90 (0.06) �
Polyunsaturated fat (g) 5.95 (0.04) 4.93 (0.04) � 6.03 (0.05) 5.16 (0.03) � 6.09 (0.05) 5.00 (0.00) �
Total carbohydrates (g) 101.58 (0.68) 115.16 (0.76) � 101.19 (0.89) 112.23 (0.65) � 100.80 (0.78) 113.72 (0.69) �
Total sugars (g) 44.21(0.36) 54.25 (0.50) � 38.42 (0.40) 54.05 (0.41) � 40.75 (0.37) 54.60 (0.44) �
Added sugar (g) 14.21 (0.20) 32.90 (0.40) � 8.66 (0.14) 30.69 (0.33) � 10.72 (0.15) 32.04 (0.35) �
Free sugar (g) 17.89 (0.23) 46.46 (0.42) � 10.82 (0.15) 34.81 (0.34) � 13.40 (0.17) 36.10 (0.37) �
Starch (g) 55.83 (0.32) 59.62 (0.37) � 60.62 (0.41) 56.32 (0.31) � 58.27 (0.37) 57.63 (0.33) NS
Fiber (g) 14.74 (0.10) 8.00 (0.06) � 15.15 (0.14) 9.62 (0.06) � 15.01 (0.12) 8.57 (0.06) �
Thiamine (mg) 0.84 (0.01) 0.67 (0.01) � 0.87 (0.01) 0.69 (0.01) � 0.86 (0.01) 0.68 (0.01) �
Riboflavin (mg) 0.95 (0.01) 0.84 (0.01) � 0.97 (0.01) 0.87 (0.01) � 0.97 (0.01) 0.86 (0.01) �
Niacin equivalents (mg) 21.58 (0.15) 18.67 (0.14) � 22.19 (0.19) 19.24 (0.12) � 21.45 (0.17) 18.95 (0.13) �
Vitamin B6 (μg) 0.79 (0.01) 0.67 (0.01) � 0.81 (0.01) 0.69 (0.01) � 0.80 (0.01) 0.68 (0.01) �
Folate equivalents (μg) 326.84 (2.63) 266.34 (2.37) � 338.74 (3.41) 275.77 (2.05) � 335.12 (3.00) 270.76 (2.17) �
Vitamin B12 (μg) 2.26 (0.03) 2.13 (0.03) NS 2.33 (0.04) 2.15 (0.03) � 2.31 (0.04) 2.12 (0.03) �
Vitamin E (μg) 6.00 (0.06) 4.27 (0.04) � 6.17 (0.08) 4.63 (0.04) � 6.17 (0.07) 4.42 (0.04) �
Iron (mg) 6.26 (0.05) 4.58 (0.04) � 6.44 (0.06) 4.90 (0.03) � 6.43 (0.05) 4.74 (0.03) �
Magnesium (mg) 191.05 (1.23) 139.62 (0.98) � 196.43 (1.61) 149.79 (0.86) � 195.71 (1.41) 144.86 (0.89) �
Potassium (mg) 1644.21 (10.17) 1200.98 (8.22) � 1663.96 (13.20) 1298.67 (7.42) � 1669.71 (11.67) 1253.16 (7.69) �
Sodium (mg) 1159.47 (9.72) 1183.64 (9.87) NS 1172.08 (12.18) 1173.16 (8.49) NS 1171.05 (10.91) 1173.29 (9.02) NS
Zinc (mg) 5.95 (0.05) 4.76 (0.04) � 6.11 (0.06) 4.95 (0.04) � 6.06 (0.06) 4.87 (0.04) �
a All values are means; standard error in parentheses.b Simple ratio (10:1), At least 1g of fibre per 10g of carbohydrates.c Modified ratio (10:1:2), At least 1g of fibre and no more than 2g of free sugars per 10g of carbohydrates.d Dual ratio (10:1 & 1:2), At least 1g of fibre per 10g of carbohydrates and no more than 2g of free sugars per 1g of fibre.e P-values were derived by independent samples t-tests; statistical significance is denoted by � (p<0.001); comparisons are between individuals who achieved and didn’t
achieve each ratio.
https://doi.org/10.1371/journal.pone.0253582.t003
PLOS ONE Balanced carbohydrate ratios improve diet quality
PLOS ONE | https://doi.org/10.1371/journal.pone.0253582 July 9, 2021 9 / 19
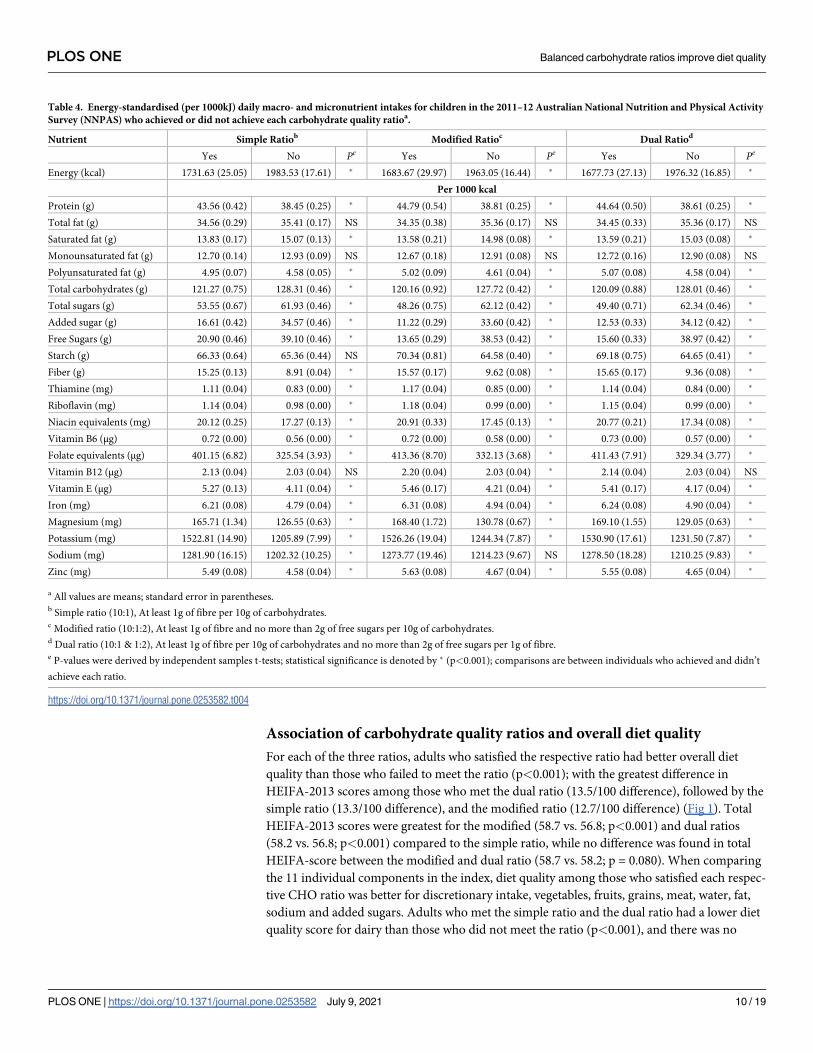
Association of carbohydrate quality ratios and overall diet quality
For each of the three ratios, adults who satisfied the respective ratio had better overall diet
quality than those who failed to meet the ratio (p<0.001); with the greatest difference in
HEIFA-2013 scores among those who met the dual ratio (13.5/100 difference), followed by the
simple ratio (13.3/100 difference), and the modified ratio (12.7/100 difference) (Fig 1). Total
HEIFA-2013 scores were greatest for the modified (58.7 vs. 56.8; p<0.001) and dual ratios
(58.2 vs. 56.8; p<0.001) compared to the simple ratio, while no difference was found in total
HEIFA-score between the modified and dual ratio (58.7 vs. 58.2; p = 0.080). When comparing
the 11 individual components in the index, diet quality among those who satisfied each respec-
tive CHO ratio was better for discretionary intake, vegetables, fruits, grains, meat, water, fat,
sodium and added sugars. Adults who met the simple ratio and the dual ratio had a lower diet
quality score for dairy than those who did not meet the ratio (p<0.001), and there was no
Table 4. Energy-standardised (per 1000kJ) daily macro- and micronutrient intakes for children in the 2011–12 Australian National Nutrition and Physical Activity
Survey (NNPAS) who achieved or did not achieve each carbohydrate quality ratioa.
Nutrient Simple Ratiob Modified Ratioc Dual Ratiod
Yes No Pe Yes No Pe Yes No Pe
Energy (kcal) 1731.63 (25.05) 1983.53 (17.61) � 1683.67 (29.97) 1963.05 (16.44) � 1677.73 (27.13) 1976.32 (16.85) �
Per 1000 kcal
Protein (g) 43.56 (0.42) 38.45 (0.25) � 44.79 (0.54) 38.81 (0.25) � 44.64 (0.50) 38.61 (0.25) �
Total fat (g) 34.56 (0.29) 35.41 (0.17) NS 34.35 (0.38) 35.36 (0.17) NS 34.45 (0.33) 35.36 (0.17) NS
Saturated fat (g) 13.83 (0.17) 15.07 (0.13) � 13.58 (0.21) 14.98 (0.08) � 13.59 (0.21) 15.03 (0.08) �
Monounsaturated fat (g) 12.70 (0.14) 12.93 (0.09) NS 12.67 (0.18) 12.91 (0.08) NS 12.72 (0.16) 12.90 (0.08) NS
Polyunsaturated fat (g) 4.95 (0.07) 4.58 (0.05) � 5.02 (0.09) 4.61 (0.04) � 5.07 (0.08) 4.58 (0.04) �
Total carbohydrates (g) 121.27 (0.75) 128.31 (0.46) � 120.16 (0.92) 127.72 (0.42) � 120.09 (0.88) 128.01 (0.46) �
Total sugars (g) 53.55 (0.67) 61.93 (0.46) � 48.26 (0.75) 62.12 (0.42) � 49.40 (0.71) 62.34 (0.46) �
Added sugar (g) 16.61 (0.42) 34.57 (0.46) � 11.22 (0.29) 33.60 (0.42) � 12.53 (0.33) 34.12 (0.42) �
Free Sugars (g) 20.90 (0.46) 39.10 (0.46) � 13.65 (0.29) 38.53 (0.42) � 15.60 (0.33) 38.97 (0.42) �
Starch (g) 66.33 (0.64) 65.36 (0.44) NS 70.34 (0.81) 64.58 (0.40) � 69.18 (0.75) 64.65 (0.41) �
Fiber (g) 15.25 (0.13) 8.91 (0.04) � 15.57 (0.17) 9.62 (0.08) � 15.65 (0.17) 9.36 (0.08) �
Thiamine (mg) 1.11 (0.04) 0.83 (0.00) � 1.17 (0.04) 0.85 (0.00) � 1.14 (0.04) 0.84 (0.00) �
Riboflavin (mg) 1.14 (0.04) 0.98 (0.00) � 1.18 (0.04) 0.99 (0.00) � 1.15 (0.04) 0.99 (0.00) �
Niacin equivalents (mg) 20.12 (0.25) 17.27 (0.13) � 20.91 (0.33) 17.45 (0.13) � 20.77 (0.21) 17.34 (0.08) �
Vitamin B6 (μg) 0.72 (0.00) 0.56 (0.00) � 0.72 (0.00) 0.58 (0.00) � 0.73 (0.00) 0.57 (0.00) �
Folate equivalents (μg) 401.15 (6.82) 325.54 (3.93) � 413.36 (8.70) 332.13 (3.68) � 411.43 (7.91) 329.34 (3.77) �
Vitamin B12 (μg) 2.13 (0.04) 2.03 (0.04) NS 2.20 (0.04) 2.03 (0.04) � 2.14 (0.04) 2.03 (0.04) NS
Vitamin E (μg) 5.27 (0.13) 4.11 (0.04) � 5.46 (0.17) 4.21 (0.04) � 5.41 (0.17) 4.17 (0.04) �
Iron (mg) 6.21 (0.08) 4.79 (0.04) � 6.31 (0.08) 4.94 (0.04) � 6.24 (0.08) 4.90 (0.04) �
Magnesium (mg) 165.71 (1.34) 126.55 (0.63) � 168.40 (1.72) 130.78 (0.67) � 169.10 (1.55) 129.05 (0.63) �
Potassium (mg) 1522.81 (14.90) 1205.89 (7.99) � 1526.26 (19.04) 1244.34 (7.87) � 1530.90 (17.61) 1231.50 (7.87) �
Sodium (mg) 1281.90 (16.15) 1202.32 (10.25) � 1273.77 (19.46) 1214.23 (9.67) NS 1278.50 (18.28) 1210.25 (9.83) �
Zinc (mg) 5.49 (0.08) 4.58 (0.04) � 5.63 (0.08) 4.67 (0.04) � 5.55 (0.08) 4.65 (0.04) �
a All values are means; standard error in parentheses.b Simple ratio (10:1), At least 1g of fibre per 10g of carbohydrates.c Modified ratio (10:1:2), At least 1g of fibre and no more than 2g of free sugars per 10g of carbohydrates.d Dual ratio (10:1 & 1:2), At least 1g of fibre per 10g of carbohydrates and no more than 2g of free sugars per 1g of fibre.e P-values were derived by independent samples t-tests; statistical significance is denoted by � (p<0.001); comparisons are between individuals who achieved and didn’t
achieve each ratio.
https://doi.org/10.1371/journal.pone.0253582.t004
PLOS ONE Balanced carbohydrate ratios improve diet quality
PLOS ONE | https://doi.org/10.1371/journal.pone.0253582 July 9, 2021 10 / 19

difference in dairy diet quality between those who did and did not meet the modified ratio.
There was no difference in the alcohol diet quality across all CHO ratios.
Effect of substitution dietary modelling on nutrient intake
When CHO-based cereal products that did not meet each ratio were substituted by similar
foods that did, energy, protein, total fat, monounsaturated and polyunsaturated fatty acids,
and dietary fiber intake among adults increased for all ratios, while total carbohydrates
decreased for all ratios (p<0.001 for all) (Table 5). Saturated fat increased with substitution in
the simple ratio model (p<0.001), decreased in the dual ratio model (p<0.001), and remained
unchanged in the modified ratio. Total CHOs, added and free sugars, and starch decreased
with substitution for all three models (p<0.001), while total sugars also decreased for the mod-
ified and dual ratio models (p<0.001) but did not change in the simple ratio model. Sodium
and vitamin B12 decreased and other micronutrients increased in all three ratio models
(p<0.001), except for folate and vitamin E. Folate decreased with substitution in the simple
and modified ratios (p<0.001), and intakes of vitamin E increased in the simple and dual ratio
models (p<0.001).
Fig 1. Healthy Eating Index for Australian adults (HEIFA-2013) 11 component scores and total score for adults in
the 2011–2012 Australian National Nutrition and Physical Activity Survey (NNPAS) who achieved or did not
achieve each carbohydrate quality ratio. (A) Simple ratio (10:1), at least 1g of fiber per 10g of carbohydrates; (B)
Modified ratio (10:1:2), at least 1g of fiber and no more than 2g of free sugars per 10g of carbohydrates; (C) Dual ratio
(10:1 & 1:2), at least 1g of fiber per 10g of carbohydrates and no more than 2g of free sugars per 1g of fiber; and (D)
HEIFA-2013 total scores. ��� P<0.001 compared to adults who did not achieve the ratio, derived by independent
samples t-tests.
https://doi.org/10.1371/journal.pone.0253582.g001
PLOS ONE Balanced carbohydrate ratios improve diet quality
PLOS ONE | https://doi.org/10.1371/journal.pone.0253582 July 9, 2021 11 / 19
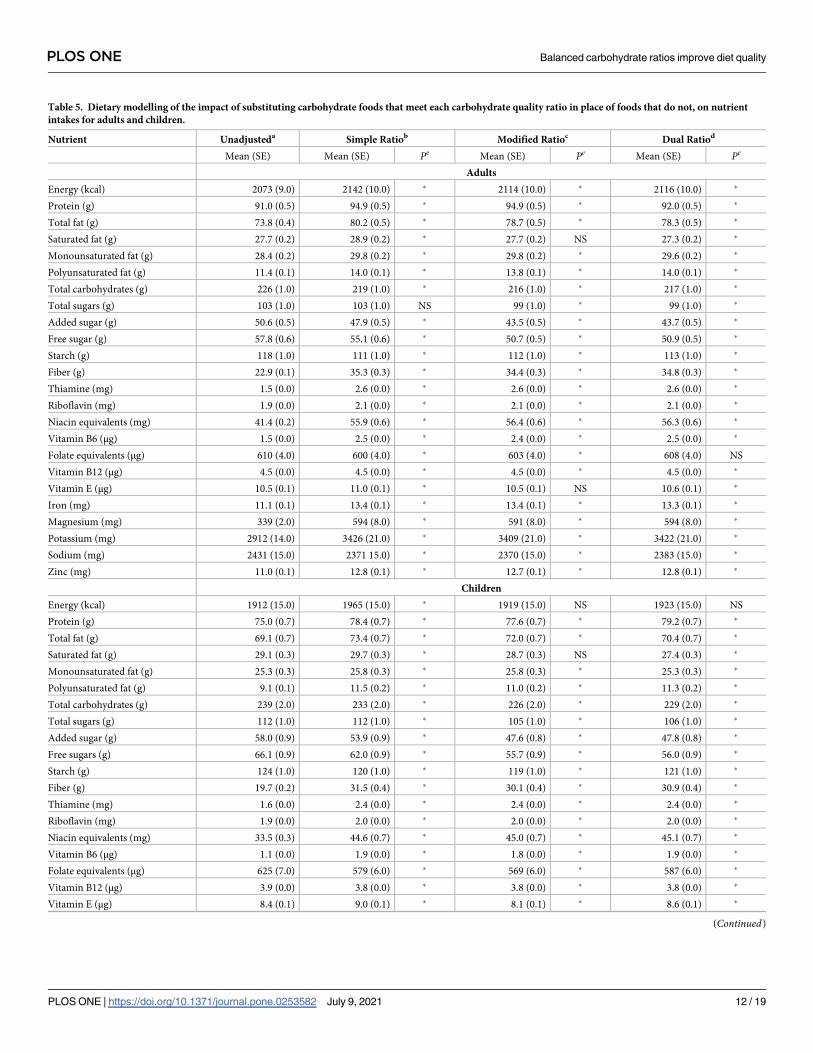
Table 5. Dietary modelling of the impact of substituting carbohydrate foods that meet each carbohydrate quality ratio in place of foods that do not, on nutrient
intakes for adults and children.
Nutrient Unadjusteda Simple Ratiob Modified Ratioc Dual Ratiod
Mean (SE) Mean (SE) Pe Mean (SE) Pe Mean (SE) Pe
Adults
Energy (kcal) 2073 (9.0) 2142 (10.0) � 2114 (10.0) � 2116 (10.0) �
Protein (g) 91.0 (0.5) 94.9 (0.5) � 94.9 (0.5) � 92.0 (0.5) �
Total fat (g) 73.8 (0.4) 80.2 (0.5) � 78.7 (0.5) � 78.3 (0.5) �
Saturated fat (g) 27.7 (0.2) 28.9 (0.2) � 27.7 (0.2) NS 27.3 (0.2) �
Monounsaturated fat (g) 28.4 (0.2) 29.8 (0.2) � 29.8 (0.2) � 29.6 (0.2) �
Polyunsaturated fat (g) 11.4 (0.1) 14.0 (0.1) � 13.8 (0.1) � 14.0 (0.1) �
Total carbohydrates (g) 226 (1.0) 219 (1.0) � 216 (1.0) � 217 (1.0) �
Total sugars (g) 103 (1.0) 103 (1.0) NS 99 (1.0) � 99 (1.0) �
Added sugar (g) 50.6 (0.5) 47.9 (0.5) � 43.5 (0.5) � 43.7 (0.5) �
Free sugar (g) 57.8 (0.6) 55.1 (0.6) � 50.7 (0.5) � 50.9 (0.5) �
Starch (g) 118 (1.0) 111 (1.0) � 112 (1.0) � 113 (1.0) �
Fiber (g) 22.9 (0.1) 35.3 (0.3) � 34.4 (0.3) � 34.8 (0.3) �
Thiamine (mg) 1.5 (0.0) 2.6 (0.0) � 2.6 (0.0) � 2.6 (0.0) �
Riboflavin (mg) 1.9 (0.0) 2.1 (0.0) � 2.1 (0.0) � 2.1 (0.0) �
Niacin equivalents (mg) 41.4 (0.2) 55.9 (0.6) � 56.4 (0.6) � 56.3 (0.6) �
Vitamin B6 (μg) 1.5 (0.0) 2.5 (0.0) � 2.4 (0.0) � 2.5 (0.0) �
Folate equivalents (μg) 610 (4.0) 600 (4.0) � 603 (4.0) � 608 (4.0) NS
Vitamin B12 (μg) 4.5 (0.0) 4.5 (0.0) � 4.5 (0.0) � 4.5 (0.0) �
Vitamin E (μg) 10.5 (0.1) 11.0 (0.1) � 10.5 (0.1) NS 10.6 (0.1) �
Iron (mg) 11.1 (0.1) 13.4 (0.1) � 13.4 (0.1) � 13.3 (0.1) �
Magnesium (mg) 339 (2.0) 594 (8.0) � 591 (8.0) � 594 (8.0) �
Potassium (mg) 2912 (14.0) 3426 (21.0) � 3409 (21.0) � 3422 (21.0) �
Sodium (mg) 2431 (15.0) 2371 15.0) � 2370 (15.0) � 2383 (15.0) �
Zinc (mg) 11.0 (0.1) 12.8 (0.1) � 12.7 (0.1) � 12.8 (0.1) �
Children
Energy (kcal) 1912 (15.0) 1965 (15.0) � 1919 (15.0) NS 1923 (15.0) NS
Protein (g) 75.0 (0.7) 78.4 (0.7) � 77.6 (0.7) � 79.2 (0.7) �
Total fat (g) 69.1 (0.7) 73.4 (0.7) � 72.0 (0.7) � 70.4 (0.7) �
Saturated fat (g) 29.1 (0.3) 29.7 (0.3) � 28.7 (0.3) NS 27.4 (0.3) �
Monounsaturated fat (g) 25.3 (0.3) 25.8 (0.3) � 25.8 (0.3) � 25.3 (0.3) �
Polyunsaturated fat (g) 9.1 (0.1) 11.5 (0.2) � 11.0 (0.2) � 11.3 (0.2) �
Total carbohydrates (g) 239 (2.0) 233 (2.0) � 226 (2.0) � 229 (2.0) �
Total sugars (g) 112 (1.0) 112 (1.0) � 105 (1.0) � 106 (1.0) �
Added sugar (g) 58.0 (0.9) 53.9 (0.9) � 47.6 (0.8) � 47.8 (0.8) �
Free sugars (g) 66.1 (0.9) 62.0 (0.9) � 55.7 (0.9) � 56.0 (0.9) �
Starch (g) 124 (1.0) 120 (1.0) � 119 (1.0) � 121 (1.0) �
Fiber (g) 19.7 (0.2) 31.5 (0.4) � 30.1 (0.4) � 30.9 (0.4) �
Thiamine (mg) 1.6 (0.0) 2.4 (0.0) � 2.4 (0.0) � 2.4 (0.0) �
Riboflavin (mg) 1.9 (0.0) 2.0 (0.0) � 2.0 (0.0) � 2.0 (0.0) �
Niacin equivalents (mg) 33.5 (0.3) 44.6 (0.7) � 45.0 (0.7) � 45.1 (0.7) �
Vitamin B6 (μg) 1.1 (0.0) 1.9 (0.0) � 1.8 (0.0) � 1.9 (0.0) �
Folate equivalents (μg) 625 (7.0) 579 (6.0) � 569 (6.0) � 587 (6.0) �
Vitamin B12 (μg) 3.9 (0.0) 3.8 (0.0) � 3.8 (0.0) � 3.8 (0.0) �
Vitamin E (μg) 8.4 (0.1) 9.0 (0.1) � 8.1 (0.1) � 8.6 (0.1) �
(Continued)
PLOS ONE Balanced carbohydrate ratios improve diet quality
PLOS ONE | https://doi.org/10.1371/journal.pone.0253582 July 9, 2021 12 / 19

Among children, energy intake increased with substitution according to the simple ratio
model (p<0.001) but remained unchanged in the modified and dual ratio models (Table 5).
Intakes of protein, total fat, polyunsaturated fatty acids, and dietary fiber increased with substi-
tution, and intakes of CHOs, starch, total, added, and free sugars decreased in all three models
(p<0.001). Saturated fat intake increased with substitution in the simple ratio model and
decreased in the dual ratio model (p<0.001), while intake of monounsaturated fatty acids
increased in the simple and modified models but decreased in the dual model (p<0.001). Die-
tary intakes of folate, vitamin B12, and sodium decreased, and other micronutrients increased
with substitution among children across all three ratio models (p<0.001), except for vitamin
E. Vitamin E increased in the simple and dual ratios and decreased in the modified ratio
model (p<0.001).
Discussion
This is the first study to examine if diets that satisfy CHO quality ratios are associated with
higher nutrient intake and diet quality. Results indicate that meeting a CHO quality ratio was
associated with lower energy intake and higher nutrient composition and, for adults, overall
diet quality, with the addition of a free sugars constraint in the dual ratio providing the greatest
improvements. Dietary modelling to substitute CHO-based foods to meet each ratio further
resulted in higher nutrient intakes, even among participants who originally met the ratios
based on total daily nutrient intakes. Currently, only the simple ratio has been associated with
health outcomes and for the utility in identifying the most healthful food products for food
labelling purposes [21, 34].
This study found that CHO quality in the Australian diet is poor;�50% of adults and
<30% of children met the CHO quality ratios, aligning with previous findings which have
reported the general Australian population does not adhere to dietary guidelines [49–51].
While it is possible that dietary intakes have changed since 2011–12, research indicates that
diet quality remains poor [52, 53]. Dietary fiber intakes have been previously reported to be
well below the daily target of 25g to 30g as recommended in the Australia and New Zealand
Nutrient Reference Values (NRVs) at a median of 20.7g for adults and 18.2g for children in the
NNPAS [51, 54]. Further, free sugars intakes of Australians exceed the WHO guidelines of less
than 10% total energy (14.7% for adults, 14.9% for children) [15]. Findings confirm that Aus-
tralians need to improve their CHO quality and may do so by following a diet that meets a
Table 5. (Continued)
Nutrient Unadjusteda Simple Ratiob Modified Ratioc Dual Ratiod
Iron (mg) 9.7 (0.1) 11.8 (0.1) � 11.6 (0.1) � 11.6 (0.1) �
Magnesium (mg) 255 (2.0) 459 (10.0) � 456 (10.0) � 461 (10.0) �
Potassium (mg) 2403 (20.0) 2830 (28.0) � 2806 (28.0) � 2828 (28.0) �
Sodium (mg) 2313 (23.0) 2251 (23.0) � 2243 (23.0) � 2253 (23.0) �
Zinc (mg) 9.2 (0.1) 10.7 (0.1) � 10.4 (0.1) � 10.6 (0.1) �
a Daily nutrient intake for participants in the 2011–12 Australian National Nutrition and Physical Activity Survey (NNPAS).b Simple ratio (10:1), At least 1g of fibre per 10g of carbohydrates. Modelled data, carbohydrate foods were substituted with similar foods that satisfied the simple ratio.c Modified ratio (10:1:2), At least 1g of fibre and no more than 2g of free sugars per 10g of carbohydrates. Modelled data, carbohydrate foods were substituted with
similar foods that satisfied the modified ratio.d Dual ratio (10:1 & 1:2), At least 1g of fibre per 10g of carbohydrates and no more than 2g of free sugars per 1g of fibre.e P values were derived by paired samples t-tests; statistical significance is denoted by � (p<0.001). Modelled data, carbohydrate foods were substituted with similar
foods that satisfied the dual ratio.
https://doi.org/10.1371/journal.pone.0253582.t005
PLOS ONE Balanced carbohydrate ratios improve diet quality
PLOS ONE | https://doi.org/10.1371/journal.pone.0253582 July 9, 2021 13 / 19
CHO quality ratio metric, with the most favorable improvements achieved by utilizing a free
sugars constraint (i.e., the modified and dual ratios).
This study contributes novel research examining the association between CHO quality and
diet quality indices. Previous studies have focused on the association between GI or GL and
nutrient or food group intakes [55–59], where lower GI diets were associated with higher fruit
and dairy consumption [56, 60, 61] and higher GL was associated with poorer nutrient intakes
[56]. This study suggests that when diets satisfied a CHO quality ratio, improvements in diet
quality were largely driven by increased servings of fruit and vegetables and decreased servings
of discretionary foods and drinks, which resulted in improvements to added sugars, sodium
and fat. Although smaller improvements were also found for grains, meat and water. This find-
ing aligns with the global priority aimed at increasing fruit and vegetable consumption [62], as
research shows that discretionary foods often displace fruit and vegetable intakes [63].
Research has also reported that consuming wholegrain cereals in place of discretionary choices
can improve overall diet quality [64]. At the food product level, products that met the CHO
quality ratios had an improved nutritional profile (e.g. lower energy and higher micronutri-
ents) and were more likely to meet the required thresholds for nutrient profiling systems in
the UK and Australia that are used to identify the healthfulness of a product, and to control
front-of-package labelling for packaged foods [32]. Therefore, a CHO quality ratio, based on
CHO, dietary fiber and free sugars, may provide a simple, standardized approach to meet this
global priority to improve diet quality.
It was interesting that the substitution dietary modelling did not improve intakes of folate
and vitamin B12. The lack of improvement for folate may be explained by differences in the
fortification of food products. In Australia, wheat has mandatory folic acid fortification, but
fortification levels are lower in whole meal and multigrain bread varieties, compared with
refined bread [65]. Although not mandatory, many processed cereal-foods (i.e. breakfast cere-
als and bread products made from other cereal flour) are also fortified with folic acid [65, 66],
but other CHO rich foods, such as oats, fruit, and some vegetables, are not. There is no intrin-
sic reason to fortify only highly refined grains, and these and prior findings suggest that, as
industry and consumers turn toward healthier whole grain products, fortification strategies
should be reconsidered to also include these healthier grain products. The lack of improve-
ment for vitamin B12 may be due to a reduction in cereal-based products and dishes contain-
ing ingredients derived from animals (e.g. pizza, lasagna, biscuits, cakes) as well as limitations
placed on vitamin B12 fortification in Australia [67]. Therefore, examination of these ratios in
other countries is of interest, such as the United States where foods are extensively fortified
with vitamin B12 [67].
There is currently no consensus regarding the most reliable measure of CHO quality. All
measures have their strengths and limitations [68]. Findings from a series of systematic reviews
and meta-analyses have reported the benefits of low GI or GL diets on human health [1, 30,
31]; however in meta-analyses of prospective studies and clinical trials, effect sizes were modest
compared to the protective effects of total dietary fiber or wholegrains [1]. Alternatively, in
global dose-response meta-analyses of prospective studies, a positive association between both
GI and GL were found with increasing incidence of type 2 diabetes [30, 69]. The GI response
of a food may change based on ethnicity [70, 71], and large variations can be reported within
and between laboratories [72]. CHO quality ratios present an alternative metric that are not
influenced by any variability in individual response and have been reported as reliable metrics
to identify food products with improved nutritional profile [32]. Substantial evidence further
supports the harmful effects of high free sugar intake on health [15], thus reducing consump-
tion of free sugars is highly recommended. Following a CHO quality ratio will also likely
reduce exposure to ultra-processed foods (typically high in energy, salt, sugar and fat), which
PLOS ONE Balanced carbohydrate ratios improve diet quality
PLOS ONE | https://doi.org/10.1371/journal.pone.0253582 July 9, 2021 14 / 19
may be causally linked to poor health [73]. Considering current evidence, a CHO quality ratio
that combines two indicators of CHO quality (dietary fiber and free sugars) might prove more
useful as an overall measure of CHO quality than individual indices on their own.
Limitations of this study relate to its cross-sectional observational nature, which does not
allow causality to be inferred, as well as the use of single-day dietary intake data, which
decreases relevance to the usual dietary intake of participants. However, the use of one self-
reported 24-hour recall to measure dietary intake is strengthened by similarities in the daily
mean energy intake reported by women in this representative sample (7,402kJ/day) and the
mean daily energy intake reported by women in the Australian Longitudinal Study on Wom-
en’s Health, which used a more rigorous method of dietary intake reporting (7,521kJ/day)
[74]. Despite being cross-sectional and limited to the Australian context, the NNPAS provides
the best available population level nutrient data at this time and offers statistical power. The
generalizability of findings may be limited by the age of the data and impact of global events
such as COVID-19. Care should also be taken in extrapolating results from the substitution
CHO quality models, as these demonstrate proof of concept only and did not consider non-
cereal-based CHO rich foods. A complete substitution of all CHO-based foods that do not
meet a CHO quality ratio with similar foods that do may not be practical in a real-world
setting.
Individual CHO-based foods and their level of processing in the substitution modelling
were not examined. This was outside the scope for this study but would be an important next
step for future research to better interpret the findings. To translate the findings of this study
to public health policies and health proportion strategies, further research regarding the rela-
tionship between the modified and dual ratios on the health of children and adults is required.
Future research is also required to confirm the suitability of modified or dual ratios on product
labelling to help consumers and organizations quickly and accurately identify healthful CHO
products and the impact of this on improvement of overall diet quality.
Conclusions
All carbohydrate ratios were associated with higher diet quality, with a free sugars constraint
in the dual ratio providing the greatest improvements. Further research is required to deter-
mine if the utility of a CHO quality metric, based on CHO, dietary fiber, and possibly free sug-
ars offers a simple, standardized approach to measure and improve diet quality. Investigations
into the relationship between diets that satisfy a CHO quality ratio and the impact on health
outcomes as well as translation to public health policies and strategies is also warranted.
Author Contributions
Conceptualization: Tim Cassettari, Vanessa Campos, Kim-Anne Lê, Kaori Minehira, Flavia
Fayet-Moore.
Formal analysis: Andrew McConnell, Peter Petocz.
Investigation: Flavia Fayet-Moore.
Methodology: Michelle Blumfield, Tim Cassettari, Peter Petocz, Flavia Fayet-Moore.
Project administration: Michelle Blumfield.
Writing – original draft: Michelle Blumfield.
Writing – review & editing: Michelle Blumfield, Molly Warner, Vanessa Campos, Kim-Anne
Lê, Kaori Minehira, Skye Marshall, Flavia Fayet-Moore.
PLOS ONE Balanced carbohydrate ratios improve diet quality
PLOS ONE | https://doi.org/10.1371/journal.pone.0253582 July 9, 2021 15 / 19

References1. Reynolds A, Mann J, Cummings J, Winter N, Mete E, Te Morenga L. Carbohydrate quality and human
health: a series of systematic reviews and meta-analyses. Lancet. 2019; 393(10170):434–45. https://
doi.org/10.1016/S0140-6736(18)31809-9 PMID: 30638909
2. McRae MP. Dietary Fiber Is Beneficial for the Prevention of Cardiovascular Disease: An Umbrella
Review of Meta-analyses. J Chiropr Med. 2017; 16(4):289–99. https://doi.org/10.1016/j.jcm.2017.05.
005 PMID: 29276461
3. Consortium InterAct. Dietary fibre and incidence of type 2 diabetes in eight European countries: the
EPIC-InterAct Study and a meta-analysis of prospective studies. Diabetologia. 2015; 58(7):1394–408.
https://doi.org/10.1007/s00125-015-3585-9 PMID: 26021487
4. Sawicki CM, Lichtenstein AH, Rogers GT, Jacques PF, Ma J, Saltzman E, et al. Comparison of indices
of carbohydrate quality and food sources of dietary diber on longitudinal changes in waist circumference
in the Framingham Offspring Cohort. Nutrients. 2021; 13(3):997. https://doi.org/10.3390/nu13030997
PMID: 33808767
5. Dahl C, Crichton M, Jenkins J, Nucera R, Mahoney S, Marshall S. Dietary fibre modification in the
recovery and prevention of reoccurrence of acute, uncomplicated diverticulitis: A systematic review and
meta-analysis. Nutrients. 2018; 10(2):137. https://doi.org/10.3390/nu10020137
6. Eberhardt F, Crichton M, Dahl C, Nucera R, Jenkins J, Marx W, et al. Role of dietary fibre in older adults
with asymptomatic (AS) or symptomatic uncomplicated diverticular disease (SUDD): Systematic review
and meta-analysis. Maturitas. 2019; 130:57–67. https://doi.org/10.1016/j.maturitas.2019.10.006 PMID:
31706437
7. Gianfredi V, Nucci D, Salvatori T, Dallagiacoma G, Fatigoni C, Moretti M, et al. Rectal cancer: 20% risk
reduction thanks to dietary fibre intake. Systematic review and meta-analysis. Nutrients. 2019; 11
(7):1579. https://doi.org/10.3390/nu11071579 PMID: 31336939
8. Lamothe LM, Le KA, Samra RA, Roger O, Green H, Mace K. The scientific basis for healthful carbohy-
drate profile. Crit Rev Food Sci Nutr. 2019; 59(7):1058–70. https://doi.org/10.1080/10408398.2017.
1392287 PMID: 29190114
9. Fayet-Moore F, Cassettari T, Tuck K, McConnell A, Petocz P. Dietary Fibre Intake in Australia. Paper II:
Comparative Examination of Food Sources of Fibre among High and Low Fibre Consumers. Nutrients.
2018; 10(9):1223. https://doi.org/10.3390/nu10091223 PMID: 30181455
10. Rosinger A, Herrick K, Gahche J, Park S. Sugar-sweetened Beverage Consumption Among U.S.
Youth, 2011–2014. NCHS Data Brief. 2017; 271:1–8.
11. Rosinger A, Herrick K, Gahche J, Park S. Sugar-sweetened Beverage Consumption Among U.S.
Adults, 2011–2014. NCHS Data Brief. 2017; 270:1–8.
12. Australian Bureau of Statistics. 4364.0.55.007—Australian Health Survey: Nutrition First Results—
Food and Nutrients, 2011–12. Canberra: Commonwealth of Australia, 2014.
13. Fayet-Moore F, McConnell A, Cassettari T, Tuck K, Petocz P, Kim J. Discretionary intake among Aus-
tralian adults: prevalence of intake, top food groups, time of consumption and its association with socio-
demographic, lifestyle and adiposity measures. Public Health Nutr. 2019; 22(9):1576–89. https://doi.
org/10.1017/S1368980018003361 PMID: 30681049
14. Popkin BM, Adair LS, Ng SW. Global nutrition transition and the pandemic of obesity in developing
countries. Nutr Rev. 2012; 70(1):3–21. https://doi.org/10.1111/j.1753-4887.2011.00456.x PMID:
22221213
15. World Health Organisation. Guideline: Sugars intake for adults and children. Geneva: World Health
Organisation, 2015.
16. Ludwig DS, Hu FB, Tappy L, Brand-Miller J. Dietary carbohydrates: role of quality and quantity in
chronic disease. BMJ. 2018; 361:k2340. https://doi.org/10.1136/bmj.k2340 PMID: 29898880
17. Roy R, Hebden L, Rangan A, Allman-Farinelli M. The development, application, and validation of a
Healthy eating index for Australian Adults (HEIFA-2013). Nutrition. 2016; 32(4):432–40. https://doi.org/
10.1016/j.nut.2015.10.006 PMID: 26740257
18. Shrapnel B, Noakes M. Discriminating between carbohydrate-rich foods: a model based on nutrient
density and glycaemic index. Nutrition & Dietetics. 2012; 69(2):152–8. https://doi.org/10.1111/j.1747-
0080.2012.01590.x
19. Campos S, Doxey J, Hammond D. Nutrition labels on pre-packaged foods: a systematic review. Public
Health Nutr. 2011; 14(8):1496–506. https://doi.org/10.1017/S1368980010003290 PMID: 21241532
20. Wills JM, Schmidt DB, Pillo-Blocka F, Cairns G. Exploring global consumer attitudes toward nutrition
information on food labels. Nutr Rev. 2009; 67 Suppl 1:S102–6. https://doi.org/10.1111/j.1753-4887.
2009.00170.x PMID: 19453661
PLOS ONE Balanced carbohydrate ratios improve diet quality
PLOS ONE | https://doi.org/10.1371/journal.pone.0253582 July 9, 2021 16 / 19
21. Mozaffarian RS, Lee RM, Kennedy MA, Ludwig DS, Mozaffarian D, Gortmaker SL. Identifying whole
grain foods: a comparison of different approaches for selecting more healthful whole grain products.
Public Health Nutr. 2013; 16(12):2255–64. https://doi.org/10.1017/S1368980012005447 PMID:
23286205
22. Food Standards Australia New Zealand. Nutrition information panels 2015 [cited 2020 3 March]. Avail-
able from: https://www.foodstandards.gov.au/consumer/labelling/panels/Pages/default.aspx.
23. Government of Canada. Nutrition facts tables 2019 [cited 2020 3 March]. Available from: https://www.
canada.ca/en/health-canada/services/understanding-food-labels/nutrition-facts-tables.html#a1.
24. U.S. Food and Drug Administration. Title 21—Food and Drugs Silver Spring: Departmet of Health and
Humans Services; 2019 [cited 2020 3 March]. Available from: https://www.accessdata.fda.gov/scripts/
cdrh/cfdocs/cfcfr/CFRSearch.cfm?CFRPart=101.
25. GOV.UK. Food labelling and packaging 2020 [cited 2020 3 March]. Available from: https://www.gov.uk/
food-labelling-and-packaging/food-labelling-what-you-must-show.
26. Korczak R, Marquart L, Slavin JL, Ringling K, Chu Y, O’Shea M, et al. Thinking critically about whole-
grain definitions: summary report of an interdisciplinary roundtable discussion at the 2015 Whole Grains
Summit. Am J Clin Nutr. 2016; 104(6):1508–14. https://doi.org/10.3945/ajcn.115.126672 PMID:
27806974
27. Wolever TM, Augustin LS, Brand-Miller JC, Delport E, Livesey G, Ludwig DS, et al. Glycemic index is
as reliable as macronutrients on food labels. Am J Clin Nutr. 2017; 105(3):768–9. https://doi.org/10.
3945/ajcn.116.146092 PMID: 28251938
28. Matthan NR, Ausman LM, Meng H, Tighiouart H, Lichtenstein AH. Estimating the reliability of glycemic
index values and potential sources of methodological and biological variability. Am J Clin Nutr. 2016;
104(4):1004–13. https://doi.org/10.3945/ajcn.116.137208 PMID: 27604773
29. Robertson TM, Alzaabi AZ, Robertson MD, Fielding BA. Starchy Carbohydrates in a Healthy Diet: The
Role of the Humble Potato. Nutrients. 2018; 10(11). https://doi.org/10.3390/nu10111764
30. Livesey G, Taylor R, Livesey HF, Buyken AE, Jenkins DJA, Augustin LSA, et al. Dietary Glycemic Index
and Load and the Risk of Type 2 Diabetes: A Systematic Review and Updated Meta-Analyses of Pro-
spective Cohort Studies. Nutrients. 2019; 11(6):1280. https://doi.org/10.3390/nu11061280 PMID:
31195724
31. Livesey G, Taylor R, Livesey HF, Buyken AE, Jenkins DJA, Augustin LSA, et al. Dietary Glycemic Index
and Load and the Risk of Type 2 Diabetes: Assessment of Causal Relations. Nutrients. 2019; 11
(6):1436. https://doi.org/10.3390/nu11061436 PMID: 31242690
32. Liu J, Rehm CD, Shi P, McKeown NM, Mozaffarian D, Micha R. A comparison of different practical indi-
ces for assessing carbohydrate quality among carbohydrate-rich processed products in the US. PLOS
ONE. 2020; 15(5):e0231572. https://doi.org/10.1371/journal.pone.0231572 PMID: 32437371
33. Lloyd-Jones DM, Hong Y, Labarthe D, Mozaffarian D, Appel LJ, Van Horn L, et al. Defining and setting
national goals for cardiovascular health promotion and disease reduction: the American Heart Associa-
tion’s strategic Impact Goal through 2020 and beyond. Circulation. 2010; 121(4):586–613. https://doi.
org/10.1161/CIRCULATIONAHA.109.192703 PMID: 20089546
34. AlEssa HB, Bhupathiraju SN, Malik VS, Wedick NM, Campos H, Rosner B, et al. Carbohydrate quality
and quantity and risk of type 2 diabetes in US women. Am J Clin Nutr. 2015; 102(6):1543–53. https://
doi.org/10.3945/ajcn.115.116558 PMID: 26537938
35. Buttriss J. Why 5%? An explanation of SACN’s recommendations about sugars and health. London,
UK: Public Health England, 2015.
36. Scientific Advisory Committee on Nutrition. Carbohydrates and health. London: The Stationary Office,
2015.
37. Fontanelli MM, Micha R, Sales CH, Liu J, Mozaffarian D, Fisberg RM. Application of the� 10:1 carbohy-
drate to fiber ratio to identify healthy grain foods and its association with cardiometabolic risk factors.
Eur J Nutr. 2019. https://doi.org/10.1007/s00394-019-02165-4
38. von Elm E, Altman DG, Egger M, Pocock SJ, Gotzsche PC, Vandenbroucke JP. The Strengthening the
Reporting of Observational Studies in Epidemiology (STROBE) Statement: guidelines for reporting
observational studies. Int J Surg. 2014; 12(12):1495–9. https://doi.org/10.1016/j.ijsu.2014.07.013
PMID: 25046131
39. Australian Bureau of Statistics. 4364.0.55.001—Australian Health Survey: First Results, 2011–12. Can-
berra: Commonwealth of Australia, 2014.
40. Food Standards Australia New Zealand. AUSNUT 2011–13—Australian food, supplement and nutrient
database for estimation of population nutrient intakes. Canberra: Commonwealth of Australia, 2014.
41. Australian Bureau of Statistics. Australian Health Survey: User’s Guide, 2011–13, 4363.0.55.001. Can-
berra: Commonwealth of Australia, 2013.
PLOS ONE Balanced carbohydrate ratios improve diet quality
PLOS ONE | https://doi.org/10.1371/journal.pone.0253582 July 9, 2021 17 / 19

42. World Health Organisation. Growth reference 5–19 years Geneva: World Health Organisation; [cited
2020 3 March]. Available from: http://www.who.int/growthref/who2007_bmi_for_age/en/
43. Barlow SE, Committee. E. Expert committee recommendations regarding the prevention, assessment,
and treatment of child and adolescent overweight and obesity: summary report. Pediatrics. 2007; 120:
S164–S92. https://doi.org/10.1542/peds.2007-2329C PMID: 18055651
44. Physical status: the use and interpretation of anthropometry. Report of a WHO Expert Committee.
1995.
45. Australian Bureau of Statistics. 4250.0.55.001—Perspectives on Education and Training: Social Inclu-
sion, 2009 Canberra: Commonwealth of Australia, 2011.
46. Kennedy ET, Ohls J, Carlson S, Fleming K. The healthy eating index: design and applications. J Am
Diet Assoc. 1995; 95(10):1103–8. https://doi.org/10.1016/S0002-8223(95)00300-2 PMID: 7560680
47. National Health and Medical Research Council. Australian Dietary Guidelines. Canberra: Department
of Health and Ageing, 2013.
48. IBM Corp. IBM SPSS Statistics for Windows, Version 26.0. Armonk, NY: IBM Corp; Released 2018.
49. Gupta A, Smithers LG, Braunack-Mayer A, Harford J. How much free sugar do Australians consume?
Findings from a national survey. Aust N Z J Public Health. 2018; 42(6):533–40. https://doi.org/10.1111/
1753-6405.12836 PMID: 30296823
50. Grech A, Sui Z, Siu HY, Zheng M, Allman-Farinelli M, Rangan A. Socio-Demographic Determinants of
Diet Quality in Australian Adults Using the Validated Healthy Eating Index for Australian Adults (HEIFA-
2013). Healthcare (Basel). 2017; 5(1):7. https://doi.org/10.3390/healthcare5010007 PMID: 28165394
51. Fayet-Moore F, Cassettari T, Tuck K, McConnell A, Petocz P. Dietary Fibre Intake in Australia. Paper I:
Associations with Demographic, Socio-Economic, and Anthropometric Factors. Nutrients. 2018; 10
(5):599. https://doi.org/10.3390/nu10050599
52. Gornicka M, DrywieńME, Zielinska MA, Hamułka J. Dietary and lifestyle changes during COVID-19
and the subsequent lockdowns among Polish adults: A cross-sectional online survey PLifeCOVID-19
study. Nutrients. 2020; 12(8):2324. https://doi.org/10.3390/nu12082324 PMID: 32756458
53. Zazpe I, Santiago S, Toledo E, Bes-Rastrollo M, Fuente-Arrillaga C, Martınez-Gonzalez MA. Diet qual-
ity indices in the SUN cohort: Observed changes and predictors of changes in scores over a 10-year
period. J Acad Nutr Diet. 2021:[In Press]. https://doi.org/10.1016/j.jand.2021.03.011 PMID: 33906824
54. National Health and Medical Research Council. Nutrient reference values for Australia and New Zea-
land. Canberra: Department of Health and Ageing, 2006.
55. Louie JCY, Buyken AE, Brand-Miller JC, Flood VM. The link between dietary glycemic index and nutri-
ent adequacy Am J Clin Nutr. 2012; 95(3):694–702. https://doi.org/10.3945/ajcn.111.015271 PMID:
22258270
56. Louie JC, Markovic TP, Ross GP, Foote D, Brand-Miller JC. Higher glycemic load diet is associated
with poorer nutrient intake in women with gestational diabetes mellitus. Nutr Res. 2013; 33(4):259–65.
https://doi.org/10.1016/j.nutres.2013.02.008 PMID: 23602242
57. Barakatun Nisak MY, Ruzita AT, Norimah AK, Gilbertson H, Nor Azmi K. Improvement of dietary quality
with the aid of a low glycemic index diet in Asian patients with type 2 diabetes mellitus. J Am Coll Nutr.
2010; 29(3):161–70. https://doi.org/10.1080/07315724.2010.10719830 PMID: 20833988
58. Alzaben AS, Turner J, Shirton L, Samuel TM, Persad R, Mager D. Assessing Nutritional Quality and
Adherence to the Gluten-free Diet in Children and Adolescents with Celiac Disease. Can J Diet Pract
Res. 2015; 76(2):56–63. https://doi.org/10.3148/cjdpr-2014-040 PMID: 26067413
59. Zazpe I, Sanchez-Taınta A, Santiago S, de la Fuente-Arrillaga C, Bes-Rastrollo M, Martınez JA, et al.
Association between dietary carbohydrate intake quality and micronutrient intake adequacy in a Medi-
terranean cohort: the SUN (Seguimiento Universidad de Navarra) Project. Br J Nutr. 2014; 111
(11):2000–9. https://doi.org/10.1017/S0007114513004364 PMID: 24666554
60. Du H, van der AD, van Bakel MM, van der Kallen CJ, Blaak EE, van Greevenbroek MM, et al. Glycemic
index and glycemic load in relation to food and nutrient intake and metabolic risk factors in a Dutch pop-
ulation. Am J Clin Nutr. 2008; 87(3):655–61. https://doi.org/10.1093/ajcn/87.3.655 PMID: 18326604
61. Cohen JF, Kraak VI, Choumenkovitch SF, Hyatt RR, Economos CD. The CHANGE study: a healthy-
lifestyles intervention to improve rural children’s diet quality. J Acad Nutr Diet. 2014; 114(1):48–53.
https://doi.org/10.1016/j.jand.2013.08.014 PMID: 24126295
62. World Health Organisation. WHO fruit and vegetable promotion initiative—report of the meeting,
Geneva, 25–27 August 2003. Geneva: World Health Organisation, 2003.
63. Johnson BJ, Bell LK, Zarnowiecki D, Rangan AM, Golley RK. Contribution of Discretionary Foods and
Drinks to Australian Children’s Intake of Energy, Saturated Fat, Added Sugars and Salt. Children. 2017;
4(12):104. https://doi.org/10.3390/children4120104 PMID: 29194425
PLOS ONE Balanced carbohydrate ratios improve diet quality
PLOS ONE | https://doi.org/10.1371/journal.pone.0253582 July 9, 2021 18 / 19
64. Grieger JA, Wycherley TP, Johnson BJ, Golley RK. Discrete strategies to reduce intake of discretionary
food choices: a scoping review. Int J Behav Nutr Phys Act. 2016; 13(57):1–22. https://doi.org/10.1186/
s12966-016-0380-z PMID: 27151280
65. Food Standards Australia New Zealand. Australian Food Composition Database—Release 1.0 Can-
berra: Commonwealth of Australia; 2019 [cited 2020 15 March]. Available from: https://www.
foodstandards.gov.au/science/monitoringnutrients/afcd/Pages/foodsearch.aspx.
66. Food Standards Australia New Zealand. Australian user guide: mandatory folic acid fortification. Imple-
menting the requirements of the mandatory fortification with folic acid under standard 2.1.1—cereals
and cereal products. Canberra: Commonwealth of Australia, 2009.
67. Zeuschner CL, Hokin BD, Marsh KA, Saunders AV, Reid MA, Ramsay MR. Vitamin B12 and vegetarian
diets. Med J Aust. 2013; 199(S4):S27–32. https://doi.org/10.5694/mja11.11509 PMID: 25369926
68. Drewnowski A, Fulgoni 3rd V. Nutrient profiling of foods: creating a nutrient-rich food index. Nutr Rev.
2008; 66(1):23–39. https://doi.org/10.1111/j.1753-4887.2007.00003.x PMID: 18254882
69. Greenwood DC, Threapleton DE, Evans CE, Cleghorn CL, Nykjaer C, Woodhead C, et al. Glycemic
index, glycemic load, carbohydrates, and type 2 diabetes: systematic review and dose-response meta-
analysis of prospective studies. Diabetes Care. 2013; 36(12):4166–71. https://doi.org/10.2337/dc13-
0325 PMID: 24265366
70. Venn BS, Williams SM, Mann JI. Comparison of postprandial glycaemia in Asians and Caucasians. Dia-
bet Med. 2010; 27(10):1205–8. https://doi.org/10.1111/j.1464-5491.2010.03069.x PMID: 20873364
71. Wolever TM, Jenkins AL, Vuksan V, Campbell J. The glycaemic index values of foods containing fruc-
tose are affected by metabolic differences between subjects. Eur J Clin Nutr. 2009; 63(9):1106–14.
https://doi.org/10.1038/ejcn.2009.30 PMID: 19471291
72. Aziz A, Dumais L, Barber J. Health Canada’s evaluation of the use of glycemic index claims on food
labels. Am J Clin Nutr. 2013; 98(2):269–74. https://doi.org/10.3945/ajcn.113.061770 PMID: 23761481
73. Hall KD, Ayuketah A, Brychta R, Cai H, Cassimatis T, Chen KY, et al. Ultra-Processed Diets Cause
Excess Calorie Intake and Weight Gain: An Inpatient Randomized Controlled Trial of Ad Libitum Food
Intake. Cell Metab. 2019; 30(1):67–77. https://doi.org/10.1016/j.cmet.2019.05.008 PMID: 31105044
74. Blumfield ML, Hure AJ, Macdonald-Wicks LK, Patterson AJ, Smith R, Collins CE. Disparities exist
between National food group recommendations and the dietary intakes of women. BMC Womens
Health. 2011; 11:37. https://doi.org/10.1186/1472-6874-11-37 PMID: 21819627
PLOS ONE Balanced carbohydrate ratios improve diet quality
PLOS ONE | https://doi.org/10.1371/journal.pone.0253582 July 9, 2021 19 / 19