Embed Size (px)
Citation preview
NASA Technical, Memorandum 104026
Bandwidth Characteristicsof Multimedia Data Trafficon a Local Area Network
Sherry L. Chuang, Sharon Doubek, and.Richard F. Haines
September 1993
(NASA-TM-I04026) BANDWIDTH
CHARACTERISTICS OF MULTIMEDIA DATA
TRAFFIC ON A LOCAL AREA NETWORK
(NASA) ii p
G3/17
N94-15648
Unclas
0190880
National AeronaulJcs andSpace Admin_
https://ntrs.nasa.gov/search.jsp?R=19940011175 2018-05-12T23:34:30+00:00Z

S
ff _
NASA TechnicalMemorandum 104026
Bandwidth Characteristicsof Multimedia Data Trafficon a Local Area Network
Sherry L. Chuang, Ames Research Center, Moffett Field, CaliforniaSharon Doubek, Recom Technologies, San Jose, CaliforniaRichard F. Haines, Ames Research Center, Moffett Field, California
September 1993
NASANationalAeronauticsandSpace Administration
Ames Research CenterMoffettF_ld, California94035-1000

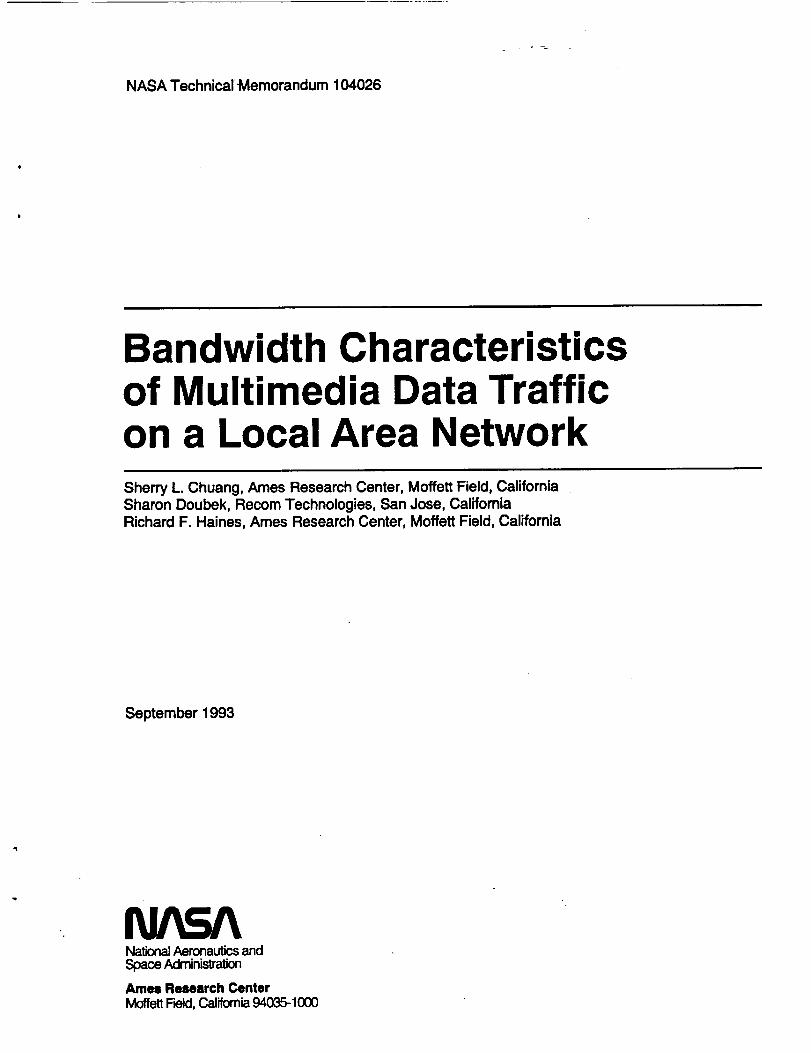
Summary
Limited spacecraft communication links call for users to
investigate the potential use of video compression and
multimedia technologies to optimize bandwidth alloca-
tions. The objective of this study was to determine thetransmission characteristics of multimedia datammotion
video, text or bitmap graphics, and files transmitted
independently and simultaneously over an ethernet localarea network. Commercial desktop video teleconfer-
eneing hardware and software and lntel's proprietary
Digital Video Interactive (DVI) video compression
algorithm were used, and typical task scenarios were
selected. The transmission time, packet size, number
of packets, and network utilization of the data were
recorded. First, each data type---compressed motion
video, text and/or bitmapped graphics, and a compressed
image file--was transmitted independently and itscharacteristics recorded. The results showed that an
average bandwidth of 7.4 kilobits per second (kbps) was
used to transmit graphics; an average bandwidth of
86.8 kbps was used to transmit an 18.9-kilobyte (kB)
image file; a bandwidth of 728.9 kbps was used to
transmit compressed motion video at 15 frames per
second (fps); and a bandwidth of 75.9 kbps was used to
transmit compressed motion video at 1.5 fps. Average
packet sizes were 93.3 bytes for graphics, 498.5 bytes for
the image file, 345.8 bytes for motion video at 15 fps, and
341.9 bytes for motion video at 1.5 fps.
Secondly, simultaneous transmission of multimedia data
types was also characterized. The multimedia packetsused transmission bandwidths of 341.4 kbps and 105.8
kbps. Bandwidth utilization varied according to the frame
rate (frames per second) setting for the transmission ofmotion video. Packet size did not vary significantly
between the data types.
When these characteristics are applied to Space Station
Frcedom (SSF), the packet sizes fall within the maximum
specified by the Consultative Committee for Space Data
Systems (CCSDS). The uplink of imagery to SSF may be
performed at minimal frame rates and/or within seconds
of dclay, depending on the user's allocated bandwidth.Further research to identify the acceptable delay interval
and its impact on human performance is required. Addi-
tional studies in network performance using various video
compression algorithms and integrated multimedia
techniques are needed to determine the optimal design
approach for utilizing SSF's data communications
system.
Introduction
Methods for remote coaching and oversight of the
onboard SSF crew members' activities by the ground-
based Principal Investigators (PI) may require the
exchange of science procedure checklists and data files.
Science payload experimenters on SSF will also require
video monitoring of their life science subjects. The
number of video cameras and the amount of imagery
that must be supported for science payloads exceeds the
currently allocated data communications bandwidth ofSSF. The transmission of these data types along with
command and controls of environmental and engineering
parameters in the payload facilities requires enoughbandwidth to support two-way communication in order to
facilitate high-quality performance. Transmission band-width will be limited because of the large numbers of
payload functions required. An effective method to
manage SSF's engineering, science, and payload com-mand and control data transmission requirements must be
found. It is necessary to investigate advanced technol-
ogies, such as video compression and methods for
networking multimedia, to determine their feasibilityfor SSF.
Previous studies have shown that compressed remote
video imagery is acceptable to the life sciences user
community (ref. 1) and frame rates as low as 4 to
6 frames per second are acceptable for remote monitoring
of small animals (ref. 2). The life sciences user com-
munity, comprised mostly of animal and plant physiol-
ogists and biologists, determined the acceptance levels of
compressed imagery; they found that video compression
technologies using a Joint Photographic Expert Group
(JPEG) algorithm and a proprietary Discrete Cosine
Transform (DCT) algorithm by Compression Laboratory
Inc. (CLI) can support their scientific requirements.
However, the engineering requirements to implement
such a system call for weight, power, volume, and databandwidth to be within SSF's engineering constraints.
Method
Experiment Design and Variables
This experiment used a two-node point-to-point con-
figuration and transmitted three types of data: a two-way
compressed motion video, a compressed video image file,
and two-way text and graphics. A step-by-step procedure
was designed for each data type and was systematically
repeated during data collection. Data collection was done
first by transmitting each of the data types independently,then simultaneously with another data type. For example,
two-way motion video was transmitted at the same time a
file was being transferred between workstations. Finally
all three data types were transmitted simultaneously.
During each data-collection trial, the total number of
packets, the total number of ethernet data bytes, the totaltransmission time in milliseconds, the packet size, and the
percentage of bandwidth utilized were measured and
recorded. A preliminary data-collection run was donewith motion video in order to understand the effects of
frame rate on the variability of network traffic. It
confirmed that five trials per frame rate setting were
sufficient, given that the variance between each trial was
minimal; this finding allowed us to save time by reducingthe number of data-collection trials per run. Therefore,
five trials were performed for motion video data trans-
mission, and ten trials were performed for file and
graphical data in order to calculate a mean value.
Apparatus
All video imagery, graphics, and files were presented on a
16-inch (diagonal) computer screen of the IBM PS/2model 80-321 computer. The computer has 10 megabytes
(MB) of RAM and a 320 MB hard disk. The video com-
pression hardware consisted of Intel's ActionMedia IIboard set, an ActionMedia 11Capture module with the
ActionMedia 1I Delivery Board (attached as a daughter
board) used to digitize and compress the NationalTelevision Standard Committee (NTSC) signal "on the
fly" for display on the VGA monitor. 1
IBM's video teieconferencing software, Person-w-Person
(P2P), was used in conjunction with the ActionMedia IIboarcLs for this study. Person.w-Person runs with IBM's
OS/2's Presentation Manager and permits live video to be
displayed locally, remotely, or in video conference mode.
For this study, P2P was configured for the video confer-ence mode. in addition to the video capability, the
software also provides utilities such as "chalkboard" and"file transfer." The chalkboard utility provides a shared
graphical workspace that participants can use to view,
create, edit, point to, and share items from their com-
puters. It has a drawing space, equipped with a set oftools for the production of simple colored graphics and
text. The drawings done on the chalkboard appear on both
participants" computer monitors simultaneously. The filetransfer utility sends files between both Person-lo-Person
users, provides progress information for file transfers, andinforms users of incoming file transfers.
lActionMedia II boards digitize and compress a video signal for
display on a monitor and/or storage on a hard disk. The boardsuscd hcrc employed a dual-chip, B-scrics i750 Video DisplayP_r.
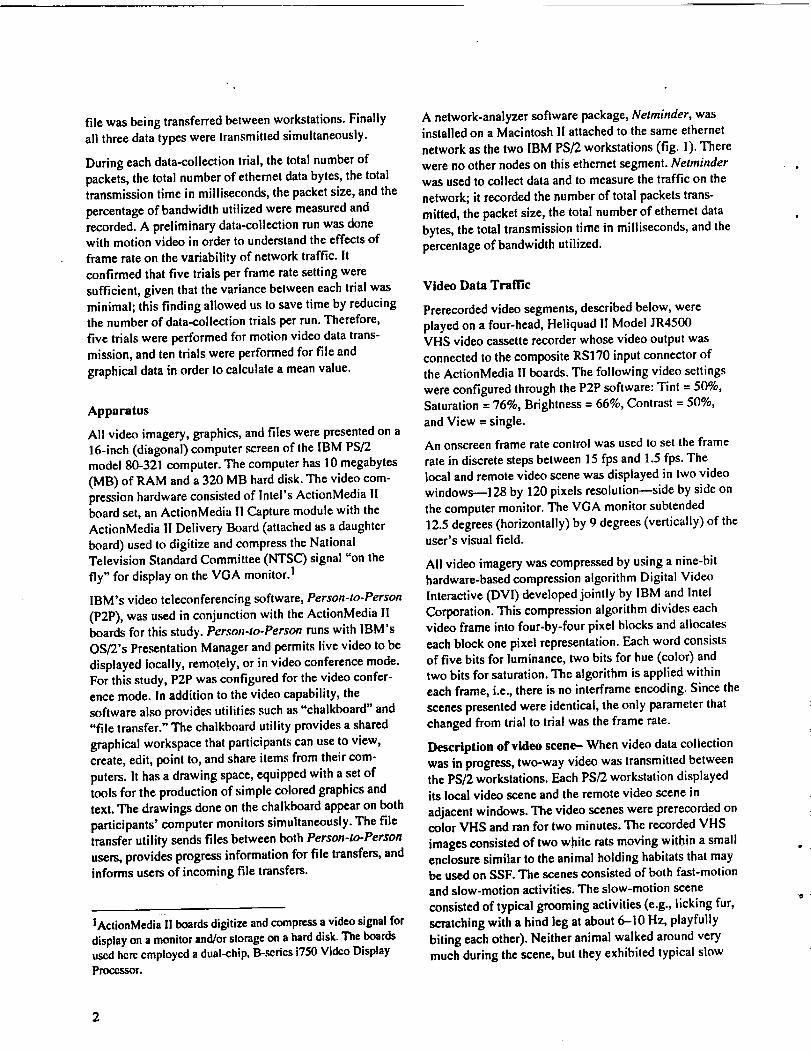
A network-analyzer software package, Netminder, wasinstalled on a Macintosh It attached to the same ethernet
network as the two IBM PS/2 workstations (fig. 1). There
were no other nodes on this ethemet segment. Netmbzderwas used to collect data and to measure the traffic on the
network; it recorded the number of total packets trans-
mitted, the packet size, the total number of ethernet data
bytes, the total transmission time in milliseconds, and the
percentage of bandwidth utilized.
Video Data Tramc
Prerecorded video segments, described below, were
played on a four-head, Heliquad II Model JR4500VHS video cassette recorder whose video output was
connected to the composite RS170 input connector ofthe ActionMedia II boards. The following video settings
were configured through the P2P software: Tint = 50%,
Saturation = 76%, Brightness = 66%, Contrast = 50%,
and View = single.
An onscreen frame rate control was used to set the frame
rate in discrete steps between 15 fps and 1.5 fps. Thelocal and remote video scene was displayed in two video
windows---128 by 120 pixels resolution--side by side on
the computer monitor. The VGA monitor subtended
12.5 degrees (horizontally) by 9 degrees (vertically) of theuser's visual field.
All video imagery was compressed by using a nine-bit
hardware-based compression algorithm Digital Video
Interactive (DVI) developed jointly by IBM and Intel
Corporation. This compression algorithm divides eachvideo frame into four-by-four pixel blocks and allocates
each block one pixel representation. Each word consistsof five bits for luminance, two bits for hue (color) and
two bits for saturation. The algorithm is applied within
each frame, i.e., there is no interframe encoding. Since the
scenes presented were identical, the only parameter that
changed from trial to trial was the frame rate.
Description of video scene- When video data collection
was in progress, two-way video was transmitted betweenthe PS/2 workstations. Each PS/2 workstation displayed
its local video scene and the remote video scene in
adjacent windows. The video scenes were prerecorded oncolor VHS and ran for two minutes. The recorded VHS
images consisted of two white rats moving within a smallenclosure similar to the animal holding habitats that may
be used on SSF. The scenes consisted of both fast-motion
and slow-motion activities. The slow-motion scene
consisted of typical grooming activities (e.g., licking fur,
scratching with a hind leg at about 6--10 Hz, playfully
biting each other). Neither animal walked around verymuch during the scene, but they exhibited typical slow
Monitor
i
, ii
MAC II
IBM ID 'P, hPS/2 IV • ..2, r -
Model 80 t \ nt
_ Videocamera
/ \/ \
/ \
Ethernat link o ,.Mi r V I PS/2
In_ I Model 80
_ Vldeocamera
/ \/ \
/ \
Monitor
Figure 1. HW system diagram.
limb and body movcmcnt and cxploratory bchavior such
as sniffing. The fast motion activity consisted of playful
behavior such as tumbling, chasing and rolling over each
other, and mock fighting. The angular rates of movement
wcrc so grcat that they appeared to bc almost at the cdgc
of blurring when viewed at 15 fps.
Procedure for video data collection- The video frame
rates wcrc varied from 1.5 fps, 5 fps, 10 fps, and 15 fpswhile in the video confcrcnce mode. Five trials wcrc
performed for cach frame ratc and mcasurcmcnts wcrcrecorded.
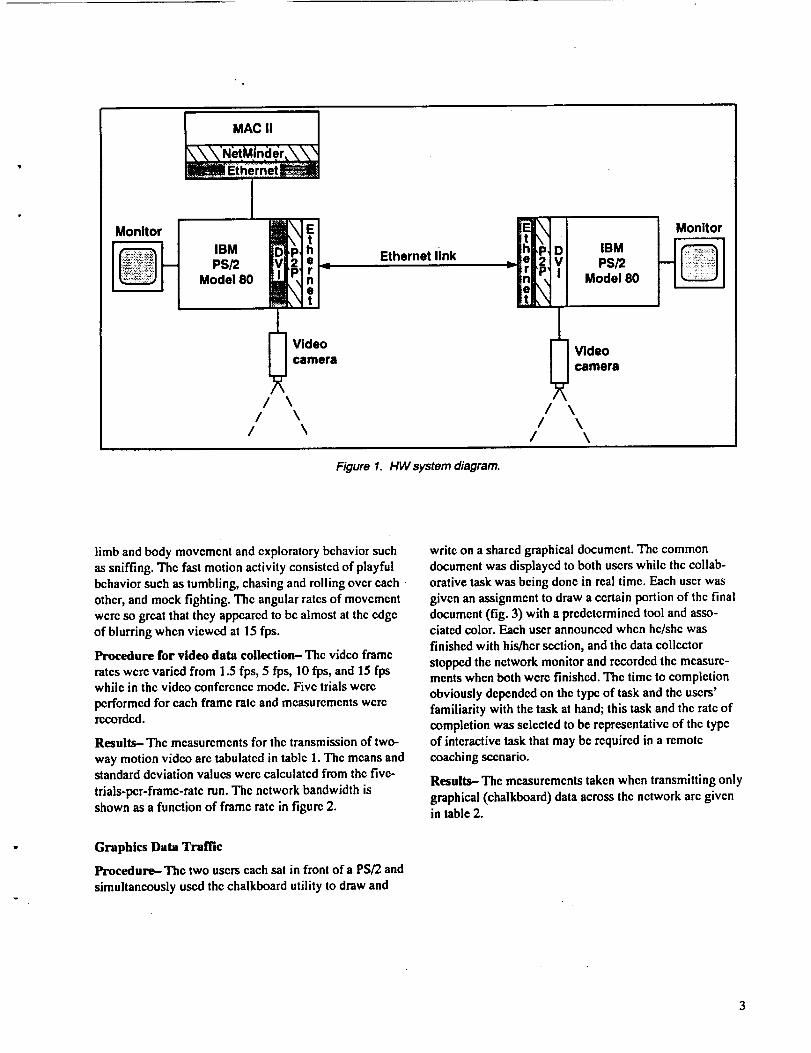
Results- The mcasurcmcnts for the transmission of two-
way motion video arc tabulatcd in table 1. The means andstandard dcviation valucs wcrc calculated from thc fivc-
trials-pcr-framc-ratc run. The network bandwidth isshown as a function of frame rate in figure 2.
Graphics Data Traffic
Procedure- Thc two users cach sat in front of a PS/2 and
simultaneously used thc chalkboard utility to draw and
write on a shared graphical document. The common
document was displayed to both users while the collab-
orative task was being done in real timc. Each user was
given an assignment to draw a ccrtain portion of the finaldocument (fig. 3) with a predetermined tool and asso-ciated color. Each user announced when he/she was
finished with his/hcr section, and the data collector
stopped the network monitor and recorded thc measure-ments whcn both wcrc finishcd. The time to complction
obviously dcpcndcd on thc type of task and the users"
familiarity with the task at hand; this task and the ratc of
completion was selected to be representative of the type
of intcractive task that may bc rcquircd in a rcmotc
coaching scenario.
Results- The measurcmcnts takcn whcn transmitting only
graphical (chalkboard) data across the network are givenin table 2.
3
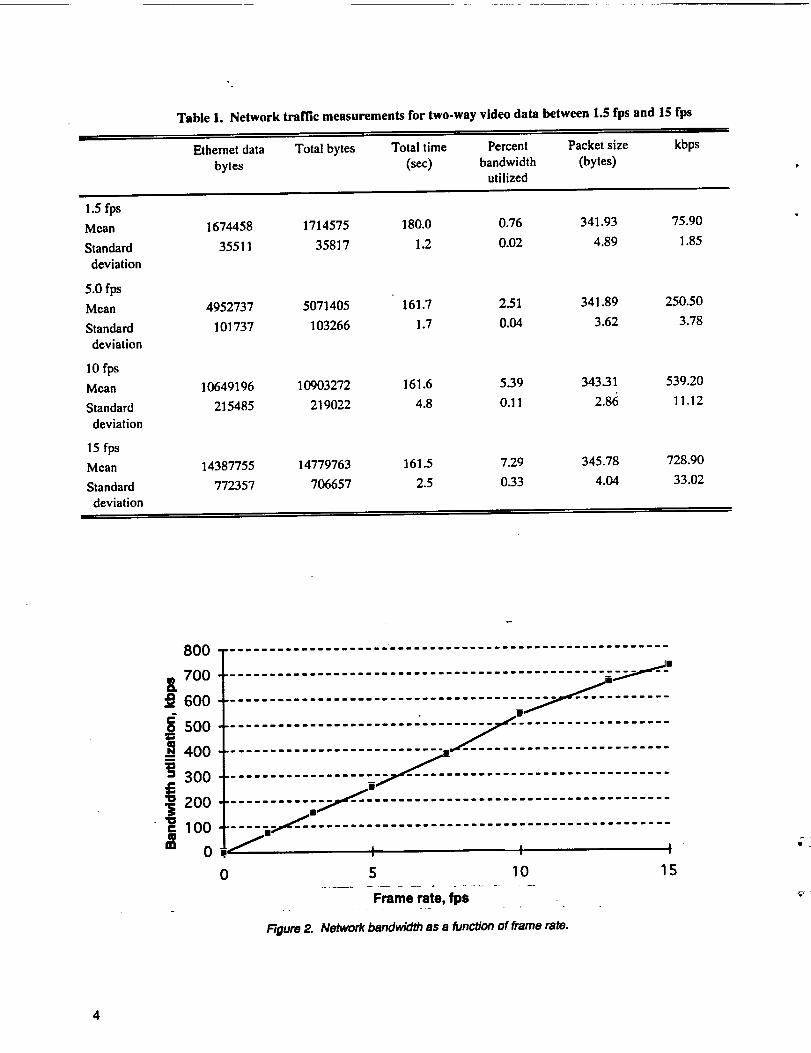
Table 1. Network traffic measurements for two-way video data between 1.5 fps and 15 fps
Ethemet data Total bytes Total time Percent Packet size
bytes (sec) bandwidth (bytes)utilized
kbps
1.5fps
Mean
Standard
deviation
5.0 fps
Mean
Standarddeviation
10 fps
Mcan
Standard
deviation
15fps
Mcan
Standard
deviation
1674458 1714575 180.0 0.76 341.93
35511 35817 1.2 0.02 4.89
4952737 5071405 161.7 2.51 341.89
101737 103266 1.7 0.04 3.62
10649196 10903272 161.6 5.39 343.31
215485 219022 4.8 0.11 2.8(_
14387755 14779763 161.5 7.29 345.78
772357 706657 2.5 0.33 4.04
75.90
1.85
250.50
3.78
539.20
11.12
728.90
33 .O2
800 ........................................................
,oo600
400
300
200 ......................................................
0 5 10 15
Frame rate, fps=
Figure 2. Network bandwidth as a function of frame rate.
4
E:MC2
is the law
Figure 1
Sample Specimen
Figure 3. Representative gra/_hics groupware document using P2P chalkboard.
Table 2. Network tramc measurements for graphics data
Ethcrnct data Total bytes Total time Percent Packet size kbps
bytes (scc) bandwidth (bytes)utilized
Mean 31029.40 33605.00 34.6 0.07 93.27 7.40
Standard 2361.49 2555.96 5.3 0.01 2.70 0.84
deviation
File Data Traffic
Procedure- Each user invoked the SEND FILE and
RECEIVE FILE commands in P2P to transfer files
between the two PS/2 workstations. The file was an
image of a plant leaf with necrosis in one comer magni-
fied 20X through a microscope. The image displayed a
range of chrominancc vectors. It was captured at high
resolution (640 wide by 480 high), digitized at DVI's
9-bit plane, compressed by using the JPEG algorithm, and
resulted in a file size of 18.9 kB with a compression ratioof 51:1.
The SEND FILE command allowed one user to select the
file to be sent, specify the destination, and then transmit "the file over the network. The destination station would
thcn rcccivc a visual message on the computer monitor
indicating that a file had been sent. The message also
prompted the user to use the RECEIVE FILE command tostore and access the transmitted file. The send/receive
procedure for a file of 18.9 kB took approximately25 seconds. The length of transmission time may change,
depending upon the file size. 2 Netminder collected data
throughout the SEND FILE/RECEIVE FILE procedure.
Results-The measurements taken while sending a file
are given in table 3.
Integrated Multimedia Data Traffic
The results are presented in tables 4-7 for aggregated
multimedia data; combinations of graphics, video, and
file data are varied systematically.
2Because the same two users performed the tasks, these SENDand RECEIVE FILE commands were completed in minimaltime. Less experienced usersmay requiremore time.
5
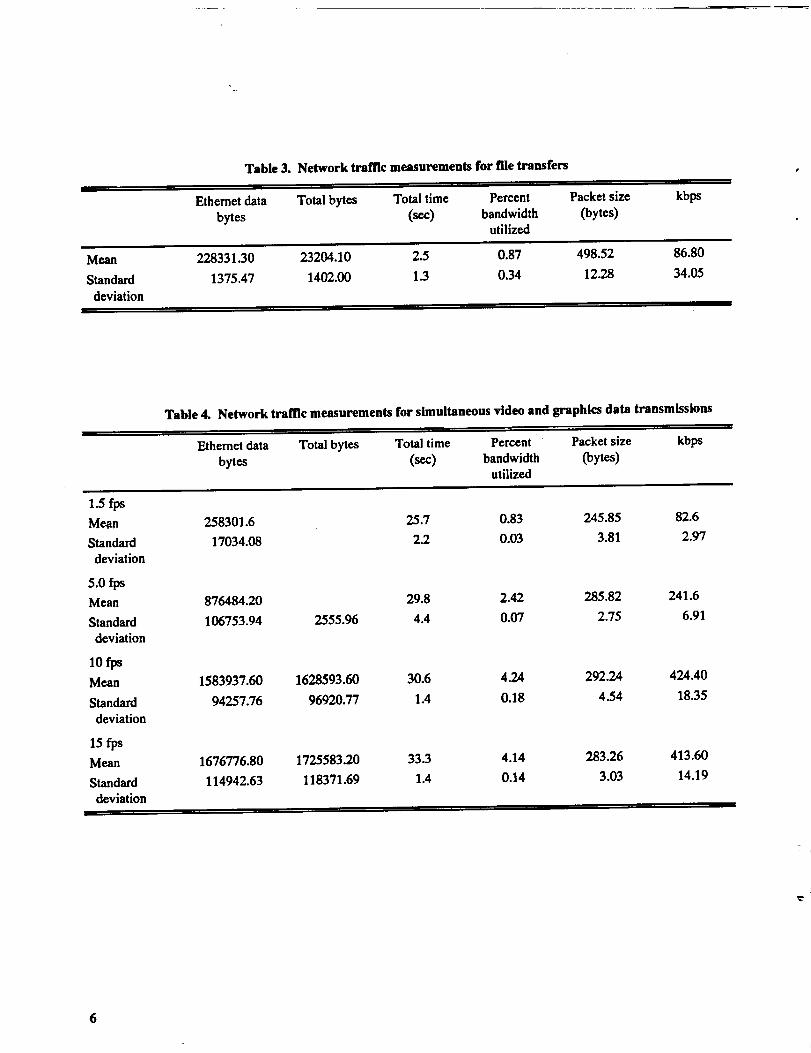
Table 3. Network traffic measurements for file transfers
Ethemet data Total bytes Total time Percent Packet size
bytes (sec) bandwidth (bytes)utilized
kbps
Mean
Standard
deviation
228331.30 23204.10 2.5 0.87 498.52 86.80
1375.47 1402.00 1.3 0.34 12.28 34.05
Table 4. Network traffic measurements for simultaneous video and graphics data transmissions
Ethemet data Total bytes Total time Percent Packet size kbps
bytes (sec) bandwidth (bytes)utilized
1.5fl_Mean
Standard
deviation
5.0 fpsMean
Standard
deviation
10fps
Mean
Standard
deviation
15 fpsMean
Standard
deviation
258301.6
17034.08
876484.20
106753.94
1583937.60
94257.76
1676776.80
114942.63
25.7 0.83 245.85 82.6
2.2 0.03 3.81 2.97
1628593.60 30.6 4.24 292.24 424.40
96920.77 1.4 0.18 4.54 18.35
1725583.20 33.3 4.14 283.26 413.60
118371.69 1.4 0.14 3.03 14.19
29.8 2.42 285.82 241.6
2555.96 4.4 0.07 2.75 6.91
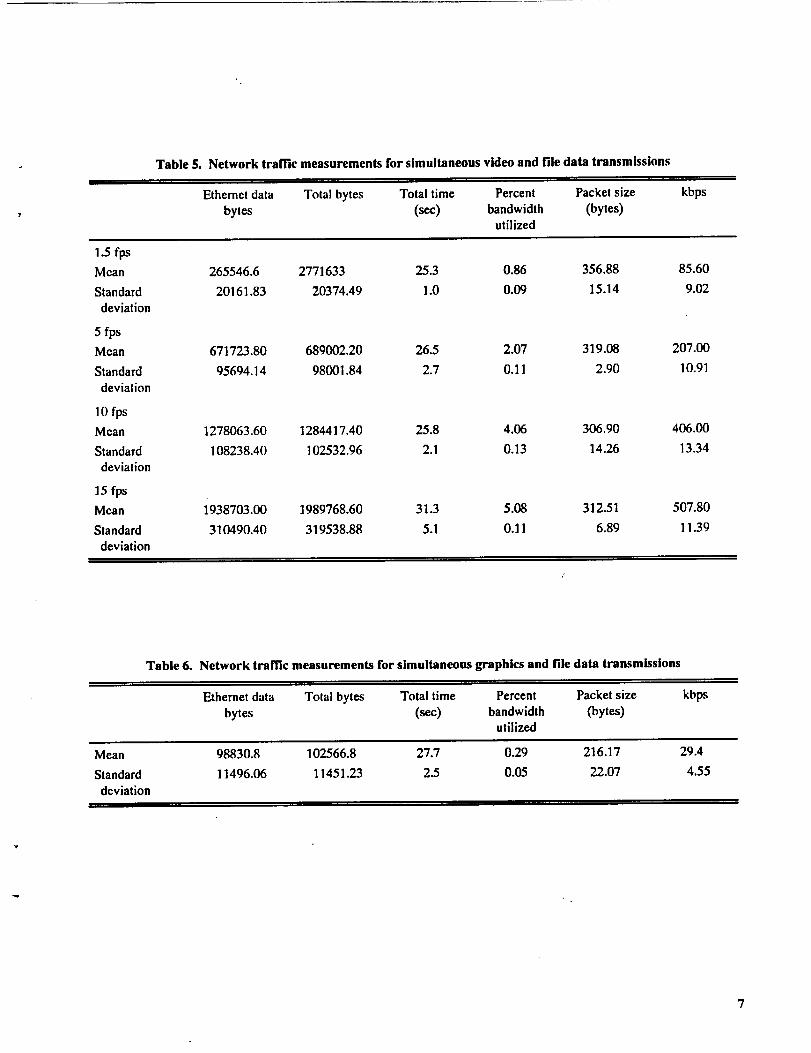
Table5. Networktramcmeasurementsforsimultaneousvideoandfiledatatransmissions
Ethernetdata Total bytes Total time Percent Packet size
bytes (see) bandwidth (bytes)utilized
kbps
1.5 rps
Mean
Standard
deviation
5 fps
Mean
Standard
deviation
10 fps
Mean
Standard
deviation
15fps
Mean
Standard
deviation
265546.6 2771633 25.3 0.86 356.88
20161.83 20374.49 1.0 0.09 15.14
671723.80 689002.20 26.5 2.07 319.08
95694.14 98001.84 2.7 0.11 2.90
1278063.60 1284417.40 25.8 4.06 306.90
108238.40 102532.96 2.1 0.13 14.26
1938703.00 1989768.60 31.3 5.08 312.51
310490.40 319538.88 5.1 0.11 6.89
85.60
9.02
207.00
10.91
406.00
13.34
507.80
l 1.39
Table 6. Network traffic measurements for simultaneous graphics and file data transmissions
Ethemet data Total bytes Total time Percent Packet size
bytes (sec) bandwidth (bytes)utilized
kbps
Mean
Standard
deviation
98830.8 102566.8 27.7 0.29 216.17
11496.06 11451.23 2.5 0.05 22.07
29.4
4.55
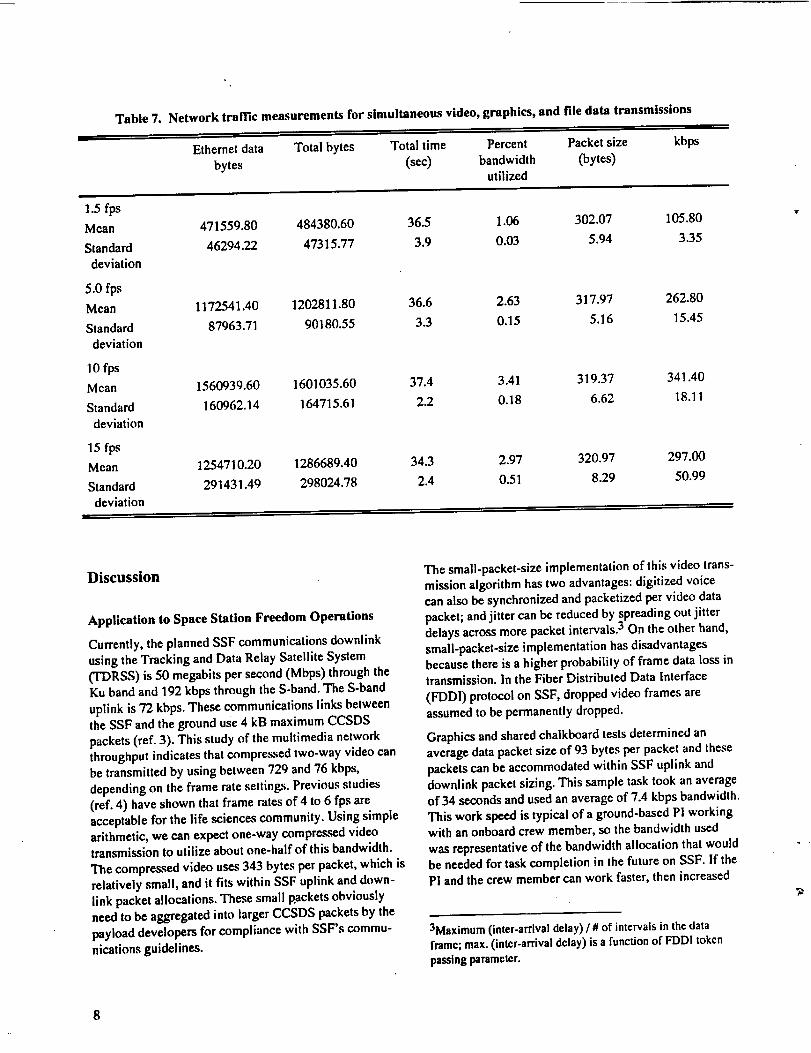
Table 7. Network traffic measurements for simultaneous video, graphics, and file data transmissions
Ethernet data Total bytes Total time Percent Packet size
bytes (see) bandwidth (bytes)utilized
kbps
1.5fpsMean 471559.80 484380.60 36.5 1.06 302.07 105.80
Standard 46294.22 47315.77 3.9 0.03 5.94 3.35
deviation
5.0 fps
Mean 1172541.40 1202811.80 36.6 2.63 317.97 262.80
Standard 87963.71 90180.55 3.3 0.15 5.16 15.45
deviation
10fpsMean 1560939.60 1601035.60 37.4 3.41 319.37 341.40
Standard 160962.14 164715.61 2.2 O.18 6.62 18.11
deviation
15fpsMcan 1254710.20 1286689.40 34.3 2.97 320.97 297.00
Standard 291431.49 298024.78 2.4 0.51 8.29 50.99
deviation
Discussion
Application to Space Station Freedom Operations
Currently, the planned SSF communications downlink
using the Tracking and Data Relay Satellite System
(TDRSS) is 50 megabits per second (Mbps) through theKu band and 192 kbps through the S-band. The S-band
uplink is 72 kbps. These communications links betweenthe SSF and the ground use 4 kB maximum CCSDS
packets (ref. 3). This study of the multimedia network
throughput indicates that compressed two-way video can
be transmitted by using between 729 and 76 kbps,
depending on the frame rate settings. Previous studies
(ref. 4) have shown that frame rates of 4 to 6 fps areacceptable for the life sciences community. Using simplearithmetic, we can expect one-way compre._d video
transmission to utilize about one-half of this bandwidth.
The compressed video uses 343 bytes per packet, which is
relatively small, and it fits within SSF uplink and down-
link packet allocations. These small packets obviouslyneed to be aggregated into larger CCSDS packets by the
payload developers for compliance with SSF's commu-
nications guidelines.
The small-packet-size implementation of this video trans-
mission algorithm has two advantages: digitized voice
can also be synchronized and packetized per video data
packet; and jitter can be reduced by spreading out jitter
delays across more packet intervals. 3 On the other hand,
small-packet-size implementation has disadvantagesbecause there is a higher probability of frame data loss in
transmission. In the Fiber Distributed Data Interface
(FDDI) protocol on SSF, dropped video frames areassumed to be permanently dropped.
Graphics and shared chalkboard tests determined an
average data packet size of 93 bytes per packet and these
packets can be accommodated within SSF uplink and
downlink packet sizing. This sample task took an averageof 34 seconds and used an average of 7.4 kbps bandwidth.
This work speed is typical of a ground-based PI workingwith an onboard crew member, so the bandwidth used
was representative of the bandwidth allocation that wouldbe needed for task completion in the future on SSF. If the
PI and the crew member can work faster, then increased
3Maximum (inter-arrival delay) / # of intervals in the dataframe; max. (inter-arrival delay) is a function of FDDI token
passing parametcr.
8
bandwidth may be needed to reduce the frustration caused
by communication delays.
Transmission of the image file used an average data-
packet size of 498.5 bytes, well within the maximum
CCSDS packet size of 4 kB. Space Station Freedom can
support image file transmissions if the user can sustain the
transmission delay. In this test the average bandwidth was
86.8 kbps and the average send and receive completiontime was 2.5 seconds. The transmission delay will vary,
depending on the percentage of the 72 kbps uplink band-width that is available to the transmission of the image
file. It is not clear what would be an acceptable delayduration. Further human-factors research is needed to
understand the impact of delay on _ience productivity.
Conclusions
Wc concludc from thcsc findings that transmission ofmultimedia data across an cthernct local area network
provides cvidcncc that the compression techniques used
by commercial multimedia vendors can bc adopted for
SSF applications. A Packet network can support aggre-
gated multimedia data by using bandwidths as low as
729 kbps for two-way transmission. A bandwidth of
310 kbps would bc needed for video transmission at
frame rates of 4 to 6 fps, which have bcen shown in
prcvious studies to bc acceptable for the life scicnccs
community. The question of delay also enters into the
bandwidth equation. The acceptable delay interval and its
impact on human performance will have to be defined
and quantified empirically in order to request SSF band-width allocations and then optimize network usage.
References
1. Haines, R. F.; and Chuang, S. L.: The Effects of
Video Compression on Acceptability of Images
for Monitoring Life Sciences' Experiments.
NASA TP-3239, 1992.
2. Haines, R. F.; and Chuang, S. L.: A Study of Video
Frame Rate on the Perception of Compressed
Dynamic Imagery. IEEE Data Compression
Conference Proceedings, Snowbird, UT,March 1993.
3. Kohl, Ron: Payload Software DMS Interfaces.
Presentation given at Payload Data Services
Workshop, Huntsville, AL, Aug. 5-6, 1992.
4. Chuang, S. L.; and Haines, R. F.: The Impact of
Video Frame Rate on Acceptable Compressed
Imagery and the Requirement for Network
Throughput. Society for Information Displays
(SID) Digest '93, Seattle, WA, 1993.
Form Approved
REPORT DOCUMENTATION PAGE OMBNo. 0704-0188
Public report ng burden for this col action o_ information is estimated to average 1 hour per response, including the time for reviewing in.structiona, searching existing data sources,gathadng and maintaining the data needed, and completing and reviewing the .col.lection.of information.. Send codlin .ants regaling this..ouroen e_imate or any =or=heras pe,ct_=of_t_h/sc:otlectio/_ of Iflforrnation, Including suggestions for reducing thle burden, to Weahmgton Heaaquarters _ervtces, utrtcmrete ;orinformation upereuone arm Hal*One. _=¢=o je.erwJ.Davis Highway. Suite 1204, Arlington, VA 222024302, and to the Office of Management and Budget, Paperwork Reduction Pro act (0704-0188), Washington. DC 20503.
1. AGENCY USE ONLY (Leave blank) | 2. REPORT DATE 3. REPORT TYPE AND DATES COVERED
I September 1993 Technical Memorandum4. TITLE AND SUBTITLE 5. FUNDING NUMBERS
Bandwidth Characteristics of Multimedia Data Traffic on a Local
Area Network
6. AUTHOR(S)
Sherry L. Chuang, Sharon Doubek, and Richard F. Haines
7. PERFORMING ORGANIZATION NAME(S) AND ADDRESSIEB)
Ames Research Center
Moffett Field, CA 94035-1000
,. SPONSORINC_MONITORINGAGENCYNAME(S)ANDADDRESS(EB)
National Aeronautics and Space Administration
Washington, DC 20546-0001
476-14-03
8. PERFORMING ORGANIZATIONREPORT NUMBER
A-93088
10. SPONSORING/MONITORINGAGENCY REPORTNUMBER
NASA TM-104026
11. SUPPLEMENTARY NOTES
Point of Contact: Sherry Chuang, Ames Research Center, MS 269-4, Moffett Field, CA 94035-1000
(415) 604-3376i
12a. DISTRIBUTION/AVAILABILITY STATEMENT 12b. DISTRIBUTION CODE
Unclassified-Unlimited
Subject Category - 17
13. ABSTRACT (Maximum 200 words)Limited spacecraft communication links call for users to investigate the potential use of video compression and multimedia technologies to
optimize bandwidth allocations. The objective of this study wasto determine the transmission characteristicsof multimedia data--motion video, textor bitmap graphics, and files transmitted independently and simultaneously over an ethernet local area network. Commercial desktop videoteleconferencing hardware and software and Intel's proprietary Digital Video Interactive (DVI) video compression algorithm were used, and typicaltask scenarios were selected. The transmission time, packet size, number of packets, and network utilization of the data were recorded. Each data
type--compressed motion video, text and/or bitmapped graphics, and a compressed image file--was In'st transmitted independendy and itscharacteristics recorded. The results showed that an average bandwidth of 7.4 kiiobits per second (kbps) was used to transmit graphics; an average
bandwidth of 86.8 kbps was used to transmit an 18.9-kilobyte (kB) image file; a bandwidth of 728.9 kbps was used to transmit compressed motionvideo at 15 frames per second (fps); and a bandwidth of 75.9 kbps was used to transmit compressed motion video at 1.5 fps. Average packet sizes
were 93.3 bytes for graphics, 498.5 bytes for the image file, 345.8 bytes for motion video at 15 fps, and 341.9 bytes for motion video at 1.5 fps.Simultaneous transmission of multimedia data types was also characterized. The multimedia packets used transmission bandwidths of
341.4 kbps and 105.8 kbps. Bandwidth utilization varied according to the frame rate (frames per second) setting for the transmission of motion video.
Packetsizedid not vary significantly between the data types.When these characteristics are applied to Space Station Freedom (SSF), the packet sizes fall within the maximum specified by the Consultative
Committee for Space Data Systems (CCSDS). The uplink of imagery to SSF may be performed at minimal frame rates and/or within seconds of delay,
depending on the user's allocated bandwidth. Furth_ research to identify the acceptable delay interval and its impact on human performance isrequired. Additional studies in network performance using various video compression algorithms and integrated multimedia techniques are needed
to determine the optimal design approach for utilizing SSF's data communications system.
14. SUBJECT TERMS
Video compression, Multimedia, Networks
17. SECURITY CLASSIFICATION 18. SECURITY CLASSIFICATIONOF REPORT OF THIS PAGE
Unclassified Unclassified=
NSN 7540-O1-280-5500
19. SECURITY CLASSIFICATIONOF ABSTRACT
lS. NUMBER OF PAGES
1216. PRICE CODE
A02
20. LIMITATION OF ABSTRAC
Standard Form 298 (Rev. 2-89)Preocfibed by ANSI Std. Z39-la


![ISSCC 2006 / SESSION 22 / LOW POWER MULTIMEDIA / 22C][2006... · 2019-05-30 · ISSCC 2006 / SESSION 22 / LOW POWER MULTIMEDIA / 22.6 22.6 A 5mW MPEG4 SP Encoder with 2D Bandwidth-Sharing](https://img.pdfslide.net/doc/110x75/5f430d11a734275dbc2d02cd/isscc-2006-session-22-low-power-multimedia-22-c2006-2019-05-30-isscc.jpg)