Embed Size (px)
Citation preview
Bangladesh Steel Re-Rolling Mills Limited
EXPERIMENTAL STUDY ON BOND PERFORMANCE OF EPOXY
COATED BARS AND UNCOATED DEFORMED BARS IN CONCRETE
DR. ISHTIAQUE AHMED
DR. TANVIR MANZUR
IKRAM HASAN EFAZ
TOUSIF MAHMOOD
MARCH 2017
Department of Civil Engineering
Bangladesh University of Engineering & Technology (BUET), Dhaka-1000, Bangladesh
Disclaimer
This report was prepared based on the experimental study conducted at the laboratory of
Bangladesh University of Engineering and Technology, Dhaka under sponsorship from
Bangladesh Steel Re-Rolling Mills Limited (BSRM). The contents of this publication do not
necessarily reflect the views and policies of the university or BSRM.
This report was prepared under the supervision of faculty members whose name appears in the
cover page. While endeavoring to provide practical and accurate information, BSRM, BUET
and the authors, assume no liability for, nor express or imply any warranty with regard to the
information contained herein. Information contained in this report shall be used in compliance
with the established engineering practice under guidance of the relevant code.
Acknowledgement
The authors express sincere appreciation to Bangladesh Steel Re-Rolling Mills Limited (BSRM) for
arranging publication of this paper. Under a MoU between BSRM and BUET, BSRM has also provided
funds for conducting experimental program for flexural behavior of beams reinforced with FBECR as
well as direct pull out tests. Cooperation received from Mr. M. Firoze, Head of Product Development and
Marketing, BSRM is particularly acknowledged for his enthusiastic efforts in collecting the recent
research publications from across the globe.
Abstract
Fusion bonded epoxy coated rebar (FBECR) has been in use in USA and other countries for over forty
years to protect corrosion led damage of RC structures. Structures that are exposed to extreme weathers,
particularly coastal structures exposed to salinity, are in immense risk of rebar corrosion. Durability of
these structure can be improved with a consequent reduction in life-cycle cost if FBECR is used instead
of conventional steel rebars with minimal additional cost. This report reviews the salient features of using
FBECR including its past performances and construction challenges. Laboratory tests have been
conducted at BUET to compare bond performance in flexural members as well as bond performance
under direct pull out of locally produced epoxy coated rebar (ECR) used with local construction
materials. ECR reinforced beams, constructed with stone-chips and brick-chips aggregates, demonstrated
identical response and behavior with those reinforced with black bars. The bond strength of ECR in
concrete is less than that of black bars. However, with higher strength concrete (3500 psi or higher), the
direct pull out tests of embedded ECR demonstrated bar yielding type failure. Code provisions in ACI,
BNBC, and AASHTO permit use of ECR with minimal change in design process. Improper handling and
uncontrolled field fabrication may cause damage to coating and may lead to counterproductive results.
With special care, and adequate provision for handling, transporting and fabrication in-place, the use of
FBECR will be beneficial for structures that are particularly vulnerable to early deterioration due to
corrosion of rebars.
Key Words:
Epoxy coated rebar, corrosion protection, durability, flexural performance.
i
TABLE OF CONTENTS
CHAPTER 1 Introduction .......................................................................................................................... 1
1.1 General ......................................................................................................................................... 1
1.2 Objectives .................................................................................................................................... 1
1.3 Report Outline .............................................................................................................................. 1
1.3.1 Chapter 1 .............................................................................................................................. 1
1.3.2 Chapter 2 .............................................................................................................................. 2
1.3.3 Chapter 3 .............................................................................................................................. 2
1.3.4 Chapter 4 .............................................................................................................................. 2
1.3.5 Chapter 5 .............................................................................................................................. 2
CHAPTER 2 Literature Review ................................................................................................................. 3
2.1 Deterioration of Concrete Due to Rebar Corrosion ..................................................................... 3
2.1.1 Corrosion Process ................................................................................................................ 3
2.1.2 Effect of Chlorides ............................................................................................................... 5
2.1.3 Carbonation of Embedded Steel........................................................................................... 5
2.1.4 The Influence of Cracks in the Concrete on the Corrosion of Embedded Steel .................. 6
2.1.5 Damages to Concrete Due to Corrosion of Steel Reinforcement ......................................... 7
2.2 Methods of Improving Concrete Durability by Protecting Rebars .............................................. 8
2.2.1 Galvanized Steel Reinforcing Bars ...................................................................................... 8
2.2.2 Stainless Steel Reinforcing Bars .......................................................................................... 9
2.2.3 Non-metallic Reinforcement ................................................................................................ 9
2.2.4 Epoxy Coated Bars............................................................................................................... 9
2.3 Design and Construction Related Challenges of using Epoxy Coated Bars .............................. 12
2.3.1 Bond Related Problem of ECR .......................................................................................... 14
2.3.2 Care During Manufacturing, Handling, Fabrication and Construction .............................. 14
2.3.3 Quality Control Issues ........................................................................................................ 17
2.3.4 Historic Performance of ECR ............................................................................................ 18
2.4 Possible Use of Epoxy Coated Bar in Bangladesh Context ....................................................... 20
CHAPTER 3 Experimental Program ....................................................................................................... 21
3.1 Background ................................................................................................................................ 21
3.2 Objectives .................................................................................................................................. 21
3.3 Test Specimens .......................................................................................................................... 23
3.3.1 Pull Out Test Specimens .................................................................................................... 23
3.3.2 Flexure Test Specimens ..................................................................................................... 25
3.4 Material Properties ..................................................................................................................... 26
3.4.1 Pull out Test ....................................................................................................................... 27
3.4.2 Flexure Test ....................................................................................................................... 30
3.5 Fabrication of the specimens...................................................................................................... 31
3.5.1 Pull out specimens ............................................................................................................. 31
3.5.2 Flexure Specimens ............................................................................................................. 31
3.6 Instrumentation .......................................................................................................................... 32
3.6.1 Pull out Test ....................................................................................................................... 32
3.6.2 Flexure Test ....................................................................................................................... 33
3.7 Testing Procedure ...................................................................................................................... 33
3.7.1 Pull out Test ....................................................................................................................... 33
3.7.2 Flexure Test ....................................................................................................................... 34
ii
CHAPTER 4 Results of Experiments ...................................................................................................... 35
4.1 Results of Pull-out Test .............................................................................................................. 36
4.1.1 Comparison of Bond Performance of ECR and BB of Type I-SC ..................................... 36
4.1.2 Comparison of Bond Performance of ECR and BB of Type I-BC .................................... 39
4.1.3 Comparison of Bond Performance of ECR and BB of Type II-SC ................................... 42
4.1.4 Comparison of Bond Performance of ECR and BB of Type III-SC .................................. 45
4.1.5 Comparison of Bond Performance of ECR and BB of Type IV-BC ................................. 48
4.1.6 Comparison of Bond Performance of ECR and BB of Type I-SC-FLd ............................. 52
4.2 Results of Flexural Test ............................................................................................................. 55
4.2.1 Comparison of Flexural Test Response of ECR and BB Reinforced Beam ...................... 56
4.2.2 Comparison of Flexural Bond Strength of ECR and BB reinforced beams ....................... 84
CHAPTER 5 Conclusions and Recommendations .................................................................................. 86
Recommendations ...................................................................................................................................... 87
References 88
LIST OF FIGURES
Fig. – 2.1: Corrosion of rebar in concrete. ................................................................................................... 4
Fig. – 2.2: Rebar corrosion leads to cracking and spalling. ......................................................................... 4
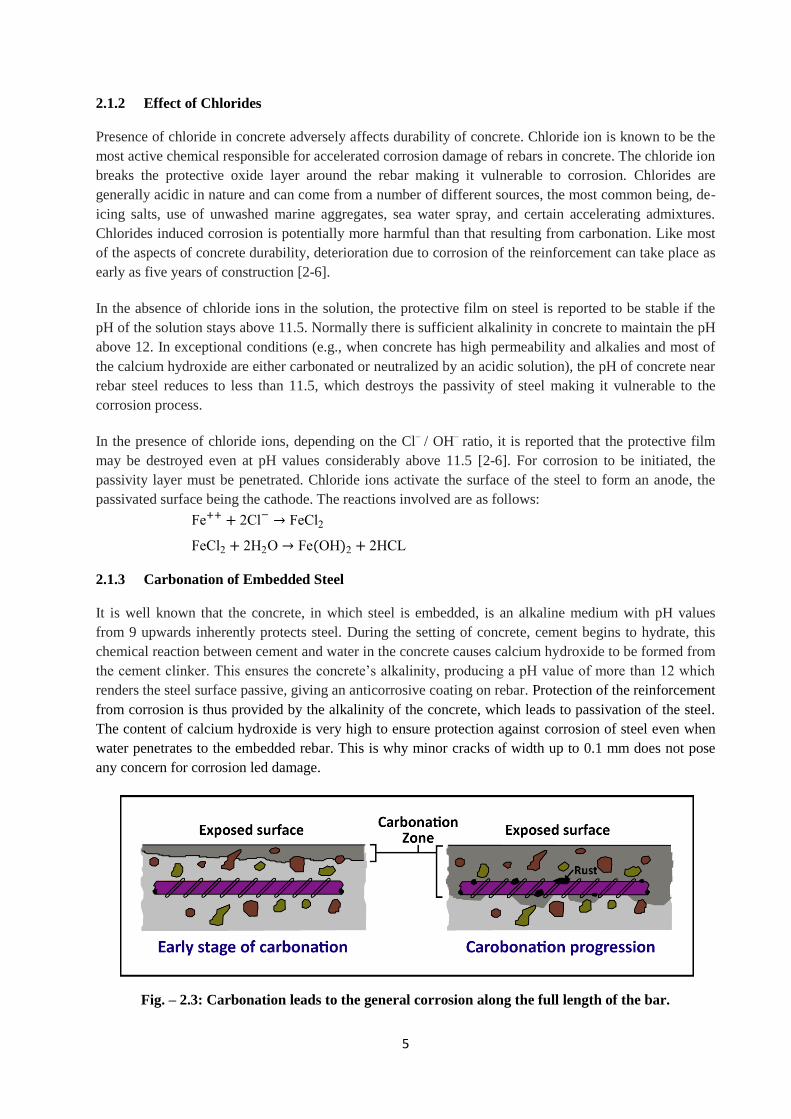
Fig. – 2.3: Carbonation leads to the general corrosion along the full length of the bar. .............................. 5
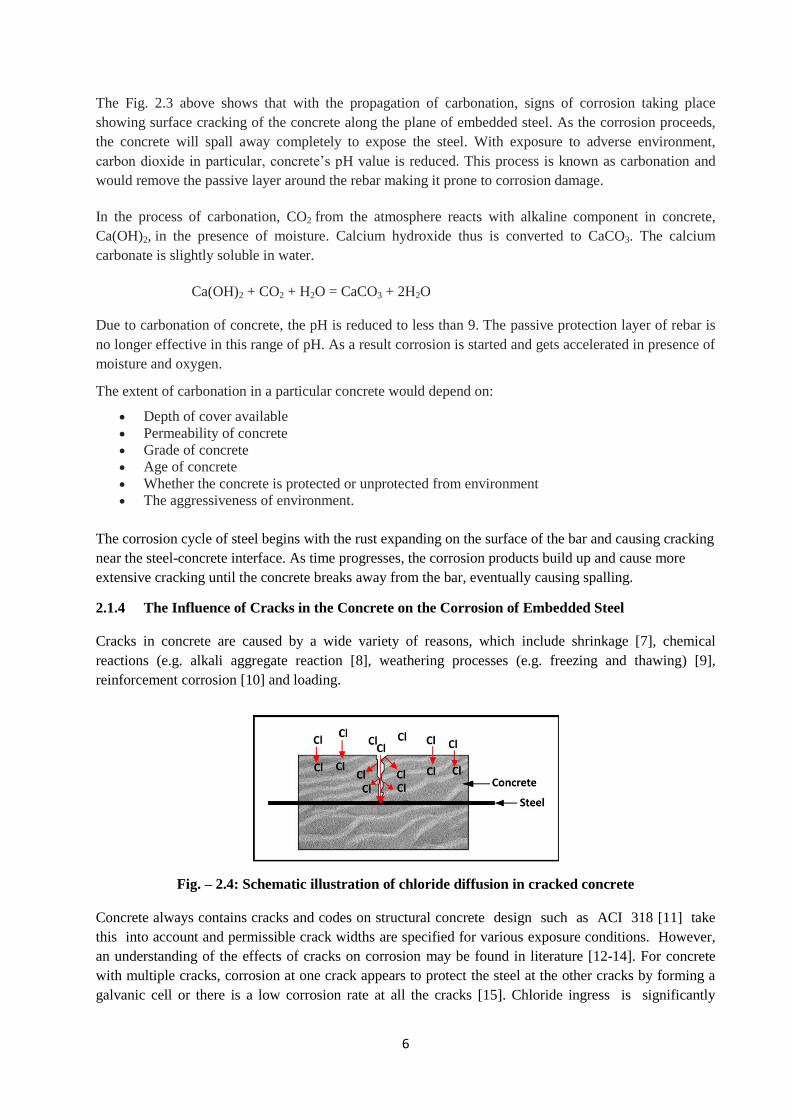
Fig. – 2.4: Schematic illustration of chloride diffusion in cracked concrete ............................................... 6
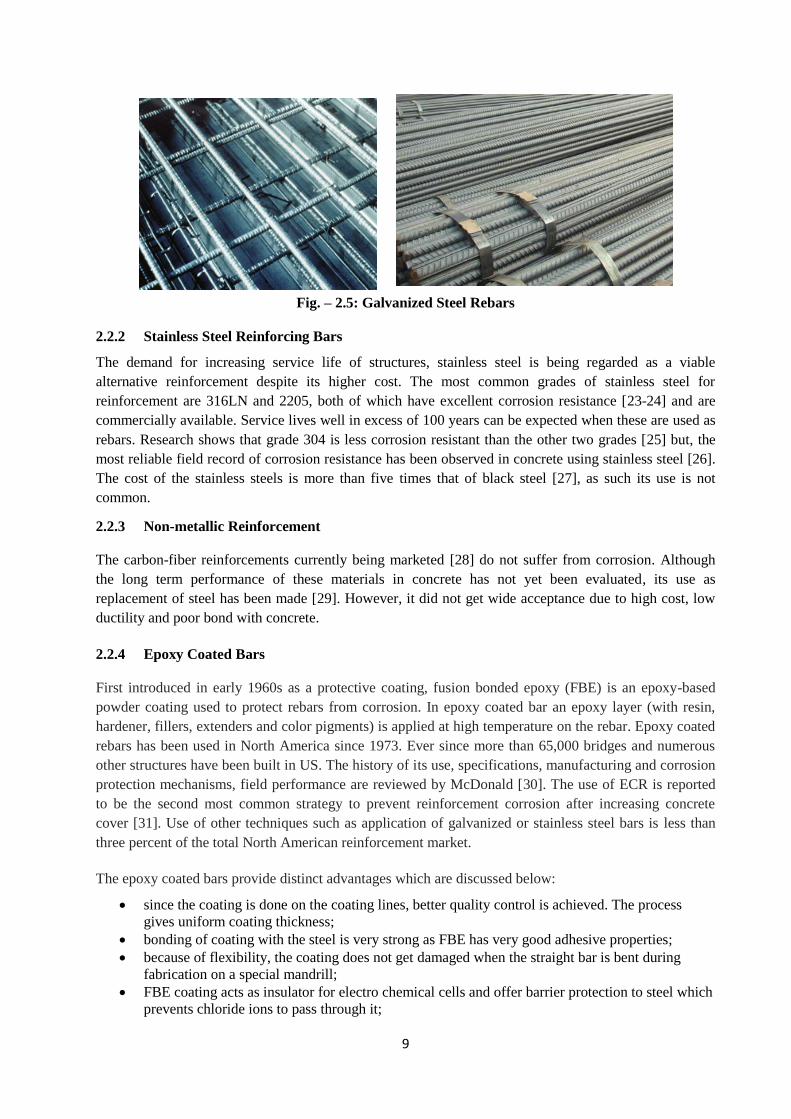
Fig. – 2.5: Galvanized Steel Rebars ............................................................................................................. 9
Fig. – 2.6: Fusion Bonded Epoxy Coated bars .......................................................................................... 10
Fig. – 2.7: Reduced rate Half-cell redox reaction in epoxy coated reinforcements [32] ........................... 10
Fig. – 2.8: Comparison of various rebar option for corrosion protection [34] ........................................... 11
Fig. – 2.9: Tuuti Model for Predicting Service Life of Concrete Structure [2] ......................................... 12
Fig. – 2.10: (a) Storage (b) Bending of bars (c) Patching of damaged area (d) Fabrication ...................... 13
Fig. – 2.11:Extra Care for Fabrication and Placement: (a) placement at casting yard (b) coating applied to
bar ends (c) & (d) repair of bar damage using special epoxy. ................................................................... 17
Fig. – 2.12: Three ECR bars after exposure in Cl contaminated concrete, first with coating holidays
identified (upper photograph of each bar pair) and, second, showing bar appearance upon removal of
disbanded coating (lower photograph of each pair).[61] ........................................................................... 19
Fig. – 3.1: Bond-ship behavior of rebar in concrete under different state of confinement [81] ................ 21
Fig. – 3.2: Pull-out test experimental set-up and dial gauge ...................................................................... 22
Fig. – 3.3: Experimental setup for flexural study with two point loading. ................................................ 23
Fig. – 3.4: Arrangement of Reinforcements at the centre of the specimen ................................................ 24
Fig. – 3.5: Arrangement of Reinforcement ................................................................................................ 26
Fig. – 3.6: Arrangement of Reinforcement ................................................................................................ 26
Fig. – 3.7(a): Load-Deflection curve for 12mm Epoxy Coated bars ......................................................... 28
Fig. – 3.7(b): Load-Deflection curve for 12mm Uncoated bars ................................................................ 28
Fig. – 3.7(c): Load-Deflection curve for 16mm Epoxy Coated bars ......................................................... 29
Fig. – 3.7(d): Load-Deflection curve for 16mm Uncoated bars ................................................................ 29
Fig. – 3.9: Pull out specimens during casting ............................................................................................ 31
Fig. – 3.10: Casting Procedure of beam specimen ..................................................................................... 32
Fig. – 3.11: FE model of the pull-out test frame ........................................................................................ 32
Fig. – 3.12: Pull-out test frame in UTM .................................................................................................... 32
Fig. – 3.13: Pull-out test specimen and instrumentation ............................................................................ 32
iii
Fig. – 3.14: Pull-out test frame with specimen in the UTM ..................................................................... 34
Fig. – 3.15: Two HD video cameras to record the data at both loaded and unloaded end of the bars. ...... 34
Fig. – 3.16: Experimental test setup for flexure. ........................................................................................ 35
Fig. – 3.17: Crack Comparator................................................................................................................... 35
Fig. – 4.1: Comparison of loads-slip response of pull-out specimen (3 ksi, stone chips, 12 mm bar)
reinforced with ECR and BB ..................................................................................................................... 37
Fig. – 4.2: Comparison of loads-slip response of pull-out specimen (3 ksi, stone chips, 16 mm bar)
reinforced with ECR and BB ..................................................................................................................... 37
Fig. – 4.3: Failure Modes of ES1R1 and US1R1 (3Ksi, 12mm Epoxy and Uncoated bars ) samples ....... 39
Fig. – 4.4: Failure Modes of ES1R2 and US1R2 (3Ksi, 16mm Epoxy and Uncoated bars ) samples ....... 39
Fig. – 4.5: Comparison of loads-slip response of pull-out specimen (3 ksi, brick chips, 12 mm bar)
reinforced with ECR and BB ..................................................................................................................... 40
Fig. – 4.6: Comparison of loads-slip response of pull-out specimen (3 ksi, brick chips, 16 mm bar)
reinforced with ECR and BB ..................................................................................................................... 40
Fig. – 4.7: Failure Modes of EB1R1 and UB1R1 (3Ksi, 12mm Epoxy and Uncoated bars ) sample ....... 42
Fig. – 4.8: Failure Modes of EB1R2 and UB1R2 (3Ksi, 16mm Epoxy and Uncoated bars ) samples ...... 42
Fig. – 4.9: Comparison of loads-slip response of pull-out specimen (3.5 ksi, Stone chips, 12 mm bar)
reinforced with ECR and BB ..................................................................................................................... 43
Fig. – 4.10: Comparison of loads-slip response of pull-out specimen (3.5 ksi, Stone chips, 16 mm bar)
reinforced with ECR and BB ..................................................................................................................... 43
Fig. – 4.11: Failure Modes of ES2R1 and US2R1 (3.5 Ksi, 12mm Epoxy and Uncoated bars ) samples . 45
Fig. – 4.12: Failure Modes of ES2R2 and US2R2 (3.5 Ksi, 16mm Epoxy and Uncoated bars ) samples . 45
Fig. – 4.13: Comparison of loads-slip response of pull-out specimen (4 ksi, Stone chips, 12 mm bar)
reinforced with ECR and BB ..................................................................................................................... 46
Fig. – 4.15: Failure Modes of ES3R1 and US3R1 (4 Ksi, 12mm Epoxy and Uncoated bars ) samples .... 48
Fig. – 4.16: Failure Modes of ES3R2 and US3R2 (4 Ksi, 16mm Epoxy and Uncoated bars ) samples .... 48
Fig. – 4.17: Comparison of loads-slip response of pull-out specimen (2.5 ksi, Brick chips, 12 mm bar)
reinforced with ECR and BB ..................................................................................................................... 49
Fig. – 4.18: Comparison of loads-slip response of pull-out specimen (2.5 ksi, Brick chips, 16 mm bar)
reinforced with ECR and BB ..................................................................................................................... 49
Fig. – 4.19: Failure Modes of ES3R1 and US3R1 (2.5 Ksi, 16mm Epoxy and Uncoated bars ) samples . 51
Fig. – 4.20: Failure Modes of ES3R1 and US3R1 (2.5 Ksi, 16mm Epoxy and Uncoated bars ) samples . 51
Fig. – 4.21: Testing of ES1R1_FLd and US1R1_FLd (3 Ksi, 12 mm Epoxy and Uncoated bars ) samples
................................................................................................................................................................... 53
Fig. – 4.22: Failure Modes of ES1R1_FLd and US1R1_FLd (3 Ksi, 12 mm Epoxy and Uncoated bars )
samples ....................................................................................................................................................... 53
Fig. – 4.23: Failure Modes of ES1R1_FLd and US1R1_FLd (3 Ksi, 12 mm Epoxy and Uncoated bars )
samples ....................................................................................................................................................... 54
Fig. – 4.24: Failure Modes of ES1R1_FLd (3 Ksi, 12 mm Epoxy Coated bars ) samples ........................ 54
Fig. – 4.25: Failure Modes of US1R1_FLd (3 Ksi, 12 mm Uncoated bars ) samples ............................... 55
Fig. – 4.26: Comparison of loads-deflection response of beams (3 ksi, stone chips, 3-12 mm bars)
reinforced with ECR and BB ..................................................................................................................... 56
Fig. – 4.27: Comparison of deflection time response of beams (3 ksi, stone chips, 3-12 mm bars)
reinforced with ECR and BB ..................................................................................................................... 57
Fig. – 4.28: Comparison of load-crack width response of beams (3 ksi, stone chips, 3-12 mm bars)
reinforced with ECR and BB ..................................................................................................................... 57
Fig. – 4.29: Comparison of Crack Pattern and Deflected Shape for Beams (3 ksi, stone chips, 3-12 mm
bars) reinforced with ECR and BB ............................................................................................................ 59
iv
Fig. – 4.30: Comparison of loads-deflection response of beams (3 ksi, brick chips, 3-12 mm bars)
reinforced with ECR and BB ..................................................................................................................... 59
Fig. – 4.31: Comparison of deflection time response of beams (3 ksi, brick chips, 3-12 mm bars)
reinforced with ECR and BB ..................................................................................................................... 60
Fig. – 4.32: Comparison of load-crack width response of beams (3 ksi, brick chips, 3-12 mm bars)
reinforced with ECR and BB ..................................................................................................................... 60
Fig. – 4.33: Comparison of Crack Pattern and Deflected Shape for Beams (3 ksi, brick chips, 3-12 mm
bars) reinforced with ECR and BB ............................................................................................................ 62
Fig. – 4.34: Comparison of loads-deflection response of beams (3.5 ksi, stone chips, 3-12 mm bars)
reinforced with ECR and BB ..................................................................................................................... 63
Fig. – 4.35: Comparison of deflection time response of beams (3.5 ksi, stone chips, 3-12 mm bars)
reinforced with ECR and BB ..................................................................................................................... 64
Fig. – 4.36: Comparison of load-crack width response of beams (3.5 ksi, stone chips, 3-12 mm bars)
reinforced with ECR and BB ..................................................................................................................... 64
Fig. – 4.37: Comparison of Crack Pattern and Deflected Shape for Beams (3.5 ksi, stone chips, 3-12 mm
bars) reinforced with ECR and BB ............................................................................................................ 66
Fig. – 4.38: Comparison of loads-deflection response of beam (3 ksi, stone chips, 2-16 mm Spliced bars)
reinforced with ECR and BB ..................................................................................................................... 67
Fig. – 4.39: Comparison of deflection time response of beams (3 ksi, stone chips, 2-16 mm Spliced bars)
reinforced with ECR and BB ..................................................................................................................... 67
Fig. – 4.40: Comparison of load-crack width response of beams (3 ksi, stone chips 2-16 mm Spliced bars)
reinforced with ECR and BB ..................................................................................................................... 68
Fig. – 4.41: Comparison of Crack Pattern and Deflected Shape for Beams (3 ksi, stone chips, 2-16 mm
Spliced bars) reinforced with ECR and BB ............................................................................................... 68
Fig. – 4.42: Comparison of loads-deflection response of beams (3 ksi, brick chips, 2-16 mm Spliced bars)
reinforced with ECR and BB ..................................................................................................................... 69
Fig. – 4.43: Comparison of deflection time response of beams (3 ksi, brick chips, 2-16 mm Spliced bars)
reinforced with ECR and BB ..................................................................................................................... 69
Fig. – 4.44: Comparison of load-crack width response of beams (3 ksi, brick chips, 2-16 mm Spliced
bars) reinforced with ECR and BB ............................................................................................................ 70
Fig. – 4.45: Comparison of Crack Pattern and Deflected Shape for Beams (3 ksi, brick chips, , 2-16 mm
Spliced bars) reinforced with ECR and BB ............................................................................................... 70
Fig. – 4.46: Comparison of loads-deflection response of beams (3 ksi, stone chips, 2-16 mm bars)
reinforced with ECR and BB ..................................................................................................................... 71
Fig. – 4.47: Comparison of deflection time response of beams (3 ksi, stone chips, 2-16 mm bars)
reinforced with ECR and BB ..................................................................................................................... 72
Fig. – 4.48: Comparison of load-crack width response of beams (3 ksi, stone chips, 2-16 mm bars)
reinforced with ECR and BB ..................................................................................................................... 72
Fig. – 4.49: Comparison of loads-deflection response of beams (3 ksi, brick chips, 2-16 mm bars)
reinforced with ECR and BB ..................................................................................................................... 73
Fig. – 4.50: Comparison of deflection time response of beams (3 ksi, brick chips, 2-12 mm bars)
reinforced with ECR and BB ..................................................................................................................... 74
Fig. – 4.51: Comparison of load-crack width response of beams (3 ksi, brick chips, 2-16 mm bars)
reinforced with ECR and BB ..................................................................................................................... 74
Fig. – 4.52: Comparison of Crack Pattern and Deflected Shape for Beams (3 ksi, stone chips and brick
chips, -16 mm bars) reinforced with ECR and BB .................................................................................... 76
Fig. – 4.53: Comparison of loads-deflection response of beams (3.5 ksi, stone chips, 2-16 mm bars)
reinforced with ECR and BB ..................................................................................................................... 77
v
Fig. – 4.54: Comparison of deflection time response of beams (3.5 ksi, stone chips, 2-16 mm bars)
reinforced with ECR and BB ..................................................................................................................... 77
Fig. – 4.55: Comparison of load-crack width response of beams (3.5 ksi, stone chips, 2-16 mm bars)
reinforced with ECR and BB ..................................................................................................................... 78
Fig. – 4.56: Comparison of Crack Pattern and Deflected Shape for Beams (3.5 ksi, stone chips, 2-16 mm
bars) reinforced with ECR and BB ............................................................................................................ 79
Fig. – 4.57: Comparison of loads-deflection response of beam (3.5 ksi, stone chips, 2-16 mm Spliced
bars) reinforced with ECR and BB ............................................................................................................ 79
Fig. – 4.58: Comparison of deflection time response of beams (3.5 ksi, stone chips, 2-16 mm Spliced
bars) reinforced with ECR and BB ............................................................................................................ 80
Fig. – 4.59: Comparison of load-crack width response of beams (3.5 ksi, stone chips 2-16 mm Spliced
bars) reinforced with ECR and BB ............................................................................................................ 80
Fig. – 4.60: Comparison of Crack Pattern and Deflected Shape for Beams (3.5 ksi, stone chips, 2-16 mm
Spliced bars) reinforced with ECR and BB ............................................................................................... 81
Fig. – 4.61: Comparison of loads-deflection response of beams (2.5 ksi, brick chips, 3-12 mm bars)
reinforced with ECR and BB ..................................................................................................................... 82
Fig. – 4.62: Comparison of deflection time response of beams (2.5 ksi, brick chips, 3-12 mm bars)
reinforced with ECR and BB ..................................................................................................................... 82
Fig. – 4.63: Comparison of load-crack width response of beams (2.5 ksi, brick chips, 3-12 mm bars)
reinforced with ECR and BB ..................................................................................................................... 83
Fig.– 4.64: Comparison of Crack Pattern and Deflected Shape for Beams (2.5 ksi, brick chips, 3-12 mm
bars) reinforced with ECR and BB ............................................................................................................ 84
LIST OF TABLES
Table-2.1: Cost Comparison of Different Reinforcement Types [33] ....................................................... 11
Table 2.2: Chronology of Changes Made to ASTM A775 [49] ................................................................ 18
Table – 3.1: Test matrix for pull out test of ECR and black bar. ............................................................... 24
Table – 3.2: Details of Beam Specimens Prepared for Flexural Testing ................................................... 25
Table 3.3 : Compressive Strength of Concrete .......................................................................................... 27
Table 3.4: Steel properties of tested Epoxy Coated and Black Bars .......................................................... 27
Table 3.5 : Compressive Strength of Concrete .......................................................................................... 30
Table – 3.6: Summary of Location, and Function of External Devices ..................................................... 33
Table – 3.7: Summary of Location, and Function of External Device ...................................................... 33
Table – 4.1: Pull out test specimens ........................................................................................................... 36
Table – 4.2: Comparison of Failure Mode and Ultimate Failure Load of ECR and BB under Direct Pull-
out…………………………………………………………………………………………………………38
Table – 4.3: Comparison of Failure Mode and Ultimate Failure Load of ECR and BB under Direct Pull-
out…………………………………………………………………………………………………………41
Table – 4.4: Comparison of Failure Mode and Ultimate Failure Load of ECR and BB under Direct Pull-
out .............................................................................................................................................................. 44
Table – 4.5: Comparison of Failure Mode and Ultimate Failure Load of ECR and BB under Direct Pull-
out…………………………………………………………………………………………………………46
Table – 4.5: Comparison of Failure Mode and Ultimate Failure Load of ECR and BB under Direct Pull-
out…………………………………………………………………………………………………………47
Table – 4.6: Comparison of Failure Mode and Ultimate Failure Load of ECR and BB under Direct Pull-
out…………………………………………………………………………………………………………50
vi
Table – 4.7: Comparison of Failure Mode and Ultimate Failure Load of ECR and BB under Direct Pull-
out…………………………………………………………………………………………………………52
Table – 4.8: Beam Specimens .................................................................................................................... 55
Table – 4.9: Comparison of Deflections at Design Load for Beams (3 ksi, stone chips, 3-12 mm bars)
reinforced with ECR and BB ..................................................................................................................... 57
Table – 4.10: Comparison of Crack Width at Design Load for Beams (3 ksi, stone chips, 3-12 mm bars)
reinforced with ECR and BB ..................................................................................................................... 58
Table – 4.11: Comparison of Number of Total Cracks for Beams (3 ksi, stone chips, 3-12 mm bars)
reinforced with ECR and BB ..................................................................................................................... 58
Table – 4.12: Comparison of Cracking Load, Spalling Load and Ultimate Load Values for Beams (3 ksi,
stone chips, 3-12 mm bars) reinforced with ECR and BB ......................................................................... 58
Table – 4.13: Comparison of Deflections at Design Load for Beams (3 ksi, brick chips, 3-12 mm bars)
reinforced with ECR and BB ..................................................................................................................... 60
Table – 4.14: Comparison of Crack Width at Design Load for Beams (3 ksi, brick chips, 3-12 mm bars)
reinforced with ECR and BB ..................................................................................................................... 61
Table – 4.15: Comparison of Number of Total Cracks for Beams (3 ksi, brick chips, 3-12 mm bars)
reinforced with ECR and BB ..................................................................................................................... 61
Table – 4.16: Comparison of Cracking Load, Spalling Load and Ultimate Load Values for Beams (3 ksi,
brick chips, 3-12 mm bars) reinforced with ECR and BB ......................................................................... 61
Table – 4.17: Comparison of Deflections at Design Load for Beams (3.5 ksi, stone chips, 3-12 mm bars)
reinforced with ECR and BB ..................................................................................................................... 63
Table – 4.18: Comparison of Crack Width at Design Load for Beams (3.5 ksi, stone chips, 3-12 mm bars)
reinforced with ECR and BB ..................................................................................................................... 65
Table – 4.19: Comparison of Number of Total Cracks for Beams (3.5 ksi, stone chips, 3-12 mm bars)
reinforced with ECR and BB ..................................................................................................................... 65
Table – 4.20: Comparison of Cracking Load, Spalling Load and Ultimate Load Values for Beams (3.5
ksi, stone chips, 3-12 mm bars) reinforced with ECR and BB .................................................................. 65
Table – 4.21: Comparison of Cracking Load, Spalling Load and Ultimate Load Values for Beams (3 ksi,
stone chips, 2-16 mm Spliced bars) reinforced with ECR and BB ............................................................ 68
Table – 4.22: Comparison of Cracking Load, Spalling Load and Ultimate Load Values for Beams (3 ksi,
brick chips, 2-16 mm Spliced bars) reinforced with ECR and BB ............................................................ 70
Table – 4.23: Comparison of Deflections at Design Load for Beams (3 ksi, stone chips, 2-16 mm bars)
reinforced with ECR and BB ..................................................................................................................... 72
Table – 4.24: Comparison of Crack Width at Design Load for Beams (3 ksi, stone chips, 2-16 mm bars)
reinforced with ECR and BB ..................................................................................................................... 73
Table – 4.25: Comparison of Number of Total Cracks for Beams (3 ksi, stone chips, 2-16 mm bars)
reinforced with ECR and BB ..................................................................................................................... 73
Table – 4.26: Comparison of Cracking Load, Spalling Load and Ultimate Load Values for Beams (3 ksi,
stone chips, 2-16 mm bars) reinforced with ECR and BB ......................................................................... 73
Table – 4.27: Comparison of Deflections at Design Load for Beams (3 ksi, brick chips, 2-16 mm bars)
reinforced with ECR and BB ..................................................................................................................... 74
Table – 4.28: Comparison of Crack Width at Design Load for Beams (3 ksi, brick chips, 2-16 mm bars)
reinforced with ECR and BB ..................................................................................................................... 75
Table – 4.29: Comparison of Number of Total Cracks for Beams (3 ksi, brick chips, 2-16 mm bars)
reinforced with ECR and BB ..................................................................................................................... 75
Table – 4.30: Comparison of Cracking Load, Spalling Load and Ultimate Load Values for Beams (3 ksi,
brick chips, 2-16 mm bars) reinforced with ECR and BB ......................................................................... 75
vii
Table – 4.31: Comparison of Deflections at Design Load for Beams (3.5 ksi, stone chips, 2-16 mm bars)
reinforced with ECR and BB ..................................................................................................................... 77
Table – 4.32: Comparison of Crack Width at Design Load for Beams (3.5 ksi, stone chips, 2-16 mm bars)
reinforced with ECR and BB ..................................................................................................................... 78
Table – 4.33: Comparison of Number of Total Cracks for Beams (3.5 ksi, stone chips, 2-16 mm bars)
reinforced with ECR and BB ..................................................................................................................... 78
Table – 4.34: Comparison of Cracking Load, Spalling Load and Ultimate Load Values for Beams (3.5
ksi, stone chips, 2-16 mm bars) reinforced with ECR and BB .................................................................. 78
Table – 4.35: Comparison of Cracking Load, Spalling Load and Ultimate Load Values for Beams (3.5
ksi, stone chips, 2-16 mm Spliced bars) reinforced with ECR and BB ..................................................... 80
Table – 4.36: Comparison of Deflections at Design Load for Beams (2.5 ksi, brick chips, 3-12 mm bars)
reinforced with ECR and BB ..................................................................................................................... 82
Table – 4.37: Comparison of Crack Width at Design Load for Beams (2.5 ksi, brick chips, 3-12 mm bars)
reinforced with ECR and BB ..................................................................................................................... 83
Table – 4.38: Comparison of Number of Total Cracks for Beams (2.5 ksi, brick chips, 3-12 mm bars)
reinforced with ECR and BB ..................................................................................................................... 83
Table – 4.39: Comparison of Cracking Load, Spalling Load and Ultimate Load Values for Beams (2.5
ksi, brick chips, 3-12 mm bars) reinforced with ECR and BB .................................................................. 83
Table – 4.40: Comparison of Design and Failure bond strength for black bars and Epoxy coated bars.
…………………………………………………………………………………………………………….84
1
CHAPTER 1
Introduction
1.1 General
The corrosion of steel rebar embedded in concrete is one of the major causes of premature deterioration
of concrete structures. The corrosion process is aggravated under aggressive exposure conditions
particularly with moist condition and presence of salinity. Early deterioration of concrete structures could
lead to serviceability, durability concerns. The associated repair and maintenance would bring the life-
cycle cost issue of the structure in fore front. Various methods of controlling the corrosion problem have
been practiced as industry standard. These include cathodic protection, use of admixtures, slilica fume,
fly ash, slag, and latex in concrete, various surface treatment options of the rebars and use of surface
coating on the concrete. Details of these options are available elsewhere [1]. The particular surface
treatment by application of fusion bonded epoxy coating on rebars will be the fours of this paper.
The effectiveness and durability of fusion bonded epoxy coatings on steel reinforcement (FBECR) in
corrosion prevention has undergone major research in past few decades. The corrosion of steel
reinforcements in concrete by intrusion of chlorides, sulphates H2S and CO2 severely deteriorates
structures’ serviceability, durability and safety. In contrast, epoxy coating acts as a physical and
electrochemical barrier inhibiting the corrosion reaction on steel surface. Recent studies have shown
corrosion rates of epoxy coated steel rebars to be 40-50 times less than that of uncoated bars [2].
Bangladesh construction industry faces the durability concern of concrete infrastructures particularly in
coastal regions due to adverse environmental conditions where reinforcement corrosion is one of prime
reasons for degradation of concrete structures. Epoxy coated steel reinforcement, used since 1973 in US,
may become a viable solution for combating corrosion related durability problem. In order to facilitate
use of FBECR in structures, the design and construction issues should be thoroughly understood by
engineers, constructors and other stakeholders. The quality control issues and improvement of life
expectancy due to its use needs to be identified from industry experience and research findings. This
paper aims to review historical and technical aspects of using epoxy coated steel reinforcements in
concrete structures and its potential application in Bangladesh as a means of effective corrosion
protection of embedded steel rebar.
1.2 Objectives
The main objectives of the study were set as follows:
a. Compare the bond strength of epoxy-coated reinforcing steel bars and uncoated deformed bars.
b. Construct a “Bond Stress vs. Slip” diagram to better understand the slip behavior of epoxy-
coated bars as compared to conventional deformed bars.
c. Assess the flexural performance of the beams and the effect of concrete strength, aggregate type
and bar diameter on beams reinforced with epoxy and uncoated bars in standard two point beam
flexural test.
1.3 Report Outline
This report includes 6 chapters. A brief description of the chapters follows.
1.3.1 Chapter 1
This chapter provides a general introduction and the objectives of the project.
2
1.3.2 Chapter 2
This chapter provides a brief literature review on the use of epoxy coated rebars in RCC members. The
literature review covers the history of epoxy coated rebars, a summary of the provisions on the use of
epoxy coated reinforcement reported in code documents.
1.3.3 Chapter 3
Chapter 3 provides details on the experimental program and the particular specimens tested. In addition,
this chapter contains details of the instrumentation of the specimens. This chapter also includes specifics
of the test set-up and testing procedures.
1.3.4 Chapter 4
This chapter presents the experimental data and corresponding analysis. The objective of this chapter is
to examine the bond performance of epoxy coating reinforcements in flexure and direct pull out tests,
effect of concrete compressive strength, aggregate types, reinforcement diameter and development
length. Comparisons are made among the specimens to describe the function of different parameters.
1.3.5 Chapter 5
This chapter provides a summary of the research program and states the pertinent conclusions obtained
from the experiments. It also provides recommendations for future study.
3
CHAPTER 2
Literature Review
2.1 Deterioration of Concrete Due to Rebar Corrosion
Reinforced Concrete (RC) is the main construction material used in buildings, bridges, power plants, and
other infrastructure throughout the world. Performance of reinforcement in concrete is vital to provide
desired strength ensuring safety, serviceability, and durability, which are all affected by deterioration of
reinforcement over time. Corrosion of reinforcement is one of the major concerns regarding durability of
RC structures particularly in marine environment. Moreover, corrosion can also be induced through
carbonation, intrusion of chloride, aggregates and admixtures containing corrosive elements, poor
workmanship, exposure to aggressive weather condition etc. Due to its inherent alkaline property,
concrete itself is inert to corrosive chemical reactions. However, presence and intrusion of deleterious
materials in concrete can adversely affect its corrosion resistance. A poor, porous concrete will also be
vulnerable to early deterioration due to rebar corrosion.
Concrete has become the single most widely used construction material of the modern civilization. The
reasons behind the widespread use of concrete in construction industry are low cost of construction as
well as maintenance, ease of construction, excellent fire resistance, high compressive strength and
excellent durability. However, its rather weak tensile property requires steel rebars to be used almost
invariably to counter the shrinkage and tensile force. The embedded steel rebar, mostly made of mild
steel, is susceptible to corrosion if not protected from aggressive environmental agents. This corrosion of
reinforcing steel could lead to early deterioration of concrete structures. To pave the way to a meaningful
discussion towards control of corrosion of steel rebar for construction of durable infrastructures, the
subsequent sections would be devoted to explaining corrosion process and corrosion agents.
2.1.1 Corrosion Process
As naturally occurring iron ore is processed through refinement to produce steel, energy is added to the
metal. Steel has a tendency to release energy to revert back to its natural state, iron oxide
e or e n or hydroxides e e by combining with oxygen in presence of
water. This leads to the fact that the following, four elements must be present for corrosion to take place:
Presence of at least two metals or two locations of a single metal at different energy levels.
Presence of an electrolyte (concrete acts as the electrolyte)
A metallic connection (ties, chair supports or rebar itself acts as metallic connection) between the
two metals.
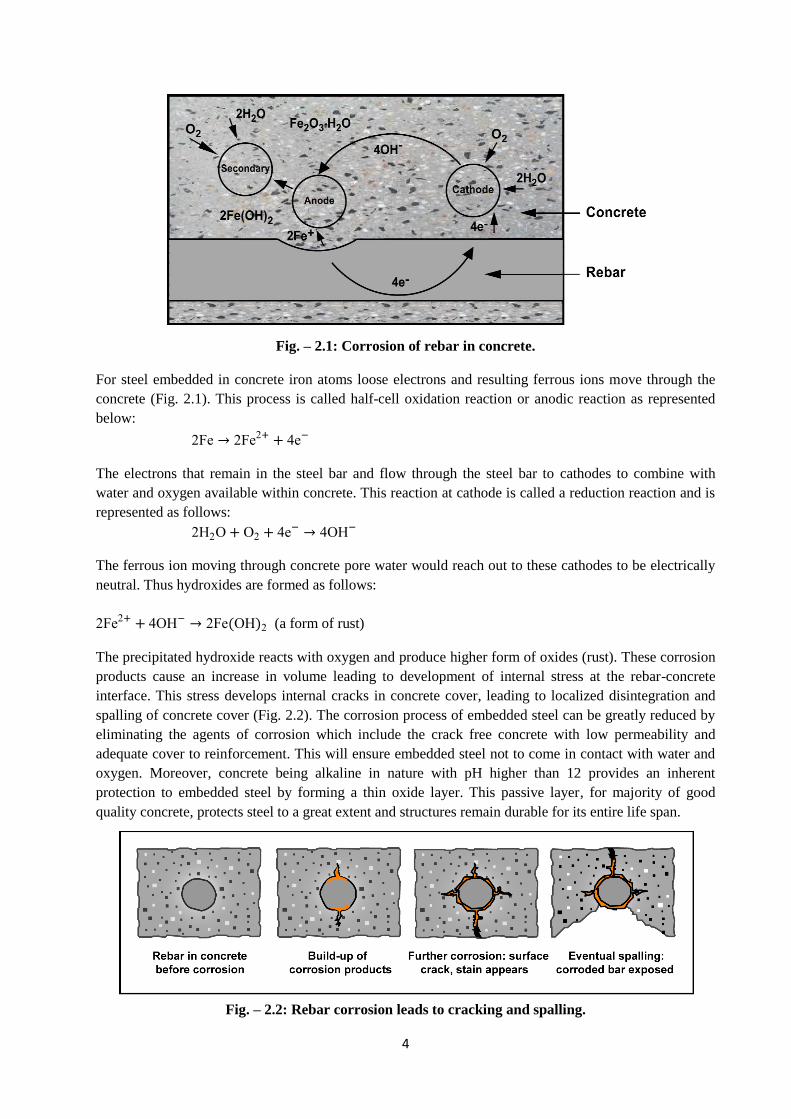
The electro chemical process of corrosion involves flow of charges as shown in Fig. 2.1.
4
Fig. – 2.1: Corrosion of rebar in concrete.
For steel embedded in concrete iron atoms loose electrons and resulting ferrous ions move through the
concrete (Fig. 2.1). This process is called half-cell oxidation reaction or anodic reaction as represented
below:
e e e
The electrons that remain in the steel bar and flow through the steel bar to cathodes to combine with
water and oxygen available within concrete. This reaction at cathode is called a reduction reaction and is
represented as follows:
e
The ferrous ion moving through concrete pore water would reach out to these cathodes to be electrically
neutral. Thus hydroxides are formed as follows:
e e (a form of rust)
The precipitated hydroxide reacts with oxygen and produce higher form of oxides (rust). These corrosion
products cause an increase in volume leading to development of internal stress at the rebar-concrete
interface. This stress develops internal cracks in concrete cover, leading to localized disintegration and
spalling of concrete cover (Fig. 2.2). The corrosion process of embedded steel can be greatly reduced by
eliminating the agents of corrosion which include the crack free concrete with low permeability and
adequate cover to reinforcement. This will ensure embedded steel not to come in contact with water and
oxygen. Moreover, concrete being alkaline in nature with pH higher than 12 provides an inherent
protection to embedded steel by forming a thin oxide layer. This passive layer, for majority of good
quality concrete, protects steel to a great extent and structures remain durable for its entire life span.
Fig. – 2.2: Rebar corrosion leads to cracking and spalling.
5
2.1.2 Effect of Chlorides
Presence of chloride in concrete adversely affects durability of concrete. Chloride ion is known to be the
most active chemical responsible for accelerated corrosion damage of rebars in concrete. The chloride ion
breaks the protective oxide layer around the rebar making it vulnerable to corrosion. Chlorides are
generally acidic in nature and can come from a number of different sources, the most common being, de-
icing salts, use of unwashed marine aggregates, sea water spray, and certain accelerating admixtures.
Chlorides induced corrosion is potentially more harmful than that resulting from carbonation. Like most
of the aspects of concrete durability, deterioration due to corrosion of the reinforcement can take place as
early as five years of construction [2-6].
In the absence of chloride ions in the solution, the protective film on steel is reported to be stable if the
pH of the solution stays above 11.5. Normally there is sufficient alkalinity in concrete to maintain the pH
above 12. In exceptional conditions (e.g., when concrete has high permeability and alkalies and most of
the calcium hydroxide are either carbonated or neutralized by an acidic solution), the pH of concrete near
rebar steel reduces to less than 11.5, which destroys the passivity of steel making it vulnerable to the
corrosion process.
In the presence of chloride ions, depending on the Cl– / OH
– ratio, it is reported that the protective film
may be destroyed even at pH values considerably above 11.5 [2-6]. For corrosion to be initiated, the
passivity layer must be penetrated. Chloride ions activate the surface of the steel to form an anode, the
passivated surface being the cathode. The reactions involved are as follows:
e Cl eCl
eCl e C
2.1.3 Carbonation of Embedded Steel
It is well known that the concrete, in which steel is embedded, is an alkaline medium with pH values
from 9 upwards inherently protects steel. During the setting of concrete, cement begins to hydrate, this
chemical reaction between cement and water in the concrete causes calcium hydroxide to be formed from
the cement clinker. This ensures the concrete’s alkalinity, producing a p value of more than 1 which
renders the steel surface passive, giving an anticorrosive coating on rebar. Protection of the reinforcement
from corrosion is thus provided by the alkalinity of the concrete, which leads to passivation of the steel.
The content of calcium hydroxide is very high to ensure protection against corrosion of steel even when
water penetrates to the embedded rebar. This is why minor cracks of width up to 0.1 mm does not pose
any concern for corrosion led damage.
Fig. – 2.3: Carbonation leads to the general corrosion along the full length of the bar.
6
The Fig. 2.3 above shows that with the propagation of carbonation, signs of corrosion taking place
showing surface cracking of the concrete along the plane of embedded steel. As the corrosion proceeds,
the concrete will spall away completely to expose the steel. With exposure to adverse environment,
carbon dioxide in particular, concrete’s pH value is reduced. This process is known as carbonation and
would remove the passive layer around the rebar making it prone to corrosion damage.
In the process of carbonation, CO2 from the atmosphere reacts with alkaline component in concrete,
Ca(OH)2, in the presence of moisture. Calcium hydroxide thus is converted to CaCO3. The calcium
carbonate is slightly soluble in water.
Ca(OH)2 + CO2 + H2O = CaCO3 + 2H2O
Due to carbonation of concrete, the pH is reduced to less than 9. The passive protection layer of rebar is
no longer effective in this range of pH. As a result corrosion is started and gets accelerated in presence of
moisture and oxygen.
The extent of carbonation in a particular concrete would depend on:
Depth of cover available
Permeability of concrete
Grade of concrete
Age of concrete
Whether the concrete is protected or unprotected from environment
The aggressiveness of environment.
The corrosion cycle of steel begins with the rust expanding on the surface of the bar and causing cracking
near the steel-concrete interface. As time progresses, the corrosion products build up and cause more
extensive cracking until the concrete breaks away from the bar, eventually causing spalling.
2.1.4 The Influence of Cracks in the Concrete on the Corrosion of Embedded Steel
Cracks in concrete are caused by a wide variety of reasons, which include shrinkage [7], chemical
reactions (e.g. alkali aggregate reaction [8], weathering processes (e.g. freezing and thawing) [9],
reinforcement corrosion [10] and loading.
Fig. – 2.4: Schematic illustration of chloride diffusion in cracked concrete
Concrete always contains cracks and codes on structural concrete design such as ACI 318 [11] take
this into account and permissible crack widths are specified for various exposure conditions. However,
an understanding of the effects of cracks on corrosion may be found in literature [12-14]. For concrete
with multiple cracks, corrosion at one crack appears to protect the steel at the other cracks by forming a
galvanic cell or there is a low corrosion rate at all the cracks [15]. Chloride ingress is significantly
7
enhanced by cracks because the ions penetrate the concrete cover from the walls of the crack as
well as from the outer surface of the concrete [16], as illustrated schematically in Fig. 2.4. Thus,
while the chlorides reach the steel directly through the crack, they also reach adjacent areas of steel
more rapidly than in uncracked concrete. The overall low pH of the adjoining concrete coupled with
ingress of moisture and oxygen make it conducive for rebar corrosion and early deterioration of concrete.
2.1.5 Damages to Concrete Due to Corrosion of Steel Reinforcement
The process of corrosion eventually results in deterioration and distress of the RC members. The various
stages of destruction are as follows:
Stage 1: Signs of Carbonation
The porous concrete allows rather easy passage of water and carbon dioxide from surface to interior and
carbonation advances towards the layer of rebar. Carbon dioxide reacts with calcium hydroxide in the
cement paste to form calcium carbonate. The free movement of water carries the unstable calcium
carbonates towards the surface and forms white patches. The white patches at the concrete surface
indicates the occurrence of carbonation.
Stage 2: Brown patches along reinforcement
With corrosion of rebar in the RC structures, a layer of ferric oxide is formed on the reinforcement
surface. This brown product resulting from corrosion may permeate along with moisture to the concrete
surface without cracking of the concrete giving patches of brown color on surfaces – an indication of the
on set of corrosion of embedded rebar.
Stage 3: Occurrence of cracks
The products of corrosion normally occupy a much greater volume about 6 to 10 times than the parent
metal. The increase in volume exerts considerable bursting pressure on the surrounding concrete and
results in cracking. The hair line crack in the concrete surface lying directly above the reinforcement and
running parallel to it is the positive visible indication that reinforcement is corroding.
Stage 4: Formation of multiple cracks
With further corrosion, there will be formation of multiple layers of ferric oxide on the reinforcement
which in turn increase pressure on the surrounding concrete resulting in widening of hair cracks. At this
stage multiple new hair cracks are formed. The bond between concrete and the reinforcement is
considerably reduced. There will be a hollow sound when the concrete is tapped at the surface with a
light hammer.
Stage 5: Spalling of cover concrete
Due to loss in bond between steel and concrete and formation of multiple layers of scales, the cover
concrete starts falling off from the rebar layer. Considerable reduction of the rebar area has also taken by
place by this time.
Stage 6: Snapping of bars
With uninhabited corrosion, the affected rebars are snapped off. Usually snapping occurs in ties/stirrups
first.
8
Stage 7: Buckling of bars and bulging of concrete
The spalling of the cover concrete and snapping of ties causes the main bars to buckle in compression
member. This will result in bulging of the surrounding concrete.
2.2 Methods of Improving Concrete Durability by Protecting Rebars
In reinforced concrete structures, corrosion of steel rebars almost invariably leads to the deterioration of
concrete leading to durability problem. While in the case of good quality concrete within controlled
environment steel generally remains protected, the problem of accelerated corrosion takes place in
aggressive environment. Structures exposed to weathering action are prone to carbonation. Marine
structures or structures that are subjected to alternate drying and wetting suffer early deterioration due to
rebar corrosion. Structures built in the coastal area are particularly susceptible to rebar corrosion led
premature deterioration due to chloride attack or presence of chloride in concrete ingredients during
casting. Various techniques of protection against rebar corrosion have become industry standard practice.
These are discussed in this section.
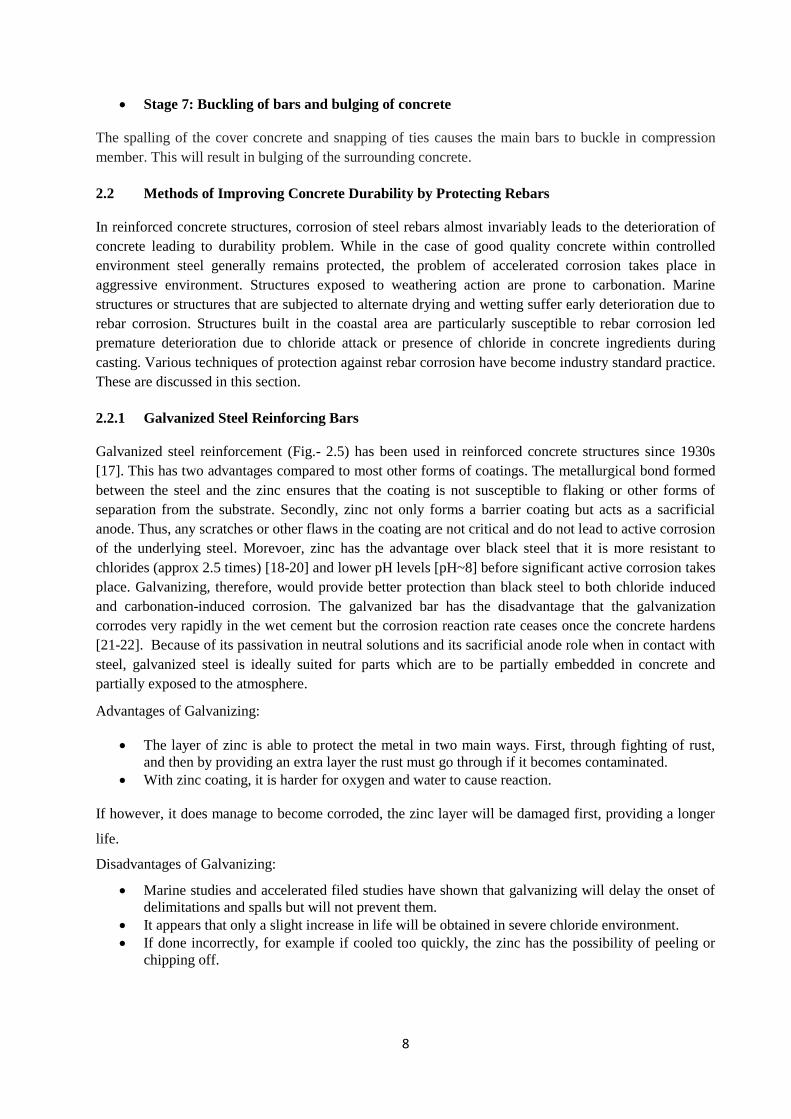
2.2.1 Galvanized Steel Reinforcing Bars
Galvanized steel reinforcement (Fig.- 2.5) has been used in reinforced concrete structures since 1930s
[17]. This has two advantages compared to most other forms of coatings. The metallurgical bond formed
between the steel and the zinc ensures that the coating is not susceptible to flaking or other forms of
separation from the substrate. Secondly, zinc not only forms a barrier coating but acts as a sacrificial
anode. Thus, any scratches or other flaws in the coating are not critical and do not lead to active corrosion
of the underlying steel. Morevoer, zinc has the advantage over black steel that it is more resistant to
chlorides (approx 2.5 times) [18-20] and lower pH levels [pH~8] before significant active corrosion takes
place. Galvanizing, therefore, would provide better protection than black steel to both chloride induced
and carbonation-induced corrosion. The galvanized bar has the disadvantage that the galvanization
corrodes very rapidly in the wet cement but the corrosion reaction rate ceases once the concrete hardens
[21-22]. Because of its passivation in neutral solutions and its sacrificial anode role when in contact with
steel, galvanized steel is ideally suited for parts which are to be partially embedded in concrete and
partially exposed to the atmosphere.
Advantages of Galvanizing:
The layer of zinc is able to protect the metal in two main ways. First, through fighting of rust,
and then by providing an extra layer the rust must go through if it becomes contaminated.
With zinc coating, it is harder for oxygen and water to cause reaction.
If however, it does manage to become corroded, the zinc layer will be damaged first, providing a longer
life.
Disadvantages of Galvanizing:
Marine studies and accelerated filed studies have shown that galvanizing will delay the onset of
delimitations and spalls but will not prevent them.
It appears that only a slight increase in life will be obtained in severe chloride environment.
If done incorrectly, for example if cooled too quickly, the zinc has the possibility of peeling or
chipping off.
9
Fig. – 2.5: Galvanized Steel Rebars
2.2.2 Stainless Steel Reinforcing Bars
The demand for increasing service life of structures, stainless steel is being regarded as a viable
alternative reinforcement despite its higher cost. The most common grades of stainless steel for
reinforcement are 316LN and 2205, both of which have excellent corrosion resistance [23-24] and are
commercially available. Service lives well in excess of 100 years can be expected when these are used as
rebars. Research shows that grade 304 is less corrosion resistant than the other two grades [25] but, the
most reliable field record of corrosion resistance has been observed in concrete using stainless steel [26].
The cost of the stainless steels is more than five times that of black steel [27], as such its use is not
common.
2.2.3 Non-metallic Reinforcement
The carbon-fiber reinforcements currently being marketed [28] do not suffer from corrosion. Although
the long term performance of these materials in concrete has not yet been evaluated, its use as
replacement of steel has been made [29]. However, it did not get wide acceptance due to high cost, low
ductility and poor bond with concrete.
2.2.4 Epoxy Coated Bars
First introduced in early 1960s as a protective coating, fusion bonded epoxy (FBE) is an epoxy-based
powder coating used to protect rebars from corrosion. In epoxy coated bar an epoxy layer (with resin,
hardener, fillers, extenders and color pigments) is applied at high temperature on the rebar. Epoxy coated
rebars has been used in North America since 1973. Ever since more than 65,000 bridges and numerous
other structures have been built in US. The history of its use, specifications, manufacturing and corrosion
protection mechanisms, field performance are reviewed by McDonald [30]. The use of ECR is reported
to be the second most common strategy to prevent reinforcement corrosion after increasing concrete
cover [31]. Use of other techniques such as application of galvanized or stainless steel bars is less than
three percent of the total North American reinforcement market.
The epoxy coated bars provide distinct advantages which are discussed below:
since the coating is done on the coating lines, better quality control is achieved. The process
gives uniform coating thickness;
bonding of coating with the steel is very strong as FBE has very good adhesive properties;
because of flexibility, the coating does not get damaged when the straight bar is bent during
fabrication on a special mandrill;
FBE coating acts as insulator for electro chemical cells and offer barrier protection to steel which
prevents chloride ions to pass through it;
10
well established criteria are available for acceptance for FBE coating in different standards;
FBE coated reinforcement bars provide the most effective corrosion protection to the
reinforcement bars;
However, the disadvantages of ECR are:
epoxy coated bars have less slip resistance than uncoated bars.
major concern is preventing damage to the coating during transportation and handling.
cracking of coating during fabrication may take place due to inadequate cleaning of bars at plant.
even a small damage in the coating can initiate corrosion in severe environment, since the
coating has no cathodic protection.
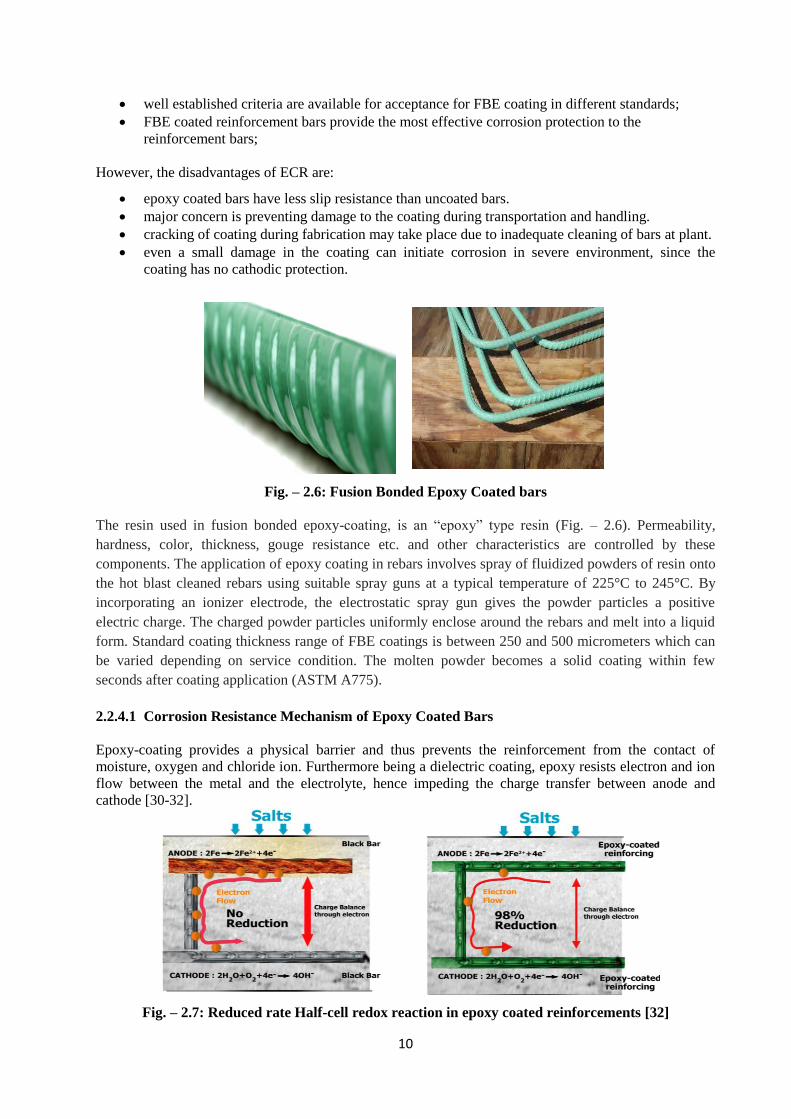
Fig. – 2.6: Fusion Bonded Epoxy Coated bars
The resin used in fusion bonded epoxy-coating, is an “epoxy” type resin (Fig. – 2.6). Permeability,
hardness, color, thickness, gouge resistance etc. and other characteristics are controlled by these
components. The application of epoxy coating in rebars involves spray of fluidized powders of resin onto
the hot blast cleaned rebars using suitable spray guns at a typical temperature of 225°C to 245°C. By
incorporating an ionizer electrode, the electrostatic spray gun gives the powder particles a positive
electric charge. The charged powder particles uniformly enclose around the rebars and melt into a liquid
form. Standard coating thickness range of FBE coatings is between 250 and 500 micrometers which can
be varied depending on service condition. The molten powder becomes a solid coating within few
seconds after coating application (ASTM A775).
2.2.4.1 Corrosion Resistance Mechanism of Epoxy Coated Bars
Epoxy-coating provides a physical barrier and thus prevents the reinforcement from the contact of
moisture, oxygen and chloride ion. Furthermore being a dielectric coating, epoxy resists electron and ion
flow between the metal and the electrolyte, hence impeding the charge transfer between anode and
cathode [30-32].
Fig. – 2.7: Reduced rate Half-cell redox reaction in epoxy coated reinforcements [32]
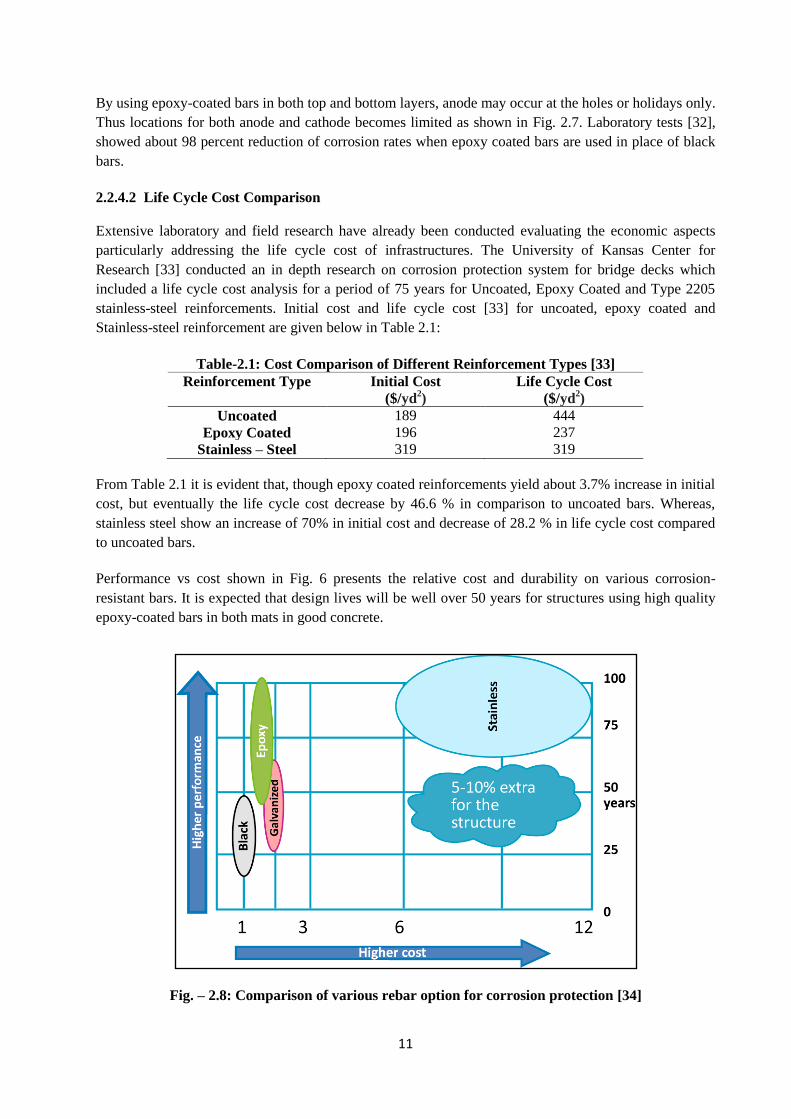
11
By using epoxy-coated bars in both top and bottom layers, anode may occur at the holes or holidays only.
Thus locations for both anode and cathode becomes limited as shown in Fig. 2.7. Laboratory tests [32],
showed about 98 percent reduction of corrosion rates when epoxy coated bars are used in place of black
bars.
2.2.4.2 Life Cycle Cost Comparison
Extensive laboratory and field research have already been conducted evaluating the economic aspects
particularly addressing the life cycle cost of infrastructures. The University of Kansas Center for
Research [33] conducted an in depth research on corrosion protection system for bridge decks which
included a life cycle cost analysis for a period of 75 years for Uncoated, Epoxy Coated and Type 2205
stainless-steel reinforcements. Initial cost and life cycle cost [33] for uncoated, epoxy coated and
Stainless-steel reinforcement are given below in Table 2.1:
Table-2.1: Cost Comparison of Different Reinforcement Types [33]
Reinforcement Type Initial Cost
($/yd2)
Life Cycle Cost
($/yd2)
Uncoated 189 444
Epoxy Coated 196 237
Stainless – Steel 319 319
From Table 2.1 it is evident that, though epoxy coated reinforcements yield about 3.7% increase in initial
cost, but eventually the life cycle cost decrease by 46.6 % in comparison to uncoated bars. Whereas,
stainless steel show an increase of 70% in initial cost and decrease of 28.2 % in life cycle cost compared
to uncoated bars.
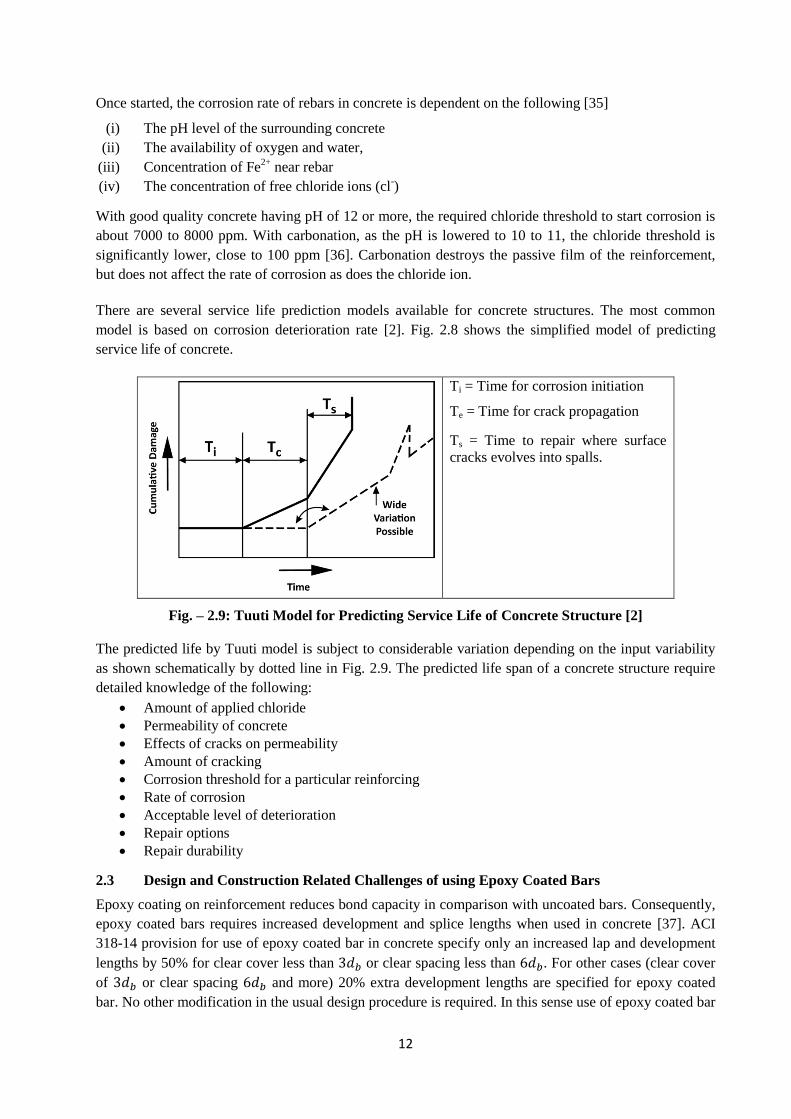
Performance vs cost shown in Fig. 6 presents the relative cost and durability on various corrosion-
resistant bars. It is expected that design lives will be well over 50 years for structures using high quality
epoxy-coated bars in both mats in good concrete.
Fig. – 2.8: Comparison of various rebar option for corrosion protection [34]
12
Once started, the corrosion rate of rebars in concrete is dependent on the following [35]
(i) The pH level of the surrounding concrete
(ii) The availability of oxygen and water,
(iii) Concentration of Fe2+
near rebar
(iv) The concentration of free chloride ions (cl-)
With good quality concrete having pH of 12 or more, the required chloride threshold to start corrosion is
about 7000 to 8000 ppm. With carbonation, as the pH is lowered to 10 to 11, the chloride threshold is
significantly lower, close to 100 ppm [36]. Carbonation destroys the passive film of the reinforcement,
but does not affect the rate of corrosion as does the chloride ion.
There are several service life prediction models available for concrete structures. The most common
model is based on corrosion deterioration rate [2]. Fig. 2.8 shows the simplified model of predicting
service life of concrete.
Ti = Time for corrosion initiation
Te = Time for crack propagation
Ts = Time to repair where surface
cracks evolves into spalls.
Fig. – 2.9: Tuuti Model for Predicting Service Life of Concrete Structure [2]
The predicted life by Tuuti model is subject to considerable variation depending on the input variability
as shown schematically by dotted line in Fig. 2.9. The predicted life span of a concrete structure require
detailed knowledge of the following:
Amount of applied chloride
Permeability of concrete
Effects of cracks on permeability
Amount of cracking
Corrosion threshold for a particular reinforcing
Rate of corrosion
Acceptable level of deterioration
Repair options
Repair durability
2.3 Design and Construction Related Challenges of using Epoxy Coated Bars
Epoxy coating on reinforcement reduces bond capacity in comparison with uncoated bars. Consequently,
epoxy coated bars requires increased development and splice lengths when used in concrete [37]. ACI
318-14 provision for use of epoxy coated bar in concrete specify only an increased lap and development
lengths by 50% for clear cover less than or clear spacing less than . For other cases (clear cover
of or clear spacing and more) 20% extra development lengths are specified for epoxy coated
bar. No other modification in the usual design procedure is required. In this sense use of epoxy coated bar
13
does not pose any design challenge. However, quality control of the coating could be a critical issue in
specifying ECR. Some studies have found that bond strength decreases with increasing coating thickness
[38]. Manufacturing deficiencies during the coating process may also result in inadequate adhesion of
epoxy coating to steel. The quality of epoxy coating has also been shown to be a key factor affecting the
corrosion performance and bond strength of fusion-bonded epoxy-coated rebars [39]. Extensive research
on bond performance of epoxy coated reinforcements has been conducted to assess the long-term
performances of structures built with epoxy coated bars.
The use of FBECR in concrete provides protection against corrosion and long lasting durability of
structures are expected even in adverse environment. However, for ensuring proper corrosion protection
with FBECR the strict quality control at manufacturing plant to every stages of transportation, handling
and placement at job site will all have to be done with utmost care. There has been few cases of early
deterioration of structures with FBECR reportedly due to improper manufacturing and poor handling at
field (see section 4.2). Therefore, it is extremely important that apart from strict quality compliance at
manufacturing plant, the transportation, stacking, handling and fabrication, job site placement and
concreting operation are to be done under a series of standard guideline. ASTM A775 has been
continually upgraded with stringent provisions since its first version issued in 1981 (see chronology of
changes in section 4.3). Concrete Reinforcing Steel Institute (CRSI) has published guidelines for
inspection and acceptance of epoxy coated rebar at job site [40].
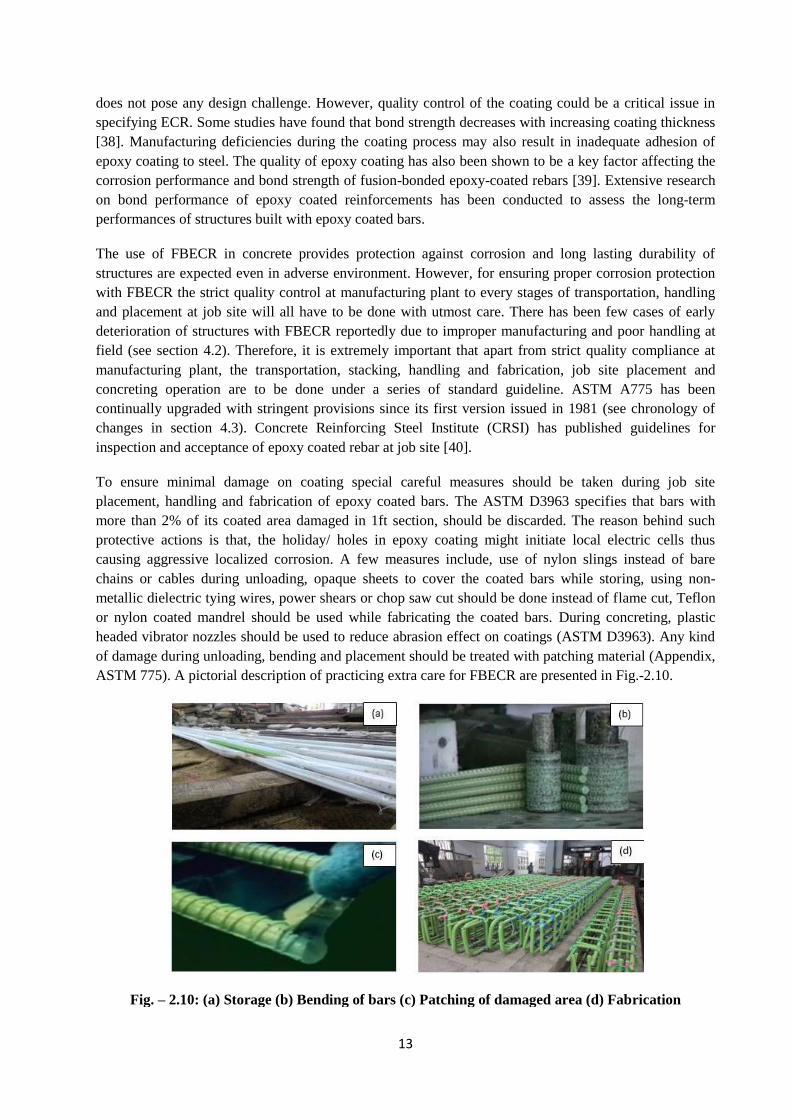
To ensure minimal damage on coating special careful measures should be taken during job site
placement, handling and fabrication of epoxy coated bars. The ASTM D3963 specifies that bars with
more than 2% of its coated area damaged in 1ft section, should be discarded. The reason behind such
protective actions is that, the holiday/ holes in epoxy coating might initiate local electric cells thus
causing aggressive localized corrosion. A few measures include, use of nylon slings instead of bare
chains or cables during unloading, opaque sheets to cover the coated bars while storing, using non-
metallic dielectric tying wires, power shears or chop saw cut should be done instead of flame cut, Teflon
or nylon coated mandrel should be used while fabricating the coated bars. During concreting, plastic
headed vibrator nozzles should be used to reduce abrasion effect on coatings (ASTM D3963). Any kind
of damage during unloading, bending and placement should be treated with patching material (Appendix,
ASTM 775). A pictorial description of practicing extra care for FBECR are presented in Fig.-2.10.
Fig. – 2.10: (a) Storage (b) Bending of bars (c) Patching of damaged area (d) Fabrication
14
2.3.1 Bond Related Problem of ECR
The change of surface properties caused by epoxy coatings leads to a loss of adhesion and friction and
alters the mechanical interaction between the steel and the concrete; all of which lead to a substantial
change in a mechanisms of bond. The roughness of the bar surface influences both the adhesion and the
friction between the bar and the concrete; the geometric properties of the deformed bar cause the
mechanical interaction [41].
In view of the substantial change in bond mechanism, several researchers have been concerned with the
bond of epoxy coated reinforcement to concrete. The first study of the bond of epoxy coated bars was
conducted by Mathey and Clifton [42-44] using pull out specimens. From the initial study, they
concluded that bars with epoxy coatings of approximately 10 mils or less in thickness, have a bond
strength that is quite similar as that of uncoated bars.
Moreover, six slab specimens and forty beam end specimens were tested [45] using #6 and #11 bars.
Based on these tests, recommendations were delivered that development length should be increased by
15% for epoxy coated bars and conclusion was drawn that effect of epoxy coating is independent of bar
size.
Further evidence of adhesion loss was provided in a series of tests [46] conducted to compare frictional
properties of mill scale steel surfaces and fusion bonded epoxy surfaces. The coating caused a significant
loss of adhesion. The difference between surfaces, as expressed by the ratio of shear strength for coated
to mill scale surfaces reduced with increasing normal stress.
Bond stiffness (i.e bond stress at a defined value of slip) is also generally reduced by coating, particularly
at low slips [46-48]. The experiments report that bond stiffness ratio increased approximately from 0.5 to
1.1 as slip increased from 0.01 mm to 1 mm. It is also reported that conclusions based upon difference
between loaded and free end slips of beam end specimens and pull out test [47-48] points to a lesser bond
stiffness for the coated bars.
2.3.2 Care During Manufacturing, Handling, Fabrication and Construction
The manufacturing of FBECR bar has to go through a strict, in-plant quality control system.
Manufacturing defects in epoxy coating have led to poor performance and rebar corrosion started at early
stages posing question as to the reliability of ECR. In US, the Concrete Reinforcing Steel Institute
(CRSI) has introduced plant certification program since 1991 where quality of coating goes through a
series of routine checks and tests. In North America there are 38 certified plants for FBECR. To ensure
quality fabrication at job site without damage to the coatings, the fabricators certification has also been
introduced. The range of checking, quality control tests commonly conducted at manufacturing are
described below:
Checking of continuity
of coating
Online and offline holiday checks, thickness checks are carried out. The
adhesion of the coated bars is also tested frequently by bending of the bar.
Testing of Performance
of rebar
At manufacturing plant various quality tests are performed like chemical
resistance, short spray, resistance in boiling water, abrasion resistance and
impact resistance etc. These are conducted on every batch of production.
For protection against damages to the coating of ECR, special care at every stages of transporting,
handling, fabrication and concreting are needed. Handling requirements are covered in ASTM D 3963. A
summary of care and protection during transporting to concreting is provided below:
15
Transporting,
handling &
stacking
Fusion Bonded Epoxy Coated Bars require padded contacts during transportation,
stacking, handling and till the concreting is done. Following precautions are to be
taken:
Bars should be lifted using a spreader bar or strong-back with multiple pick-up
points to minimize sag. During sagging, steel may rub on each other, causing
coating damage.
At no time should coated steel be dragged.
Nylon or padded slings should be used and at no times should bare chains or
cables be permitted.
Steel should be unloaded as close as possible to the point of concrete placement
to minimize rehandling.
Bundles of steel should be stored on suitable material, such as timber cribbing.
At no time should steel be stored directly on the ground.
If the steel are to be exposed outdoors for more than 30 days, they should be
covered with a suitable opaque material that minimizes condensation.
Coated and uncoated steel should be stored separately.
Cutting, bending
& welding
During bar fabrication at site, the cut ends, welded spots and handling damages
are required to be repaired with special liquid epoxy compatible with the
coating material as per specification of the coating agency.
Bars should not be dragged or placed directly on the forms as this may result in
oil contamination of the surface.
Bars should be placed on supports coated with non-conductive material, such as
epoxy or plastic bar supports, and these should meet class 1A, as defined in the
CRSI Manual of Standard Practice.
Bars should be tied using coated tie wire.
Coated bars may be cut using power shears or chop saws and cut ends should be
repaired using a two-part epoxy.
Bars must not be flame cut.
Bars may only be bent at the jobsite with the permission of the engineer
responsible for the particular project and this should be documented.
If bending is to be conducted it must be conducted at ambient temperatures.
Concreting Special care are needed during pouring and compacting of concrete.
After placement, movement over the epoxy-coated steel should be kept at
minimum.
Concrete hoses on placed steel should be avoided as they may damage the
coating on movement.
Care should also be taken to ensure that items such as unprotected couplers for
concrete delivery hoses are not dragged across the steel as these may result in
coating damage.
16
A site meeting may be beneficial with the concrete contractor.
At no time should stands or rails used for concrete placement machines be
welded to the epoxy-coated steel.
Care should be used to ensure that activities during the concrete placement do
not result in damage to the epoxy-coated steel.
Concrete pumps should be fitted with an “S” bend to prevent free fall of
concrete directly onto the coating.
Plastic headed vibrations should be used to consolidate concrete. Steel vibrators
may cause coating damage.
Bars that are partially cast in concrete, and then remain exposed for extended
periods, should be protected against exposure to UV, salts and condensation. It
has been found that wrapping with plastic or individual tubing is suitable for
providing long-term protection.
Care during bar
fabrication
Bends: The coating at bends should not exhibit any cracking or fractures. Particular
care should be taken to inspect the condition of the coating in these regions as
damage may occur during fabrication.
Repair of all damage: Repairs to any visible damage should be made allowing
sufficient time for coatings to dry. Such repairs should be conducted using a two-
part epoxy. Spray can repair materials are not recommended. If the bar has more
than 2% of its area damaged in any given 1ft. section of coated reinforcement it
should be replaced. ASTM D3963 states that if the total bar surface area covered by
patching material exceeds 5% in any given 1ft. section of coated reinforcement, the
bar may be rejected. This limit does not include sheared or cut ends.
Bar supports: Reinforcement should be placed on supports coated with non-
conductive material, such as epoxy or plastic bar supports.
Tie wire: Reinforcement should be tied using a coated tie wire.
Bar samples: Some agencies require inspectors to collect coated steel samples
from the jobsite and these should be clearly identified prior to submittal to the
appropriate laboratory for testing.
Welding: Welding should only occur with the permission of the engineer. Any
welds should be cleaned and patched with repair materials.
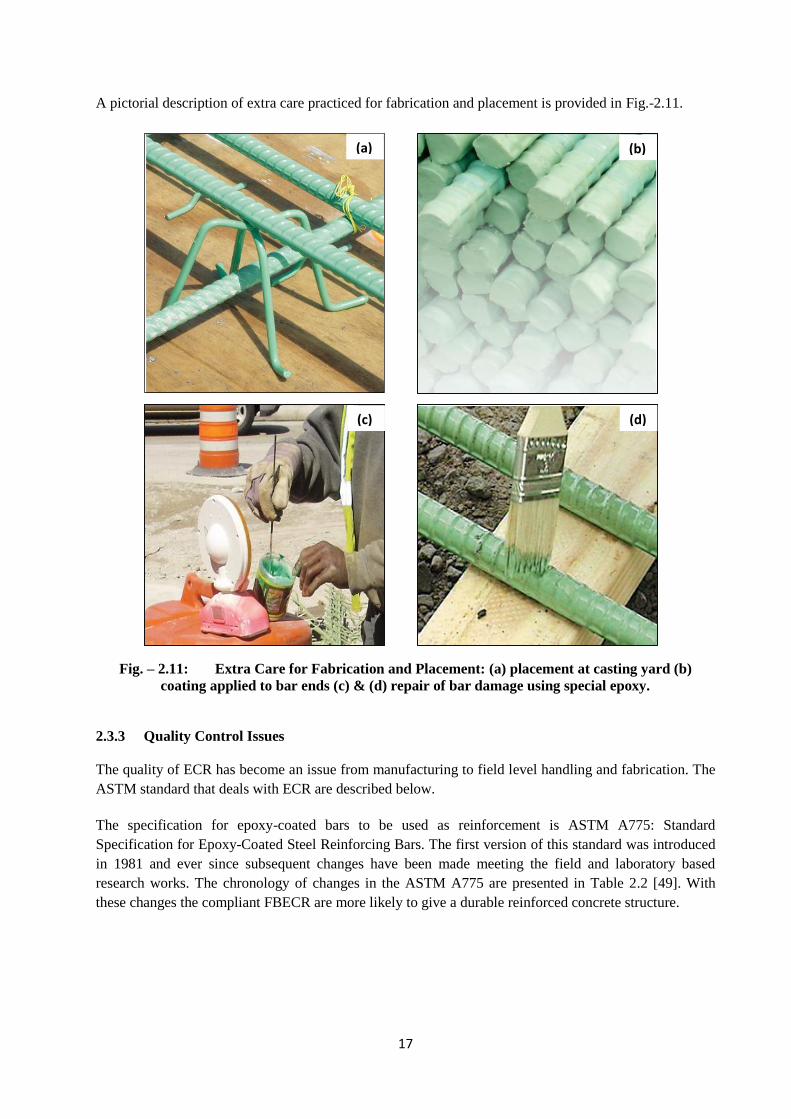
17
A pictorial description of extra care practiced for fabrication and placement is provided in Fig.-2.11.
Fig. – 2.11: Extra Care for Fabrication and Placement: (a) placement at casting yard (b)
coating applied to bar ends (c) & (d) repair of bar damage using special epoxy.
2.3.3 Quality Control Issues
The quality of ECR has become an issue from manufacturing to field level handling and fabrication. The
ASTM standard that deals with ECR are described below.
The specification for epoxy-coated bars to be used as reinforcement is ASTM A775: Standard
Specification for Epoxy-Coated Steel Reinforcing Bars. The first version of this standard was introduced
in 1981 and ever since subsequent changes have been made meeting the field and laboratory based
research works. The chronology of changes in the ASTM A775 are presented in Table 2.2 [49]. With
these changes the compliant FBECR are more likely to give a durable reinforced concrete structure.
(a) (b)
(c) (d)
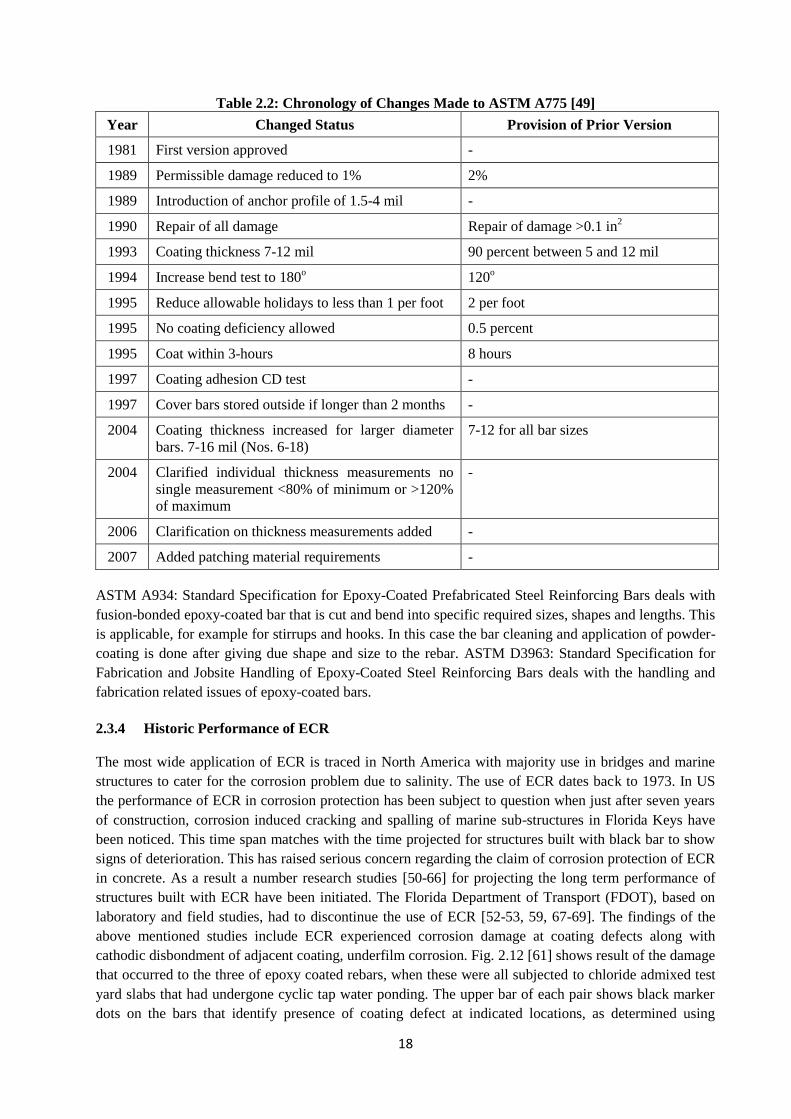
18
Table 2.2: Chronology of Changes Made to ASTM A775 [49]
Year Changed Status Provision of Prior Version
1981 First version approved -
1989 Permissible damage reduced to 1% 2%
1989 Introduction of anchor profile of 1.5-4 mil -
1990 Repair of all damage Repair of damage >0.1 in2
1993 Coating thickness 7-12 mil 90 percent between 5 and 12 mil
1994 Increase bend test to 180o 120
o
1995 Reduce allowable holidays to less than 1 per foot 2 per foot
1995 No coating deficiency allowed 0.5 percent
1995 Coat within 3-hours 8 hours
1997 Coating adhesion CD test -
1997 Cover bars stored outside if longer than 2 months -
2004 Coating thickness increased for larger diameter
bars. 7-16 mil (Nos. 6-18)
7-12 for all bar sizes
2004 Clarified individual thickness measurements no
single measurement <80% of minimum or >120%
of maximum
-
2006 Clarification on thickness measurements added -
2007 Added patching material requirements -
ASTM A934: Standard Specification for Epoxy-Coated Prefabricated Steel Reinforcing Bars deals with
fusion-bonded epoxy-coated bar that is cut and bend into specific required sizes, shapes and lengths. This
is applicable, for example for stirrups and hooks. In this case the bar cleaning and application of powder-
coating is done after giving due shape and size to the rebar. ASTM D3963: Standard Specification for
Fabrication and Jobsite Handling of Epoxy-Coated Steel Reinforcing Bars deals with the handling and
fabrication related issues of epoxy-coated bars.
2.3.4 Historic Performance of ECR
The most wide application of ECR is traced in North America with majority use in bridges and marine
structures to cater for the corrosion problem due to salinity. The use of ECR dates back to 1973. In US
the performance of ECR in corrosion protection has been subject to question when just after seven years
of construction, corrosion induced cracking and spalling of marine sub-structures in Florida Keys have
been noticed. This time span matches with the time projected for structures built with black bar to show
signs of deterioration. This has raised serious concern regarding the claim of corrosion protection of ECR
in concrete. As a result a number research studies [50-66] for projecting the long term performance of
structures built with ECR have been initiated. The Florida Department of Transport (FDOT), based on
laboratory and field studies, had to discontinue the use of ECR [52-53, 59, 67-69]. The findings of the
above mentioned studies include ECR experienced corrosion damage at coating defects along with
cathodic disbondment of adjacent coating, underfilm corrosion. Fig. 2.12 [61] shows result of the damage
that occurred to the three of epoxy coated rebars, when these were all subjected to chloride admixed test
yard slabs that had undergone cyclic tap water ponding. The upper bar of each pair shows black marker
dots on the bars that identify presence of coating defect at indicated locations, as determined using
19
holiday detector. The lower bar of each pair shows the bar appearance subsequent to peeling away
disbonded coating using a knife. This clearly establishes a one-to-one correlation between presence of
defect and coating disbonding and underfilm corrosion.
Fig. – 2.12: Three ECR bars after exposure in Cl contaminated concrete, first with coating
holidays identified (upper photograph of each bar pair) and, second, showing bar appearance upon
removal of disbanded coating (lower photograph of each pair).[61]
Laboratory and field studies by Weyers et. al. [70-72] reported ECR coating disbonment and underfilm
corrosion on bridges in Virginia which has led the Virginia Department of Transportation (VDOT) to
discontinue use of ECR in 2010. Pianca et. al. [72] conducted study on the field performance of ECR in
concrete barrier walls and unprotected portion of bridge decks and found that corrosion damage did occur
in ECR. This has led the Ontario Ministry of Transportation (OMOT) to change its specification to use
stainless steel for structure barrier walls and for decks of high traffic volume bridges for which
repair/rehabilitation could cause traffic disruption due to lane closure. Moreover, Canadian Standards
Association [73] clause 6.1.3 provides a cautionary note as follows:
“Such reinforcement should be selected with caution, based on the severity of the concrete exposure and
the desired service life of the concrete component or structure. There is a growing body of knowledge
suggesting that the benefits of epoxy coatings for long-term corrosion protection are not what was
originally anticipated. Potential users should review recent literature on the subject for further
information.”
Another study by A.A. Sohanghpurwala et. al. [74] by field survey and laboratory analysis of 240
extracted bar segments from 80 bridges decks with ECR in Pennsylvania and New York of age 4-18
years has demonstrated generally good performance but also identified some locations where corrosion
had commenced. Although a service life of 75 years of low maintenance had been extrapolated through
linear extrapolation, the validity of such extrapolation had been doubted by others [51].
All the above mentioned studies are related to extreme harsh environmental condition where almost
invariably high concentration of chloride ion was present due to application of de-icing salt on bridge
decks. However, following general conclusions can be drawn from the various North American studies
on ECR performance:
a) Thickness of concrete cover provides the best protection to rebar corrosion by preventing
penetration of chloride or carbonation to the rebar. Once the corrosion is started, the rate of
corrosion is independent of cover thickness [75].
20
b) Uncertainties exit regarding the long-term performance of ECR and the prediction of service life
of concrete with ECR in chloride exposed concrete. Despite this, where a side-by-side
comparisons had been possible, ECR has outperformed black bars [54-55, 76].
c) Some researches have projected an ECR service life of less than fifty years [58] while other
projected seventy five years [74] in chloride contaminated concrete. However, these claims did
not receive wide acceptance by the experts.
d) Most of the reported poor performances of epoxy coated bars within 6~10 years of construction
(e.g. Florida Keys and water-line in the $45 million seven-mile Bridge) are due to poor coating,
lower coating thickness than present day requirement of ASTM A775, poor handling,
transporting, stacking methods employed than the present day recommended practice. Out of the
65000 structures built with ECR, most of the structures serving for more than 37 years have
demonstrated low maintenance service life. Problems have been encountered only in few of them
due to poor or damaged coating [76].
e) With the more stringent requirements of present day standards for manufacturing of ECR (ASTM
A 775) and standard for fabrication and job site handling of ECR (ASTM D 3963), it is believed
that structures built with ECR should provide a maintenance free service life many fold than
ordinary black bar, particularly in adverse environmental exposure.
The various performance evaluations have made experts to believe that ECR is performing well in high
quality concrete with good cover but not in situations where either of these two conditions (good quality
concrete and cover) is not met [77].
2.4 Possible Use of Epoxy Coated Bar in Bangladesh Context
Due to salt water intrusion in the coastal region of Bangladesh, the nearby coastal structures such as
bridge piers and abutments, cyclone shelters, dams and other concrete structures exposed to saline water
are in immense threat of corrosion. Apart from coastal regions, other structural members such as top floor
slabs exposed to dampness, shallow and deep foundations, bridge piers subjected to intermittent drying
and wetting, water treatment plants are also threatened with rapid deterioration of design life span due to
corrosion. Currently, widespread corrosion resistant system adopted in Bangladesh is limited only to
increase in concrete cover. In adverse weather cover alone is not sufficient and additional protection is
warranted. Epoxy coated reinforcement can be a cost effective and feasible solution to cater the durability
issues in the structures of Bangladesh. Though epoxy coated bars are globally accepted as an effective
corrosion resistant system, local engineering community needs to be conversant about its design and
construction related challenges. Before large scale application in Bangladesh, due training of the
engineers, fabricators and contractors are essential. This will help the professionals to gain confidence in
using epoxy-coated bars in RC structures which appears to have a significant impact on durability and
overall economy of concrete structures.
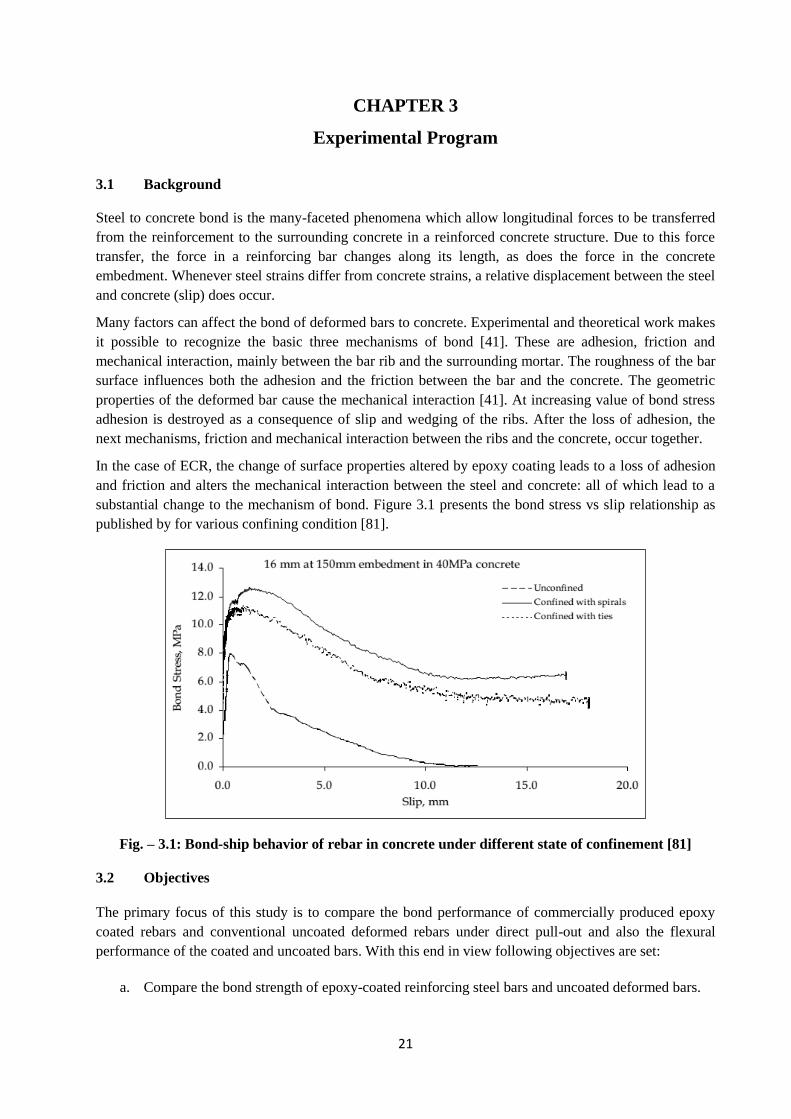
21
CHAPTER 3
Experimental Program
3.1 Background
Steel to concrete bond is the many-faceted phenomena which allow longitudinal forces to be transferred
from the reinforcement to the surrounding concrete in a reinforced concrete structure. Due to this force
transfer, the force in a reinforcing bar changes along its length, as does the force in the concrete
embedment. Whenever steel strains differ from concrete strains, a relative displacement between the steel
and concrete (slip) does occur.
Many factors can affect the bond of deformed bars to concrete. Experimental and theoretical work makes
it possible to recognize the basic three mechanisms of bond [41]. These are adhesion, friction and
mechanical interaction, mainly between the bar rib and the surrounding mortar. The roughness of the bar
surface influences both the adhesion and the friction between the bar and the concrete. The geometric
properties of the deformed bar cause the mechanical interaction [41]. At increasing value of bond stress
adhesion is destroyed as a consequence of slip and wedging of the ribs. After the loss of adhesion, the
next mechanisms, friction and mechanical interaction between the ribs and the concrete, occur together.
In the case of ECR, the change of surface properties altered by epoxy coating leads to a loss of adhesion
and friction and alters the mechanical interaction between the steel and concrete: all of which lead to a
substantial change to the mechanism of bond. Figure 3.1 presents the bond stress vs slip relationship as
published by for various confining condition [81].
Fig. – 3.1: Bond-ship behavior of rebar in concrete under different state of confinement [81]
3.2 Objectives
The primary focus of this study is to compare the bond performance of commercially produced epoxy
coated rebars and conventional uncoated deformed rebars under direct pull-out and also the flexural
performance of the coated and uncoated bars. With this end in view following objectives are set:
a. Compare the bond strength of epoxy-coated reinforcing steel bars and uncoated deformed bars.
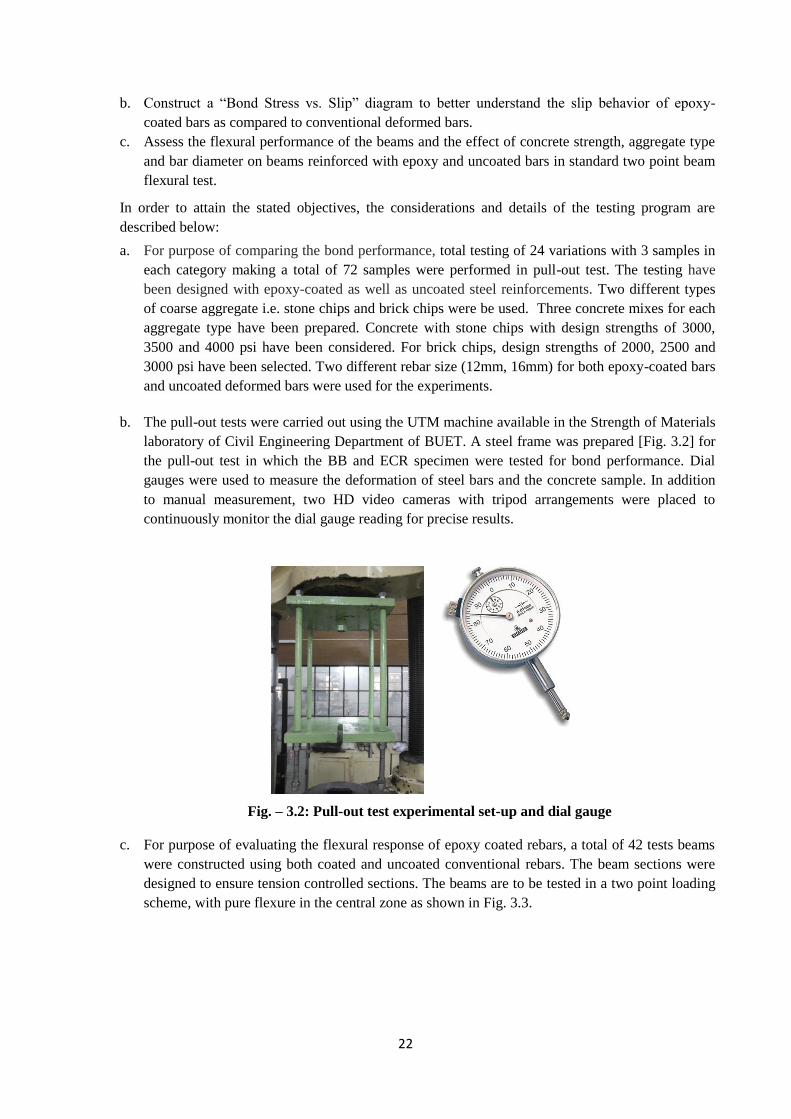
22
b. Construct a “Bond Stress vs. Slip” diagram to better understand the slip behavior of epoxy-
coated bars as compared to conventional deformed bars.
c. Assess the flexural performance of the beams and the effect of concrete strength, aggregate type
and bar diameter on beams reinforced with epoxy and uncoated bars in standard two point beam
flexural test.
In order to attain the stated objectives, the considerations and details of the testing program are
described below:
a. For purpose of comparing the bond performance, total testing of 24 variations with 3 samples in
each category making a total of 72 samples were performed in pull-out test. The testing have
been designed with epoxy-coated as well as uncoated steel reinforcements. Two different types
of coarse aggregate i.e. stone chips and brick chips were be used. Three concrete mixes for each
aggregate type have been prepared. Concrete with stone chips with design strengths of 3000,
3500 and 4000 psi have been considered. For brick chips, design strengths of 2000, 2500 and
3000 psi have been selected. Two different rebar size (12mm, 16mm) for both epoxy-coated bars
and uncoated deformed bars were used for the experiments.
b. The pull-out tests were carried out using the UTM machine available in the Strength of Materials
laboratory of Civil Engineering Department of BUET. A steel frame was prepared [Fig. 3.2] for
the pull-out test in which the BB and ECR specimen were tested for bond performance. Dial
gauges were used to measure the deformation of steel bars and the concrete sample. In addition
to manual measurement, two HD video cameras with tripod arrangements were placed to
continuously monitor the dial gauge reading for precise results.
Fig. – 3.2: Pull-out test experimental set-up and dial gauge
c. For purpose of evaluating the flexural response of epoxy coated rebars, a total of 42 tests beams
were constructed using both coated and uncoated conventional rebars. The beam sections were
designed to ensure tension controlled sections. The beams are to be tested in a two point loading
scheme, with pure flexure in the central zone as shown in Fig. 3.3.
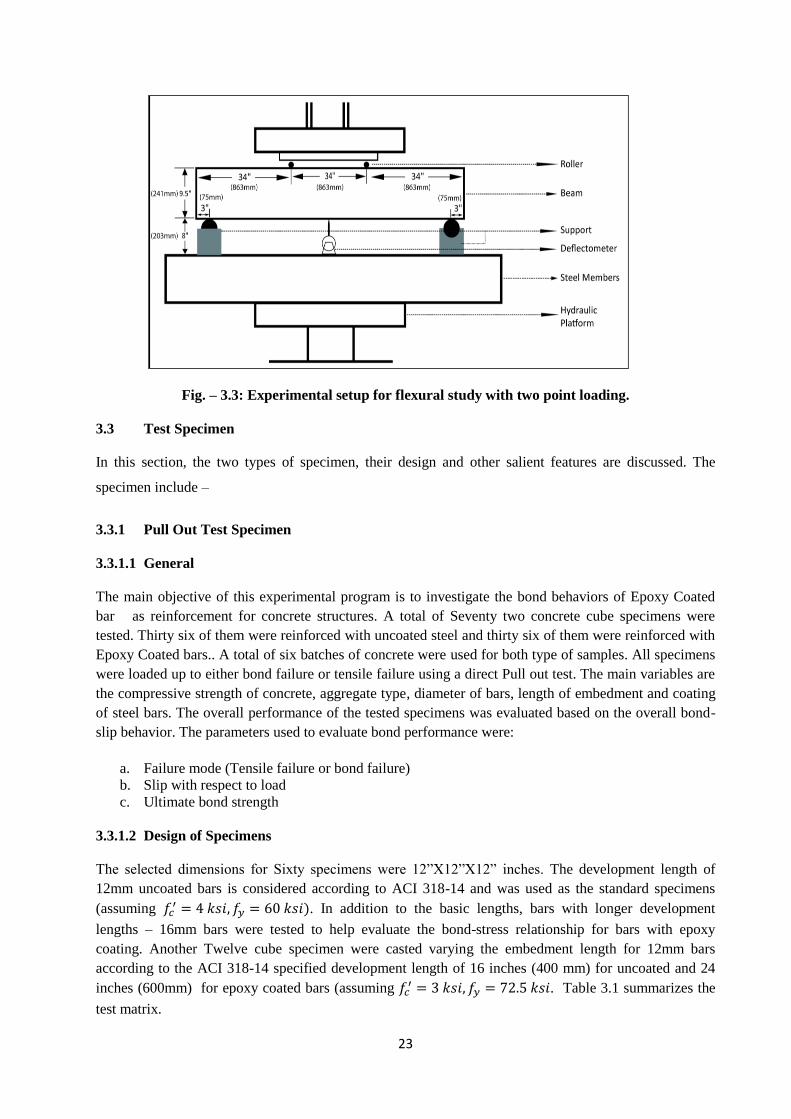
23
Fig. – 3.3: Experimental setup for flexural study with two point loading.
3.3 Test Specimen
In this section, the two types of specimen, their design and other salient features are discussed. The
specimen include –
3.3.1 Pull Out Test Specimen
3.3.1.1 General
The main objective of this experimental program is to investigate the bond behaviors of Epoxy Coated
bar as reinforcement for concrete structures. A total of Seventy two concrete cube specimens were
tested. Thirty six of them were reinforced with uncoated steel and thirty six of them were reinforced with
Epoxy Coated bars.. A total of six batches of concrete were used for both type of samples. All specimens
were loaded up to either bond failure or tensile failure using a direct Pull out test. The main variables are
the compressive strength of concrete, aggregate type, diameter of bars, length of embedment and coating
of steel bars. The overall performance of the tested specimens was evaluated based on the overall bond-
slip behavior. The parameters used to evaluate bond performance were:
a. Failure mode (Tensile failure or bond failure)
b. Slip with respect to load
c. Ultimate bond strength
3.3.1.2 Design of Specimens
The selected dimensions for Sixty specimens were 1 ”X1 ”X1 ” inches. The development length of
12mm uncoated bars is considered according to ACI 318-14 and was used as the standard specimens
(assuming . In addition to the basic lengths, bars with longer development
lengths – 16mm bars were tested to help evaluate the bond-stress relationship for bars with epoxy
coating. Another Twelve cube specimen were casted varying the embedment length for 12mm bars
according to the ACI 318-14 specified development length of 16 inches (400 mm) for uncoated and 24
inches (600mm) for epoxy coated bars (assuming . Table 3.1 summarizes the
test matrix.
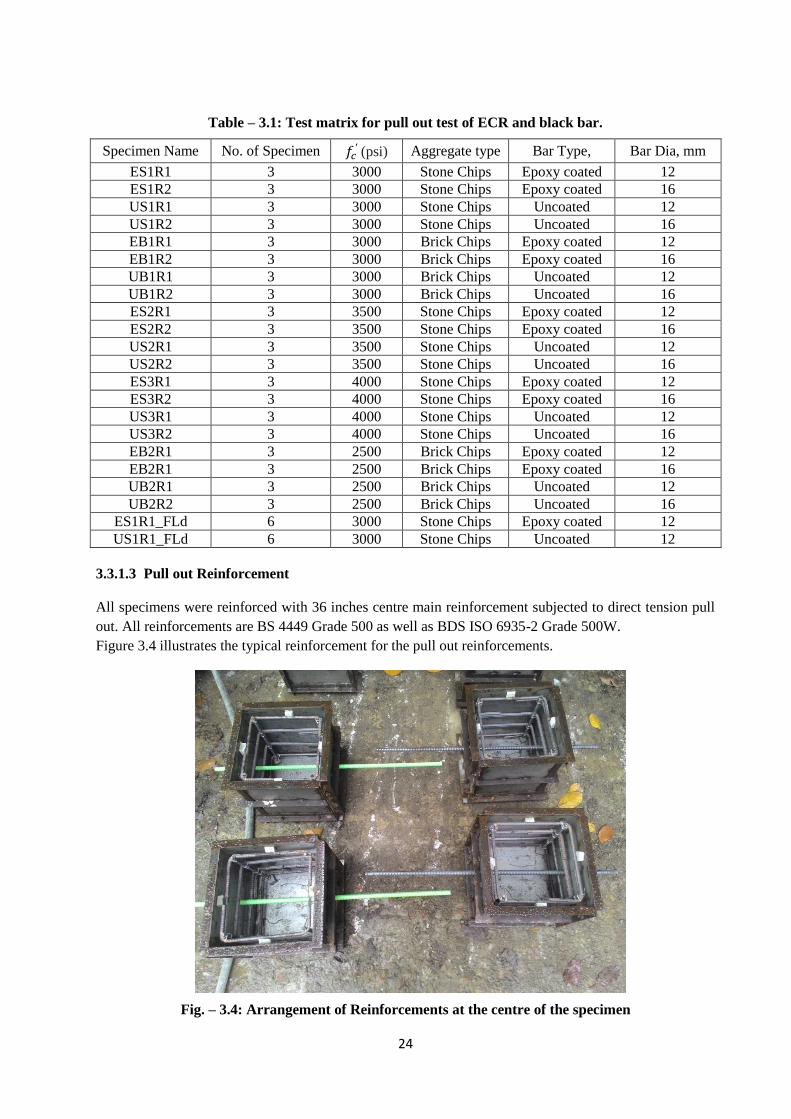
24
Table – 3.1: Test matrix for pull out test of ECR and black bar.
Specimen Name No. of Specimen (psi) Aggregate type Bar Type, Bar Dia, mm
ES1R1 3 3000 Stone Chips Epoxy coated 12
ES1R2 3 3000 Stone Chips Epoxy coated 16
US1R1 3 3000 Stone Chips Uncoated 12
US1R2 3 3000 Stone Chips Uncoated 16
EB1R1 3 3000 Brick Chips Epoxy coated 12
EB1R2 3 3000 Brick Chips Epoxy coated 16
UB1R1 3 3000 Brick Chips Uncoated 12
UB1R2 3 3000 Brick Chips Uncoated 16
ES2R1 3 3500 Stone Chips Epoxy coated 12
ES2R2 3 3500 Stone Chips Epoxy coated 16
US2R1 3 3500 Stone Chips Uncoated 12
US2R2 3 3500 Stone Chips Uncoated 16
ES3R1 3 4000 Stone Chips Epoxy coated 12
ES3R2 3 4000 Stone Chips Epoxy coated 16
US3R1 3 4000 Stone Chips Uncoated 12
US3R2 3 4000 Stone Chips Uncoated 16
EB2R1 3 2500 Brick Chips Epoxy coated 12
EB2R1 3 2500 Brick Chips Epoxy coated 16
UB2R1 3 2500 Brick Chips Uncoated 12
UB2R2 3 2500 Brick Chips Uncoated 16
ES1R1_FLd 6 3000 Stone Chips Epoxy coated 12
US1R1_FLd 6 3000 Stone Chips Uncoated 12
3.3.1.3 Pull out Reinforcement
All specimens were reinforced with 36 inches centre main reinforcement subjected to direct tension pull
out. All reinforcements are BS 4449 Grade 500 as well as BDS ISO 6935-2 Grade 500W.
Figure 3.4 illustrates the typical reinforcement for the pull out reinforcements.
Fig. – 3.4: Arrangement of Reinforcements at the centre of the specimen
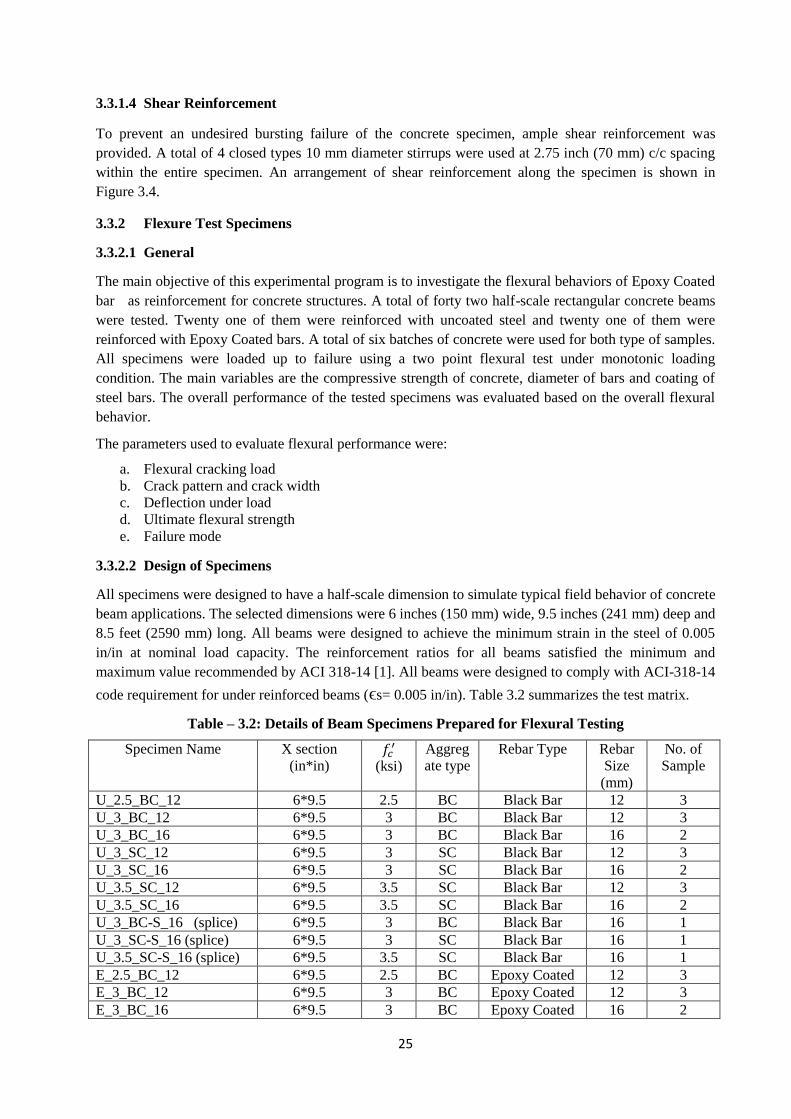
25
3.3.1.4 Shear Reinforcement
To prevent an undesired bursting failure of the concrete specimen, ample shear reinforcement was
provided. A total of 4 closed types 10 mm diameter stirrups were used at 2.75 inch (70 mm) c/c spacing
within the entire specimen. An arrangement of shear reinforcement along the specimen is shown in
Figure 3.4.
3.3.2 Flexure Test Specimens
3.3.2.1 General
The main objective of this experimental program is to investigate the flexural behaviors of Epoxy Coated
bar as reinforcement for concrete structures. A total of forty two half-scale rectangular concrete beams
were tested. Twenty one of them were reinforced with uncoated steel and twenty one of them were
reinforced with Epoxy Coated bars. A total of six batches of concrete were used for both type of samples.
All specimens were loaded up to failure using a two point flexural test under monotonic loading
condition. The main variables are the compressive strength of concrete, diameter of bars and coating of
steel bars. The overall performance of the tested specimens was evaluated based on the overall flexural
behavior.
The parameters used to evaluate flexural performance were:
a. Flexural cracking load
b. Crack pattern and crack width
c. Deflection under load
d. Ultimate flexural strength
e. Failure mode
3.3.2.2 Design of Specimens
All specimens were designed to have a half-scale dimension to simulate typical field behavior of concrete
beam applications. The selected dimensions were 6 inches (150 mm) wide, 9.5 inches (241 mm) deep and
8.5 feet (2590 mm) long. All beams were designed to achieve the minimum strain in the steel of 0.005
in/in at nominal load capacity. The reinforcement ratios for all beams satisfied the minimum and
maximum value recommended by ACI 318-14 [1]. All beams were designed to comply with ACI-318-14
code requirement for under reinforced beams (ϵs= 0.005 in/in). Table 3.2 summarizes the test matrix.
Table – 3.2: Details of Beam Specimens Prepared for Flexural Testing
Specimen Name X section
(in*in)
(ksi)
Aggreg
ate type
Rebar Type Rebar
Size
(mm)
No. of
Sample
U_2.5_BC_12 6*9.5 2.5 BC Black Bar 12 3
U_3_BC_12 6*9.5 3 BC Black Bar 12 3
U_3_BC_16 6*9.5 3 BC Black Bar 16 2
U_3_SC_12 6*9.5 3 SC Black Bar 12 3
U_3_SC_16 6*9.5 3 SC Black Bar 16 2
U_3.5_SC_12 6*9.5 3.5 SC Black Bar 12 3
U_3.5_SC_16 6*9.5 3.5 SC Black Bar 16 2
U_3_BC-S_16 (splice) 6*9.5 3 BC Black Bar 16 1
U_3_SC-S_16 (splice) 6*9.5 3 SC Black Bar 16 1
U_3.5_SC-S_16 (splice) 6*9.5 3.5 SC Black Bar 16 1
E_2.5_BC_12 6*9.5 2.5 BC Epoxy Coated 12 3
E_3_BC_12 6*9.5 3 BC Epoxy Coated 12 3
E_3_BC_16 6*9.5 3 BC Epoxy Coated 16 2
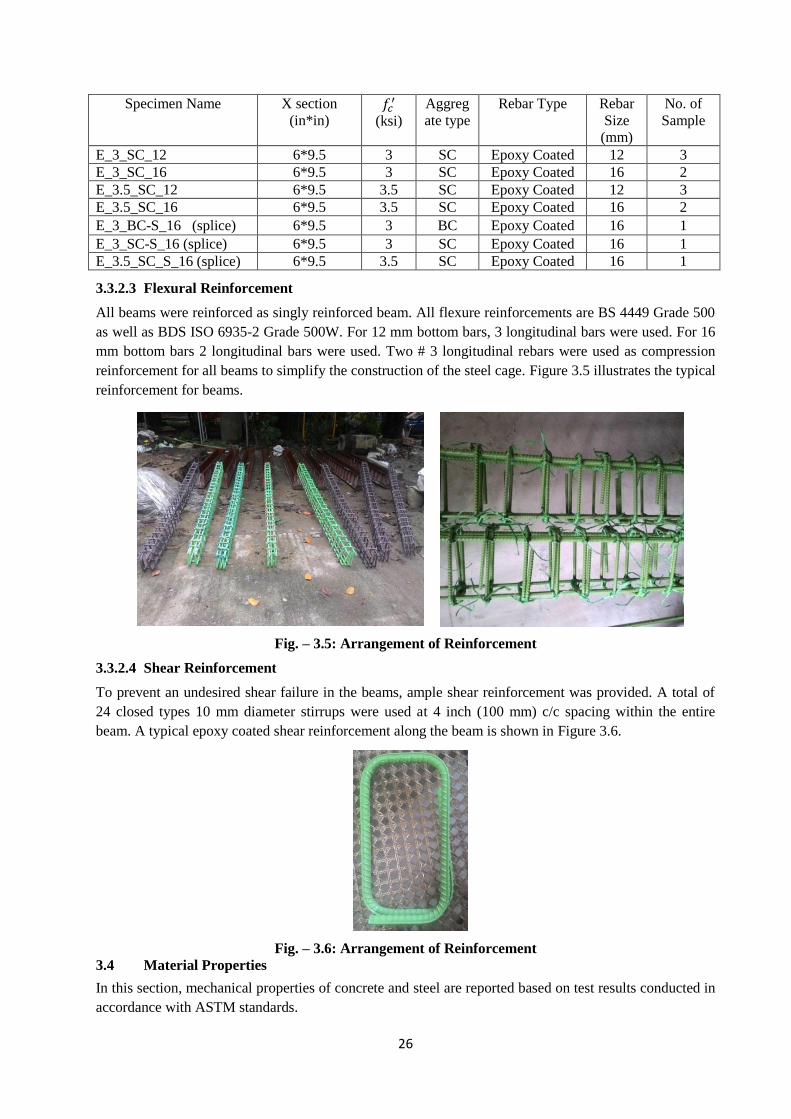
26
Specimen Name X section
(in*in)
(ksi)
Aggreg
ate type
Rebar Type Rebar
Size
(mm)
No. of
Sample
E_3_SC_12 6*9.5 3 SC Epoxy Coated 12 3
E_3_SC_16 6*9.5 3 SC Epoxy Coated 16 2
E_3.5_SC_12 6*9.5 3.5 SC Epoxy Coated 12 3
E_3.5_SC_16 6*9.5 3.5 SC Epoxy Coated 16 2
E_3_BC-S_16 (splice) 6*9.5 3 BC Epoxy Coated 16 1
E_3_SC-S_16 (splice) 6*9.5 3 SC Epoxy Coated 16 1
E_3.5_SC_S_16 (splice) 6*9.5 3.5 SC Epoxy Coated 16 1
3.3.2.3 Flexural Reinforcement
All beams were reinforced as singly reinforced beam. All flexure reinforcements are BS 4449 Grade 500
as well as BDS ISO 6935-2 Grade 500W. For 12 mm bottom bars, 3 longitudinal bars were used. For 16
mm bottom bars 2 longitudinal bars were used. Two # 3 longitudinal rebars were used as compression
reinforcement for all beams to simplify the construction of the steel cage. Figure 3.5 illustrates the typical
reinforcement for beams.
Fig. – 3.5: Arrangement of Reinforcement
3.3.2.4 Shear Reinforcement
To prevent an undesired shear failure in the beams, ample shear reinforcement was provided. A total of
24 closed types 10 mm diameter stirrups were used at 4 inch (100 mm) c/c spacing within the entire
beam. A typical epoxy coated shear reinforcement along the beam is shown in Figure 3.6.
Fig. – 3.6: Arrangement of Reinforcement
3.4 Material Properties
In this section, mechanical properties of concrete and steel are reported based on test results conducted in
accordance with ASTM standards.
27
3.4.1 Pull out test
3.4.1.1 Concrete
Six batches of cement concrete were used in this program. The concrete was produced at Concrete
laboratory of the Civil Engineering Department of BUET. The mix proportion for all batches of concrete
were 1:1.5:3 (cement: sand: aggregate), nine 4x8 inch (100X200 mm) concrete cylinders were prepared
for each batch and cured at room temperature. For each batch three concrete cylinders were tested at 7
days, 14 days and other three cylinders were tested at the time of testing beam specimens as per ASTM
C39-01. All cylinders were loaded to failure. The compressive strengths of each set of pull out specimen
at testing day are presented in Table 3.3.
Table 3.3: Compressive Strength of Concrete
Beam Type Testing day Cylinder
Compressive Strength (psi)
Average Strength
(psi) Standard Deviation
I-SC
3847
4162 228.19 4381
4257
I-BC
3939
3933 22.81 3903
3958
II-SC
5644
5992 249.05 6213
6119
III-SC
6817
7053 221.83 7350
6992
IV-BC
3441
3655 161.97 3833
3690
I-SC-FLd
4330
4311 216.89 4294
4310
3.4.1.2 Steel
Tension tests were performed according to ASTM A615/A615M to determine the stress strain
characteristic of the steel reinforcements of both epoxy coated and uncoated variations. The actual load-
deflection curves for all reinforcements can be found in the Figure 3.7. All tensile properties are reported
in terms of average value. The failure mode of the reinforcements was found by subjecting them to a
tension test until rupture. Tests on rebars were done at the Strength of Materials Laboratory, Department
of Civil engineering, BUET and results are shown in Figure 3.8. Table 3.4 shows the bar original
diameter, average yield load, average ultimate load and percent elongation of the steel bars.
Table 3.4: Steel properties of tested Epoxy Coated and Black Bars
Bar Type Original Bar
diameter (mm)
Yield Load
(kN)
Ultimate Load
(kN)
Percent Elongation
(%)
12 mm Epoxy Coated 12.07 66.2 78.74 12
12 mm Uncoated 11.87 67.87 77.61 13.67
16 mm Epoxy Coated 16.11 117.6 138.78 13.67
16 mm Uncoated 15.9 113.99 135.61 16
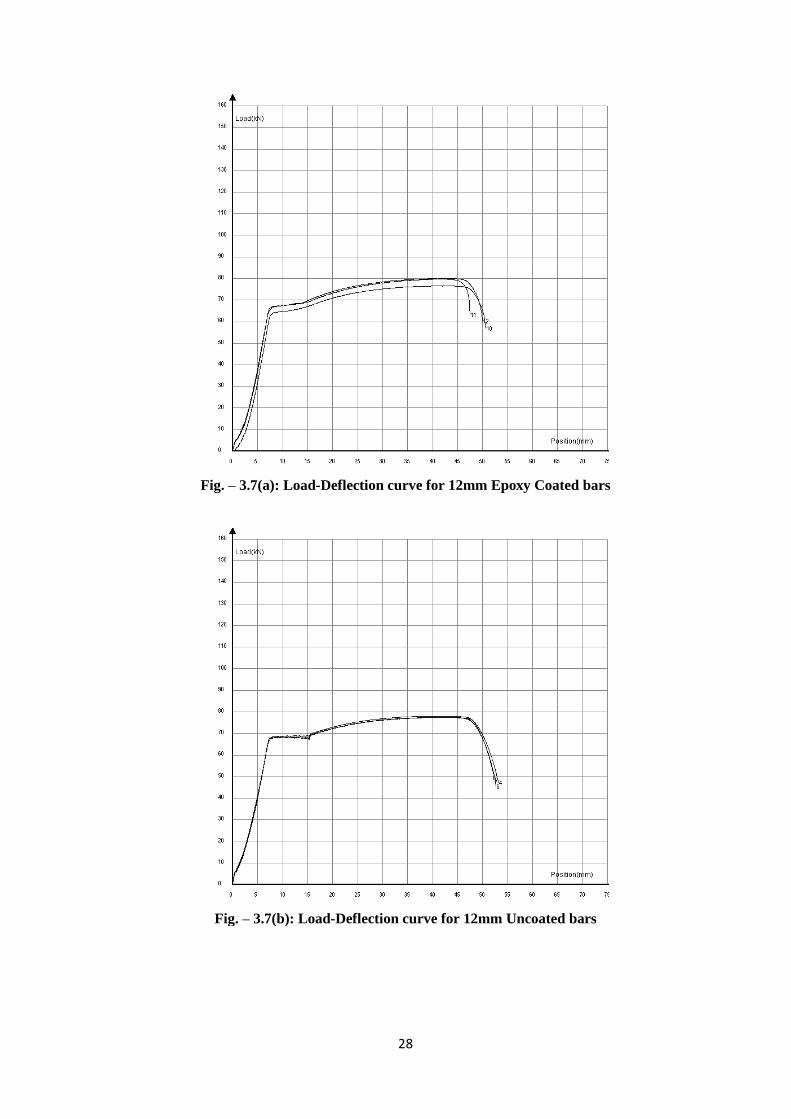
28
Fig. – 3.7(a): Load-Deflection curve for 12mm Epoxy Coated bars
Fig. – 3.7(b): Load-Deflection curve for 12mm Uncoated bars
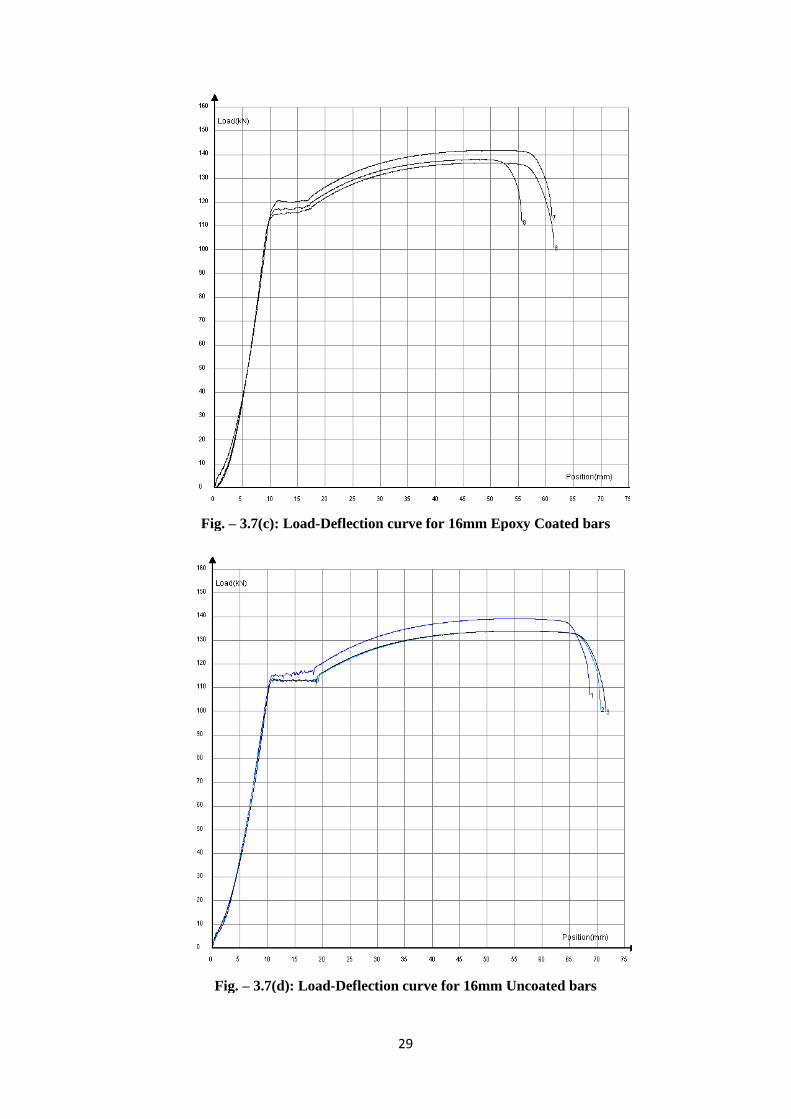
29
Fig. – 3.7(c): Load-Deflection curve for 16mm Epoxy Coated bars
Fig. – 3.7(d): Load-Deflection curve for 16mm Uncoated bars
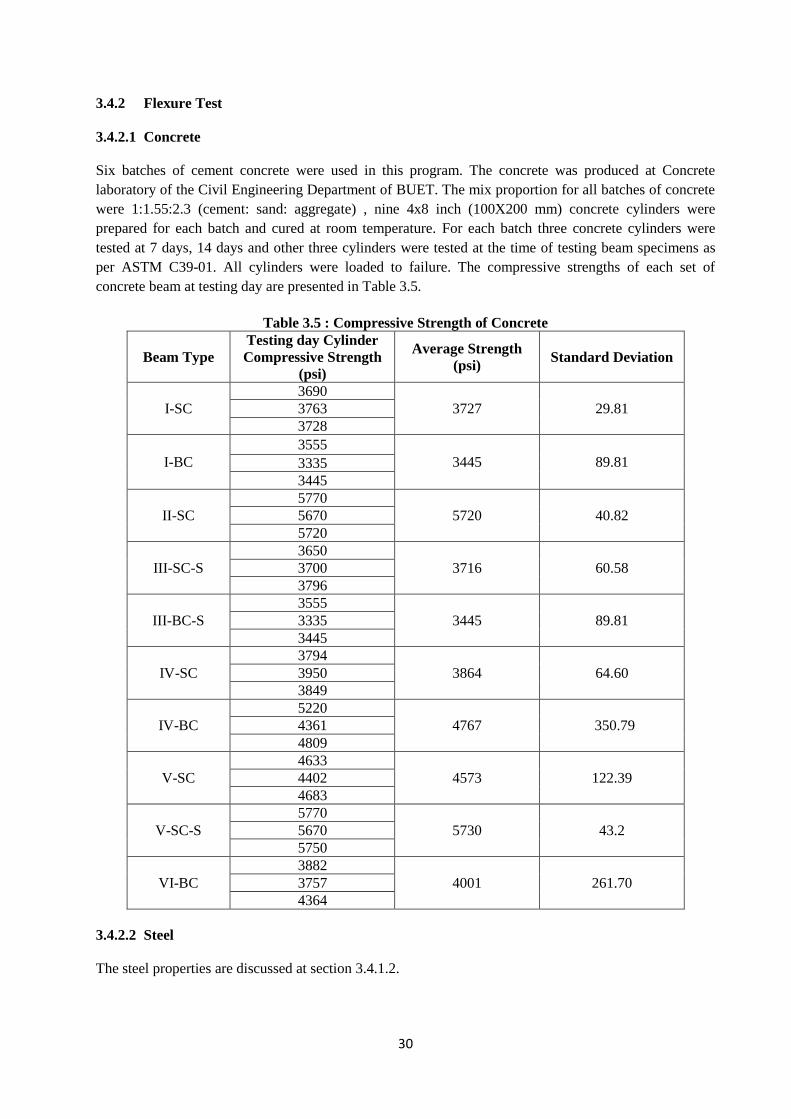
30
3.4.2 Flexure Test
3.4.2.1 Concrete
Six batches of cement concrete were used in this program. The concrete was produced at Concrete
laboratory of the Civil Engineering Department of BUET. The mix proportion for all batches of concrete
were 1:1.55:2.3 (cement: sand: aggregate) , nine 4x8 inch (100X200 mm) concrete cylinders were
prepared for each batch and cured at room temperature. For each batch three concrete cylinders were
tested at 7 days, 14 days and other three cylinders were tested at the time of testing beam specimens as
per ASTM C39-01. All cylinders were loaded to failure. The compressive strengths of each set of
concrete beam at testing day are presented in Table 3.5.
Table 3.5 : Compressive Strength of Concrete
Beam Type
Testing day Cylinder
Compressive Strength
(psi)
Average Strength
(psi) Standard Deviation
I-SC
3690
3727 29.81 3763
3728
I-BC
3555
3445 89.81 3335
3445
II-SC
5770
5720 40.82 5670
5720
III-SC-S
3650
3716 60.58 3700
3796
III-BC-S
3555
3445 89.81 3335
3445
IV-SC
3794
3864 64.60 3950
3849
IV-BC
5220
4767 350.79 4361
4809
V-SC
4633
4573 122.39 4402
4683
V-SC-S
5770
5730 43.2 5670
5750
VI-BC
3882
4001 261.70 3757
4364
3.4.2.2 Steel
The steel properties are discussed at section 3.4.1.2.
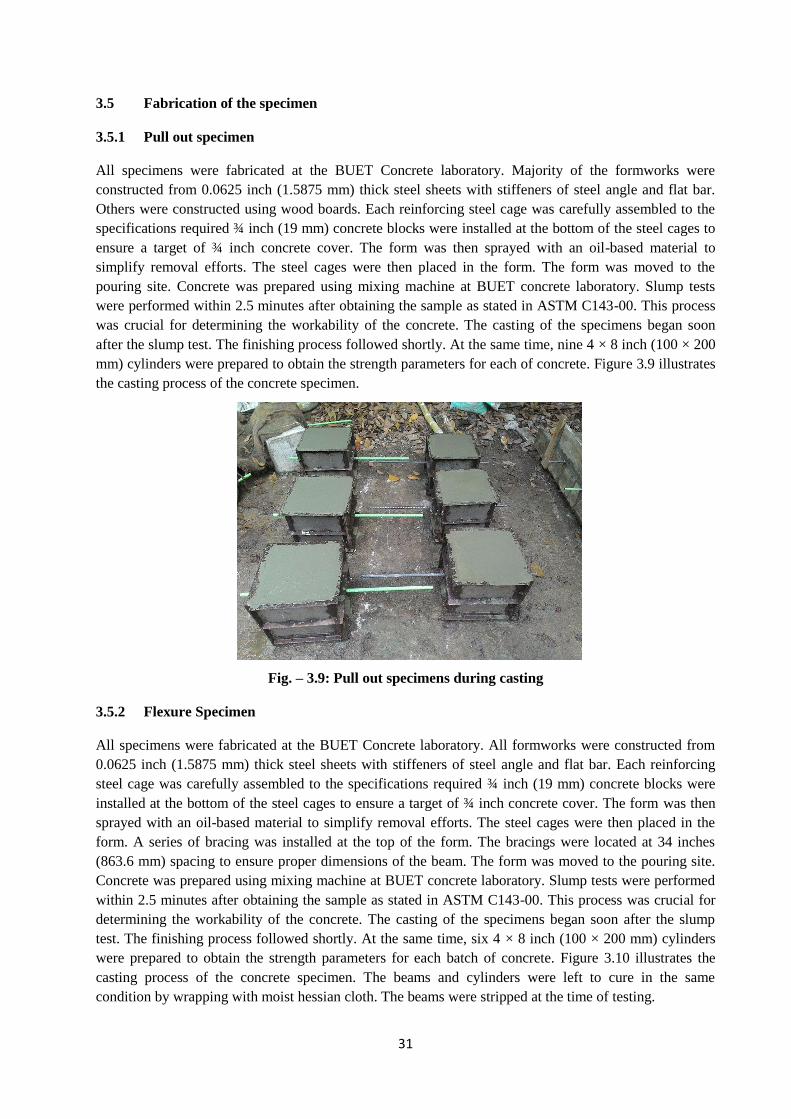
31
3.5 Fabrication of the specimen
3.5.1 Pull out specimen
All specimens were fabricated at the BUET Concrete laboratory. Majority of the formworks were
constructed from 0.0625 inch (1.5875 mm) thick steel sheets with stiffeners of steel angle and flat bar.
Others were constructed using wood boards. Each reinforcing steel cage was carefully assembled to the
specifications required ¾ inch (19 mm) concrete blocks were installed at the bottom of the steel cages to
ensure a target of ¾ inch concrete cover. The form was then sprayed with an oil-based material to
simplify removal efforts. The steel cages were then placed in the form. The form was moved to the
pouring site. Concrete was prepared using mixing machine at BUET concrete laboratory. Slump tests
were performed within 2.5 minutes after obtaining the sample as stated in ASTM C143-00. This process
was crucial for determining the workability of the concrete. The casting of the specimens began soon
after the slump test. The finishing process followed shortly. At the same time, nine 4 × 8 inch (100 × 200
mm) cylinders were prepared to obtain the strength parameters for each of concrete. Figure 3.9 illustrates
the casting process of the concrete specimen.
Fig. – 3.9: Pull out specimens during casting
3.5.2 Flexure Specimen
All specimens were fabricated at the BUET Concrete laboratory. All formworks were constructed from
0.0625 inch (1.5875 mm) thick steel sheets with stiffeners of steel angle and flat bar. Each reinforcing
steel cage was carefully assembled to the specifications required ¾ inch (19 mm) concrete blocks were
installed at the bottom of the steel cages to ensure a target of ¾ inch concrete cover. The form was then
sprayed with an oil-based material to simplify removal efforts. The steel cages were then placed in the
form. A series of bracing was installed at the top of the form. The bracings were located at 34 inches
(863.6 mm) spacing to ensure proper dimensions of the beam. The form was moved to the pouring site.
Concrete was prepared using mixing machine at BUET concrete laboratory. Slump tests were performed
within 2.5 minutes after obtaining the sample as stated in ASTM C143-00. This process was crucial for
determining the workability of the concrete. The casting of the specimens began soon after the slump
test. The finishing process followed shortly. At the same time, six 4 × 8 inch (100 × 200 mm) cylinders
were prepared to obtain the strength parameters for each batch of concrete. Figure 3.10 illustrates the
casting process of the concrete specimen. The beams and cylinders were left to cure in the same
condition by wrapping with moist hessian cloth. The beams were stripped at the time of testing.
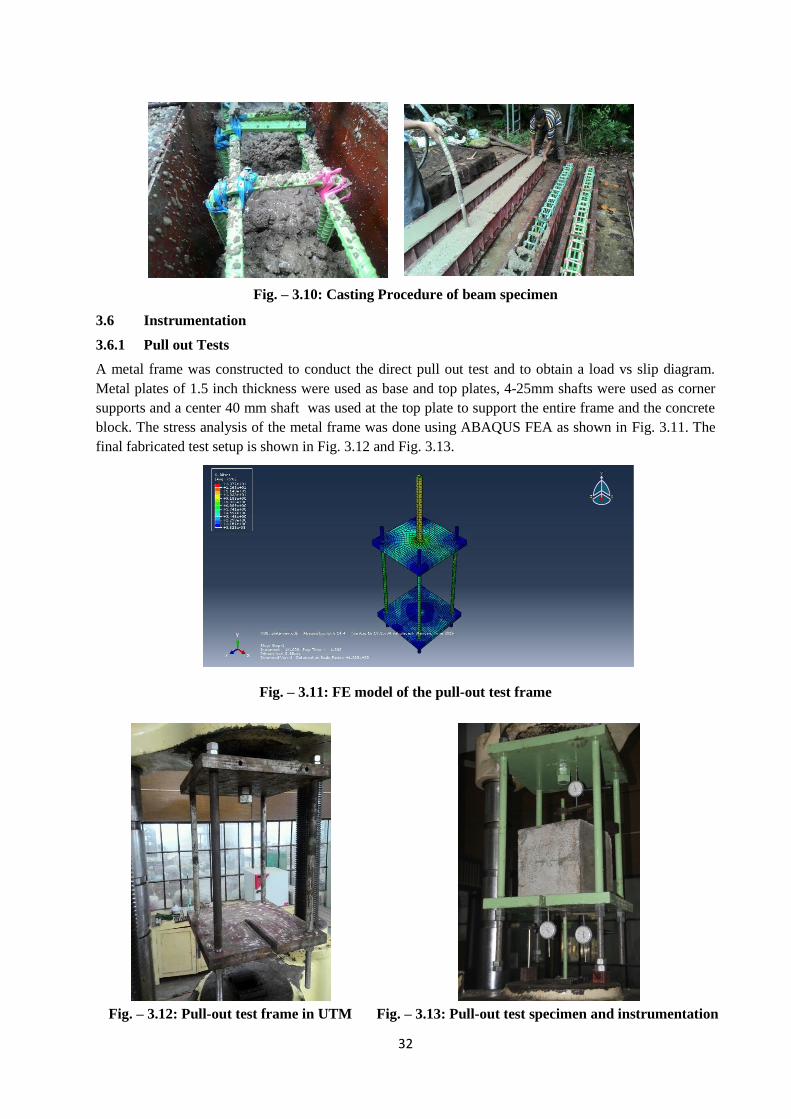
32
Fig. – 3.10: Casting Procedure of beam specimen
3.6 Instrumentation
3.6.1 Pull out Tests
A metal frame was constructed to conduct the direct pull out test and to obtain a load vs slip diagram.
Metal plates of 1.5 inch thickness were used as base and top plates, 4-25mm shafts were used as corner
supports and a center 40 mm shaft was used at the top plate to support the entire frame and the concrete
block. The stress analysis of the metal frame was done using ABAQUS FEA as shown in Fig. 3.11. The
final fabricated test setup is shown in Fig. 3.12 and Fig. 3.13.
Fig. – 3.11: FE model of the pull-out test frame
Fig. – 3.12: Pull-out test frame in UTM Fig. – 3.13: Pull-out test specimen and instrumentation
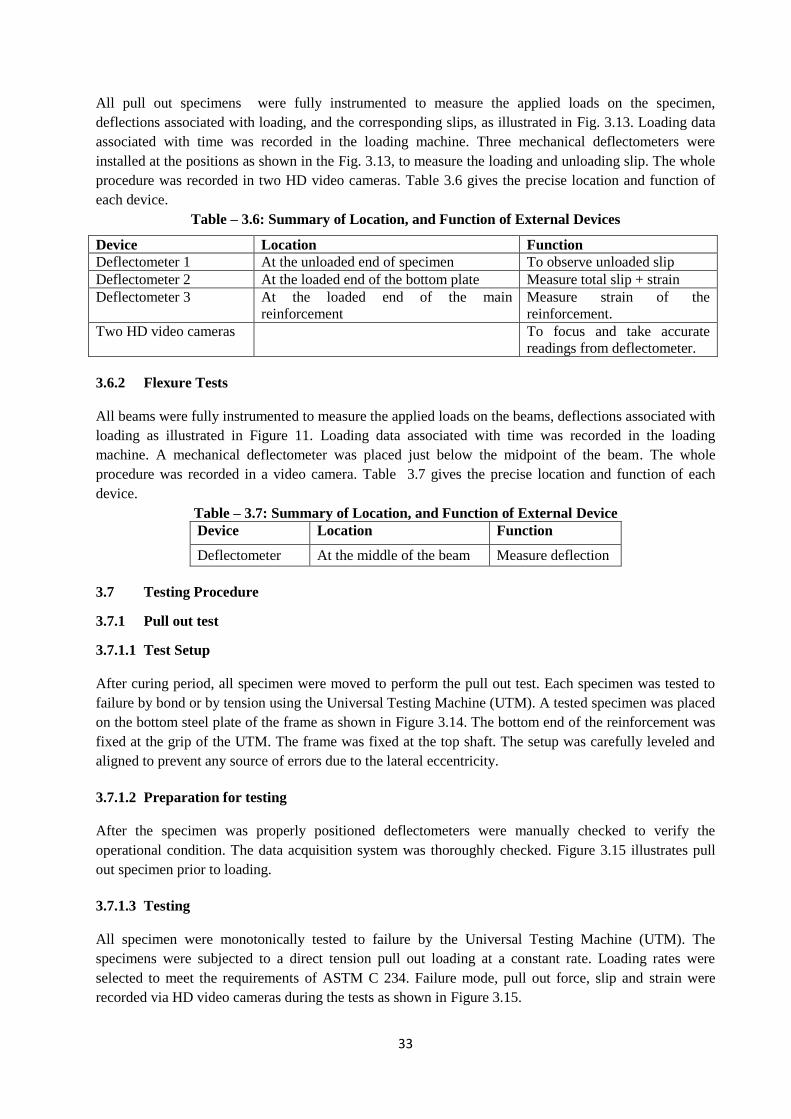
33
All pull out specimens were fully instrumented to measure the applied loads on the specimen,
deflections associated with loading, and the corresponding slips, as illustrated in Fig. 3.13. Loading data
associated with time was recorded in the loading machine. Three mechanical deflectometers were
installed at the positions as shown in the Fig. 3.13, to measure the loading and unloading slip. The whole
procedure was recorded in two HD video cameras. Table 3.6 gives the precise location and function of
each device.
Table – 3.6: Summary of Location, and Function of External Devices
Device Location Function
Deflectometer 1 At the unloaded end of specimen To observe unloaded slip
Deflectometer 2 At the loaded end of the bottom plate Measure total slip + strain
Deflectometer 3 At the loaded end of the main
reinforcement
Measure strain of the
reinforcement.
Two HD video cameras To focus and take accurate
readings from deflectometer.
3.6.2 Flexure Tests
All beams were fully instrumented to measure the applied loads on the beams, deflections associated with
loading as illustrated in Figure 11. Loading data associated with time was recorded in the loading
machine. A mechanical deflectometer was placed just below the midpoint of the beam. The whole
procedure was recorded in a video camera. Table 3.7 gives the precise location and function of each
device.
Table – 3.7: Summary of Location, and Function of External Device
Device Location Function
Deflectometer At the middle of the beam Measure deflection
3.7 Testing Procedure
3.7.1 Pull out test
3.7.1.1 Test Setup
After curing period, all specimen were moved to perform the pull out test. Each specimen was tested to
failure by bond or by tension using the Universal Testing Machine (UTM). A tested specimen was placed
on the bottom steel plate of the frame as shown in Figure 3.14. The bottom end of the reinforcement was
fixed at the grip of the UTM. The frame was fixed at the top shaft. The setup was carefully leveled and
aligned to prevent any source of errors due to the lateral eccentricity.
3.7.1.2 Preparation for testing
After the specimen was properly positioned deflectometers were manually checked to verify the
operational condition. The data acquisition system was thoroughly checked. Figure 3.15 illustrates pull
out specimen prior to loading.
3.7.1.3 Testing
All specimen were monotonically tested to failure by the Universal Testing Machine (UTM). The
specimens were subjected to a direct tension pull out loading at a constant rate. Loading rates were
selected to meet the requirements of ASTM C 234. Failure mode, pull out force, slip and strain were
recorded via HD video cameras during the tests as shown in Figure 3.15.
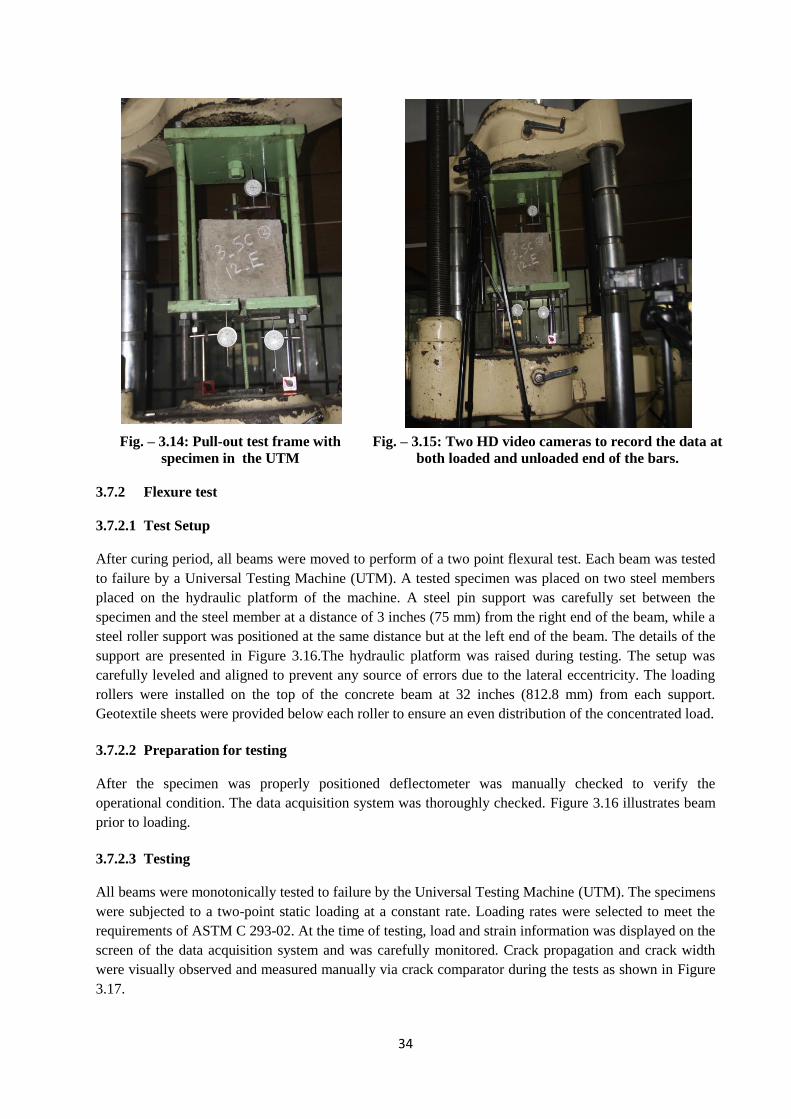
34
Fig. – 3.14: Pull-out test frame with
specimen in the UTM
Fig. – 3.15: Two HD video cameras to record the data at
both loaded and unloaded end of the bars.
3.7.2 Flexure test
3.7.2.1 Test Setup
After curing period, all beams were moved to perform of a two point flexural test. Each beam was tested
to failure by a Universal Testing Machine (UTM). A tested specimen was placed on two steel members
placed on the hydraulic platform of the machine. A steel pin support was carefully set between the
specimen and the steel member at a distance of 3 inches (75 mm) from the right end of the beam, while a
steel roller support was positioned at the same distance but at the left end of the beam. The details of the
support are presented in Figure 3.16.The hydraulic platform was raised during testing. The setup was
carefully leveled and aligned to prevent any source of errors due to the lateral eccentricity. The loading
rollers were installed on the top of the concrete beam at 32 inches (812.8 mm) from each support.
Geotextile sheets were provided below each roller to ensure an even distribution of the concentrated load.
3.7.2.2 Preparation for testing
After the specimen was properly positioned deflectometer was manually checked to verify the
operational condition. The data acquisition system was thoroughly checked. Figure 3.16 illustrates beam
prior to loading.
3.7.2.3 Testing
All beams were monotonically tested to failure by the Universal Testing Machine (UTM). The specimens
were subjected to a two-point static loading at a constant rate. Loading rates were selected to meet the
requirements of ASTM C 293-02. At the time of testing, load and strain information was displayed on the
screen of the data acquisition system and was carefully monitored. Crack propagation and crack width
were visually observed and measured manually via crack comparator during the tests as shown in Figure
3.17.
35
Fig. – 3.16: Experimental test setup for flexure.
Fig. – 3.17: Crack Comparator.
36
CHAPTER 4
Results of Experiments
4.1 Results of Pull-out tests
The experimental results of 72 pull out specimen are available. Properties of concrete and steel
reinforcing bars are also reported here. Details of the test scheme and test matrix have been presented
earlier in section 3. Material properties included the measure of concrete strength, and the mechanical
properties of BDS ISO 6935-2 Grade 500W steel. Characteristics of the concrete are the compressive
strength of the cylinder specimens determined at the time of testing of the specimen. Experimental results
of the 72 specimen included this presentation of load vs slip diagram, ultimate bond failure load, and
failure modes. Table 4.1 gives pull out test specimens and material properties.
Table – 4.1: Pull out test specimens
Pull out
Specimen Type
Concrete
Strength (ksi)
Main Pull out
Bar
Aggregate
Type Type of Rebar
I-SC 3 12 & 16 mm Stone Chips
3 Specimen of 12 mm BB
3 Specimen of 12 mm ECR
3 Specimen of 16 mm BB
3 Specimen of 16 mm ECR
I-BC 3 12 & 16 mm Brick Chips
3 Specimen of 12 mm BB
3 Specimen of 12 mm ECR
3 Specimen of 16 mm BB
3 Specimen of 16 mm ECR
II-SC 3.5 12 & 16 mm Stone Chips
3 Specimen of 12 mm BB
3 Specimen of 12 mm ECR
3 Specimen of 16 mm BB
3 Specimen of 16 mm ECR
III-SC 4 12 & 16 mm Stone Chips
3 Specimen of 12 mm BB
3 Specimen of 12 mm ECR
3 Specimen of 16 mm BB
3 Specimen of 16 mm ECR
IV-BC 2.5 12 & 16 mm Brick Chips
3 Specimen of 12 mm BB
3 Specimen of 12 mm ECR
3 Specimen of 16 mm BB
3 Specimen of 16 mm ECR
I-SC-FLd 3 12 mm Stone Chips 6 Specimen of 12 mm BB
6 Specimen of 12 mm ECR
Total = 72 Specimen
4.1.1 Comparison of Bond performance of ECR and BB of Type I-SC
The principal objective of the pull-out test was to observe the bar slip of the embedded steel rebar under
direct tensile load. Tests were conducted on 12mm and 16mm specimens with epoxy coating and black
bar. The 12in (300mm) cubical concrete block of with stone chips was cast to hold the bars .
The results of bar slip against applied direct pull are presented in Figures 4.1 and 4.2 for 12mm and
16mm bars, respectively. Each of these Figures compare the performances of 3 specimen of ECR and 3
specimen of BB all tested under identical situation.
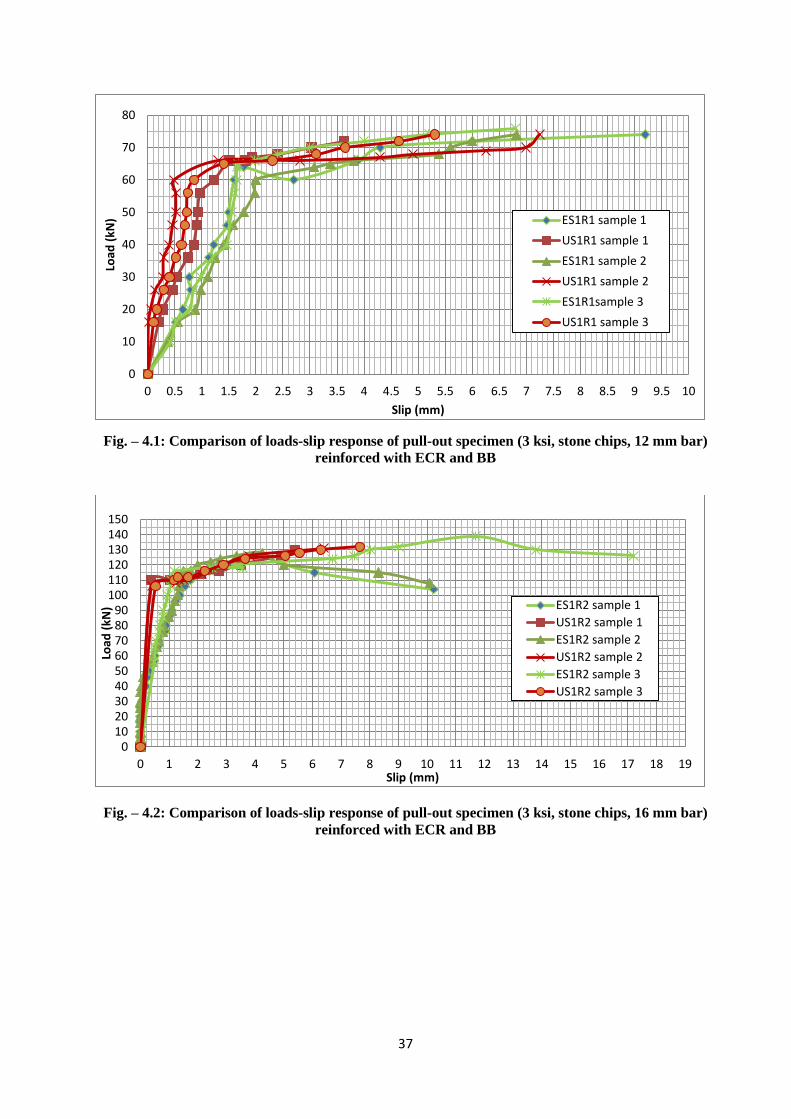
37
Fig. – 4.1: Comparison of loads-slip response of pull-out specimen (3 ksi, stone chips, 12 mm bar)
reinforced with ECR and BB
Fig. – 4.2: Comparison of loads-slip response of pull-out specimen (3 ksi, stone chips, 16 mm bar)
reinforced with ECR and BB
0
10
20
30
40
50
60
70
80
0 0.5 1 1.5 2 2.5 3 3.5 4 4.5 5 5.5 6 6.5 7 7.5 8 8.5 9 9.5 10
Load
(kN
)
Slip (mm)
ES1R1 sample 1
US1R1 sample 1
ES1R1 sample 2
US1R1 sample 2
ES1R1sample 3
US1R1 sample 3
0 10 20 30 40 50 60 70 80 90
100 110 120 130 140 150
0 1 2 3 4 5 6 7 8 9 10 11 12 13 14 15 16 17 18 19
Load
(kN
)
Slip (mm)
ES1R2 sample 1
US1R2 sample 1
ES1R2 sample 2
US1R2 sample 2
ES1R2 sample 3
US1R2 sample 3
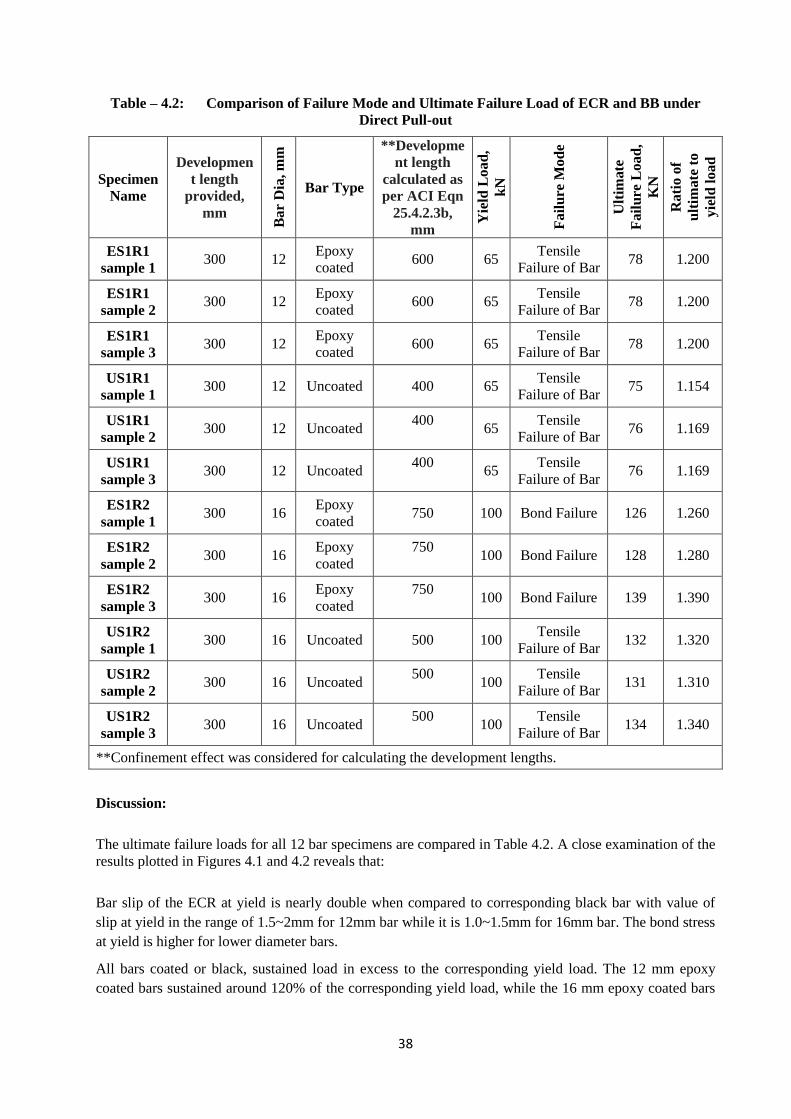
38
Table – 4.2: Comparison of Failure Mode and Ultimate Failure Load of ECR and BB under
Direct Pull-out
Specimen
Name
Developmen
t length
provided,
mm
Ba
r D
ia, m
m
Bar Type
**Developme
nt length
calculated as
per ACI Eqn
25.4.2.3b,
mm
Yie
ld L
oa
d,
kN
Fa
ilu
re M
od
e
Ult
imate
Fa
ilu
re L
oa
d,
KN
Ra
tio
of
ult
imate
to
yie
ld l
oad
ES1R1
sample 1 300 12
Epoxy
coated 600 65
Tensile
Failure of Bar 78 1.200
ES1R1
sample 2 300 12
Epoxy
coated 600 65
Tensile
Failure of Bar 78 1.200
ES1R1
sample 3 300 12
Epoxy
coated 600 65
Tensile
Failure of Bar 78 1.200
US1R1
sample 1 300 12 Uncoated 400 65
Tensile
Failure of Bar 75 1.154
US1R1
sample 2 300 12 Uncoated
400 65
Tensile
Failure of Bar 76 1.169
US1R1
sample 3 300 12 Uncoated
400 65
Tensile
Failure of Bar 76 1.169
ES1R2
sample 1 300 16
Epoxy
coated 750 100 Bond Failure 126 1.260
ES1R2
sample 2 300 16
Epoxy
coated
750 100 Bond Failure 128 1.280
ES1R2
sample 3 300 16
Epoxy
coated
750 100 Bond Failure 139 1.390
US1R2
sample 1 300 16 Uncoated 500 100
Tensile
Failure of Bar 132 1.320
US1R2
sample 2 300 16 Uncoated
500 100
Tensile
Failure of Bar 131 1.310
US1R2
sample 3 300 16 Uncoated
500 100
Tensile
Failure of Bar 134 1.340
**Confinement effect was considered for calculating the development lengths.
Discussion:
The ultimate failure loads for all 12 bar specimens are compared in Table 4.2. A close examination of the
results plotted in Figures 4.1 and 4.2 reveals that:
Bar slip of the ECR at yield is nearly double when compared to corresponding black bar with value of
slip at yield in the range of 1.5~2mm for 12mm bar while it is 1.0~1.5mm for 16mm bar. The bond stress
at yield is higher for lower diameter bars.
All bars coated or black, sustained load in excess to the corresponding yield load. The 12 mm epoxy
coated bars sustained around 120% of the corresponding yield load, while the 16 mm epoxy coated bars
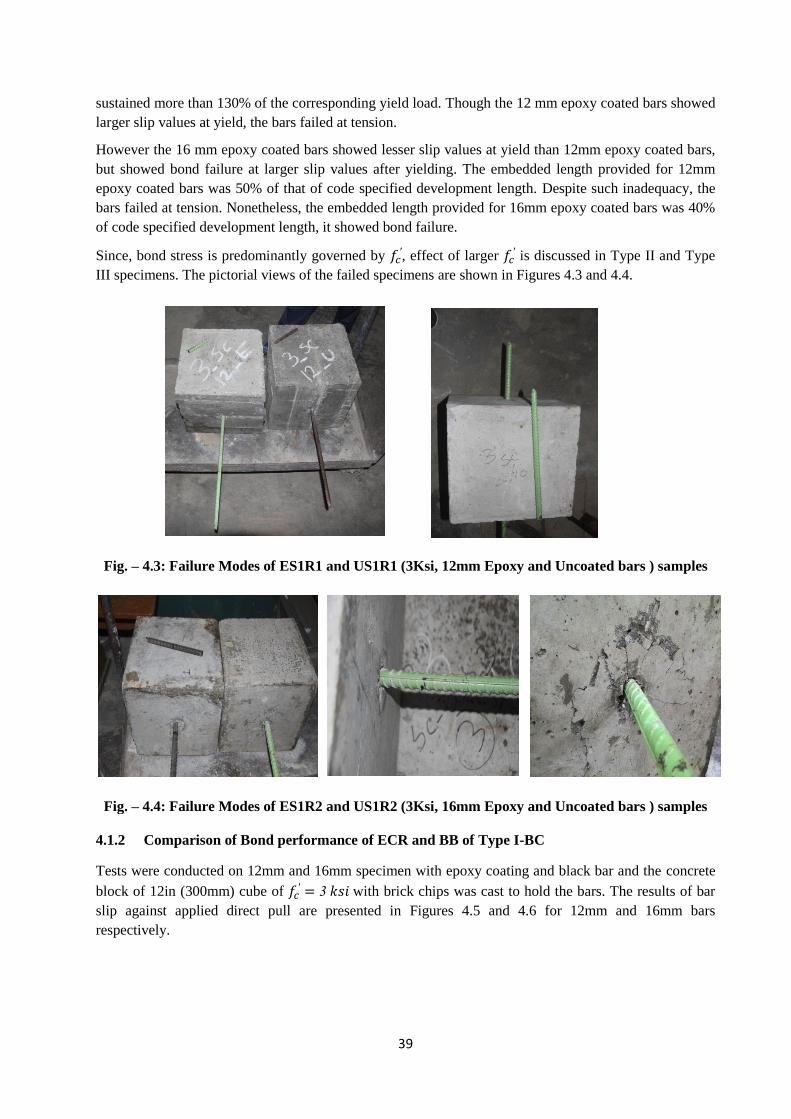
39
sustained more than 130% of the corresponding yield load. Though the 12 mm epoxy coated bars showed
larger slip values at yield, the bars failed at tension.
However the 16 mm epoxy coated bars showed lesser slip values at yield than 12mm epoxy coated bars,
but showed bond failure at larger slip values after yielding. The embedded length provided for 12mm
epoxy coated bars was 50% of that of code specified development length. Despite such inadequacy, the
bars failed at tension. Nonetheless, the embedded length provided for 16mm epoxy coated bars was 40%
of code specified development length, it showed bond failure.
Since, bond stress is predominantly governed by , effect of larger
is discussed in Type II and Type
III specimens. The pictorial views of the failed specimens are shown in Figures 4.3 and 4.4.
Fig. – 4.3: Failure Modes of ES1R1 and US1R1 (3Ksi, 12mm Epoxy and Uncoated bars ) samples
Fig. – 4.4: Failure Modes of ES1R2 and US1R2 (3Ksi, 16mm Epoxy and Uncoated bars ) samples
4.1.2 Comparison of Bond performance of ECR and BB of Type I-BC
Tests were conducted on 12mm and 16mm specimen with epoxy coating and black bar and the concrete
block of 12in (300mm) cube of with brick chips was cast to hold the bars. The results of bar
slip against applied direct pull are presented in Figures 4.5 and 4.6 for 12mm and 16mm bars
respectively.
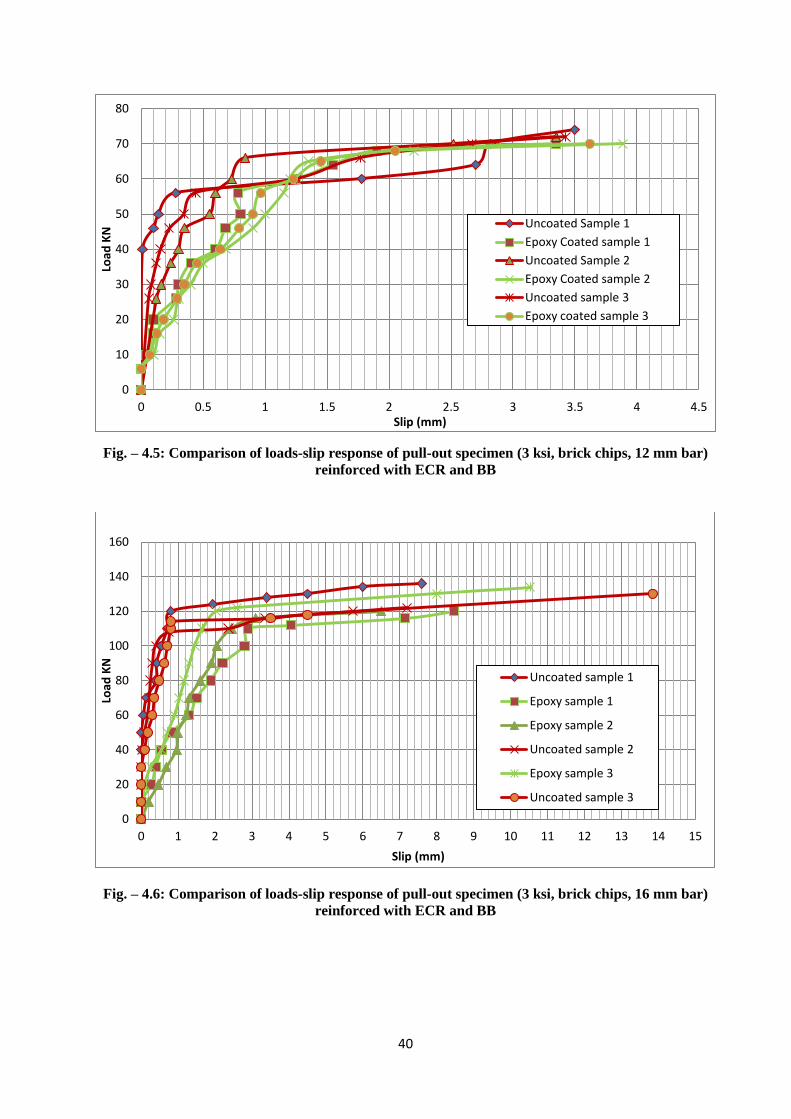
40
Fig. – 4.5: Comparison of loads-slip response of pull-out specimen (3 ksi, brick chips, 12 mm bar)
reinforced with ECR and BB
Fig. – 4.6: Comparison of loads-slip response of pull-out specimen (3 ksi, brick chips, 16 mm bar)
reinforced with ECR and BB
0
10
20
30
40
50
60
70
80
0 0.5 1 1.5 2 2.5 3 3.5 4 4.5
Load
KN
Slip (mm)
Uncoated Sample 1
Epoxy Coated sample 1
Uncoated Sample 2
Epoxy Coated sample 2
Uncoated sample 3
Epoxy coated sample 3
0
20
40
60
80
100
120
140
160
0 1 2 3 4 5 6 7 8 9 10 11 12 13 14 15
Load
KN
Slip (mm)
Uncoated sample 1
Epoxy sample 1
Epoxy sample 2
Uncoated sample 2
Epoxy sample 3
Uncoated sample 3
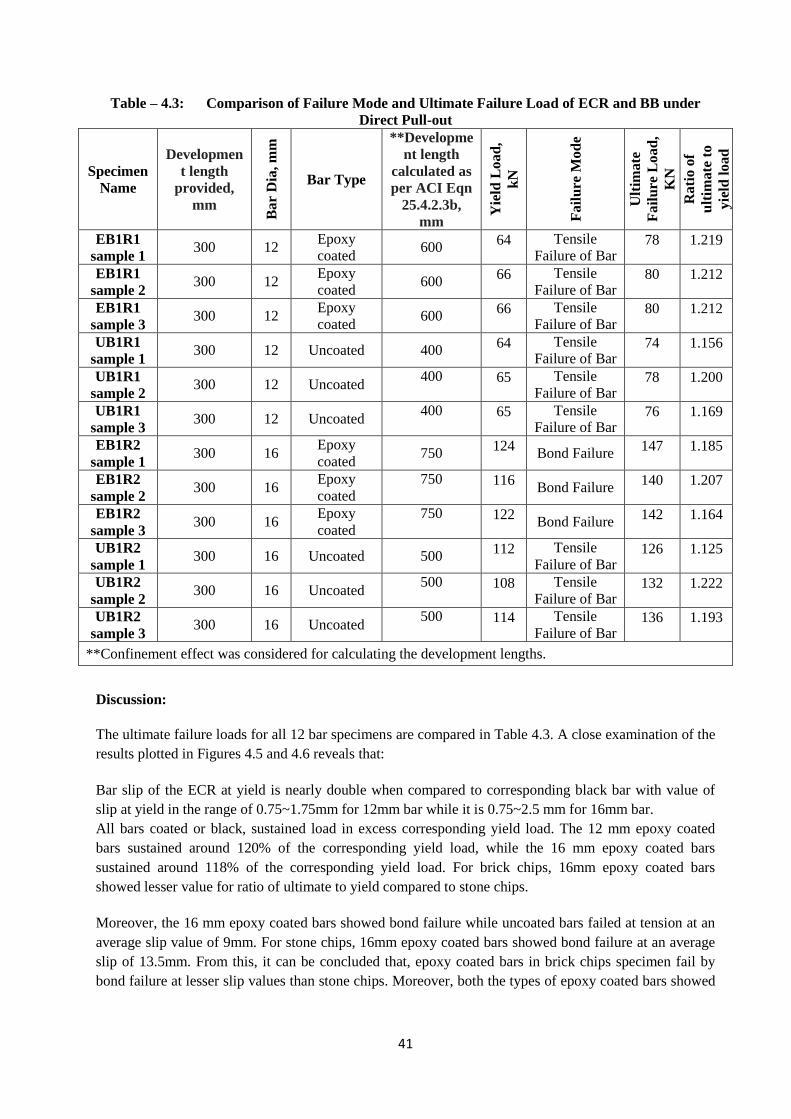
41
Table – 4.3: Comparison of Failure Mode and Ultimate Failure Load of ECR and BB under
Direct Pull-out
Specimen
Name
Developmen
t length
provided,
mm
Ba
r D
ia, m
m
Bar Type
**Developme
nt length
calculated as
per ACI Eqn
25.4.2.3b,
mm
Yie
ld L
oa
d,
kN
Fa
ilu
re M
od
e
Ult
imate
Fa
ilu
re L
oa
d,
KN
Ra
tio
of
ult
imate
to
yie
ld l
oad
EB1R1
sample 1 300 12
Epoxy
coated 600
64 Tensile
Failure of Bar 78 1.219
EB1R1
sample 2 300 12
Epoxy
coated 600
66 Tensile
Failure of Bar 80 1.212
EB1R1
sample 3 300 12
Epoxy
coated 600
66 Tensile
Failure of Bar 80 1.212
UB1R1
sample 1 300 12 Uncoated 400
64 Tensile
Failure of Bar 74 1.156
UB1R1
sample 2 300 12 Uncoated
400 65 Tensile
Failure of Bar 78 1.200
UB1R1
sample 3 300 12 Uncoated
400 65 Tensile
Failure of Bar 76 1.169
EB1R2
sample 1 300 16
Epoxy
coated 750
124 Bond Failure
147 1.185
EB1R2
sample 2 300 16
Epoxy
coated
750 116 Bond Failure
140 1.207
EB1R2
sample 3 300 16
Epoxy
coated
750 122 Bond Failure
142 1.164
UB1R2
sample 1 300 16 Uncoated 500
112 Tensile
Failure of Bar 126 1.125
UB1R2
sample 2 300 16 Uncoated
500 108 Tensile
Failure of Bar 132 1.222
UB1R2
sample 3 300 16 Uncoated
500 114 Tensile
Failure of Bar 136 1.193
**Confinement effect was considered for calculating the development lengths.
Discussion:
The ultimate failure loads for all 12 bar specimens are compared in Table 4.3. A close examination of the
results plotted in Figures 4.5 and 4.6 reveals that:
Bar slip of the ECR at yield is nearly double when compared to corresponding black bar with value of
slip at yield in the range of 0.75~1.75mm for 12mm bar while it is 0.75~2.5 mm for 16mm bar.
All bars coated or black, sustained load in excess corresponding yield load. The 12 mm epoxy coated
bars sustained around 120% of the corresponding yield load, while the 16 mm epoxy coated bars
sustained around 118% of the corresponding yield load. For brick chips, 16mm epoxy coated bars
showed lesser value for ratio of ultimate to yield compared to stone chips.
Moreover, the 16 mm epoxy coated bars showed bond failure while uncoated bars failed at tension at an
average slip value of 9mm. For stone chips, 16mm epoxy coated bars showed bond failure at an average
slip of 13.5mm. From this, it can be concluded that, epoxy coated bars in brick chips specimen fail by
bond failure at lesser slip values than stone chips. Moreover, both the types of epoxy coated bars showed
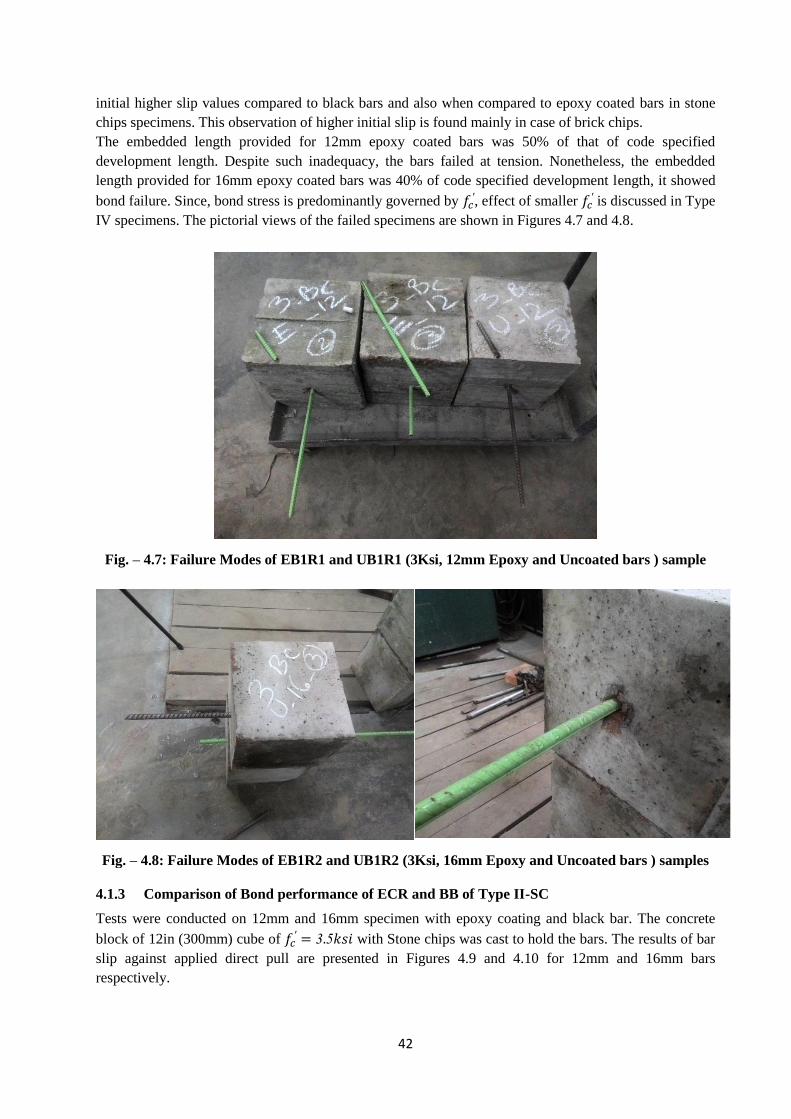
42
initial higher slip values compared to black bars and also when compared to epoxy coated bars in stone
chips specimens. This observation of higher initial slip is found mainly in case of brick chips.
The embedded length provided for 12mm epoxy coated bars was 50% of that of code specified
development length. Despite such inadequacy, the bars failed at tension. Nonetheless, the embedded
length provided for 16mm epoxy coated bars was 40% of code specified development length, it showed
bond failure. Since, bond stress is predominantly governed by , effect of smaller
is discussed in Type
IV specimens. The pictorial views of the failed specimens are shown in Figures 4.7 and 4.8.
Fig. – 4.7: Failure Modes of EB1R1 and UB1R1 (3Ksi, 12mm Epoxy and Uncoated bars ) sample
Fig. – 4.8: Failure Modes of EB1R2 and UB1R2 (3Ksi, 16mm Epoxy and Uncoated bars ) samples
4.1.3 Comparison of Bond performance of ECR and BB of Type II-SC
Tests were conducted on 12mm and 16mm specimen with epoxy coating and black bar. The concrete
block of 12in (300mm) cube of with Stone chips was cast to hold the bars. The results of bar
slip against applied direct pull are presented in Figures 4.9 and 4.10 for 12mm and 16mm bars
respectively.
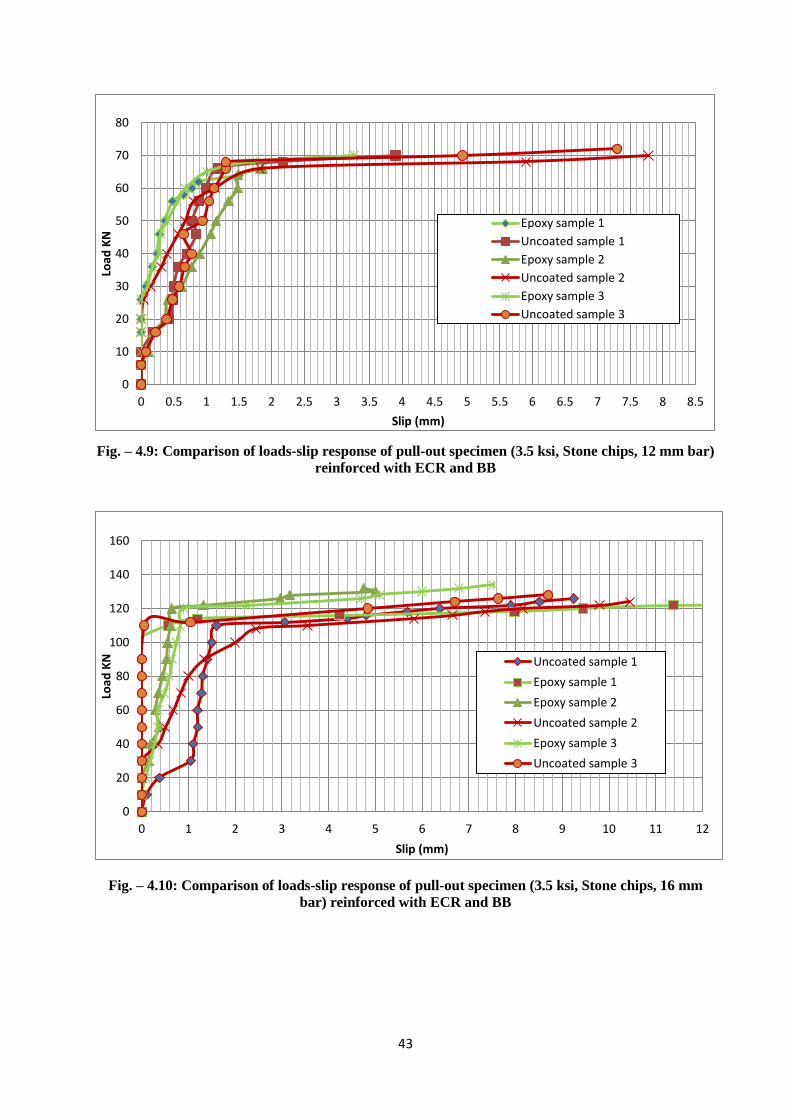
43
Fig. – 4.9: Comparison of loads-slip response of pull-out specimen (3.5 ksi, Stone chips, 12 mm bar)
reinforced with ECR and BB
Fig. – 4.10: Comparison of loads-slip response of pull-out specimen (3.5 ksi, Stone chips, 16 mm
bar) reinforced with ECR and BB
0
10
20
30
40
50
60
70
80
0 0.5 1 1.5 2 2.5 3 3.5 4 4.5 5 5.5 6 6.5 7 7.5 8 8.5
Load
KN
Slip (mm)
Epoxy sample 1
Uncoated sample 1
Epoxy sample 2
Uncoated sample 2
Epoxy sample 3
Uncoated sample 3
0
20
40
60
80
100
120
140
160
0 1 2 3 4 5 6 7 8 9 10 11 12
Load
KN
Slip (mm)
Uncoated sample 1
Epoxy sample 1
Epoxy sample 2
Uncoated sample 2
Epoxy sample 3
Uncoated sample 3
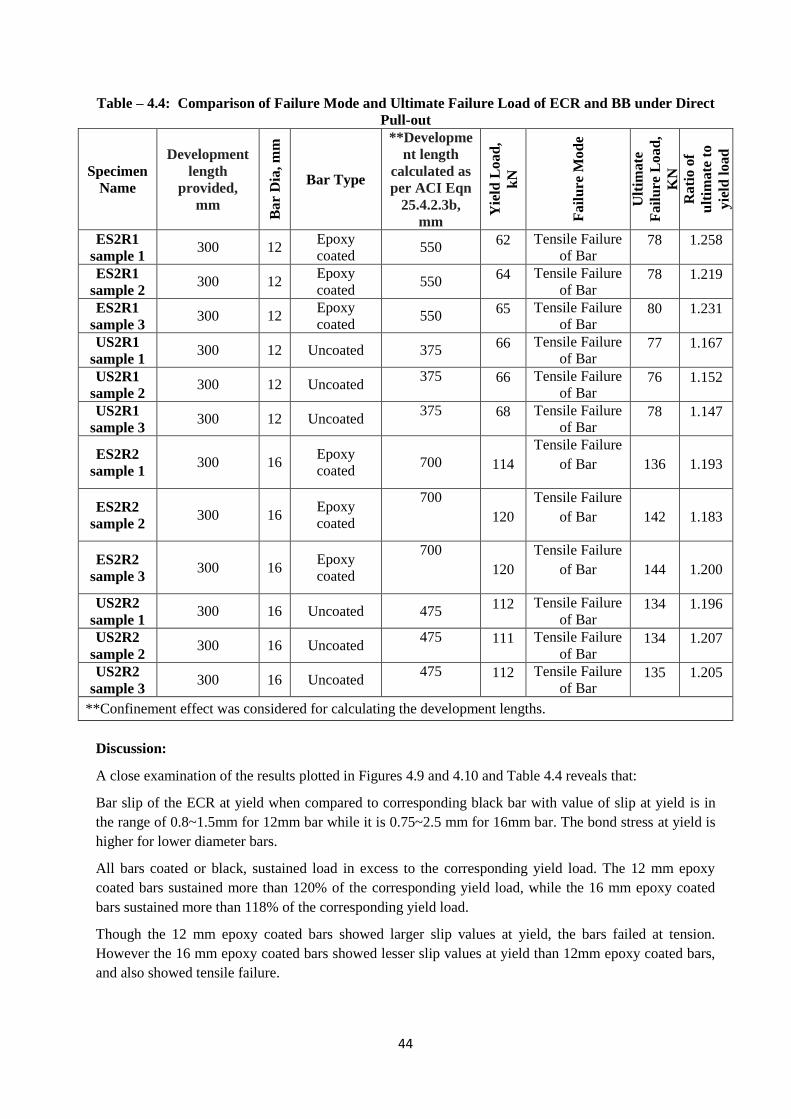
44
Table – 4.4: Comparison of Failure Mode and Ultimate Failure Load of ECR and BB under Direct
Pull-out
Specimen
Name
Development
length
provided,
mm
Ba
r D
ia, m
m
Bar Type
**Developme
nt length
calculated as
per ACI Eqn
25.4.2.3b,
mm
Yie
ld L
oa
d,
kN
Fa
ilu
re M
od
e
Ult
imate
Fa
ilu
re L
oa
d,
KN
Ra
tio
of
ult
imate
to
yie
ld l
oad
ES2R1
sample 1 300 12
Epoxy
coated 550
62 Tensile Failure
of Bar 78 1.258
ES2R1
sample 2 300 12
Epoxy
coated 550
64 Tensile Failure
of Bar 78 1.219
ES2R1
sample 3 300 12
Epoxy
coated 550
65 Tensile Failure
of Bar 80 1.231
US2R1
sample 1 300 12 Uncoated 375
66 Tensile Failure
of Bar 77 1.167
US2R1
sample 2 300 12 Uncoated
375 66 Tensile Failure
of Bar 76 1.152
US2R1
sample 3 300 12 Uncoated
375 68 Tensile Failure
of Bar 78 1.147
ES2R2
sample 1 300 16
Epoxy
coated 700 114
Tensile Failure
of Bar 136 1.193
ES2R2
sample 2 300 16
Epoxy
coated
700
120
Tensile Failure
of Bar 142 1.183
ES2R2
sample 3 300 16
Epoxy
coated
700
120
Tensile Failure
of Bar 144 1.200
US2R2
sample 1 300 16 Uncoated 475
112 Tensile Failure
of Bar 134 1.196
US2R2
sample 2 300 16 Uncoated
475 111 Tensile Failure
of Bar 134 1.207
US2R2
sample 3 300 16 Uncoated
475 112 Tensile Failure
of Bar 135 1.205
**Confinement effect was considered for calculating the development lengths.
Discussion:
A close examination of the results plotted in Figures 4.9 and 4.10 and Table 4.4 reveals that:
Bar slip of the ECR at yield when compared to corresponding black bar with value of slip at yield is in
the range of 0.8~1.5mm for 12mm bar while it is 0.75~2.5 mm for 16mm bar. The bond stress at yield is
higher for lower diameter bars.
All bars coated or black, sustained load in excess to the corresponding yield load. The 12 mm epoxy
coated bars sustained more than 120% of the corresponding yield load, while the 16 mm epoxy coated
bars sustained more than 118% of the corresponding yield load.
Though the 12 mm epoxy coated bars showed larger slip values at yield, the bars failed at tension.
However the 16 mm epoxy coated bars showed lesser slip values at yield than 12mm epoxy coated bars,
and also showed tensile failure.
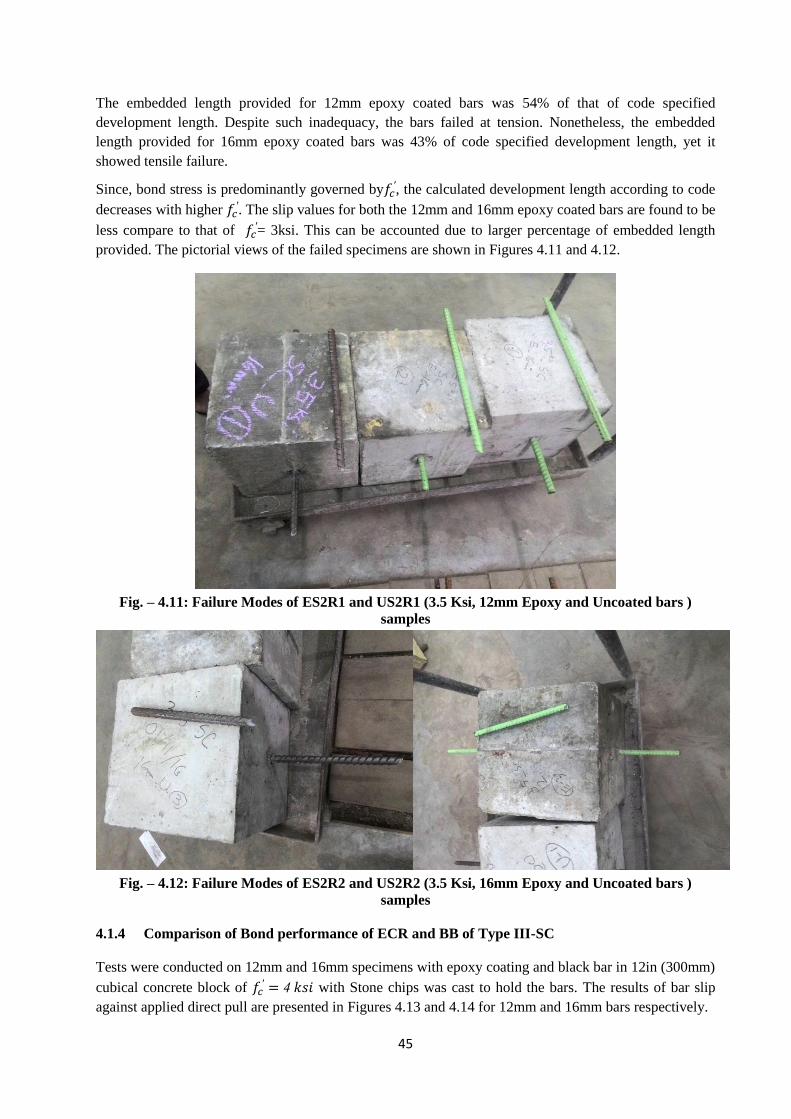
45
The embedded length provided for 12mm epoxy coated bars was 54% of that of code specified
development length. Despite such inadequacy, the bars failed at tension. Nonetheless, the embedded
length provided for 16mm epoxy coated bars was 43% of code specified development length, yet it
showed tensile failure.
Since, bond stress is predominantly governed by , the calculated development length according to code
decreases with higher . The slip values for both the 12mm and 16mm epoxy coated bars are found to be
less compare to that of = 3ksi. This can be accounted due to larger percentage of embedded length
provided. The pictorial views of the failed specimens are shown in Figures 4.11 and 4.12.
Fig. – 4.11: Failure Modes of ES2R1 and US2R1 (3.5 Ksi, 12mm Epoxy and Uncoated bars )
samples
Fig. – 4.12: Failure Modes of ES2R2 and US2R2 (3.5 Ksi, 16mm Epoxy and Uncoated bars )
samples
4.1.4 Comparison of Bond performance of ECR and BB of Type III-SC
Tests were conducted on 12mm and 16mm specimens with epoxy coating and black bar in 12in (300mm)
cubical concrete block of with Stone chips was cast to hold the bars. The results of bar slip
against applied direct pull are presented in Figures 4.13 and 4.14 for 12mm and 16mm bars respectively.
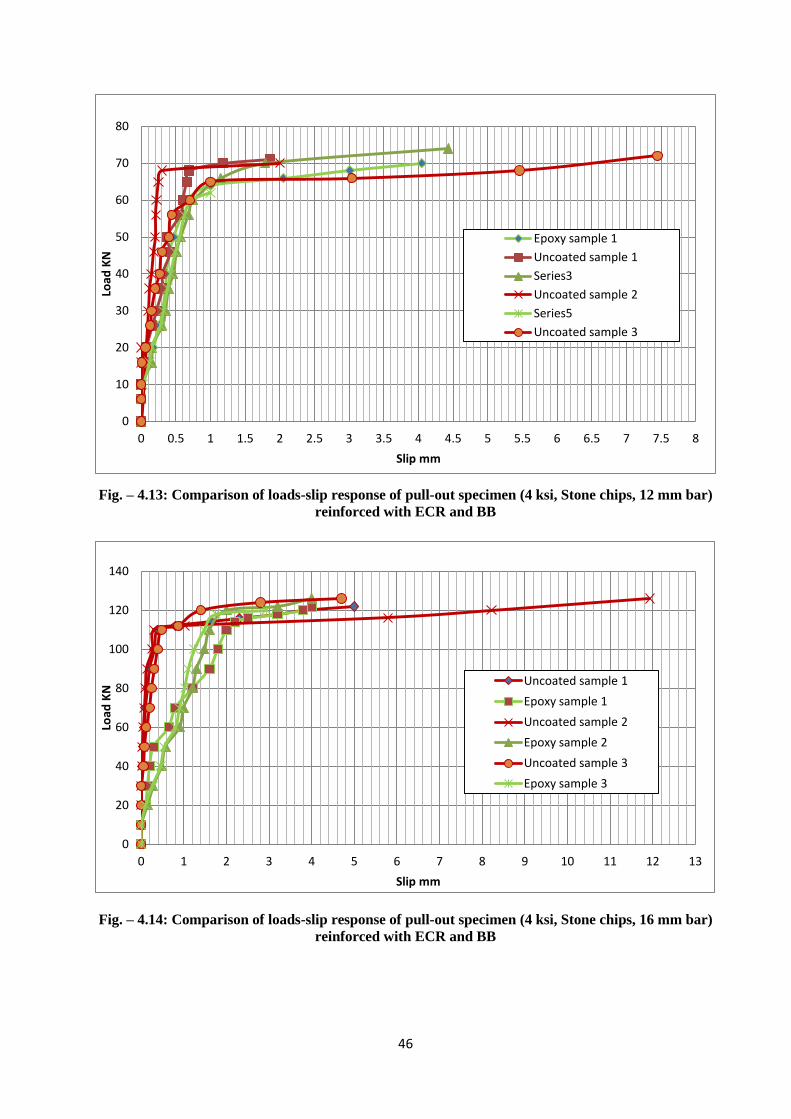
46
Fig. – 4.13: Comparison of loads-slip response of pull-out specimen (4 ksi, Stone chips, 12 mm bar)
reinforced with ECR and BB
Fig. – 4.14: Comparison of loads-slip response of pull-out specimen (4 ksi, Stone chips, 16 mm bar)
reinforced with ECR and BB
0
10
20
30
40
50
60
70
80
0 0.5 1 1.5 2 2.5 3 3.5 4 4.5 5 5.5 6 6.5 7 7.5 8
Load
KN
Slip mm
Epoxy sample 1
Uncoated sample 1
Series3
Uncoated sample 2
Series5
Uncoated sample 3
0
20
40
60
80
100
120
140
0 1 2 3 4 5 6 7 8 9 10 11 12 13
Load
KN
Slip mm
Uncoated sample 1
Epoxy sample 1
Uncoated sample 2
Epoxy sample 2
Uncoated sample 3
Epoxy sample 3
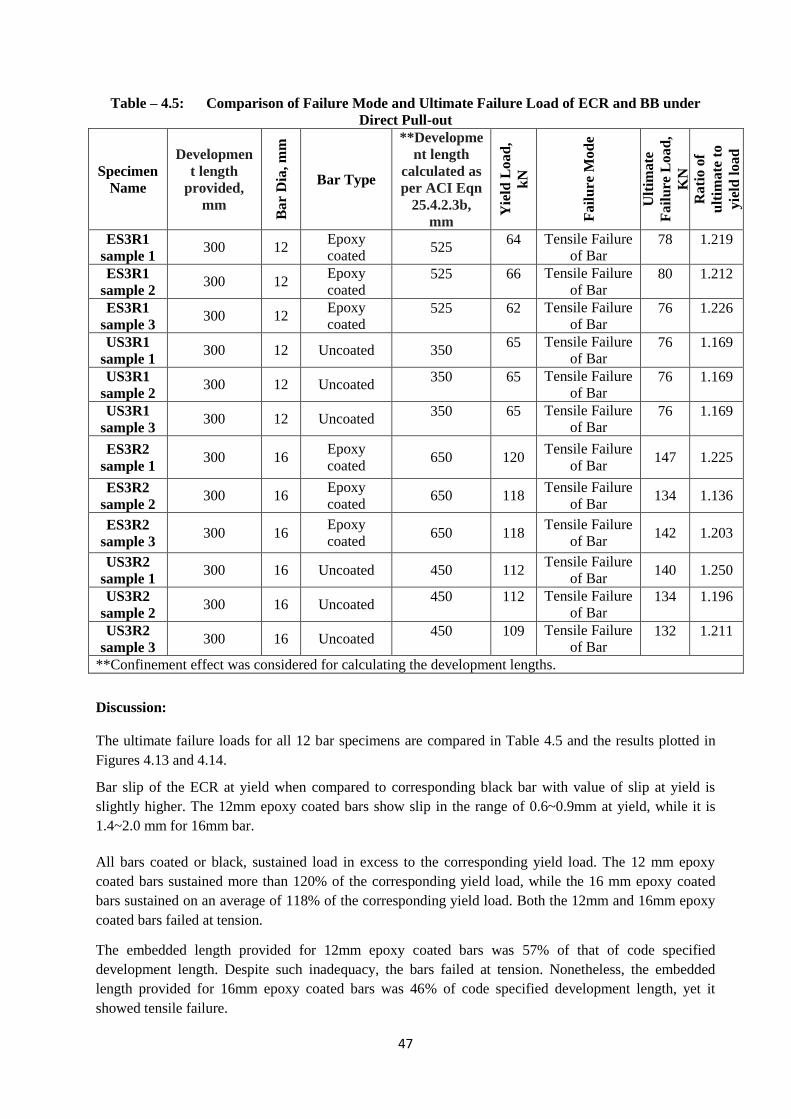
47
Table – 4.5: Comparison of Failure Mode and Ultimate Failure Load of ECR and BB under
Direct Pull-out
Specimen
Name
Developmen
t length
provided,
mm
Ba
r D
ia, m
m
Bar Type
**Developme
nt length
calculated as
per ACI Eqn
25.4.2.3b,
mm
Yie
ld L
oa
d,
kN
Fa
ilu
re M
od
e
Ult
imate
Fa
ilu
re L
oa
d,
KN
Ra
tio
of
ult
imate
to
yie
ld l
oad
ES3R1
sample 1 300 12
Epoxy
coated 525
64 Tensile Failure
of Bar 78 1.219
ES3R1
sample 2 300 12
Epoxy
coated 525 66 Tensile Failure
of Bar 80 1.212
ES3R1
sample 3 300 12
Epoxy
coated 525 62 Tensile Failure
of Bar 76 1.226
US3R1
sample 1 300 12 Uncoated 350
65 Tensile Failure
of Bar 76 1.169
US3R1
sample 2 300 12 Uncoated
350 65 Tensile Failure
of Bar 76 1.169
US3R1
sample 3 300 12 Uncoated
350 65 Tensile Failure
of Bar 76 1.169
ES3R2
sample 1 300 16
Epoxy
coated 650 120
Tensile Failure
of Bar 147 1.225
ES3R2
sample 2 300 16
Epoxy
coated 650 118
Tensile Failure
of Bar 134 1.136
ES3R2
sample 3 300 16
Epoxy
coated 650 118
Tensile Failure
of Bar 142 1.203
US3R2
sample 1 300 16 Uncoated 450 112
Tensile Failure
of Bar 140 1.250
US3R2
sample 2 300 16 Uncoated
450 112 Tensile Failure
of Bar 134 1.196
US3R2
sample 3 300 16 Uncoated
450 109 Tensile Failure
of Bar 132 1.211
**Confinement effect was considered for calculating the development lengths.
Discussion:
The ultimate failure loads for all 12 bar specimens are compared in Table 4.5 and the results plotted in
Figures 4.13 and 4.14.
Bar slip of the ECR at yield when compared to corresponding black bar with value of slip at yield is
slightly higher. The 12mm epoxy coated bars show slip in the range of 0.6~0.9mm at yield, while it is
1.4~2.0 mm for 16mm bar.
All bars coated or black, sustained load in excess to the corresponding yield load. The 12 mm epoxy
coated bars sustained more than 120% of the corresponding yield load, while the 16 mm epoxy coated
bars sustained on an average of 118% of the corresponding yield load. Both the 12mm and 16mm epoxy
coated bars failed at tension.
The embedded length provided for 12mm epoxy coated bars was 57% of that of code specified
development length. Despite such inadequacy, the bars failed at tension. Nonetheless, the embedded
length provided for 16mm epoxy coated bars was 46% of code specified development length, yet it
showed tensile failure.
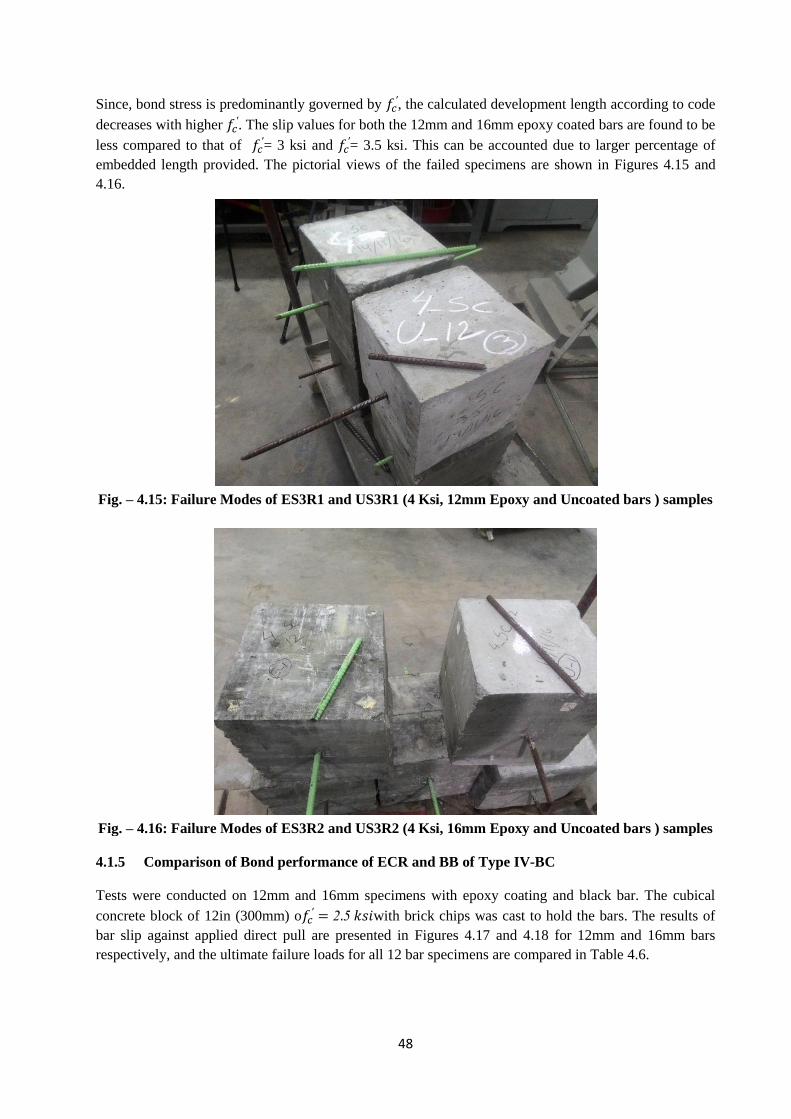
48
Since, bond stress is predominantly governed by , the calculated development length according to code
decreases with higher . The slip values for both the 12mm and 16mm epoxy coated bars are found to be
less compared to that of = 3 ksi and
= 3.5 ksi. This can be accounted due to larger percentage of
embedded length provided. The pictorial views of the failed specimens are shown in Figures 4.15 and
4.16.
Fig. – 4.15: Failure Modes of ES3R1 and US3R1 (4 Ksi, 12mm Epoxy and Uncoated bars ) samples
Fig. – 4.16: Failure Modes of ES3R2 and US3R2 (4 Ksi, 16mm Epoxy and Uncoated bars ) samples
4.1.5 Comparison of Bond performance of ECR and BB of Type IV-BC
Tests were conducted on 12mm and 16mm specimens with epoxy coating and black bar. The cubical
concrete block of 12in (300mm) o with brick chips was cast to hold the bars. The results of
bar slip against applied direct pull are presented in Figures 4.17 and 4.18 for 12mm and 16mm bars
respectively, and the ultimate failure loads for all 12 bar specimens are compared in Table 4.6.
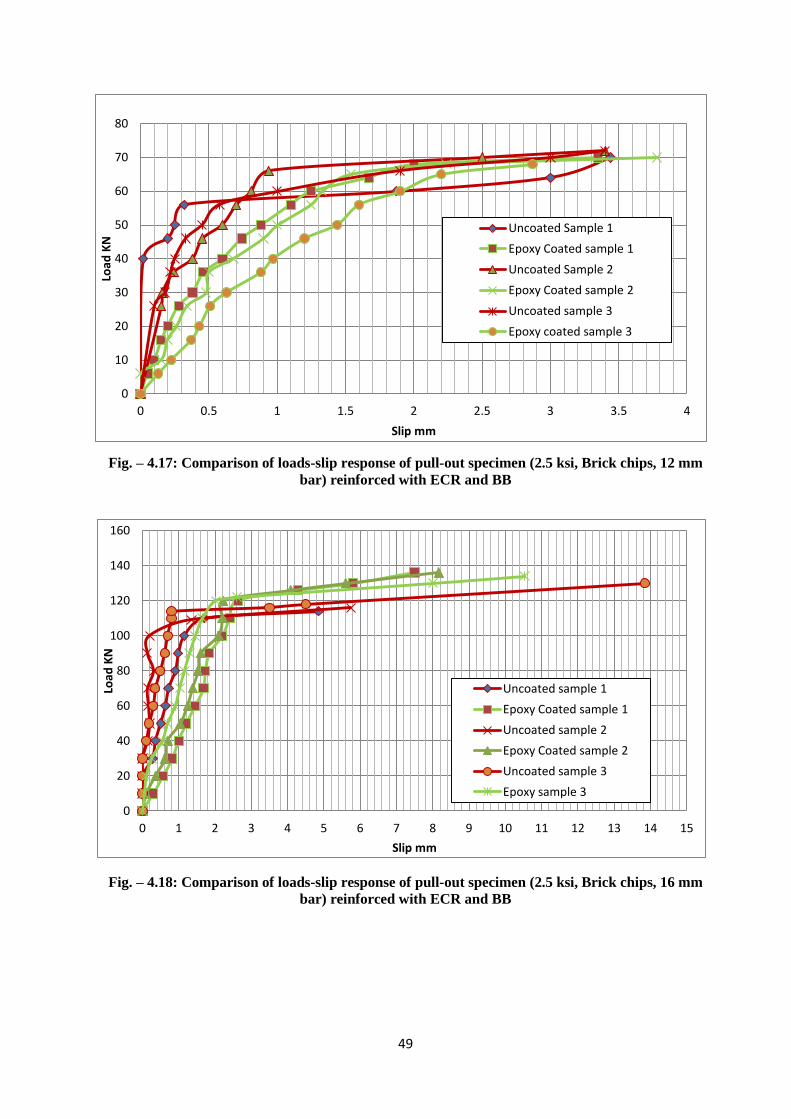
49
Fig. – 4.17: Comparison of loads-slip response of pull-out specimen (2.5 ksi, Brick chips, 12 mm
bar) reinforced with ECR and BB
Fig. – 4.18: Comparison of loads-slip response of pull-out specimen (2.5 ksi, Brick chips, 16 mm
bar) reinforced with ECR and BB
0
10
20
30
40
50
60
70
80
0 0.5 1 1.5 2 2.5 3 3.5 4
Load
KN
Slip mm
Uncoated Sample 1
Epoxy Coated sample 1
Uncoated Sample 2
Epoxy Coated sample 2
Uncoated sample 3
Epoxy coated sample 3
0
20
40
60
80
100
120
140
160
0 1 2 3 4 5 6 7 8 9 10 11 12 13 14 15
Load
KN
Slip mm
Uncoated sample 1
Epoxy Coated sample 1
Uncoated sample 2
Epoxy Coated sample 2
Uncoated sample 3
Epoxy sample 3
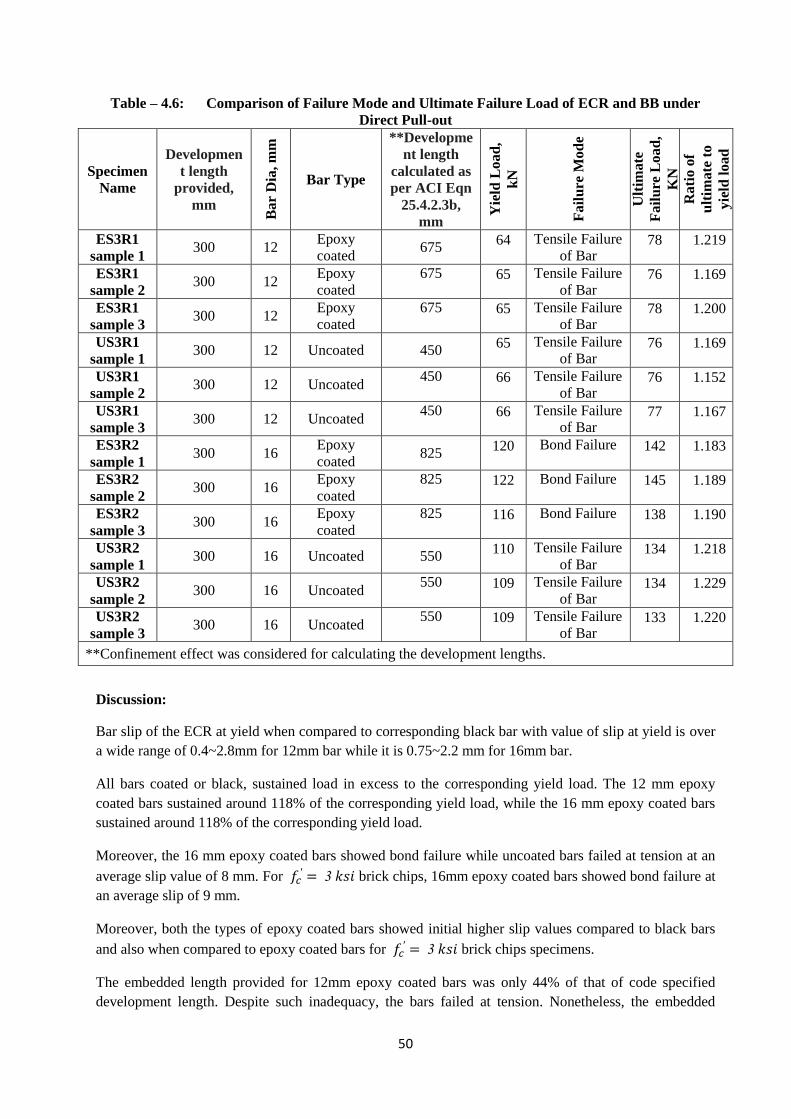
50
Table – 4.6: Comparison of Failure Mode and Ultimate Failure Load of ECR and BB under
Direct Pull-out
Specimen
Name
Developmen
t length
provided,
mm
Ba
r D
ia, m
m
Bar Type
**Developme
nt length
calculated as
per ACI Eqn
25.4.2.3b,
mm
Yie
ld L
oa
d,
kN
Fa
ilu
re M
od
e
Ult
imate
Fa
ilu
re L
oa
d,
KN
Ra
tio
of
ult
imate
to
yie
ld l
oad
ES3R1
sample 1 300 12
Epoxy
coated 675
64 Tensile Failure
of Bar 78 1.219
ES3R1
sample 2 300 12
Epoxy
coated
675 65 Tensile Failure
of Bar 76 1.169
ES3R1
sample 3 300 12
Epoxy
coated
675 65 Tensile Failure
of Bar 78 1.200
US3R1
sample 1 300 12 Uncoated 450
65 Tensile Failure
of Bar 76 1.169
US3R1
sample 2 300 12 Uncoated
450 66 Tensile Failure
of Bar 76 1.152
US3R1
sample 3 300 12 Uncoated
450 66 Tensile Failure
of Bar 77 1.167
ES3R2
sample 1 300 16
Epoxy
coated 825
120 Bond Failure 142 1.183
ES3R2
sample 2 300 16
Epoxy
coated
825 122 Bond Failure 145 1.189
ES3R2
sample 3 300 16
Epoxy
coated
825 116 Bond Failure 138 1.190
US3R2
sample 1 300 16 Uncoated 550
110 Tensile Failure
of Bar 134 1.218
US3R2
sample 2 300 16 Uncoated
550 109 Tensile Failure
of Bar 134 1.229
US3R2
sample 3 300 16 Uncoated
550 109 Tensile Failure
of Bar 133 1.220
**Confinement effect was considered for calculating the development lengths.
Discussion:
Bar slip of the ECR at yield when compared to corresponding black bar with value of slip at yield is over
a wide range of 0.4~2.8mm for 12mm bar while it is 0.75~2.2 mm for 16mm bar.
All bars coated or black, sustained load in excess to the corresponding yield load. The 12 mm epoxy
coated bars sustained around 118% of the corresponding yield load, while the 16 mm epoxy coated bars
sustained around 118% of the corresponding yield load.
Moreover, the 16 mm epoxy coated bars showed bond failure while uncoated bars failed at tension at an
average slip value of 8 mm. For brick chips, 16mm epoxy coated bars showed bond failure at
an average slip of 9 mm.
Moreover, both the types of epoxy coated bars showed initial higher slip values compared to black bars
and also when compared to epoxy coated bars for brick chips specimens.
The embedded length provided for 12mm epoxy coated bars was only 44% of that of code specified
development length. Despite such inadequacy, the bars failed at tension. Nonetheless, the embedded
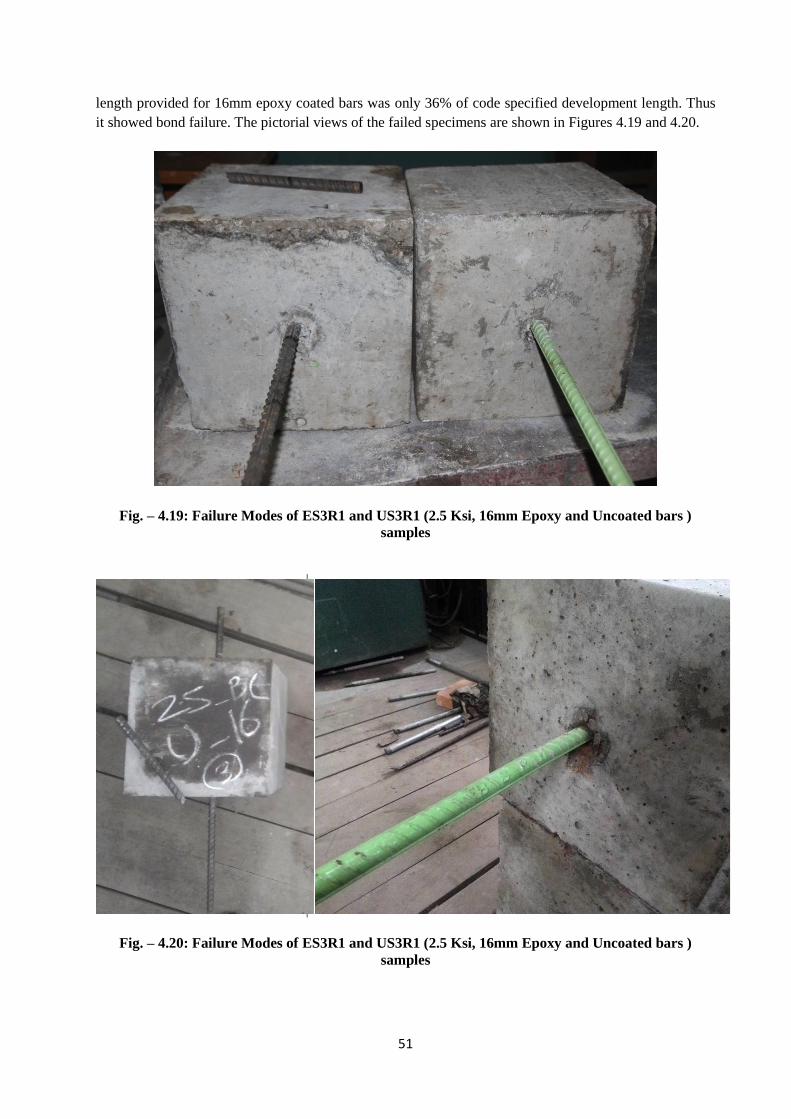
51
length provided for 16mm epoxy coated bars was only 36% of code specified development length. Thus
it showed bond failure. The pictorial views of the failed specimens are shown in Figures 4.19 and 4.20.
Fig. – 4.19: Failure Modes of ES3R1 and US3R1 (2.5 Ksi, 16mm Epoxy and Uncoated bars )
samples
Fig. – 4.20: Failure Modes of ES3R1 and US3R1 (2.5 Ksi, 16mm Epoxy and Uncoated bars )
samples
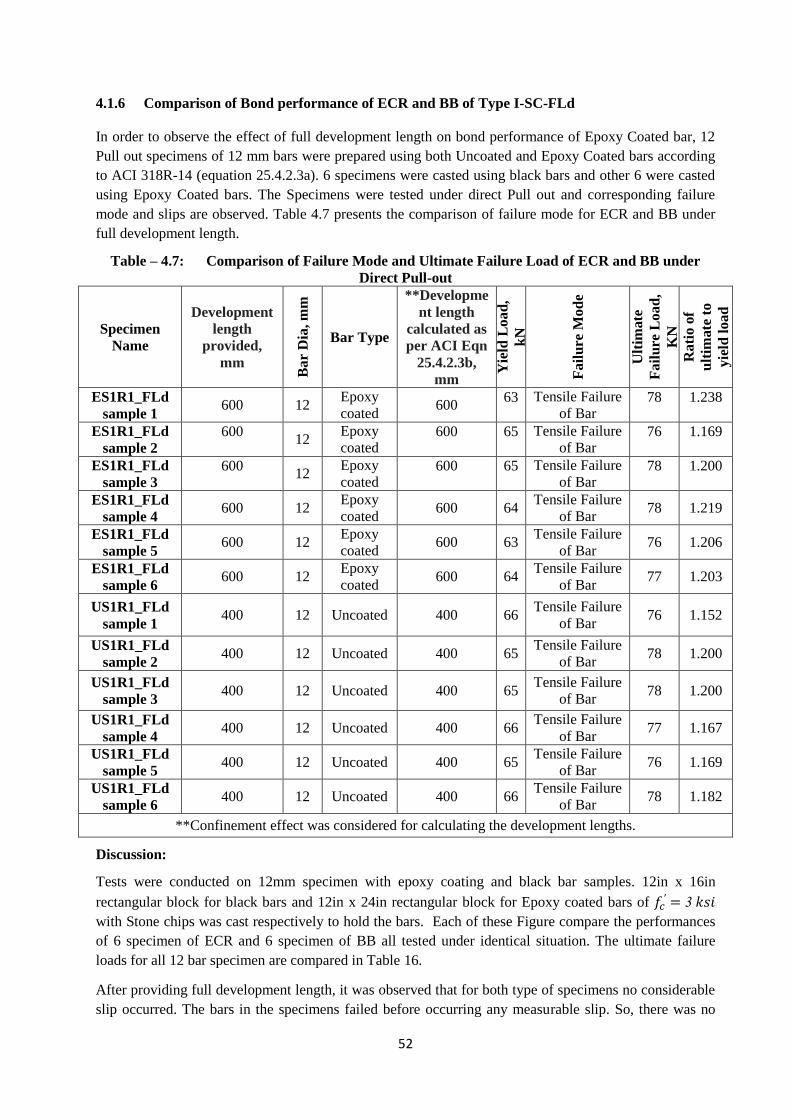
52
4.1.6 Comparison of Bond performance of ECR and BB of Type I-SC-FLd
In order to observe the effect of full development length on bond performance of Epoxy Coated bar, 12
Pull out specimens of 12 mm bars were prepared using both Uncoated and Epoxy Coated bars according
to ACI 318R-14 (equation 25.4.2.3a). 6 specimens were casted using black bars and other 6 were casted
using Epoxy Coated bars. The Specimens were tested under direct Pull out and corresponding failure
mode and slips are observed. Table 4.7 presents the comparison of failure mode for ECR and BB under
full development length.
Table – 4.7: Comparison of Failure Mode and Ultimate Failure Load of ECR and BB under
Direct Pull-out
Specimen
Name
Development
length
provided,
mm
Ba
r D
ia, m
m
Bar Type
**Developme
nt length
calculated as
per ACI Eqn
25.4.2.3b,
mm
Yie
ld L
oa
d,
kN
Fa
ilu
re M
od
e
Ult
imate
Fa
ilu
re L
oa
d,
KN
Ra
tio
of
ult
imate
to
yie
ld l
oad
ES1R1_FLd
sample 1 600 12
Epoxy
coated 600
63 Tensile Failure
of Bar 78 1.238
ES1R1_FLd
sample 2
600 12
Epoxy
coated 600 65 Tensile Failure
of Bar 76 1.169
ES1R1_FLd
sample 3
600 12
Epoxy
coated 600 65 Tensile Failure
of Bar 78 1.200
ES1R1_FLd
sample 4 600 12
Epoxy
coated 600 64
Tensile Failure
of Bar 78 1.219
ES1R1_FLd
sample 5 600 12
Epoxy
coated 600 63
Tensile Failure
of Bar 76 1.206
ES1R1_FLd
sample 6 600 12
Epoxy
coated 600 64
Tensile Failure
of Bar 77 1.203
US1R1_FLd
sample 1 400 12 Uncoated 400 66
Tensile Failure
of Bar 76 1.152
US1R1_FLd
sample 2 400 12 Uncoated 400 65
Tensile Failure
of Bar 78 1.200
US1R1_FLd
sample 3 400 12 Uncoated 400 65
Tensile Failure
of Bar 78 1.200
US1R1_FLd
sample 4 400 12 Uncoated 400 66
Tensile Failure
of Bar 77 1.167
US1R1_FLd
sample 5 400 12 Uncoated 400 65
Tensile Failure
of Bar 76 1.169
US1R1_FLd
sample 6 400 12 Uncoated 400 66
Tensile Failure
of Bar 78 1.182
**Confinement effect was considered for calculating the development lengths.
Discussion:
Tests were conducted on 12mm specimen with epoxy coating and black bar samples. 12in x 16in
rectangular block for black bars and 12in x 24in rectangular block for Epoxy coated bars of
with Stone chips was cast respectively to hold the bars. Each of these Figure compare the performances
of 6 specimen of ECR and 6 specimen of BB all tested under identical situation. The ultimate failure
loads for all 12 bar specimen are compared in Table 16.
After providing full development length, it was observed that for both type of specimens no considerable
slip occurred. The bars in the specimens failed before occurring any measurable slip. So, there was no
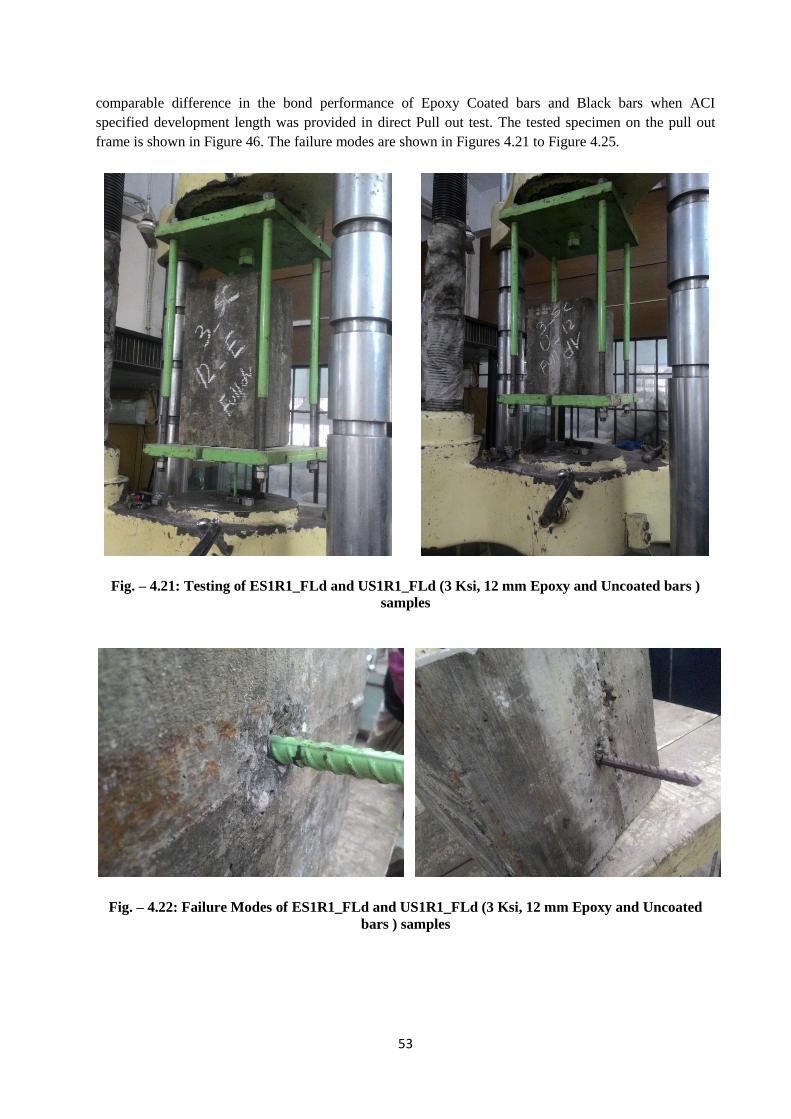
53
comparable difference in the bond performance of Epoxy Coated bars and Black bars when ACI
specified development length was provided in direct Pull out test. The tested specimen on the pull out
frame is shown in Figure 46. The failure modes are shown in Figures 4.21 to Figure 4.25.
Fig. – 4.21: Testing of ES1R1_FLd and US1R1_FLd (3 Ksi, 12 mm Epoxy and Uncoated bars )
samples
Fig. – 4.22: Failure Modes of ES1R1_FLd and US1R1_FLd (3 Ksi, 12 mm Epoxy and Uncoated
bars ) samples
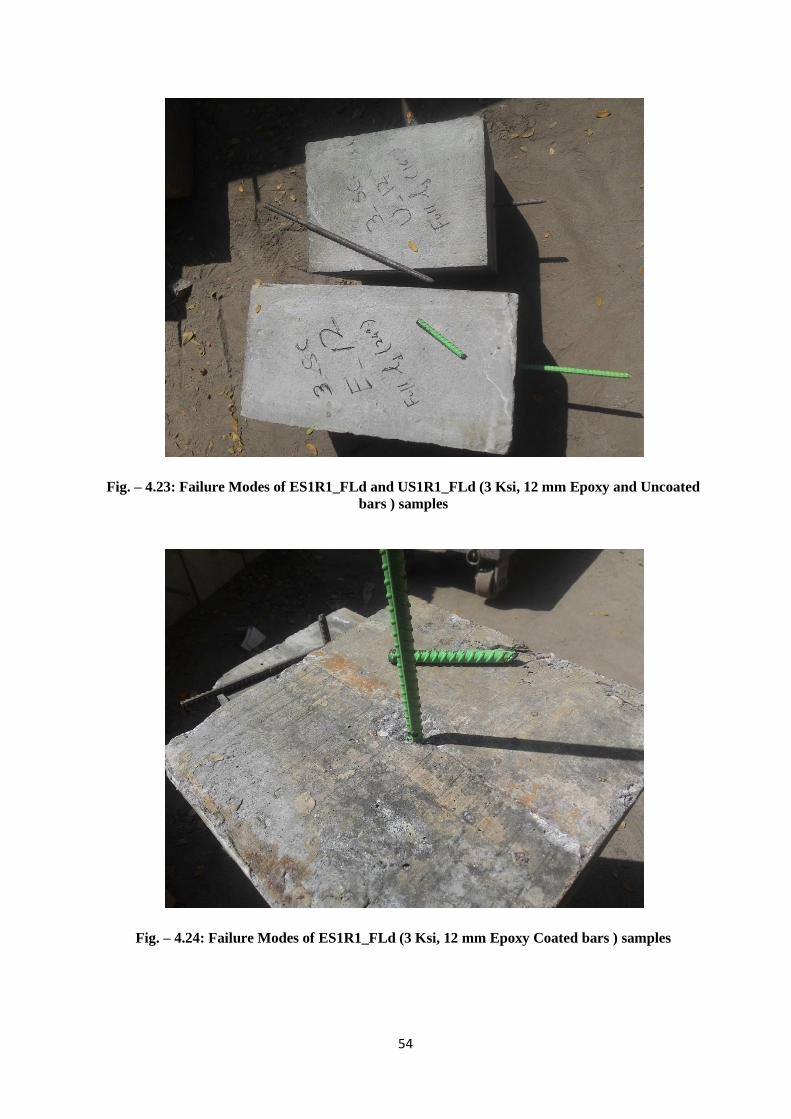
54
Fig. – 4.23: Failure Modes of ES1R1_FLd and US1R1_FLd (3 Ksi, 12 mm Epoxy and Uncoated
bars ) samples
Fig. – 4.24: Failure Modes of ES1R1_FLd (3 Ksi, 12 mm Epoxy Coated bars ) samples
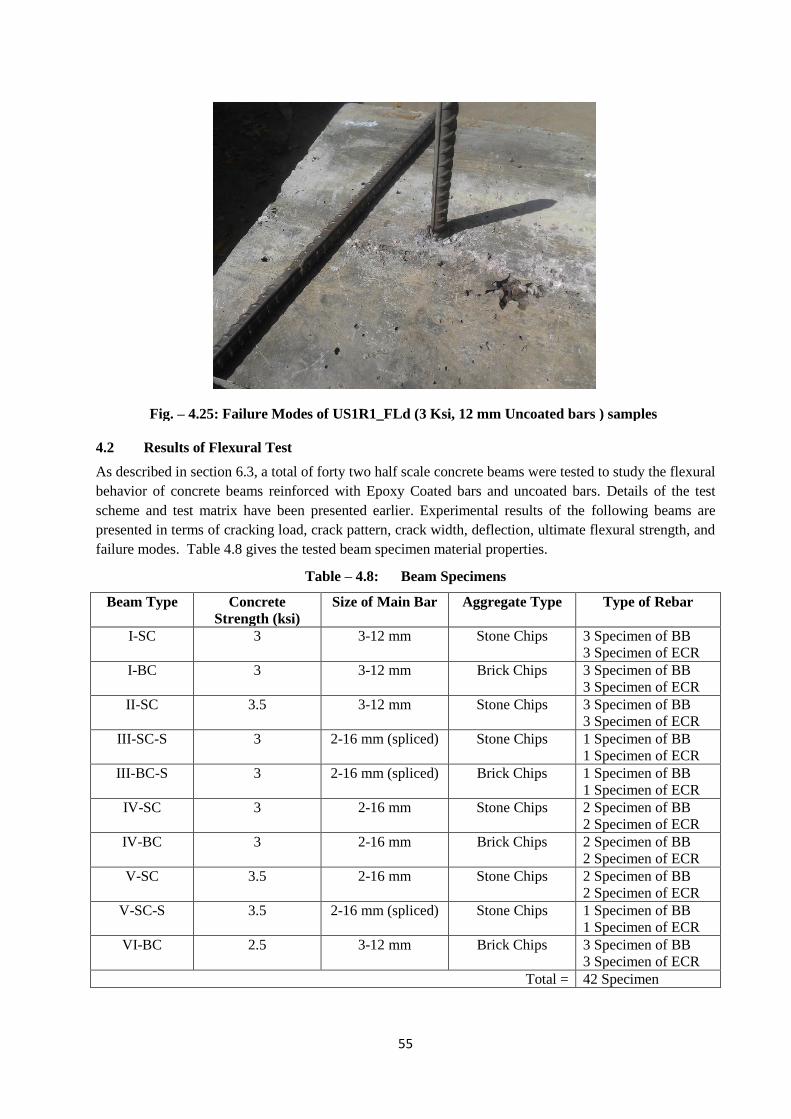
55
Fig. – 4.25: Failure Modes of US1R1_FLd (3 Ksi, 12 mm Uncoated bars ) samples
4.2 Results of Flexural Test
As described in section 6.3, a total of forty two half scale concrete beams were tested to study the flexural
behavior of concrete beams reinforced with Epoxy Coated bars and uncoated bars. Details of the test
scheme and test matrix have been presented earlier. Experimental results of the following beams are
presented in terms of cracking load, crack pattern, crack width, deflection, ultimate flexural strength, and
failure modes. Table 4.8 gives the tested beam specimen material properties.
Table – 4.8: Beam Specimens
Beam Type Concrete
Strength (ksi)
Size of Main Bar Aggregate Type Type of Rebar
I-SC 3 3-12 mm Stone Chips 3 Specimen of BB
3 Specimen of ECR
I-BC 3 3-12 mm Brick Chips 3 Specimen of BB
3 Specimen of ECR
II-SC 3.5 3-12 mm Stone Chips 3 Specimen of BB
3 Specimen of ECR
III-SC-S 3 2-16 mm (spliced) Stone Chips 1 Specimen of BB
1 Specimen of ECR
III-BC-S 3 2-16 mm (spliced) Brick Chips 1 Specimen of BB
1 Specimen of ECR
IV-SC 3 2-16 mm Stone Chips 2 Specimen of BB
2 Specimen of ECR
IV-BC 3 2-16 mm Brick Chips 2 Specimen of BB
2 Specimen of ECR
V-SC 3.5 2-16 mm Stone Chips 2 Specimen of BB
2 Specimen of ECR
V-SC-S 3.5 2-16 mm (spliced) Stone Chips 1 Specimen of BB
1 Specimen of ECR
VI-BC 2.5 3-12 mm Brick Chips 3 Specimen of BB
3 Specimen of ECR
Total = 42 Specimen
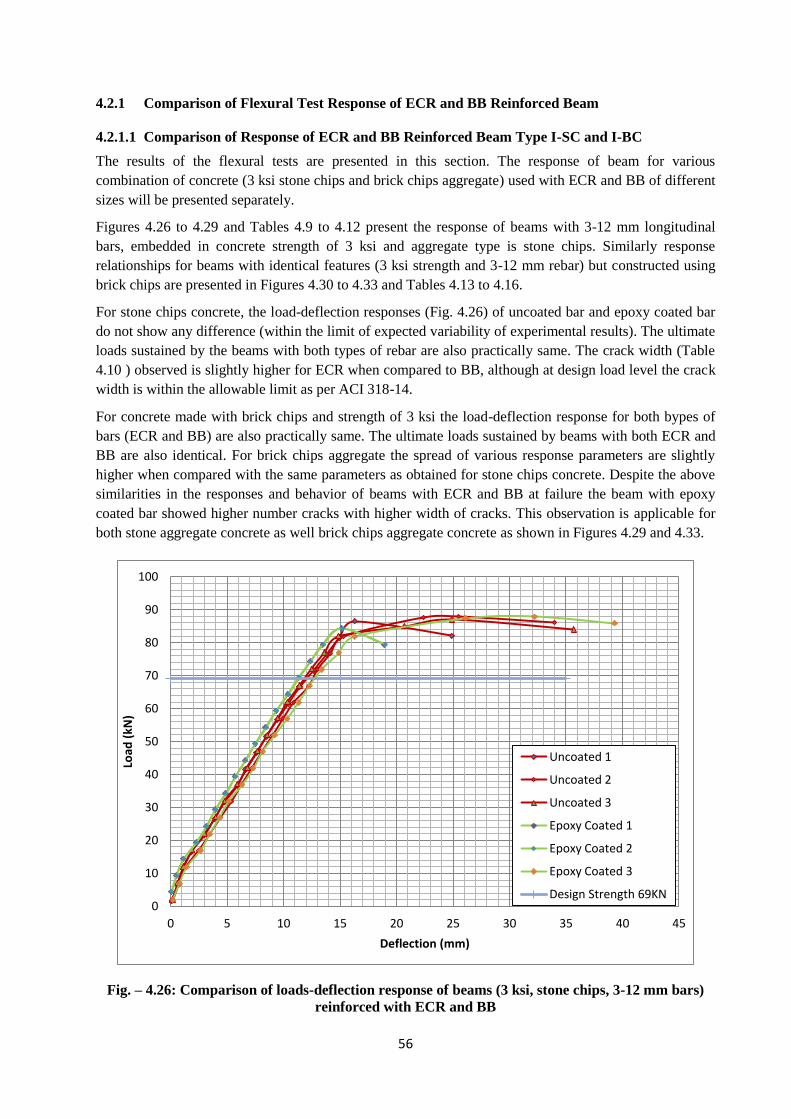
56
4.2.1 Comparison of Flexural Test Response of ECR and BB Reinforced Beam
4.2.1.1 Comparison of Response of ECR and BB Reinforced Beam Type I-SC and I-BC
The results of the flexural tests are presented in this section. The response of beam for various
combination of concrete (3 ksi stone chips and brick chips aggregate) used with ECR and BB of different
sizes will be presented separately.
Figures 4.26 to 4.29 and Tables 4.9 to 4.12 present the response of beams with 3-12 mm longitudinal
bars, embedded in concrete strength of 3 ksi and aggregate type is stone chips. Similarly response
relationships for beams with identical features (3 ksi strength and 3-12 mm rebar) but constructed using
brick chips are presented in Figures 4.30 to 4.33 and Tables 4.13 to 4.16.
For stone chips concrete, the load-deflection responses (Fig. 4.26) of uncoated bar and epoxy coated bar
do not show any difference (within the limit of expected variability of experimental results). The ultimate
loads sustained by the beams with both types of rebar are also practically same. The crack width (Table
4.10 ) observed is slightly higher for ECR when compared to BB, although at design load level the crack
width is within the allowable limit as per ACI 318-14.
For concrete made with brick chips and strength of 3 ksi the load-deflection response for both bypes of
bars (ECR and BB) are also practically same. The ultimate loads sustained by beams with both ECR and
BB are also identical. For brick chips aggregate the spread of various response parameters are slightly
higher when compared with the same parameters as obtained for stone chips concrete. Despite the above
similarities in the responses and behavior of beams with ECR and BB at failure the beam with epoxy
coated bar showed higher number cracks with higher width of cracks. This observation is applicable for
both stone aggregate concrete as well brick chips aggregate concrete as shown in Figures 4.29 and 4.33.
Fig. – 4.26: Comparison of loads-deflection response of beams (3 ksi, stone chips, 3-12 mm bars)
reinforced with ECR and BB
0
10
20
30
40
50
60
70
80
90
100
0 5 10 15 20 25 30 35 40 45
Load
(kN
)
Deflection (mm)
Uncoated 1
Uncoated 2
Uncoated 3
Epoxy Coated 1
Epoxy Coated 2
Epoxy Coated 3
Design Strength 69KN
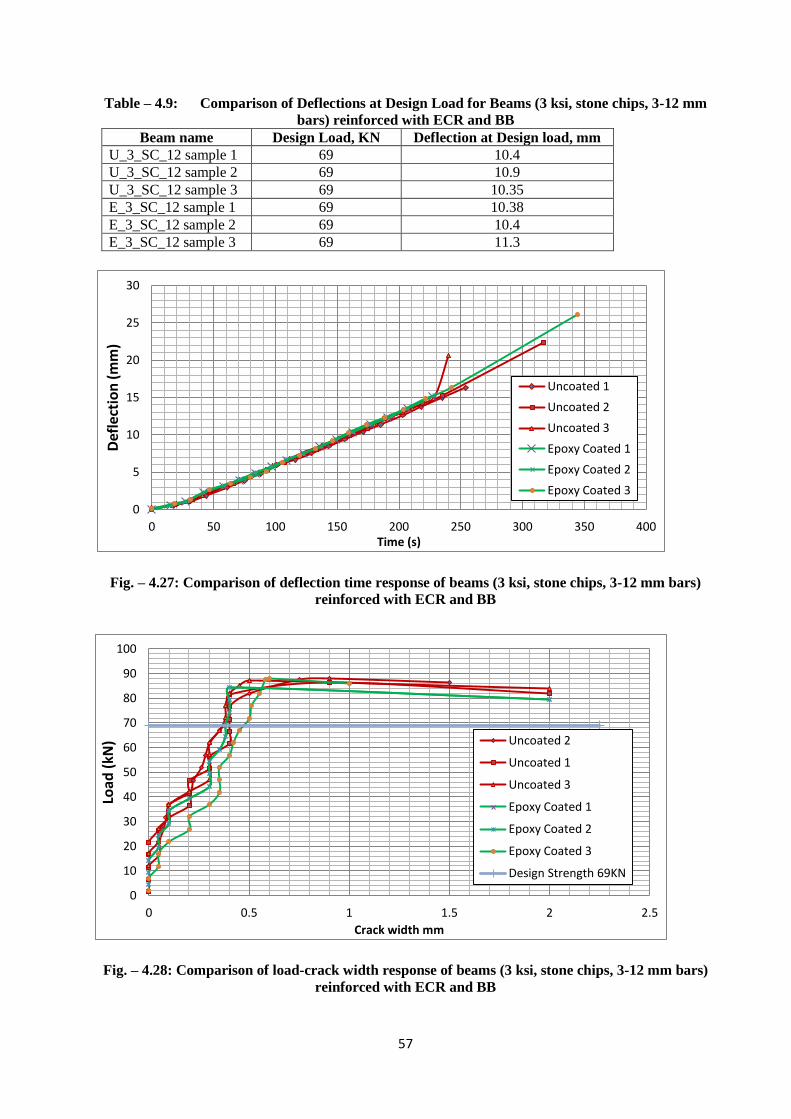
57
Table – 4.9: Comparison of Deflections at Design Load for Beams (3 ksi, stone chips, 3-12 mm
bars) reinforced with ECR and BB
Beam name Design Load, KN Deflection at Design load, mm
U_3_SC_12 sample 1 69 10.4
U_3_SC_12 sample 2 69 10.9
U_3_SC_12 sample 3 69 10.35
E_3_SC_12 sample 1 69 10.38
E_3_SC_12 sample 2 69 10.4
E_3_SC_12 sample 3 69 11.3
Fig. – 4.27: Comparison of deflection time response of beams (3 ksi, stone chips, 3-12 mm bars)
reinforced with ECR and BB
Fig. – 4.28: Comparison of load-crack width response of beams (3 ksi, stone chips, 3-12 mm bars)
reinforced with ECR and BB
0
5
10
15
20
25
30
0 50 100 150 200 250 300 350 400
Def
lect
ion
(m
m)
Time (s)
Uncoated 1
Uncoated 2
Uncoated 3
Epoxy Coated 1
Epoxy Coated 2
Epoxy Coated 3
0
10
20
30
40
50
60
70
80
90
100
0 0.5 1 1.5 2 2.5
Load
(kN
)
Crack width mm
Uncoated 2
Uncoated 1
Uncoated 3
Epoxy Coated 1
Epoxy Coated 2
Epoxy Coated 3
Design Strength 69KN
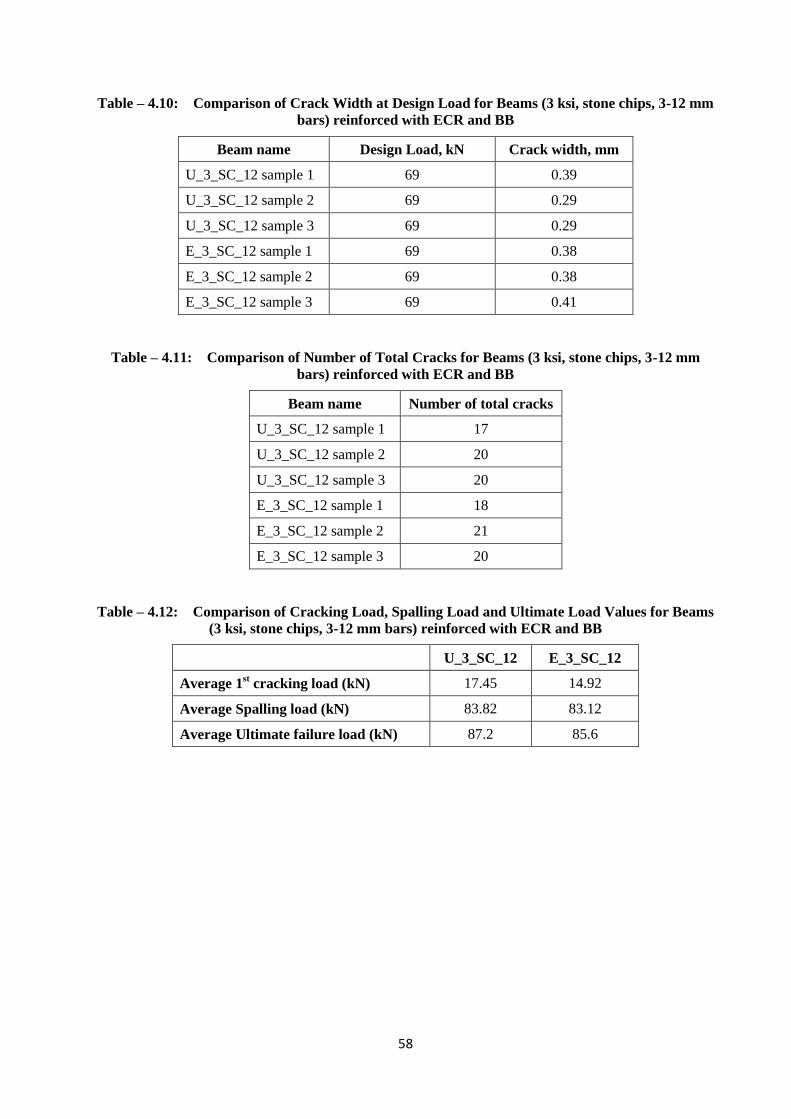
58
Table – 4.10: Comparison of Crack Width at Design Load for Beams (3 ksi, stone chips, 3-12 mm
bars) reinforced with ECR and BB
Beam name Design Load, kN Crack width, mm
U_3_SC_12 sample 1 69 0.39
U_3_SC_12 sample 2 69 0.29
U_3_SC_12 sample 3 69 0.29
E_3_SC_12 sample 1 69 0.38
E_3_SC_12 sample 2 69 0.38
E_3_SC_12 sample 3 69 0.41
Table – 4.11: Comparison of Number of Total Cracks for Beams (3 ksi, stone chips, 3-12 mm
bars) reinforced with ECR and BB
Beam name Number of total cracks
U_3_SC_12 sample 1 17
U_3_SC_12 sample 2 20
U_3_SC_12 sample 3 20
E_3_SC_12 sample 1 18
E_3_SC_12 sample 2 21
E_3_SC_12 sample 3 20
Table – 4.12: Comparison of Cracking Load, Spalling Load and Ultimate Load Values for Beams
(3 ksi, stone chips, 3-12 mm bars) reinforced with ECR and BB
U_3_SC_12 E_3_SC_12
Average 1st cracking load (kN) 17.45 14.92
Average Spalling load (kN) 83.82 83.12
Average Ultimate failure load (kN) 87.2 85.6
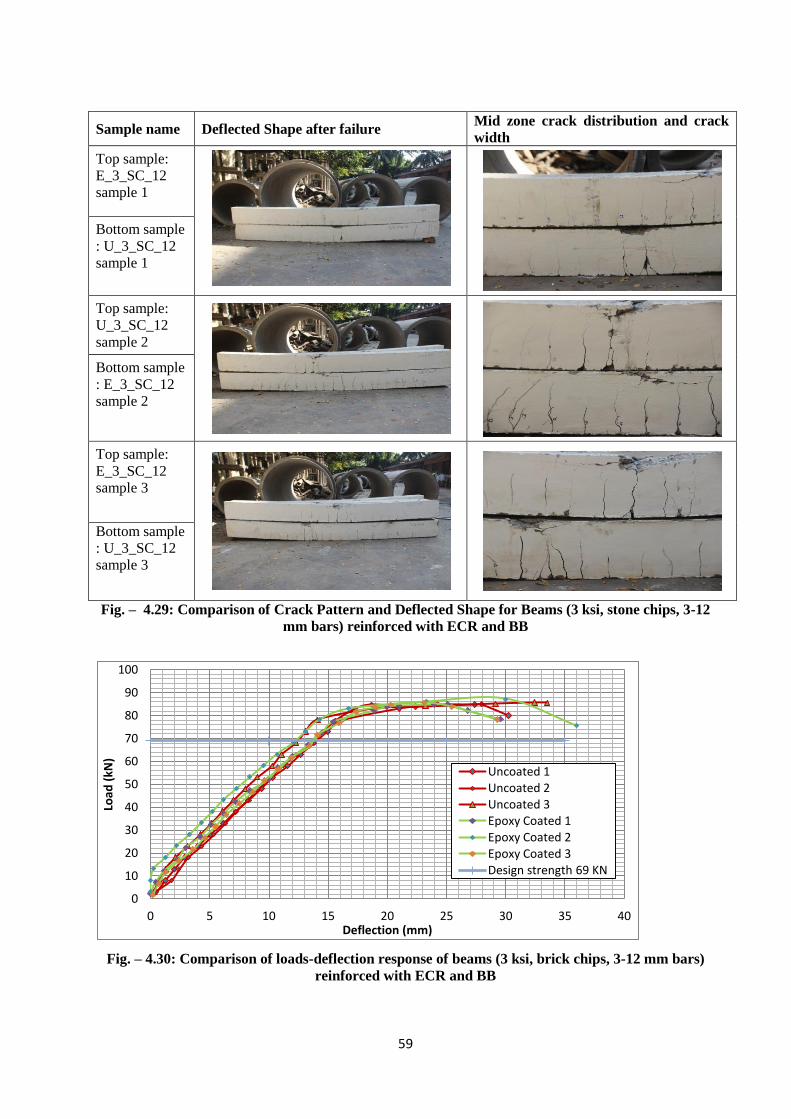
59
Sample name Deflected Shape after failure Mid zone crack distribution and crack
width
Top sample:
E_3_SC_12
sample 1
Bottom sample
: U_3_SC_12
sample 1
Top sample:
U_3_SC_12
sample 2
Bottom sample
: E_3_SC_12
sample 2
Top sample:
E_3_SC_12
sample 3
Bottom sample
: U_3_SC_12
sample 3
Fig. – 4.29: Comparison of Crack Pattern and Deflected Shape for Beams (3 ksi, stone chips, 3-12
mm bars) reinforced with ECR and BB
Fig. – 4.30: Comparison of loads-deflection response of beams (3 ksi, brick chips, 3-12 mm bars)
reinforced with ECR and BB
0
10
20
30
40
50
60
70
80
90
100
0 5 10 15 20 25 30 35 40
Load
(kN
)
Deflection (mm)
Uncoated 1 Uncoated 2 Uncoated 3 Epoxy Coated 1 Epoxy Coated 2 Epoxy Coated 3 Design strength 69 KN
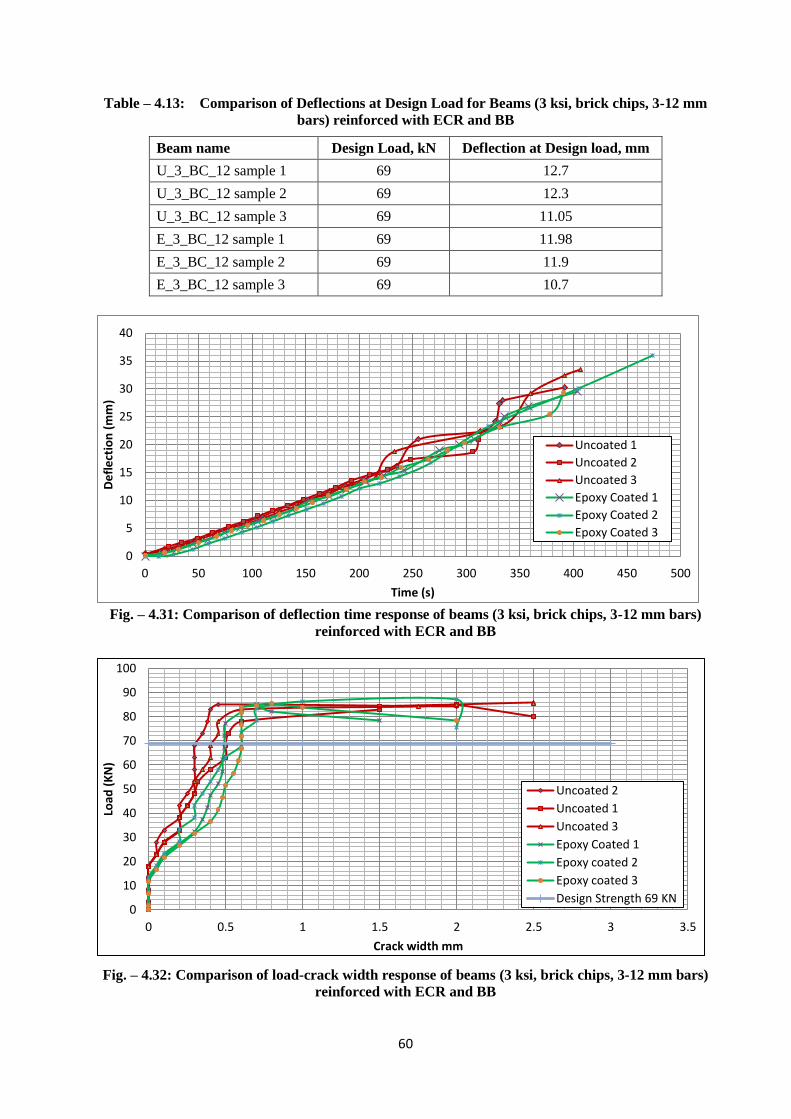
60
Table – 4.13: Comparison of Deflections at Design Load for Beams (3 ksi, brick chips, 3-12 mm
bars) reinforced with ECR and BB
Beam name Design Load, kN Deflection at Design load, mm
U_3_BC_12 sample 1 69 12.7
U_3_BC_12 sample 2 69 12.3
U_3_BC_12 sample 3 69 11.05
E_3_BC_12 sample 1 69 11.98
E_3_BC_12 sample 2 69 11.9
E_3_BC_12 sample 3 69 10.7
Fig. – 4.31: Comparison of deflection time response of beams (3 ksi, brick chips, 3-12 mm bars)
reinforced with ECR and BB
Fig. – 4.32: Comparison of load-crack width response of beams (3 ksi, brick chips, 3-12 mm bars)
reinforced with ECR and BB
0
5
10
15
20
25
30
35
40
0 50 100 150 200 250 300 350 400 450 500
De
fle
ctio
n (
mm
)
Time (s)
Uncoated 1
Uncoated 2
Uncoated 3
Epoxy Coated 1
Epoxy Coated 2
Epoxy Coated 3
0
10
20
30
40
50
60
70
80
90
100
0 0.5 1 1.5 2 2.5 3 3.5
Load
(K
N)
Crack width mm
Uncoated 2
Uncoated 1
Uncoated 3
Epoxy Coated 1
Epoxy coated 2
Epoxy coated 3
Design Strength 69 KN
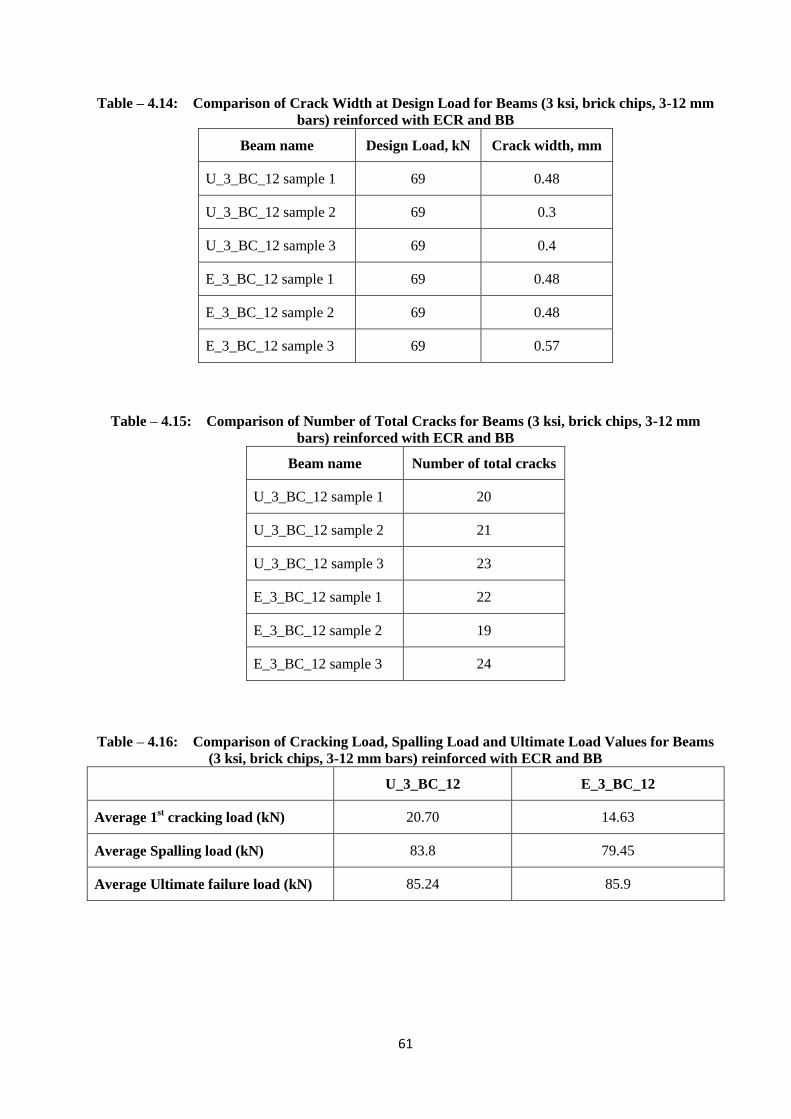
61
Table – 4.14: Comparison of Crack Width at Design Load for Beams (3 ksi, brick chips, 3-12 mm
bars) reinforced with ECR and BB
Beam name Design Load, kN Crack width, mm
U_3_BC_12 sample 1 69 0.48
U_3_BC_12 sample 2 69 0.3
U_3_BC_12 sample 3 69 0.4
E_3_BC_12 sample 1 69 0.48
E_3_BC_12 sample 2 69 0.48
E_3_BC_12 sample 3 69 0.57
Table – 4.15: Comparison of Number of Total Cracks for Beams (3 ksi, brick chips, 3-12 mm
bars) reinforced with ECR and BB
Beam name Number of total cracks
U_3_BC_12 sample 1 20
U_3_BC_12 sample 2 21
U_3_BC_12 sample 3 23
E_3_BC_12 sample 1 22
E_3_BC_12 sample 2 19
E_3_BC_12 sample 3 24
Table – 4.16: Comparison of Cracking Load, Spalling Load and Ultimate Load Values for Beams
(3 ksi, brick chips, 3-12 mm bars) reinforced with ECR and BB
U_3_BC_12 E_3_BC_12
Average 1st cracking load (kN) 20.70 14.63
Average Spalling load (kN) 83.8 79.45
Average Ultimate failure load (kN) 85.24 85.9
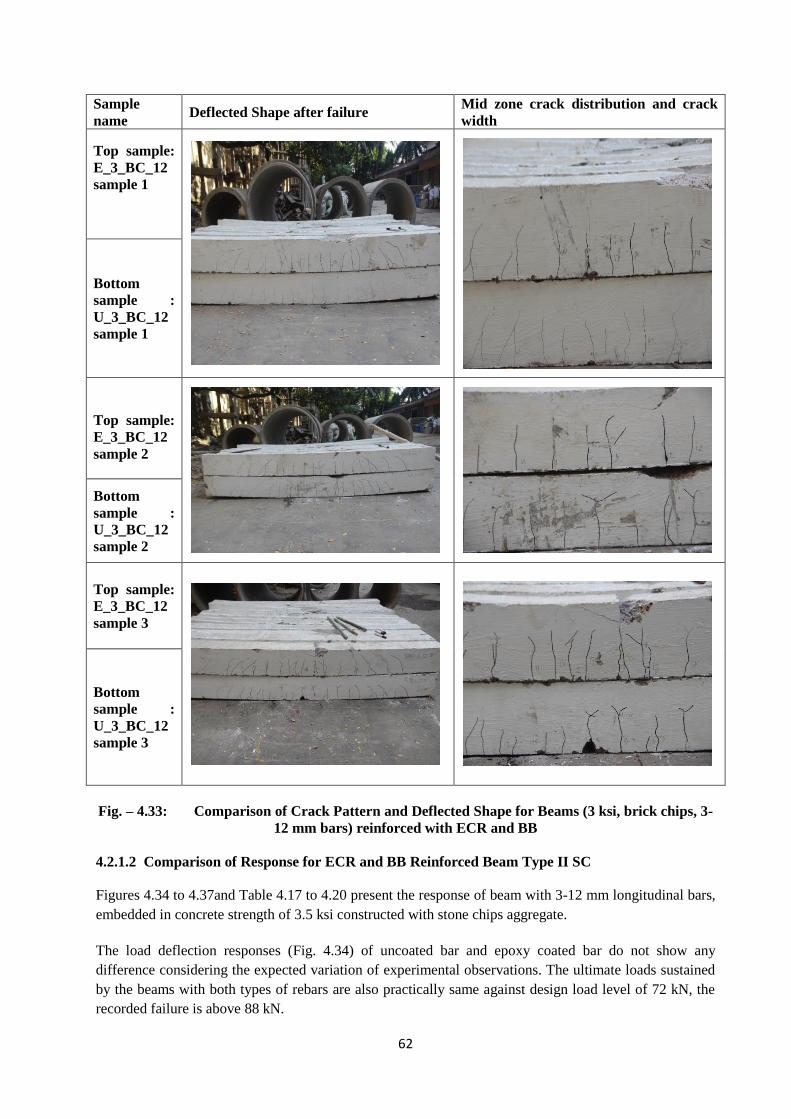
62
Sample
name Deflected Shape after failure
Mid zone crack distribution and crack
width
Top sample:
E_3_BC_12
sample 1
Bottom
sample :
U_3_BC_12
sample 1
Top sample:
E_3_BC_12
sample 2
Bottom
sample :
U_3_BC_12
sample 2
Top sample:
E_3_BC_12
sample 3
Bottom
sample :
U_3_BC_12
sample 3
Fig. – 4.33: Comparison of Crack Pattern and Deflected Shape for Beams (3 ksi, brick chips, 3-
12 mm bars) reinforced with ECR and BB
4.2.1.2 Comparison of Response for ECR and BB Reinforced Beam Type II SC
Figures 4.34 to 4.37and Table 4.17 to 4.20 present the response of beam with 3-12 mm longitudinal bars,
embedded in concrete strength of 3.5 ksi constructed with stone chips aggregate.
The load deflection responses (Fig. 4.34) of uncoated bar and epoxy coated bar do not show any
difference considering the expected variation of experimental observations. The ultimate loads sustained
by the beams with both types of rebars are also practically same against design load level of 72 kN, the
recorded failure is above 88 kN.
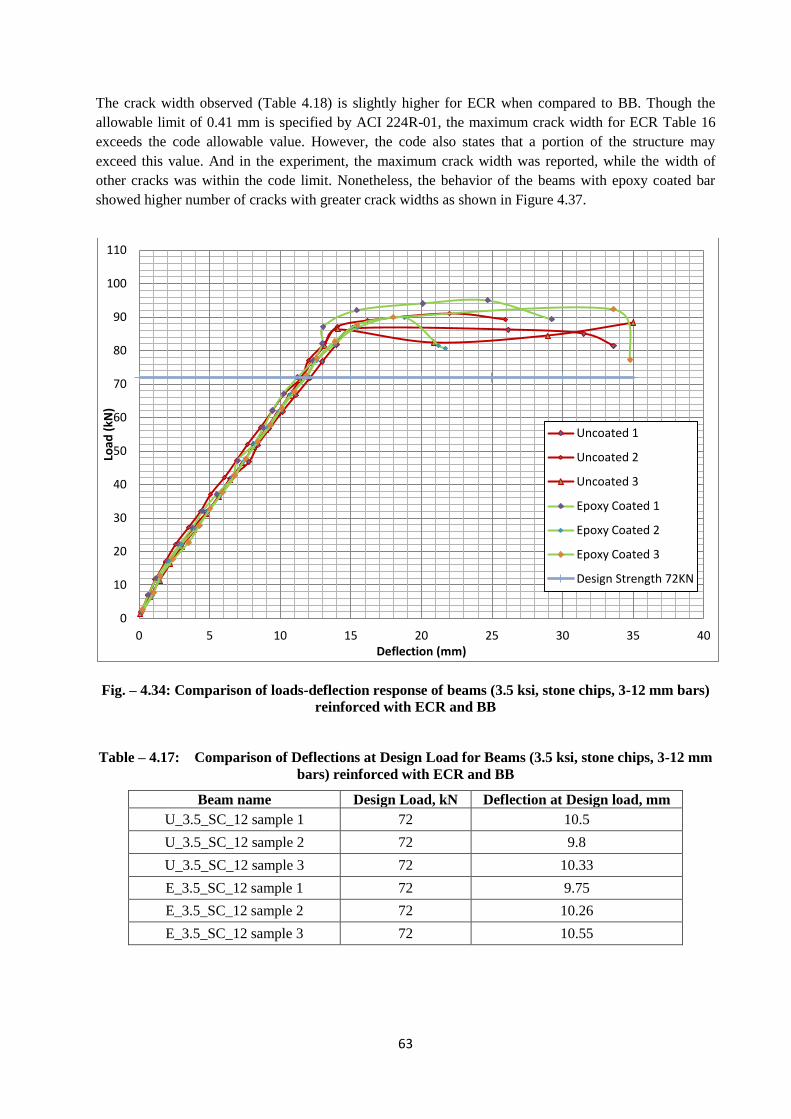
63
The crack width observed (Table 4.18) is slightly higher for ECR when compared to BB. Though the
allowable limit of 0.41 mm is specified by ACI 224R-01, the maximum crack width for ECR Table 16
exceeds the code allowable value. However, the code also states that a portion of the structure may
exceed this value. And in the experiment, the maximum crack width was reported, while the width of
other cracks was within the code limit. Nonetheless, the behavior of the beams with epoxy coated bar
showed higher number of cracks with greater crack widths as shown in Figure 4.37.
Fig. – 4.34: Comparison of loads-deflection response of beams (3.5 ksi, stone chips, 3-12 mm bars)
reinforced with ECR and BB
Table – 4.17: Comparison of Deflections at Design Load for Beams (3.5 ksi, stone chips, 3-12 mm
bars) reinforced with ECR and BB
Beam name Design Load, kN Deflection at Design load, mm
U_3.5_SC_12 sample 1 72 10.5
U_3.5_SC_12 sample 2 72 9.8
U_3.5_SC_12 sample 3 72 10.33
E_3.5_SC_12 sample 1 72 9.75
E_3.5_SC_12 sample 2 72 10.26
E_3.5_SC_12 sample 3 72 10.55
0
10
20
30
40
50
60
70
80
90
100
110
0 5 10 15 20 25 30 35 40
Load
(kN
)
Deflection (mm)
Uncoated 1
Uncoated 2
Uncoated 3
Epoxy Coated 1
Epoxy Coated 2
Epoxy Coated 3
Design Strength 72KN
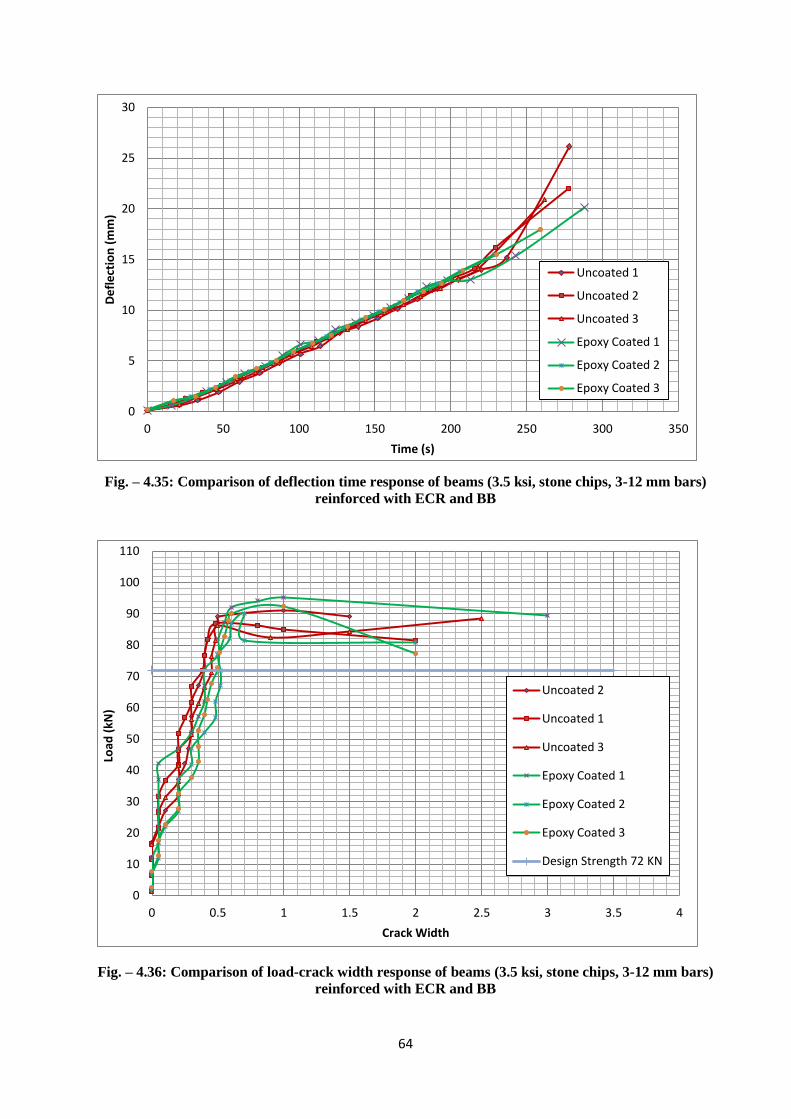
64
Fig. – 4.35: Comparison of deflection time response of beams (3.5 ksi, stone chips, 3-12 mm bars)
reinforced with ECR and BB
Fig. – 4.36: Comparison of load-crack width response of beams (3.5 ksi, stone chips, 3-12 mm bars)
reinforced with ECR and BB
0
5
10
15
20
25
30
0 50 100 150 200 250 300 350
De
fle
ctio
n (
mm
)
Time (s)
Uncoated 1
Uncoated 2
Uncoated 3
Epoxy Coated 1
Epoxy Coated 2
Epoxy Coated 3
0
10
20
30
40
50
60
70
80
90
100
110
0 0.5 1 1.5 2 2.5 3 3.5 4
Load
(kN
)
Crack Width
Uncoated 2
Uncoated 1
Uncoated 3
Epoxy Coated 1
Epoxy Coated 2
Epoxy Coated 3
Design Strength 72 KN
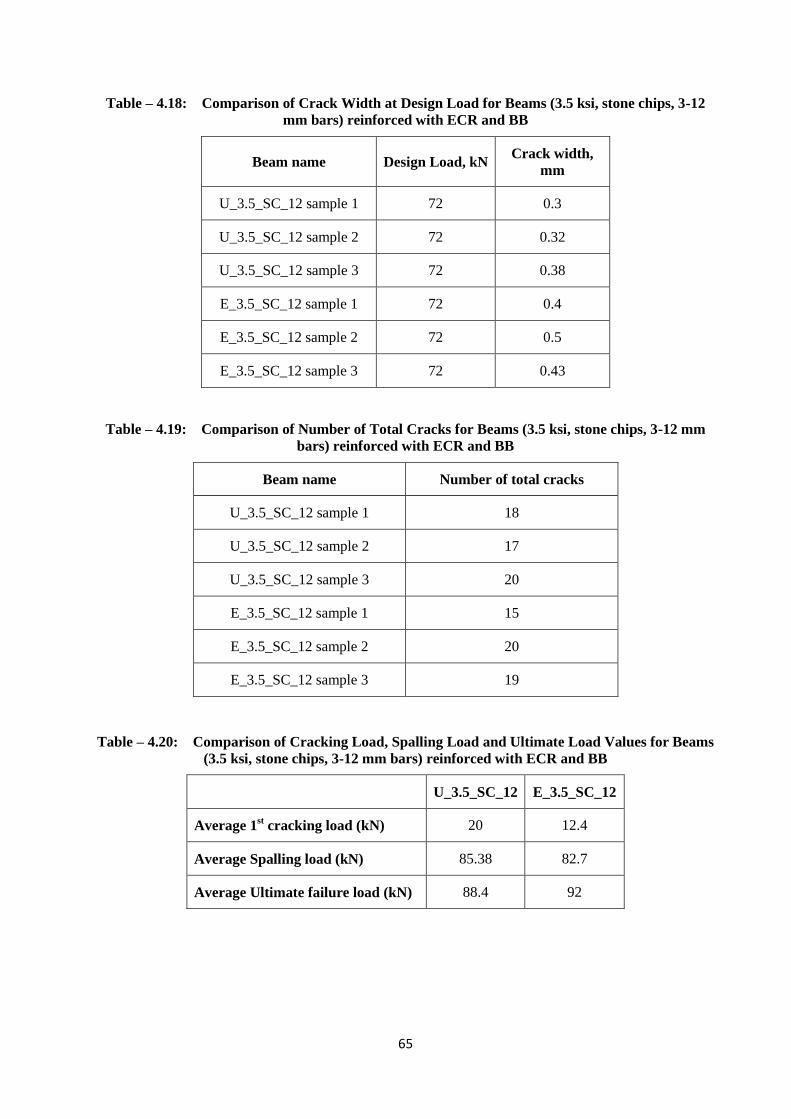
65
Table – 4.18: Comparison of Crack Width at Design Load for Beams (3.5 ksi, stone chips, 3-12
mm bars) reinforced with ECR and BB
Beam name Design Load, kN Crack width,
mm
U_3.5_SC_12 sample 1 72 0.3
U_3.5_SC_12 sample 2 72 0.32
U_3.5_SC_12 sample 3 72 0.38
E_3.5_SC_12 sample 1 72 0.4
E_3.5_SC_12 sample 2 72 0.5
E_3.5_SC_12 sample 3 72 0.43
Table – 4.19: Comparison of Number of Total Cracks for Beams (3.5 ksi, stone chips, 3-12 mm
bars) reinforced with ECR and BB
Beam name Number of total cracks
U_3.5_SC_12 sample 1 18
U_3.5_SC_12 sample 2 17
U_3.5_SC_12 sample 3 20
E_3.5_SC_12 sample 1 15
E_3.5_SC_12 sample 2 20
E_3.5_SC_12 sample 3 19
Table – 4.20: Comparison of Cracking Load, Spalling Load and Ultimate Load Values for Beams
(3.5 ksi, stone chips, 3-12 mm bars) reinforced with ECR and BB
U_3.5_SC_12 E_3.5_SC_12
Average 1st cracking load (kN) 20 12.4
Average Spalling load (kN) 85.38 82.7
Average Ultimate failure load (kN) 88.4 92
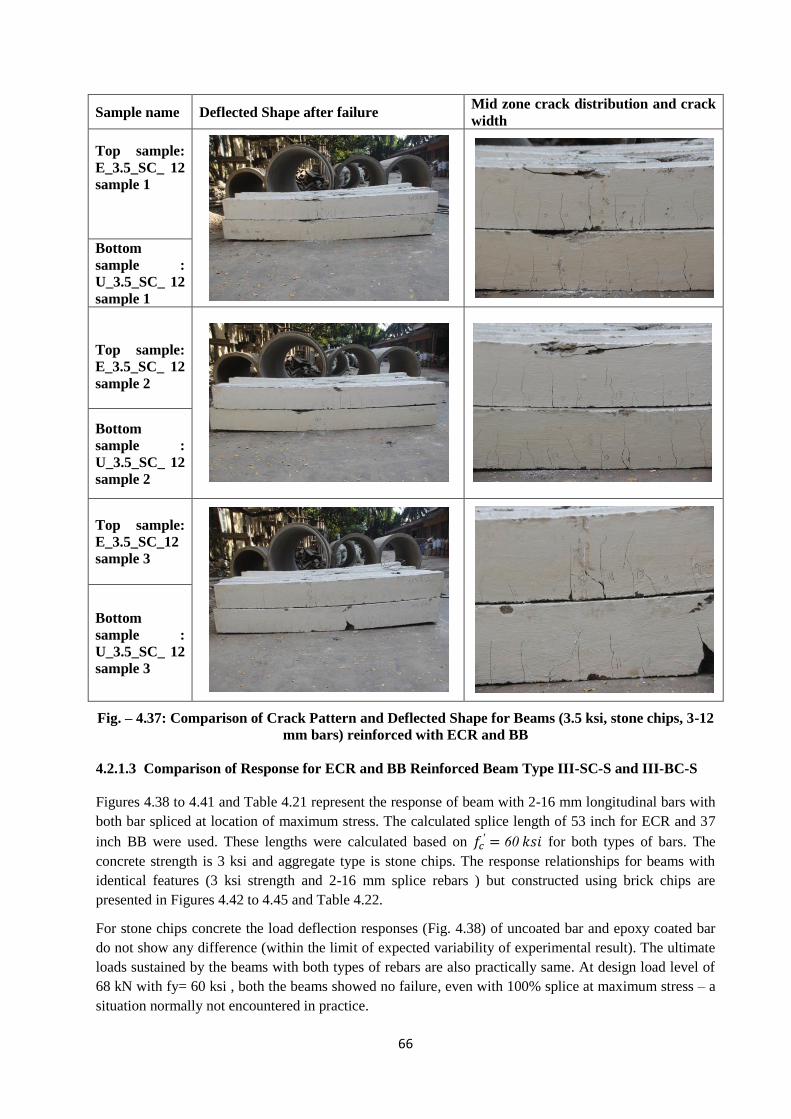
66
Sample name Deflected Shape after failure Mid zone crack distribution and crack
width
Top sample:
E_3.5_SC_ 12
sample 1
Bottom
sample :
U_3.5_SC_ 12
sample 1
Top sample:
E_3.5_SC_ 12
sample 2
Bottom
sample :
U_3.5_SC_ 12
sample 2
Top sample:
E_3.5_SC_12
sample 3
Bottom
sample :
U_3.5_SC_ 12
sample 3
Fig. – 4.37: Comparison of Crack Pattern and Deflected Shape for Beams (3.5 ksi, stone chips, 3-12
mm bars) reinforced with ECR and BB
4.2.1.3 Comparison of Response for ECR and BB Reinforced Beam Type III-SC-S and III-BC-S
Figures 4.38 to 4.41 and Table 4.21 represent the response of beam with 2-16 mm longitudinal bars with
both bar spliced at location of maximum stress. The calculated splice length of 53 inch for ECR and 37
inch BB were used. These lengths were calculated based on for both types of bars. The
concrete strength is 3 ksi and aggregate type is stone chips. The response relationships for beams with
identical features (3 ksi strength and 2-16 mm splice rebars ) but constructed using brick chips are
presented in Figures 4.42 to 4.45 and Table 4.22.
For stone chips concrete the load deflection responses (Fig. 4.38) of uncoated bar and epoxy coated bar
do not show any difference (within the limit of expected variability of experimental result). The ultimate
loads sustained by the beams with both types of rebars are also practically same. At design load level of
68 kN with fy= 60 ksi , both the beams showed no failure, even with 100% splice at maximum stress – a
situation normally not encountered in practice.
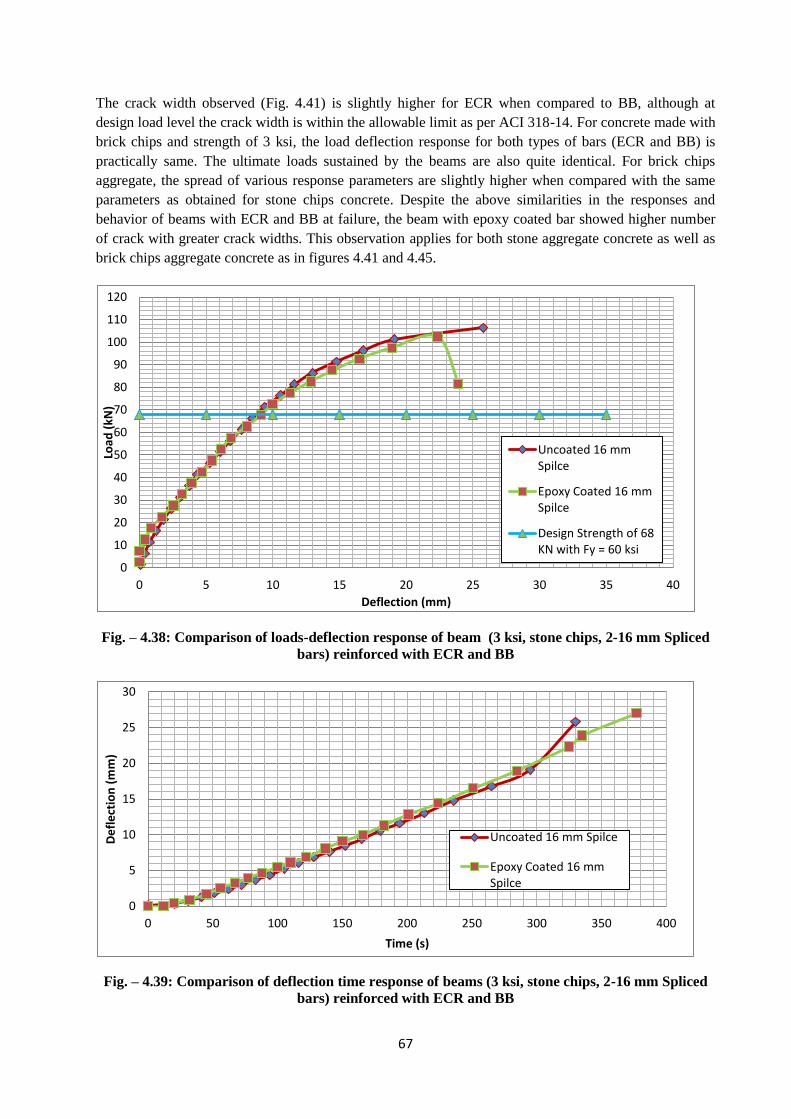
67
The crack width observed (Fig. 4.41) is slightly higher for ECR when compared to BB, although at
design load level the crack width is within the allowable limit as per ACI 318-14. For concrete made with
brick chips and strength of 3 ksi, the load deflection response for both types of bars (ECR and BB) is
practically same. The ultimate loads sustained by the beams are also quite identical. For brick chips
aggregate, the spread of various response parameters are slightly higher when compared with the same
parameters as obtained for stone chips concrete. Despite the above similarities in the responses and
behavior of beams with ECR and BB at failure, the beam with epoxy coated bar showed higher number
of crack with greater crack widths. This observation applies for both stone aggregate concrete as well as
brick chips aggregate concrete as in figures 4.41 and 4.45.
Fig. – 4.38: Comparison of loads-deflection response of beam (3 ksi, stone chips, 2-16 mm Spliced
bars) reinforced with ECR and BB
Fig. – 4.39: Comparison of deflection time response of beams (3 ksi, stone chips, 2-16 mm Spliced
bars) reinforced with ECR and BB
0
10
20
30
40
50
60
70
80
90
100
110
120
0 5 10 15 20 25 30 35 40
Load
(kN
)
Deflection (mm)
Uncoated 16 mm Spilce
Epoxy Coated 16 mm Spilce
Design Strength of 68 KN with Fy = 60 ksi
0
5
10
15
20
25
30
0 50 100 150 200 250 300 350 400
De
fle
ctio
n (
mm
)
Time (s)
Uncoated 16 mm Spilce
Epoxy Coated 16 mm Spilce
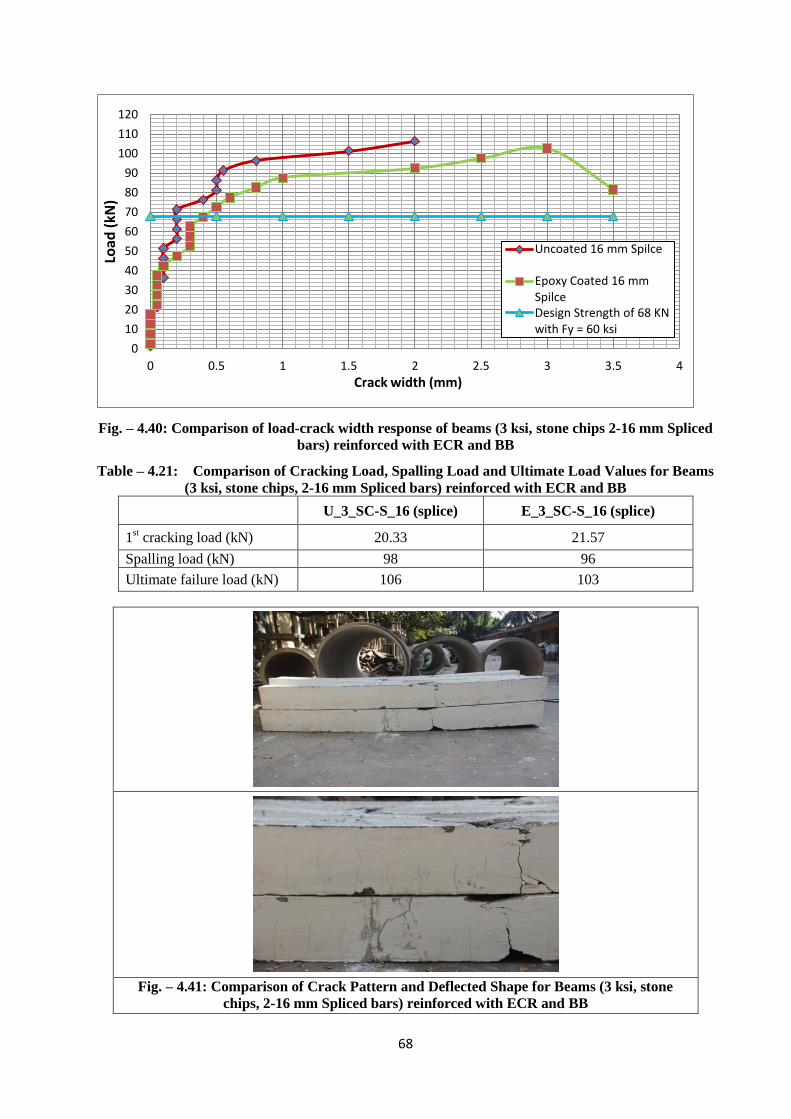
68
Fig. – 4.40: Comparison of load-crack width response of beams (3 ksi, stone chips 2-16 mm Spliced
bars) reinforced with ECR and BB
Table – 4.21: Comparison of Cracking Load, Spalling Load and Ultimate Load Values for Beams
(3 ksi, stone chips, 2-16 mm Spliced bars) reinforced with ECR and BB
U_3_SC-S_16 (splice) E_3_SC-S_16 (splice)
1st cracking load (kN) 20.33 21.57
Spalling load (kN) 98 96
Ultimate failure load (kN) 106 103
Fig. – 4.41: Comparison of Crack Pattern and Deflected Shape for Beams (3 ksi, stone
chips, 2-16 mm Spliced bars) reinforced with ECR and BB
0
10
20
30
40
50
60
70
80
90
100
110
120
0 0.5 1 1.5 2 2.5 3 3.5 4
Load
(kN
)
Crack width (mm)
Uncoated 16 mm Spilce
Epoxy Coated 16 mm Spilce Design Strength of 68 KN with Fy = 60 ksi
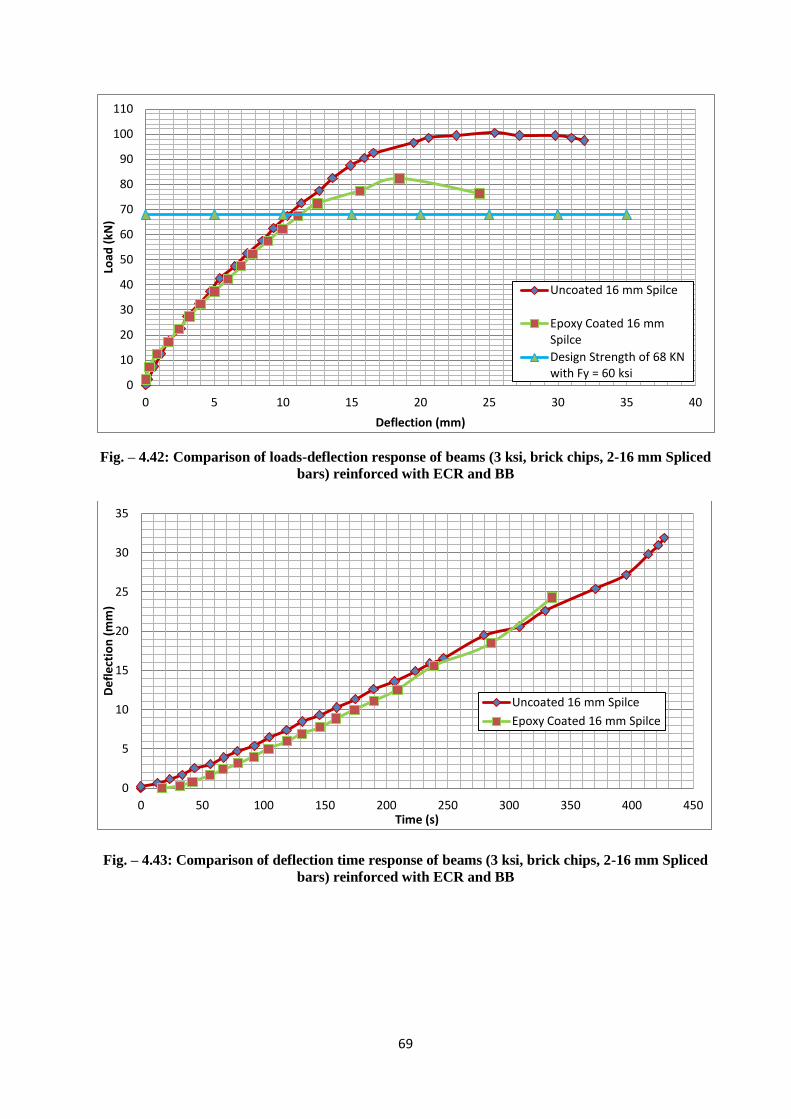
69
Fig. – 4.42: Comparison of loads-deflection response of beams (3 ksi, brick chips, 2-16 mm Spliced
bars) reinforced with ECR and BB
Fig. – 4.43: Comparison of deflection time response of beams (3 ksi, brick chips, 2-16 mm Spliced
bars) reinforced with ECR and BB
0
10
20
30
40
50
60
70
80
90
100
110
0 5 10 15 20 25 30 35 40
Load
(kN
)
Deflection (mm)
Uncoated 16 mm Spilce
Epoxy Coated 16 mm Spilce
Design Strength of 68 KN with Fy = 60 ksi
0
5
10
15
20
25
30
35
0 50 100 150 200 250 300 350 400 450
De
fle
ctio
n (
mm
)
Time (s)
Uncoated 16 mm Spilce
Epoxy Coated 16 mm Spilce
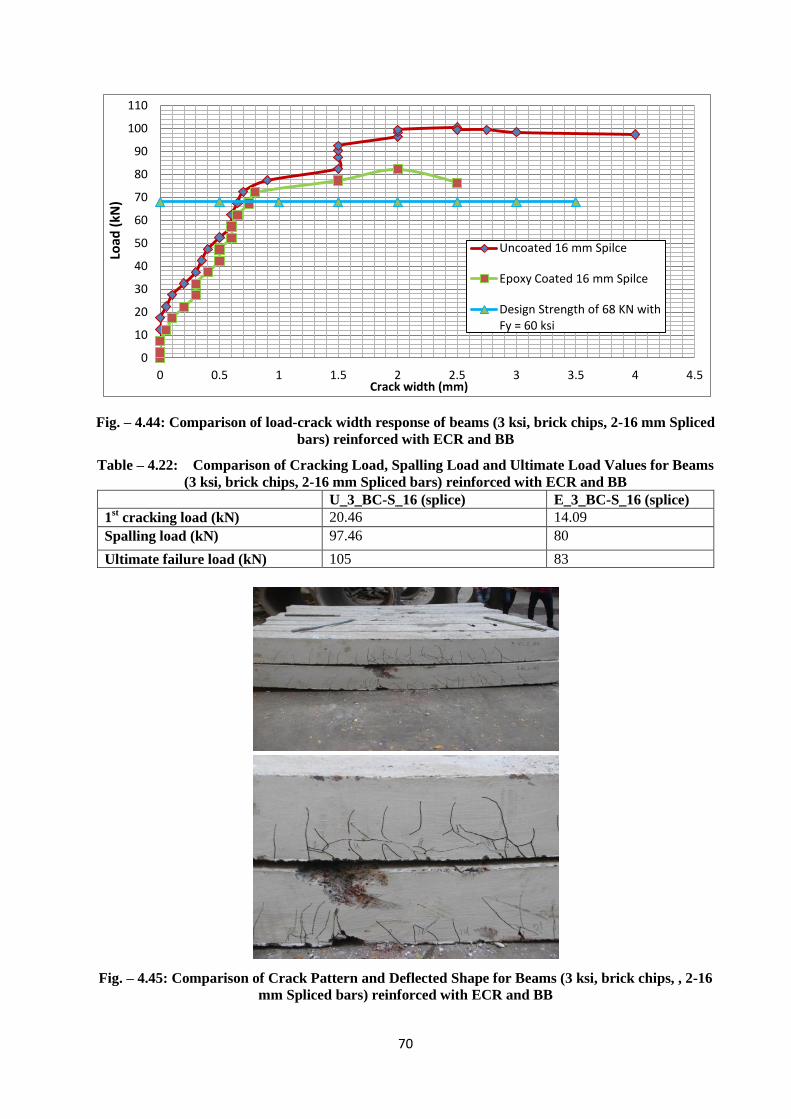
70
Fig. – 4.44: Comparison of load-crack width response of beams (3 ksi, brick chips, 2-16 mm Spliced
bars) reinforced with ECR and BB
Table – 4.22: Comparison of Cracking Load, Spalling Load and Ultimate Load Values for Beams
(3 ksi, brick chips, 2-16 mm Spliced bars) reinforced with ECR and BB
U_3_BC-S_16 (splice) E_3_BC-S_16 (splice)
1st cracking load (kN) 20.46 14.09
Spalling load (kN) 97.46 80
Ultimate failure load (kN) 105 83
Fig. – 4.45: Comparison of Crack Pattern and Deflected Shape for Beams (3 ksi, brick chips, , 2-16
mm Spliced bars) reinforced with ECR and BB
0
10
20
30
40
50
60
70
80
90
100
110
0 0.5 1 1.5 2 2.5 3 3.5 4 4.5
Lo
ad (
kN)
Crack width (mm)
Uncoated 16 mm Spilce
Epoxy Coated 16 mm Spilce
Design Strength of 68 KN with Fy = 60 ksi
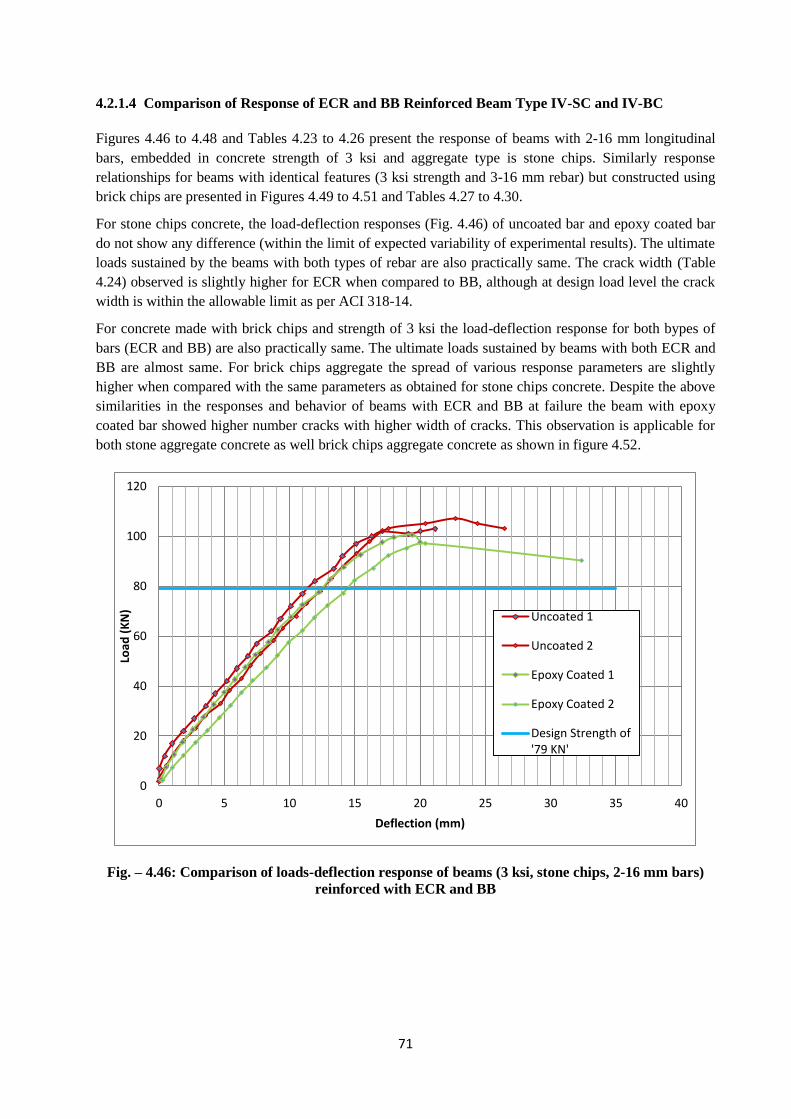
71
4.2.1.4 Comparison of Response of ECR and BB Reinforced Beam Type IV-SC and IV-BC
Figures 4.46 to 4.48 and Tables 4.23 to 4.26 present the response of beams with 2-16 mm longitudinal
bars, embedded in concrete strength of 3 ksi and aggregate type is stone chips. Similarly response
relationships for beams with identical features (3 ksi strength and 3-16 mm rebar) but constructed using
brick chips are presented in Figures 4.49 to 4.51 and Tables 4.27 to 4.30.
For stone chips concrete, the load-deflection responses (Fig. 4.46) of uncoated bar and epoxy coated bar
do not show any difference (within the limit of expected variability of experimental results). The ultimate
loads sustained by the beams with both types of rebar are also practically same. The crack width (Table
4.24) observed is slightly higher for ECR when compared to BB, although at design load level the crack
width is within the allowable limit as per ACI 318-14.
For concrete made with brick chips and strength of 3 ksi the load-deflection response for both bypes of
bars (ECR and BB) are also practically same. The ultimate loads sustained by beams with both ECR and
BB are almost same. For brick chips aggregate the spread of various response parameters are slightly
higher when compared with the same parameters as obtained for stone chips concrete. Despite the above
similarities in the responses and behavior of beams with ECR and BB at failure the beam with epoxy
coated bar showed higher number cracks with higher width of cracks. This observation is applicable for
both stone aggregate concrete as well brick chips aggregate concrete as shown in figure 4.52.
Fig. – 4.46: Comparison of loads-deflection response of beams (3 ksi, stone chips, 2-16 mm bars)
reinforced with ECR and BB
0
20
40
60
80
100
120
0 5 10 15 20 25 30 35 40
Load
(K
N)
Deflection (mm)
Uncoated 1
Uncoated 2
Epoxy Coated 1
Epoxy Coated 2
Design Strength of '79 KN'
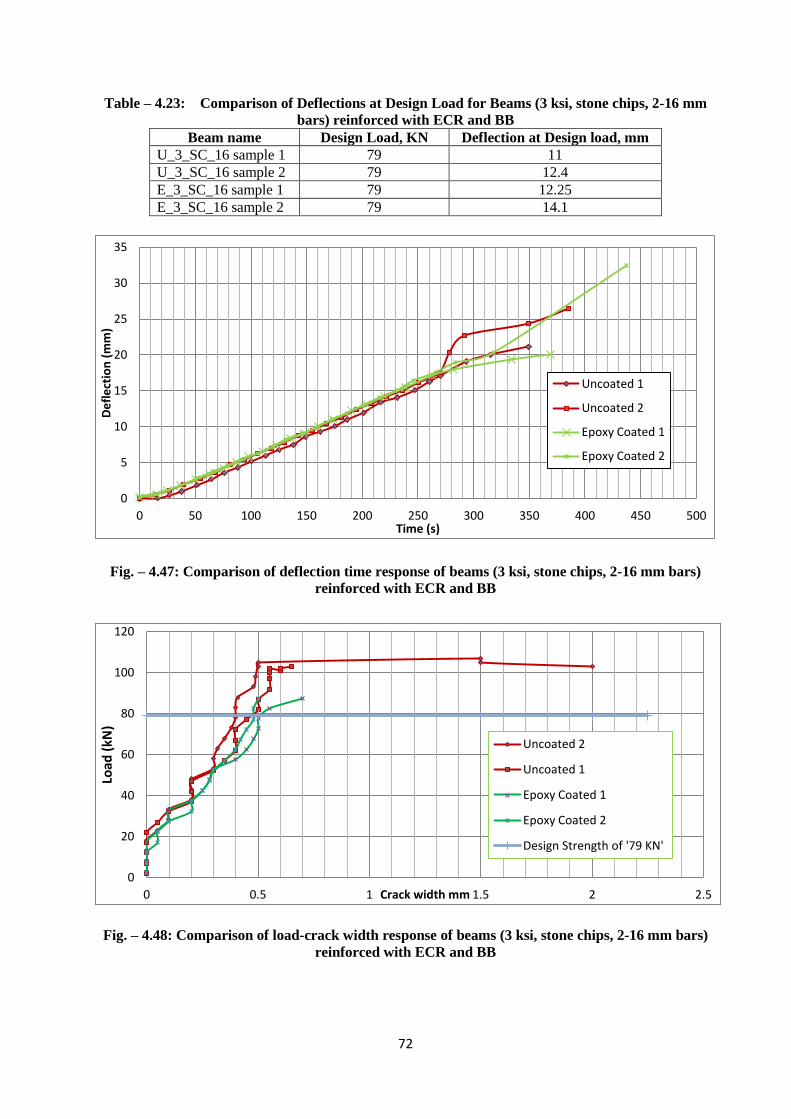
72
Table – 4.23: Comparison of Deflections at Design Load for Beams (3 ksi, stone chips, 2-16 mm
bars) reinforced with ECR and BB
Beam name Design Load, KN Deflection at Design load, mm
U_3_SC_16 sample 1 79 11
U_3_SC_16 sample 2 79 12.4
E_3_SC_16 sample 1 79 12.25
E_3_SC_16 sample 2 79 14.1
Fig. – 4.47: Comparison of deflection time response of beams (3 ksi, stone chips, 2-16 mm bars)
reinforced with ECR and BB
Fig. – 4.48: Comparison of load-crack width response of beams (3 ksi, stone chips, 2-16 mm bars)
reinforced with ECR and BB
0
5
10
15
20
25
30
35
0 50 100 150 200 250 300 350 400 450 500
De
fle
ctio
n (
mm
)
Time (s)
Uncoated 1
Uncoated 2
Epoxy Coated 1
Epoxy Coated 2
0
20
40
60
80
100
120
0 0.5 1 1.5 2 2.5
Load
(kN
)
Crack width mm
Uncoated 2
Uncoated 1
Epoxy Coated 1
Epoxy Coated 2
Design Strength of '79 KN'
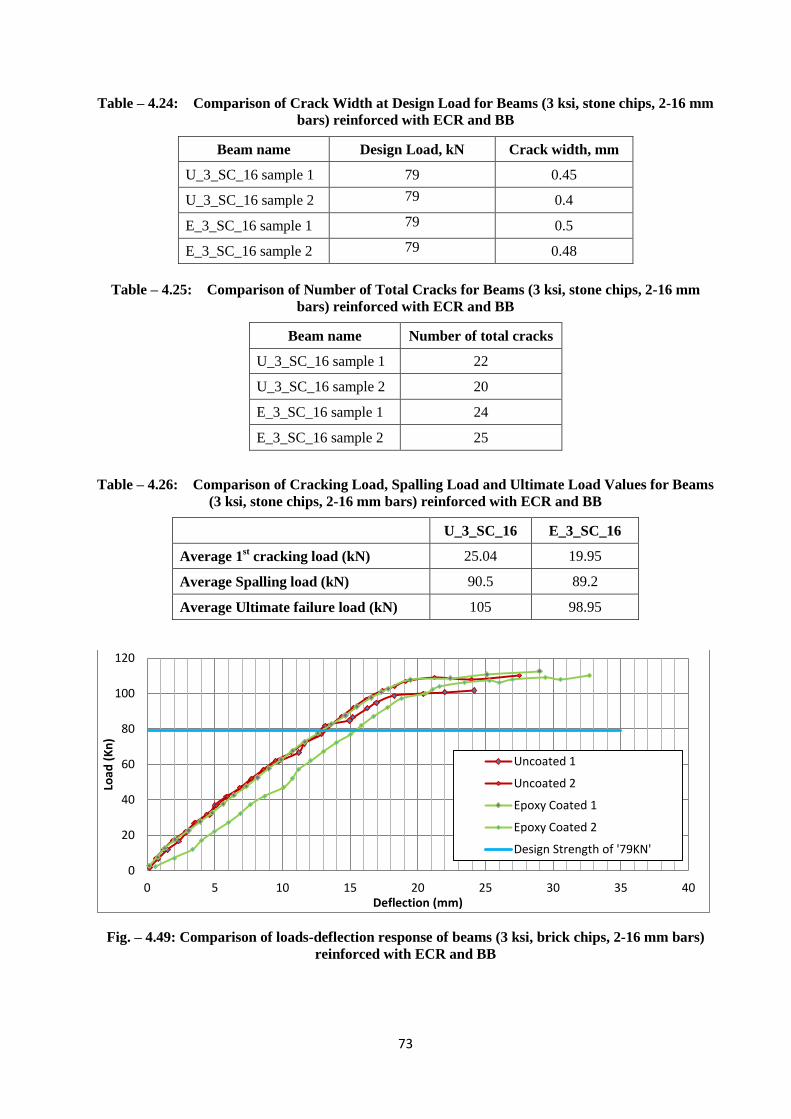
73
Table – 4.24: Comparison of Crack Width at Design Load for Beams (3 ksi, stone chips, 2-16 mm
bars) reinforced with ECR and BB
Beam name Design Load, kN Crack width, mm
U_3_SC_16 sample 1 79 0.45
U_3_SC_16 sample 2 79 0.4
E_3_SC_16 sample 1 79 0.5
E_3_SC_16 sample 2 79 0.48
Table – 4.25: Comparison of Number of Total Cracks for Beams (3 ksi, stone chips, 2-16 mm
bars) reinforced with ECR and BB
Beam name Number of total cracks
U_3_SC_16 sample 1 22
U_3_SC_16 sample 2 20
E_3_SC_16 sample 1 24
E_3_SC_16 sample 2 25
Table – 4.26: Comparison of Cracking Load, Spalling Load and Ultimate Load Values for Beams
(3 ksi, stone chips, 2-16 mm bars) reinforced with ECR and BB
U_3_SC_16 E_3_SC_16
Average 1st cracking load (kN) 25.04 19.95
Average Spalling load (kN) 90.5 89.2
Average Ultimate failure load (kN) 105 98.95
Fig. – 4.49: Comparison of loads-deflection response of beams (3 ksi, brick chips, 2-16 mm bars)
reinforced with ECR and BB
0
20
40
60
80
100
120
0 5 10 15 20 25 30 35 40
Load
(K
n)
Deflection (mm)
Uncoated 1
Uncoated 2
Epoxy Coated 1
Epoxy Coated 2
Design Strength of '79KN'
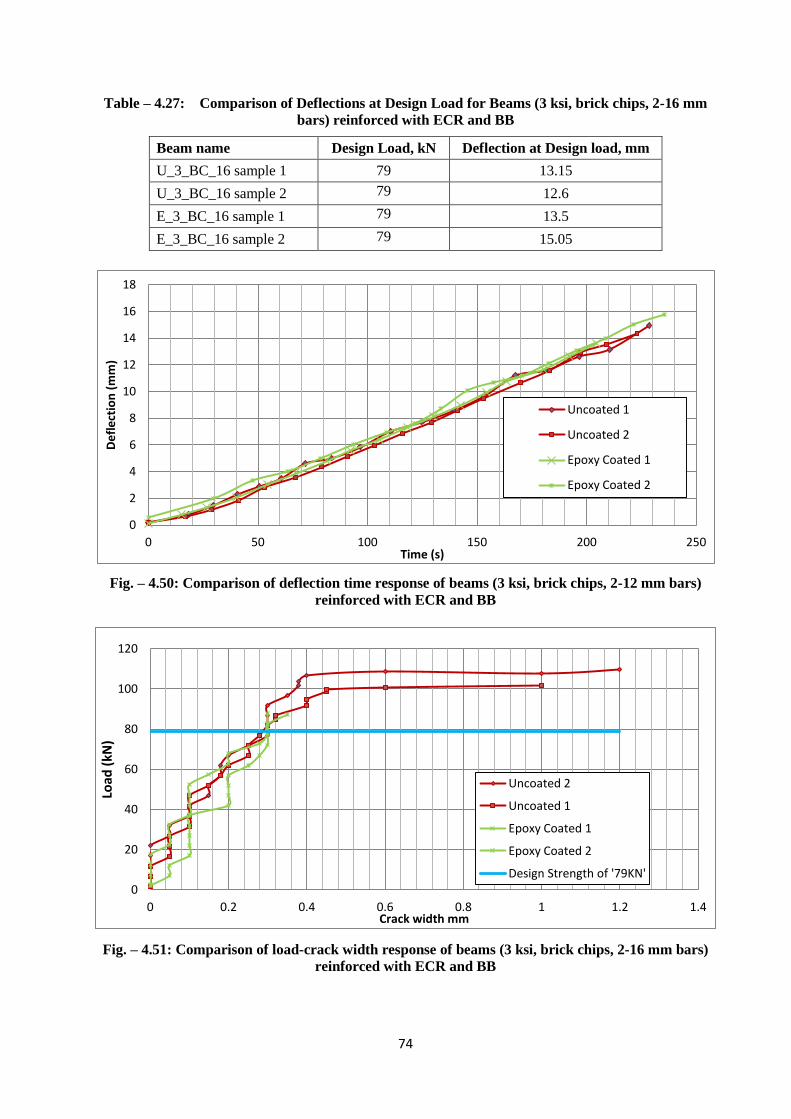
74
Table – 4.27: Comparison of Deflections at Design Load for Beams (3 ksi, brick chips, 2-16 mm
bars) reinforced with ECR and BB
Beam name Design Load, kN Deflection at Design load, mm
U_3_BC_16 sample 1 79 13.15
U_3_BC_16 sample 2 79 12.6
E_3_BC_16 sample 1 79 13.5
E_3_BC_16 sample 2 79 15.05
Fig. – 4.50: Comparison of deflection time response of beams (3 ksi, brick chips, 2-12 mm bars)
reinforced with ECR and BB
Fig. – 4.51: Comparison of load-crack width response of beams (3 ksi, brick chips, 2-16 mm bars)
reinforced with ECR and BB
0
2
4
6
8
10
12
14
16
18
0 50 100 150 200 250
De
fle
ctio
n (
mm
)
Time (s)
Uncoated 1
Uncoated 2
Epoxy Coated 1
Epoxy Coated 2
0
20
40
60
80
100
120
0 0.2 0.4 0.6 0.8 1 1.2 1.4
Load
(kN
)
Crack width mm
Uncoated 2
Uncoated 1
Epoxy Coated 1
Epoxy Coated 2
Design Strength of '79KN'
75
Table – 4.28: Comparison of Crack Width at Design Load for Beams (3 ksi, brick chips, 2-16 mm
bars) reinforced with ECR and BB
Beam name Design Load, kN Crack width, mm
U_3_BC_16 sample 1 79 0.3
U_3_BC_16 sample 2 79 0.3
E_3_BC_16 sample 1 79 0.3
E_3_BC_16 sample 2 79 0.3
Table – 4.29: Comparison of Number of Total Cracks for Beams (3 ksi, brick chips, 2-16 mm
bars) reinforced with ECR and BB
Beam name Number of total cracks
U_3_BC_16 sample 1 20
U_3_BC_16 sample 2 19
E_3_BC_16 sample 1 26
E_3_BC_16 sample 2 28
Table – 4.30: Comparison of Cracking Load, Spalling Load and Ultimate Load Values for Beams
(3 ksi, brick chips, 2-16 mm bars) reinforced with ECR and BB
U_3_BC_16 E_3_BC_16
Average 1st cracking load (kN) 21.79 14.87
Average Spalling load (kN) 97.5 99.2
Average Ultimate failure load (kN) 105.75 111.35
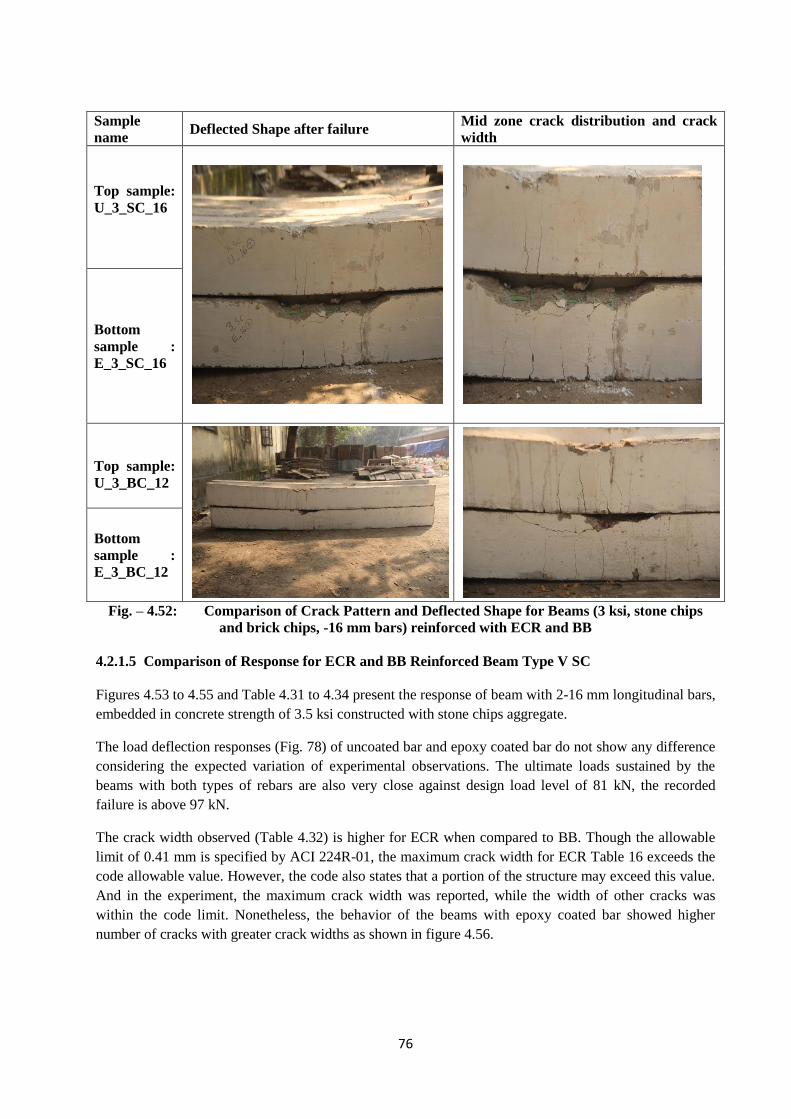
76
Sample
name Deflected Shape after failure
Mid zone crack distribution and crack
width
Top sample:
U_3_SC_16
Bottom
sample :
E_3_SC_16
Top sample:
U_3_BC_12
Bottom
sample :
E_3_BC_12
Fig. – 4.52: Comparison of Crack Pattern and Deflected Shape for Beams (3 ksi, stone chips
and brick chips, -16 mm bars) reinforced with ECR and BB
4.2.1.5 Comparison of Response for ECR and BB Reinforced Beam Type V SC
Figures 4.53 to 4.55 and Table 4.31 to 4.34 present the response of beam with 2-16 mm longitudinal bars,
embedded in concrete strength of 3.5 ksi constructed with stone chips aggregate.
The load deflection responses (Fig. 78) of uncoated bar and epoxy coated bar do not show any difference
considering the expected variation of experimental observations. The ultimate loads sustained by the
beams with both types of rebars are also very close against design load level of 81 kN, the recorded
failure is above 97 kN.
The crack width observed (Table 4.32) is higher for ECR when compared to BB. Though the allowable
limit of 0.41 mm is specified by ACI 224R-01, the maximum crack width for ECR Table 16 exceeds the
code allowable value. However, the code also states that a portion of the structure may exceed this value.
And in the experiment, the maximum crack width was reported, while the width of other cracks was
within the code limit. Nonetheless, the behavior of the beams with epoxy coated bar showed higher
number of cracks with greater crack widths as shown in figure 4.56.
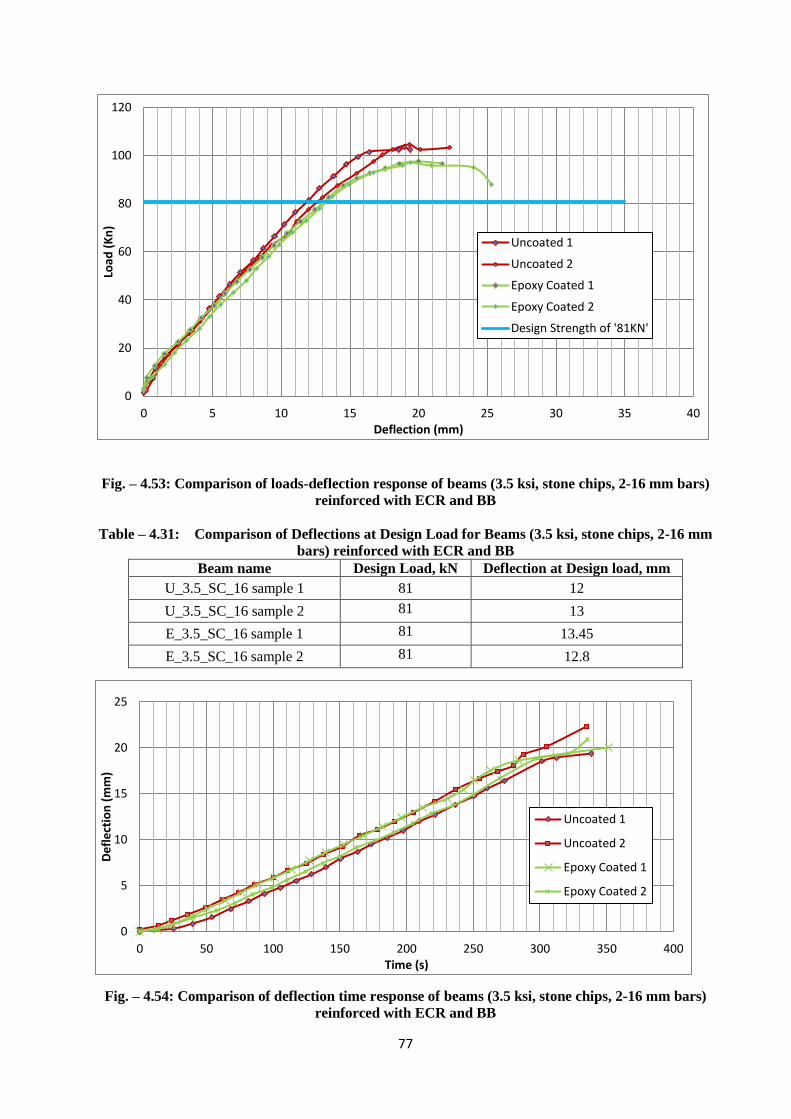
77
Fig. – 4.53: Comparison of loads-deflection response of beams (3.5 ksi, stone chips, 2-16 mm bars)
reinforced with ECR and BB
Table – 4.31: Comparison of Deflections at Design Load for Beams (3.5 ksi, stone chips, 2-16 mm
bars) reinforced with ECR and BB
Beam name Design Load, kN Deflection at Design load, mm
U_3.5_SC_16 sample 1 81 12
U_3.5_SC_16 sample 2 81 13
E_3.5_SC_16 sample 1 81 13.45
E_3.5_SC_16 sample 2 81 12.8
Fig. – 4.54: Comparison of deflection time response of beams (3.5 ksi, stone chips, 2-16 mm bars)
reinforced with ECR and BB
0
20
40
60
80
100
120
0 5 10 15 20 25 30 35 40
Load
(K
n)
Deflection (mm)
Uncoated 1
Uncoated 2
Epoxy Coated 1
Epoxy Coated 2
Design Strength of '81KN'
0
5
10
15
20
25
0 50 100 150 200 250 300 350 400
De
fle
ctio
n (
mm
)
Time (s)
Uncoated 1
Uncoated 2
Epoxy Coated 1
Epoxy Coated 2
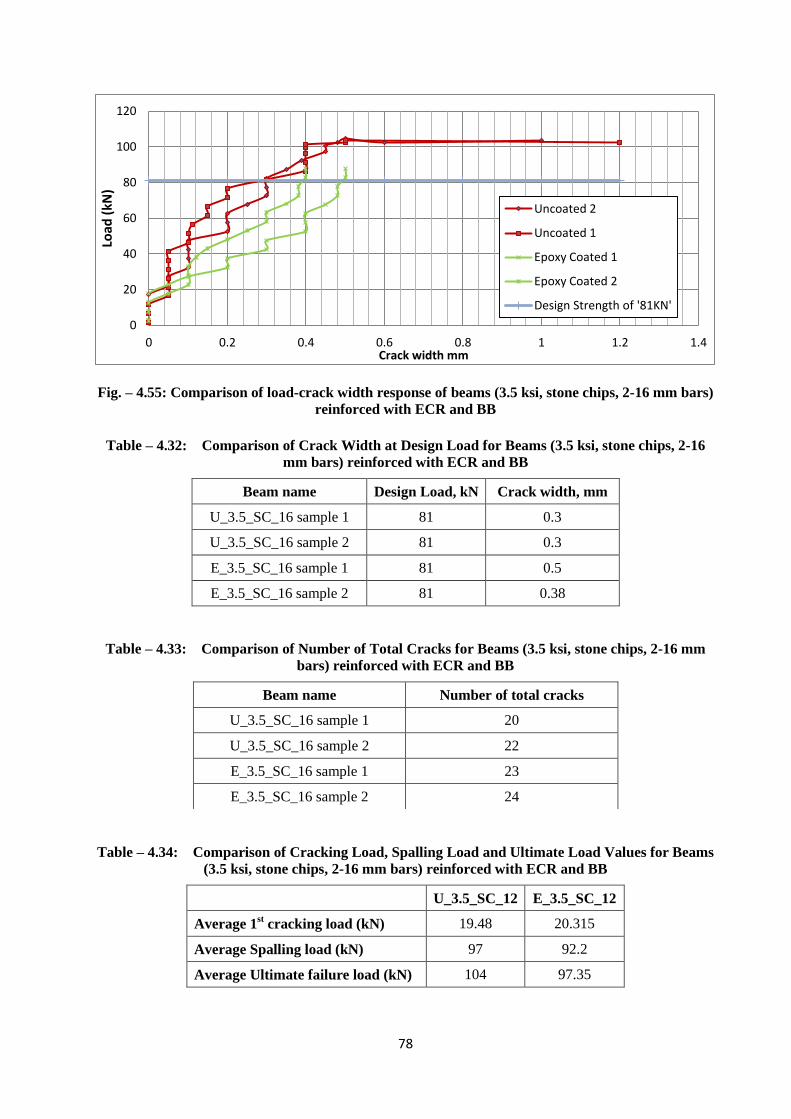
78
Fig. – 4.55: Comparison of load-crack width response of beams (3.5 ksi, stone chips, 2-16 mm bars)
reinforced with ECR and BB
Table – 4.32: Comparison of Crack Width at Design Load for Beams (3.5 ksi, stone chips, 2-16
mm bars) reinforced with ECR and BB
Beam name Design Load, kN Crack width, mm
U_3.5_SC_16 sample 1 81 0.3
U_3.5_SC_16 sample 2 81 0.3
E_3.5_SC_16 sample 1 81 0.5
E_3.5_SC_16 sample 2 81 0.38
Table – 4.33: Comparison of Number of Total Cracks for Beams (3.5 ksi, stone chips, 2-16 mm
bars) reinforced with ECR and BB
Table – 4.34: Comparison of Cracking Load, Spalling Load and Ultimate Load Values for Beams
(3.5 ksi, stone chips, 2-16 mm bars) reinforced with ECR and BB
U_3.5_SC_12 E_3.5_SC_12
Average 1st cracking load (kN) 19.48 20.315
Average Spalling load (kN) 97 92.2
Average Ultimate failure load (kN) 104 97.35
0
20
40
60
80
100
120
0 0.2 0.4 0.6 0.8 1 1.2 1.4
Load
(kN
)
Crack width mm
Uncoated 2
Uncoated 1
Epoxy Coated 1
Epoxy Coated 2
Design Strength of '81KN'
Beam name Number of total cracks
U_3.5_SC_16 sample 1 20
U_3.5_SC_16 sample 2 22
E_3.5_SC_16 sample 1 23
E_3.5_SC_16 sample 2 24
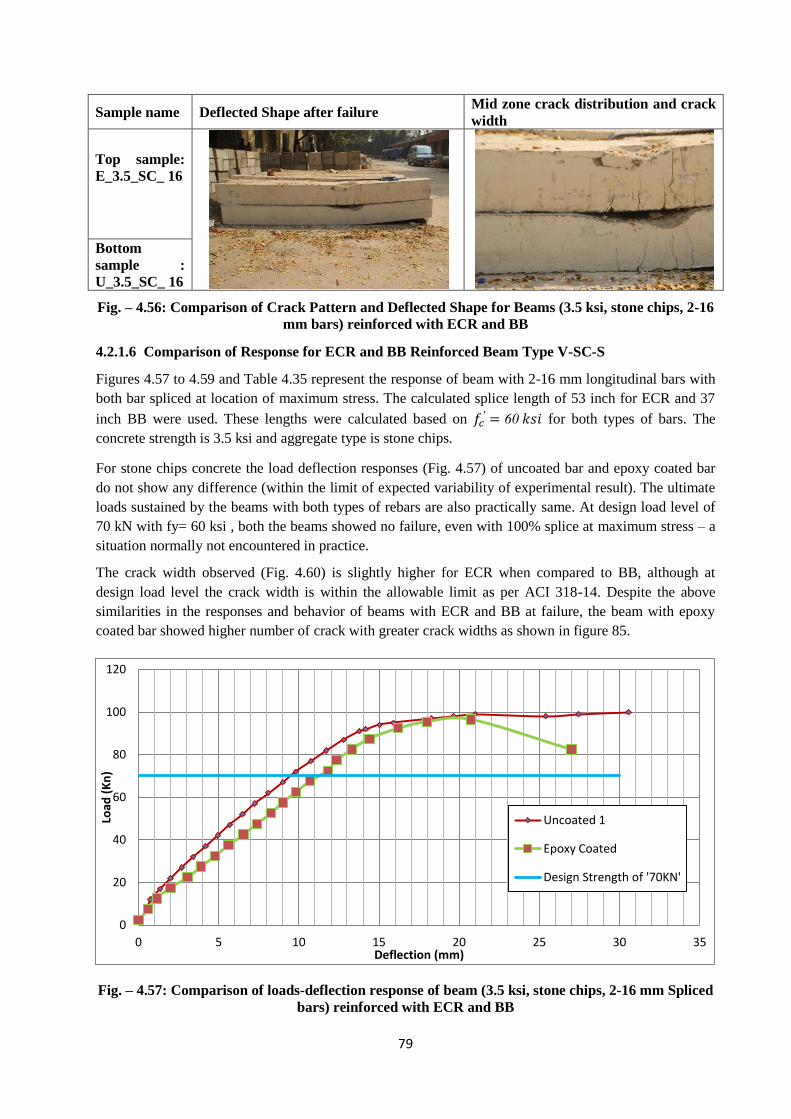
79
Sample name Deflected Shape after failure Mid zone crack distribution and crack
width
Top sample:
E_3.5_SC_ 16
Bottom
sample :
U_3.5_SC_ 16
Fig. – 4.56: Comparison of Crack Pattern and Deflected Shape for Beams (3.5 ksi, stone chips, 2-16
mm bars) reinforced with ECR and BB
4.2.1.6 Comparison of Response for ECR and BB Reinforced Beam Type V-SC-S
Figures 4.57 to 4.59 and Table 4.35 represent the response of beam with 2-16 mm longitudinal bars with
both bar spliced at location of maximum stress. The calculated splice length of 53 inch for ECR and 37
inch BB were used. These lengths were calculated based on for both types of bars. The
concrete strength is 3.5 ksi and aggregate type is stone chips.
For stone chips concrete the load deflection responses (Fig. 4.57) of uncoated bar and epoxy coated bar
do not show any difference (within the limit of expected variability of experimental result). The ultimate
loads sustained by the beams with both types of rebars are also practically same. At design load level of
70 kN with fy= 60 ksi , both the beams showed no failure, even with 100% splice at maximum stress – a
situation normally not encountered in practice.
The crack width observed (Fig. 4.60) is slightly higher for ECR when compared to BB, although at
design load level the crack width is within the allowable limit as per ACI 318-14. Despite the above
similarities in the responses and behavior of beams with ECR and BB at failure, the beam with epoxy
coated bar showed higher number of crack with greater crack widths as shown in figure 85.
Fig. – 4.57: Comparison of loads-deflection response of beam (3.5 ksi, stone chips, 2-16 mm Spliced
bars) reinforced with ECR and BB
0
20
40
60
80
100
120
0 5 10 15 20 25 30 35
Load
(K
n)
Deflection (mm)
Uncoated 1
Epoxy Coated
Design Strength of '70KN'
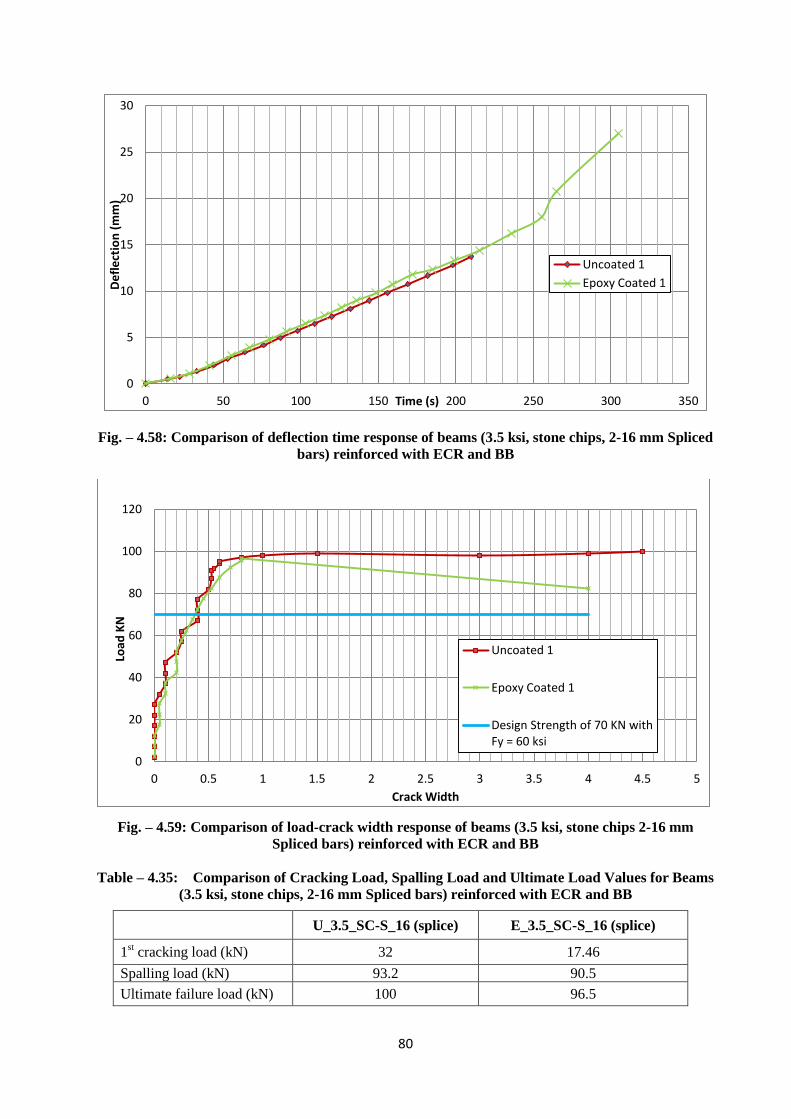
80
Fig. – 4.58: Comparison of deflection time response of beams (3.5 ksi, stone chips, 2-16 mm Spliced
bars) reinforced with ECR and BB
Fig. – 4.59: Comparison of load-crack width response of beams (3.5 ksi, stone chips 2-16 mm
Spliced bars) reinforced with ECR and BB
Table – 4.35: Comparison of Cracking Load, Spalling Load and Ultimate Load Values for Beams
(3.5 ksi, stone chips, 2-16 mm Spliced bars) reinforced with ECR and BB
U_3.5_SC-S_16 (splice) E_3.5_SC-S_16 (splice)
1st cracking load (kN) 32 17.46
Spalling load (kN) 93.2 90.5
Ultimate failure load (kN) 100 96.5
0
5
10
15
20
25
30
0 50 100 150 200 250 300 350
De
fle
ctio
n (
mm
)
Time (s)
Uncoated 1
Epoxy Coated 1
0
20
40
60
80
100
120
0 0.5 1 1.5 2 2.5 3 3.5 4 4.5 5
Load
KN
Crack Width
Uncoated 1
Epoxy Coated 1
Design Strength of 70 KN with Fy = 60 ksi
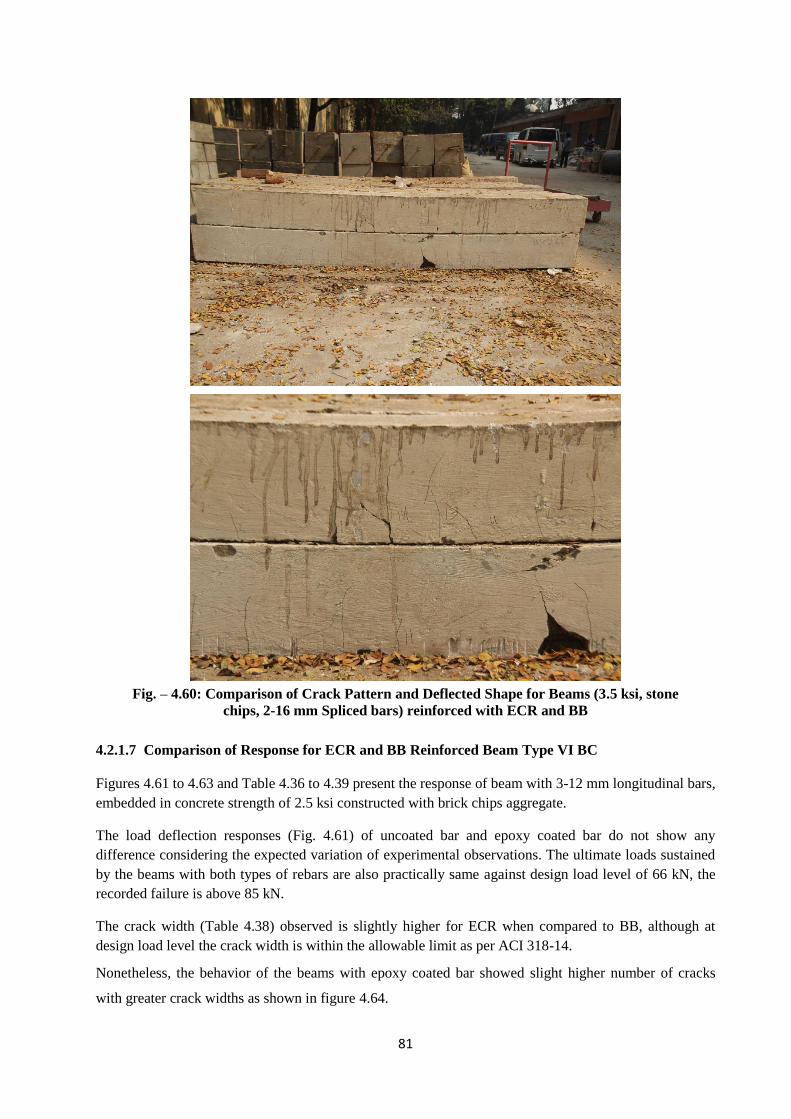
81
Fig. – 4.60: Comparison of Crack Pattern and Deflected Shape for Beams (3.5 ksi, stone
chips, 2-16 mm Spliced bars) reinforced with ECR and BB
4.2.1.7 Comparison of Response for ECR and BB Reinforced Beam Type VI BC
Figures 4.61 to 4.63 and Table 4.36 to 4.39 present the response of beam with 3-12 mm longitudinal bars,
embedded in concrete strength of 2.5 ksi constructed with brick chips aggregate.
The load deflection responses (Fig. 4.61) of uncoated bar and epoxy coated bar do not show any
difference considering the expected variation of experimental observations. The ultimate loads sustained
by the beams with both types of rebars are also practically same against design load level of 66 kN, the
recorded failure is above 85 kN.
The crack width (Table 4.38) observed is slightly higher for ECR when compared to BB, although at
design load level the crack width is within the allowable limit as per ACI 318-14.
Nonetheless, the behavior of the beams with epoxy coated bar showed slight higher number of cracks
with greater crack widths as shown in figure 4.64.
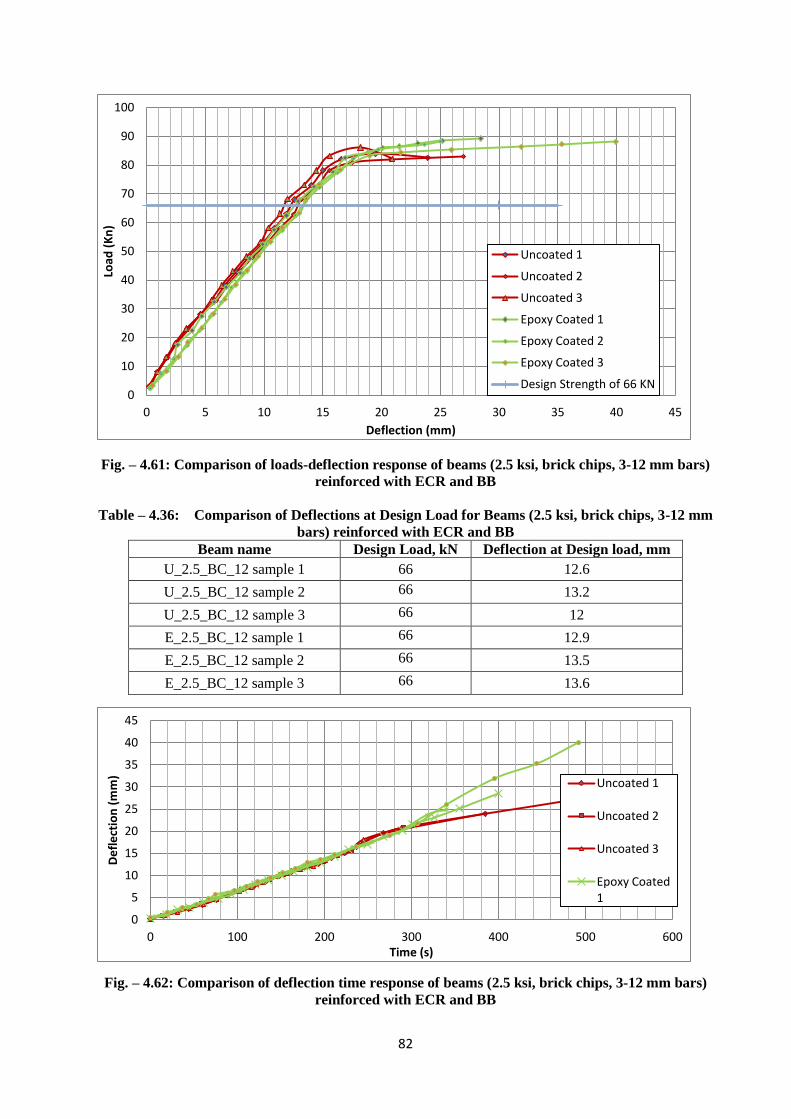
82
Fig. – 4.61: Comparison of loads-deflection response of beams (2.5 ksi, brick chips, 3-12 mm bars)
reinforced with ECR and BB
Table – 4.36: Comparison of Deflections at Design Load for Beams (2.5 ksi, brick chips, 3-12 mm
bars) reinforced with ECR and BB
Beam name Design Load, kN Deflection at Design load, mm
U_2.5_BC_12 sample 1 66 12.6
U_2.5_BC_12 sample 2 66 13.2
U_2.5_BC_12 sample 3 66 12
E_2.5_BC_12 sample 1 66 12.9
E_2.5_BC_12 sample 2 66 13.5
E_2.5_BC_12 sample 3 66 13.6
Fig. – 4.62: Comparison of deflection time response of beams (2.5 ksi, brick chips, 3-12 mm bars)
reinforced with ECR and BB
0
10
20
30
40
50
60
70
80
90
100
0 5 10 15 20 25 30 35 40 45
Load
(K
n)
Deflection (mm)
Uncoated 1
Uncoated 2
Uncoated 3
Epoxy Coated 1
Epoxy Coated 2
Epoxy Coated 3
Design Strength of 66 KN
0
5
10
15
20
25
30
35
40
45
0 100 200 300 400 500 600
De
fle
ctio
n (
mm
)
Time (s)
Uncoated 1
Uncoated 2
Uncoated 3
Epoxy Coated 1
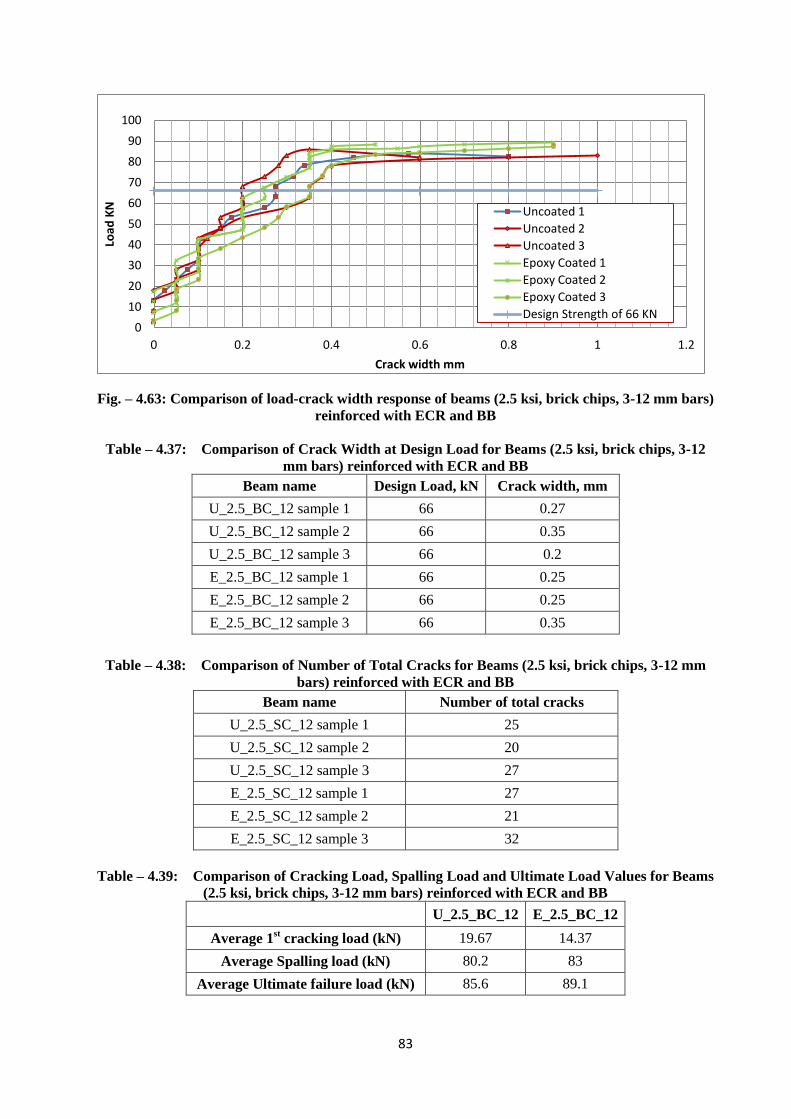
83
Fig. – 4.63: Comparison of load-crack width response of beams (2.5 ksi, brick chips, 3-12 mm bars)
reinforced with ECR and BB
Table – 4.37: Comparison of Crack Width at Design Load for Beams (2.5 ksi, brick chips, 3-12
mm bars) reinforced with ECR and BB
Beam name Design Load, kN Crack width, mm
U_2.5_BC_12 sample 1 66 0.27
U_2.5_BC_12 sample 2 66 0.35
U_2.5_BC_12 sample 3 66 0.2
E_2.5_BC_12 sample 1 66 0.25
E_2.5_BC_12 sample 2 66 0.25
E_2.5_BC_12 sample 3 66 0.35
Table – 4.38: Comparison of Number of Total Cracks for Beams (2.5 ksi, brick chips, 3-12 mm
bars) reinforced with ECR and BB
Beam name Number of total cracks
U_2.5_SC_12 sample 1 25
U_2.5_SC_12 sample 2 20
U_2.5_SC_12 sample 3 27
E_2.5_SC_12 sample 1 27
E_2.5_SC_12 sample 2 21
E_2.5_SC_12 sample 3 32
Table – 4.39: Comparison of Cracking Load, Spalling Load and Ultimate Load Values for Beams
(2.5 ksi, brick chips, 3-12 mm bars) reinforced with ECR and BB
U_2.5_BC_12 E_2.5_BC_12
Average 1st cracking load (kN) 19.67 14.37
Average Spalling load (kN) 80.2 83
Average Ultimate failure load (kN) 85.6 89.1
0
10
20
30
40
50
60
70
80
90
100
0 0.2 0.4 0.6 0.8 1 1.2
Load
KN
Crack width mm
Uncoated 1
Uncoated 2
Uncoated 3
Epoxy Coated 1
Epoxy Coated 2
Epoxy Coated 3
Design Strength of 66 KN
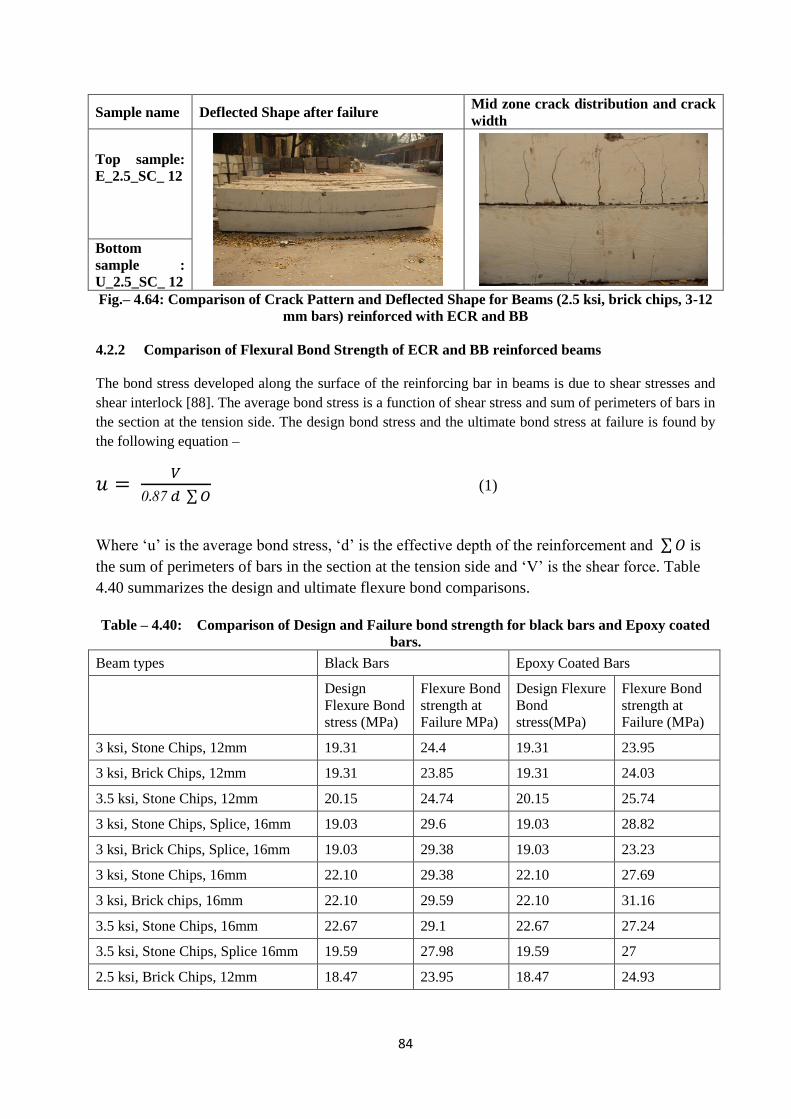
84
Sample name Deflected Shape after failure Mid zone crack distribution and crack
width
Top sample:
E_2.5_SC_ 12
Bottom
sample :
U_2.5_SC_ 12
Fig.– 4.64: Comparison of Crack Pattern and Deflected Shape for Beams (2.5 ksi, brick chips, 3-12
mm bars) reinforced with ECR and BB
4.2.2 Comparison of Flexural Bond Strength of ECR and BB reinforced beams
The bond stress developed along the surface of the reinforcing bar in beams is due to shear stresses and
shear interlock [88]. The average bond stress is a function of shear stress and sum of perimeters of bars in
the section at the tension side. The design bond stress and the ultimate bond stress at failure is found by
the following equation –
(1)
Where ‘u’ is the average bond stress, ‘d’ is the effective depth of the reinforcement and is
the sum of perimeters of bars in the section at the tension side and ‘V’ is the shear force. Table
4.40 summarizes the design and ultimate flexure bond comparisons.
Table – 4.40: Comparison of Design and Failure bond strength for black bars and Epoxy coated
bars.
Beam types Black Bars Epoxy Coated Bars
Design
Flexure Bond
stress (MPa)
Flexure Bond
strength at
Failure MPa)
Design Flexure
Bond
stress(MPa)
Flexure Bond
strength at
Failure (MPa)
3 ksi, Stone Chips, 12mm 19.31 24.4 19.31 23.95
3 ksi, Brick Chips, 12mm 19.31 23.85 19.31 24.03
3.5 ksi, Stone Chips, 12mm 20.15 24.74 20.15 25.74
3 ksi, Stone Chips, Splice, 16mm 19.03 29.6 19.03 28.82
3 ksi, Brick Chips, Splice, 16mm 19.03 29.38 19.03 23.23
3 ksi, Stone Chips, 16mm 22.10 29.38 22.10 27.69
3 ksi, Brick chips, 16mm 22.10 29.59 22.10 31.16
3.5 ksi, Stone Chips, 16mm 22.67 29.1 22.67 27.24
3.5 ksi, Stone Chips, Splice 16mm 19.59 27.98 19.59 27
2.5 ksi, Brick Chips, 12mm 18.47 23.95 18.47 24.93
85
Design flexure bond stress for both ECR and BB are theoretical bond stresses calculated using
equation 1 where ‘V’ is calculated from theoretical two point loading condition. The analytical
equation for the beam does not include any coating factor. Thus, the design flexural bond is
same for both ECR and BB. But, the flexure bond strength is calculated using equation 1 at
failure load. It is found that, the flexure bond strength at failure is higher for both ECR and BB
when compared to design bond stress.
86
CHAPTER 5
Conclusions and Recommendations
Based on the review of worldwide research and results of experiments conducted at BUET on epoxy
coated reinforcements (ECR) and conventional black bars (BB), the following conclusions are drawn:
A. A review of research findings on corrosion led deterioration of concrete structures has been made. As a
protection against early deterioration of concrete in aggressive environment, epoxy coated rebars have
been in use for more than forty years in North America. Its use has gained popularity in constructions
of infrastructures that are exposed to adverse weathering conditions. Based on the review, the
following conclusions are made:
(i) With exposure to extreme saline environment, the epoxy coated rebar demonstrates superior
performance against corrosion led deterioration of concrete structures.
(ii) During initial years of its production and use quality of coating as well as less stringent
requirements of care and protection during handling and fabrication have led to concerns about
the effectiveness of ECR in corrosion protection. However, the ASTM A775 has had several
revisions with stringent quality control requirements. With higher quality requirements
coupled with introduction of ASTM D3963 (Standard Specification for Fabrication and Jobsite
Handling of Epoxy-Coated Steel Reinforcing Bars) for minimizing coating damage during
handling, transporting and fabrication, it is expected that ECR will have maintenance free
service life many-fold than the ordinary black bars, particularly in extreme weather condition.
(iii) Over the life-cycle of a structure exposed to extreme weather condition, epoxy coated
reinforcement proved to be much economic. The ECR involves only an increase in initial cost
of 3.7% but the life-cycle cost is decreased by more than 46% when compared with the
uncoated bars.
(iv) The design of structures with epoxy-coated rebar does not require any change from the
conventional un-coated bars. The only change that is required to be addressed is in the
development and splice length of ECR to be 20 to 50% higher than the black bars.
(v) The transportation, handling, storage and jobsite fabrication of ECR require a detail and
careful procedure not to damage the coatings for a sustained and durable performance. This
may become a crucial issue in construction practice. Special trained transporters and
fabricators would be necessary to cater for this.
B. A series of laboratory tests on two-types of concrete specimens have been conducted to evaluate
performance of locally produced FBECR over the conventional black bars. Results on specimens of (a)
direct pull-out and (b) flexural beams revealed the following:
(i) The ECR expectedly demonstrated slightly higher slip than the BB. A few samples behaved
otherwise which can be discarded as sample variations. With code specified embedment, the
ECR can sustain higher stress than the corresponding yield load of the bar.
(ii) The 12 mm epoxy coated bars sustained around 118-120% of the corresponding yield load,
while the 16 mm epoxy coated bars sustained around 118-130% of the corresponding yield
load.
(iii) The flexural load-deflection behavior of beams tested under two-point loading shows identical
response for both ECR and BB type reinforcements.
(iv) The beams reinforced with ECR showed higher crack width than conventional deformed bars,
87
although at design load the observed crack-width was within code specified limit.
(v) Though the average number of total cracks and crack widths are higher in case of ECR, some
individual beams with ECR showed equal or lesser crack number and crack width compared to
BB. Thus, it cannot be solely concluded based upon crack number and crack widths that, ECR
perform poorly under flexure compared to BB.
(vi) The concrete made with brick-chips aggregate demonstrated satisfactory performance in bond
behavior under direct pull-out as well as load-deflection response of beams. The observed slip,
deflection, crack widths are higher when ECR is used with brick chips concrete. Despite this
fact, the pull-out force and crack width satisfied the code specified limits.
(vii) The slip values for Epoxy Coated bars for both 12 mm and 16 mm decrease as concrete
strength increases. This is true for both brick chips and stone chips specimens.
(viii) Bond failure occurred for 16 mm Epoxy coated bars with for both stone chips and
brick chips specimens. This is because the embedded length of the bars was only 40% of the
code specified development length. Bond failure also occurred for 16 mm Epoxy Coated
bars with for brick chips specimens for the same reason. For the same cases
with 12 mm Epoxy Coated bars, no bond failure occurs due to increased percentages of
embedded lengths provided compared to 16 mm Epoxy Coated bars.
(ix) For higher strength concretes (e.g. and
) no bond failure occurs for
both 12mm and 16mm Epoxy Coated bars. So higher strength concrete would ensure better
performance of ECR.
(x) For the specimens with full development length, no difference in bond performance was
noticed for ECR and BB (see figure 4.22 and figure 4.23).With the use of code specified
development length the use of epoxy coated bar does not cause any poor performance.
C. Based on research conducted on performance of ECR in concrete, it may be concluded that with proper
quality assurance and care of handling and fabrication against coating damage, use of ECR in concrete
members will maintain comparable performance as expected with the use of BB reinforcements. This
is particularly the case when stone chips aggregate is used. With brick chips aggregate, the poor bond
performance leads to higher flexural crack width and deflection when ECR is used.
Recommendations
In case of both flexure tests and pull out tests, some specimens showed spurious results. This discrepancy
can be avoided with larger sample size so that the results obtained can be concluded as more statistically
significant one. Further research should be done with larger sample size.
88
References
1. ACI Committee 222R, Protection of Metals in Concrete Against Corrosion, American Concrete
Institute, Farmington Hills, Michigan, USA, 2001.
2. Tuutti, K., Corrosion of Steel in Concrete, Swedish Cement and Concrete Research Institute, 1982.
3. Hansson, C. M.and Sørensen, B., The Threshold Concentration of Chloride in Concrete for the
Initiation of Reinforcement Corrosion. in Corrosion Rates of Steel in Concrete, 1990, Baltimore,
Maryland, USA, ASTM STP 1065.
4. Sørensen, B.and Maahn, E, Nordic Concrete Research, Vol 1, No 1, 1982, p 1.
5. Gouda, V. K., Corrosion and Corrosion Inhibition of Reinforcing Steel I: Immersed in Alkaline
Solutions. British Corrosion Journal, 1970, 5, pages 198 to 203.
6. Gouda , V. K. and Halaka, W. Y., Corrosion and Corrosion Inhibition of Reinforcing Steel II:
Embedded in Concrete, British Corrosion Journal, 1970, 5 pages 204 to 208.
7. Aïtcin, P.C.; Neville, A.M., and Acker, P., Integrated View of Shrinkage Deformation, in Concrete
International, 1997, pages 35 to 41.
8. Mehta, P. K., Concrete Structure, Properties and Materials, 1986, Englewood Cliffs, New Jersey,
USA, Prentice-Hall Inc.
9. ACI Committee 224, Causes, Evaluation and Repair of Cracks in Concrete Structures, American
Concrete Institute, Farmington Hills, Michigan, USA, 1998.
10. Andrade,C.; Alonzo,C., and Molina, F. J., Cover Cracking as a Function of Rebar Corrosion: Part
II – Numerical Model, Materials and Structures, 1993, 26, pages 532 to 548.
11. ACI 318, Building Code Requirements for Structural Concrete, American Concrete Institute,
Farmington Hills, Michigan, USA,2014.
12. Francois, R. and Arliguie, G., Effect of Microcracking and Cracking on the Development of
Corrosion in Reinforced Concrete Members, Magazine of Concrete Research, 1999, 51 (2), pages
143 to150.
13. Okulaja, S. A. and Hansson, C. M. Corrosion of Reinforcing Steel in Cracked High Performance
Concrete, Advances in Cement and Concrete IX, 2003, Copper Mountain, Colorado, USA,
Engineering Conferences International.
14. Poursaee, A., The Effect of Concrete Composition, Wet Curing Period and Ambient Condition on
the Internal Environment in Concrete, MASc. thesis, University of Waterloo, Canada, 2004.
15. Suzuki, K.; Ohno,Y.; Praparntanatorn, S., and Tamura, H.. Mechanism of Steel Corrosion in
Cracked Concrete, International Symposium on Corrosion of Reinforcement in Concrete
Construction (3rd, 1990, Wishaw, England, Elsevier Applied Science.
16. Win, P. P.; Watanabe, M., and Machida, A., Penetration profile of chloride ion in cracked
reinforced concrete, Cement and Concrete Research, 2004, 34 (7), pages 1073 to 1079.
17. Yeomans, S. R., Galvanized Steel in Concrete: An Overview, in Galvanized Steel Reinforcement
in Concrete, S. R. Yeomans, Editor, 2004, International Lead Zinc Research Organization, North
Carolina, USA.
18. Tonini, D. E. and Dean, S. W., Chloride corrosion of steel in concrete, ASTM-STP 629, 1976.
19. Cornet, I. and Bresler, B., Corrosion of steel and galvanized steel in concrete, Materials Protection,
1966, 5 (5), pages 69 to 72.
20. Yeomans, S.R., Performance of Black, Galvanized and Epoxy-Coated Reinforcing Steels in
Chloride-Contaminated Concrete, Corrosion, 1994, 50 (1), pages 72 to 81.
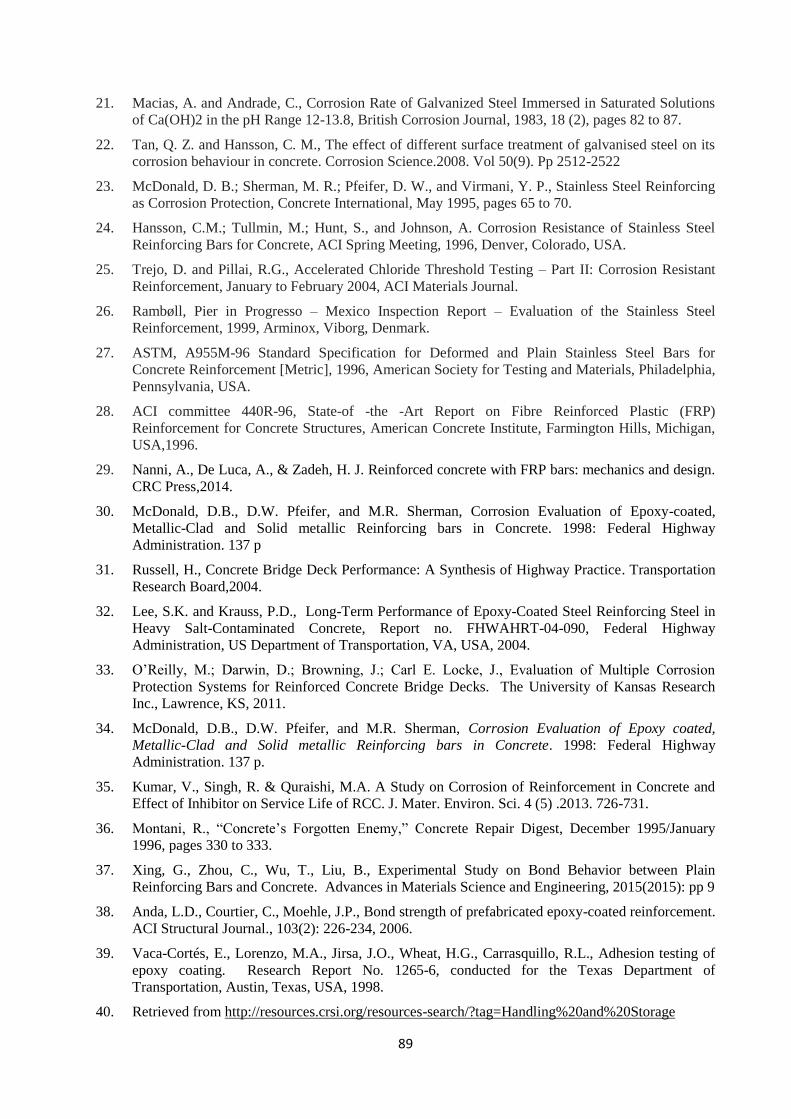
89
21. Macias, A. and Andrade, C., Corrosion Rate of Galvanized Steel Immersed in Saturated Solutions
of Ca(OH)2 in the pH Range 12-13.8, British Corrosion Journal, 1983, 18 (2), pages 82 to 87.
22. Tan, Q. Z. and Hansson, C. M., The effect of different surface treatment of galvanised steel on its
corrosion behaviour in concrete. Corrosion Science.2008. Vol 50(9). Pp 2512-2522
23. McDonald, D. B.; Sherman, M. R.; Pfeifer, D. W., and Virmani, Y. P., Stainless Steel Reinforcing
as Corrosion Protection, Concrete International, May 1995, pages 65 to 70.
24. Hansson, C.M.; Tullmin, M.; Hunt, S., and Johnson, A. Corrosion Resistance of Stainless Steel
Reinforcing Bars for Concrete, ACI Spring Meeting, 1996, Denver, Colorado, USA.
25. Trejo, D. and Pillai, R.G., Accelerated Chloride Threshold Testing – Part II: Corrosion Resistant
Reinforcement, January to February 2004, ACI Materials Journal.
26. Rambøll, Pier in Progresso – Mexico Inspection Report – Evaluation of the Stainless Steel
Reinforcement, 1999, Arminox, Viborg, Denmark.
27. ASTM, A955M-96 Standard Specification for Deformed and Plain Stainless Steel Bars for
Concrete Reinforcement [Metric], 1996, American Society for Testing and Materials, Philadelphia,
Pennsylvania, USA.
28. ACI committee 440R-96, State-of -the -Art Report on Fibre Reinforced Plastic (FRP)
Reinforcement for Concrete Structures, American Concrete Institute, Farmington Hills, Michigan,
USA,1996.
29. Nanni, A., De Luca, A., & Zadeh, H. J. Reinforced concrete with FRP bars: mechanics and design.
CRC Press,2014.
30. McDonald, D.B., D.W. Pfeifer, and M.R. Sherman, Corrosion Evaluation of Epoxy-coated,
Metallic-Clad and Solid metallic Reinforcing bars in Concrete. 1998: Federal Highway
Administration. 137 p
31. Russell, H., Concrete Bridge Deck Performance: A Synthesis of Highway Practice. Transportation
Research Board,2004.
32. Lee, S.K. and Krauss, P.D., Long-Term Performance of Epoxy-Coated Steel Reinforcing Steel in
Heavy Salt-Contaminated Concrete, Report no. FHWAHRT-04-090, Federal Highway
Administration, US Department of Transportation, VA, USA, 2004.
33. ’Reilly, M.; Darwin, D.; Browning, J.; Carl E. ocke, J., Evaluation of Multiple Corrosion
Protection Systems for Reinforced Concrete Bridge Decks. The University of Kansas Research
Inc., Lawrence, KS, 2011.
34. McDonald, D.B., D.W. Pfeifer, and M.R. Sherman, Corrosion Evaluation of Epoxy coated,
Metallic-Clad and Solid metallic Reinforcing bars in Concrete. 1998: Federal Highway
Administration. 137 p.
35. Kumar, V., Singh, R. & Quraishi, M.A. A Study on Corrosion of Reinforcement in Concrete and
Effect of Inhibitor on Service Life of RCC. J. Mater. Environ. Sci. 4 (5) .2013. 726-731.
36. Montani, R., “Concrete’s orgotten Enemy,” Concrete Repair Digest, December 1995/January
1996, pages 330 to 333.
37. Xing, G., Zhou, C., Wu, T., Liu, B., Experimental Study on Bond Behavior between Plain
Reinforcing Bars and Concrete. Advances in Materials Science and Engineering, 2015(2015): pp 9
38. Anda, L.D., Courtier, C., Moehle, J.P., Bond strength of prefabricated epoxy-coated reinforcement.
ACI Structural Journal., 103(2): 226-234, 2006.
39. Vaca-Cortés, E., Lorenzo, M.A., Jirsa, J.O., Wheat, H.G., Carrasquillo, R.L., Adhesion testing of
epoxy coating. Research Report No. 1265-6, conducted for the Texas Department of
Transportation, Austin, Texas, USA, 1998.
40. Retrieved from http://resources.crsi.org/resources-search/?tag=Handling%20and%20Storage
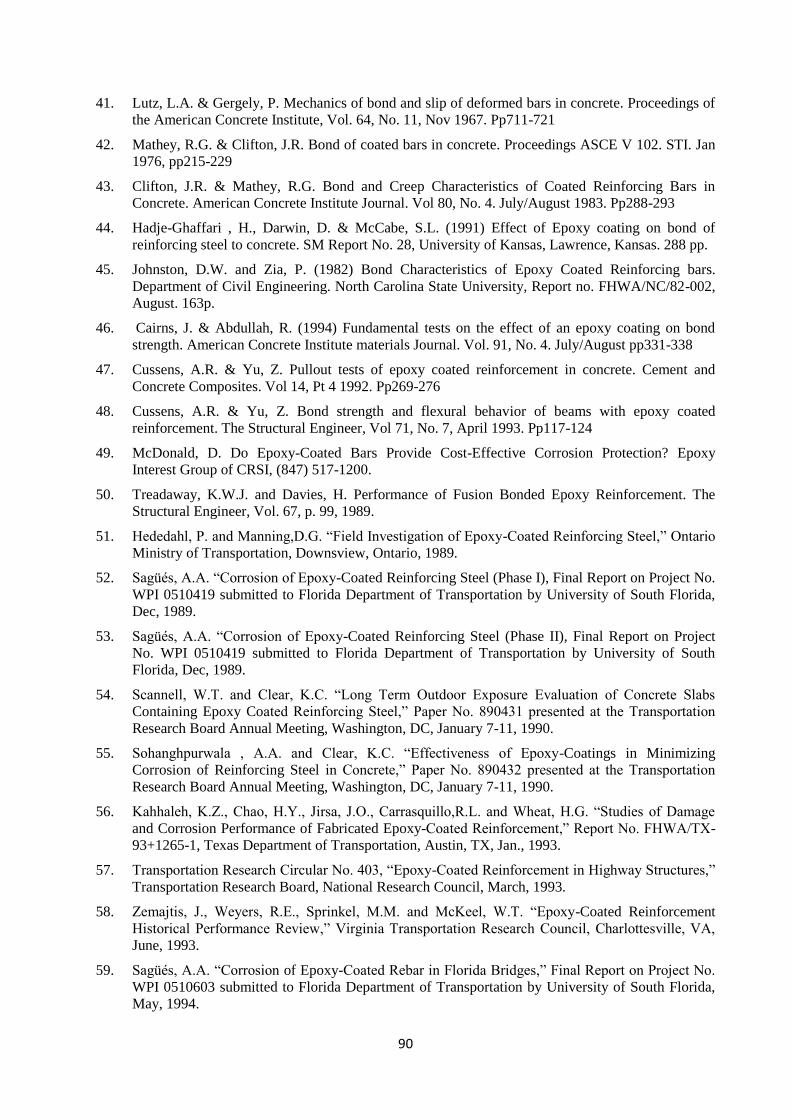
90
41. Lutz, L.A. & Gergely, P. Mechanics of bond and slip of deformed bars in concrete. Proceedings of
the American Concrete Institute, Vol. 64, No. 11, Nov 1967. Pp711-721
42. Mathey, R.G. & Clifton, J.R. Bond of coated bars in concrete. Proceedings ASCE V 102. STI. Jan
1976, pp215-229
43. Clifton, J.R. & Mathey, R.G. Bond and Creep Characteristics of Coated Reinforcing Bars in
Concrete. American Concrete Institute Journal. Vol 80, No. 4. July/August 1983. Pp288-293
44. Hadje-Ghaffari , H., Darwin, D. & McCabe, S.L. (1991) Effect of Epoxy coating on bond of
reinforcing steel to concrete. SM Report No. 28, University of Kansas, Lawrence, Kansas. 288 pp.
45. Johnston, D.W. and Zia, P. (1982) Bond Characteristics of Epoxy Coated Reinforcing bars.
Department of Civil Engineering. North Carolina State University, Report no. FHWA/NC/82-002,
August. 163p.
46. Cairns, J. & Abdullah, R. (1994) Fundamental tests on the effect of an epoxy coating on bond
strength. American Concrete Institute materials Journal. Vol. 91, No. 4. July/August pp331-338
47. Cussens, A.R. & Yu, Z. Pullout tests of epoxy coated reinforcement in concrete. Cement and
Concrete Composites. Vol 14, Pt 4 1992. Pp269-276
48. Cussens, A.R. & Yu, Z. Bond strength and flexural behavior of beams with epoxy coated
reinforcement. The Structural Engineer, Vol 71, No. 7, April 1993. Pp117-124
49. McDonald, D. Do Epoxy-Coated Bars Provide Cost-Effective Corrosion Protection? Epoxy
Interest Group of CRSI, (847) 517-1200.
50. Treadaway, K.W.J. and Davies, H. Performance of Fusion Bonded Epoxy Reinforcement. The
Structural Engineer, Vol. 67, p. 99, 1989.
51. ededahl, P. and Manning,D.G. “ ield Investigation of Epoxy-Coated Reinforcing Steel,” ntario
Ministry of Transportation, Downsview, Ontario, 1989.
52. Sagüés, A.A. “Corrosion of Epoxy-Coated Reinforcing Steel (Phase I), Final Report on Project No.
WPI 0510419 submitted to Florida Department of Transportation by University of South Florida,
Dec, 1989.
53. Sagüés, A.A. “Corrosion of Epoxy-Coated Reinforcing Steel (Phase II), Final Report on Project
No. WPI 0510419 submitted to Florida Department of Transportation by University of South
Florida, Dec, 1989.
54. Scannell, W.T. and Clear, K.C. “ ong Term utdoor Exposure Evaluation of Concrete Slabs
Containing Epoxy Coated Reinforcing Steel,” Paper No. 890 1 presented at the Transportation
Research Board Annual Meeting, Washington, DC, January 7-11, 1990.
55. Sohanghpurwala , A.A. and Clear, K.C. “Effectiveness of Epoxy-Coatings in Minimizing
Corrosion of Reinforcing Steel in Concrete,” Paper No. 890 presented at the Transportation
Research Board Annual Meeting, Washington, DC, January 7-11, 1990.
56. Kahhaleh, K.Z., Chao, .Y., Jirsa, J. ., Carrasquillo,R. . and Wheat, .G. “Studies of Damage
and Corrosion Performance of Fabricated Epoxy-Coated Reinforcement,” Report No. WA/TX-
93+1265-1, Texas Department of Transportation, Austin, TX, Jan., 1993.
57. Transportation Research Circular No. 0 , “Epoxy-Coated Reinforcement in ighway Structures,”
Transportation Research Board, National Research Council, March, 1993.
58. Zemajtis, J., Weyers, R.E., Sprinkel, M.M. and McKeel, W.T. “Epoxy-Coated Reinforcement
istorical Performance Review,” Virginia Transportation Research Council, Charlottesville, VA,
June, 1993.
59. Sagüés, A.A. “Corrosion of Epoxy-Coated Rebar in lorida Bridges,” inal Report on Project No.
WPI 0510603 submitted to Florida Department of Transportation by University of South Florida,
May, 1994.
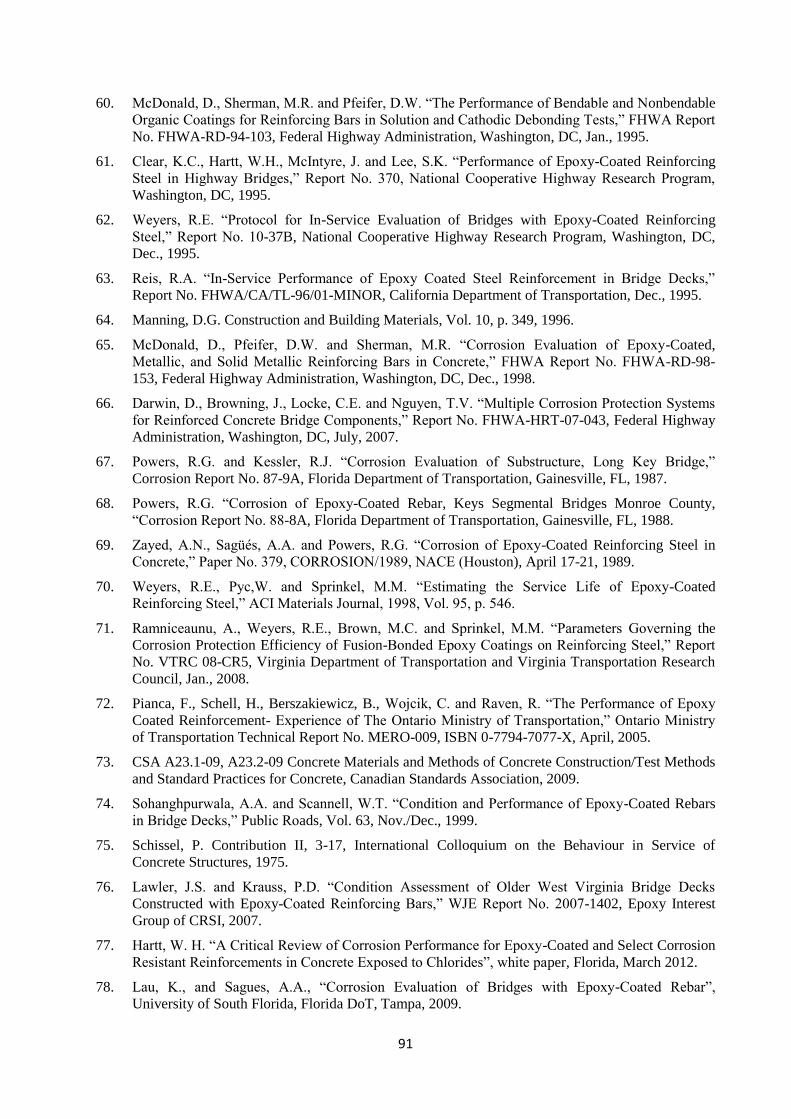
91
60. McDonald, D., Sherman, M.R. and Pfeifer, D.W. “The Performance of Bendable and Nonbendable
rganic Coatings for Reinforcing Bars in Solution and Cathodic Debonding Tests,” WA Report
No. FHWA-RD-94-103, Federal Highway Administration, Washington, DC, Jan., 1995.
61. Clear, K.C., artt, W. ., McIntyre, J. and ee, S.K. “Performance of Epoxy-Coated Reinforcing
Steel in ighway Bridges,” Report No. 70, National Cooperative ighway Research Program,
Washington, DC, 1995.
62. Weyers, R.E. “Protocol for In-Service Evaluation of Bridges with Epoxy-Coated Reinforcing
Steel,” Report No. 10-37B, National Cooperative Highway Research Program, Washington, DC,
Dec., 1995.
63. Reis, R.A. “In-Service Performance of Epoxy Coated Steel Reinforcement in Bridge Decks,”
Report No. FHWA/CA/TL-96/01-MINOR, California Department of Transportation, Dec., 1995.
64. Manning, D.G. Construction and Building Materials, Vol. 10, p. 349, 1996.
65. McDonald, D., Pfeifer, D.W. and Sherman, M.R. “Corrosion Evaluation of Epoxy-Coated,
Metallic, and Solid Metallic Reinforcing Bars in Concrete,” WA Report No. WA-RD-98-
153, Federal Highway Administration, Washington, DC, Dec., 1998.
66. Darwin, D., Browning, J., ocke, C.E. and Nguyen, T.V. “Multiple Corrosion Protection Systems
for Reinforced Concrete Bridge Components,” Report No. WA-HRT-07-043, Federal Highway
Administration, Washington, DC, July, 2007.
67. Powers, R.G. and Kessler, R.J. “Corrosion Evaluation of Substructure, ong Key Bridge,”
Corrosion Report No. 87-9A, Florida Department of Transportation, Gainesville, FL, 1987.
68. Powers, R.G. “Corrosion of Epoxy-Coated Rebar, Keys Segmental Bridges Monroe County,
“Corrosion Report No. 88-8A, Florida Department of Transportation, Gainesville, FL, 1988.
69. Zayed, A.N., Sagüés, A.A. and Powers, R.G. “Corrosion of Epoxy-Coated Reinforcing Steel in
Concrete,” Paper No. 79, C RR SI N/1989, NACE ( ouston), April 17-21, 1989.
70. Weyers, R.E., Pyc,W. and Sprinkel, M.M. “Estimating the Service ife of Epoxy-Coated
Reinforcing Steel,” ACI Materials Journal, 1998, Vol. 95, p. 5 6.
71. Ramniceaunu, A., Weyers, R.E., Brown, M.C. and Sprinkel, M.M. “Parameters Governing the
Corrosion Protection Efficiency of Fusion-Bonded Epoxy Coatings on Reinforcing Steel,” Report
No. VTRC 08-CR5, Virginia Department of Transportation and Virginia Transportation Research
Council, Jan., 2008.
72. Pianca, F., Schell, H., Berszakiewicz, B., Wojcik, C. and Raven, R. “The Performance of Epoxy
Coated Reinforcement- Experience of The ntario Ministry of Transportation,” ntario Ministry
of Transportation Technical Report No. MERO-009, ISBN 0-7794-7077-X, April, 2005.
73. CSA A23.1-09, A23.2-09 Concrete Materials and Methods of Concrete Construction/Test Methods
and Standard Practices for Concrete, Canadian Standards Association, 2009.
74. Sohanghpurwala, A.A. and Scannell, W.T. “Condition and Performance of Epoxy-Coated Rebars
in Bridge Decks,” Public Roads, Vol. 63, Nov./Dec., 1999.
75. Schissel, P. Contribution II, 3-17, International Colloquium on the Behaviour in Service of
Concrete Structures, 1975.
76. awler, J.S. and Krauss, P.D. “Condition Assessment of lder West Virginia Bridge Decks
Constructed with Epoxy-Coated Reinforcing Bars,” WJE Report No. 007-1402, Epoxy Interest
Group of CRSI, 2007.
77. artt, W. . “A Critical Review of Corrosion Performance for Epoxy-Coated and Select Corrosion
Resistant Reinforcements in Concrete Exposed to Chlorides”, white paper, Florida, March 2012.
78. au, K., and Sagues, A.A., “Corrosion Evaluation of Bridges with Epoxy-Coated Rebar”,
University of South Florida, Florida DoT, Tampa, 2009.
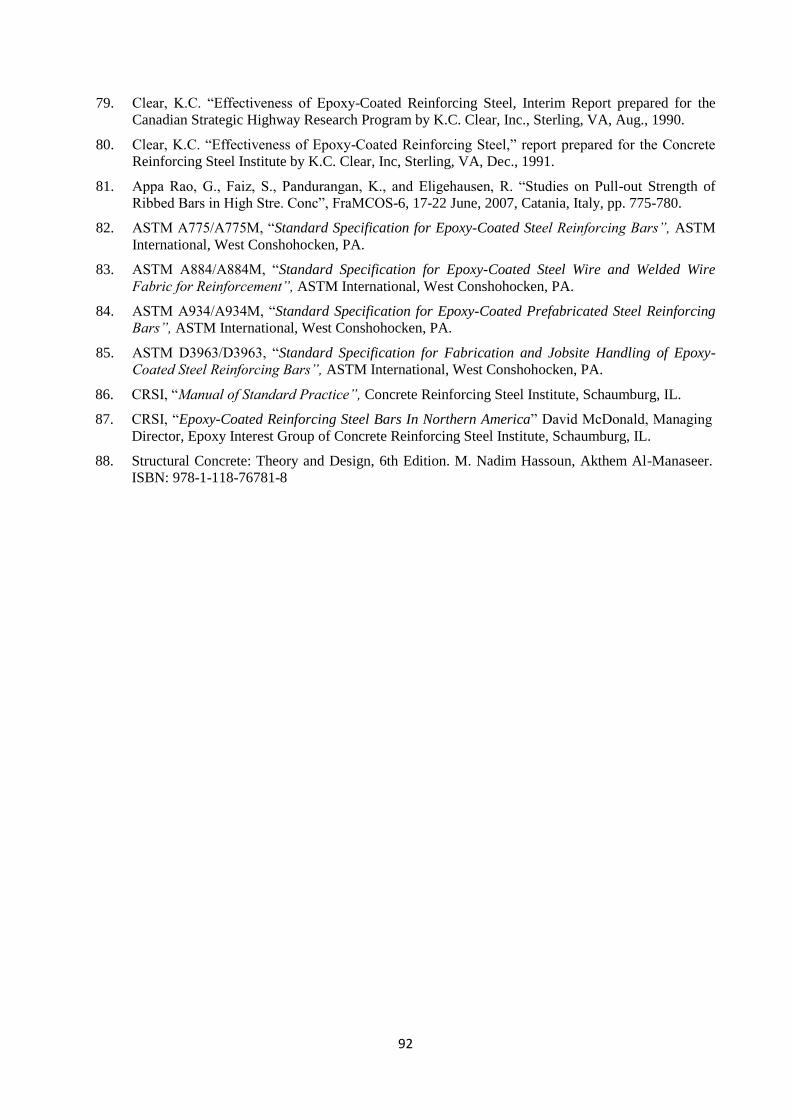
92
79. Clear, K.C. “Effectiveness of Epoxy-Coated Reinforcing Steel, Interim Report prepared for the
Canadian Strategic Highway Research Program by K.C. Clear, Inc., Sterling, VA, Aug., 1990.
80. Clear, K.C. “Effectiveness of Epoxy-Coated Reinforcing Steel,” report prepared for the Concrete
Reinforcing Steel Institute by K.C. Clear, Inc, Sterling, VA, Dec., 1991.
81. Appa Rao, G., aiz, S., Pandurangan, K., and Eligehausen, R. “Studies on Pull-out Strength of
Ribbed Bars in igh Stre. Conc”, raMC S-6, 17-22 June, 2007, Catania, Italy, pp. 775-780.
82. ASTM A775/A775M, “Standard Specification for Epoxy-Coated Steel Reinforcing Bars”, ASTM
International, West Conshohocken, PA.
83. ASTM A88 /A88 M, “Standard Specification for Epoxy-Coated Steel Wire and Welded Wire
Fabric for Reinforcement”, ASTM International, West Conshohocken, PA.
84. ASTM A9 /A9 M, “Standard Specification for Epoxy-Coated Prefabricated Steel Reinforcing
Bars”, ASTM International, West Conshohocken, PA.
85. ASTM D 96 /D 96 , “Standard Specification for Fabrication and Jobsite Handling of Epoxy-
Coated Steel Reinforcing Bars”, ASTM International, West Conshohocken, PA.
86. CRSI, “Manual of Standard Practice”, Concrete Reinforcing Steel Institute, Schaumburg, IL.
87. CRSI, “Epoxy-Coated Reinforcing Steel Bars In Northern America” David McDonald, Managing
Director, Epoxy Interest Group of Concrete Reinforcing Steel Institute, Schaumburg, IL.
88. Structural Concrete: Theory and Design, 6th Edition. M. Nadim Hassoun, Akthem Al-Manaseer.
ISBN: 978-1-118-76781-8