Embed Size (px)
Citation preview
R Y E R S O N I N V E S T O R P R E S E N T A T I O N
November 2016
Bank of America Merrill Lynch Leveraged Finance Conference

2
IMPORTANT INFORMATION ABOUT RYERSON HOLDING CORPORATION These materials do not constitute an offer or solicitation to purchase or sell securities of Ryerson Holding Corporation (“Ryerson”) and no investment decision should be made based upon the information provided herein. Ryerson strongly urges you to review its filings with the Securities and Exchange Commission, which can be found at http://ir.ryerson.com/financial-information/sec-filings/default.aspx. This site also provides additional information about Ryerson.
SAFE HARBOR PROVISION Certain statements made in this presentation and other written or oral statements made by or on behalf of the Company constitute “forward-looking statements” within the meaning of the federal securities laws, including statements regarding our future performance, as well as management’s expectations, beliefs, intentions, plans, estimates or projections relating to the future. Such statements can be identified by the use of forward-looking terminology such as “believes,” “expects,” “may,” “estimates,” “will,” “should,” “plans” or “anticipates” or the negative thereof or other variations thereon or comparable terminology, or by discussions of strategy. The Company cautions that any such forward-looking statements are not guarantees of future performance and may involve significant risks and uncertainties, and that actual results may vary materially from those in the forward-looking statements as a result of various factors. Among the factors that significantly impact the metals distribution industry and our business are: the cyclicality of our business; the highly competitive, volatile, and fragmented market in which we operate; fluctuating metal prices; our substantial indebtedness and the covenants in instruments governing such indebtedness; the integration of acquired operations; regulatory and other operational risks associated with our operations located inside and outside of the United States; work stoppages; obligations under certain employee retirement benefit plans; the ownership of a majority of our equity securities by a single investor group; currency fluctuations; and consolidation in the metals producer industry. Forward-looking statements should, therefore, be considered in light of various factors, including those set forth above and those set forth under “Risk Factors” in our annual report on Form 10-K for the year ended December 31, 2015 and in our other filings with the Securities and Exchange Commission. Moreover, we caution against placing undue reliance on these statements, which speak only as of the date they were made. The Company does not undertake any obligation to publicly update or revise any forward-looking statements to reflect future events or circumstances, new information or otherwise.
NON-GAAP MEASURES Certain measures contained in these slides or the related presentation are not measures calculated in accordance with generally accepted accounting principles (“GAAP”). They should not be considered a replacement for GAAP results. Non-GAAP financial measures appearing in these slides are identified in the footnotes. A reconciliation of these non-GAAP measures to the most directly comparable GAAP financial measures is included in the Appendix.
R Y E R S O N I N V E S T O R P R E S E N T A T I O N
BUSINESS OVERVIEW E D D I E L E H N E R │ P R E S I D E N T A N D C H I E F E X E C U T I V E O F F I C E R

R Y E R S O N I N V E S T O R P R E S E N T A T I O N
Ryerson Highlights
4
Differentiated by an interconnected service center network driven by speed, scale, value-add, culture, and analytics
A market-leading metals service center offering a broad range of products to a diversified group of industrial manufacturing customers
Benefitting from expected industry rationalization as metals consumption and fixed asset investment recover toward historical averages
Built for all market cycles as evidenced by continued market share growth, strong margins, cash generation, and improving quality of earnings
Executing our growth strategy through increased value-added processing, deployment of innovative sales channels, supply chain mapping, and accretive M&A
Improved our capital structure by deleveraging the balance sheet and extending our significant debt maturities to 2021
Ryerson’s transformation is gaining momentum, positioning us to benefit from potential secular industrial growth
R Y E R S O N I N V E S T O R P R E S E N T A T I O N
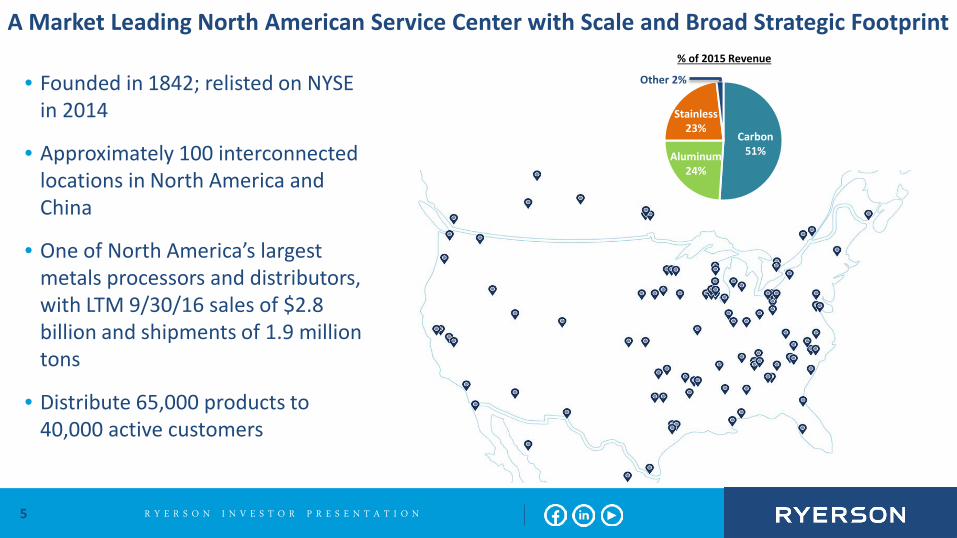
A Market Leading North American Service Center with Scale and Broad Strategic Footprint
5
• Founded in 1842; relisted on NYSE in 2014
• Approximately 100 interconnected locations in North America and China
• One of North America’s largest metals processors and distributors, with LTM 9/30/16 sales of $2.8 billion and shipments of 1.9 million tons
• Distribute 65,000 products to 40,000 active customers
% of 2015 Revenue
Other 2%
Stainless 23%
Aluminum 24%
Carbon 51%

6
The US Trade Deficit: Does This Seem Normal to You?
7
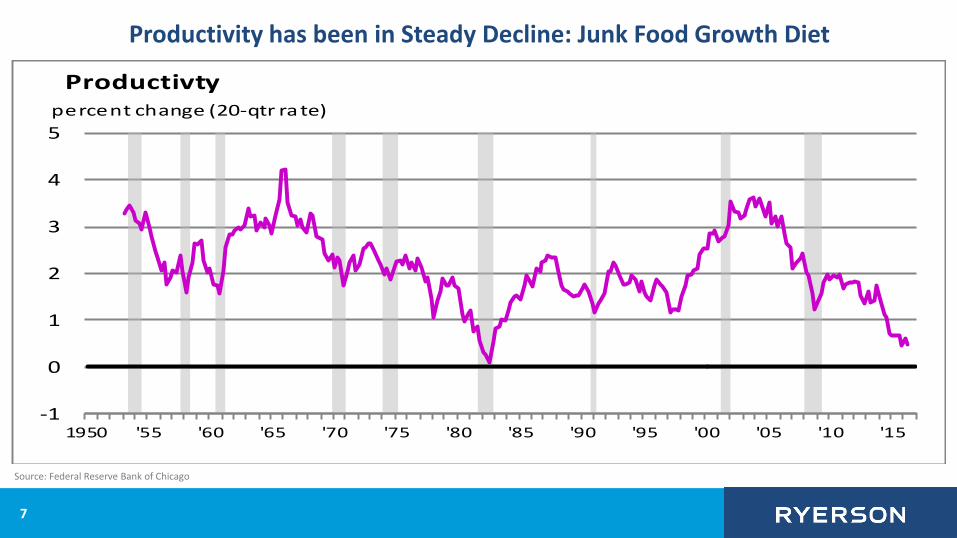
Productivity has been in Steady Decline: Junk Food Growth Diet
-1
0
1
2
3
4
5
1950 '55 '60 '65 '70 '75 '80 '85 '90 '95 '00 '05 '10 '15
Productivtypercent change (20-qtr rate)
Source: Federal Reserve Bank of Chicago
8
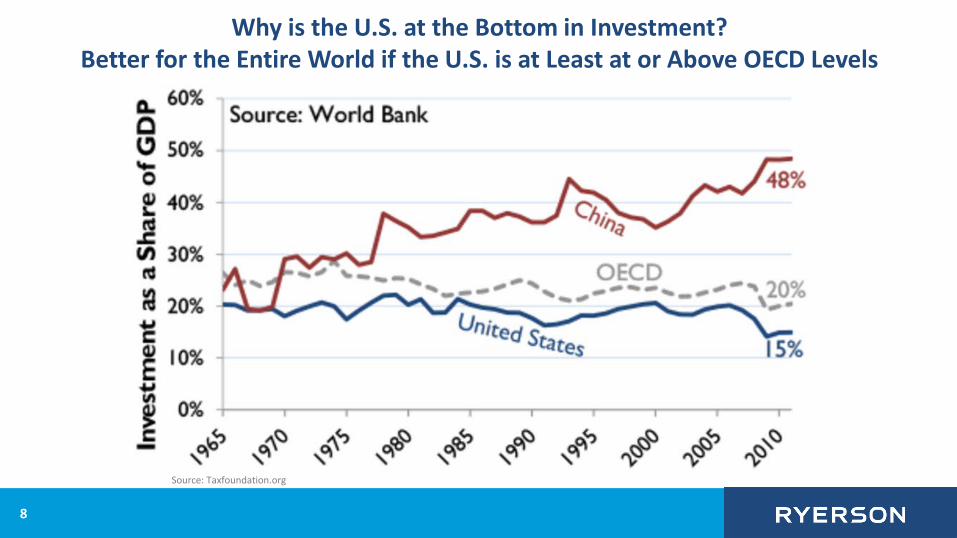
Why is the U.S. at the Bottom in Investment? Better for the Entire World if the U.S. is at Least at or Above OECD Levels
Source: Taxfoundation.org
R Y E R S O N I N V E S T O R P R E S E N T A T I O N
0.8
1.0
1.2
1.4
1.6
1.8
2.0
Pric
e in
dex
to D
ec. 3
1, 2
015
CRU HRCLME NickelLME Aluminum + Midwest Premium
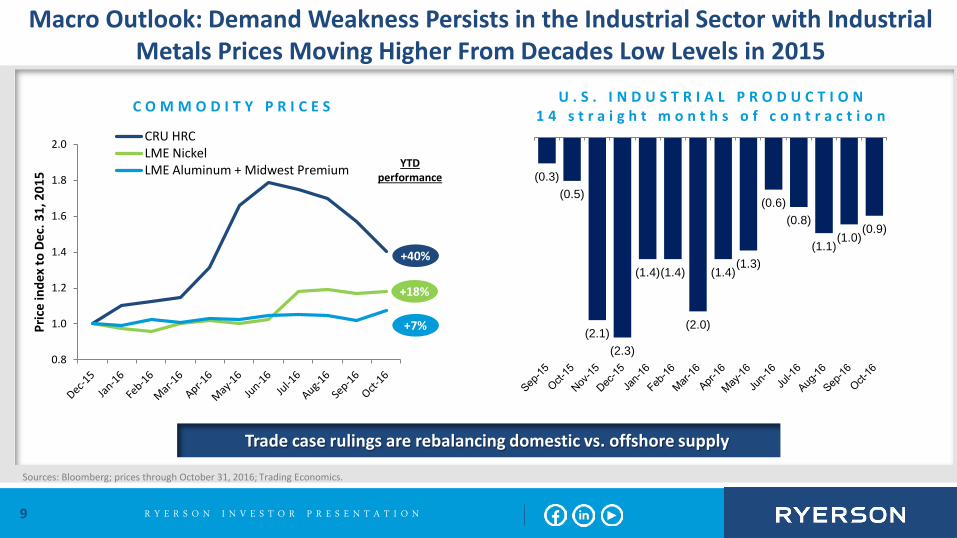
Macro Outlook: Demand Weakness Persists in the Industrial Sector with Industrial Metals Prices Moving Higher From Decades Low Levels in 2015
9
Sources: Bloomberg; prices through October 31, 2016; Trading Economics.
Trade case rulings are rebalancing domestic vs. offshore supply
U . S . I N D U S T R I A L P R O D U C T I O N 1 4 s t r a i g h t m o n t h s o f c o n t r a c t i o n
YTD performance
+7%
+18%
+40%
C O M M O D I T Y P R I C E S
(0.3) (0.5)
(2.1) (2.3)
(1.4) (1.4)
(2.0)
(1.4) (1.3)
(0.6) (0.8)
(1.1) (1.0)
(0.9)
R Y E R S O N I N V E S T O R P R E S E N T A T I O N
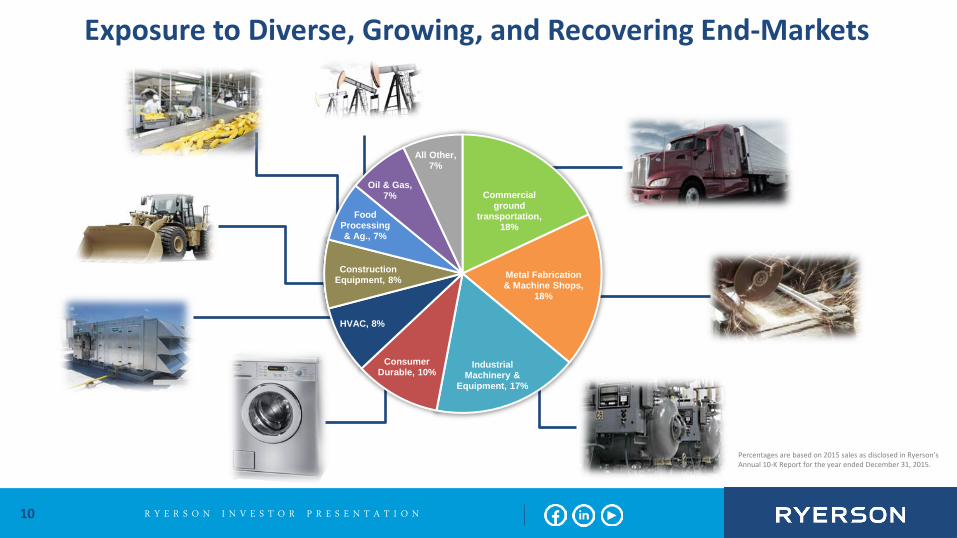
Exposure to Diverse, Growing, and Recovering End-Markets
10
Commercial ground
transportation, 18%
Metal Fabrication & Machine Shops,
18%
Industrial Machinery &
Equipment, 17%
Consumer Durable, 10%
HVAC, 8%
Construction Equipment, 8%
Food Processing & Ag., 7%
Oil & Gas, 7%
All Other, 7%
Percentages are based on 2015 sales as disclosed in Ryerson’s Annual 10-K Report for the year ended December 31, 2015.
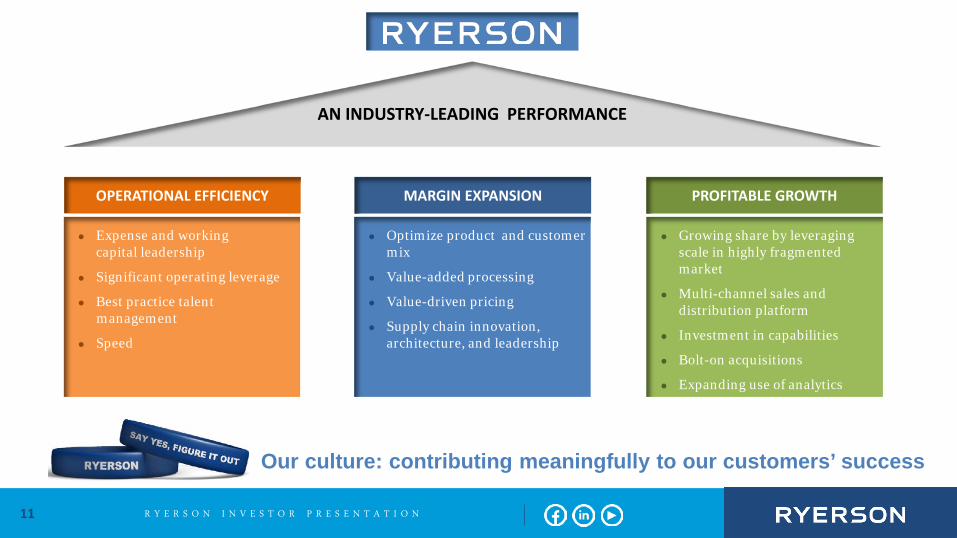
R Y E R S O N I N V E S T O R P R E S E N T A T I O N 11
MARGIN EXPANSION OPERATIONAL EFFICIENCY
Growing share by leveraging scale in highly fragmented market
Multi-channel sales and distribution platform
Investment in capabilities
Bolt-on acquisitions
Expanding use of analytics
PROFITABLE GROWTH
AN INDUSTRY-LEADING PERFORMANCE
Optimize product and customer mix
Value-added processing
Value-driven pricing
Supply chain innovation, architecture, and leadership
Expense and working capital leadership
Significant operating leverage
Best practice talent management
Speed
Our culture: contributing meaningfully to our customers’ success
R Y E R S O N I N V E S T O R P R E S E N T A T I O N
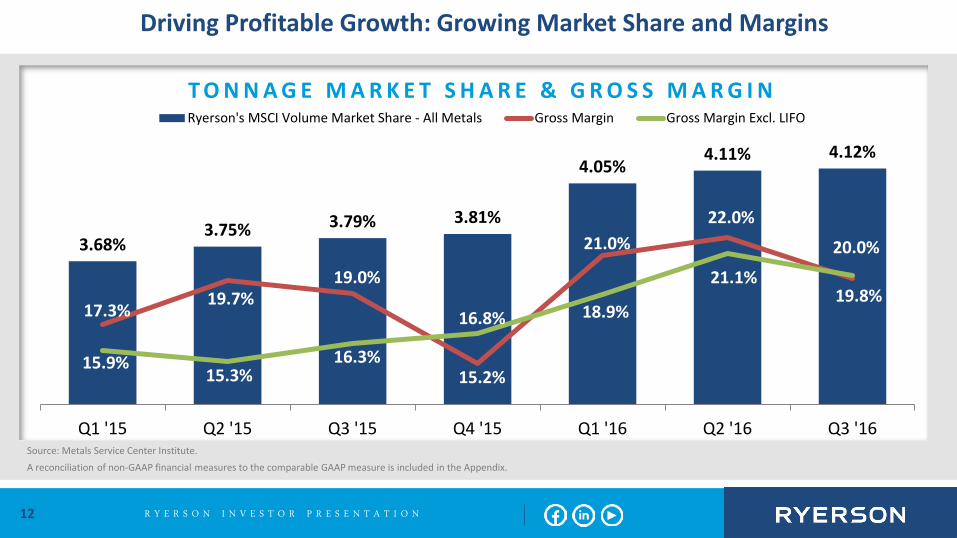
3.68% 3.75% 3.79% 3.81%
4.05% 4.11% 4.12%
17.3% 19.7%
19.0%
15.2%
21.0% 22.0%
19.8%
15.9% 15.3%
16.3%
16.8% 18.9%
21.1%
20.0%
Q1 '15 Q2 '15 Q3 '15 Q4 '15 Q1 '16 Q2 '16 Q3 '16
Ryerson's MSCI Volume Market Share - All Metals Gross Margin Gross Margin Excl. LIFO
12
Driving Profitable Growth: Growing Market Share and Margins
Source: Metals Service Center Institute. A reconciliation of non-GAAP financial measures to the comparable GAAP measure is included in the Appendix.
T O N N A G E M A R K E T S H A R E & G R O S S M A R G I N

R Y E R S O N I N V E S T O R P R E S E N T A T I O N
Proven Operational Efficiency and Industry Leadership: Consistent Execution of Fundamentals
13
82 84
82 80
78
110 109 106
109 112
2012 2013 2014 2015 Q3 2016
Competitor averages are based on Ryerson’s analysis of financial information disclosed in competitors’ SEC filings. Competitor averages include Reliance Steel & Aluminum, Olympic Steel, Kloeckner Metals, Russel Metals, and A.M. Castle. Expense % excluding D&A and one-time items is a non-GAAP financial measure; A reconciliation of this non-GAAP financial measure to the comparable GAAP measure is included in the Appendix.
Ryerson Competitor Averages
11.5% 12.5%
11.9% 12.9%
13.8%
16.5% 17.5% 17.6%
19.1%
20.7%
2012 2013 2014 2015 2016 YTD
E X P E N S E P E R C E N T A G E E X C L U D I N G D & A A N D O N E - T I M E I T E M S D A Y S O F S U P P L Y
R Y E R S O N I N V E S T O R P R E S E N T A T I O N 14
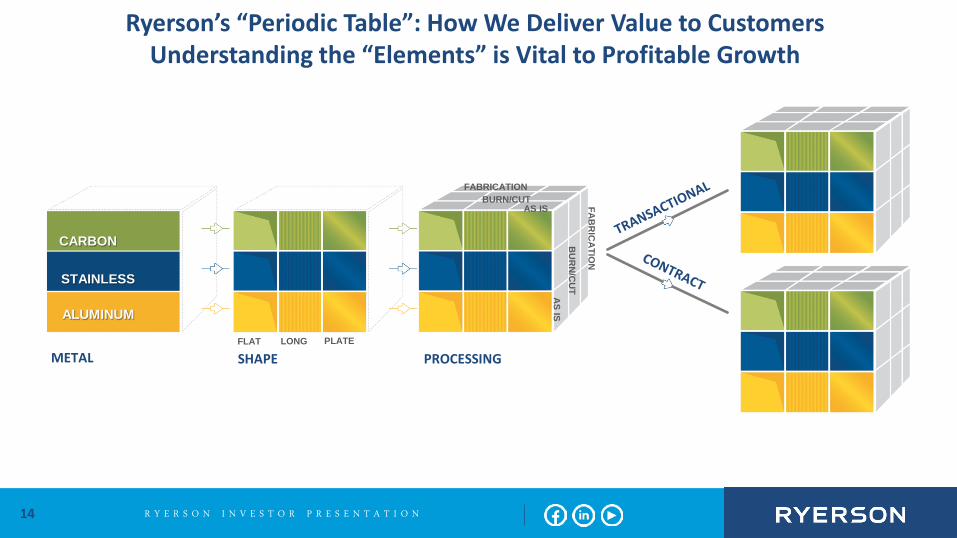
METAL SHAPE PROCESSING
CARBON
STAINLESS
ALUMINUM
FABRICATION BURN/CUT
AS IS
FLAT LONG PLATE
FAB
RIC
ATIO
N
BU
RN
/CU
T AS IS
Ryerson’s “Periodic Table”: How We Deliver Value to Customers Understanding the “Elements” is Vital to Profitable Growth
R Y E R S O N I N V E S T O R P R E S E N T A T I O N 15
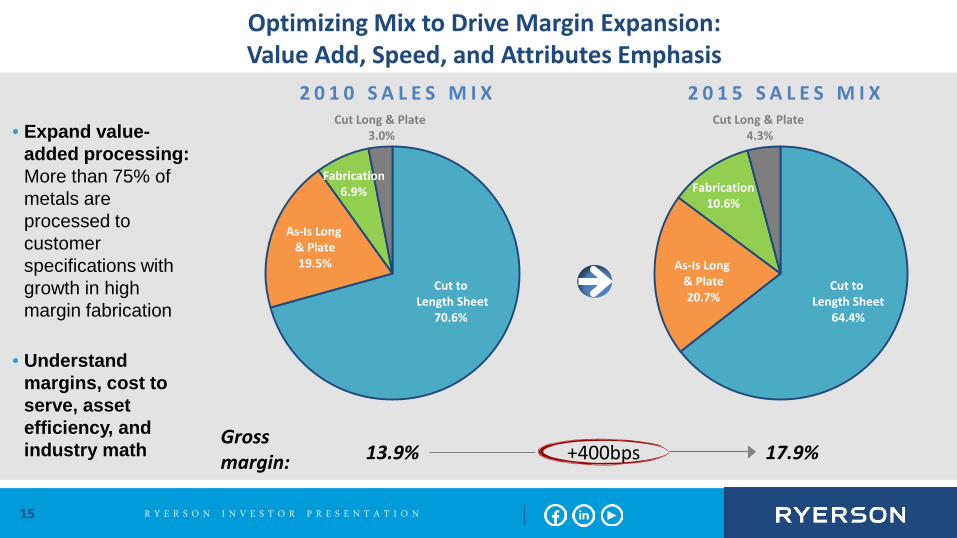
2 0 1 5 S A L E S M I X 2 0 1 0 S A L E S M I X
• Expand value-added processing: More than 75% of metals are processed to customer specifications with growth in high margin fabrication
• Understand margins, cost to serve, asset efficiency, and industry math
Optimizing Mix to Drive Margin Expansion: Value Add, Speed, and Attributes Emphasis
Gross margin: 13.9% 17.9% +400bps
Cut Long & Plate 3.0%
Fabrication 6.9%
As-Is Long & Plate 19.5%
Cut to Length Sheet
70.6%
Cut Long & Plate 4.3%
Fabrication 10.6%
As-Is Long & Plate 20.7%
Cut to Length Sheet
64.4%

R Y E R S O N I N V E S T O R P R E S E N T A T I O N
Our Strategic Priorities Step-by-Step: A Differentiated Approach
16
8
Ryerson virtual warehouse
7
Ryerson e-commerce 2.0 and 3.0
5
Build out long products depots and inventory
profile
6
Grow stainless products market share through supply chain leverage
4 Develop and diversify
vertical markets
3 Renewed emphasis
on coil / sheet
1 2
Ryerson advanced processing
Scale prospecting and call centers

R Y E R S O N I N V E S T O R P R E S E N T A T I O N
70k
40k
25k 65k
~930k
Unique accounts served(2011-2015)
Avg. unique accounts / yr(2011-2015)
Targeted customer opportunity Potential unique accounts / yr Estimated universe of metalbuying customers
Significant Growth Potential Around Smart Use of Analytics Commercial Bandwidth is the Key
17
We have a large database of customer
accounts…
…potentially increasing both margin & market share
...but on average we only sell to 57% of them each year
Attractive pool of profitable prior customers
Using data analytics and advanced sales techniques, we are targeting attractive account opportunities…
Ryerson’s existing customer base External
Source: Estimated universe of metal buying customers from Ryerson analysis of Metals Service Center Institute data.
R Y E R S O N I N V E S T O R P R E S E N T A T I O N 18
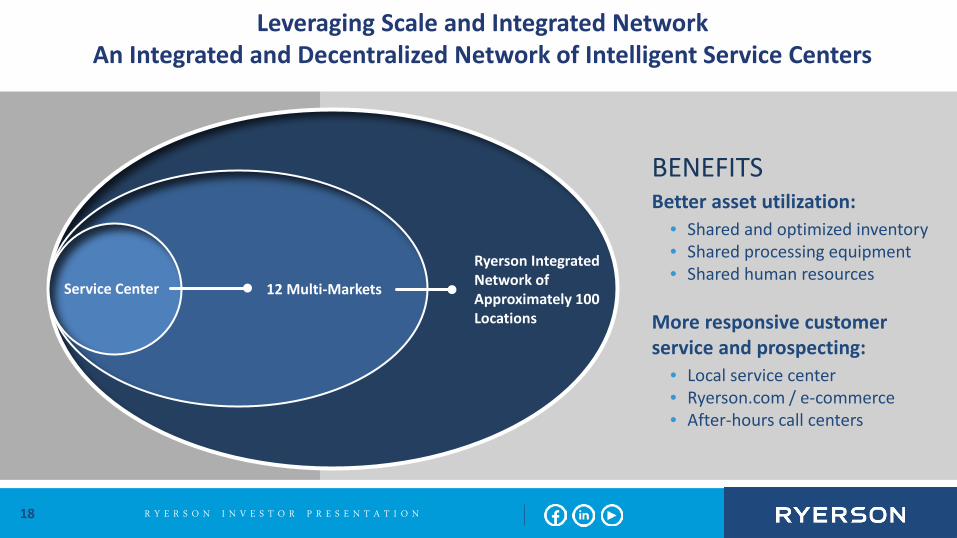
Service Center 12 Multi-Markets
Ryerson Integrated Network of Approximately 100 Locations
BENEFITS Better asset utilization:
• Shared and optimized inventory • Shared processing equipment • Shared human resources
More responsive customer service and prospecting:
• Local service center • Ryerson.com / e-commerce • After-hours call centers
Leveraging Scale and Integrated Network An Integrated and Decentralized Network of Intelligent Service Centers

R Y E R S O N I N V E S T O R P R E S E N T A T I O N
SCALE
VALUE-ADD
SPEED CULTURE
ANALYTICS
Ryerson’s DNA – The “How” Really Matters
19
R Y E R S O N I N V E S T O R P R E S E N T A T I O N 20
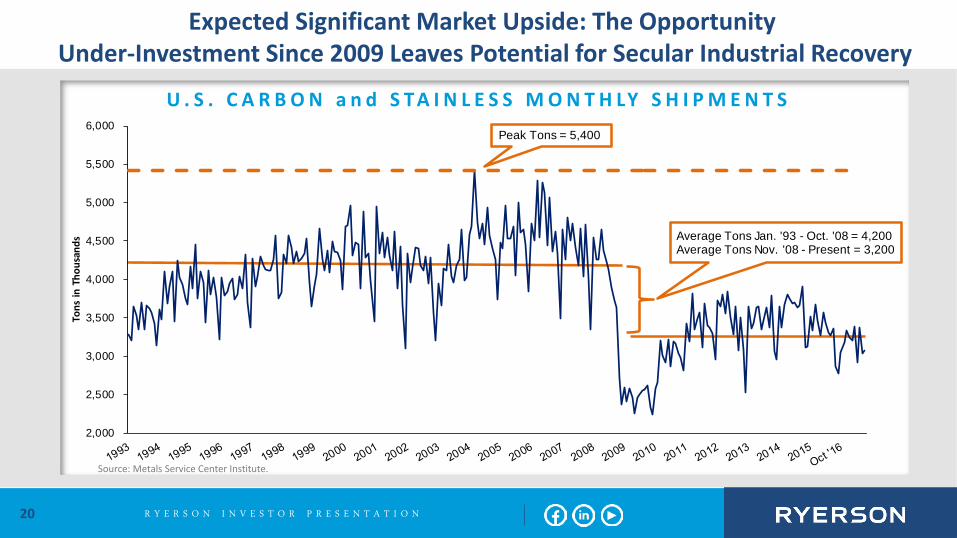
Source: Metals Service Center Institute.
Expected Significant Market Upside: The Opportunity Under-Investment Since 2009 Leaves Potential for Secular Industrial Recovery
U . S . C A R B O N a n d S T A I N L E S S M O N T H LY S H I P M E N T S
2,000
2,500
3,000
3,500
4,000
4,500
5,000
5,500
6,000
Tons
in T
hous
ands Average Tons Jan. '93 - Oct. '08 = 4,200
Average Tons Nov. '08 - Present = 3,200
Peak Tons = 5,400

R Y E R S O N I N V E S T O R P R E S E N T A T I O N
F I N A N C I A L O V E R V I E W E R I C H S C H N A U F E R │ C H I E F F I N A N C I A L O F F I C E R

R Y E R S O N I N V E S T O R P R E S E N T A T I O N
Expense management leadership
Continue best in class working capital management
Maximize free cash flow for investment while maintaining a strong balance sheet
Propel growth, invest in high return capital projects, and bolt-on acquisitions
Deleveraging
Ryerson Financial Priorities
22

R Y E R S O N I N V E S T O R P R E S E N T A T I O N
2016 Q3 Performance Highlights
23
Earnings • Net income attributable to Ryerson Holding Corp. of $8.2M • Diluted earnings per share of $0.23 • Diluted earnings per share on an adjusted basis of $0.28 vs. $0.20 in Q3 ‘15 • Gross margin increased 80 bps to 19.8% vs. Q3 ‘15 • Gross margin, excluding LIFO increased 370 bps to 20.0% vs. Q3 ‘15 • Adjusted EBITDA, excluding LIFO up over 60% to $48.8M vs. Q3 ‘15
Market Share Gains • Ryerson volume up 0.5% year-over-year vs. MSCI decline of 6.9%
Expense Reductions • Warehousing, delivery, selling, general, and administrative expenses down
3.3%, vs. Q3 ‘15
Working Capital, Cash Flow & Liquidity • Issued 5M shares of common stock in July 2016 with net proceeds of
$71.5M used to reduce our debt balance
• In October 2016, redeemed all remaining 11.25% Senior Notes due 2018 and amended our credit facility in November 2016, thereby extending all significant debt maturities to 2021
• Q3 ending total liquidity of $364M
ANGEL ALFARO OPERATIONS SUPERVISOR
ELGIN, ILLINOIS A reconciliation of non-GAAP financial measures to the comparable GAAP measure is included in the Appendix.
R Y E R S O N I N V E S T O R P R E S E N T A T I O N
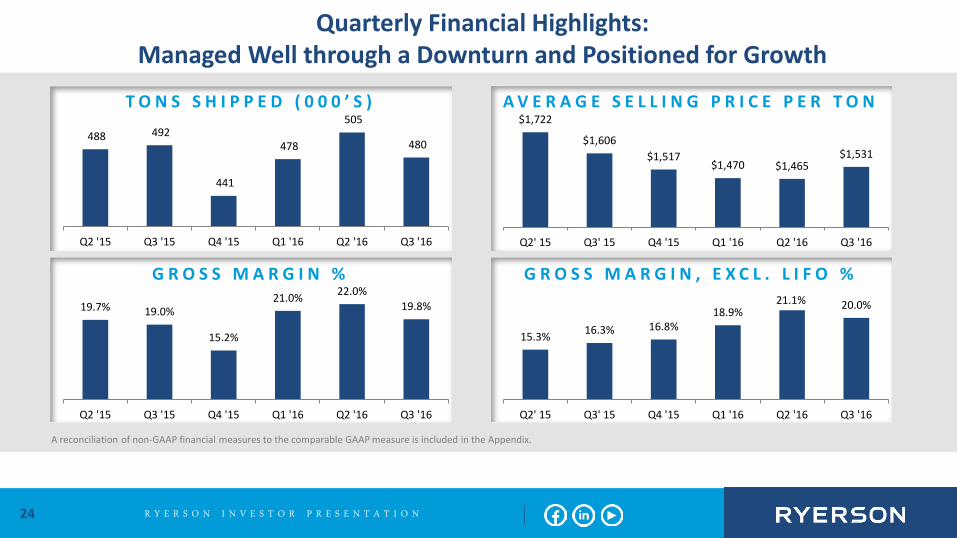
Quarterly Financial Highlights: Managed Well through a Downturn and Positioned for Growth
24
A reconciliation of non-GAAP financial measures to the comparable GAAP measure is included in the Appendix.
488 492
441
478
505
480
Q2 '15 Q3 '15 Q4 '15 Q1 '16 Q2 '16 Q3 '16
T O N S S H I P P E D ( 0 0 0 ’ S ) $1,722
$1,606 $1,517
$1,470 $1,465 $1,531
Q2' 15 Q3' 15 Q4 '15 Q1 '16 Q2 '16 Q3 '16
A V E R A G E S E L L I N G P R I C E P E R T O N
19.7% 19.0%
15.2%
21.0% 22.0% 19.8%
Q2 '15 Q3 '15 Q4 '15 Q1 '16 Q2 '16 Q3 '16
G R O S S M A R G I N %
15.3% 16.3% 16.8% 18.9%
21.1% 20.0%
Q2' 15 Q3' 15 Q4 '15 Q1 '16 Q2 '16 Q3 '16
G R O S S M A R G I N , E X C L . L I F O %
R Y E R S O N I N V E S T O R P R E S E N T A T I O N
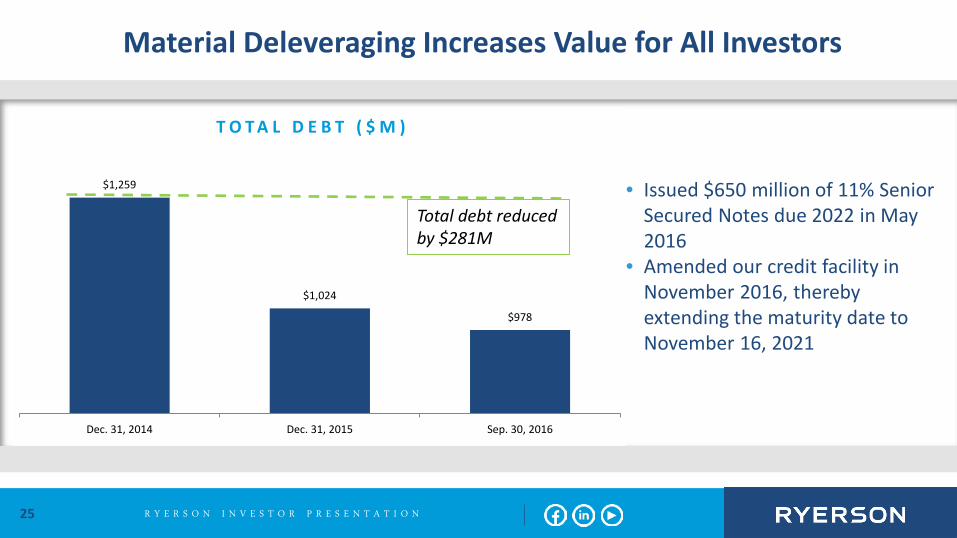
$1,259
$1,024
$978
Dec. 31, 2014 Dec. 31, 2015 Sep. 30, 2016
Material Deleveraging Increases Value for All Investors
25
T O T A L D E B T ( $ M )
Total debt reduced by $281M
• Issued $650 million of 11% Senior Secured Notes due 2022 in May 2016
• Amended our credit facility in November 2016, thereby extending the maturity date to November 16, 2021

R Y E R S O N I N V E S T O R P R E S E N T A T I O N
Investing in the Business
26
• More than $100 million in growth capital invested since 2010, expanding value-added capabilities
• Enhanced intelligent systems for connecting: people, supply chains, inventory, fixed assets, and logistics
• Six bolt-on acquisitions since 2010 • Accretive to gross margin and adjusted
EBITDA • Focus on value-added processing • Broaden transactional customer portfolio • Strategically expand network to better
service customers JASON CHONTOS, MAC BHAGWANDINE
OPERATIONS SUPERVISOR, LINE PACKAGER BURNS HARBOR, INDIANA

R Y E R S O N I N V E S T O R P R E S E N T A T I O N
C O N C L U S I O N E D D I E L E H N E R │ P R E S I D E N T A N D C H I E F E X E C U T I V E O F F I C E R

R Y E R S O N I N V E S T O R P R E S E N T A T I O N
RYERSON Leveraging Scale and
Integrated Network
“ONE RYERSON” • Single franchise / one brand • Great customer experiences • Decentralized AND connected
Ryerson’s Differentiated Model: Connectivity, Speed, Scale, Value-Add, Culture, and Analytics Well Executed Creates Value for Investors
28
CONNECTIVITY • Technical knowledge • Processing & fabrication • Logistics • Inventory
MULTI-CHANNEL SALES • Local sales and service • Customer service
prospecting centers • Ryerson.com / e-commerce
GEOGRAPHIC SCALE • United States, Canada, Mexico,
and China • Local, regional, national, inter-
continental

R Y E R S O N I N V E S T O R P R E S E N T A T I O N
SAY YES, FIGURE IT OUT
Our Commitment Our Culture
29
R Y E R S O N I N V E S T O R P R E S E N T A T I O N
A P P E N D I X
30

R Y E R S O N I N V E S T O R P R E S E N T A T I O N
Metal Service Center Supply Chain
31
S U P P L I E R S
• Manufacture metals • Produce & ship large
volumes • Have long lead times with
high variance delivery times
R Y E R S O N S E R V I C E C E N T E R S
• Purchase in scale; ship smaller quantities • Distribute more than 65,000 carbon,
stainless, and aluminum products • Process 75% of products sold
• Deliver same/next day • Provide product and end-market expertise
C U S T O M E R S
• Purchase smaller quantities • Require a variety of
products and services • Can leverage Ryerson to
reduce processing and inventory investment needs
R Y E R S O N I N V E S T O R P R E S E N T A T I O N
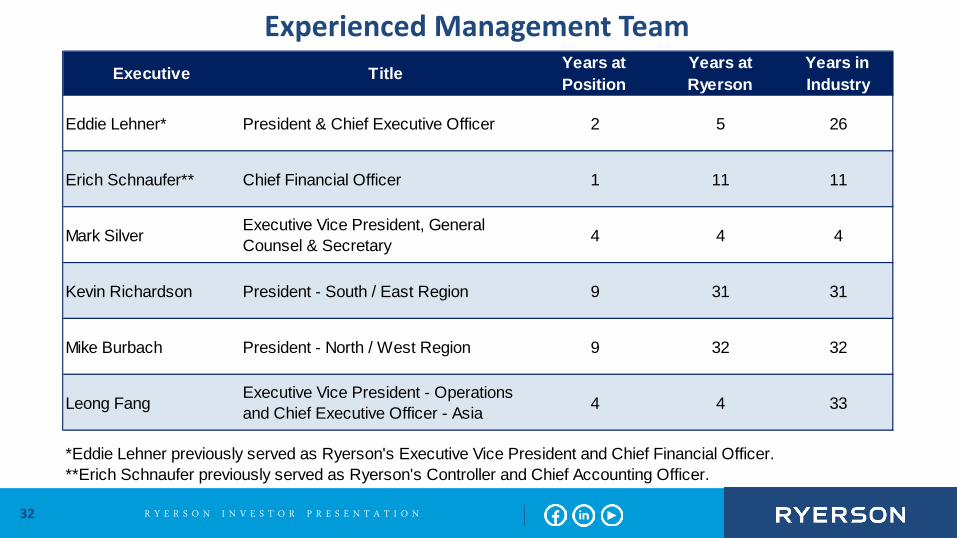
Experienced Management Team
32
Executive Title Years at Position
Years at Ryerson
Years in Industry
Eddie Lehner* President & Chief Executive Officer 2 5 26
Erich Schnaufer** Chief Financial Officer 1 11 11
Mark SilverExecutive Vice President, General Counsel & Secretary 4 4 4
Kevin Richardson President - South / East Region 9 31 31
Mike Burbach President - North / West Region 9 32 32
Leong FangExecutive Vice President - Operations and Chief Executive Officer - Asia 4 4 33
*Eddie Lehner previously served as Ryerson's Executive Vice President and Chief Financial Officer.**Erich Schnaufer previously served as Ryerson's Controller and Chief Accounting Officer.

R Y E R S O N I N V E S T O R P R E S E N T A T I O N
Ample Liquidity to Fund Operations and Investments
33
$162.9
185
295
23
26
65
43 $273
$364
Dec. 31, 2015 Sep. 30, 2016
North American Availability Foreign Availability Cash & Equivalents
L I Q U I D I T Y ( $ M )
R Y E R S O N I N V E S T O R P R E S E N T A T I O N
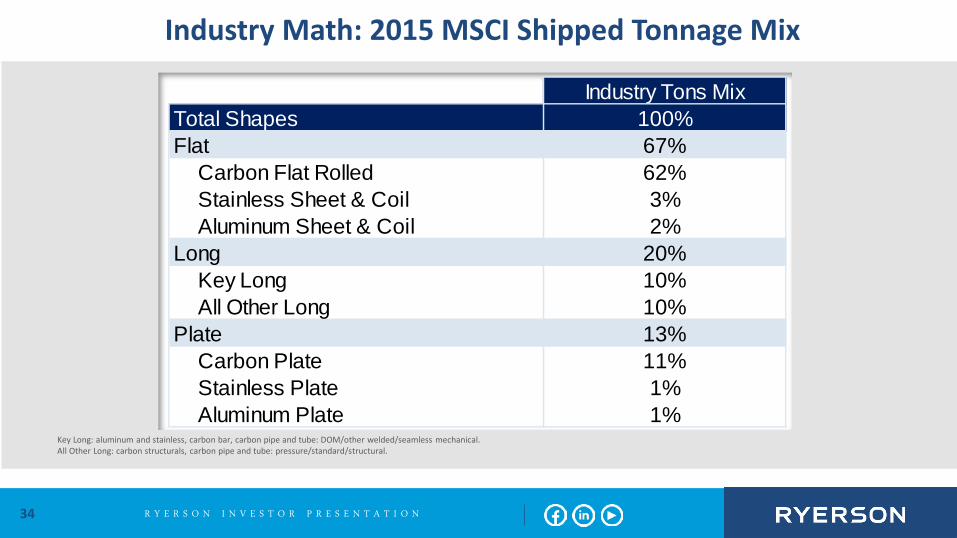
Industry Math: 2015 MSCI Shipped Tonnage Mix
Key Long: aluminum and stainless, carbon bar, carbon pipe and tube: DOM/other welded/seamless mechanical. All Other Long: carbon structurals, carbon pipe and tube: pressure/standard/structural.
34
Industry Tons MixTotal Shapes 100%Flat 67%
Carbon Flat Rolled 62%Stainless Sheet & Coil 3%Aluminum Sheet & Coil 2%
Long 20%Key Long 10%All Other Long 10%
Plate 13%Carbon Plate 11%Stainless Plate 1%Aluminum Plate 1%

35
EBITDA represents net income before interest and other expense on debt, provision for income taxes, depreciation and amortization. Adjusted EBITDA gives further effect to, among other things, impairment charges on assets, reorganization expenses and foreign currency transaction gains and losses. We believe that the presentation of EBITDA, Adjusted EBITDA and Adjusted EBITDA, excluding LIFO expense (income), net, provides useful information to investors regarding our operational performance because they enhance an investor’s overall understanding of our core financial performance and provide a basis of comparison of results between current, past and future periods. We also disclose the metric Adjusted EBITDA, excluding LIFO expense (income), net, to provide a means of comparison amongst our competitors who may not use the same basis of accounting for inventories. EBITDA, Adjusted EBITDA and Adjusted EBITDA, excluding LIFO expense (income), net, are three of the primary metrics management uses for planning and forecasting in future periods, including trending and analyzing the core operating performance of our business without the effect of U.S. generally accepted accounting principles, or GAAP, expenses, revenues and gains (losses) that are unrelated to the day to day performance of our business. We also establish compensation programs for our executive management and regional employees that are based upon the achievement of pre-established EBITDA, Adjusted EBITDA and Adjusted EBITDA, excluding LIFO expense (income), net, targets. We also use EBITDA, Adjusted EBITDA and Adjusted EBITDA, excluding LIFO expense (income), net, to benchmark our operating performance to that of our competitors. EBITDA, Adjusted EBITDA and Adjusted EBITDA, excluding LIFO expense (income), net do not represent, and should not be used as a substitute for, net income or cash flows from operations as determined in accordance with generally accepted accounting principles, and neither EBITDA, Adjusted EBITDA and Adjusted EBITDA, excluding LIFO expense (income), net, is necessarily an indication of whether cash flow will be sufficient to fund our cash requirements. This release also presents gross margin, excluding LIFO expense (income), net, which is calculated as gross profit plus LIFO expense (or minus LIFO income), net, divided by net sales. We have excluded LIFO expense (income), net from the gross margin and Adjusted EBITDA as a percentage of net sales metrics in order to provide a means of comparison amongst our competitors who may not use the same basis of accounting for inventories as we do. Our definitions of EBITDA, Adjusted EBITDA, Adjusted EBITDA, excluding LIFO expense (income), net, gross margin, excluding LIFO expense (income), net, and Adjusted EBITDA, excluding LIFO expense (income), net, as a percentage of sales may differ from that of other companies. Net income and Earnings per share excluding restructuring and other charges, impairment charges on assets and (gain) loss on retirement of debt are presented to provide a means of comparison with periods that do not include restructuring and other charges, impairment charges on assets and gains or losses on retirement of debt.
Non-GAAP Reconciliation
R Y E R S O N I N V E S T O R P R E S E N T A T I O N
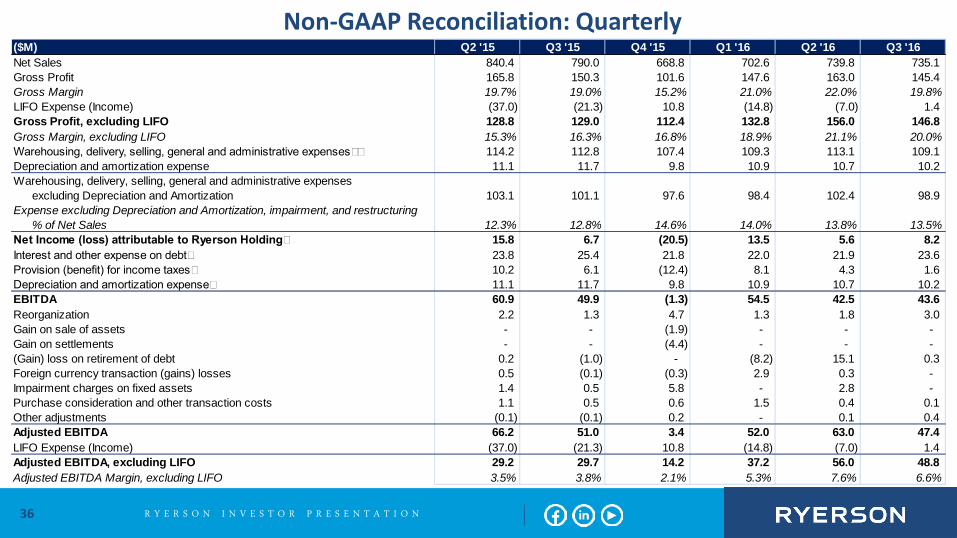
Non-GAAP Reconciliation: Quarterly
36
($M) Q2 '15 Q3 '15 Q4 '15 Q1 '16 Q2 '16 Q3 '16Net Sales 840.4 790.0 668.8 702.6 739.8 735.1 Gross Profit 165.8 150.3 101.6 147.6 163.0 145.4 Gross Margin 19.7% 19.0% 15.2% 21.0% 22.0% 19.8%LIFO Expense (Income) (37.0) (21.3) 10.8 (14.8) (7.0) 1.4 Gross Profit, excluding LIFO 128.8 129.0 112.4 132.8 156.0 146.8 Gross Margin, excluding LIFO 15.3% 16.3% 16.8% 18.9% 21.1% 20.0%Warehousing, delivery, selling, general and administrative expenses 114.2 112.8 107.4 109.3 113.1 109.1 Depreciation and amortization expense 11.1 11.7 9.8 10.9 10.7 10.2 Warehousing, delivery, selling, general and administrative expenses
excluding Depreciation and Amortization 103.1 101.1 97.6 98.4 102.4 98.9 Expense excluding Depreciation and Amortization, impairment, and restructuring
% of Net Sales 12.3% 12.8% 14.6% 14.0% 13.8% 13.5%Net Income (loss) attributable to Ryerson Holding 15.8 6.7 (20.5) 13.5 5.6 8.2 Interest and other expense on debt 23.8 25.4 21.8 22.0 21.9 23.6 Provision (benefit) for income taxes 10.2 6.1 (12.4) 8.1 4.3 1.6 Depreciation and amortization expense 11.1 11.7 9.8 10.9 10.7 10.2 EBITDA 60.9 49.9 (1.3) 54.5 42.5 43.6 Reorganization 2.2 1.3 4.7 1.3 1.8 3.0 Gain on sale of assets - - (1.9) - - - Gain on settlements - - (4.4) - - - (Gain) loss on retirement of debt 0.2 (1.0) - (8.2) 15.1 0.3 Foreign currency transaction (gains) losses 0.5 (0.1) (0.3) 2.9 0.3 - Impairment charges on fixed assets 1.4 0.5 5.8 - 2.8 - Purchase consideration and other transaction costs 1.1 0.5 0.6 1.5 0.4 0.1 Other adjustments (0.1) (0.1) 0.2 - 0.1 0.4 Adjusted EBITDA 66.2 51.0 3.4 52.0 63.0 47.4 LIFO Expense (Income) (37.0) (21.3) 10.8 (14.8) (7.0) 1.4 Adjusted EBITDA, excluding LIFO 29.2 29.7 14.2 37.2 56.0 48.8 Adjusted EBITDA Margin, excluding LIFO 3.5% 3.8% 2.1% 5.3% 7.6% 6.6%

R Y E R S O N I N V E S T O R P R E S E N T A T I O N
Non-GAAP Reconciliation: Reconciliation of Net Income and Earnings per Share Excluding Impairment and (Gain) Loss on Retirement of Debt
37
Dollars and Shares in Millions, Except per Share Data Q3 '16 Q3 '15 2016 2015Net Income attributable to Ryerson Holding Corporation 8.2$ 6.7$ 27.3$ 20.0$
Restructuring and other charges 2.5 - 2.5 - Impairment charges on assets - 0.5 2.8 14.2(Gain) loss on retirement of debt 0.3 (1.0) 7.2 (0.3) Provision (benefit) for income taxes (1.0) 0.3 (4.7) (5.0)Net income attributable to Ryerson Holding Corporation, excluding
restructuring and other charges, impairment charges on assets and gain (loss) on retirement of debt 10.0$ 6.5$ 35.1$ 28.9$
Earnings per share, excluding restructuring and other charges, impairment charges on assets and (gain) loss on retirement of debt
Basic 0.28$ 0.20$ 1.05$ 0.90$ Diluted 0.28$ 0.20$ 1.05$ 0.90$
Shares outstanding - basic 35.8 32.1 33.3 32.0
Shares outstanding - diluted 36.0 32.1 33.4 32.1
Third QuarterNine Months Ended Sep 30
Net income and Earnings per share excluding restructuring and other charges, impairment charges on assets and (gain) loss on retirement of debt are presented to provide a means of comparison with periods that do not include restructuring and other charges, impairment charges on assets and gains or losses on retirement of debt.
R Y E R S O N I N V E S T O R P R E S E N T A T I O N
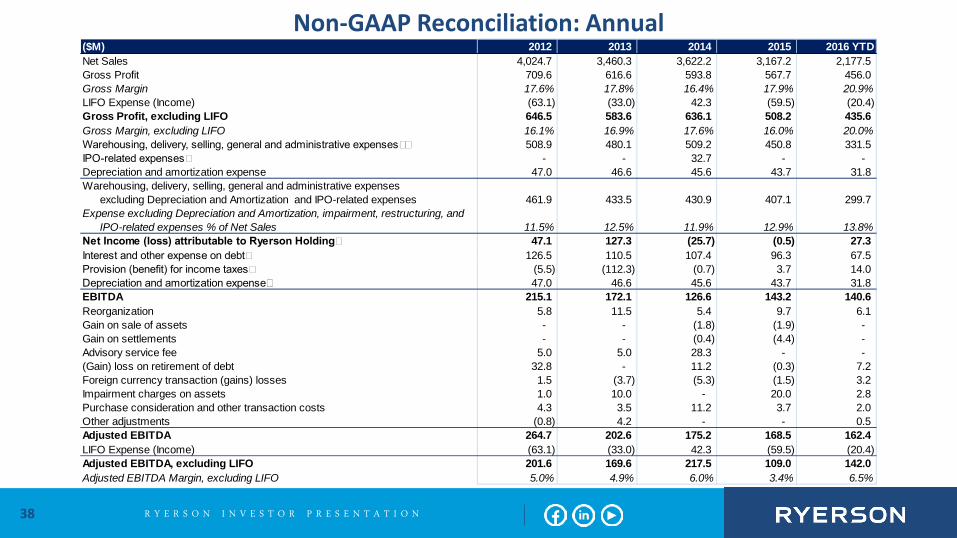
Non-GAAP Reconciliation: Annual
38
($M) 2012 2013 2014 2015 2016 YTDNet Sales 4,024.7 3,460.3 3,622.2 3,167.2 2,177.5 Gross Profit 709.6 616.6 593.8 567.7 456.0 Gross Margin 17.6% 17.8% 16.4% 17.9% 20.9%LIFO Expense (Income) (63.1) (33.0) 42.3 (59.5) (20.4) Gross Profit, excluding LIFO 646.5 583.6 636.1 508.2 435.6 Gross Margin, excluding LIFO 16.1% 16.9% 17.6% 16.0% 20.0%Warehousing, delivery, selling, general and administrative expenses 508.9 480.1 509.2 450.8 331.5 IPO-related expenses - - 32.7 - - Depreciation and amortization expense 47.0 46.6 45.6 43.7 31.8 Warehousing, delivery, selling, general and administrative expenses
excluding Depreciation and Amortization and IPO-related expenses 461.9 433.5 430.9 407.1 299.7 Expense excluding Depreciation and Amortization, impairment, restructuring, and
IPO-related expenses % of Net Sales 11.5% 12.5% 11.9% 12.9% 13.8%Net Income (loss) attributable to Ryerson Holding 47.1 127.3 (25.7) (0.5) 27.3 Interest and other expense on debt 126.5 110.5 107.4 96.3 67.5 Provision (benefit) for income taxes (5.5) (112.3) (0.7) 3.7 14.0 Depreciation and amortization expense 47.0 46.6 45.6 43.7 31.8 EBITDA 215.1 172.1 126.6 143.2 140.6 Reorganization 5.8 11.5 5.4 9.7 6.1 Gain on sale of assets - - (1.8) (1.9) - Gain on settlements - - (0.4) (4.4) - Advisory service fee 5.0 5.0 28.3 - - (Gain) loss on retirement of debt 32.8 - 11.2 (0.3) 7.2 Foreign currency transaction (gains) losses 1.5 (3.7) (5.3) (1.5) 3.2 Impairment charges on assets 1.0 10.0 - 20.0 2.8 Purchase consideration and other transaction costs 4.3 3.5 11.2 3.7 2.0 Other adjustments (0.8) 4.2 - - 0.5 Adjusted EBITDA 264.7 202.6 175.2 168.5 162.4 LIFO Expense (Income) (63.1) (33.0) 42.3 (59.5) (20.4) Adjusted EBITDA, excluding LIFO 201.6 169.6 217.5 109.0 142.0 Adjusted EBITDA Margin, excluding LIFO 5.0% 4.9% 6.0% 3.4% 6.5%

R Y E R S O N I N V E S T O R P R E S E N T A T I O N