Embed Size (px)
Citation preview
STATISTICAL BULLETIN
MARCH 2012
Bank of GhanaE 7S 5T 9. 1
F GO H K A
N N
A A
B
BANK OF GHANA
STATISTICAL BULLETIN
MARCH 2012
Prepared by Research DepartmentPublished by IDPS Department
Bank of GhanaP. O. Box GP 2674
Accra - Ghanawww.bog.gov.gh
ISBN: 0855 - 6229
TABLE OF CONTENTSSelected Economic Indicators 5 Charts 6Statistical Tables: 10
Monetary Indicators 1. Monetary Survey 102. Assets of the Bank of Ghana 113. Liabilities of the Bank of Ghana 124. Assets of Deposit Money Banks 135. Liabilities of Deposit Money Banks 146. Sectoral Distribution of Outstanding Credit by Deposit Money Banks 157. Reserve Requirements of Deposit Money Banks 168. Bank Clearing and Debits 179. Consolidated Assets and Liabilities of Rural/Community Banks 18
Interest Rates
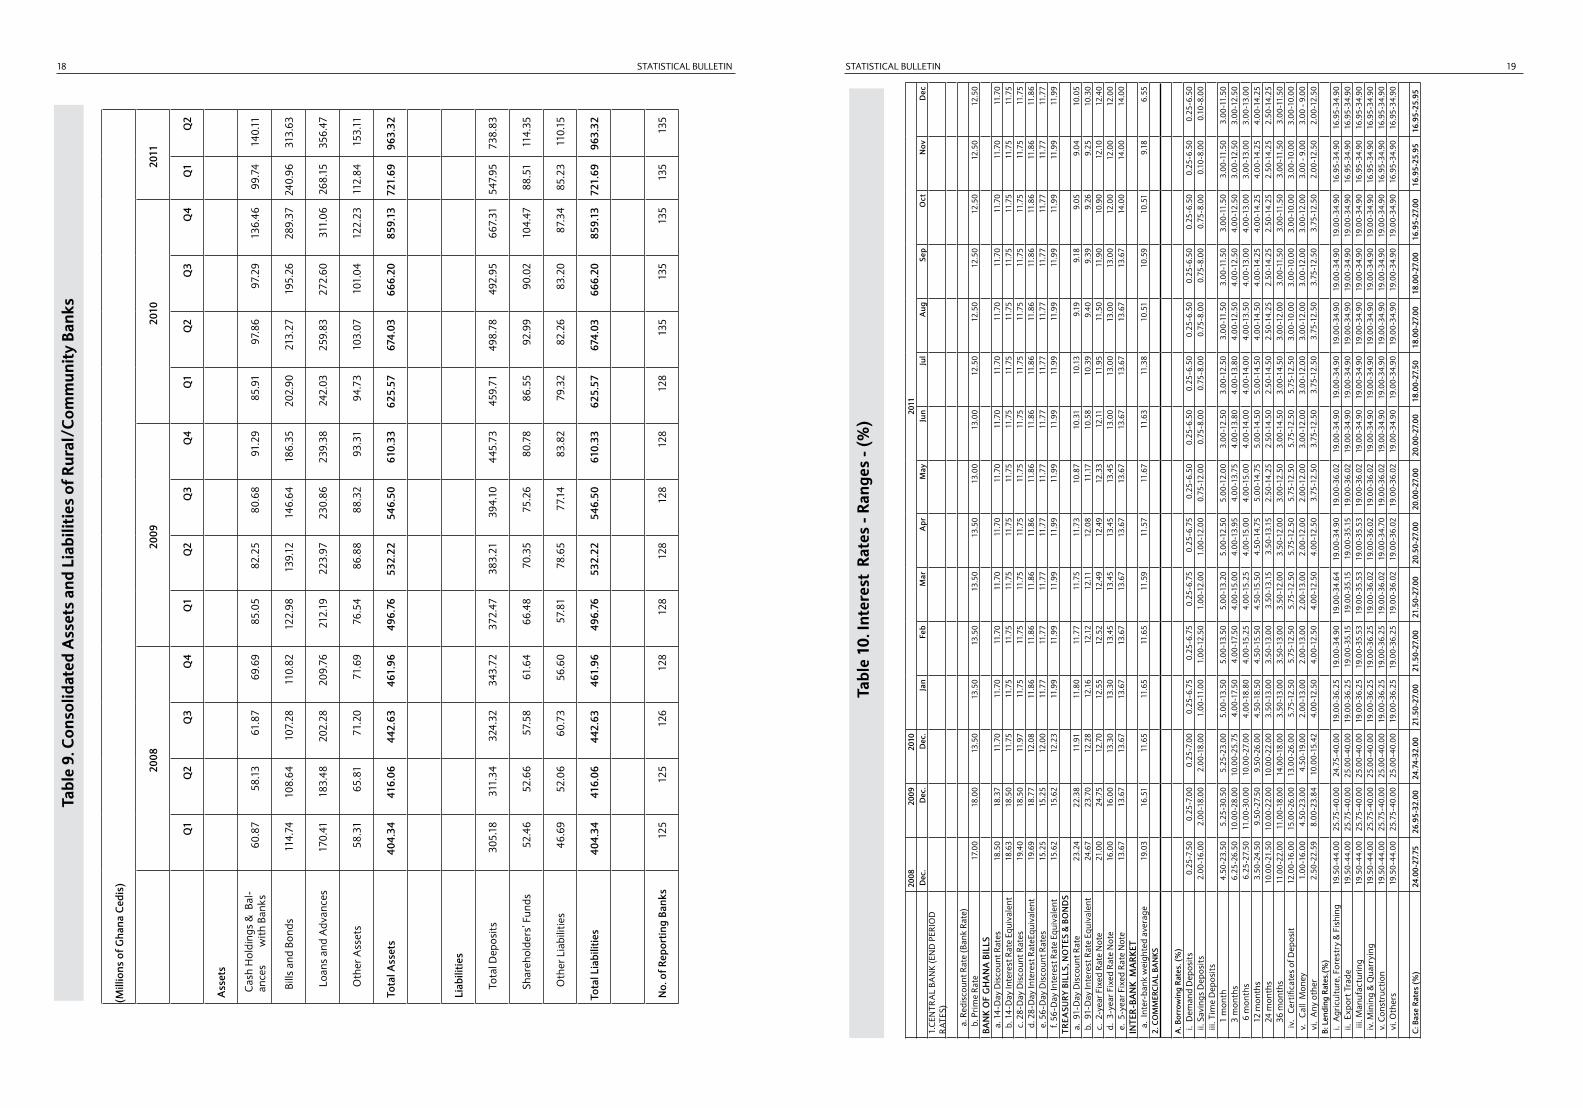
10. Interest Rates – Ranges 1911. Money Market & DMBs Rates 20
Government Fiscal Operations
12. Central Government Budget (Revenue) 2113. Central Government Budget (Expenditure) 2214. Central Government Fiscal Position (Financing) 2315. Fiscal Position – Narrow Coverage 2416. Outstanding Stock of Selected Financial Assets 2517. Holders and Structure of Domestic Debt 26
External Sector Indicators
18. International Reserves of Bank of Ghana 2719. Balance of Payments 2820. Merchandise Trade Flows 2921. Crude Oil and Petroleum Products Imports 3022. Ghana: Value, Volume and Unit Price of Exports 3123. Commodity Prices 3224. Ghana: Direction of Trade 3325. Foreign Exchange Rates (Interbank & Forex Bureaux Markets) 3426. Ghana: Public & Publicly Guaranteed External Debt 35
Real Sector Indicators
27. Ghana: Retail Prices of Major Petroleum Products 3628. National Consumer Price Index and Inflation Rates 3729. Gross Domestic Product at 2006 Constant Prices 3830. Gross Domestic Product at Current Prices 39
STATISTICAL BULLETIN 5
2008
2009
2010
2011
Dec
Dec
Dec
Jan
Feb
Mar
Apr
May
Jun
Jul
Aug
Sep
Oct
Nov
Dec
Infla
tiona
ry M
easu
res
[CO
ICO
P Ba
sed]
(y-
o-y)
Hea
dlin
e In
flatio
n(%
)18
.13
15.9
78.
589.
089.
169.
139.
028.
908.
598.
398.
418.
408.
568.
558.
58
Ave
rage
Infla
tion(
%)
(yr)
16.5
219
.25
10.7
511
.55
10.7
510
.00
10.3
69.
789.
099.
579.
298.
838.
778.
738.
72
Cor
e 1:
INFX
EU (i
nflat
ion
adj.
for e
nerg
y &
ut
ility
)13
.86
16.2
38.
038.
128.
218.
178.
107.
877.
527.
827.
847.
757.
927.
917.
93
Mon
etar
y Se
ctor
Indi
cato
rs (
y-o-
y) G
row
th (%
)
Tota
l Dom
estic
Cre
dit
43.9
16.1
15.4
38.6
29.1
29.0
26.0
26.6
26.9
34.1
31.1
35.7
37.1
37.6
17.0
Priv
ate
Sect
or C
redi
t48
.215
.819
.917
.79.
610
.317
.318
.518
.225
.022
.125
.527
.026
.726
.3
Rese
rve
Mon
ey (R
M)
27.1
36.3
45.2
41.6
51.1
37.6
49.0
53.2
52.5
52.4
48.4
37.8
41.3
43.6
31.1
Tota
l Liq
uidi
ty (M
2+)
40.2
26.9
35.0
33.5
35.9
36.0
41.5
40.7
40.2
42.6
42.1
41.9
38.1
34.6
33.2
Broa
d M
oney
(M2)
31.2
21.2
46.2
37.2
36.2
36.4
41.4
39.2
36.6
39.7
40.6
39.2
36.9
29.2
30.2
Exte
rnal
Sec
tor D
evel
opm
ents
(US$
mill
ion)
Net
Inte
rnat
iona
l Res
erve
s1,
300.
592,
459.
373,
924.
874,
039.
854,
082.
923,
738.
234,
007.
433,
811.
133,
882.
963,
680.
443,
549.
313,
604.
294,
012.
723,
560.
034,
438.
97
Gro
ss In
tern
atio
nal R
eser
ves
2,03
2.16
3,16
4.81
4,72
4.89
4,76
7.82
4,82
5.52
4,50
3.61
4,88
2.99
4,70
4.49
4,76
4.93
4,62
9.23
4,50
2.04
4,59
4.66
4,97
7.64
4,84
5.83
5,38
2.82
(equ
iv in
mon
ths
of im
port
s of
goo
ds &
ser
vice
s)1.
83.
23.
73.
83.
83.
53.
93.
83.
83.
72.
92.
93.
02.
93.
2
Cur
rent
Acc
ount
(inc
l. of
ficia
l tra
nsfe
rs)
-813
.78
-159
.90
-955
.18
n.a
n.a
-548
.58
n.a
n.a
-471
.42
n.a
n.a
-725
.23
n.a
n.a
-1,8
07.8
4
Priv
ate
Tran
sfer
s (n
et)
480.
2949
4.42
530.
67n.
an.
a67
3.76
n.a
n.a
595.
14
n.a
n.a
507.
68n.
an.
a59
2.19
Com
mod
ity
Pric
e M
ovem
ents
Coc
oa L
IFFE
[£
per
tonn
e]1,
657.
102,
248.
001,
994.
482,
046.
002,
228.
152,
161.
611,
934.
851,
878.
481,
858.
551,
954.
671,
888.
431,
823.
521,
700.
861,
590.
231,
406.
00
Gol
d [U
S$ p
er fi
ne o
unce
]82
1.49
1,12
6.83
1,39
1.16
1,35
9.46
1,37
2.35
1,42
2.50
1,48
1.10
1,51
5.22
1,52
8.25
1,57
5.15
1,77
0.13
1,76
8.96
1,67
3.66
1,74
4.69
1,65
8.49
Bren
t Cru
de O
il [
US$
per
bar
rel]
43.2
975
.24
92.3
496
.82
104.
0911
4.62
123.
1311
4.53
113.
9111
6.68
109.
8210
9.96
108.
8011
0.61
107.
72
Dom
estic
Pet
role
um P
rice
s (G
H¢
per l
itre)
:
Prem
ium
0.82
1.17
1.17
1.52
1.52
1.52
1.52
1.52
1.52
1.52
1.52
1.52
1.52
1.52
1.75
Real
Sec
tor I
ndic
ator
s(Ba
se: A
vg. 2
001=
100)
CIE
A: Y
ear-
on-y
ear g
row
th (n
omin
al)
n.a
19.5
16.5
20.4
20.5
28.7
27.7
23.9
25.5
26.6
24.5
27.3
21.9
22.9
20.9
CIE
A: Y
ear-
on-y
ear g
row
th (r
eal)
n.a
9.2
10.5
14.2
14.3
22.2
21.4
17.9
19.6
20.7
18.8
21.5
16.3
17.3
15.2
Exte
rnal
Deb
t (In
mill
ion
of U
S$) B
y M
atur
ity
Tota
l (ex
clud
es c
ocob
od s
hort
-ter
m)
4,03
5.07
5,00
7.88
6,25
4.55
n.a
n.a
6,68
1.87
n.a
n.a
7,08
2.64
n.a
n.a
7,34
5.38
n.a
n.a
7,58
9.45
Exte
rnal
deb
t/G
DP
(%)
16.2
19.1
20.9
n.a
n.a
17.6
n.a
n.a
18.7
n.a
n.a
19.8
n.a
n.a
20.8
Deb
t Ser
vice
/Exp
orts
of g
oods
and
ser
vice
s (%
) 6.
54.
33.
7n.
an.
a2.
4n.
an.
a3.
4n.
an.
a2.
5n.
an.
a3.
3
Deb
t Ser
vice
/GD
P (%
)0.
51.
30.
3n.
an.
a0.
2n.
an.
a0.
3n.
an.
a0.
3n.
an.
a0.
3
Gov
ernm
ent F
isca
l Ope
ratio
ns (
Mill
ion
Gh
Ced
is)
Net
Dom
estic
Fin
anci
ng (N
DF)
249.
7090
.01
-141
.82
-91.
592.
5262
9.44
348.
2832
2.47
-610
.65
445.
4717
9.59
67
.75
461.
8659
8.66
-261
.84
ND
F as
% o
f GD
P1.
530.
42-0
.55
-0.2
00.
001.
100.
600.
60-1
.10
0.80
0.03
0.
120.
811.
05-0
.46
n.a
= no
t ava
ilabl
e
SELE
CTE
D E
CO
NO
MIC
IND
ICAT
ORS
STATISTICAL BULLETIN STATISTICAL BULLETIN6 7
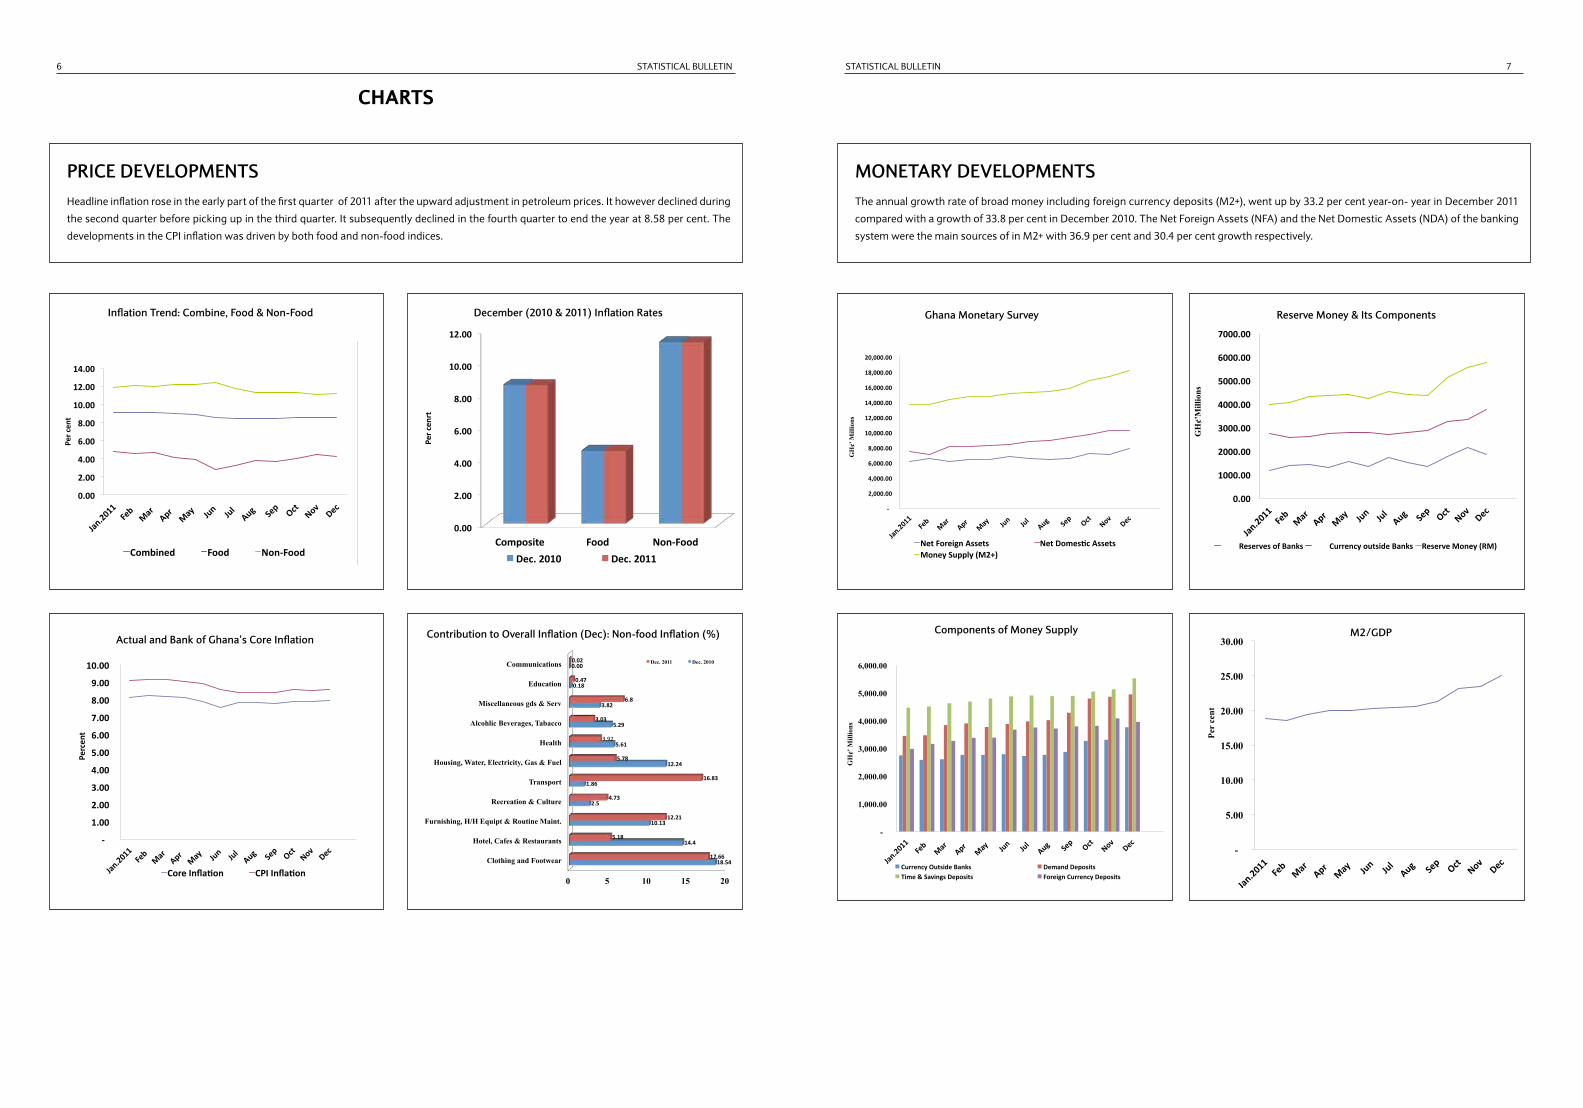
PRICE DEVELOPMENTS MONETARY DEVELOPMENTSHeadline inflation rose in the early part of the first quarter of 2011 after the upward adjustment in petroleum prices. It however declined during
the second quarter before picking up in the third quarter. It subsequently declined in the fourth quarter to end the year at 8.58 per cent. The
developments in the CPI inflation was driven by both food and non-food indices.
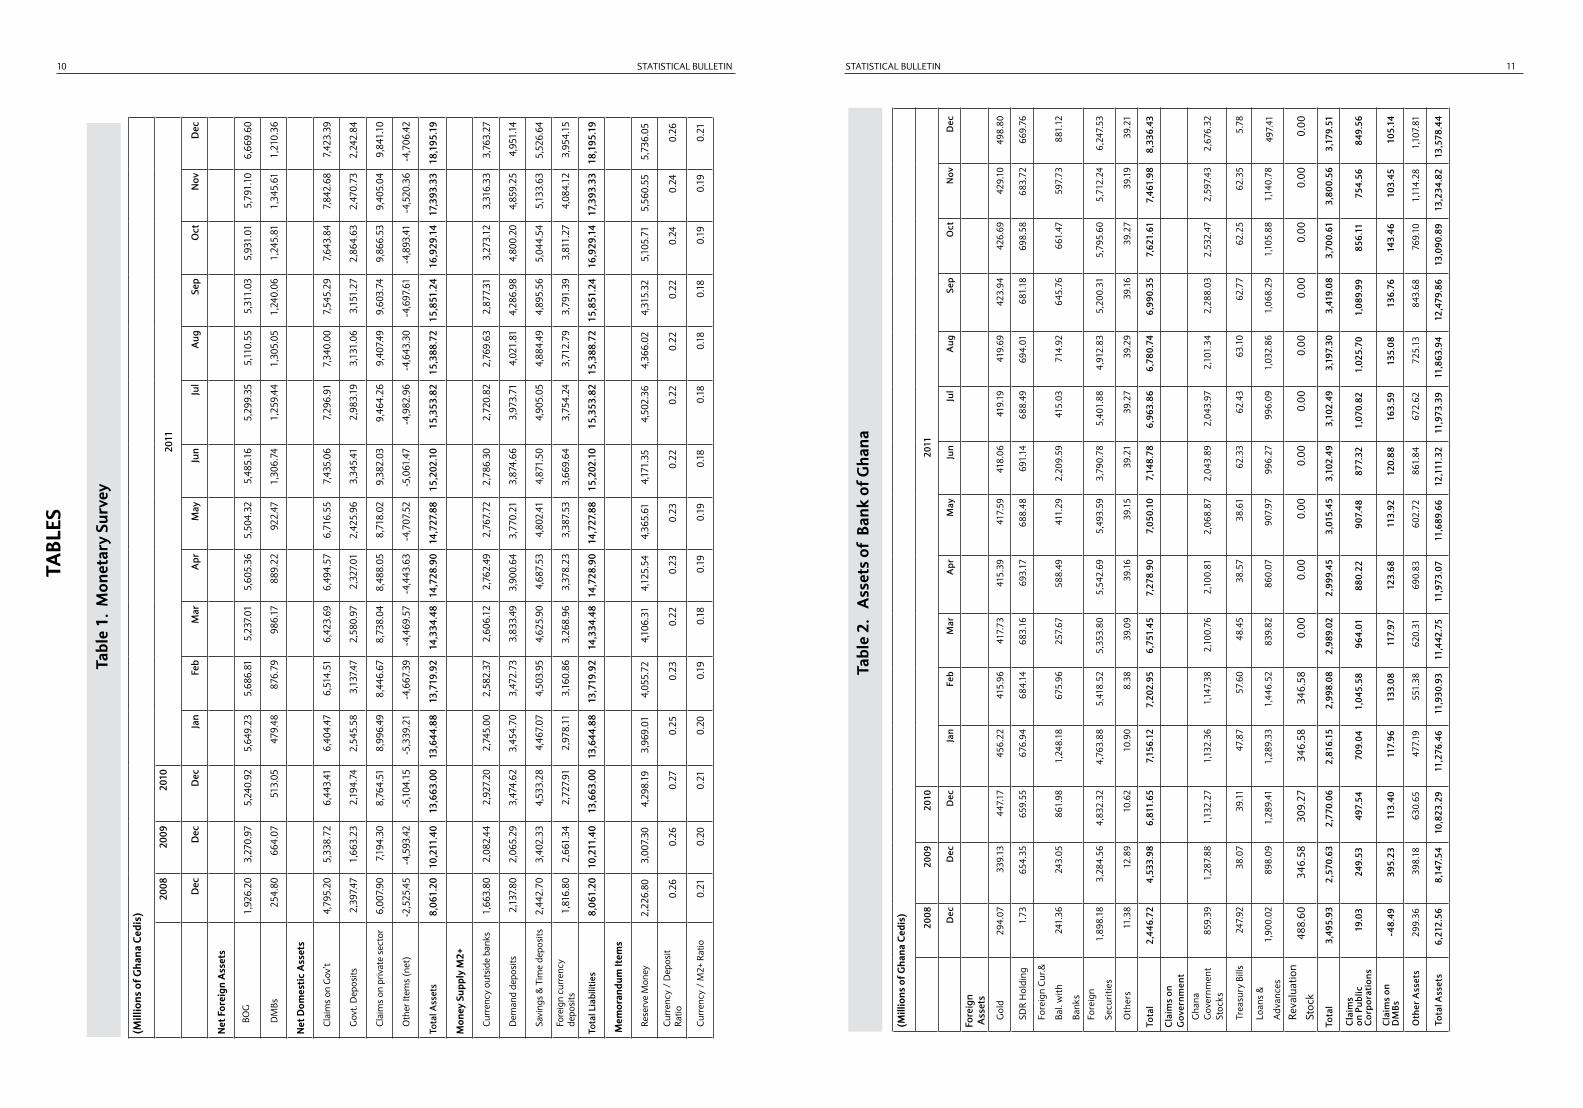
The annual growth rate of broad money including foreign currency deposits (M2+), went up by 33.2 per cent year-on- year in December 2011
compared with a growth of 33.8 per cent in December 2010. The Net Foreign Assets (NFA) and the Net Domestic Assets (NDA) of the banking
system were the main sources of in M2+ with 36.9 per cent and 30.4 per cent growth respectively.
CHARTS
0.00
2.00
4.00
6.00
8.00
10.00
12.00
14.00
Jan.2011
Feb
Mar
Apr
May
Jun Ju
l
Aug
Sep
Oct
Nov
Dec
Per cent
InflaBon Trend: Combine, Food & Non-‐Food
Combined Food Non-‐Food
Inflation Trend: Combine, Food & Non-Food
-‐
1.00
2.00
3.00
4.00
5.00
6.00
7.00
8.00
9.00
10.00
Jan.2
011
Feb
Mar
Apr
May
Ju
n Jul
Aug
Se
p Oct
Nov
Dec
Perc
ent
Actual and Bank of Ghana's Core Inflation
Core InflaHon CPI InflaHon
Actual and Bank of Ghana’s Core Inflation
0 5 10 15 20
Clothing and Footwear
Hotel, Cafes & Restaurants
Furnishing, H/H Equipt & Routine Maint.
Recreation & Culture
Transport
Housing, Water, Electricity, Gas & Fuel
Health
Alcohlic Beverages, Tabacco
Miscellaneous gds & Serv
Education
Communications
18.54
14.4
10.13
2.5
1.86
12.24
5.61
5.29
3.82
0.18
0.00
17.66
5.18
12.21
4.73
16.83
5.78
3.92
3.03
6.8
0.47
0.02
Contribution to Overall Inflation (Dec): Non-food Inflation (%)
Dec. 2011 Dec. 2010
Contribution to Overall Inflation (Dec): Non-food Inflation (%)
0.00
2.00
4.00
6.00
8.00
10.00
12.00
Composite Food Non-‐Food
Per cenrt
December (2010 & 2011) InflaAon Rates
Dec. 2010 Dec. 2011
December (2010 & 2011) Inflation Rates Ghana Monetary Survey
-‐
2,000.00
4,000.00
6,000.00
8,000.00
10,000.00
12,000.00
14,000.00
16,000.00
18,000.00
20,000.00
Jan.2
011
Feb
Mar
Apr
May
Ju
n Jul
Aug
Se
p Oct
Nov
Dec
GH
¢' M
illio
ns
Ghana Monetary Survey
Net Foreign Assets Net DomesDc Assets Money Supply (M2+)
0.00
1000.00
2000.00
3000.00
4000.00
5000.00
6000.00
7000.00
Jan.2
011
Feb
Mar
Apr
May
Ju
n Jul
Aug
Sep
Oct Nov
Dec
GH
¢'M
illio
ns
Reserve Money & Its Components
Reserves of Banks Currency outside Banks Reserve Money (RM)
Reserve Money & Its Components
Components of Money Supply
-
1,000.00
2,000.00
3,000.00
4,000.00
5,000.00
6,000.00
Jan.2
011
Feb
Mar
Apr
May
Ju
n Jul
Aug
Sep
Oct Nov
Dec
G
H¢'
Mill
ions
Components of Money Supply
Currency Outside Banks Demand Deposits Time & Savings Deposits Foreign Currency Deposits
-
5.00
10.00
15.00
20.00
25.00
30.00
Jan.2011
Feb
Mar
Apr
May
Jun Ju
l
Aug
Sep
Oct
Nov
Dec
Per
cent
M2/GDP M2/GDP
STATISTICAL BULLETIN STATISTICAL BULLETIN8 9
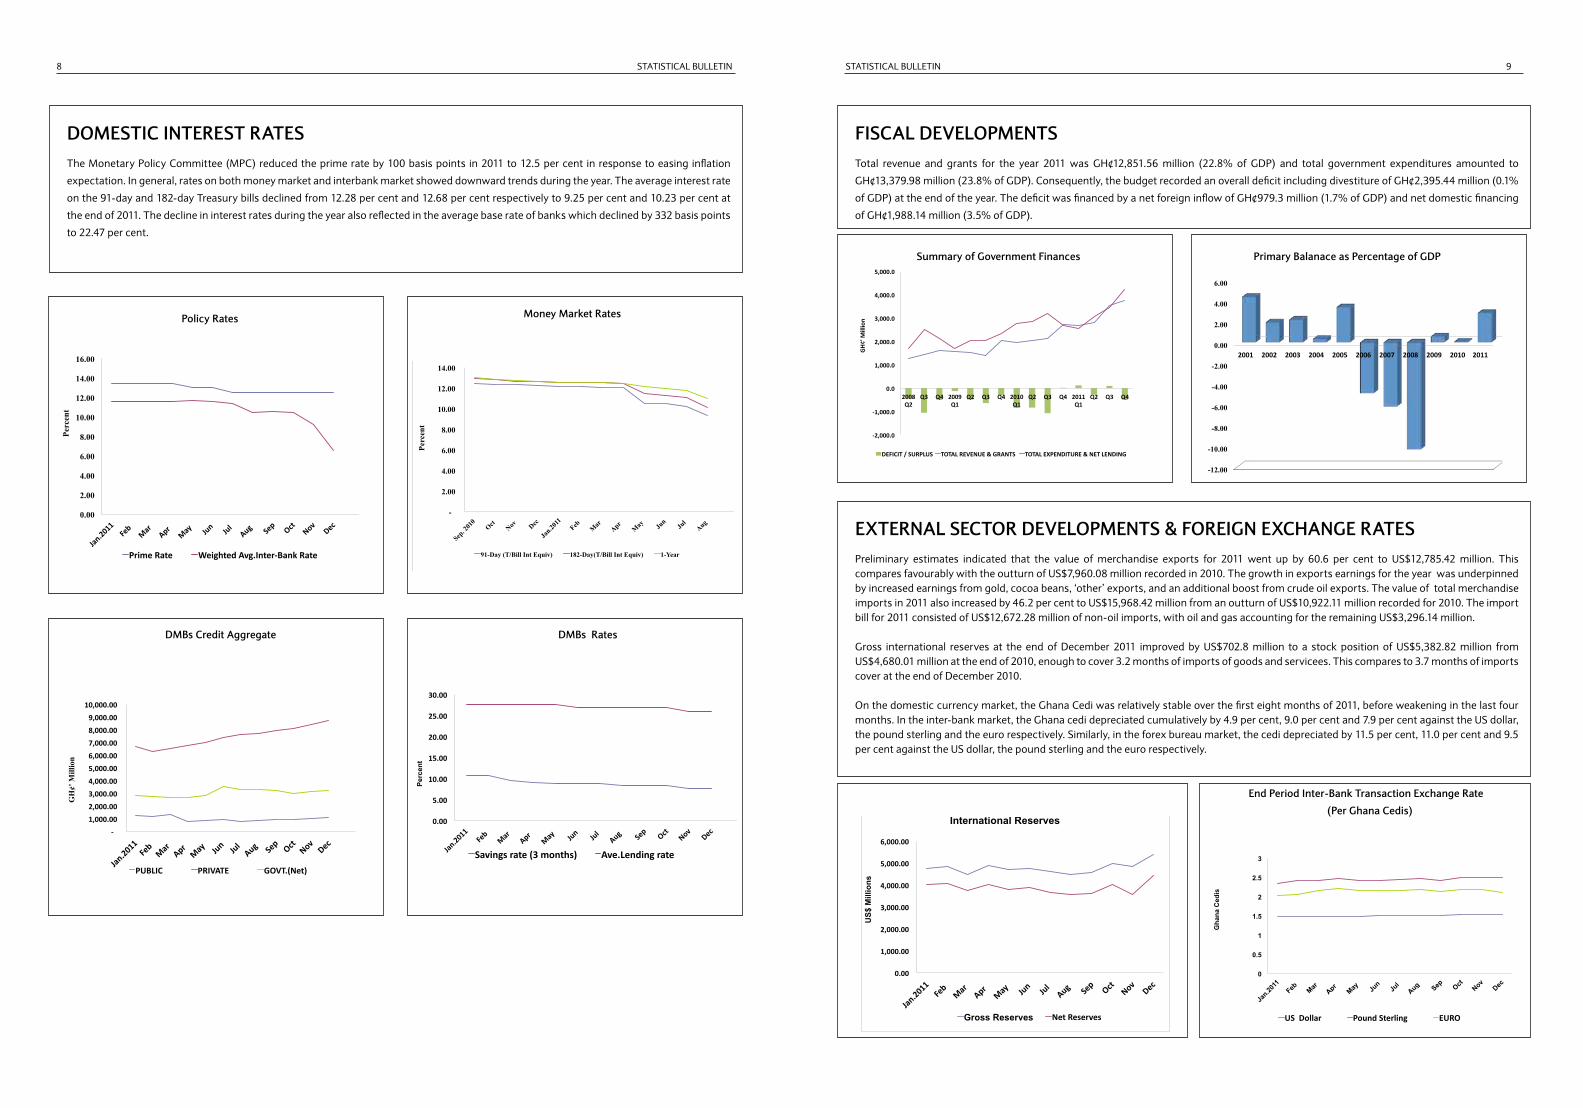
DOMESTIC INTEREST RATES FISCAL DEVELOPMENTS The Monetary Policy Committee (MPC) reduced the prime rate by 100 basis points in 2011 to 12.5 per cent in response to easing inflation
expectation. In general, rates on both money market and interbank market showed downward trends during the year. The average interest rate
on the 91-day and 182-day Treasury bills declined from 12.28 per cent and 12.68 per cent respectively to 9.25 per cent and 10.23 per cent at
the end of 2011. The decline in interest rates during the year also reflected in the average base rate of banks which declined by 332 basis points
to 22.47 per cent.
Total revenue and grants for the year 2011 was GH¢12,851.56 million (22.8% of GDP) and total government expenditures amounted to
GH¢13,379.98 million (23.8% of GDP). Consequently, the budget recorded an overall deficit including divestiture of GH¢2,395.44 million (0.1%
of GDP) at the end of the year. The deficit was financed by a net foreign inflow of GH¢979.3 million (1.7% of GDP) and net domestic financing
of GH¢1,988.14 million (3.5% of GDP).
0.00
2.00
4.00
6.00
8.00
10.00
12.00
14.00
16.00
Jan.2011
Feb
Mar
Apr
May
Jun Ju
l
Aug
Sep
Oct
Nov
Dec
Perc
ent
Policy Rates
Prime Rate Weighted Avg.Inter-‐Bank Rate
Policy Rates
DMBs Credit Aggregate DMBs Rates
Money Market Rates
-‐
1,000.00
2,000.00
3,000.00
4,000.00
5,000.00
6,000.00
7,000.00
8,000.00
9,000.00
10,000.00
Jan.2011 Feb
Mar
Apr
May
Jun Ju
l
Aug Sep
Oct Nov
Dec
GH
¢' M
illio
n
DMBs Credit Aggregate
PUBLIC PRIVATE GOVT.(Net)
0.00
5.00
10.00
15.00
20.00
25.00
30.00
Jan.2
011
Feb
Mar
Apr
May
Jun Ju
l
Aug
Se
p Oct
Nov
Dec
Perc
ent
DMBs Rates
Savings rate (3 months) Ave.Lending rate
Summary of Government Finances
-‐2,000.0
-‐1,000.0
0.0
1,000.0
2,000.0
3,000.0
4,000.0
5,000.0
2008 Q2
Q3 Q4 2009 Q1
Q2 Q3 Q4 2010 Q1
Q2 Q3 Q4 2011 Q1
Q2 Q3 Q4
GH¢' M
illion
Summary of Government Finances
DEFICIT / SURPLUS TOTAL REVENUE & GRANTS TOTAL EXPENDITURE & NET LENDING
Primary Balanace as Percentage of GDP
-12.00
-10.00
-8.00
-6.00
-4.00
-2.00
0.00
2.00
4.00
6.00
2001 2002 2003 2004 2005 2006 2007 2008 2009 2010 2011
Primary Balanace as Percentage of GDP
EXTERNAL SECTOR DEVELOPMENTS & FOREIGN EXCHANGE RATESPreliminary estimates indicated that the value of merchandise exports for 2011 went up by 60.6 per cent to US$12,785.42 million. This compares favourably with the outturn of US$7,960.08 million recorded in 2010. The growth in exports earnings for the year was underpinned by increased earnings from gold, cocoa beans, ‘other’ exports, and an additional boost from crude oil exports. The value of total merchandise imports in 2011 also increased by 46.2 per cent to US$15,968.42 million from an outturn of US$10,922.11 million recorded for 2010. The import bill for 2011 consisted of US$12,672.28 million of non-oil imports, with oil and gas accounting for the remaining US$3,296.14 million.
Gross international reserves at the end of December 2011 improved by US$702.8 million to a stock position of US$5,382.82 million from US$4,680.01 million at the end of 2010, enough to cover 3.2 months of imports of goods and servicees. This compares to 3.7 months of imports cover at the end of December 2010.
On the domestic currency market, the Ghana Cedi was relatively stable over the first eight months of 2011, before weakening in the last four months. In the inter-bank market, the Ghana cedi depreciated cumulatively by 4.9 per cent, 9.0 per cent and 7.9 per cent against the US dollar, the pound sterling and the euro respectively. Similarly, in the forex bureau market, the cedi depreciated by 11.5 per cent, 11.0 per cent and 9.5 per cent against the US dollar, the pound sterling and the euro respectively.
-
2.00
4.00
6.00
8.00
10.00
12.00
14.00
Sep. 2
010
Oct
Nov
Dec
Jan.20
11
Feb
Mar
Apr
May
Ju
n Ju
l Aug
Perc
ent
Money Market Rates
91-Day (T/Bill Int Equiv) 182-Day(T/Bill Int Equiv) 1-Year
0.00
1,000.00
2,000.00
3,000.00
4,000.00
5,000.00
6,000.00
Jan.2011
Feb
Mar
Apr
May
Jun Ju
l
Aug
Sep
Oct
Nov
Dec
US$
Mill
ions
International Reserves
Gross Reserves Net Reserves
International Reserves End Period Inter-Bank Transaction Exchange Rate
(Per Ghana Cedis)
0
0.5
1
1.5
2
2.5
3
Jan.20
11
Feb
Mar
Apr
May
Jun
Jul
Aug Sep
Oct
Nov Dec
Gha
na C
edis
End Period Inter-Bank Transaction Exchange Rate (Per Ghana Cedis)
US Dollar Pound Sterling EURO
STATISTICAL BULLETIN STATISTICAL BULLETIN10 11TA
BLES
(Mill
ions
of G
hana
Ced
is)
2008
20
09
2010
20
11
Dec
Dec
Dec
Jan
Feb
Mar
Apr
May
Jun
Jul
Aug
Sep
Oct
Nov
Dec
Net
For
eign
Ass
ets
BOG
1,9
26.2
0 3
,270
.97
5,24
0.92
5,64
9.23
5,68
6.81
5,23
7.01
5,60
5.36
5,50
4.32
5,4
85.1
6 5
,299
.35
5,1
10.5
5 5
,311
.03
5,9
31.0
1 5
,791
.10
6,6
69.6
0
DM
Bs 2
54.8
0 6
64.0
7 51
3.05
479.
4887
6.79
986.
1788
9.22
922.
47 1
,306
.74
1,2
59.4
4 1
,305
.05
1,2
40.0
6 1
,245
.81
1,3
45.6
1 1
,210
.36
Net
Dom
estic
Ass
ets
Cla
ims
on G
ov’t
4,7
95.2
0 5
,338
.72
6,44
3.41
6,40
4.47
6,51
4.51
6,42
3.69
6,49
4.57
6,71
6.55
7,43
5.06
7,2
96.9
1 7
,340
.00
7,5
45.2
9 7
,643
.84
7,8
42.6
8 7
,423
.39
Gov
t. D
epos
its 2
,397
.47
1,6
63.2
3 2,
194.
742,
545.
583,
137.
472,
580.
972,
327.
012,
425.
963,
345.
41 2
,983
.19
3,1
31.0
6 3
,151
.27
2,8
64.6
3 2
,470
.73
2,2
42.8
4
Cla
ims
on p
rivat
e se
ctor
6,0
07.9
0 7
,194
.30
8,76
4.51
8,99
6.49
8,44
6.67
8,73
8.04
8,48
8.05
8,71
8.02
9,38
2.03
9,4
64.2
6 9
,407
.49
9,6
03.7
4 9
,866
.53
9,4
05.0
4 9
,841
.10
Oth
er It
ems
(net
)-2
,525
.45
-4,5
93.4
2-5
,104
.15
-5,3
39.2
1-4
,667
.39
-4,4
69.5
7-4
,443
.63
-4,7
07.5
2-5
,061
.47
-4,9
82.9
6-4
,643
.30
-4,6
97.6
1-4
,893
.41
-4,5
20.3
6-4
,706
.42
Tota
l Ass
ets
8,0
61.2
0 10
,211
.40
13,6
63.0
013
,644
.88
13,7
19.9
214
,334
.48
14,7
28.9
014
,727
.88
15,2
02.1
0 1
5,35
3.82
15
,388
.72
15,8
51.2
4 16
,929
.14
17,3
93.3
3 18
,195
.19
Mon
ey S
uppl
y M
2+
Cur
renc
y ou
tsid
e ba
nks
1,6
63.8
0 2
,082
.44
2,92
7.20
2,74
5.00
2,58
2.37
2,60
6.12
2,76
2.49
2,76
7.72
2,78
6.30
2,7
20.8
2 2
,769
.63
2,8
77.3
1 3
,273
.12
3,3
16.3
3 3
,763
.27
Dem
and
depo
sits
2,1
37.8
0 2
,065
.29
3,47
4.62
3,45
4.70
3,47
2.73
3,83
3.49
3,90
0.64
3,77
0.21
3,87
4.66
3,9
73.7
1 4
,021
.81
4,2
86.9
8 4
,800
.20
4,8
59.2
5 4
,951
.14
Savi
ngs
& T
ime
depo
sits
2,4
42.7
0 3
,402
.33
4,53
3.28
4,46
7.07
4,50
3.95
4,62
5.90
4,68
7.53
4,80
2.41
4,87
1.50
4,9
05.0
5 4
,884
.49
4,8
95.5
6 5
,044
.54
5,1
33.6
3 5
,526
.64
Fore
ign
curr
ency
de
posi
ts 1
,816
.80
2,6
61.3
4 2,
727.
912,
978.
113,
160.
863,
268.
963,
378.
233,
387.
533,
669.
64 3
,754
.24
3,7
12.7
9 3
,791
.39
3,8
11.2
7 4
,084
.12
3,9
54.1
5
Tota
l Lia
bilit
ies
8,0
61.2
0 10
,211
.40
13,6
63.0
013
,644
.88
13,7
19.9
214
,334
.48
14,7
28.9
014
,727
.88
15,2
02.1
0 1
5,35
3.82
15
,388
.72
15,8
51.2
4 16
,929
.14
17,3
93.3
3 18
,195
.19
Mem
oran
dum
Item
s
Rese
rve
Mon
ey2,
226.
80
3,0
07.3
0 4,
298.
193,
969.
014,
055.
724,
106.
314,
125.
544,
365.
614,
171.
35 4
,502
.36
4,3
66.0
2 4
,315
.32
5,1
05.7
1 5
,560
.55
5,7
36.0
5
Cur
renc
y /
Dep
osit
Ratio
0.26
0.26
0.27
0.25
0.23
0.22
0.23
0.23
0.22
0.2
2 0
.22
0.2
2 0
.24
0.2
4 0
.26
Cur
renc
y /
M2+
Rat
io0.
210.
200.
210.
200.
190.
180.
190.
190.
18 0
.18
0.1
8 0
.18
0.1
9 0
.19
0.2
1
(Mill
ions
of G
hana
Ced
is)
2008
20
09
2010
20
11
Dec
Dec
Dec
Jan
Feb
Mar
Apr
May
Jun
Jul
Aug
Sep
Oct
Nov
Dec
Fore
ign
Ass
ets
Gol
d 2
94.0
7 3
39.1
3 4
47.1
7 4
56.2
2 4
15.9
6 4
17.7
3 4
15.3
9 4
17.5
9 4
18.0
6 4
19.1
9 4
19.6
9 4
23.9
4 4
26.6
9 4
29.1
0 4
98.8
0
SDR
Hol
ding
1.7
3 6
54.3
5 6
59.5
5 6
76.9
4 6
84.1
4 6
83.1
6 6
93.1
7 6
88.4
8 6
91.1
4 6
88.4
9 6
94.0
1 6
81.1
8 6
98.5
8 6
83.7
2 6
69.7
6
Fore
ign
Cur
.&
Bal.
with
Bank
s
241
.36
243
.05
861
.98
1,2
48.1
8 6
75.9
6 2
57.6
7 5
88.4
9 4
11.2
9 2
,209
.59
415
.03
714
.92
645
.76
661
.47
597
.73
881
.12
Fore
ign
Secu
ritie
s 1
,898
.18
3,2
84.5
6 4
,832
.32
4,7
63.8
8 5
,418
.52
5,3
53.8
0 5
,542
.69
5,4
93.5
9 3
,790
.78
5,4
01.8
8 4
,912
.83
5,2
00.3
1 5
,795
.60
5,7
12.2
4 6
,247
.53
Oth
ers
11.
38
12.
89
10.
62
10.
90
8.3
8 3
9.09
3
9.16
3
9.15
3
9.21
3
9.27
3
9.29
3
9.16
3
9.27
3
9.19
3
9.21
Tota
l 2
,446
.72
4,5
33.9
8 6
,811
.65
7,1
56.1
2 7
,202
.95
6,7
51.4
5 7
,278
.90
7,0
50.1
0 7
,148
.78
6,9
63.8
6 6
,780
.74
6,9
90.3
5 7
,621
.61
7,4
61.9
8 8
,336
.43
Cla
ims
on
Gov
ernm
ent
Gha
na
Gov
ernm
ent
Stoc
ks 8
59.3
9 1
,287
.88
1,1
32.2
7 1
,132
.36
1,1
47.3
8 2
,100
.76
2,1
00.8
1 2
,068
.87
2,0
43.8
9 2
,043
.97
2,1
01.3
4 2
,288
.03
2,5
32.4
7 2
,597
.43
2,6
76.3
2
Trea
sury
Bill
s 2
47.9
2 3
8.07
3
9.11
4
7.87
5
7.60
4
8.45
3
8.57
3
8.61
6
2.33
6
2.43
6
3.10
6
2.77
6
2.25
6
2.35
5
.78
Loan
s &
Adv
ance
s 1
,900
.02
898
.09
1,2
89.4
1 1
,289
.33
1,4
46.5
2 8
39.8
2 8
60.0
7 9
07.9
7 9
96.2
7 9
96.0
9 1
,032
.86
1,0
68.2
9 1
,105
.88
1,1
40.7
8 4
97.4
1
Reva
luat
ion
Stoc
k 4
88.6
0 3
46.5
8 3
09.2
7 3
46.5
8 3
46.5
8 0.
00
0.00
0.
00
0.00
0.
00
0.00
0.
00
0.00
0.
00
0.00
Tota
l 3
,495
.93
2,5
70.6
3 2
,770
.06
2,8
16.1
5 2
,998
.08
2,9
89.0
2 2
,999
.45
3,0
15.4
5 3
,102
.49
3,1
02.4
9 3
,197
.30
3,4
19.0
8 3
,700
.61
3,8
00.5
6 3
,179
.51
Cla
ims
on P
ublic
C
orpo
ratio
ns 1
9.03
2
49.5
3 4
97.5
4 7
09.0
4 1
,045
.58
964
.01
880
.22
907
.48
877
.32
1,0
70.8
2 1
,025
.70
1,0
89.9
9 8
56.1
1 7
54.5
6 8
49.5
6
Cla
ims
on
DM
Bs-4
8.49
3
95.2
3 1
13.4
0 1
17.9
6 1
33.0
8 1
17.9
7 1
23.6
8 1
13.9
2 1
20.8
8 1
63.5
9 1
35.0
8 1
36.7
6 1
43.4
6 1
03.4
5 1
05.1
4
Oth
er A
sset
s 2
99.3
6 3
98.1
8 6
30.6
5 4
77.1
9 5
51.3
8 6
20.3
1 6
90.8
3 6
02.7
2 8
61.8
4 6
72.6
2 7
25.1
3 8
43.6
8 7
69.1
0 1
,114
.28
1,1
07.8
1
Tota
l Ass
ets
6,2
12.5
6 8
,147
.54
10,8
23.2
9 1
1,27
6.46
1
1,93
0.93
11
,442
.75
11,
973.
07
11,
689.
66
12,1
11.3
2 11
,973
.39
11,
863.
94
12,
479.
86
13,0
90.8
9 13
,234
.82
13,5
78.4
4
Tabl
e 1.
Mon
etar
y Su
rvey
Tabl
e 2.
A
sset
s of
Ban
k of
Gha
na
STATISTICAL BULLETIN STATISTICAL BULLETIN12 13
(Mill
ions
of G
hana
Ced
is)
2008
20
09
2010
20
11
Dec
Dec
Dec
Jan
Feb
Mar
Apr
May
Jun
Jul
Aug
Sep
Oct
Nov
Dec
Cur
renc
y In
C
ircu
latio
n 1
,939
.19
2,3
43.8
0 3
,262
.72
3,0
56.3
5 2
,877
.04
2,8
99.4
0 3
,068
.45
3,0
96.2
2 3,
073.
89
3,0
05.5
9 3
,079
.61
3,1
94.9
5 3
,640
.11
3,6
66.3
8 4
,244
.27
Dep
osit
s
Gov
ernm
ent
2,0
48.0
6 1
,181
.11
1,3
98.8
0 1
,734
.76
2,3
87.1
7 1
,775
.16
1,4
98.9
5 1
,565
.42
2,5
13.5
5 2
,111
.03
2,2
73.2
1 2
,258
.31
1,9
42.2
6 1
,528
.93
1,2
36.4
6
Com
mer
cial
Ban
ks
386
.25
611
.38
984
.59
848
.79
1,1
04.4
4 1
,141
.42
1,0
04.8
6 1
,215
.25
1,0
39.3
2 1
,424
.27
1,2
14.2
0 1
,045
.56
1,3
96.1
3 1
,777
.02
1,3
59.2
0
Publ
ic In
stitu
tions
7
9.15
4
3.20
1
14.7
2 1
5.78
5
3.53
2
09.7
1 2
14.0
9 2
3.30
8
1.91
5
7.15
3
9.09
5
6.58
3
2.37
4
17.8
5 6
4.96
Tota
l 2
,513
.46
1,83
5.69
2
,498
.11
2,5
99.3
4 3
,545
.14
3,1
26.3
0 2
,717
.89
2,8
03.9
6 3,
634.
78
3,5
92.4
5 3
,526
.50
3,3
60.4
5 3
,370
.76
3,7
23.8
0 2
,660
.62
Fore
ign
Liab
ilitie
s 5
15.8
3 1
,263
.01
1,5
70.7
3 1
,506
.90
1,5
16.0
1 1
,514
.33
1,6
73.5
5 1
,514
.78
1,6
63.6
2 1
,664
.51
1,6
70.1
9 1
,679
.32
1,6
90.6
1 1
,670
.88
1,6
66.8
3
Cap
ital a
nd R
eser
ves
133
.09
-17.
37
90.
04
137
.49
-108
.65
-109
.30
-42.
60
154.
20
154
.39
154
.39
154
.39
154
.42
154
.42
154
.33
154
.42
Oth
er L
iabi
litie
s 1
,111
.00
2,7
22.4
0 3
,401
.96
3,9
79.3
8 4
,101
.39
4,0
12.0
2 4
,555
.78
4,0
89.4
9 3
,584
.65
3,5
56.4
5 3
,433
.25
4,0
90.7
2 4
,235
.00
4,0
19.4
3 4
,852
.30
Tota
l Lia
bilit
ies
6,21
2.56
8,
147.
54
10,
823.
29
11,
276.
46
11,
930.
93
11,4
42.7
5 11
,973
.07
11,6
89.6
6 2
,111
.32
11,9
73.3
9 11
,863
.94
12,
479.
86
13,
090.
89
13,
234.
82
13,
578.
44
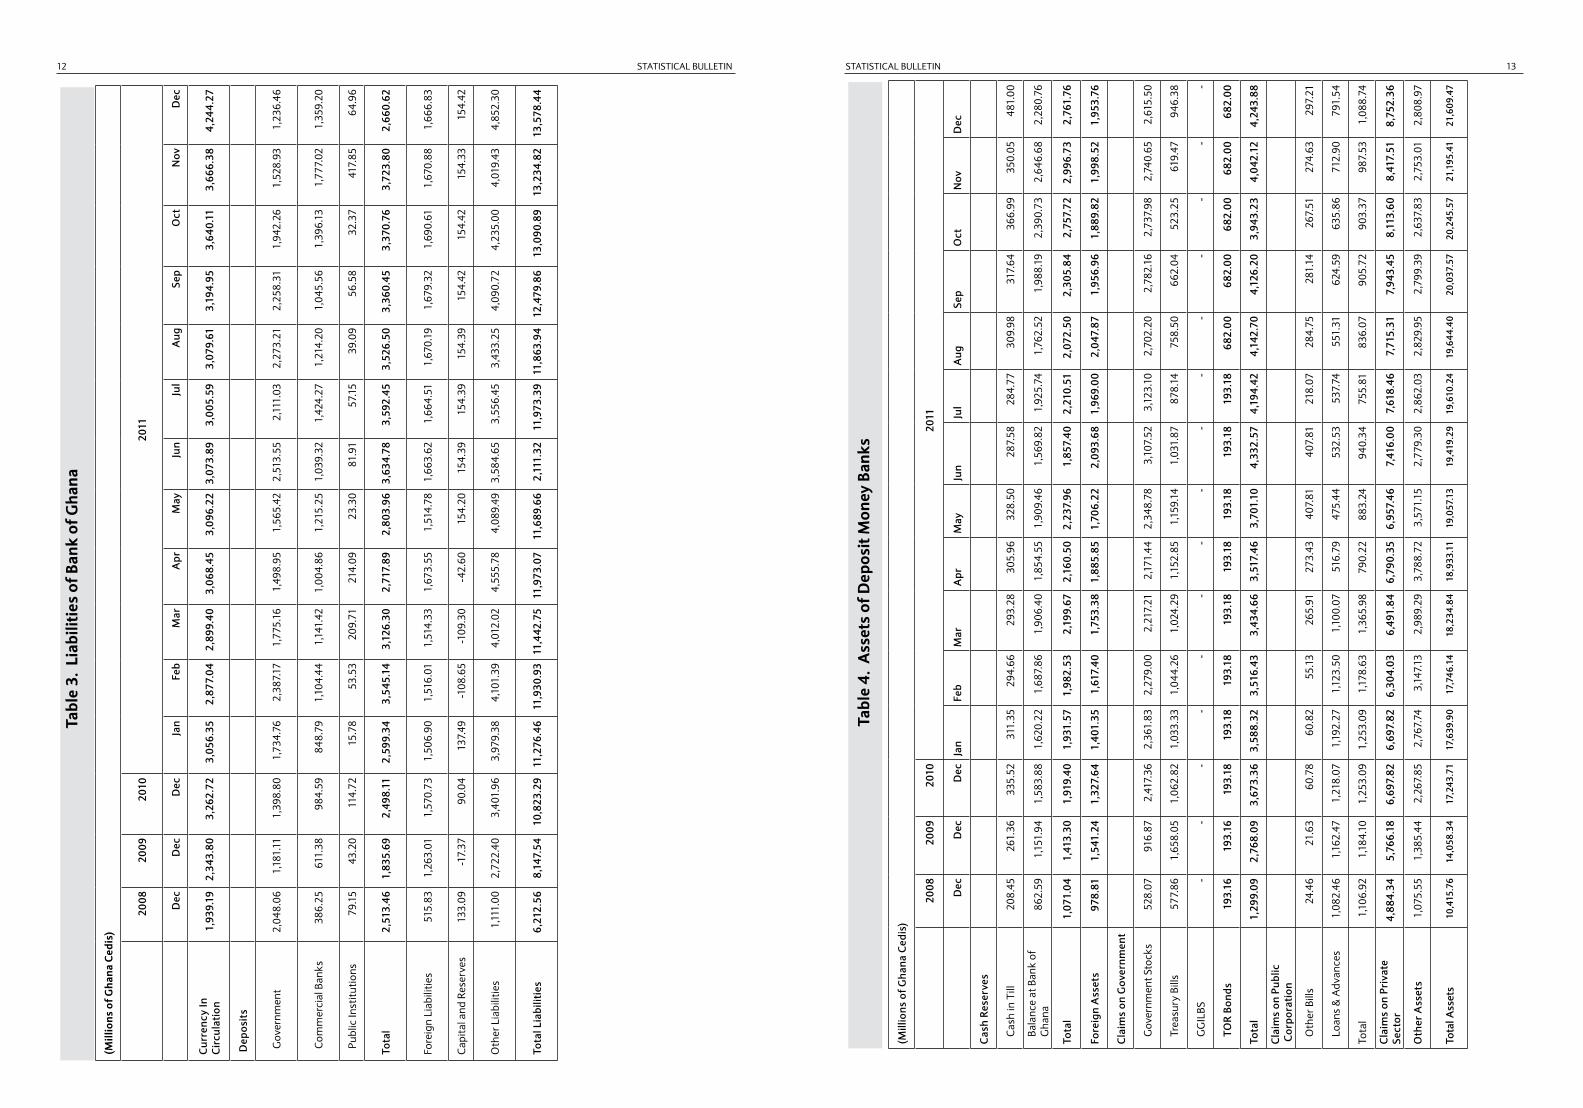
Tabl
e 3.
Lia
bilit
ies
of B
ank
of G
hana
Tabl
e 4.
Ass
ets
of D
epos
it M
oney
Ban
ks
(Mill
ions
of G
hana
Ced
is)
2008
20
09
2010
20
11
Dec
Dec
Dec
Jan
Feb
Mar
Apr
May
Jun
Jul
Aug
Sep
Oct
Nov
Dec
Cas
h Re
serv
es
Cas
h in
Till
208
.45
261
.36
335
.52
311
.35
294
.66
293
.28
305
.96
328
.50
287
.58
284
.77
309
.98
317
.64
366
.99
350
.05
481
.00
Bala
nce
at B
ank
of
Gha
na 8
62.5
9 1
,151
.94
1,5
83.8
8 1
,620
.22
1,6
87.8
6 1
,906
.40
1,8
54.5
5 1
,909
.46
1,5
69.8
2 1
,925
.74
1,7
62.5
2 1
,988
.19
2,3
90.7
3 2
,646
.68
2,2
80.7
6
Tota
l 1
,071
.04
1,4
13.3
0 1
,919
.40
1,9
31.5
7 1
,982
.53
2,1
99.6
7 2
,160
.50
2,2
37.9
6 1
,857
.40
2,2
10.5
1 2
,072
.50
2,3
05.8
4 2
,757
.72
2,9
96.7
3 2
,761
.76
Fore
ign
Ass
ets
978
.81
1,5
41.2
4 1
,327
.64
1,4
01.3
5 1
,617
.40
1,7
53.3
8 1
,885
.85
1,7
06.2
2 2
,093
.68
1,9
69.0
0 2
,047
.87
1,9
56.9
6 1
,889
.82
1,9
98.5
2 1
,953
.76
Cla
ims
on G
over
nmen
t
Gov
ernm
ent S
tock
s 5
28.0
7 9
16.8
7 2
,417
.36
2,3
61.8
3 2
,279
.00
2,2
17.2
1 2
,171
.44
2,3
48.7
8 3
,107
.52
3,1
23.1
0 2
,702
.20
2,7
82.1
6 2
,737
.98
2,7
40.6
5 2
,615
.50
Trea
sury
Bill
s 5
77.8
6 1
,658
.05
1,0
62.8
2 1
,033
.33
1,0
44.2
6 1
,024
.29
1,1
52.8
5 1
,159
.14
1,0
31.8
7 8
78.1
4 7
58.5
0 6
62.0
4 5
23.2
5 6
19.4
7 9
46.3
8
GG
ILBS
-
-
-
-
-
-
-
-
-
-
-
-
-
-
-
TOR
Bond
s 1
93.1
6 1
93.1
6 1
93.1
8 1
93.1
8 1
93.1
8 1
93.1
8 1
93.1
8 1
93.1
8 1
93.1
8 1
93.1
8 6
82.0
0 6
82.0
0 6
82.0
0 6
82.0
0 6
82.0
0
Tota
l 1
,299
.09
2,7
68.0
9 3
,673
.36
3,5
88.3
2 3
,516
.43
3,4
34.6
6 3
,517
.46
3,7
01.1
0 4
,332
.57
4,1
94.4
2 4
,142
.70
4,1
26.2
0 3
,943
.23
4,0
42.1
2 4
,243
.88
Cla
ims
on P
ublic
Cor
pora
tion
Oth
er B
ills
24.
46
21.
63
60.
78
60.
82
55.
13
265
.91
273
.43
407
.81
407
.81
218
.07
284
.75
281
.14
267
.51
274
.63
297
.21
Loan
s &
Adv
ance
s 1
,082
.46
1,1
62.4
7 1
,218
.07
1,1
92.2
7 1
,123
.50
1,1
00.0
7 5
16.7
9 4
75.4
4 5
32.5
3 5
37.7
4 5
51.3
1 6
24.5
9 6
35.8
6 7
12.9
0 7
91.5
4
Tota
l 1
,106
.92
1,1
84.1
0 1
,253
.09
1,2
53.0
9 1
,178
.63
1,3
65.9
8 7
90.2
2 8
83.2
4 9
40.3
4 7
55.8
1 8
36.0
7 9
05.7
2 9
03.3
7 9
87.5
3 1
,088
.74
Cla
ims
on P
riva
te
Sect
or4,
884.
34
5,7
66.1
8 6
,697
.82
6,6
97.8
2 6
,304
.03
6,4
91.8
4 6
,790
.35
6,9
57.4
6 7
,416
.00
7,6
18.4
6 7
,715
.31
7,9
43.4
5 8
,113
.60
8,4
17.5
1 8
,752
.36
Oth
er A
sset
s 1
,075
.55
1,3
85.4
4 2
,267
.85
2,7
67.7
4 3
,147
.13
2,9
89.2
9 3
,788
.72
3,5
71.1
5 2
,779
.30
2,8
62.0
3 2
,829
.95
2,7
99.3
9 2
,637
.83
2,7
53.0
1 2
,808
.97
Tota
l Ass
ets
10,4
15.7
6 1
4,05
8.34
17
,243
.71
17,6
39.9
0 17
,746
.14
18,2
34.8
4 18
,933
.11
19,0
57.1
3 1
9,41
9.29
19
,610
.24
19,
644.
40
20,
037.
57
20,
245.
57
21,
195.
41
21,
609.
47
STATISTICAL BULLETIN STATISTICAL BULLETIN14 15
(Mill
ions
of G
hana
Ced
is)
2008
20
09
2010
20
11
Dec
Dec
Dec
Jan
Feb
Mar
Apr
May
Jun
Jul
Aug
Sep
Oct
Nov
Dec
PRIV
ATE
SEC
TOR
DEP
OSI
TS
Dem
and
Dep
osit
s 1
,686
.60
1,6
48.3
6 2
,963
.74
2,9
94.2
5 2
,942
.07
3,1
33.9
8 3
,159
.42
3,1
97.0
1 3
,274
.10
3,3
78.1
6 3
,544
.45
3,7
02.6
8 3
,917
.72
3,9
69.5
1 4
,337
.14
Fore
ign
Cur
renc
y D
epos
its
1,8
16.8
1 2
,661
.34
2,7
27.9
1 2
,978
.11
3,1
60.8
6 3
,268
.96
3,3
78.2
3 3
,387
.53
3,6
69.6
4 3
,754
.24
3,7
12.7
9 3
,791
.39
3,8
11.2
7 4
,084
.12
3,9
54.1
5
Savi
ngs
Dep
osit
s 9
64.0
9 1
,256
.52
1,8
75.2
4 1
,893
.66
1,9
24.8
2 1
,969
.77
2,0
40.8
8 2
,085
.88
2,1
34.8
8 2
,222
.98
2,2
09.6
0 2
,259
.60
2,2
95.3
6 2
,395
.02
2,5
54.5
2
Tim
e D
epos
its
1,2
46.1
1 1
,825
.91
2,2
84.1
9 2
,207
.53
2,2
24.0
3 2
,278
.58
2,2
30.5
7 2
,331
.99
2,3
43.5
5 2
,279
.87
2,3
03.2
4 2
,268
.11
2,3
70.3
8 2
,283
.48
2,5
20.6
0
Tota
l 5
,713
.61
7,3
92.1
3 9
,851
.08
10,
073.
55
10,
251.
78
10,
651.
29
10,
809.
10
11,
002.
42
11,
422.
17
11,
635.
25
11,
770.
08
12,
021.
78
12,
394.
73
12,7
32.1
3 1
3,36
6.42
PUBL
IC S
ECTO
R D
EPO
SITS
Dem
and
Dep
osit
s 4
06.2
3 3
31.2
3 3
48.5
7 3
83.1
5 4
28.6
5 4
26.9
1 4
77.4
1 5
02.2
1 4
70.3
5 5
01.7
5 3
95.8
6 4
83.4
0 8
00.3
8 7
74.5
3 4
37.8
9
Savi
ngs
Dep
osit
s 1
.27
1.1
4 2
.33
3.3
3 2
.22
2.3
8 0
.74
1.2
1 1
.87
0.7
7 1
.26
3.0
5 3
.71
5.6
5 3
.29
Tim
e D
epos
its
231
.25
318
.76
371
.51
362
.55
352
.88
375
.18
415
.34
383
.33
391
.21
401
.42
370
.38
364
.79
375
.10
449
.48
448
.23
Tota
l 6
38.7
5 6
51.1
3 7
22.4
2 7
49.0
3 7
83.7
6 8
04.4
7 8
93.5
0 8
86.7
4 8
63.4
3 9
03.9
5 7
67.5
0 8
51.2
5 1
,179
.19
1,2
29.6
7 8
89.4
1
GO
VER
NM
ENT
DEP
OSI
TS 3
49.4
5 4
82.1
3 7
95.9
4 8
10.8
2 7
50.3
0 8
05.8
1 8
28.0
5 8
60.5
5 8
31.8
6 8
72.1
6 8
57.8
6 8
92.9
5 9
22.3
7 9
41.8
0 1
,006
.38
FOR
EIG
N L
IABI
LITI
ES 7
23.9
7 8
77.1
7 8
14.5
9 9
21.8
7 7
40.6
1 7
67.2
1 9
96.6
3 7
83.7
5 7
86.9
4 7
09.5
6 7
42.8
3 7
16.9
0 6
44.0
1 6
52.9
1 7
43.4
0
CR
EDIT
FRO
M
BAN
K O
F G
HA
NA
12.
48
443
.85
134
.80
138
.54
137
.54
137
.92
140
.98
160
.50
133
.96
134
.00
106
.72
108
.29
79.
44
79.
86
80.
59
PAID
-UP
CA
PITA
L &
RES
ERV
ES 1
,195
.82
1,7
89.6
5 2
,336
.26
2,4
74.1
6 2
,528
.79
2,5
61.8
0 2
,562
.89
2,5
80.1
2 2
,637
.36
2,6
59.7
4 2
,694
.74
2,7
49.8
7 2
,824
.87
2,8
56.7
1 3
,048
.19
OTH
ER L
IABI
LITI
ES 1
,781
.67
2,4
22.2
9 2
,588
.61
2,4
71.9
4 2
,553
.37
2,5
06.3
3 2
,701
.96
2,7
83.0
6 2
,743
.56
2,6
95.5
8 2
,704
.68
2,6
96.5
3 2
,200
.97
2,7
02.3
3 2
,475
.10
TOTA
L LI
ABI
LITI
ES10
,415
.76
14,0
58.3
4 17
,243
.71
17,
639.
90
17,
746.
14
18,
234.
84
18,
933.
11
19,0
57.1
3 1
9,41
9.29
1
9,61
0.24
1
9,64
4.40
2
0,03
7.57
20
,245
.57
21,
195.
41
21,6
09.4
7
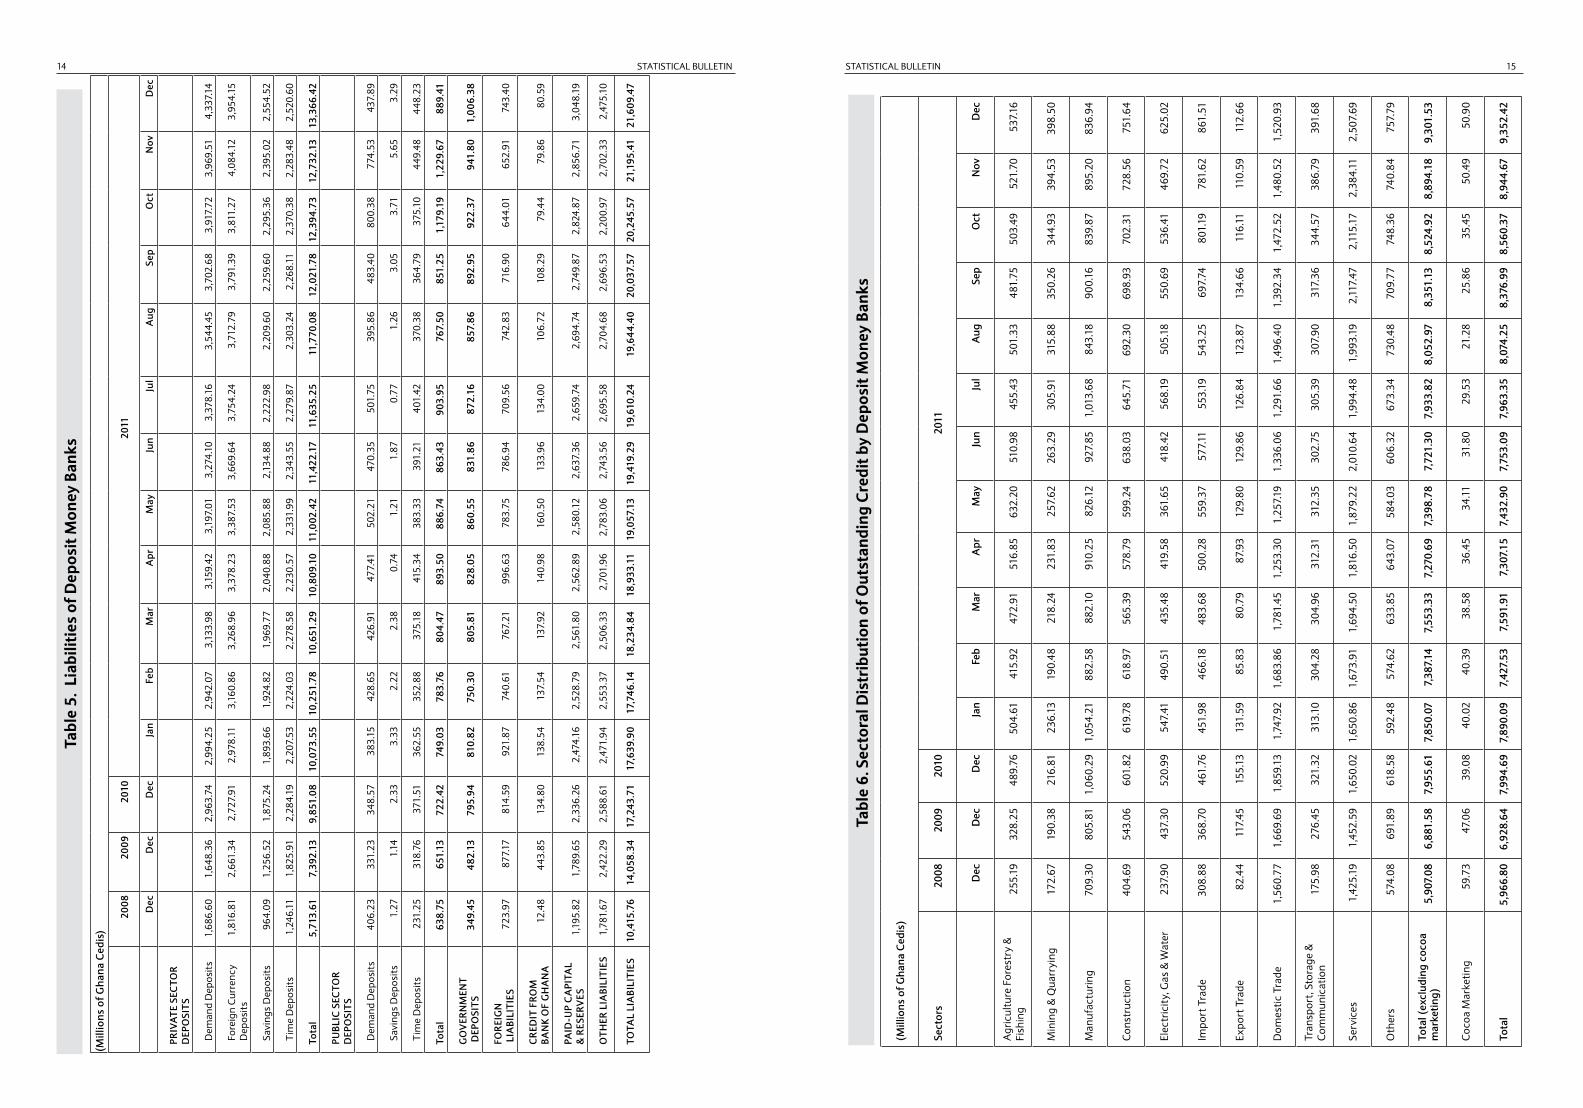
Tabl
e 5.
Lia
bilit
ies
of D
epos
it M
oney
Ban
ks
Tabl
e 6.
Sec
tora
l Dis
trib
utio
n of
Out
stan
ding
Cre
dit b
y D
epos
it M
oney
Ban
ks
(Mill
ions
of G
hana
Ced
is)
Sect
ors
200
8 2
009
201
0 20
11
Dec
Dec
Dec
Jan
Feb
Mar
Apr
May
Jun
Jul
Aug
Sep
Oct
Nov
Dec
Agr
icul
ture
For
estr
y &
Fi
shin
g 2
55.1
9 3
28.2
5 4
89.7
6 5
04.6
1 4
15.9
2 4
72.9
1 5
16.8
5 6
32.2
0 5
10.9
8 4
55.4
3 5
01.3
3 4
81.7
5 5
03.4
9 5
21.7
0 5
37.1
6
Min
ing
& Q
uarr
ying
172
.67
190
.38
216
.81
236
.13
190
.48
218
.24
231
.83
257
.62
263
.29
305
.91
315
.88
350
.26
344
.93
394
.53
398
.50
Man
ufac
turin
g 7
09.3
0 8
05.8
1 1
,060
.29
1,05
4.21
8
82.5
8 8
82.1
0 9
10.2
5 8
26.1
2 9
27.8
5 1
,013
.68
843
.18
900
.16
839
.87
895
.20
836
.94
Con
stru
ctio
n 4
04.6
9 5
43.0
6 6
01.8
2 6
19.7
8 6
18.9
7 5
65.3
9 5
78.7
9 5
99.2
4 6
38.0
3 6
45.7
1 6
92.3
0 6
98.9
3 7
02.3
1 7
28.5
6 7
51.6
4
Elec
tric
ity,
Gas
& W
ater
237
.90
437
.30
520
.99
547
.41
490
.51
435
.48
419
.58
361
.65
418
.42
568
.19
505
.18
550
.69
536
.41
469
.72
625
.02
Impo
rt T
rade
308
.88
368
.70
461
.76
451
.98
466
.18
483
.68
500
.28
559
.37
577
.11
553
.19
543
.25
697
.74
801
.19
781
.62
861
.51
Expo
rt T
rade
82.
44
117
.45
155
.13
131
.59
85.
83
80.
79
87.
93
129
.80
129
.86
126
.84
123
.87
134
.66
116
.11
110
.59
112
.66
Dom
estic
Tra
de 1
,560
.77
1,6
69.6
9 1
,859
.13
1,7
47.9
2 1
,683
.86
1,7
81.4
5 1
,253
.30
1,2
57.1
9 1
,336
.06
1,2
91.6
6 1
,496
.40
1,3
92.3
4 1
,472
.52
1,4
80.5
2 1
,520
.93
Tran
spor
t, St
orag
e &
C
omm
unic
atio
n 1
75.9
8 2
76.4
5 3
21.3
2 3
13.1
0 3
04.2
8 3
04.9
6 3
12.3
1 3
12.3
5 3
02.7
5 3
05.3
9 3
07.9
0 3
17.3
6 3
44.5
7 3
86.7
9 3
91.6
8
Serv
ices
1,4
25.1
9 1
,452
.59
1,6
50.0
2 1,
650.
86
1,6
73.9
1 1
,694
.50
1,8
16.5
0 1,
879.
22
2,0
10.6
4 1,
994.
48
1,9
93.1
9 2
,117
.47
2,1
15.1
7 2
,384
.11
2,5
07.6
9
Oth
ers
574
.08
691
.89
618
.58
592
.48
574
.62
633
.85
643
.07
584
.03
606
.32
673
.34
730
.48
709
.77
748
.36
740
.84
757
.79
Tota
l (ex
clud
ing
coco
a m
arke
ting)
5,9
07.0
8 6
,881
.58
7,9
55.6
1 7,
850.
07
7,3
87.1
4 7
,553
.33
7,2
70.6
9 7,
398.
78
7,7
21.3
0 7,
933.
82
8,0
52.9
7 8
,351
.13
8,52
4.92
8
,894
.18
9,3
01.5
3
Coc
oa M
arke
ting
59.
73
47.
06
39.
08
40.
02
40.
39
38.
58
36.
45
34.
11
31.
80
29.
53
21.
28
25.
86
35.
45
50.
49
50.
90
Tota
l 5,
966.
80
6,9
28.6
4 7
,994
.69
7,89
0.09
7
,427
.53
7,5
91.9
1 7
,307
.15
7,43
2.90
7
,753
.09
7,96
3.35
8
,074
.25
8,3
76.9
9 8,
560.
37
8,9
44.6
7 9
,352
.42
STATISTICAL BULLETIN STATISTICAL BULLETIN16 17
(Mill
ions
of G
hana
Ced
is)
2008
20
09
2010
20
11
Dec
Dec
Dec
Jan
Feb
Mar
Apr
May
Jun
Jul
Aug
Sep
Oct
Nov
Dec
Liqu
idity
Res
erve
s
Prim
ary
Rese
rve
Dom
estic
426
.5
486
.8
820
.7
871
.1
935
.3
859
.1
909
.5
929
.6
981
.0
981
.9
1,0
17.3
9
94.0
1,
100.
61,
222.
01,
391.
5
Fore
ign
337
.3
486
.2
366
.0
370
.9
399
.1
412
.5
397
.2
419
.5
423
.4
426
.8
466
.8
472
.9
501.
151
8.5
518.
5
Tota
l 7
63.8
9
72.9
1
,186
.8
1,2
42.0
1
,334
.3
1,2
71.6
1
,306
.7
1,3
49.1
1
,404
.4
1,4
08.7
1
,484
.1
1,4
66.9
1,
601.
61,
910.
01,
910.
0
Dep
osits
Dom
estic
4,5
51.9
6
,017
.0
8,4
01.8
8
,854
.5
8,9
73.6
8
,751
.5
9,2
53.1
9
,364
.5
9,7
10.0
9
,619
.5
9,5
56.0
9
,744
.8
10,5
17.5
10,8
37.4
10,8
37.4
Fore
ign
1,5
46.1
2
,262
.3
2,4
40.2
2
,866
.7
3,0
86.2
3
,348
.9
3,4
70.2
3
,564
.7
3,5
99.1
3
,778
.8
3,8
66.5
3
,954
.7
3,83
0.9
3,81
5.2
4,02
6.7
Tota
l 6
,098
.0
8,2
79.4
1
0,84
2.0
11,
721.
1 1
2,05
9.9
12,
100.
5 12
,723
.3
12,9
29.2
1
3,30
9.1
13,
398.
3 13
,422
.5
13,6
99.5
14
,348
.414
,424
.214
,864
.1
Rese
rve
Rat
ios
(%)
Requ
irem
ents
Prim
ary
Rese
rve
Ratio
(Dom
estic
) 9
.4
8.1
9
.8
9.8
1
0.4
9.8
9
.8
9.9
1
0.1
10.
2 1
0.6
10.
2 10
.511
.512
.8
Prim
ary
Rese
rve
Ratio
(For
eign
) 2
1.8
21.
5 1
5.0
12.
9 1
2.9
12.
3 1
1.4
11.
8 1
1.8
11.
3 1
2.1
12.
0 13
.113
.712
.9
*Pri
mar
y Re
serv
e M
inim
um R
atio
Req
uire
men
t is
9 pe
rcen
tFo
r Dom
estic
Dep
osit
s =
9 pe
rcen
tFo
r For
eign
Dep
osit
s =
9 pe
rcen
t in
thei
r res
pect
ive
curr
enci
es
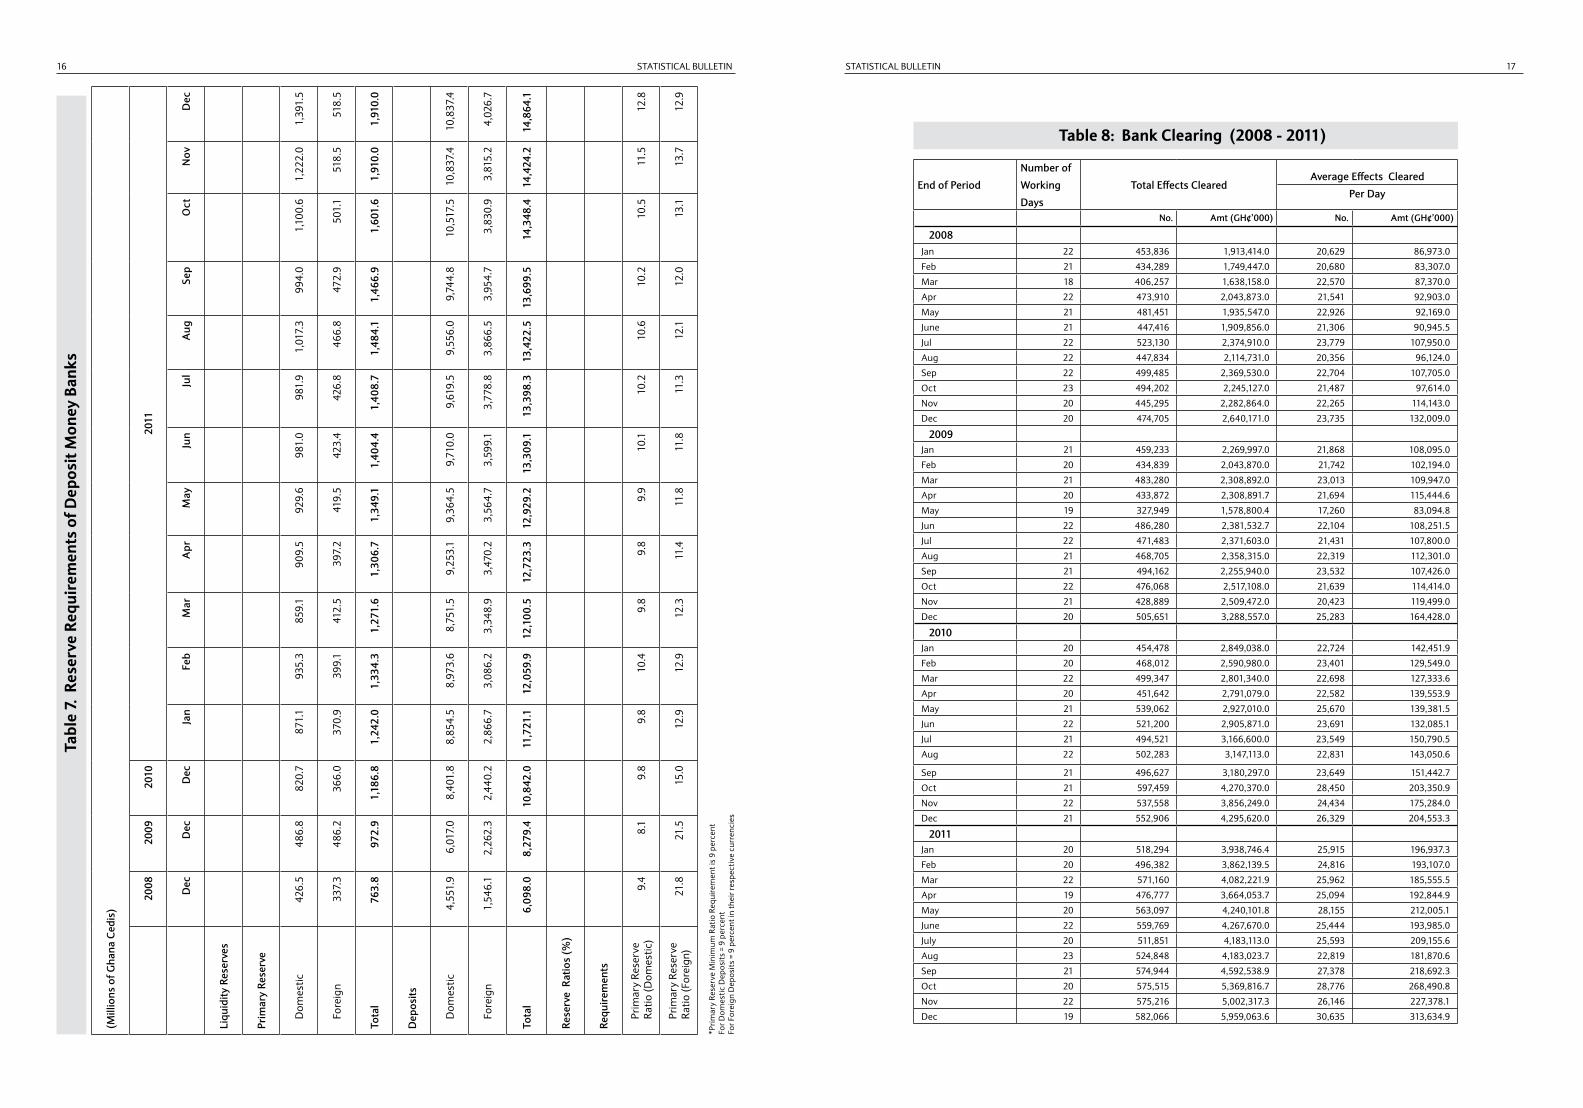
Tabl
e 7.
Res
erve
Req
uire
men
ts o
f Dep
osit
Mon
ey B
anks
Table 8: Bank Clearing (2008 - 2011)
End of Period
Number of
Working
Days
Total Effects ClearedAverage Effects Cleared
Per Day
No. Amt (GH¢’000) No. Amt (GH¢’000)
2008Jan 22 453,836 1,913,414.0 20,629 86,973.0
Feb 21 434,289 1,749,447.0 20,680 83,307.0
Mar 18 406,257 1,638,158.0 22,570 87,370.0
Apr 22 473,910 2,043,873.0 21,541 92,903.0
May 21 481,451 1,935,547.0 22,926 92,169.0
June 21 447,416 1,909,856.0 21,306 90,945.5
Jul 22 523,130 2,374,910.0 23,779 107,950.0
Aug 22 447,834 2,114,731.0 20,356 96,124.0
Sep 22 499,485 2,369,530.0 22,704 107,705.0
Oct 23 494,202 2,245,127.0 21,487 97,614.0
Nov 20 445,295 2,282,864.0 22,265 114,143.0
Dec 20 474,705 2,640,171.0 23,735 132,009.0
2009Jan 21 459,233 2,269,997.0 21,868 108,095.0
Feb 20 434,839 2,043,870.0 21,742 102,194.0
Mar 21 483,280 2,308,892.0 23,013 109,947.0
Apr 20 433,872 2,308,891.7 21,694 115,444.6
May 19 327,949 1,578,800.4 17,260 83,094.8
Jun 22 486,280 2,381,532.7 22,104 108,251.5
Jul 22 471,483 2,371,603.0 21,431 107,800.0
Aug 21 468,705 2,358,315.0 22,319 112,301.0
Sep 21 494,162 2,255,940.0 23,532 107,426.0
Oct 22 476,068 2,517,108.0 21,639 114,414.0
Nov 21 428,889 2,509,472.0 20,423 119,499.0
Dec 20 505,651 3,288,557.0 25,283 164,428.0
2010Jan 20 454,478 2,849,038.0 22,724 142,451.9
Feb 20 468,012 2,590,980.0 23,401 129,549.0
Mar 22 499,347 2,801,340.0 22,698 127,333.6
Apr 20 451,642 2,791,079.0 22,582 139,553.9
May 21 539,062 2,927,010.0 25,670 139,381.5
Jun 22 521,200 2,905,871.0 23,691 132,085.1
Jul 21 494,521 3,166,600.0 23,549 150,790.5
Aug 22 502,283 3,147,113.0 22,831 143,050.6
Sep 21 496,627 3,180,297.0 23,649 151,442.7
Oct 21 597,459 4,270,370.0 28,450 203,350.9
Nov 22 537,558 3,856,249.0 24,434 175,284.0
Dec 21 552,906 4,295,620.0 26,329 204,553.3
2011Jan 20 518,294 3,938,746.4 25,915 196,937.3
Feb 20 496,382 3,862,139.5 24,816 193,107.0
Mar 22 571,160 4,082,221.9 25,962 185,555.5
Apr 19 476,777 3,664,053.7 25,094 192,844.9
May 20 563,097 4,240,101.8 28,155 212,005.1
June 22 559,769 4,267,670.0 25,444 193,985.0
July 20 511,851 4,183,113.0 25,593 209,155.6
Aug 23 524,848 4,183,023.7 22,819 181,870.6
Sep 21 574,944 4,592,538.9 27,378 218,692.3
Oct 20 575,515 5,369,816.7 28,776 268,490.8
Nov 22 575,216 5,002,317.3 26,146 227,378.1
Dec 19 582,066 5,959,063.6 30,635 313,634.9
STATISTICAL BULLETIN STATISTICAL BULLETIN18 19
(Mill
ions
of G
hana
Ced
is)
2008
2009
2010
2011
Q1
Q2
Q3
Q4
Q1
Q2
Q3
Q4
Q1
Q2
Q3
Q4
Q1
Q2
Ass
ets
Cas
h H
oldi
ngs
& B
al-
ance
s
w
ith B
anks
60.
87
58.
13
61.
87
69.
69
85.
05
82.
25
80.
68
91.
29
85.
91
97.
86
97.
29
136
.46
99.
74
140
.11
Bill
s an
d Bo
nds
114
.74
108
.64
107
.28
110
.82
122
.98
139
.12
146
.64
186
.35
202
.90
213
.27
195
.26
289
.37
240.
96
313
.63
Loa
ns a
nd A
dvan
ces
170
.41
183
.48
202
.28
209
.76
212
.19
223
.97
230
.86
239
.38
242
.03
259
.83
272
.60
311
.06
268.
15
356
.47
Oth
er A
sset
s 5
8.31
6
5.81
7
1.20
7
1.69
7
6.54
8
6.88
8
8.32
9
3.31
9
4.73
1
03.0
7 1
01.0
4 1
22.2
3 11
2.84
1
53.1
1
Tot
al A
sset
s 4
04.3
4 4
16.0
6 4
42.6
3 4
61.9
6 4
96.7
6 5
32.2
2 5
46.5
0 6
10.3
3 6
25.5
7 6
74.0
3 6
66.2
0 8
59.1
3 72
1.69
9
63.3
2
Lia
bilit
ies
Tot
al D
epos
its
305
.18
311
.34
324
.32
343
.72
372
.47
383
.21
394
.10
445
.73
459
.71
498
.78
492
.95
667
.31
547.
95
738
.83
Sha
reho
lder
s’ F
unds
52.
46
52.
66
57.
58
61.
64
66.
48
70.
35
75.
26
80.
78
86.
55
92.
99
90.
02
104
.47
88.
51
114
.35
Oth
er L
iabi
litie
s 4
6.69
5
2.06
6
0.73
5
6.60
5
7.81
7
8.65
7
7.14
8
3.82
7
9.32
8
2.26
8
3.20
8
7.34
8
5.23
1
10.1
5
Tot
al L
iabi
litie
s 4
04.3
4 4
16.0
6 4
42.6
3 4
61.9
6 4
96.7
6 5
32.2
2 5
46.5
0 6
10.3
3 6
25.5
7 6
74.0
3 6
66.2
0 8
59.1
3 72
1.69
9
63.3
2
No.
of R
epor
ting
Bank
s12
512
512
612
812
812
812
812
812
813
513
513
513
513
5
Tabl
e 9.
Con
solid
ated
Ass
ets
and
Liab
ilitie
s of
Rur
al/C
omm
unity
Ban
ks
2008
2009
20
10
2011
Dec
. D
ec.
Dec
.Ja
nFe
bM
arA
prM
ayJu
nJu
lA
ugSe
pO
ctN
ovD
ec1.
CEN
TRA
L BA
NK
(EN
D P
ERIO
D
RAT
ES)
a. R
edis
coun
t Rat
e (B
ank
Rat
e)b.
Pri
me
Rat
e17
.00
18.0
013
.50
13.5
013
.50
13.5
013
.50
13.0
013
.00
12.5
012
.50
12.5
0 12
.50
12.5
0 12
.50
BAN
K O
F G
HA
NA
BIL
LS a
. 14-
Day
Dis
coun
t Rat
es18
.50
18.3
711
.70
11.7
011
.70
11.7
011
.70
11.7
011
.70
11.7
011
.70
11.7
0 11
.70
11.7
0 11
.70
b. 1
4-D
ay In
tere
st R
ate
Equi
vale
nt18
.63
18.5
011
.75
11.7
511
.75
11.7
511
.75
11.7
511
.75
11.7
511
.75
11.7
5 11
.75
11.7
5 11
.75
c. 2
8-D
ay D
isco
unt R
ates
19.4
018
.50
11.9
711
.75
11.7
511
.75
11.7
511
.75
11.7
511
.75
11.7
511
.75
11.7
5 11
.75
11.7
5 d
. 28-
Day
Inte
rest
Rat
eEqu
ival
ent
19.6
918
.77
12.0
811
.86
11.8
611
.86
11.8
611
.86
11.8
611
.86
11.8
611
.86
11.8
611
.86
11.8
6 e
. 56-
Day
Dis
coun
t Rat
es15
.25
15.2
512
.00
11.7
711
.77
11.7
711
.77
11.7
711
.77
11.7
711
.77
11.7
7 11
.77
11.7
7 11
.77
f. 5
6-D
ay In
tere
st R
ate
Equi
vale
nt15
.62
15.6
212
.23
11.9
911
.99
11.9
911
.99
11.9
911
.99
11.9
911
.99
11.9
911
.99
11.9
911
.99
TREA
SURY
BIL
LS, N
OTE
S &
BO
ND
Sa.
91-
Day
Dis
coun
t Rat
e23
.24
22.3
811
.91
11.8
011
.77
11.7
511
.73
10.8
710
.31
10.1
39.
199.
189.
059.
0410
.05
b. 9
1-D
ay In
tere
st R
ate
Equi
vale
nt
24.6
723
.70
12.2
812
.16
12.1
212
.11
12.0
811
.17
10.5
810
.39
9.40
9.39
9.26
9.25
10.3
0c.
2-y
ear F
ixed
Rat
e N
ote
21.0
024
.75
12.7
012
.55
12.5
212
.49
12.4
912
.33
12.1
111
.95
11.5
011
.90
10.9
012
.10
12.4
0d.
3-y
ear F
ixed
Rat
e N
ote
16.0
016
.00
13.3
013
.30
13.4
513
.45
13.4
513
.45
13.0
013
.00
13.0
013
.00
12.0
012
.00
12.0
0e.
5-y
ear F
ixed
Rat
e N
ote
13.6
713
.67
13.6
713
.67
13.6
713
.67
13.6
713
.67
13.6
713
.67
13.6
713
.67
14.0
014
.00
14.0
0IN
TER-
BAN
K M
ARK
ET a
. In
ter-
bank
wei
ghte
d av
erag
e19
.03
16.5
111
.65
11.6
511
.65
11.5
911
.57
11.6
711
.63
11.3
810
.51
10.5
910
.51
9.18
6.55
2. C
OM
MER
CIA
L BA
NKS
A. B
orro
win
g Ra
tes.
(%)
i. D
eman
d D
epos
its
0.25
-7.5
00.
25-7
.00
0.25
-7.0
00.
25-6
.75
0.25
-6.7
50.
25-6
.75
0.25
-6.7
50.
25-6
.50
0.25
-6.5
00.
25-6
.50
0.25
-6.5
00.
25-6
.50
0.25
-6.5
00.
25-6
.50
0.25
-6.5
0ii.
Sav
ings
Dep
osit
s2.
00-1
6.00
2.00
-18.
002.
00-1
8.00
1.00
-11.
001.
00-1
2.50
1.00
-12.
001.
00-1
2.00
0.75
-12.
000.
75-8
.00
0.75
-8.0
00.
75-8
.00
0.75
-8.0
00.
75-8
.00
0.10
-8.0
00.
10-8
.00
iii. T
ime
Dep
osit
s1
mon
th4.
50-2
3.50
5.25
-30.
505.
25-2
3.00
5.00
-13.
505.
00-1
3.50
5.00
-13.
205.
00-1
2.50
5.00
-12.
003.
00-1
2.50
3.00
-12.
503.
00-1
1.50
3.00
-11.
503.
00-1
1.50
3.00
-11.
503.
00-1
1.50
3 m
onth
s6.
25-2
6.50
10.0
0-28
.00
10.0
0-25
.75
4.00
-17.
504.
00-1
7.50
4.00
-15.
004.
00-1
3.95
4.00
-13.
754.
00-1
3.80
4.00
-13.
804.
00-1
2.50
4.00
-12.
504.
00-1
2.50
3.00
-12.
503.
00-1
2.50
6 m
onth
s6.
25-2
7.50
11.0
0-30
.00
10.0
0-27
.00
4.00
-18.
804.
00-1
5.25
4.00
-15.
254.
00-1
5.00
4.00
-15.
004.
00-1
4.00
4.00
-14.
004.
00-1
3.50
4.00
-13.
004.
00-1
3.00
3.00
-13.
003.
00-1
3.00
12 m
onth
s3.
50-2
4.50
9.50
-27.
509.
50-2
6.00
4.50
-18.
504.
50-1
5.50
4.50
-15.
504.
50-1
4.75
5.00
-14.
755.
00-1
4.50
5.00
-14.
504.
00-1
4.50
4.00
-14.
254.
00-1
4.25
4.00
-14.
254.
00-1
4.25
24 m
onth
s10
.00-
21.5
010
.00-
22.0
010
.00-
22.0
03.
50-1
3.00
3.50
-13.
003.
50-1
3.15
3.50
-13.
152.
50-1
4.25
2.50
-14.
502.
50-1
4.50
2.50
-14.
252.
50-1
4.25
2.50
-14.
252.
50-1
4.25
2.50
-14.
2536
mon
ths
11.0
0-22
.00
11.0
0-18
.00
14.0
0-18
.00
3.50
-13.
003.
50-1
3.00
3.50
-12.
003.
50-1
2.00
3.00
-12.
503.
00-1
4.50
3.00
-14.
503.
00-1
2.00
3.00
-11.
503.
00-1
1.50
3.00
-11.
503.
00-1
1.50
iv.
Cer
tifica
tes
of D
epos
it12
.00-
16.0
015
.00-
26.0
013
.00-
26.0
05.
75-1
2.50
5.75
-12.
505.
75-1
2.50
5.75
-12.
505.
75-1
2.50
5.75
-12.
505.
75-1
2.50
3.00
-10.
003.
00-1
0.00
3.00
-10.
003.
00-1
0.00
3.00
-10.
00v.
C
all
Mon
ey1.
00-1
6.00
4.50
-23.
004.
50-1
9.00
2.00
-13.
002.
00-1
3.00
2.00
-13.
002.
00-1
2.00
2.00
-12.
003.
00-1
2.00
3.00
-12.
003.
00-1
2.00
3.00
-12.
003.
00-1
2.00
3.00
- 9
.00
3.00
- 9
.00
vi.
Any
oth
er
2.50
-22.
598.
00-2
3.84
10.0
0-15
.42
4.00
-12.
504.
00-1
2.50
4.00
-12.
504.
00-1
2.50
3.75
-12.
503.
75-1
2.50
3.75
-12.
503.
75-1
2.50
3.75
-12.
503.
75-1
2.50
2.00
-12.
502.
00-1
2.50
B: L
endi
ng R
ates
.(%
)i.
Agr
icul
ture
, For
estr
y &
Fis
hing
19.5
0-44
.00
25.7
5-40
.00
24.7
5-40
.00
19.0
0-36
.25
19.0
0-34
.90
19.0
0-34
.64
19.0
0-34
.90
19.0
0-36
.02
19.0
0-34
.90
19.0
0-34
.90
19.0
0-34
.90
19.0
0-34
.90
19.0
0-34
.90
16.9
5-34
.90
16.9
5-34
.90
ii. E
xpor
t Tra
de19
.50-
44.0
025
.75-
40.0
025
.00-
40.0
019
.00-
36.2
519
.00-
35.1
519
.00-
35.1
519
.00-
35.1
519
.00-
36.0
219
.00-
34.9
019
.00-
34.9
019
.00-
34.9
019
.00-
34.9
019
.00-
34.9
016
.95-
34.9
016
.95-
34.9
0 ii
i. M
anuf
actu
ring
19.5
0-44
.00
25.7
5-40
.00
25.0
0-40
.00
19.0
0-36
.25
19.0
0-35
.53
19.0
0-35
.53
19.0
0-35
.53
19.0
0-36
.02
19.0
0-34
.90
19.0
0-34
.90
19.0
0-34
.90
19.0
0-34
.90
19.0
0-34
.90
16.9
5-34
.90
16.9
5-34
.90
iv. M
inin
g &
Qua
rryi
ng19
.50-
44.0
025
.75-
40.0
025
.00-
40.0
019
.00-
36.2
519
.00-
36.2
519
.00-
36.0
219
.00-
36.0
219
.00-
36.0
219
.00-
34.9
019
.00-
34.9
019
.00-
34.9
019
.00-
34.9
019
.00-
34.9
016
.95-
34.9
016
.95-
34.9
0v.
Con
stru
ctio
n19
.50-
44.0
025
.75-
40.0
025
.00-
40.0
019
.00-
36.2
519
.00-
36.2
519
.00-
36.0
219
.00-
34.7
019
.00-
36.0
219
.00-
34.9
019
.00-
34.9
019
.00-
34.9
019
.00-
34.9
019
.00-
34.9
016
.95-
34.9
016
.95-
34.9
0vi
. Oth
ers
19.5
0-44
.00
25.7
5-40
.00
25.0
0-40
.00
19.0
0-36
.25
19.0
0-36
.25
19.0
0-36
.02
19.0
0-36
.02
19.0
0-36
.02
19.0
0-34
.90
19.0
0-34
.90
19.0
0-34
.90
19.0
0-34
.90
19.0
0-34
.90
16.9
5-34
.90
16.9
5-34
.90
C: B
ase
Rate
s (%
)24
.00-
27.7
526
.95-
32.0
024
.74-
32.0
021
.50-
27.0
021
.50-
27.0
021
.50-
27.0
020
.50-
27.0
020
.00-
27.0
020
.00-
27.0
018
.00-
27.5
018
.00-
27.0
018
.00-
27.0
016
.95-
27.0
016
.95-
25.9
516
.95-
25.9
5
Tabl
e 10
. Int
eres
t Ra
tes
- Ran
ges
- (%
)
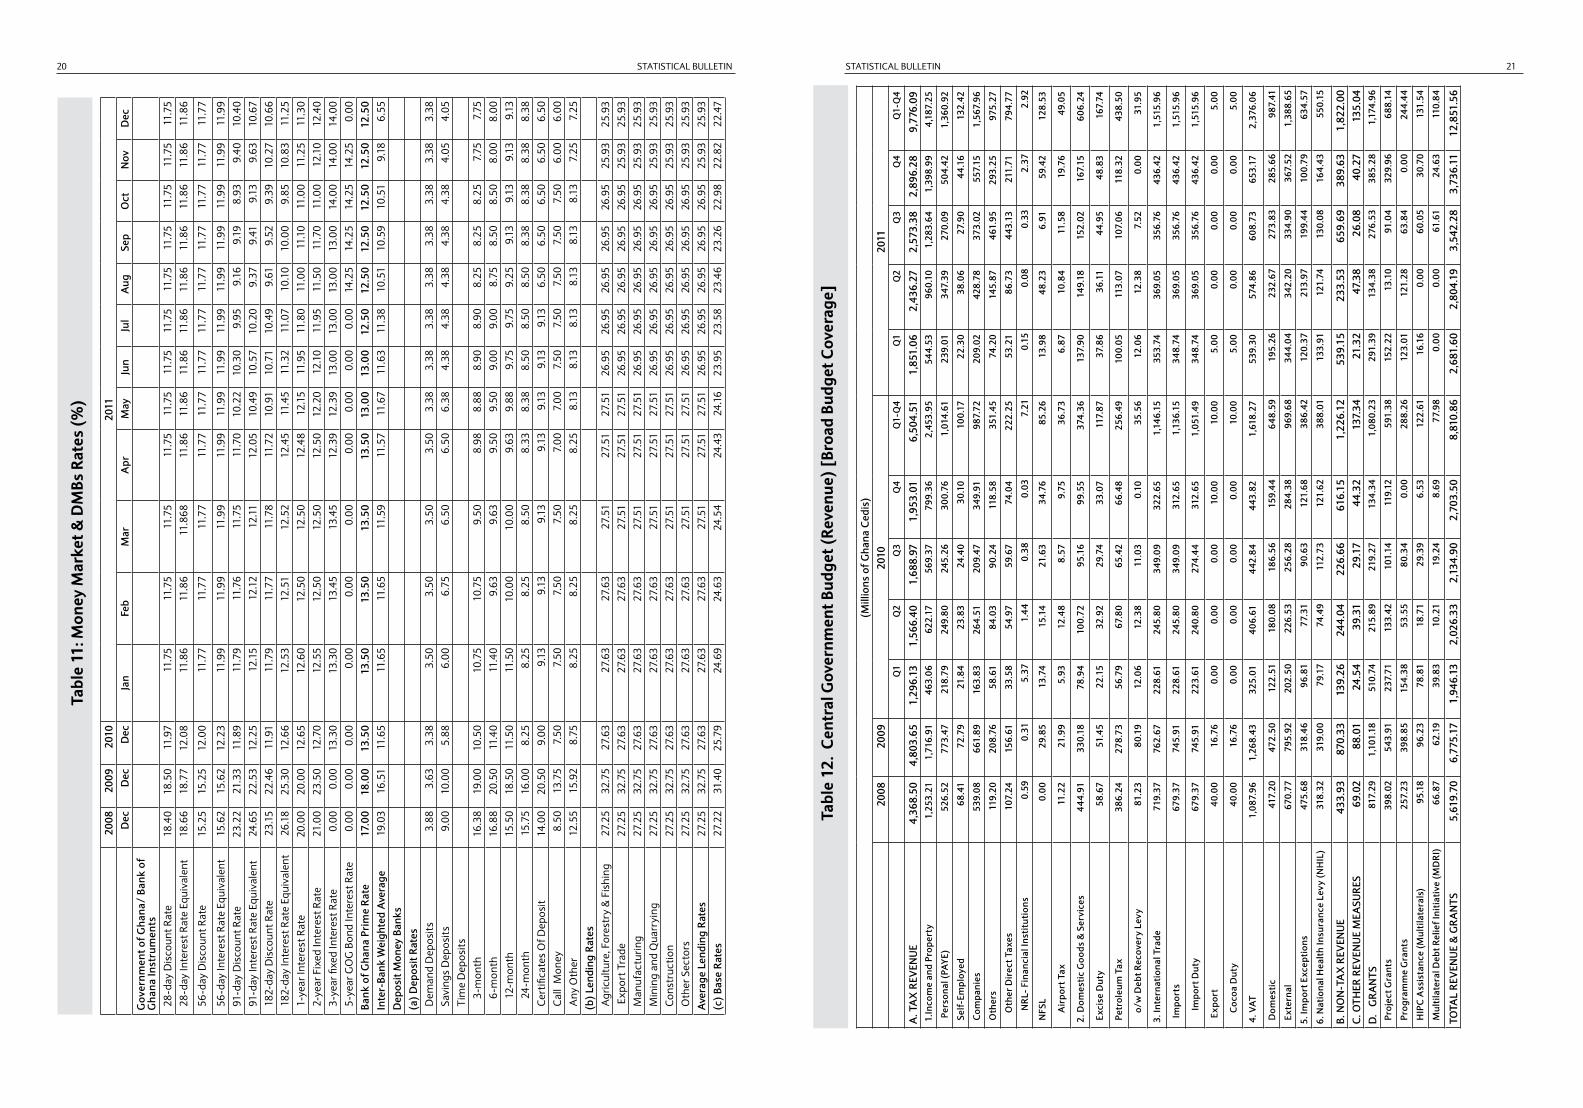
STATISTICAL BULLETIN STATISTICAL BULLETIN20 21
2008
2009
2010
2011
Dec
Dec
Dec
Jan
Feb
Mar
Apr
May
Jun
Jul
Aug
Sep
Oct
Nov
Dec
Gov
ernm
ent o
f Gha
na/
Bank
of
Gha
na In
stru
men
ts28
-day
Dis
coun
t Rat
e 18
.40
18.5
011
.97
11.7
511
.75
11.7
511
.75
11.7
511
.75
11.7
511
.75
11.7
5 11
.75
11.7
511
.75
28-d
ay In
tere
st R
ate
Equi
vale
nt18
.66
18.7
712
.08
11.8
611
.86
11.8
6811
.86
11.8
611
.86
11.8
611
.86
11.8
611
.86
11.8
611
.86
56-d
ay D
isco
unt R
ate
15.2
515
.25
12.0
011
.77
11.7
711
.77
11.7
711
.77
11.7
711
.77
11.7
711
.77
11.7
711
.77
11.7
7
56-d
ay In
tere
st R
ate
Equi
vale
nt15
.62
15.6
212
.23
11.9
911
.99
11.9
911
.99
11.9
911
.99
11.9
911
.99
11.9
911
.99
11.9
911
.99
91-d
ay D
isco
unt R
ate
23.2
221
.33
11.8
911
.79
11.7
611
.75
11.7
010
.22
10.3
09.
959.
169.
198.
939.
4010
.40
91-d
ay In
tere
st R
ate
Equi
vale
nt24
.65
22.5
312
.25
12.1
512
.12
12.1
112
.05
10.4
910
.57
10.2
09.
379.
419.
139.
6310
.67
182-
day
Dis
coun
t Rat
e23
.15
22.4
611
.91
11.7
911
.77
11.7
811
.72
10.9
110
.71
10.4
99.
619.
529.
3910
.27
10.6
618
2-da
y In
tere
st R
ate
Equi
vale
nt26
.18
25.3
012
.66
12.5
312
.51
12.5
212
.45
11.4
511
.32
11.0
710
.10
10.0
09.
8510
.83
11.2
51-
year
Inte
rest
Rat
e20
.00
20.0
012
.65
12.6
012
.50
12.5
012
.48
12.1
511
.95
11.8
011
.00
11.1
011
.00
11.2
511
.30
2-ye
ar F
ixed
Inte
rest
Rat
e21
.00
23.5
012
.70
12.5
512
.50
12.5
012
.50
12.2
012
.10
11.9
511
.50
11.7
011
.00
12.1
012
.40
3-ye
ar fi
xed
Inte
rest
Rat
e0.
000.
0013
.30
13.3
013
.45
13.4
512
.39
12.3
913
.00
13.0
013
.00
13.0
014
.00
14.0
014
.00
5-ye
ar G
OG
Bon
d In
tere
st R
ate
0.00
0.00
0.00
0.00
0.00
0.00
0.00
0.00
0.00
0.00
14.2
514
.25
14.2
514
.25
0.00
Bank
of G
hana
Pri
me
Rate
17.0
018
.00
13.5
013
.50
13.5
013
.50
13.5
013
.00
13.0
012
.50
12.5
012
.50
12.5
012
.50
12.5
0In
ter-
Bank
Wei
ghte
d A
vera
ge19
.03
16.5
111
.65
11.6
511
.65
11.5
911
.57
11.6
711
.63
11.3
810
.51
10.5
910
.51
9.18
6.55
Dep
osit
Mon
ey B
anks
(a
) Dep
osit
Rate
sD
eman
d D
epos
its
3.88
3.63
3.38
3.50
3.50
3.50
3.50
3.38
3.38
3.38
3.38
3.38
3.38
3.38
3.38
Savi
ngs
Dep
osit
s9.
0010
.00
5.88
6.00
6.75
6.50
6.50
6.38
4.38
4.38
4.38
4.38
4.38
4.05
4.05
Tim
e D
epos
its
3-m
onth
16.3
819
.00
10.5
010
.75
10.7
59.
508.
988.
888.
908.
908.
258.
258.
257.
757.
756-
mon
th16
.88
20.5
011
.40
11.4
09.
639.
639.
509.
509.
009.
008.
758.
508.
508.
008.
0012
-mon
th15
.50
18.5
011
.50
11.5
010
.00
10.0
09.
639.
889.
759.
759.
259.
139.
139.
139.
1324
-mon
th15
.75
16.0
08.
258.
258.
258.
508.
338.
388.
508.
508.
508.
388.
388.
388.
38C
ertifi
cate
s O
f Dep
osit
14.0
020
.50
9.00
9.13
9.13
9.13
9.13
9.13
9.13
9.13
6.50
6.50
6.50
6.50
6.50
Cal
l M
oney
8.50
13.7
57.
507.
507.
507.
507.
007.
007.
507.
507.
507.
507.
506.
006.
00A
ny O
ther
12
.55
15.9
28.
758.
258.
258.
258.
258.
138.
138.
138.
138.
138.
137.
257.
25(b
) Len
ding
Rat
es
Agr
icul
ture
, For
estr
y &
Fis
hing
27.2
532
.75
27.6
327
.63
27.6
327
.51
27.5
127
.51
26.9
526
.95
26.9
526
.95
26.9
525
.93
25.9
3 E
xpor
t Tra
de27
.25
32.7
527
.63
27.6
327
.63
27.5
127
.51
27.5
126
.95
26.9
526
.95
26.9
526
.95
25.9
325
.93
Man
ufac
turin
g27
.25
32.7
527
.63
27.6
327
.63
27.5
127
.51
27.5
126
.95
26.9
526
.95
26.9
526
.95
25.9
325
.93
Min
ing
and
Qua
rryi
ng27
.25
32.7
527
.63
27.6
327
.63
27.5
127
.51
27.5
126
.95
26.9
526
.95
26.9
526
.95
25.9
325
.93
Con
stru
ctio
n27
.25
32.7
527
.63
27.6
327
.63
27.5
127
.51
27.5
126
.95
26.9
526
.95
26.9
526
.95
25.9
325
.93
Oth
er S
ecto
rs27
.25
32.7
527
.63
27.6
327
.63
27.5
127
.51
27.5
126
.95
26.9
526
.95
26.9
526
.95
25.9
325
.93
Ave
rage
Len
ding
Rat
es27
.25
32.7
527
.63
27.6
327
.63
27.5
127
.51
27.5
126
.95
26.9
526
.95
26.9
526
.95
25.9
325
.93
(c) B
ase
Rate
s 27
.22
31.4
025
.79
24.6
924
.63
24.5
424
.43
24.1
623
.95
23.5
823
.46
23.2
622
.98
22.8
222
.47
Tabl
e 11
: Mon
ey M
arke
t & D
MBs
Rat
es (%
)
(Mill
ions
of G
hana
Ced
is)
2008
2009
2010
2011
Q1
Q2
Q3
Q4
Q1-
Q4
Q1
Q2
Q3
Q4
Q1-
Q4
A. T
AX
REV
ENU
E 4
,368
.50
4,8
03.6
5 1
,296
.13
1,5
66.4
0 1
,688
.97
1,9
53.0
1 6
,504
.51
1,8
51.0
6 2
,436
.27
2,57
3.38
2,89
6.28
9,77
6.09
1.In
com
e an
d Pr
oper
ty 1
,253
.21
1,7
16.9
1 4
63.0
6 6
22.1
7 5
69.3
7 79
9.36
2,4
53.9
5 5
44.5
3 9
60.1
0 1,
283.
641,
398.
994,
187.
25
Per
sona
l (PA
YE)
526
.52
773
.47
218
.79
249
.80
245
.26
300.
76 1
,014
.61
239
.01
347
.39
270.
0950
4.42
1,36
0.92
Self-
Empl
oyed
68.
41
72.
79
21.
84
23.
83
24.
40
30.1
0 1
00.1
7 2
2.30
3
8.06
27
.90
44.1
613
2.42
Com
pani
es 5
39.0
8 6
61.8
9 1
63.8
3 2
64.5
1 2
09.4
7 34
9.91
987
.72
209
.02
428
.78
373.
0255
7.15
1,56
7.96
Oth
ers
119
.20
208
.76
58.
61
84.
03
90.
24
118.
58 3
51.4
5 7
4.20
1
45.8
7 46
1.95
293.
2597
5.27
Oth
er D
irec
t Tax
es 1
07.2
4 1
56.6
1 3
3.58
5
4.97
5
9.67
74
.04
222
.25
53.
21
86.
73
443.
1321
1.71
794.
77
NR
L- F
inan
cial
Inst
itut
ions
0.5
9 0
.31
5.3
7 1
.44
0.3
8 0.
03 7
.21
0.1
5 0
.08
0.33
2.37
2.92
NFS
L 0.
00
29.
85
13.
74
15.
14
21.
63
34.7
6 8
5.26
1
3.98
4
8.23
6.
9159
.42
128.
53
Air
port
Tax
11.
22
21.
99
5.9
3 1
2.48
8
.57
9.75
36.
73
6.8
7 1
0.84
11
.58
19.7
649
.05
2. D
omes
tic G
oods
& S
ervi
ces
444
.91
330
.18
78.
94
100
.72
95.
16
99.5
5 3
74.3
6 1
37.9
0 1
49.1
8 15
2.02
167.
1560
6.24
Exci
se D
uty
58.
67
51.
45
22.
15
32.
92
29.
74
33.0
7 1
17.8
7 3
7.86
3
6.11
44
.95
48.8
316
7.74
Petr
oleu
m T
ax 3
86.2
4 2
78.7
3 5
6.79
6
7.80
6
5.42
66
.48
256
.49
100
.05
113
.07
107.
0611
8.32
438.
50
o/w
Deb
t Rec
over
y Le
vy 8
1.23
8
0.19
1
2.06
1
2.38
1
1.03
0.
10 3
5.56
1
2.06
1
2.38
7.
520.
0031
.95
3. In
tern
atio
nal T
rade
719
.37
762
.67
228
.61
245
.80
349
.09
322.
65 1
,146
.15
353
.74
369
.05
356.
7643
6.42
1,51
5.96
Impo
rts
679
.37
745
.91
228
.61
245
.80
349
.09
312.
65 1
,136
.15
348
.74
369
.05
356.
7643
6.42
1,51
5.96
Impo
rt D
uty
679
.37
745
.91
223
.61
240
.80
274
.44
312.
65 1
,051
.49
348
.74
369
.05
356.
7643
6.42
1,51
5.96
Exp
ort
40.
00
16.
76
0.00
0.00
0.00
10.
00
10.
00
5.0
0 0.
00
0.00
0.00
5.00
Coc
oa D
uty
40.
00
16.
76
0.00
0.00
0.00
0.00
10.
00
5.0
0 0.
00
0.00
0.00
5.00
4. V
AT
1,0
87.9
6 1
,268
.43
325
.01
406
.61
442
.84
443.
82 1
,618
.27
539
.30
574
.86
608.
7365
3.17
2,37
6.06
Dom
estic
417
.20
472
.50
122
.51
180
.08
186
.56
159.
44 6
48.5
9 1
95.2
6 2
32.6
7 27
3.83
285.
6698
7.41
Exte
rnal
670
.77
795
.92
202
.50
226
.53
256
.28
284.
38 9
69.6
8 3
44.0
4 3
42.2
0 33
4.90
367.
521,
388.
65
5. Im
port
Exc
eptio
ns 4
75.6
8 3
18.4
6 9
6.81
7
7.31
9
0.63
1
21.6
8 3
86.4
2 1
20.3
7 2
13.9
7 19
9.44
100.
7963
4.57
6. N
atio
nal H
ealt
h In
sura
nce
Levy
(NH
IL)
318
.32
319
.00
79.
17
74.
49
112
.73
121.
62 3
88.0
1 1
33.9
1 1
21.7
4 13
0.08
164.
4355
0.15
B. N
ON
-TA
X R
EVEN
UE
433
.93
870
.33
139
.26
244
.04
226
.66
616.
15 1
,226
.12
539
.15
233
.53
659.
6938
9.63
1,82
2.00
C. O
THER
REV
ENU
E M
EASU
RES
69.
02
88.
01
24.
54
39.
31
29.
17
44.3
2 1
37.3
4 2
1.32
4
7.38
26
.08
40.2
713
5.04
D.
GRA
NTS
817
.29
1,1
01.1
8 5
10.7
4 2
15.8
9 2
19.2
7 13
4.34
1,0
80.2
3 2
91.3
9 1
34.3
8 27
6.53
385.
281,
174.
96
Proj
ect G
rant
s 3
98.0
2 5
43.9
1 2
37.7
1 1
33.4
2 1
01.1
4 11
9.12
591
.38
152
.22
13.
10
91.0
432
9.96
688.
14
Prog
ram
me
Gra
nts
257
.23
398
.85
154
.38
53.
55
80.
34
0.00
288
.26
123
.01
121
.28
63.8
40.
0024
4.44
HIP
C A
ssis
tanc
e (M
ultil
ater
als)
95.
18
96.
23
78.
81
18.
71
29.
39
6.53
122
.61
16.
16
0.00
60
.05
30.7
013
1.54
Mul
tilat
eral
Deb
t Rel
ief I
nitia
tive
(MD
RI)
66.
87
62.
19
39.
83
10.
21
19.
24
8.69
77.
98
0.00
0.
00
61.6
124
.63
110.
84
TOTA
L RE
VEN
UE
& G
RAN
TS 5
,619
.70
6,7
75.1
7 1
,946
.13
2,0
26.3
3 2
,134
.90
2,70
3.50
8,8
10.8
6 2
,681
.60
2,8
04.1
9 3,
542.
283,
736.
1112
,851
.56
Tabl
e 12
. C
entr
al G
over
nmen
t Bud
get (
Reve
nue)
[Br
oad
Budg
et C
over
age]
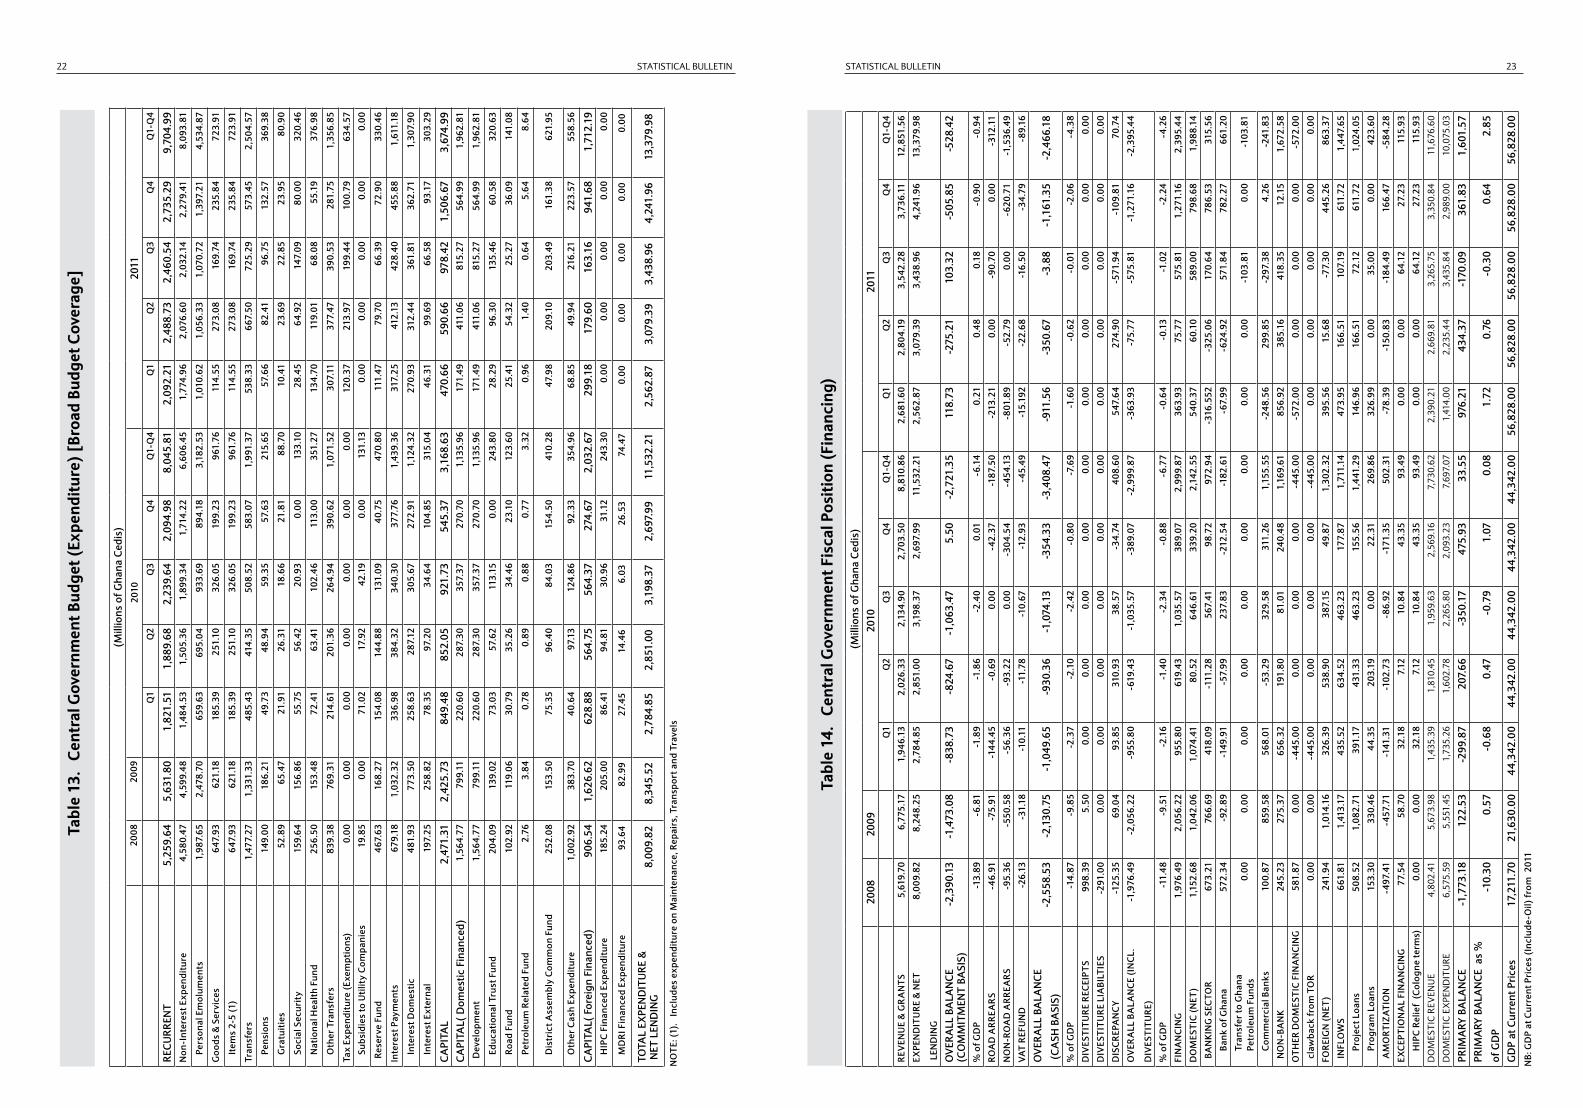
STATISTICAL BULLETIN STATISTICAL BULLETIN22 23
Tabl
e 14
. C
entr
al G
over
nmen
t Fis
cal P
osit
ion
(Fin
anci
ng)
(Mill
ions
of G
hana
Ced
is)
2008
2009
2010
2011
Q1
Q2
Q3
Q4
Q1-
Q4
Q1
Q2
Q3
Q4
Q1-
Q4
REV
ENU
E &
GR
AN
TS5,
619.
706,
775.
171,
946.
132,
026.
332,
134.
902,
703.
508,
810.
862,
681.
602,
804.
193,
542.
283,
736.
1112
,851
.56
EXPE
ND
ITU
RE
& N
ET
LEN
DIN
G
8,00
9.82
8,24
8.25
2,78
4.85
2,85
1.00
3,19
8.37
2,69
7.99
11,5
32.2
12,
562.
873,
079.
393,
438.
964,
241.
9613
,379
.98
OV
ERA
LL B
ALA
NC
E (C
OM
MIT
MEN
T BA
SIS)
-2,3
90.1
3-1
,473
.08
-838
.73
-824
.67
-1,0
63.4
75.
50-2
,721
.35
118.
73-2
75.2
110
3.32
-505
.85
-528
.42
% o
f GD
P-1
3.89
-6.8
1-1
.89
-1.8
6-2
.40
0.01
-6.1
40.
210.
480.
18-0
.90
-0.9
4
ROA
D A
RR
EAR
S -4
6.91
-75.
91-1
44.4
5-0
.69
0.00
-42.
37-1
87.5
0-2
13.2
10.
00-9
0.70
0.00
-312
.11
NO
N-R
OA
D A
RR
EAR
S-9
5.36
-550
.58
-56.
36-9
3.22
0.00
-304
.54
-454
.13
-801
.89
-52.
790.
00-6
20.7
1-1
,536
.49
VAT
REF
UN
D-2
6.13
-31.
18-1
0.11
-11.
78-1
0.67
-12.
93-4
5.49
-15.
192
-22.
68-1
6.50
-34.
79-8
9.16
OV
ERA
LL B
ALA
NC
E
(CA
SH B
ASI
S)-2
,558
.53
-2,1
30.7
5-1
,049
.65
-930
.36
-1,0
74.1
3-3
54.3
3-3
,408
.47
-911
.56
-350
.67
-3.8
8-1
,161
.35
-2,4
66.1
8
% o
f GD
P-1
4.87
-9.8
5-2
.37
-2.1
0-2
.42
-0.8
0-7
.69
-1.6
0-0
.62
-0.0
1-2
.06
-4.3
8
DIV
ESTI
TUR
E R
ECEI
PTS
998.
395.
500.
000.
000.
000.
000.
000.
000.
000.
000.
000.
00
DIV
ESTI
TUR
E LI
ABI
LTIE
S-2
91.0
00.
000.
000.
000.
000.
000.
000.
000.
000.
000.
000.
00
DIS
CR
EPA
NC
Y-1
25.3
569
.04
93.8
531
0.93
38.5
7-3
4.74
408.
6054
7.64
274.
90-5
71.9
4-1
09.8
170
.74
OV
ERA
LL B
ALA
NC
E (I
NC
L.
DIV
ESTI
TUR
E)
-1,9
76.4
9-2
,056
.22
-955
.80
-619
.43
-1,0
35.5
7-3
89.0
7-2
,999
.87
-363
.93
-75.
77-5
75.8
1-1
,271
.16
-2,3
95.4
4
% o
f GD
P-1
1.48
-9.5
1-2
.16
-1.4
0-2
.34
-0.8
8-6
.77
-0.6
4-0
.13
-1.0
2-2
.24
-4.2
6
FIN
AN
CIN
G1,
976.
492,
056.
2295
5.80
619.
431,
035.
5738
9.07
2,99
9.87
363.
9375
.77
575.
811,
271.
162,
395.
44
DO
MES
TIC
(NET
)1,
152.
681,
042.
061,
074.
4180
.52
646.
6133
9.20
2,14
2.55
540.
3760
.10
589.
0079
8.68
1,98
8.14
BAN
KIN
G S
ECTO
R67
3.21
766.
6941
8.09
-111
.28
567.
4198
.72
972.
94-3
16.5
52-3
25.0
617
0.64
786.
5331
5.56
Bank
of G
hana
572.
34-9
2.89
-149
.91
-57.
9923
7.83
-212
.54
-182
.61
-67.
99-6
24.9
257
1.84
782.
2766
1.20
Tran
sfer
to G
hana
Pe
trol
eum
Fun
ds0.
000.
000.
000.
000.
000.
000.
000.
000.
00-1
03.8
10.
00-1
03.8
1
Com
mer
cial
Ban
ks10
0.87
859.
5856
8.01
-53.
2932
9.58
311.
261,
155.
55-2
48.5
629
9.85
-297
.38
4.26
-241
.83
NO
N-B
AN
K 24
5.23
275.
3765
6.32
191.
8081
.01
240.
481,
169.
6185
6.92
385.
1641
8.35
12.1
51,
672.
58
OTH
ER D
OM
ESTI
C F
INA
NC
ING
581.
870.
00-4
45.0
00.
000.
000.
00-4
45.0
0-5
72.0
00.
000.
000.
00-5
72.0
0
claw
back
from
TO
R0.
000.
00-4
45.0
00.
000.
000.
00-4
45.0
00.
000.
000.
000.
000.
00
FOR
EIG
N (N
ET)
241.
941,
014.
1632
6.39
538.
9038
7.15
49.8
71,
302.
3239
5.56
15.6
8-7
7.30
445.
2686
3.37
INFL
OW
S66
1.81
1,41
3.17
435.
5263
4.52
463.
2317
7.87
1,71
1.14
473.
9516
6.51
107.
1961
1.72
1,44
7.65
Proj
ect L
oans
508.
521,
082.
7139
1.17
431.
3346
3.23
155.
561,
441.
2914
6.96
166.
5172
.12
611.
721,
024.
05
Prog
ram
Loa
ns15
3.30
330.
4644
.35
203.
190.
0022
.31
269.
8632
6.99
0.00
35.0
00.
0042
3.60
AM
OR
TIZA
TIO
N-4
97.4
1-4
57.7
1-1
41.3
1-1
02.7
3-8
6.92
-171
.35
502.
31-7
8.39
-150
.83
-184
.49
166.
47-5
84.2
8
EXC
EPTI
ON
AL
FIN
AN
CIN
G77
.54
58.7
032
.18
7.12
10.8
443
.35
93.4
90.
000.
0064
.12
27.2
311
5.93
HIP
C R
elie
f (C
olog
ne te
rms)
0.00
0.00
32.1
87.
1210
.84
43.3
593
.49
0.00
0.00
64.1
227
.23
115.
93
DO
MES
TIC
REV
ENU
E4,
802.
415,
673.
981,
435.
391,
810.
451,
959.
632,
569.
167,
730.
622,
390.
212,
669.
813,
265.
753,
350.
8411
,676
.60
DO
MES
TIC
EX
PEN
DIT
UR
E6,
575.
595,
551.
451,
735.
261,
602.
782,
265.
802,
093.
237,
697.
071,
414.
002,
235.
443,
435.
842,
989.
0010
,075
.03
PRIM
ARY
BA
LAN
CE
-1,7
73.1
812
2.53
-299
.87
207.
66-3
50.1
747
5.93
33.5
597
6.21
434.
37-1
70.0
936
1.83
1,60
1.57
PRIM
ARY
BA
LAN
CE
as
%
of G
DP
-10.
300.
57-0
.68
0.47
-0.7
91.
070.
081.
720.
76-0
.30
0.64
2.85
GD
P at
Cur
rent
Pri
ces
17,2
11.7
021
,630
.00
44,3
42.0
044
,342
.00
44,3
42.0
044
,342
.00
44,3
42.0
056
,828
.00
56,8
28.0
056
,828
.00
56,8
28.0
056
,828
.00
NB:
GD
P at
Cur
rent
Pri
ces
(Inc
lude
-Oil)
from
201
1
(Mill
ions
of G
hana
Ced
is)
2008
2009
2010
2011
Q1
Q2
Q3
Q4
Q1-
Q4
Q1
Q2
Q3
Q4
Q1-
Q4
REC
URR
ENT
5,25
9.64
5,63
1.80
1,82
1.51
1,88
9.68
2,23
9.64
2,09
4.98
8,04
5.81
2,0
92.2
1 2
,488
.73
2,46
0.54
2,73
5.29
9,70
4.99
Non
-Int
eres
t Exp
endi
ture
4,58
0.47
4,59
9.48
1,48
4.53
1,50
5.36
1,89
9.34
1,71
4.22
6,60
6.45
1,7
74.9
6 2
,076
.60
2,03
2.14
2,27
9.41
8,09
3.81
Pers
onal
Em
olum
ents
1,98
7.65
2,47
8.70
659.
6369
5.04
933.
6989
4.18
3,18
2.53
1,0
10.6
2 1
,056
.33
1,07
0.72
1,39
7.21
4,53
4.87
Goo
ds &
Ser
vice
s64
7.93
621.
1818
5.39
251.
1032
6.05
199.
2396
1.76
114
.55
273
.08
169.
7423
5.84
723.
91
Item
s 2-
5 (1
)64
7.93
621.
1818
5.39
251.
1032
6.05
199.
2396
1.76
114
.55
273
.08
169.
7423
5.84
723.
91
Tran
sfer
s1,
477.
271,
331.
3348
5.43
414.
3550
8.52
583.
071,
991.
37 5
38.3
3 6
67.5
0 72
5.29
573.
452,
504.
57
Pens
ions
149.
0018
6.21
49.7
348
.94
59.3
557
.63
215.
65 5
7.66
8
2.41
96
.75
132.
5736
9.38
Gra
tuit
ies
52.8
965
.47
21.9
126
.31
18.6
621
.81
88.7
0 1
0.41
2
3.69
22
.85
23.9
580
.90
Soci
al S
ecur
ity
159.
6415
6.86
55.7
556
.42
20.9
30.
0013
3.10
28.
45
64.
92
147.
0980
.00
320.
46
Nat
iona
l Hea
lth
Fund
256.
5015
3.48
72.4
163
.41
102.
4611
3.00
351.
27 1
34.7
0 1
19.0
1 68
.08
55.1
937
6.98
Oth
er T
rans
fers
839.
3876
9.31
214.
6120
1.36
264.
9439
0.62
1,07
1.52
307
.11
377
.47
390.
5328
1.75
1,35
6.85
Tax
Expe
ndit
ure
(Exe
mpt
ions
)0.
000.
000.
000.
000.
000.
000.
0012
0.37
21
3.97
19
9.44
100.
7963
4.57
Subs
idie
s to
Util
ity
Com
pani
es19
.85
0.00
71.0
217
.92
42.1
90.
0013
1.13
0.00
0.
00
0.00
0.00
0.00
Rese
rve
Fund
467.
6316
8.27
154.
0814
4.88
131.
0940
.75
470.
80 1
11.4
7 7
9.70
66
.39
72.9
033
0.46
Inte
rest
Pay
men
ts67
9.18
1,03
2.32
336.
9838
4.32
340.
3037
7.76
1,43
9.36
317
.25
412
.13
428.
4045
5.88
1,61
1.18
Inte
rest
Dom
estic
481.
9377
3.50
258.
6328
7.12
305.
6727
2.91
1,12
4.32
270
.93
312
.44
361.
8136
2.71
1,30
7.90
Inte
rest
Ext
erna
l19
7.25
258.
8278
.35
97.2
034
.64
104.
8531
5.04
46.
31
99.
69
66.5
893
.17
303.
29
CA
PITA
L2,
471.
312,
425.
7384
9.48
852.
0592
1.73
545.
373,
168.
63 4
70.6
6 5
90.6
6 97
8.42
1,50
6.67
3,67
4.99
CA
PITA
L( D
omes
tic F
inan
ced)
1,56
4.77
799.
1122
0.60
287.
3035
7.37
270.
701,
135.
96 1
71.4
9 4
11.0
6 81
5.27
564.
991,
962.
81
Dev
elop
men
t1,
564.
7779
9.11
220.
6028
7.30
357.
3727
0.70
1,13
5.96
171
.49
411
.06
815.
2756
4.99
1,96
2.81
Educ
atio
nal T
rust
Fun
d20
4.09
139.
0273
.03
57.6
211
3.15
0.00
243.
80 2
8.29
9
6.30
13
5.46
60.5
832
0.63
Road
Fun
d10
2.92
119.
0630
.79
35.2
634
.46
23.1
012
3.60
25.
41
54.
32
25.2
736
.09
141.
08
Petr
oleu
m R
elat
ed F
und
2.76
3.84
0.78
0.89
0.88
0.77
3.32
0.9
6 1
.40
0.64
5.64
8.64
Dis
tric
t Ass
embl
y C
omm
on F
und
252.
0815
3.50
75.3
596
.40
84.0
315
4.50
410.
28 4
7.98
2
09.1
0 20
3.49
161.
3862
1.95
Oth
er C
ash
Expe
ndit
ure
1,00
2.92
383.
7040
.64
97.1
312
4.86
92.3
335
4.96
68.
85
49.
94
216.
2122
3.57
558.
56
CA
PITA
L( F
orei
gn F
inan
ced)
906.
541,
626.
6262
8.88
564.
7556
4.37
274.
672,
032.
67 2
99.1
8 1
79.6
0 16
3.16
941.
681,
712.
19H
IPC
Fin
ance
d Ex
pend
itur
e18
5.24
205.
0086
.41
94.8
130
.96
31.1
224
3.30
0.00
0.
00
0.00
0.00
0.00
MD
RI F
inan
ced
Expe
ndit
ure
93.6
482
.99
27.4
514
.46
6.03
26.5
374
.47
0.00
0.
00
0.00
0.00
0.00
TOTA
L EX
PEN
DIT
URE
& N
ET L
END
ING
8,00
9.82
8,34
5.52
2,78
4.85
2,85
1.00
3,19
8.37
2,69
7.99
11,5
32.2
1 2
,562
.87
3,0
79.3
9 3,
438.
964,
241.
9613
,379
.98
NO
TE: (
1).
Incl
udes
exp
endi
ture
on
Mai
nten
ance
, Rep
airs
, Tra
nspo
rt a
nd T
rave
ls
Tabl
e 13
. C
entr
al G
over
nmen
t Bud
get (
Expe
nditu
re) [
Broa
d Bu
dget
Cov
erag
e]
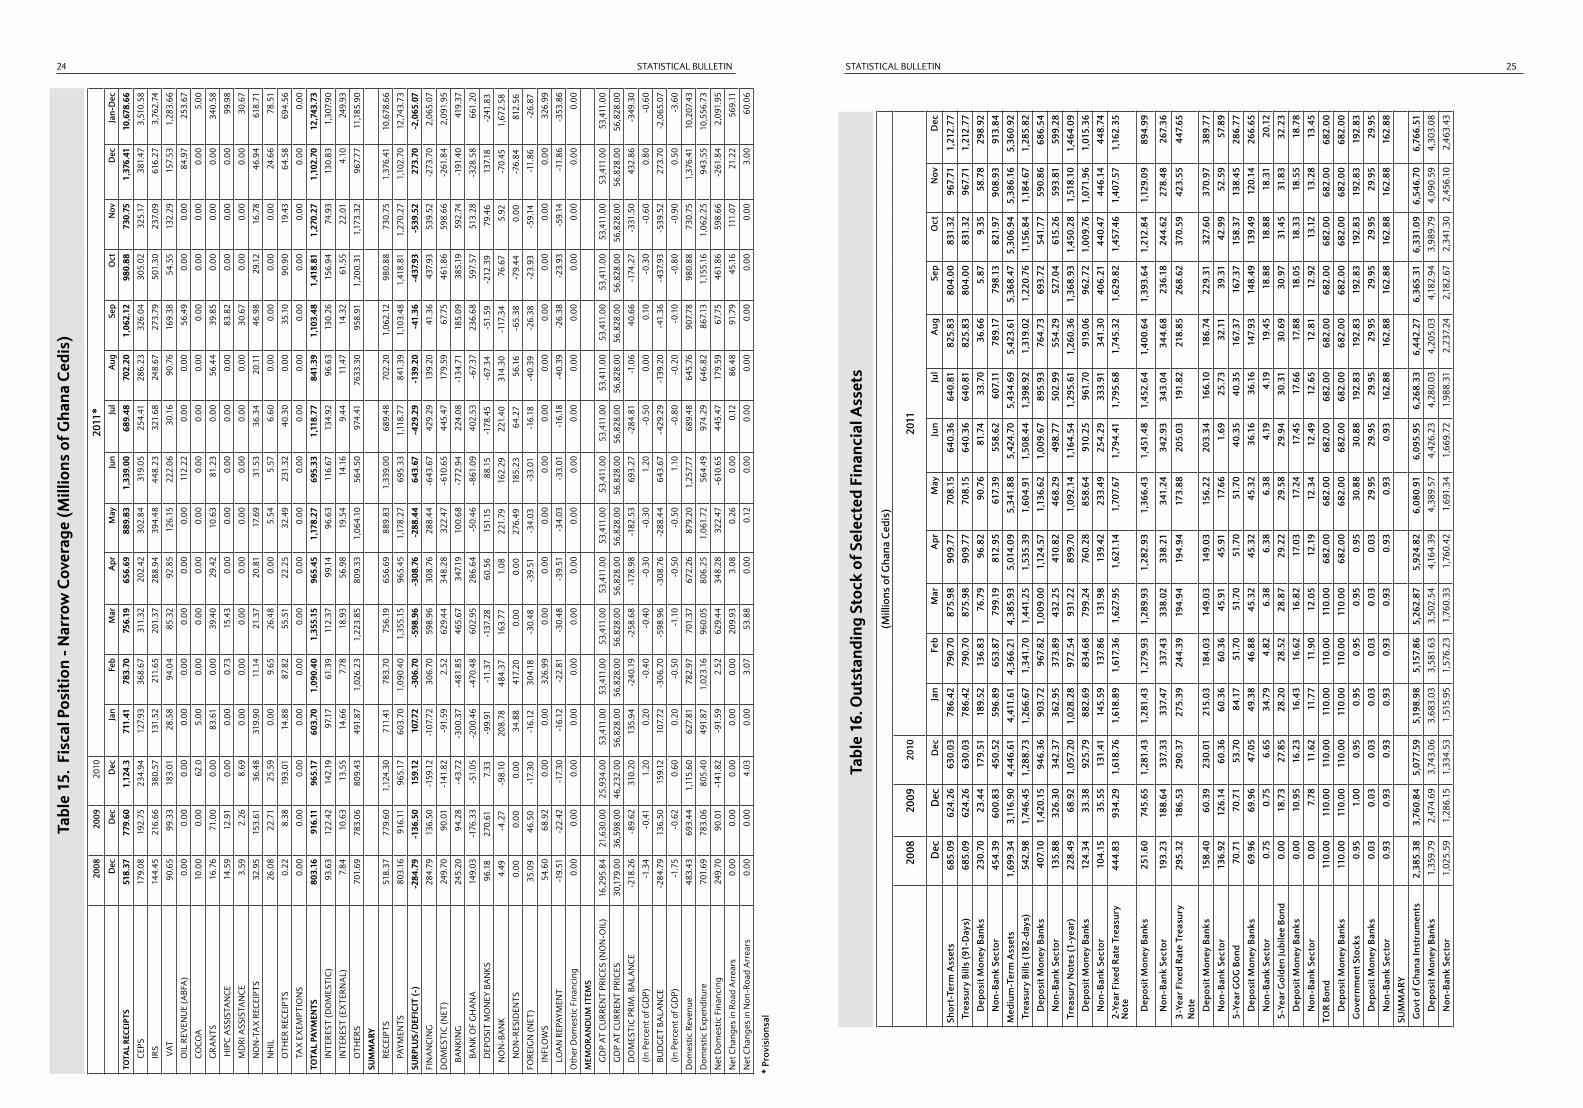
STATISTICAL BULLETIN STATISTICAL BULLETIN24 25
2008
20
09
2010
2011
* D
ecD
ecD
ecJa
nFe
bM
arA
prM
ayJu
nJu
lA
ugSe
pO
ctN
ovD
ecJa
n-D
ec
TOTA
L RE
CEI
PTS
518.
3777
9.60
1,12
4.3
711.
4178
3.70
756.
1965
6.69
889
.83
1,3
39.0
0 6
89.4
8 70
2.20
1,06
2.12
980.
8873
0.75
1,37
6.41
10,6
78.6
6
CEP
S17
9.08
192.
7523
4.94
12
7.93
368.
6731
1.32
202.
42 3
02.8
4 3
19.0
5 2
54.4
1 28
6.23
326.
0430
5.02
325.
1738
1.47
3,51
0.58
IRS
144.
4521
6.66
380.
57
131.
5221
1.65
201.
3728
8.94
394
.48
448
.23
321
.68
248.
6727
3.79
501.
3023
7.09
616.
273,
762.
74
VAT
90.6
599
.33
183.
01
28.5
894
.04
85.3
292
.85
126
.15
222
.06
30.
16
90.7
616
9.38
54.5
513
2.29
157.
531,
283.
66
OIL
REV
ENU
E (A
BFA
)0.
000.
000.
00
0.00
0.00
0.00
0.00
0.00
112
.22
0.00
0.00
56.4
90.
000.
0084
.97
253.
67
CO
CO
A10
.00
0.00
62.0
5.
000.
000.
000.
000.
000.
000.
000.
000.
000.
000.
000.
005.
00
GR
AN
TS16
.76
71.0
00.
0083
.61
0.00
39.4
029
.42
10.
63
81.
23
0.00
56.4
439
.85
0.00
0.00
0.00
340.
58
HIP
C A
SSIS
TAN
CE
14.5
912
.91
0.00
0.00
0.73
15.4
30.
000.
000.
000.
000.
0083
.82
0.00
0.00
0.00
99.9
8
MD
RI A
SSIS
TAN
CE
3.59
2.26
8.69
0.
000.
000.
000.
000.
000.
000.
000.
0030
.67
0.00
0.00
0.00
30.6
7
NO
N-T
AX
REC
EIPT
S32
.95
153.
6136
.48
319.
9011
.14
21.3
720
.81
17.
69
31.
53
36.
34
20.1
146
.98
29.1
216
.78
46.9
461
8.71
NH
IL26
.08
22.7
125
.59
0.00
9.65
26.4
80.
00 5
.54
5.5
7 6
.60
0.00
0.00
0.00
0.00
24.6
678
.51
OT
HER
REC
EIPT
S0.
228.
3819
3.01
14
.88
87.8
255
.51
22.2
5 3
2.49
2
31.3
2 4
0.30
0.
0035
.10
90.9
019
.43
64.5
869
4.56
TAX
EX
EMPT
ION
S0.
000.
000.
000.
000.
000.
000.
000.
000.
00
0.00
0.00
0.00
0.00
0.00
0.00
0.00
TOTA
L PA
YMEN
TS80
3.16
916.
1196
5.17
603.
701,
090.
401,
355.
1596
5.45
1,1
78.2
7 6
95.3
3 1
,118
.77
841.
391,
103.
481,
418.
811,
270.
271,
102.
7012
,743
.73
INT
ERES
T (D
OM
ESTI
C)
93.6
312
2.42
142
.19
97.1
761
.39
112.
3799
.14
96.
63
116
.67
134
.92
96.6
313
0.26
156.
9474
.93
130.
831,
307.
90
INT
ERES
T (E
XT
ERN
AL)
7.84
10.6
3 1
3.55
14
.66
7.78
18.9
356
.98
19.
54
14.
16
9.4
4 11
.47
14.3
261
.55
22.0
14.
1024
9.93
OT
HER
S70
1.69
783.
06 8
09.4
3 49
1.87
1,02
6.23
1,22
3.85
809.
33 1
,064
.10
564
.50
974
.41
7633
.30
958.
911,
200.
311,
173.
3296
7.77
11,1
85.9
0
SUM
MA
RY
REC
EIPT
S51
8.37
779.
601,
124.
3071
1.41
783.
7075
6.19
656.
69 8
89.8
3 1
,339
.00
689
.48
702.
201,
062.
1298
0.88
730.
751,
376.
4110
,678
.66
PAYM
ENTS
803.
1691
6.11
965.
1760
3.70
1,09
0.40
1,35
5.15
965.
45 1
,178
.27
695
.33
1,1
18.7
7 84
1.39
1,10
3.48
1,41
8.81
1,27
0.27
1,10
2.70
12,7
43.7
3
SURP
LUS/
DEF
ICIT
(-)
-284
.79
-136
.50
159.
1210
7.72
-306
.70
-598
.96
-308
.76
-288
.44
643.
67-4
29.2
9-1
39.2
0-4
1.36
-437
.93
-539
.52
273.
70-2
,065
.07
FIN
AN
CIN
G28
4.79
136.
50-1
59.1
2-1
07.7
230
6.70
598.
9630
8.76
288.
44-6
43.6
742
9.29
139.
2041
.36
437.
9353
9.52
-273
.70
2,06
5.07
DO
MES
TIC
(NET
)24
9.70
90.0
1-1
41.8
2-9
1.59
2.52
629.
4434
8.28
322
.47
-610
.65
445
.47
179.
5967
.75
461.
8659
8.66
-261
.84
2,09
1.95
BAN
KIN
G24
5.20
94.2
8-4
3.72
-300
.37
-481
.85
465.
6734
7.19
100
.68
-772
.94
224
.08
-134
.71
185.
0938
5.19
592.
74-1
91.4
041
9.37
BAN
K O
F G
HA
NA
149.
03-1
76.3
3-5
1.05
-200
.46
-470
.48
602.
9528
6.64
-50.
46-8
61.0
9 4
02.5
3 -6
7.37
236.
6859
7.57
513.
28-3
28.5
866
1.20
DEP
OSI
T M
ON
EY B
AN
KS
96
.18
270.
617.
33-9
9.91
-11.
37-1
37.2
860
.56
151
.15
88.
15
-178
.45
-67.
34-5
1.59
-212
.39
79.4
613
7.18
-241
.83
NO
N-B
AN
K4.
49-4
.27
-98.
1020
8.78
484.
3716
3.77
1.08
221
.79
162
.29
221
.40
314.
30-1
17.3
476
.67
5.92
-70.
451,
672.
58
NO
N-R
ESID
ENTS
0.00
0.00
0.00
34.8
841
7.20
0.00
0.00
276
.49
185
.23
64.
27
56.1
6-6
5.38
-79.
440.
00-7
6.84
812.
56
FOR
EIG
N (N
ET)
35.0
946
.50
-17.
30-1
6.12
304.
18-3
0.48
-39.
51-3
4.03
-33.
01-1
6.18
-40.
39-2
6.38
-23.
93-5
9.14
-11.
86-2
6.87
INFL
OW
S54
.60
68.9
20.
000.
0032
6.99
0.00
0.00
0.00
0.00
0.00
0.00
0.00
0.00
0.00
0.00
326.
99
LOA
N R
EPA
YMEN
T-1
9.51
-22.
42-1
7.30
-16.
12-2
2.81
-30.
48-3
9.51
-34.
03-3
3.01
-16.
18-4
0.39
-26.
38-2
3.93
-59.
14-1
1.86
-353
.86
Oth
er D
omes
tic F
inan
cing
0.00
0.00
0.00
0.00
0.00
0.00
0.00
0.00
0.00
0.00
0.00
0.00
0.00
0.00
0.00
0.00
MEM
ORA
ND
UM
ITEM
S
GD
P AT
CU
RR
ENT
PRIC
ES (N
ON
-OIL
)16
,295
.84
21,6
30.0
025
,934
.00
53,4
11.0
053
,411
.00
53,4
11.0
053
,411
.00
53,4
11.0
053
,411
.00
53,4
11.0
0 5
3,41
1.00
5
3,41
1.00
5
3,41
1.00
5
3,41
1.00
5
3,41
1.00
5
3,41
1.00
GD
P AT
CU
RR
ENT
PRIC
ES
30,1
79.0
036
,598
.00
46,2
32.0
056
,828
.00
56,8
28.0
056
,828
.00
56,8
28.0
056
,828
.00
56,8
28.0
056
,828
.00
56,8
28.0
056
,828
.00
56,8
28.0
056
,828
.00
56,8
28.0
056
,828
.00
DO
MES
TIC
PR
IM. B
ALA
NC
E-2
18.2
6-8
9.62
310.
2013
5.94
-240
.19
-258
.68
-178
.98
-182
.53
693.
27-2
84.8
1-1
.06
40.6
6-1
74.2
7-3
31.5
043
2.86
-349
.30
(In
Perc
ent o
f GD
P)-1
.34
-0.4
11.
200.
20-0
.40
-0.4
0-0
.30
-0.3
0 1
.20
-0.5
00.
000.
10-0
.30
-0.6
00.
80-0
.60
BUD
GET
BA
LAN
CE
-284
.79
136.
5015
9.12
107.
72-3
06.7
0-5
98.9
6-3
08.7
6-2
88.4
464
3.67
-429
.29
-139
.20
-41.
36-4
37.9
3-5
39.5
227
3.70
-2,0
65.0
7
(In
Perc
ent o
f GD
P)-1
.75
-0.6
20.
600.
20-0
.50
-1.1
0-0
.50
-0.5
01.
10-0
.80
-0.2
0-0
.10
-0.8
0-0
.90
0.50
-3.6
0
Dom
estic
Rev
enue
483.
4369
3.44
1,11
5.60
627.
8178
2.97
701.
3767
2.26
879
.20
1,2
57.7
7 6
89.4
8 64
5.76
907.
7898
0.88
730.
751,
376.
4110
,207
.43
Dom
estic
Exp
endi
ture
701.
6978
3.06
805.
4049
1.87
1,02
3.16
960.
0580
6.25
1,0
61.7
2 5
64.4
9 9
74.2
9 64
6.82
867.
131,
155.
161,
062.
2594
3.55
10,5
56.7
3
Net
Dom
estic
Fin
anci
ng24
9.70
90.0
1-1
41.8
2-9
1.59
2.52
629.
4434
8.28
322
.47
-610
.65
445
.47
179.
5967
.75
461.
8659
8.66
-261
.84
2,09
1.95
Net
Cha
nges
in R
oad
Arr
ears
0.00
0.00
0.00
0.00
0.00
209.
933.
08 0
.26
0.00
0.12
86.4
891
.79
45.1
611
1.07
21.2
256
9.11
Net
Cha
nges
in N
on-R
oad
Arr
ears
0.00
0.00
4.03
0.00
3.07
53.8
80.
00 0
.12
0.00
0.00
0.00
0.00
0.00
0.00
3.00
60.0
6
* Pr
ovis
ions
al
Tabl
e 15
. Fi
scal
Pos
ition
- N
arro
w C
over
age
(Mill
ions
of G
hana
Ced
is)
(Mill
ions
of G
hana
Ced
is)
2008
20
09
2010
2011
Dec
Dec
Dec
Jan
Feb
Mar
Apr
May
Jun
Jul
Aug
Sep
O
ct
Nov
D
ec
Shor
t-Te
rm A
sset
s68
5.09
624.
2663
0.03
786
.42
790
.70
875
.98
909
.77
708
.15
640
.36
640
.81
825
.83
804
.00
831.
3296
7.71
1,21
2.77
Trea
sury
Bill
s (9
1-D
ays)
685.
0962
4.26
630.
03 7
86.4
2 7
90.7
0 8
75.9
8 9
09.7
7 7
08.1
5 6
40.3
6 6
40.8
1 8
25.8
3 8
04.0
0 83
1.32
967.
711,
212.
77
Dep
osit
Mon
ey B
anks
230.
7023
.44
179.
51 1
89.5
2 1
36.8
3 7
6.79
9
6.82
9
0.76
8
1.74
3
3.70
3
6.66
5
.87
9.35
58.7
829
8.92
Non
-Ban
k Se
ctor
454.
3960
0.83
450.
52 5
96.8
9 6
53.8
7 7
99.1
9 8
12.9
5 6
17.3
9 5
58.6
2 6
07.1
1 7
89.1
7 7
98.1
3 82
1.97
908.
9391
3.84
Med
ium
-Ter
m A
sset
s1,
699.
343,
116.
904,
446.
61 4
,411
.61
4,3
66.2
1 4
,385
.93
5,0
14.0
9 5
,341
.88
5,4
24.7
0 5
,434
.69
5,4
23.6
1 5
,368
.47
5,30
6.94
5,38
6.16
5,36
0.92
Trea
sury
Bill
s (1
82-d
ays)
542.
981,
746.
451,
288.
73 1
,266
.67
1,3
41.7
0 1
,441
.25
1,5
35.3
9 1
,604
.91
1,5
08.4
4 1
,398
.92
1,3
19.0
2 1
,220
.76
1,15
6.84
1,18
4.67
1,28
5.82
Dep
osit
Mon
ey B
anks
407.
101,
420.
1594
6.36
903
.72
967
.82
1,0
09.0
0 1
,124
.57
1,1
36.6
2 1
,009
.67
895
.93
764
.73
693
.72
541.
7759
0.86
686.
54
Non
-Ban
k Se
ctor
135.
8832
6.30
342.
37 3
62.9
5 3
73.8
9 4
32.2
5 4
10.8
2 4
68.2
9 4
98.7
7 5
02.9
9 5
54.2
9 5
27.0
4 61
5.26
593.
8159
9.28
Trea
sury
Not
es (1
-yea
r)22
8.49
68.9
21,
057.
20 1
,028
.28
972
.54
931
.22
899
.70
1,0
92.1
4 1
,164
.54
1,2
95.6
1 1
,260
.36
1,3
68.9
3 1,
450.
281,
518.
101,
464.
09
Dep
osit
Mon
ey B
anks
124.
3433
.38
925.
79 8
82.6
9 8
34.6
8 7
99.2
4 7
60.2
8 8
58.6
4 9
10.2
5 9
61.7
0 9
19.0
6 9
62.7
2 1,
009.
761,
071.
961,
015.
36
Non
-Ban
k Se
ctor
104.
1535
.55
131.
41 1
45.5
9 1
37.8
6 1
31.9
8 1
39.4
2 2
33.4
9 2
54.2
9 3
33.9
1 3
41.3
0 4
06.2
1 44
0.47
446.
1444
8.74
2-Ye
ar F
ixed
Rat
e Tr
easu
ry
Not
e44
4.83
934.
291,
618.
76 1
,618
.89
1,6
17.3
6 1
,627
.95
1,6
21.1
4 1
,707
.67
1,7
94.4
1 1
,795
.68
1,7
45.3
2 1
,629
.82
1,45
7.46
1,40
7.57
1,16
2.35
Dep
osit
Mon
ey B
anks
251.
6074
5.65
1,28
1.43
1,2
81.4
3 1
,279
.93
1,2
89.9
3 1
,282
.93
1,3
66.4
3 1
,451
.48
1,4
52.6
4 1
,400
.64
1,3
93.6
4 1,
212.
841,
129.
0989
4.99
Non
-Ban
k Se
ctor
193.
2318
8.64
337.
33 3
37.4
7 3
37.4
3 3
38.0
2 3
38.2
1 3
41.2
4 3
42.9
3 3
43.0
4 3
44.6
8 2
36.1
8 24
4.62
278.
4826
7.36
3-Ye
ar F
ixed
Rat
e Tr
easu
ry
Not
e29
5.32
186.
5329
0.37
275
.39
244
.39
194
.94
194
.94
173
.88
205
.03
191
.82
218
.85
268
.62
370.
5942
3.55
447.
65
Dep
osit
Mon
ey B
anks
158.
4060
.39
230.
01 2
15.0
3 1
84.0
3 1
49.0
3 1
49.0
3 1
56.2
2 2
03.3
4 1
66.1
0 1
86.7
4 2
29.3
1 32
7.60
370.
9738
9.77
Non
-Ban
k Se
ctor
136.
9212
6.14
60.3
6 6
0.36
6
0.36
4
5.91
4
5.91
1
7.66
1
.69
25.
73
32.
11
39.
31
42.9
952
.59
57.8
9
5-Ye
ar G
OG
Bon
d70
.71
70.7
153
.70
84.
17
51.
70
51.
70
51.
70
51.
70
40.
35
40.
35
167
.37
167
.37
158.
3713
8.45
286.
77
Dep
osit
Mon
ey B
anks
69.9
669
.96
47.0
5 4
9.38
4
6.88
4
5.32
4
5.32
4
5.32
3
6.16
3
6.16
1
47.9
3 1
48.4
9 13
9.49
120.
1426
6.65
Non
-Ban
k Se
ctor
0.75
0.75
6.65
34.
79
4.8
2 6
.38
6.3
8 6
.38
4.1
9 4
.19
19.
45
18.
88
18.8
818
.31
20.1
2
5-Ye
ar G
olde
n Ju
bile
e Bo
nd0.
0018
.73
27.8
5 2
8.20
2
8.52
2
8.87
2
9.22
2
9.58
2
9.94
3
0.31
3
0.69
3
0.97
31
.45
31.8
332
.23
Dep
osit
Mon
ey B
anks
0.00
10.9
516
.23
16.
43
16.
62
16.
82
17.
03
17.
24
17.
45
17.
66
17.
88
18.
05
18.3
318
.55
18.7
8
Non
-Ban
k Se
ctor
0.00
7.78
11.6
2 1
1.77
1
1.90
1
2.05
1
2.19
1
2.34
1
2.49
1
2.65
1
2.81
1
2.92
13
.12
13.2
813
.45
TOR
Bond
110.
0011
0.00
110.
0011
0.00
110.
0011
0.00
682.
00 6
82.0
0 6
82.0
0 6
82.0
0 6
82.0
0 6
82.0
0 68
2.00
682.
0068
2.00
Dep
osit
Mon
ey B
anks
110.
0011
0.00
110.
0011
0.00
110.
0011
0.00
682.
00 6
82.0
0 6
82.0
0 6
82.0
0 6
82.0
0 6
82.0
0 68
2.00
682.
0068
2.00
Gov
ernm
ent S
tock
s0.
951.
000.
950.
950.
950.
950.
95 3
0.88
3
0.88
1
92.8
3 1
92.8
3 1
92.8
3 19
2.83
192.
8319
2.83
Dep
osit
Mon
ey B
anks
0.03
0.03
0.03
0.03
0.03
0.03
0.03
29.
95
29.
95
29.
95
29.
95
29.
95
29.9
529
.95
29.9
5
Non
-Ban
k Se
ctor
0.93
0.93
0.93
0.93
0.93
0.93
0.93
0.9
3 0
.93
162
.88
162
.88
162
.88
162.
8816
2.88
162.
88
SUM
MA
RY
Gov
t of G
hana
Inst
rum
ents
2,38
5.38
3,76
0.84
5,
077.
59 5
,198
.98
5,1
57.8
6 5
,262
.87
5,9
24.8
2 6
,080
.91
6,0
95.9
5 6
,268
.33
6,4
42.2
7 6
,365
.31
6,33
1.09
6,54
6.70
6,76
6.51
Dep
osit
Mon
ey B
anks
1,35
9.79
2,47
4.69
3,
743.
06 3
,683
.03
3,5
81.6
3 3
,502
.54
4,1
64.3
9 4
,389
.57
4,4
26.2
3 4
,280
.03
4,2
05.0
3 4
,182
.94
3,98
9.79
4,09
0.59
4,30
3.08
Non
-Ban
k Se
ctor
1,02
5.59
1,28
6.15
1,
334.
53 1
,515
.95
1,5
76.2
3 1
,760
.33
1,7
60.4
2 1
,691
.34
1,6
69.7
2 1
,988
.31
2,2
37.2
4 2
,182
.67
2,34
1.30
2,45
6.10
2,46
3.43
Tabl
e 16
. Out
stan
ding
Sto
ck o
f Sel
ecte
d Fi
nanc
ial A
sset
s
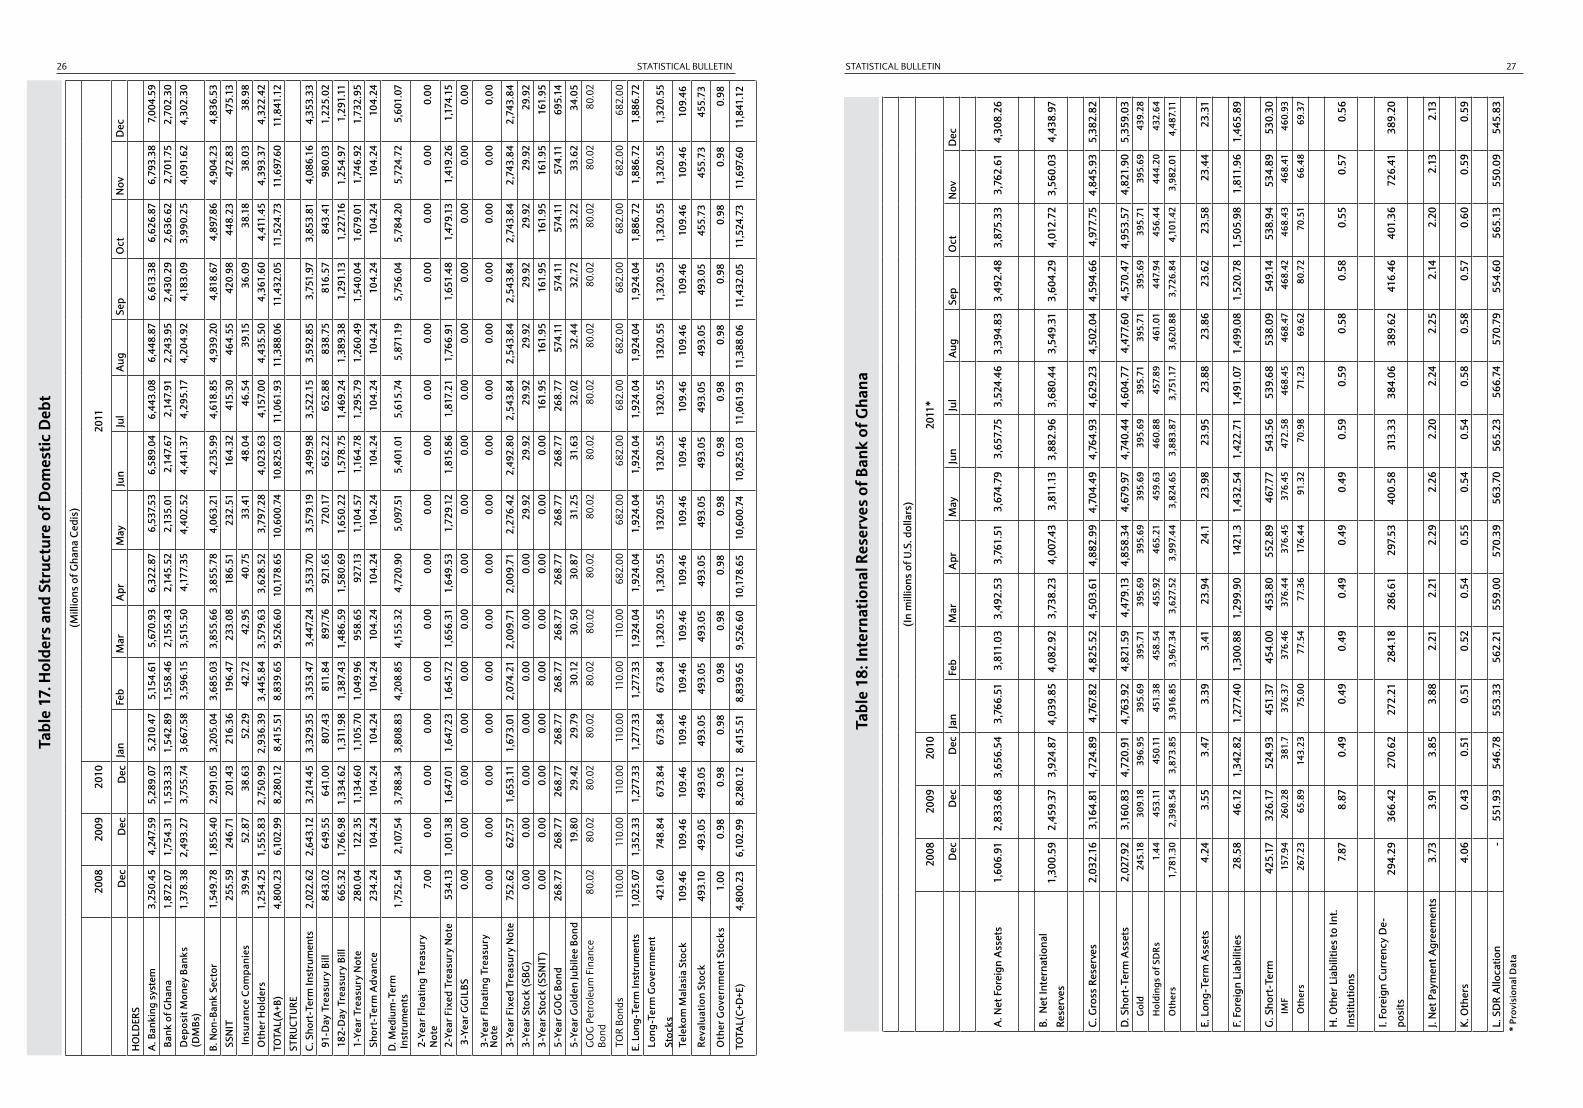
STATISTICAL BULLETIN STATISTICAL BULLETIN26 27
Tab
le 1
8: In
tern
atio
nal R
eser
ves
of B
ank
of G
hana
(In
mill
ions
of U
.S. d
olla
rs)
2008
20
09
2010
20
11*
Dec
Dec
Dec
Jan
Feb
Mar
Apr
May
Jun
Jul
Aug
Sep
Oct
Nov
Dec
A. N
et F
orei
gn A
sset
s1,
606.
912,
833.
68 3
,656
.54
3,7
66.5
1 3
,811
.03
3,4
92.5
3 3
,761
.51
3,67
4.79
3,6
57.7
5 3
,524
.46
3,3
94.8
3 3
,492
.48
3,8
75.3
3 3
,762
.61
4,3
08.2
6
B. N
et In
tern
atio
nal
Rese
rves
1,30
0.59
2,45
9.37
3,9
24.8
7 4
,039
.85
4,0
82.9
2 3
,738
.23
4,0
07.4
3 3,
811.
13 3
,882
.96
3,6
80.4
4 3
,549
.31
3,6
04.2
9 4
,012
.72
3,5
60.0
3 4
,438
.97
C. G
ross
Res
erve
s2,
032.
163,
164.
81 4
,724
.89
4,7
67.8
2 4
,825
.52
4,5
03.6
1 4
,882
.99
4,70
4.49
4,7
64.9
3 4
,629
.23
4,5
02.0
4 4
,594
.66
4,9
77.7
5 4
,845
.93
5,3
82.8
2
D. S
hort
-Ter
m A
sset
s2,
027.
923,
160.
83 4
,720
.91
4,7
63.9
2 4
,821
.59
4,4
79.1
3 4
,858
.34
4,67
9.97
4,7
40.4
4 4
,604
.77
4,4
77.6
0 4
,570
.47
4,9
53.5
7 4
,821
.90
5,3
59.0
3 G
old
245.
1830
9.18
396
.95
395
.69
395
.71
395
.69
395
.69
395.
69 3
95.6
9 3
95.7
1 3
95.7
1 3
95.6
9 3
95.7
1 3
95.6
9 4
39.2
8
Hol
ding
s of
SD
Rs
1.44
453.
11 4
50.1
1 4
51.3
8 4
58.5
4 4
55.9
2 4
65.2
1 45
9.63
460
.88
457
.89
461
.01
447
.94
456
.44
444
.20
432
.64
Oth
ers
1,78
1.30
2,39
8.54
3,8
73.8
5 3
,916
.85
3,9
67.3
4 3
,627
.52
3,9
97.4
4 3,
824.
65 3
,883
.87
3,7
51.1
7 3
,620
.88
3,7
26.8
4 4
,101
.42
3,9
82.0
1 4
,487
.11
E. L
ong-
Term
Ass
ets
4.24
3.55
3.47
3.39
3.41
23.9
424
.123
.98
23.
95
23.
88
23.
86
23.
62
23.
58
23.
44
23.
31
F. F
orei
gn L
iabi
litie
s 28
.58
46.1
2 1
,342
.82
1,2
77.4
0 1
,300
.88
1,2
99.9
0 14
21.3
1,43
2.54
1,4
22.7
1 1
,491
.07
1,4
99.0
8 1
,520
.78
1,5
05.9
8 1
,811
.96
1,4
65.8
9
G. S
hort
-Ter
m42
5.17
326.
1752
4.93
451
.37
454
.00
453
.80
552.
8946
7.77
543
.56
539
.68
538
.09
549
.14
538.
9453
4.89
530
.30
IMF
157.
9426
0.28
381.
7 3
76.3
7 3
76.4
6 3
76.4
4 37
6.45
376.
45 4
72.5
8 4
68.4
5 4
68.4
7 4
68.4
2 46
8.43
468.
41 4
60.9
3
Oth
ers
267.
2365
.89
143.
23 7
5.00
7
7.54
7
7.36
17
6.44
91.3
2 7
0.98
7
1.23
6
9.62
8
0.72
70
.51
66.4
8 6
9.37
H. O
ther
Lia
bilit
ies
to In
t.
Inst
itutio
ns7.
878.
870.
49 0
.49
0.4
9 0
.49
0.4
9 0.
49 0
.59
0.5
9 0
.58
0.5
8 0
.55
0.5
7 0
.56
I. Fo
reig
n C
urre
ncy
De-
posi
ts29
4.29
366.
4227
0.62
272
.21
284
.18
286
.61
297.
5340
0.58
313
.33
384
.06
389
.62
416
.46
401
.36
726
.41
389
.20
J. N
et P
aym
ent A
gree
men
ts3.
733.
913.
853.
882.
212.
212.
292.
26 2
.20
2.2
4 2
.25
2.1
4 2
.20
2.1
3 2
.13
K. O
ther
s4.
060.
430.
510.
510.
520.
540.
550.
54 0
.54
0.5
8 0
.58
0.5
7 0
.60
0.5
9 0
.59
L. S
DR
Allo
catio
n-
551
.93
546.
7855
3.33
562.
2155
9.00
570.
3956
3.70
565
.23
566
.74
570
.79
554
.60
565
.13
550
.09
545
.83
* Pr
ovis
iona
l Dat
a
Tabl
e 17
. Hol
ders
and
Str
uctu
re o
f Dom
estic
Deb
t
(Mill
ions
of G
hana
Ced
is)
2008
20
09
2010
2011
Dec
Dec
Dec
Jan
Feb
Mar
Apr
May
Jun
Jul
Aug
Sep
Oct
Nov
Dec
HO
LDER
S
A. B
anki
ng s
yste
m3,
250.
454,
247.
595,
289.
075,
210.
475,
154.
615,
670.
936,
322.
876,
537.
536,
589.
046,
443.
086,
448.
876,
613.
386,
626.
876,
793.
387,
004.
59
Bank
of G
hana
1,87
2.07
1,75
4.31
1,53
3.33
1,5
42.8
9 1
,558
.46
2,1
55.4
3 2
,145
.52
2,13
5.01
2,14
7.67
2,14
7.91
2,24
3.95
2,43
0.29
2,63
6.62
2,70
1.75
2,70
2.30
Dep
osit
Mon
ey B
anks
(D
MBs
)1,
378.
382,
493.
273,
755.
74 3
,667
.58
3,5
96.1
5 3
,515
.50
4,1
77.3
5 4,
402.
524,
441.
374,
295.
174,
204.
924,
183.
093,
990.
254,
091.
624,
302.
30
B. N
on-B
ank
Sect
or1,
549.
781,
855.
402,
991.
053,
205.
043,
685.
033,
855.
663,
855.
784,
063.
214,
235.
994,
618.
854,
939.
204,
818.
674,
897.
864,
904.
234,
836.
53
SSN
IT25
5.59
246.
7120
1.43
216
.36
196
.47
233
.08
186
.51
232.
5116
4.32
415.
3046
4.55
420.
9844
8.23
472.
8347
5.13
Insu
ranc
e C
ompa
nies
39.9
452
.87
38.6
3 5
2.29
4
2.72
4
2.95
4
0.75
33
.41
48.0
446
.54
39.1
536
.09
38.1
838
.03
38.9
8
Oth
er H
olde
rs1,
254.
251,
555.
832,
750.
99 2
,936
.39
3,4
45.8
4 3
,579
.63
3,6
28.5
2 3,
797.
284,
023.
634,
157.
004,
435.
504,
361.
604,
411.
454,
393.
374,
322.
42
TOTA
L(A
+B)
4,80
0.23
6,10
2.99
8,28
0.12
8,41
5.51
8,83
9.65
9,52
6.60
10,1
78.6
510
,600
.74
10,8
25.0
311
,061
.93
11,3
88.0
611
,432
.05
11,5
24.7
311
,697
.60
11,8
41.1
2
STRU
CTU
RE
C. S
hort
-Ter
m In
stru
men
ts2,
022.
622,
643.
123,
214.
45 3
,329
.35
3,3
53.4
7 3
,447
.24
3,5
33.7
0 3
,579
.19
3,4
99.9
8 3
,522
.15
3,5
92.8
5 3
,751
.97
3,8
53.8
1 4
,086
.16
4,3
53.3
3
91-D
ay T
reas
ury
Bill
843.
0264
9.55
641.
00 8
07.4
3 8
11.8
4 8
97.7
6 9
21.6
5 7
20.1
7 6
52.2
2 6
52.8
8 8
38.7
5 8
16.5
7 8
43.4
1 9
80.0
3 1
,225
.02
182-
Day
Tre
asur
y Bi
ll66
5.32
1,76
6.98
1,33
4.62
1,3
11.9
8 1
,387
.43
1,4
86.5
9 1
,580
.69
1,6
50.2
2 1
,578
.75
1,4
69.2
4 1
,389
.38
1,2
91.1
3 1
,227
.16
1,2
54.9
7 1
,291
.11
1-Ye
ar T
reas
ury
Not
e28
0.04
122.
351,
134.
60 1
,105
.70
1,0
49.9
6 9
58.6
5 9
27.1
3 1
,104
.57
1,1
64.7
8 1
,295
.79
1,2
60.4
9 1
,540
.04
1,6
79.0
1 1
,746
.92
1,7
32.9
5
Shor
t-Te
rm A
dvan
ce23
4.24
104.
2410
4.24
104
.24
104
.24
104
.24
104
.24
104
.24
104
.24
104
.24
104
.24
104
.24
104
.24
104
.24
104
.24
D. M
ediu
m-T
erm
Inst
rum
ents
1,75
2.54
2,10
7.54
3,78
8.34
3,80
8.83
4,20
8.85
4,15
5.32
4,72
0.90
5,09
7.51
5,40
1.01
5,61
5.74
5,87
1.19
5,7
56.0
4 5
,784
.20
5,7
24.7
2 5
,601
.07
2-Ye
ar F
loat
ing
Trea
sury
N
ote
7.00
0.00
0.00
0.00
0.00
0.00
0.00
0.00
0.00
0.00
0.00
0.00
0.00
0.00
0.00
2-Ye
ar F
ixed
Tre
asur
y N
ote
534.
131,
001.
381,
647.
01 1
,647
.23
1,6
45.7
2 1
,656
.31
1,64
9.53
1,72
9.12
1,81
5.86
1,81
7.21
1,76
6.91
1,6
51.4
8 1,
479.
131,
419.
261,
174.
15
3-Y
ear G
GIL
BS
0.00
0.00
0.00
0.00
0.00
0.00
0.00
0.00
0.00
0.00
0.00
0.00
0.00
0.00
0.00
3-Ye
ar F
loat
ing
Trea
sury
N
ote
0.00
0.00
0.00
0.00
0.00
0.00
0.00
0.00
0.00
0.00
0.00
0.00
0.00
0.00
0.00
3-Ye
ar F
ixed
Tre
asur
y N
ote
752.
6262
7.57
1,65
3.11
1,6
73.0
1 2
,074
.21
2,0
09.7
1 2,
009.
712,
276.
422,
492.
802,
543.
842,
543.
84 2
,543
.84
2,74
3.84
2,74
3.84
2,74
3.84
3-Ye
ar S
tock
(SBG
)0.
000.
000.
000.
000.
000.
000.
0029
.92
29.9
229
.92
29.9
2 2
9.92
29
.92
29.9
229
.92
3-Ye
ar S
tock
(SSN
IT)
0.00
0.00
0.00
0.00
0.00
0.00
0.00
0.00
0.00
161.
9516
1.95
161
.95
161.
9516
1.95
161.
95
5-Ye
ar G
OG
Bon
d26
8.77
268.
7726
8.77
268
.77
268
.77
268
.77
268.
7726
8.77
268.
7726
8.77
574.
11 5
74.1
1 57
4.11
574.
1169
5.14
5-Ye
ar G
olde
n Ju
bile
e Bo
nd19
.80
29.4
2 2
9.79
3
0.12
3
0.50
30
.87
31.2
531
.63
32.0
232
.44
32.
72
33.2
233
.62
34.0
5G
OG
Pet
role
um F
inan
ce
Bond
80.0
280
.02
80.0
280
.02
80.0
280
.02
80.0
280
.02
80.0
280
.02
80.0
2 8
0.02
80
.02
80.0
280
.02
TOR
Bond
s11
0.00
110.
0011
0.00
110.
0011
0.00
110.
0068
2.00
682.
0068
2.00
682.
0068
2.00
682
.00
682.
0068
2.00
682.
00
E. L
ong-
Term
Inst
rum
ents
1,02
5.07
1,35
2.33
1,27
7.33
1,27
7.33
1,27
7.33
1,92
4.04
1,92
4.04
1,92
4.04
1,92
4.04
1,92
4.04
1,92
4.04
1,9
24.0
4 1
,886
.72
1,8
86.7
2 1
,886
.72
Long
-Ter
m G
over
nmen
t
Stoc
ks42
1.60
748.
8467
3.84
673
.84
673
.84
1,3
20.5
5 1
,320
.55
1320
.55
1320
.55
1320
.55
1320
.55
1,3
20.5
5 1,
320.
55
1,32
0.55
1,
320.
55
Tele
kom
Mal
asia
Sto
ck10
9.46
109.
4610
9.46
109.
4610
9.46
109.
4610
9.46
109.
4610
9.46
109.
4610
9.46
109
.46
109.
46
109.
46
109.
46
Reva
luat
ion
Stoc
k49
3.10
493.
0549
3.05
493.
0549
3.05
493.
0549
3.05
493.
0549
3.05
493.
0549
3.05
493
.05
455.
73
455.
73
455.
73
Oth
er G
over
nmen
t Sto
cks
1.00
0.98
0.98
0.98
0.98
0.98
0.98
0.98
0.98
0.98
0.98
0.9
8 0.
98
0.98
0.
98
TOTA
L(C
+D+E
)4,
800.
236,
102.
998,
280.
128,
415.
518,
839.
659,
526.
6010
,178
.65
10,6
00.7
410
,825
.03
11,0
61.9
311
,388
.06
11,4
32.0
511
,524
.73
11,6
97.6
011
,841
.12
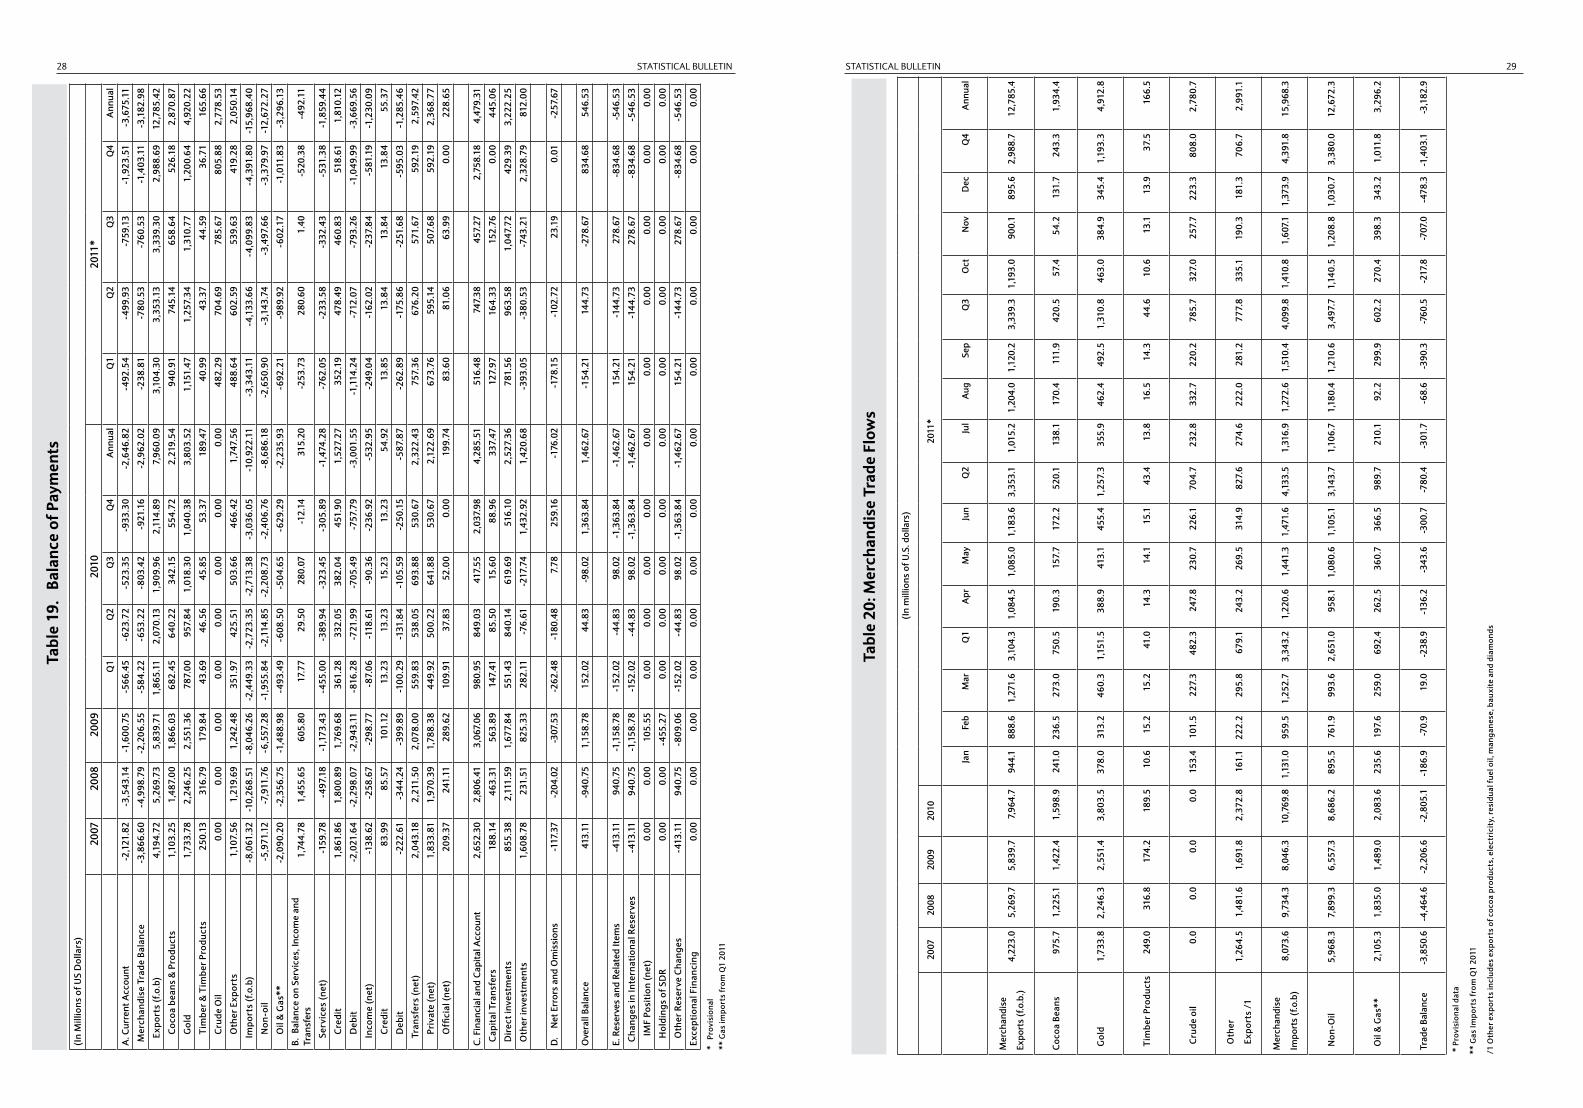
STATISTICAL BULLETIN STATISTICAL BULLETIN28 29
(In
mill
ions
of U
.S. d
olla
rs)
2007
2008
2009
2010
2011
*
Jan
Feb
Mar
Q1
Apr
May
Jun
Q2
Jul
Aug
Sep
Q3
Oct
Nov
Dec
Q4
Ann
ual
Mer
chan
dise
Expo
rts
(f.o
.b.)
4,22
3.0
5,26
9.7
5,83
9.7
7,96
4.7
944.
188
8.6
1,27
1.6
3,10
4.3
1,08
4.5
1,08
5.0
1,18
3.6
3,35
3.1
1,01
5.2
1,20
4.0
1,12
0.2
3,33
9.3
1,19
3.0
900.
189
5.6
2,98
8.7
12,7
85.4
Coc
oa B
eans
97
5.7
1,22
5.1
1,42
2.4
1,59
8.9
241.
023
6.5
273.
075
0.5
190.
315
7.7
172.
252
0.1
138.
117
0.4
111.
942
0.5
57.4
54.2
131.
724
3.3
1,93
4.4
Gol
d1,
733.
82,
246.
32,
551.
43,
803.
537
8.0
313.
246
0.3
1,15
1.5
388.
941
3.1
455.
41,
257.
335
5.9
462.
449
2.5
1,31
0.8
463.
038
4.9
345.
41,
193.
34,
912.
8
Tim
ber P
rodu
cts
249.
031
6.8
174.
218
9.5
10.6
15.2
15.2
41.0
14.3
14.1
15.1
43.4
13.8
16.5
14.3
44.6
10.6
13.1
13.9
37.5
166.
5
Cru
de o
il0.
00.
00.
00.
015
3.4
101.
522
7.3
482.
324
7.8
230.
722
6.1
704.
723
2.8
332.
722
0.2
785.
732
7.0
257.
722
3.3
808.
02,
780.
7
Oth
er
Exp
orts
/1
1,26
4.5
1,48
1.6
1,69
1.8
2,37
2.8
161.
122
2.2
295.
867
9.1
243.
226
9.5
314.
982
7.6
274.
622
2.0
281.
277
7.8
335.
119
0.3
181.
370
6.7
2,99
1.1
Mer
chan
dise
Impo
rts
(f.o
.b)
8,07
3.6
9,73
4.3
8,04
6.3
10,7
69.8
1,13
1.0
959.
51,
252.
73,
343.
21,
220.
61,
441.
31,
471.
64,
133.
51,
316.
91,
272.
61,
510.
44,
099.
81,
410.
81,
607.
11,
373.
94,
391.
815
,968
.3
Non
-Oil
5,96
8.3
7,89
9.3
6,55
7.3
8,68
6.2
895.
576
1.9
993.
62,
651.
095
8.1
1,08
0.6
1,10
5.1
3,14
3.7
1,10
6.7
1,18
0.4
1,21
0.6
3,49
7.7
1,14
0.5
1,20
8.8
1,03
0.7
3,38
0.0
12,6
72.3
Oil
& G
as**
2,10
5.3
1,83
5.0
1,48
9.0
2,08
3.6
235.
619
7.6
259.
069
2.4
262.
536
0.7
366.
598
9.7
210.
192
.229
9.9
602.
227
0.4
398.
334
3.2
1,01
1.8
3,29
6.2
Trad
e Ba
lanc
e-3
,850
.6-4
,464
.6-2
,206
.6-2
,805
.1-1
86.9
-70.
919
.0-2
38.9
-136
.2-3
43.6
-300
.7-7
80.4
-301
.7-6
8.6
-390
.3-7
60.5
-217
.8-7
07.0
-478
.3-1
,403
.1-3
,182
.9
* P
rovi
sion
al d
ata
** G
as Im
port
s fr
om Q
1 20
11
/1 O
ther
exp
orts
incl
udes
exp
orts
of c
ocoa
pro
duct
s, e
lect
rici
ty, r
esid
ual f
uel o
il, m
anga
nese
, bau
xite
and
dia
mon
ds
Tabl
e 20
: Mer
chan
dise
Tra
de F
low
s
Tabl
e 19
. B
alan
ce o
f Pay
men
ts
(In
Mill
ions
of U
S D
olla
rs)
2007
2008
2009
2010
2011
*Q
1Q
2Q
3Q
4A
nnua
lQ
1Q
2Q
3Q
4A
nnua
l
A. C
urre
nt A
ccou
nt-2
,121
.82
-3,5
43.1
4-1
,600
.75
-566
.45
-623
.72
-523
.35
-933
.30
-2,6
46.8
2-4
92.5
4-4
99.9
3-7
59.1
3-1
,923
.51
-3,6
75.1
1
Mer
chan
dise
Tra
de B
alan
ce-3
,866
.60
-4,9
98.7
9-2
,206
.55
-584
.22
-653
.22
-803
.42
-921
.16
-2,9
62.0
2-2
38.8
1-7
80.5
3-7
60.5
3-1
,403
.11
-3,1
82.9
8
Expo
rts
(f.o
.b)
4,19
4.72
5,26
9.73
5,83
9.71
1,86
5.11
2,07
0.13
1,90
9.96
2,11
4.89
7,96
0.09
3,10
4.30
3,35
3.13
3,33
9.30
2,98
8.69
12,7
85.4
2
Coc
oa b
eans
& P
rodu
cts
1,10
3.25
1,48
7.00
1,86
6.03
682.
4564
0.22
342.
1555
4.72
2,21
9.54
940.
9174
5.14
658.
6452
6.18
2,87
0.87
Gol
d1,
733.
782,
246.
252,
551.
3678
7.00
957.
841,
018.
301,
040.
383,
803.
521,
151.
471,
257.
341,
310.
771,
200.
644,
920.
22
Tim
ber &
Tim
ber P
rodu
cts
250.
1331
6.79
179.
8443
.69
46.5
645
.85
53.3
718
9.47
40.9
943
.37
44.5
936
.71
165.
66
Cru
de O
il0.
00
0.00
0.
00
0.00
0.
00
0.00
0.
00
0.00
48
2.29
704.
6978
5.67
805.
882,
778.
53
Oth
er E
xpor
ts1,
107.
561,
219.
691,
242.
4835
1.97
425.
5150
3.66
466.
421,
747.
5648
8.64
602.
5953
9.63
419.
282,
050.
14
Impo
rts
(f.o
.b)
-8,0
61.3
2-1
0,26
8.51
-8,0
46.2
6-2
,449
.33
-2,7
23.3
5-2
,713
.38
-3,0
36.0
5-1
0,92
2.11
-3,3
43.1
1-4
,133
.66
-4,0
99.8
3-4
,391
.80
-15,
968.
40
Non
-oil
-5,9
71.1
2-7
,911
.76
-6,5
57.2
8-1
,955
.84
-2,1
14.8
5-2
,208
.73
-2,4
06.7
6-8
,686
.18
-2,6
50.9
0-3
,143
.74
-3,4
97.6
6-3
,379
.97
-12,
672.
27
Oil
& G
as**
-2,0
90.2
0-2
,356
.75
-1,4
88.9
8-4
93.4
9-6
08.5
0-5
04.6
5-6
29.2
9-2
,235
.93
-692
.21
-989
.92
-602
.17
-1,0
11.8
3-3
,296
.13
B. B
alan
ce o
n Se
rvic
es, I
ncom
e an
d Tr
ansf
ers
1,74
4.78
1,45
5.65
605.
8017
.77
29.5
028
0.07
-12.
1431
5.20
-253
.73
280.
601.
40-5
20.3
8-4
92.1
1
Serv
ices
(net
)-1
59.7
8-4
97.1
8-1
,173
.43
-455
.00
-389
.94
-323
.45
-305
.89
-1,4
74.2
8-7
62.0
5-2
33.5
8-3
32.4
3-5
31.3
8-1
,859
.44
Cre
dit
1,86
1.86
1,80
0.89
1,76
9.68
361.
2833
2.05
382.
0445
1.90
1,52
7.27
352.
1947
8.49
460.
8351
8.61
1,81
0.12
Deb
it-2
,021
.64
-2,2
98.0
7-2
,943
.11
-816
.28
-721
.99
-705
.49
-757
.79
-3,0
01.5
5-1
,114
.24
-712
.07
-793
.26
-1,0
49.9
9-3
,669
.56
Inco
me
(net
)-1
38.6
2-2
58.6
7-2
98.7
7-8
7.06
-118
.61
-90.
36-2
36.9
2-5
32.9
5-2
49.0
4-1
62.0
2-2
37.8
4-5
81.1
9-1
,230
.09
Cre
dit
83.9
985
.57
101.
1213
.23
13.2
315
.23
13.2
354
.92
13.8
513
.84
13.8
413
.84
55.3
7
Deb
it-2
22.6
1-3
44.2
4-3
99.8
9-1
00.2
9-1
31.8
4-1
05.5
9-2
50.1
5-5
87.8
7-2
62.8
9-1
75.8
6-2
51.6
8-5
95.0
3-1
,285
.46
Tran
sfer
s (n
et)
2,04
3.18
2,21
1.50
2,07
8.00
559.
8353
8.05
693.
8853
0.67
2,32
2.43
757.
3667
6.20
571.
6759
2.19
2,59
7.42
Priv
ate
(net
)1,
833.
811,
970.
391,
788.
3844
9.92
500.
2264
1.88
530.
672,
122.
6967
3.76
595.
1450
7.68
592.
192,
368.
77
Offi
cial
(net
)20
9.37
241.
1128
9.62
109.
9137
.83
52.0
00.
0019
9.74
83.6
081
.06
63.9
90.
0022
8.65
C. F
inan
cial
and
Cap
ital A
ccou
nt2,
652.
302,
806.
413,
067.
0698
0.95
849.
0341
7.55
2,03
7.98
4,28
5.51
516.
4874
7.38
457.
272,
758.
184,
479.
31
Cap
ital
Tra
nsfe
rs18
8.14
463.
3156
3.89
147.
4185
.50
15.6
088
.96
337.
4712
7.97
164.
3315
2.76
0.00
445.
06
Dir
ect i
nves
tmen
ts85
5.38
2,11
1.59
1,67
7.84
551.
4384
0.14
619.
6951
6.10
2,52
7.36
781.
5696
3.58
1,04
7.72
429.
393,
222.
25
Oth
er in
vest
men
ts1,
608.
7823
1.51
825.
3328
2.11
-76.
61-2
17.7
41,
432.
921,
420.
68-3
93.0
5-3
80.5
3-7
43.2
12,
328.
7981
2.00
D.
Net
Err
ors
and
Om
issi
ons
-117
.37
-204
.02
-307
.53
-262
.48
-180
.48
7.78
259.
16-1
76.0
2-1
78.1
5-1
02.7
223
.19
0.01
-257
.67
Ove
rall
Bala
nce
413.
11-9
40.7
51,
158.
7815
2.02
44.8
3-9
8.02
1,36
3.84
1,46
2.67
-154
.21
144.
73-2
78.6
783
4.68
546.
53
E. R
eser
ves
and
Rela
ted
Item
s-4
13.1
194
0.75
-1,1
58.7
8-1
52.0
2-4
4.83
98.0
2-1
,363
.84
-1,4
62.6
715
4.21
-144
.73
278.
67-8
34.6
8-5
46.5
3
Cha
nges
in In
tern
atio
nal R
eser
ves
-413
.11
940.
75-1
,158
.78
-152
.02
-44.
8398
.02
-1,3
63.8
4-1
,462
.67
154.
21-1
44.7
327
8.67
-834
.68
-546
.53
IMF
Posi
tion
(net
)0.
000.
0010
5.55
0.00
0.00
0.00
0.00
0.00
0.00
0.00
0.00
0.00
0.00
Hol
ding
s of
SD
R0.
000.
00-4
55.2
70.
000.
000.
000.
000.
000.
000.
000.
000.
000.
00
Oth
er R
eser
ve C
hang
es-4
13.1
194
0.75
-809
.06
-152
.02
-44.
8398
.02
-1,3
63.8
4-1
,462
.67
154.
21-1
44.7
327
8.67
-834
.68
-546
.53
Exce
ptio
nal F
inan
cing
0.00
0.00
0.00
0.00
0.00
0.00
0.00
0.00
0.00
0.00
0.00
0.00
0.00
* P
rovi
sion
al**
Gas
impo
rts
from
Q1
2011
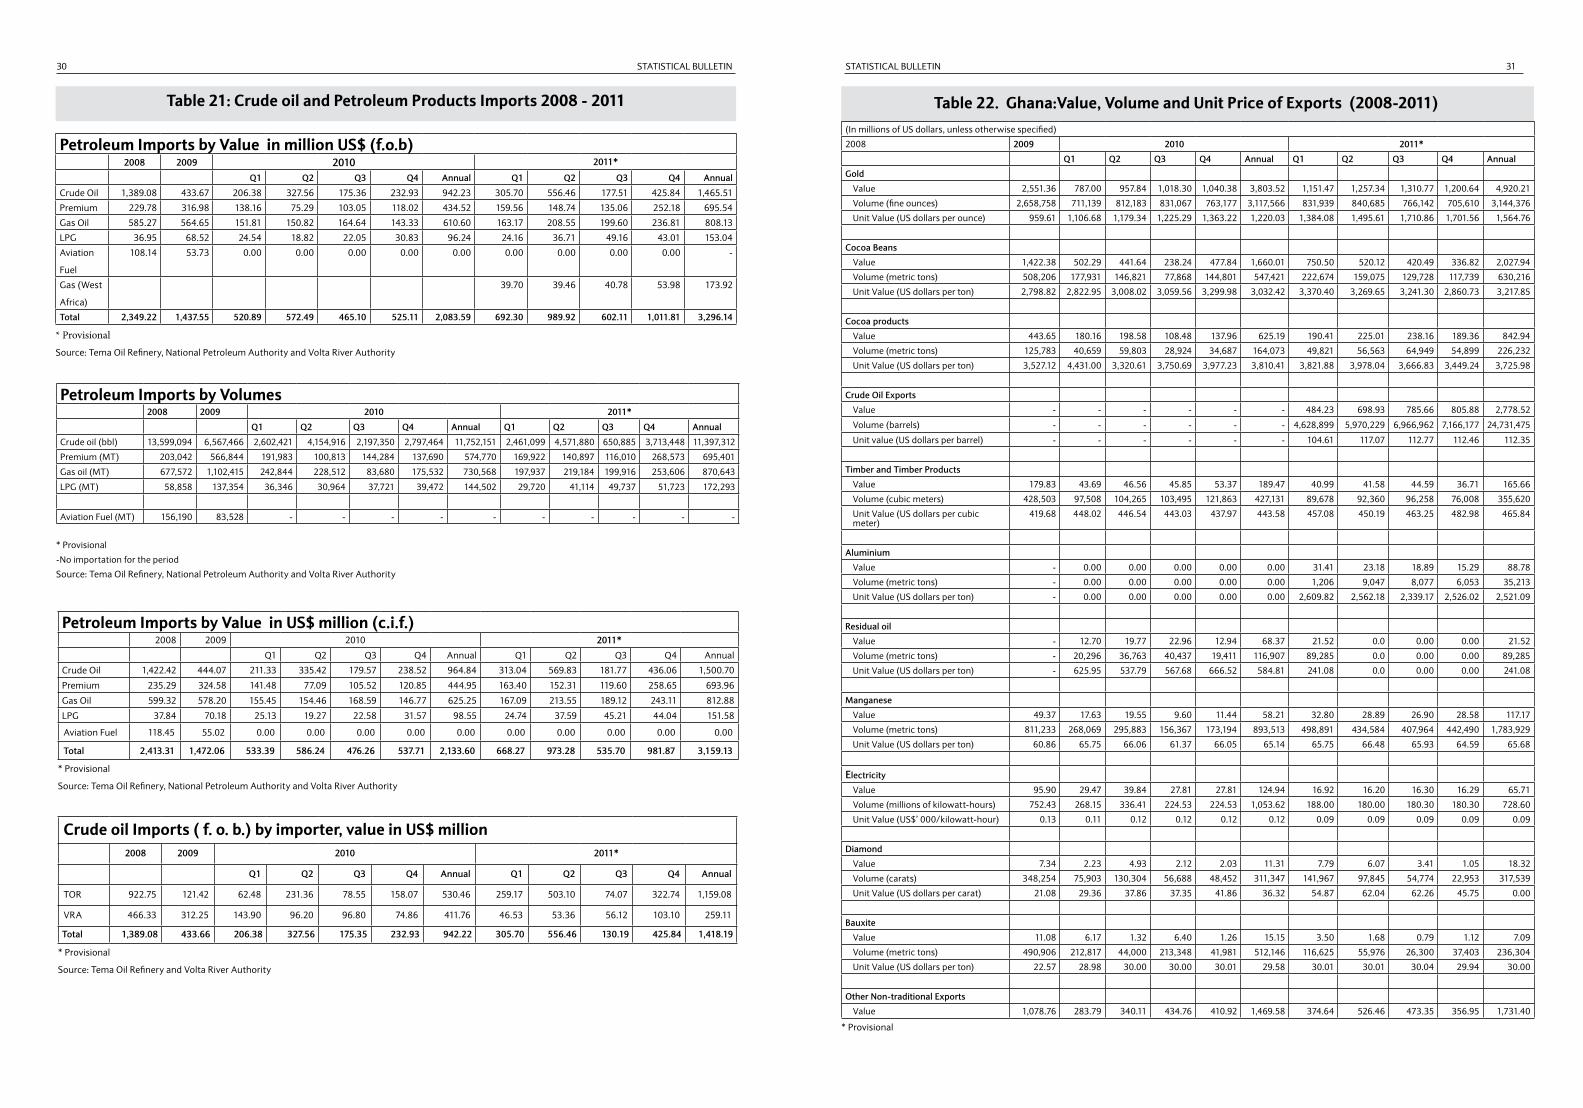
STATISTICAL BULLETIN STATISTICAL BULLETIN30 31
Table 21: Crude oil and Petroleum Products Imports 2008 - 2011
Petroleum Imports by Value in million US$ (f.o.b)2008 2009 2010 2011*
Q1 Q2 Q3 Q4 Annual Q1 Q2 Q3 Q4 Annual
Crude Oil 1,389.08 433.67 206.38 327.56 175.36 232.93 942.23 305.70 556.46 177.51 425.84 1,465.51
Premium 229.78 316.98 138.16 75.29 103.05 118.02 434.52 159.56 148.74 135.06 252.18 695.54
Gas Oil 585.27 564.65 151.81 150.82 164.64 143.33 610.60 163.17 208.55 199.60 236.81 808.13
LPG 36.95 68.52 24.54 18.82 22.05 30.83 96.24 24.16 36.71 49.16 43.01 153.04
Aviation
Fuel
108.14 53.73 0.00 0.00 0.00 0.00 0.00 0.00 0.00 0.00 0.00 -
Gas (West
Africa)
39.70 39.46 40.78 53.98 173.92
Total 2,349.22 1,437.55 520.89 572.49 465.10 525.11 2,083.59 692.30 989.92 602.11 1,011.81 3,296.14
* Provisional Source: Tema Oil Refinery, National Petroleum Authority and Volta River Authority
Petroleum Imports by Volumes2008 2009 2010 2011*
Q1 Q2 Q3 Q4 Annual Q1 Q2 Q3 Q4 Annual
Crude oil (bbl) 13,599,094 6,567,466 2,602,421 4,154,916 2,197,350 2,797,464 11,752,151 2,461,099 4,571,880 650,885 3,713,448 11,397,312
Premium (MT) 203,042 566,844 191,983 100,813 144,284 137,690 574,770 169,922 140,897 116,010 268,573 695,401
Gas oil (MT) 677,572 1,102,415 242,844 228,512 83,680 175,532 730,568 197,937 219,184 199,916 253,606 870,643
LPG (MT) 58,858 137,354 36,346 30,964 37,721 39,472 144,502 29,720 41,114 49,737 51,723 172,293
Aviation Fuel (MT) 156,190 83,528 - - - - - - - - - -
* Provisional
-No importation for the period
Source: Tema Oil Refinery, National Petroleum Authority and Volta River Authority
Petroleum Imports by Value in US$ million (c.i.f.)2008 2009 2010 2011*
Q1 Q2 Q3 Q4 Annual Q1 Q2 Q3 Q4 Annual
Crude Oil 1,422.42 444.07 211.33 335.42 179.57 238.52 964.84 313.04 569.83 181.77 436.06 1,500.70
Premium 235.29 324.58 141.48 77.09 105.52 120.85 444.95 163.40 152.31 119.60 258.65 693.96
Gas Oil 599.32 578.20 155.45 154.46 168.59 146.77 625.25 167.09 213.55 189.12 243.11 812.88
LPG 37.84 70.18 25.13 19.27 22.58 31.57 98.55 24.74 37.59 45.21 44.04 151.58
Aviation Fuel 118.45 55.02 0.00 0.00 0.00 0.00 0.00 0.00 0.00 0.00 0.00 0.00
Total 2,413.31 1,472.06 533.39 586.24 476.26 537.71 2,133.60 668.27 973.28 535.70 981.87 3,159.13
* Provisional
Source: Tema Oil Refinery, National Petroleum Authority and Volta River Authority
Crude oil Imports ( f. o. b.) by importer, value in US$ million2008 2009 2010 2011*
Q1 Q2 Q3 Q4 Annual Q1 Q2 Q3 Q4 Annual
TOR 922.75 121.42 62.48 231.36 78.55 158.07 530.46 259.17 503.10 74.07 322.74 1,159.08
VRA 466.33 312.25 143.90 96.20 96.80 74.86 411.76 46.53 53.36 56.12 103.10 259.11
Total 1,389.08 433.66 206.38 327.56 175.35 232.93 942.22 305.70 556.46 130.19 425.84 1,418.19
* Provisional
Source: Tema Oil Refinery and Volta River Authority
Table 22. Ghana:Value, Volume and Unit Price of Exports (2008-2011)(In millions of US dollars, unless otherwise specified)
2008 2009 2010 2011*
Q1 Q2 Q3 Q4 Annual Q1 Q2 Q3 Q4 Annual
Gold
Value 2,551.36 787.00 957.84 1,018.30 1,040.38 3,803.52 1,151.47 1,257.34 1,310.77 1,200.64 4,920.21
Volume (fine ounces) 2,658,758 711,139 812,183 831,067 763,177 3,117,566 831,939 840,685 766,142 705,610 3,144,376
Unit Value (US dollars per ounce) 959.61 1,106.68 1,179.34 1,225.29 1,363.22 1,220.03 1,384.08 1,495.61 1,710.86 1,701.56 1,564.76
Cocoa Beans
Value 1,422.38 502.29 441.64 238.24 477.84 1,660.01 750.50 520.12 420.49 336.82 2,027.94
Volume (metric tons) 508,206 177,931 146,821 77,868 144,801 547,421 222,674 159,075 129,728 117,739 630,216
Unit Value (US dollars per ton) 2,798.82 2,822.95 3,008.02 3,059.56 3,299.98 3,032.42 3,370.40 3,269.65 3,241.30 2,860.73 3,217.85
Cocoa products
Value 443.65 180.16 198.58 108.48 137.96 625.19 190.41 225.01 238.16 189.36 842.94
Volume (metric tons) 125,783 40,659 59,803 28,924 34,687 164,073 49,821 56,563 64,949 54,899 226,232
Unit Value (US dollars per ton) 3,527.12 4,431.00 3,320.61 3,750.69 3,977.23 3,810.41 3,821.88 3,978.04 3,666.83 3,449.24 3,725.98
Crude Oil Exports
Value - - - - - - 484.23 698.93 785.66 805.88 2,778.52
Volume (barrels) - - - - - - 4,628,899 5,970,229 6,966,962 7,166,177 24,731,475
Unit value (US dollars per barrel) - - - - - - 104.61 117.07 112.77 112.46 112.35
Timber and Timber Products
Value 179.83 43.69 46.56 45.85 53.37 189.47 40.99 41.58 44.59 36.71 165.66
Volume (cubic meters) 428,503 97,508 104,265 103,495 121,863 427,131 89,678 92,360 96,258 76,008 355,620
Unit Value (US dollars per cubic meter)
419.68 448.02 446.54 443.03 437.97 443.58 457.08 450.19 463.25 482.98 465.84
Aluminium
Value - 0.00 0.00 0.00 0.00 0.00 31.41 23.18 18.89 15.29 88.78
Volume (metric tons) - 0.00 0.00 0.00 0.00 0.00 1,206 9,047 8,077 6,053 35,213
Unit Value (US dollars per ton) - 0.00 0.00 0.00 0.00 0.00 2,609.82 2,562.18 2,339.17 2,526.02 2,521.09
Residual oil
Value - 12.70 19.77 22.96 12.94 68.37 21.52 0.0 0.00 0.00 21.52
Volume (metric tons) - 20,296 36,763 40,437 19,411 116,907 89,285 0.0 0.00 0.00 89,285
Unit Value (US dollars per ton) - 625.95 537.79 567.68 666.52 584.81 241.08 0.0 0.00 0.00 241.08
Manganese
Value 49.37 17.63 19.55 9.60 11.44 58.21 32.80 28.89 26.90 28.58 117.17
Volume (metric tons) 811,233 268,069 295,883 156,367 173,194 893,513 498,891 434,584 407,964 442,490 1,783,929
Unit Value (US dollars per ton) 60.86 65.75 66.06 61.37 66.05 65.14 65.75 66.48 65.93 64.59 65.68
Electricity
Value 95.90 29.47 39.84 27.81 27.81 124.94 16.92 16.20 16.30 16.29 65.71
Volume (millions of kilowatt-hours) 752.43 268.15 336.41 224.53 224.53 1,053.62 188.00 180.00 180.30 180.30 728.60
Unit Value (US$’ 000/kilowatt-hour) 0.13 0.11 0.12 0.12 0.12 0.12 0.09 0.09 0.09 0.09 0.09
Diamond
Value 7.34 2.23 4.93 2.12 2.03 11.31 7.79 6.07 3.41 1.05 18.32
Volume (carats) 348,254 75,903 130,304 56,688 48,452 311,347 141,967 97,845 54,774 22,953 317,539
Unit Value (US dollars per carat) 21.08 29.36 37.86 37.35 41.86 36.32 54.87 62.04 62.26 45.75 0.00
Bauxite
Value 11.08 6.17 1.32 6.40 1.26 15.15 3.50 1.68 0.79 1.12 7.09
Volume (metric tons) 490,906 212,817 44,000 213,348 41,981 512,146 116,625 55,976 26,300 37,403 236,304
Unit Value (US dollars per ton) 22.57 28.98 30.00 30.00 30.01 29.58 30.01 30.01 30.04 29.94 30.00
Other Non-traditional Exports
Value 1,078.76 283.79 340.11 434.76 410.92 1,469.58 374.64 526.46 473.35 356.95 1,731.40
* Provisional
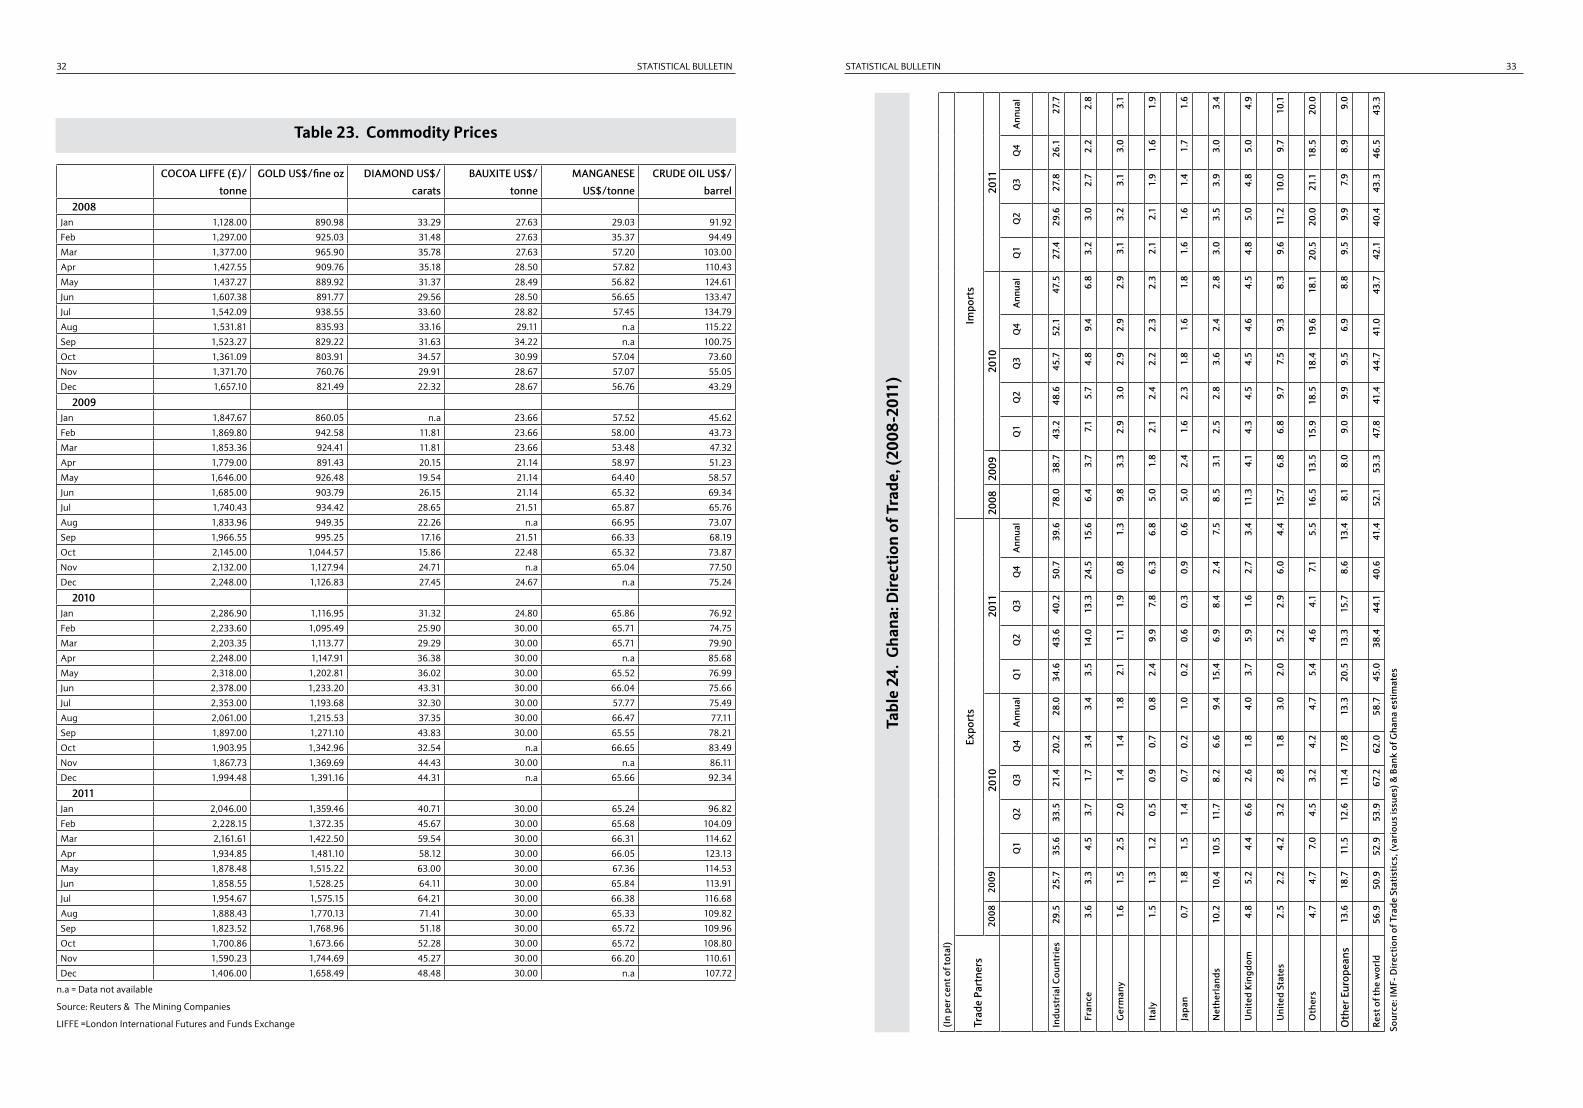
STATISTICAL BULLETIN STATISTICAL BULLETIN32 33
COCOA LIFFE (£)/
tonne
GOLD US$/fine oz DIAMOND US$/
carats
BAUXITE US$/
tonne
MANGANESE
US$/tonne
CRUDE OIL US$/
barrel2008
Jan 1,128.00 890.98 33.29 27.63 29.03 91.92
Feb 1,297.00 925.03 31.48 27.63 35.37 94.49
Mar 1,377.00 965.90 35.78 27.63 57.20 103.00
Apr 1,427.55 909.76 35.18 28.50 57.82 110.43
May 1,437.27 889.92 31.37 28.49 56.82 124.61
Jun 1,607.38 891.77 29.56 28.50 56.65 133.47
Jul 1,542.09 938.55 33.60 28.82 57.45 134.79
Aug 1,531.81 835.93 33.16 29.11 n.a 115.22
Sep 1,523.27 829.22 31.63 34.22 n.a 100.75
Oct 1,361.09 803.91 34.57 30.99 57.04 73.60
Nov 1,371.70 760.76 29.91 28.67 57.07 55.05
Dec 1,657.10 821.49 22.32 28.67 56.76 43.29
2009Jan 1,847.67 860.05 n.a 23.66 57.52 45.62
Feb 1,869.80 942.58 11.81 23.66 58.00 43.73
Mar 1,853.36 924.41 11.81 23.66 53.48 47.32
Apr 1,779.00 891.43 20.15 21.14 58.97 51.23
May 1,646.00 926.48 19.54 21.14 64.40 58.57
Jun 1,685.00 903.79 26.15 21.14 65.32 69.34
Jul 1,740.43 934.42 28.65 21.51 65.87 65.76
Aug 1,833.96 949.35 22.26 n.a 66.95 73.07
Sep 1,966.55 995.25 17.16 21.51 66.33 68.19
Oct 2,145.00 1,044.57 15.86 22.48 65.32 73.87
Nov 2,132.00 1,127.94 24.71 n.a 65.04 77.50
Dec 2,248.00 1,126.83 27.45 24.67 n.a 75.24
2010Jan 2,286.90 1,116.95 31.32 24.80 65.86 76.92
Feb 2,233.60 1,095.49 25.90 30.00 65.71 74.75
Mar 2,203.35 1,113.77 29.29 30.00 65.71 79.90
Apr 2,248.00 1,147.91 36.38 30.00 n.a 85.68
May 2,318.00 1,202.81 36.02 30.00 65.52 76.99
Jun 2,378.00 1,233.20 43.31 30.00 66.04 75.66
Jul 2,353.00 1,193.68 32.30 30.00 57.77 75.49
Aug 2,061.00 1,215.53 37.35 30.00 66.47 77.11
Sep 1,897.00 1,271.10 43.83 30.00 65.55 78.21
Oct 1,903.95 1,342.96 32.54 n.a 66.65 83.49
Nov 1,867.73 1,369.69 44.43 30.00 n.a 86.11
Dec 1,994.48 1,391.16 44.31 n.a 65.66 92.34
2011Jan 2,046.00 1,359.46 40.71 30.00 65.24 96.82
Feb 2,228.15 1,372.35 45.67 30.00 65.68 104.09
Mar 2,161.61 1,422.50 59.54 30.00 66.31 114.62
Apr 1,934.85 1,481.10 58.12 30.00 66.05 123.13
May 1,878.48 1,515.22 63.00 30.00 67.36 114.53
Jun 1,858.55 1,528.25 64.11 30.00 65.84 113.91
Jul 1,954.67 1,575.15 64.21 30.00 66.38 116.68
Aug 1,888.43 1,770.13 71.41 30.00 65.33 109.82
Sep 1,823.52 1,768.96 51.18 30.00 65.72 109.96
Oct 1,700.86 1,673.66 52.28 30.00 65.72 108.80
Nov 1,590.23 1,744.69 45.27 30.00 66.20 110.61
Dec 1,406.00 1,658.49 48.48 30.00 n.a 107.72
n.a = Data not available
Source: Reuters & The Mining Companies
LIFFE =London International Futures and Funds Exchange
Table 23. Commodity Prices
(In
per c
ent o
f tot
al)
Trad
e Pa
rtne
rsEx
port
sIm
port
s
2008
2009
2010
2011
2008
2009
2010
2011
Q1
Q2
Q3
Q4
Ann
ual
Q1
Q2
Q3
Q4
Ann
ual
Q1
Q2
Q3
Q4
Ann
ual
Q1
Q2
Q3
Q4
Ann
ual
Indu
stri
al C
ount
ries
29.5
25.7
35.6
33.5
21.4
20.2
28.0
34.6
43.6
40.2
50.7
39.6
78.0
38.7
43.2
48.6
45.7
52.1
47.5
27.4
29.6
27.8
26.1
27.7
Fr
ance
3.6
3.3
4.5
3.7
1.7
3.4
3.4
3.5
14.0
13.3
24.5
15.6
6.4
3.7
7.1
5.7
4.8
9.4
6.8
3.2
3.0
2.7
2.2
2.8
G
erm
any
1.6
1.5
2.5
2.0
1.4
1.4
1.8
2.1
1.1
1.9
0.8
1.3
9.8
3.3
2.9
3.0
2.9
2.9
2.9
3.1
3.2
3.1
3.0
3.1
It
aly
1.5
1.3
1.2
0.5
0.9
0.7
0.8
2.4
9.9
7.8
6.3
6.8
5.0
1.8
2.1
2.4
2.2
2.3
2.3
2.1
2.1
1.9
1.6
1.9
Ja
pan
0.7
1.8
1.5
1.4
0.7
0.2
1.0
0.2
0.6
0.3
0.9
0.6
5.0
2.4
1.6
2.3
1.8
1.6
1.8
1.6
1.6
1.4
1.7
1.6
N
ethe
rlan
ds10
.210
.410
.511
.78.
26.
69.
415
.46.
98.
42.
47.
58.
53.
12.
52.
83.
62.
42.
83.
03.
53.
93.
03.
4
U
nite
d Ki
ngdo
m4.
85.
24.
46.
62.
61.
84.
03.
75.
91.
62.
73.
411
.34.
14.
34.
54.
54.
64.
54.
85.
04.
85.
04.
9
U
nite
d St
ates
2.5
2.2
4.2
3.2
2.8
1.8
3.0
2.0
5.2
2.9
6.0
4.4
15.7
6.8
6.8
9.7
7.5
9.3
8.3
9.6
11.2
10.0
9.7
10.1
O
ther
s4.
74.
77.
04.
53.
24.
24.
75.
44.
64.
17.
15.
516
.513
.515
.918
.518
.419
.618
.120
.520
.021
.118
.520
.0
Oth
er E
urop
eans
13.6
18.7
11.5
12.6
11.4
17.8
13.3
20.5
13.3
15.7
8.6
13.4
8.1
8.0
9.0
9.9
9.5
6.9
8.8
9.5
9.9
7.9
8.9
9.0
Rest
of t
he w
orld
56.9
50.9
52.9
53.9
67.2
62.0
58.7
45.0
38.4
44.1
40.6
41.4
52.1
53.3
47.8
41.4
44.7
41.0
43.7
42.1
40.4
43.3
46.5
43.3
Sour
ce: I
MF-
Dir
ectio
n of
Tra
de S
tatis
tics,
(var
ious
issu
es) &
Ban
k of
Gha
na e
stim
ates
Tabl
e 24
. G
hana
: Dir
ectio
n of
Tra
de, (
2008
-201
1)
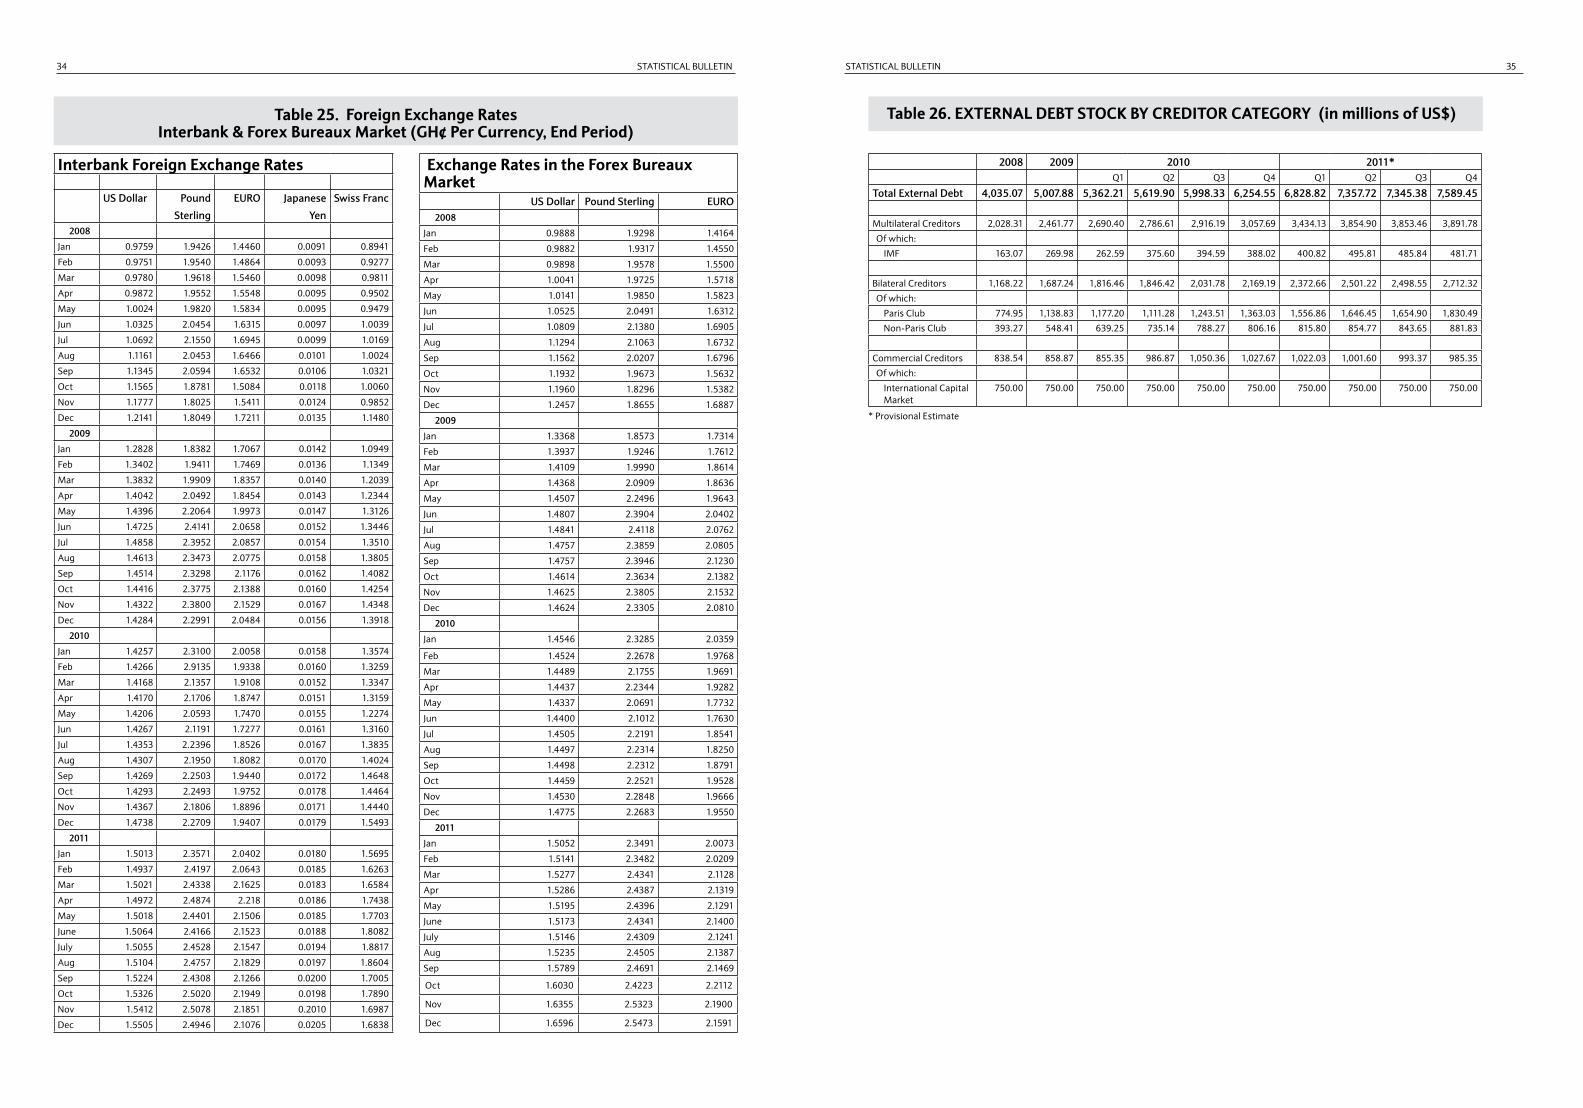
STATISTICAL BULLETIN STATISTICAL BULLETIN34 35
Interbank Foreign Exchange Rates
US Dollar Pound
Sterling
EURO Japanese
Yen
Swiss Franc
2008
Jan 0.9759 1.9426 1.4460 0.0091 0.8941
Feb 0.9751 1.9540 1.4864 0.0093 0.9277
Mar 0.9780 1.9618 1.5460 0.0098 0.9811
Apr 0.9872 1.9552 1.5548 0.0095 0.9502
May 1.0024 1.9820 1.5834 0.0095 0.9479
Jun 1.0325 2.0454 1.6315 0.0097 1.0039
Jul 1.0692 2.1550 1.6945 0.0099 1.0169
Aug 1.1161 2.0453 1.6466 0.0101 1.0024
Sep 1.1345 2.0594 1.6532 0.0106 1.0321
Oct 1.1565 1.8781 1.5084 0.0118 1.0060
Nov 1.1777 1.8025 1.5411 0.0124 0.9852
Dec 1.2141 1.8049 1.7211 0.0135 1.1480
2009
Jan 1.2828 1.8382 1.7067 0.0142 1.0949
Feb 1.3402 1.9411 1.7469 0.0136 1.1349
Mar 1.3832 1.9909 1.8357 0.0140 1.2039
Apr 1.4042 2.0492 1.8454 0.0143 1.2344
May 1.4396 2.2064 1.9973 0.0147 1.3126
Jun 1.4725 2.4141 2.0658 0.0152 1.3446
Jul 1.4858 2.3952 2.0857 0.0154 1.3510
Aug 1.4613 2.3473 2.0775 0.0158 1.3805
Sep 1.4514 2.3298 2.1176 0.0162 1.4082
Oct 1.4416 2.3775 2.1388 0.0160 1.4254
Nov 1.4322 2.3800 2.1529 0.0167 1.4348
Dec 1.4284 2.2991 2.0484 0.0156 1.3918
2010
Jan 1.4257 2.3100 2.0058 0.0158 1.3574
Feb 1.4266 2.9135 1.9338 0.0160 1.3259
Mar 1.4168 2.1357 1.9108 0.0152 1.3347
Apr 1.4170 2.1706 1.8747 0.0151 1.3159
May 1.4206 2.0593 1.7470 0.0155 1.2274
Jun 1.4267 2.1191 1.7277 0.0161 1.3160
Jul 1.4353 2.2396 1.8526 0.0167 1.3835
Aug 1.4307 2.1950 1.8082 0.0170 1.4024
Sep 1.4269 2.2503 1.9440 0.0172 1.4648
Oct 1.4293 2.2493 1.9752 0.0178 1.4464
Nov 1.4367 2.1806 1.8896 0.0171 1.4440
Dec 1.4738 2.2709 1.9407 0.0179 1.5493
2011
Jan 1.5013 2.3571 2.0402 0.0180 1.5695
Feb 1.4937 2.4197 2.0643 0.0185 1.6263
Mar 1.5021 2.4338 2.1625 0.0183 1.6584
Apr 1.4972 2.4874 2.218 0.0186 1.7438
May 1.5018 2.4401 2.1506 0.0185 1.7703
June 1.5064 2.4166 2.1523 0.0188 1.8082
July 1.5055 2.4528 2.1547 0.0194 1.8817
Aug 1.5104 2.4757 2.1829 0.0197 1.8604
Sep 1.5224 2.4308 2.1266 0.0200 1.7005
Oct 1.5326 2.5020 2.1949 0.0198 1.7890
Nov 1.5412 2.5078 2.1851 0.2010 1.6987
Dec 1.5505 2.4946 2.1076 0.0205 1.6838
Table 25. Foreign Exchange RatesInterbank & Forex Bureaux Market (GH¢ Per Currency, End Period)
Exchange Rates in the Forex BureauxMarket
US Dollar Pound Sterling EURO2008
Jan 0.9888 1.9298 1.4164
Feb 0.9882 1.9317 1.4550
Mar 0.9898 1.9578 1.5500
Apr 1.0041 1.9725 1.5718
May 1.0141 1.9850 1.5823
Jun 1.0525 2.0491 1.6312
Jul 1.0809 2.1380 1.6905
Aug 1.1294 2.1063 1.6732
Sep 1.1562 2.0207 1.6796
Oct 1.1932 1.9673 1.5632
Nov 1.1960 1.8296 1.5382
Dec 1.2457 1.8655 1.6887
2009
Jan 1.3368 1.8573 1.7314
Feb 1.3937 1.9246 1.7612
Mar 1.4109 1.9990 1.8614
Apr 1.4368 2.0909 1.8636
May 1.4507 2.2496 1.9643
Jun 1.4807 2.3904 2.0402
Jul 1.4841 2.4118 2.0762
Aug 1.4757 2.3859 2.0805
Sep 1.4757 2.3946 2.1230
Oct 1.4614 2.3634 2.1382
Nov 1.4625 2.3805 2.1532
Dec 1.4624 2.3305 2.0810
2010
Jan 1.4546 2.3285 2.0359
Feb 1.4524 2.2678 1.9768
Mar 1.4489 2.1755 1.9691
Apr 1.4437 2.2344 1.9282
May 1.4337 2.0691 1.7732
Jun 1.4400 2.1012 1.7630
Jul 1.4505 2.2191 1.8541
Aug 1.4497 2.2314 1.8250
Sep 1.4498 2.2312 1.8791
Oct 1.4459 2.2521 1.9528
Nov 1.4530 2.2848 1.9666
Dec 1.4775 2.2683 1.9550
2011
Jan 1.5052 2.3491 2.0073
Feb 1.5141 2.3482 2.0209
Mar 1.5277 2.4341 2.1128
Apr 1.5286 2.4387 2.1319
May 1.5195 2.4396 2.1291
June 1.5173 2.4341 2.1400
July 1.5146 2.4309 2.1241
Aug 1.5235 2.4505 2.1387
Sep 1.5789 2.4691 2.1469
Oct 1.6030 2.4223 2.2112
Nov 1.6355 2.5323 2.1900
Dec 1.6596 2.5473 2.1591
Table 26. EXTERNAL DEBT STOCK BY CREDITOR CATEGORY (in millions of US$)
2008 2009 2010 2011*Q1 Q2 Q3 Q4 Q1 Q2 Q3 Q4
Total External Debt 4,035.07 5,007.88 5,362.21 5,619.90 5,998.33 6,254.55 6,828.82 7,357.72 7,345.38 7,589.45
Multilateral Creditors 2,028.31 2,461.77 2,690.40 2,786.61 2,916.19 3,057.69 3,434.13 3,854.90 3,853.46 3,891.78
Of which:
IMF 163.07 269.98 262.59 375.60 394.59 388.02 400.82 495.81 485.84 481.71
Bilateral Creditors 1,168.22 1,687.24 1,816.46 1,846.42 2,031.78 2,169.19 2,372.66 2,501.22 2,498.55 2,712.32
Of which:
Paris Club 774.95 1,138.83 1,177.20 1,111.28 1,243.51 1,363.03 1,556.86 1,646.45 1,654.90 1,830.49
Non-Paris Club 393.27 548.41 639.25 735.14 788.27 806.16 815.80 854.77 843.65 881.83
Commercial Creditors 838.54 858.87 855.35 986.87 1,050.36 1,027.67 1,022.03 1,001.60 993.37 985.35
Of which:
International Capital Market
750.00 750.00 750.00 750.00 750.00 750.00 750.00 750.00 750.00 750.00
* Provisional Estimate
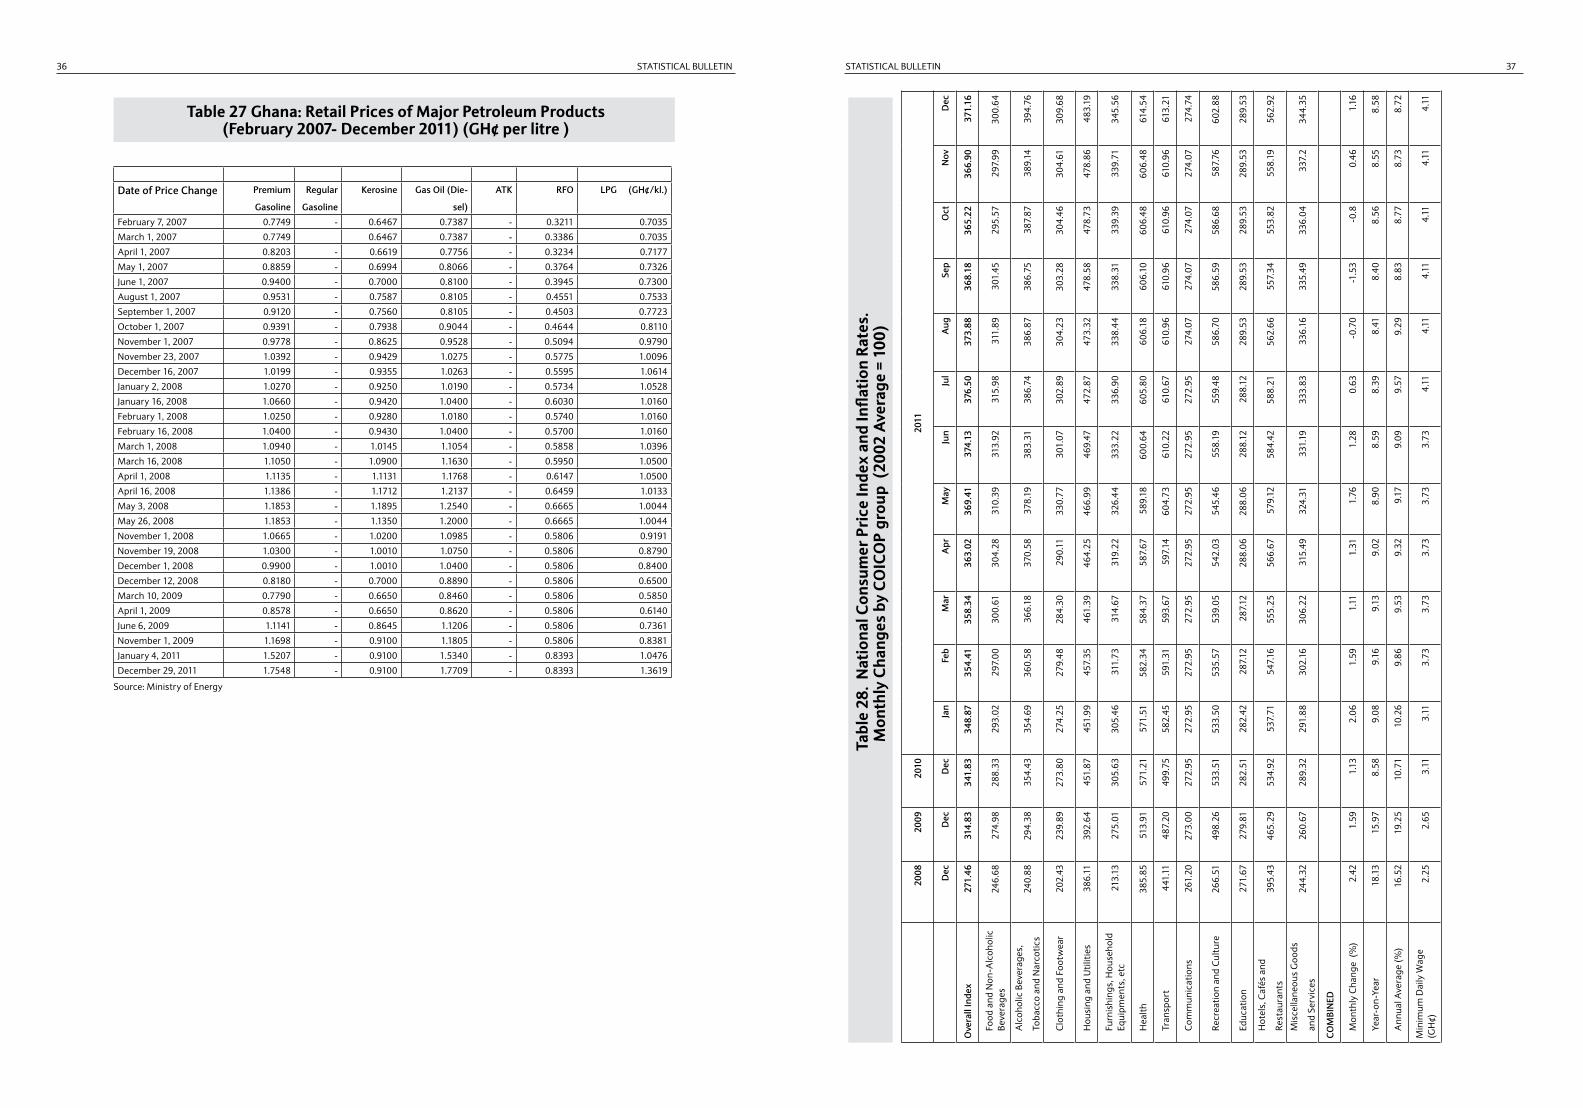
STATISTICAL BULLETIN STATISTICAL BULLETIN36 37
Table 27 Ghana: Retail Prices of Major Petroleum Products(February 2007- December 2011) (GH¢ per litre )
Date of Price Change Premium
Gasoline
Regular
Gasoline
Kerosine Gas Oil (Die-
sel)
ATK RFO LPG (GH¢/kl.)
February 7, 2007 0.7749 - 0.6467 0.7387 - 0.3211 0.7035
March 1, 2007 0.7749 0.6467 0.7387 - 0.3386 0.7035
April 1, 2007 0.8203 - 0.6619 0.7756 - 0.3234 0.7177
May 1, 2007 0.8859 - 0.6994 0.8066 - 0.3764 0.7326
June 1, 2007 0.9400 - 0.7000 0.8100 - 0.3945 0.7300
August 1, 2007 0.9531 - 0.7587 0.8105 - 0.4551 0.7533
September 1, 2007 0.9120 - 0.7560 0.8105 - 0.4503 0.7723
October 1, 2007 0.9391 - 0.7938 0.9044 - 0.4644 0.8110
November 1, 2007 0.9778 - 0.8625 0.9528 - 0.5094 0.9790
November 23, 2007 1.0392 - 0.9429 1.0275 - 0.5775 1.0096
December 16, 2007 1.0199 - 0.9355 1.0263 - 0.5595 1.0614
January 2, 2008 1.0270 - 0.9250 1.0190 - 0.5734 1.0528
January 16, 2008 1.0660 - 0.9420 1.0400 - 0.6030 1.0160
February 1, 2008 1.0250 - 0.9280 1.0180 - 0.5740 1.0160
February 16, 2008 1.0400 - 0.9430 1.0400 - 0.5700 1.0160
March 1, 2008 1.0940 - 1.0145 1.1054 - 0.5858 1.0396
March 16, 2008 1.1050 - 1.0900 1.1630 - 0.5950 1.0500
April 1, 2008 1.1135 - 1.1131 1.1768 - 0.6147 1.0500
April 16, 2008 1.1386 - 1.1712 1.2137 - 0.6459 1.0133
May 3, 2008 1.1853 - 1.1895 1.2540 - 0.6665 1.0044
May 26, 2008 1.1853 - 1.1350 1.2000 - 0.6665 1.0044
November 1, 2008 1.0665 - 1.0200 1.0985 - 0.5806 0.9191
November 19, 2008 1.0300 - 1.0010 1.0750 - 0.5806 0.8790
December 1, 2008 0.9900 - 1.0010 1.0400 - 0.5806 0.8400
December 12, 2008 0.8180 - 0.7000 0.8890 - 0.5806 0.6500
March 10, 2009 0.7790 - 0.6650 0.8460 - 0.5806 0.5850
April 1, 2009 0.8578 - 0.6650 0.8620 - 0.5806 0.6140
June 6, 2009 1.1141 - 0.8645 1.1206 - 0.5806 0.7361
November 1, 2009 1.1698 - 0.9100 1.1805 - 0.5806 0.8381
January 4, 2011 1.5207 - 0.9100 1.5340 - 0.8393 1.0476
December 29, 2011 1.7548 - 0.9100 1.7709 - 0.8393 1.3619
Source: Ministry of Energy
Tab
le 2
8. N
atio
nal C
onsu
mer
Pri
ce In
dex
and
Infla
tion
Rate
s.
Mon
thly
Cha
nges
by
CO
ICO
P gr
oup
(200
2 A
vera
ge =
100
)
2008
2009
2010
2011
Dec
Dec
Dec
Jan
Feb
Mar
Apr
May
Jun
Jul
Aug
Sep
Oct
Nov
Dec
Ove
rall
Inde
x27
1.46
314.
8334
1.83
348.
8735
4.41
358.
3436
3.02
369.
4137
4.13
376.
5037
3.88
368.
1836
5.22
366.
9037
1.16
Food
and
Non
-Alc
ohol
ic
Beve
rage
s24
6.68
274.
9828
8.33
293.
0229
7.00
300.
6130
4.28
310.
3931
3.92
315.
9831
1.89
301.
4529
5.57
297.
9930
0.64
Alc
ohol
ic B
ever
ages
,
Toba
cco
and
Nar
cotic
s24
0.88
294.
3835
4.43
354.
6936
0.58
366.
1837
0.58
378.
1938
3.31
386.
7438
6.87
386.
7538
7.87
389.
1439
4.76
Clo
thin
g an
d Fo
otw
ear
202.
4323
9.89
273.
8027
4.25
279.
4828
4.30
290.
1133
0.77
301.
0730
2.89
304.
2330
3.28
304.
4630
4.61
309.
68
Hou
sing
and
Util
ities
386.
1139
2.64
451.
8745
1.99
457.
3546
1.39
464.
2546
6.99
469.
4747
2.87
473.
3247
8.58
478.
7347
8.86
483.
19
Furn
ishi
ngs,
Hou
seho
ld
Equi
pmen
ts, e
tc21
3.13
275.
0130
5.63
305.
4631
1.73
314.
6731
9.22
326.
4433
3.22
336.
9033
8.44
338.
3133
9.39
339.
7134
5.56
Hea
lth
385.
8551
3.91
571.
2157
1.51
582.
3458
4.37
587.
6758
9.18
600.
6460
5.80
606.
1860
6.10
606.
4860
6.48
614.
54
Tran
spor
t 44
1.11
487.
2049
9.75
582.
4559
1.31
593.
6759
7.14
604.
7361
0.22
610.
6761
0.96
610.
9661
0.96
610.
9661
3.21
Com
mun
icat
ions
261.
2027
3.00
272.
9527
2.95
272.
9527
2.95
272.
9527
2.95
272.
9527
2.95
274.
0727
4.07
274.
0727
4.07
274.
74
Recr
eatio
n an
d C
ultu
re
266.
5149
8.26
533.
5153
3.50
535.
5753
9.05
542.
0354
5.46
558.
1955
9.48
586.
7058
6.59
586.
6858
7.76
602.
88
Educ
atio
n27
1.67
279.
8128
2.51
282.
4228
7.12
287.
1228
8.06
288.
0628
8.12
288.
1228
9.53
289.
5328
9.53
289.
5328
9.53
Hot
els,
Caf
és a
nd
Rest
aura
nts
395.
4346
5.29
534.
9253
7.71
547.
1655
5.25
566.
6757
9.12
584.
4258
8.21
562.
6655
7.34
553.
8255
8.19
562.
92
Mis
cella
neou
s G
oods
and
Serv
ices
244.
3226
0.67
289.
3229
1.88
302.
1630
6.22
315.
4932
4.31
331.
1933
3.83
336.
1633
5.49
336.
0433
7.2
344.
35
CO
MBI
NED
Mon
thly
Cha
nge
(%)
2.42
1.59
1.13
2.06
1.59
1.11
1.31
1.76
1.28
0.63
-0.7
0-1
.53
-0.8
0.46
1.16
Year
-on-
Year
18.1
315
.97
8.58
9.08
9.16
9.13
9.02
8.90
8.59
8.39
8.41
8.40
8.56
8.55
8.58
Ann
ual A
vera
ge (%
)16
.52
19.2
510
.71
10.2
69.
869.
539.
329.
179.
099.
579.
298.
838.
778.
738.
72
Min
imum
Dai
ly W
age
(GH
¢)2.
252.
653.
113.
113.
733.
733.
733.
733.
734.
114.
114.
114.
114.
114.
11
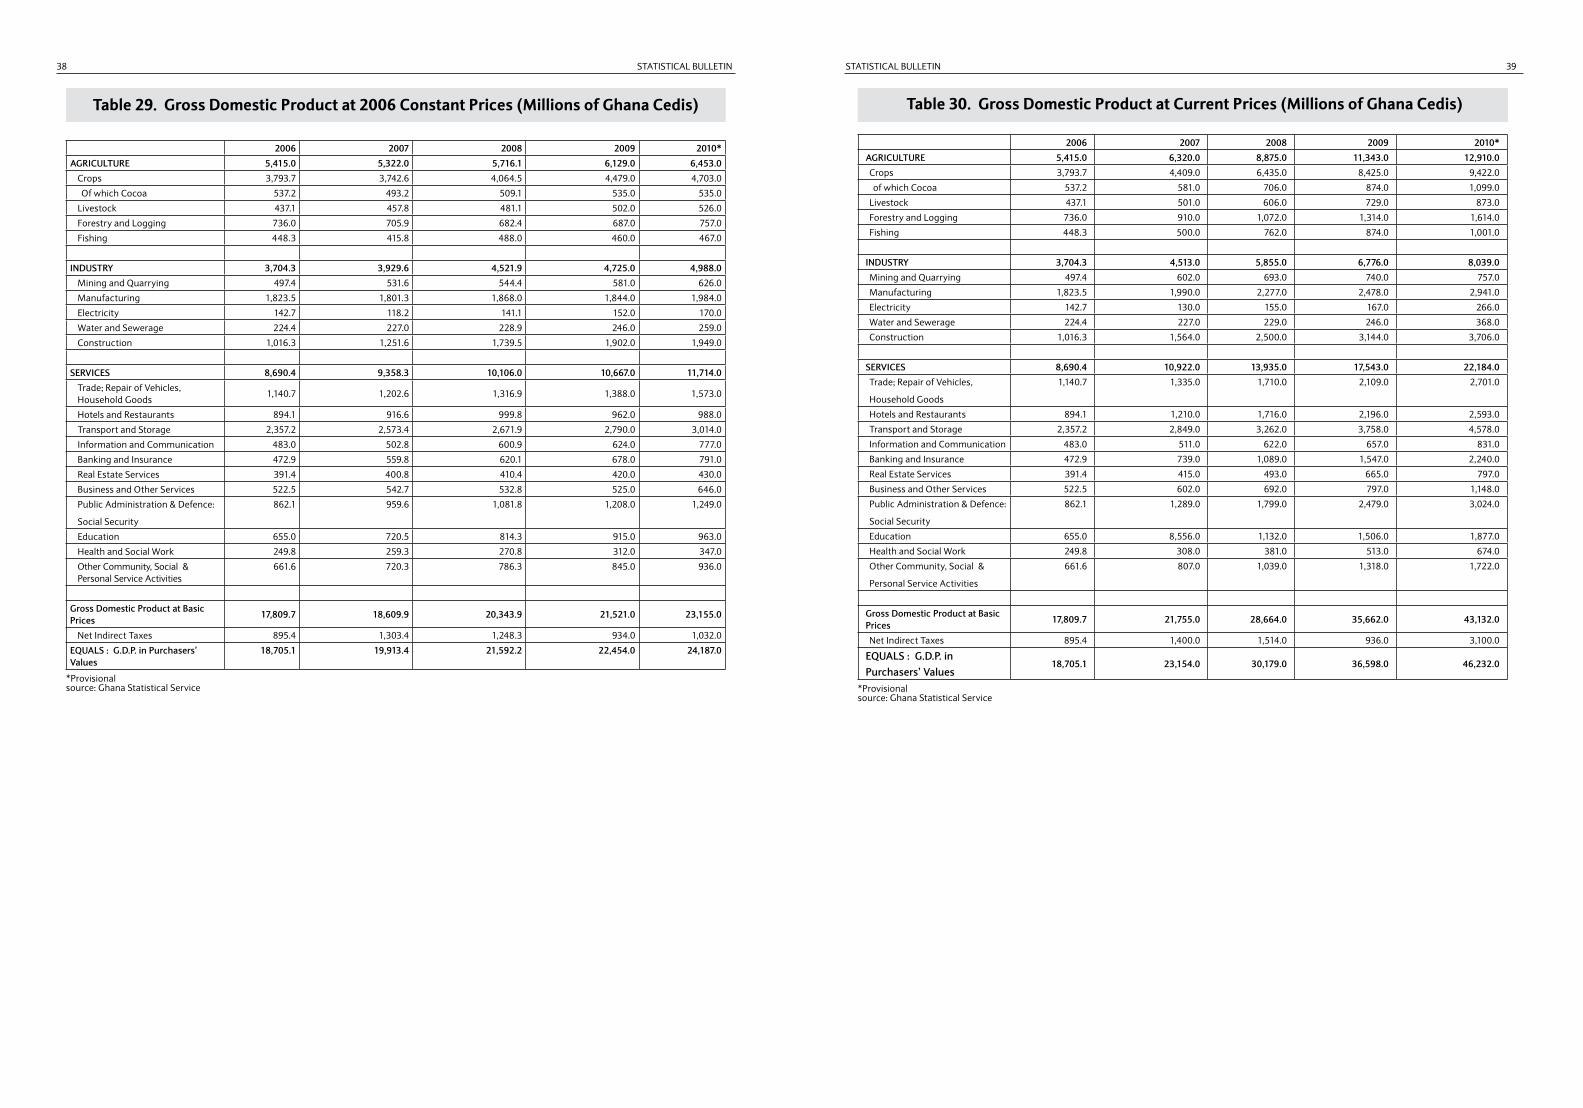
STATISTICAL BULLETIN STATISTICAL BULLETIN38 39
Table 29. Gross Domestic Product at 2006 Constant Prices (Millions of Ghana Cedis)
2006 2007 2008 2009 2010*
AGRICULTURE 5,415.0 5,322.0 5,716.1 6,129.0 6,453.0
Crops 3,793.7 3,742.6 4,064.5 4,479.0 4,703.0
Of which Cocoa 537.2 493.2 509.1 535.0 535.0
Livestock 437.1 457.8 481.1 502.0 526.0
Forestry and Logging 736.0 705.9 682.4 687.0 757.0
Fishing 448.3 415.8 488.0 460.0 467.0
INDUSTRY 3,704.3 3,929.6 4,521.9 4,725.0 4,988.0
Mining and Quarrying 497.4 531.6 544.4 581.0 626.0
Manufacturing 1,823.5 1,801.3 1,868.0 1,844.0 1,984.0
Electricity 142.7 118.2 141.1 152.0 170.0
Water and Sewerage 224.4 227.0 228.9 246.0 259.0
Construction 1,016.3 1,251.6 1,739.5 1,902.0 1,949.0
SERVICES 8,690.4 9,358.3 10,106.0 10,667.0 11,714.0
Trade; Repair of Vehicles, Household Goods
1,140.7 1,202.6 1,316.9 1,388.0 1,573.0
Hotels and Restaurants 894.1 916.6 999.8 962.0 988.0
Transport and Storage 2,357.2 2,573.4 2,671.9 2,790.0 3,014.0
Information and Communication 483.0 502.8 600.9 624.0 777.0
Banking and Insurance 472.9 559.8 620.1 678.0 791.0
Real Estate Services 391.4 400.8 410.4 420.0 430.0
Business and Other Services 522.5 542.7 532.8 525.0 646.0
Public Administration & Defence:
Social Security
862.1 959.6 1,081.8 1,208.0 1,249.0
Education 655.0 720.5 814.3 915.0 963.0
Health and Social Work 249.8 259.3 270.8 312.0 347.0
Other Community, Social & Personal Service Activities
661.6 720.3 786.3 845.0 936.0
Gross Domestic Product at Basic Prices
17,809.7 18,609.9 20,343.9 21,521.0 23,155.0
Net Indirect Taxes 895.4 1,303.4 1,248.3 934.0 1,032.0
EQUALS : G.D.P. in Purchasers’ Values
18,705.1 19,913.4 21,592.2 22,454.0 24,187.0
*Provisional source: Ghana Statistical Service
Table 30. Gross Domestic Product at Current Prices (Millions of Ghana Cedis)
2006 2007 2008 2009 2010*
AGRICULTURE 5,415.0 6,320.0 8,875.0 11,343.0 12,910.0
Crops 3,793.7 4,409.0 6,435.0 8,425.0 9,422.0
of which Cocoa 537.2 581.0 706.0 874.0 1,099.0
Livestock 437.1 501.0 606.0 729.0 873.0
Forestry and Logging 736.0 910.0 1,072.0 1,314.0 1,614.0
Fishing 448.3 500.0 762.0 874.0 1,001.0
INDUSTRY 3,704.3 4,513.0 5,855.0 6,776.0 8,039.0
Mining and Quarrying 497.4 602.0 693.0 740.0 757.0
Manufacturing 1,823.5 1,990.0 2,277.0 2,478.0 2,941.0
Electricity 142.7 130.0 155.0 167.0 266.0
Water and Sewerage 224.4 227.0 229.0 246.0 368.0
Construction 1,016.3 1,564.0 2,500.0 3,144.0 3,706.0
SERVICES 8,690.4 10,922.0 13,935.0 17,543.0 22,184.0
Trade; Repair of Vehicles,
Household Goods
1,140.7 1,335.0 1,710.0 2,109.0 2,701.0
Hotels and Restaurants 894.1 1,210.0 1,716.0 2,196.0 2,593.0
Transport and Storage 2,357.2 2,849.0 3,262.0 3,758.0 4,578.0
Information and Communication 483.0 511.0 622.0 657.0 831.0
Banking and Insurance 472.9 739.0 1,089.0 1,547.0 2,240.0
Real Estate Services 391.4 415.0 493.0 665.0 797.0
Business and Other Services 522.5 602.0 692.0 797.0 1,148.0
Public Administration & Defence:
Social Security
862.1 1,289.0 1,799.0 2,479.0 3,024.0
Education 655.0 8,556.0 1,132.0 1,506.0 1,877.0
Health and Social Work 249.8 308.0 381.0 513.0 674.0
Other Community, Social &
Personal Service Activities
661.6 807.0 1,039.0 1,318.0 1,722.0
Gross Domestic Product at Basic Prices
17,809.7 21,755.0 28,664.0 35,662.0 43,132.0
Net Indirect Taxes 895.4 1,400.0 1,514.0 936.0 3,100.0
EQUALS : G.D.P. in Purchasers’ Values
18,705.1 23,154.0 30,179.0 36,598.0 46,232.0
*Provisionalsource: Ghana Statistical Service
STATISTICAL BULLETIN STATISTICAL BULLETIN40 41