Embed Size (px)
Citation preview
Washington University in St. Louis Washington University in St. Louis
Washington University Open Scholarship Washington University Open Scholarship
Doctor of Business Administration Dissertations Olin Business School
Spring 5-2021
Banks vs Shadow Banks: Evidence from the 2015 FHA Mortgage Banks vs Shadow Banks: Evidence from the 2015 FHA Mortgage
Insurance Premium Cut Insurance Premium Cut
Pornteera Tungtrakul Jefferson Washington University in St. Louis
Follow this and additional works at: https://openscholarship.wustl.edu/dba
Part of the Business Administration, Management, and Operations Commons, and the Corporate
Finance Commons
Recommended Citation Recommended Citation Jefferson, Pornteera Tungtrakul, "Banks vs Shadow Banks: Evidence from the 2015 FHA Mortgage Insurance Premium Cut" (2021). Doctor of Business Administration Dissertations. 11. https://openscholarship.wustl.edu/dba/11
This Dissertation is brought to you for free and open access by the Olin Business School at Washington University Open Scholarship. It has been accepted for inclusion in Doctor of Business Administration Dissertations by an authorized administrator of Washington University Open Scholarship. For more information, please contact [email protected].
1
Banks vs Shadow Banks: Evidence from
the 2015 FHA Mortgage Insurance Premium Cut
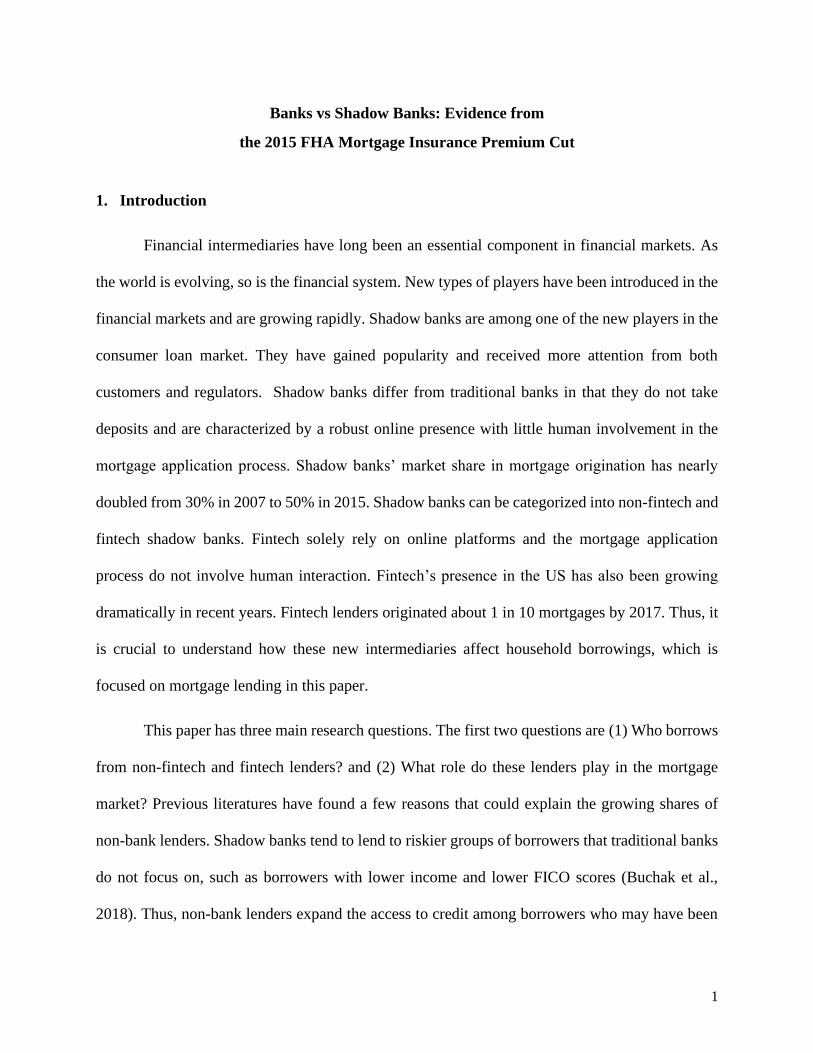
1. Introduction
Financial intermediaries have long been an essential component in financial markets. As
the world is evolving, so is the financial system. New types of players have been introduced in the
financial markets and are growing rapidly. Shadow banks are among one of the new players in the
consumer loan market. They have gained popularity and received more attention from both
customers and regulators. Shadow banks differ from traditional banks in that they do not take
deposits and are characterized by a robust online presence with little human involvement in the
mortgage application process. Shadow banks’ market share in mortgage origination has nearly
doubled from 30% in 2007 to 50% in 2015. Shadow banks can be categorized into non-fintech and
fintech shadow banks. Fintech solely rely on online platforms and the mortgage application
process do not involve human interaction. Fintech’s presence in the US has also been growing
dramatically in recent years. Fintech lenders originated about 1 in 10 mortgages by 2017. Thus, it
is crucial to understand how these new intermediaries affect household borrowings, which is
focused on mortgage lending in this paper.
This paper has three main research questions. The first two questions are (1) Who borrows
from non-fintech and fintech lenders? and (2) What role do these lenders play in the mortgage
market? Previous literatures have found a few reasons that could explain the growing shares of
non-bank lenders. Shadow banks tend to lend to riskier groups of borrowers that traditional banks
do not focus on, such as borrowers with lower income and lower FICO scores (Buchak et al.,
2018). Thus, non-bank lenders expand the access to credit among borrowers who may have been
2
previous constrained. Lastly, (3) How have non-bank lenders been able to take market share from
traditional bank lenders? Previous papers have found that lower regulatory cost, greater efficiency,
and convenience due to technology are factors that help non-bank lenders take away market share
from traditional banks. However, there’s no research that further studies which two types of
shadow banks, non-fintech or fintech, take away the market. The paper also discusses how non-
fintech and fintech are able to increase their lending and increasing the market share.
This paper uses the 2015 surprise cut in mortgage insurance premium in the FHA loan
market to shed light on these research questions. In January 2015, the Obama administration made
a surprise announcement that the Federal Housing Administration (FHA) would be reducing its
annual mortgage insurance premiums (MIP) from 135 basis points to 85 basis points for typical
FHA loans. Among the federal guarantee programs, the FHA traditionally has focused the most
on lower-income borrowers with relatively weak credit profiles (Davis et al., 2017). Lenders often
require applicants with low down-payments to pay for mortgage insurance, which guarantees the
mortgages. In 2014, the FHA insured about one-fifth of all home purchase loans originated in the
US. The annual premium rates are generally the same for all borrowers regardless of credit score.
The annual premium is assessed as a fixed percentage of the expected average loan balance in the
coming year and is added to borrowers’ monthly interest and principal payments. Thus, MIP
mimics an interest rate risk premium (Bhutta and Ringo, 2019). The cut in an annual mortgage
insurance premium by 50 basis points essentially represented a direct drop in borrowers’ credit
cost.
Several papers studied the impact of the premium cut. Davis et al. (2017) study only
focused on first-time buyers and data across 12 states. The results showed that the FHA premium
cut entice a statistically significant 2.8 percentage-point increase in the constant-quality price of
3
homes purchased by FHA borrowers relative to GSE borrowers, but no substantial change in the
quality of homes purchased. On the other hand, Bhutta and Ringo (2019) measured the effect of
MIP cut on all home purchases and focused mainly on increasing the number of home purchase
loans enduced by premium cuts. They used a regression discontinuity design and found that a
reduction in FHA’s annual mortgage insurance premium led to an almost immediate jump in home
buying by FHA-likely borrowers of about 14 percent. The reduced premiums led to more home
purchase loans by improving applicants’ DTI ratios, thus easing underwriting constraints.
There is a study of supply shock on bank and non-bank lenders by Buchak et al. (2020),
which explored the consequences of several policy changes on banks and shadow banks. They
found that increasing capital requirement leads to banks' lending contraction. Shadow banks
stepped into the market and provided some loans to fill in the lending gap since they are not
subjected to this regulation. However, I used the demand shock experiment, MIP cut, because of
the following reasons: first, the MIP cut represents a shock to mortgage demand, which allowed
me to examine how banks, shadow banks, and fintech compete to capture new loan demand. A
study by Fuster et al. (2018) examined specifically how banks and shadow banks respond to
demand shocks. They did not find any differential response for fintech in loan originations in
response to demand shocks. However, they relied on time-series variation in aggregate loan
applications to measure demand shocks, which they argued is not ideal for answering this
question1. By focusing in on the FHA MIP cut and using detailed loan-level data, my paper helps
better identify the relative response to a demand shock. However, this applies to just FHA segment
of the mortgage market.
1 They mentioned in the paper that “it is quite difficult to establish lender-type specific effects given the strong and
nonlinear upward trend in the FinTech lender market share during this period”
4
Second, this experiment focuses on the FHA market, which is a segment of borrowers that
may have difficulty accessing finance due to lower credit score. A previous study suggests that
the FHA market is a segment where shadow banks have especially gained market share (Buchak
et al., 2018). This paper can shed more light on the role of shadow banks and fintech in serving
this segment of borrowers by focusing not just on average shares but on the response to a demand
shock.
According to summary statistics, my paper finds that during the period following the MIP
cut, the number of FHA loans issued by shadow banks increased dramatically while the number
of banks loans issuance decreased relative to shadow banks. These new loans that shadow banks
gain are loans that banks could have lent out to and new loans that are issued in the market. Average
loan size increased for both banks and shadow banks, but the magnitude is much bigger for shadow
banks. The average interest rate decreased. This could suggest that borrowers use the opportunity
of lower MIP to refinance their loans and thus benefited the lower interest rates or it could be the
strategic competition among lenders that drive changes in loan interest rates. Mean credit score
and mean debt-to-expense ratio stay roughly the same for all type of lenders, implying that
borrowers’ characteristics are unchanged in post-period.
I use triple differences methods to study the rise of shadow banks, an MIP cut experiment.
Empirical results show that FHA loan volume increased significantly after the MIP cut. This result
is in line with the premium cut policy which aims to increase lending. Considering the effects on
each lender type, banks’ loan volume is $4,580 less relative to non-banks for FHA loans in the
post-period. The finding is consistent with a paper by Buchak et al. (2018), suggesting that shadow
banks are much more active in FHA market. Comparing within non-bank lenders, both non-fintech
and fintech FHA loan volume increased in post-period, but the magnitude of $3,290 is slightly
5
smaller for fintech loans, comparing to $4,940 of non-fintech loans. This could be explained by
Gulamhuseiwala et al. (2015)’s paper which suggests that fintech borrowers tend to be high-
income and high-value. Thus, they are less elastic to the decrease in the premium cut.
Next, I explore the role that shadow banks play in the mortgage market, in particular
whether they expand access to credit to borrowers who may have been previously constrained. By
re-arranging data by its loan type, lender type, and quarter, the regression results can explain the
variation in the pool of borrowers for each lender type and are found to be directionally consistent
with my hypothesis that shadow banks increase their lending through issuing higher number of
loans and issuing larger loan size while banks decrease their lending because their target groups
are not FHA loans. However, I find that the results are not statistically significant.
Results show that fintech’s total FHA loan volume is substantially higher by $402 million,
while banks’ total FHA loan volume is significantly lower by around $120 million in post-period.
This suggests that non-bank lenders, especially fintech, issued loans to capture much of the new
demand and captured some additional market share from banks. Another test using number of
loans as a dependent variable also suggests that shadow banks took away borrowers from banks
since banks issued on average 120 fewer FHA loans per bank while the typical shadow bank issued
over 120 more FHA loans in post-period. Comparing across all lender types, fintech issued more
than 1,900 loans more, while non-fintech shadow banks only increased their loan issuance by
around 515 loans. The results affirm that shadow banks take away demand from traditional banks.
Both non-fintech and fintech shadow banks may be able to do so because of lower regulatory
burden. Fintech significantly increases their lending higher than non-fintech is most likely a result
from greater efficiency and convenience due to technology arbitrage.
6
Next, I explore how the MIP cut affects loans’ interest rates. Changes in interest rate after
the MIP cut can be explained by (1) the strategic competition among lenders, (2) the relative
efficiency of processing loans, and (3) the pass-through of the MIP discount to the borrowers. A
paper by Bhutta and Ringo (2019) tested for a discontinuity in interest rate around the 2015 MIP
cut and found that there’s a full pass through of the MIP reduction to borrowers2.
I found that FHA loans’ interest rates are roughly 3 basis points higher in post-period.
Comparing interest rates across all lender type, banks’ FHA loans interest rates are higher by 11
basis points in post-period. The cut in mortgage premium makes the loans become less expensive,
so that lenders levied to raise prices. Thus, the increase in interest rate could be the pricing response
of the bank that they value profitability over market share. In contrast, non-fintech and fintech’s
FHA interest rates in post-period are 11.5 and 8.5 basis points lower, respectively. These results
suggest that there’s more than 100% pass-through of the MIP cut to non-fintech and fintech
borrowers. Borrowers paid less for both the MIP and the interest rate, reaping the full benefit of
the MIP cut and the lower interest rate.
Lastly, I study the riskiness of the loans by looking at the default rates and interest rates of
the loans using triple differences method. First, I investigated loan performance using Ginnie Mae
mortgage-backed securities portfolio data and found that FHA loans that were issued by bank
during the year after the MIP cut are 0.21 percentage points less likely to default than shadow bank
loans. The effect is mostly driven by fintech shadow bank lenders whose borrowers default at
about 0.3 percentage points higher than banks for loans that were issued in post-period. Thus,
fintech borrowers are considered as riskiest relative to other borrowers. The results for non-fintech
loans indicate that non-fintech borrowers have lower default rates than traditional bank borrowers.
2 The paper does not include the cross-sectional data with lender types like paper does.
7
Non-fintech are able to take away demand from banks while still able to screen relatively safer
borrower than fintech’s. This could be a result from using human involvement in screening
borrowers, allowing them to evaluate applicants’ characters that fintech’s algorithm might not be
able to.
In contrast to previous studies, my paper includes all home purchases in the sample and is
the first to study the impact of FHA MIP cut on each bank type. This study is relevant and
informative since it examines shadow banks, whose rise has attracted a great deal of attention. My
experiment is related to prior literature by Buchak et al. (2018) which explores why shadow banks
and fintech have grown so much since the financial crisis. They focus on shocks to the US
regulation following the 2008 financial crisis, whereas my paper focuses on shocks to the
borrowing cost in the FHA segment. Buchak’s focuses on shocks on the supply side of the lending,
which is banks’ ability to lend. On the other hand, my paper focuses on shocks on the demand
side, borrowers’ ability and willingness to take loans. However, Buchak’s paper only tests
regulatory shock between banks and shadow banks, not within the shadow banks group. There is
no study on whether the rise in shadow banks is from non-fintech or fintech lenders, as presented
in my paper. Their conclusion suggests that banks were not exiting lending, but shadow banks
were expanding into the market. My paper found similar results that shadow banks expand into
the market and banks increased their lending by less than they did for shadow banks or fintech so
there was a relative decrease in FHA loans for banks, which is also a decrease in market share.
2. Literature Review
My paper contributes to a growing literature examining shadow bank lending. Many have
studied the difference between banks and shadow banks in mortgage lending. Buchak et al. (2018)
8
used HMDA, Fannie Mae, and Freddie Mac to show that lower-income borrowers and racial
minorities are more likely to be shadow bank borrowers. Borrowers with lower FICO scores,
greater debt to income ratios, and lower LTV are more likely to be shadow banks borrowers.
However, first-time borrowers were significantly less likely to be shadow banks borrowers
Besides, they found that shadow banks are much more active in the FHA market, but FSA/RHS
loans are more likely to be originated by traditional banks. This might be because loans having
FHA and VA guarantee may be a proxy for borrowers' creditworthiness, and shadow banks may
focus on less creditworthy borrowers.
There are a few studies that examine specifically how banks and shadow banks respond to
supply shocks. Buchak et al. (2020) studied the consequences of several policy changes. They
found that increasing capital requirement leads to banks' lending contraction even though banks
can adjust their balance sheet retention margin by keeping fewer originated loans on the balance
sheet. However, shadow banks stepped into the market and provided some loans to fill in the
lending gap since they are not subjected to this regulation. They also shared somewhat similar
results to our findings in terms of financing cost and mortgage origination. They found that a 25-
basis points decrease in GSE rates led to a nearly one-to-one decrease in conforming loan rates
and new mortgage origination. However, an increase in GSE financing costs lead to a much larger
contraction of aggregate lending volume, because it directly affects both banks and shadow banks'
lending activity. A study by Fuster et al. (2018) focused on just the shadow banks and found that
fintech lenders are about half as sensitive to agreement application volume as other lenders when
there are shocks to mortgage demand.
There are mixed findings in previous studies regarding the pricing of banks and shadow
banks. A study by Buchak et al. (2018) on GSE mortgages found that non-fintech lenders charge
9
rates that are 3 basis points lower than those of traditional banks, suggesting that consumers
perceive some product differentiation. However, fintech shadow banks offered significantly higher
interest rates by 13 basis points more than traditional banks. Moreover, fintech borrowers with the
highest credit ratings paid an even greater premium for fintech loans for the convenience of the
online platform that fintech lenders offer. This result is in line with the study from Navaretti et al.
(2018) suggesting that fintech lenders charged lower margins for least creditworthy borrowers and
higher for the most creditworthy borrowers. Thus, they concluded that the growth of fintech market
share is explained by consumer tastes rather than by passing lower cost onto borrowers.
In contrast with Buchak’s study, Fuster et al. (2018) exploited Ginnie Mae data and showed
that interest rate is 2.3 basis points lower for fintech lenders. This might be because lower-income
borrowers are more price sensitive and less willing to pay a premium. Moreover, interest-rate
discrimination was documented, according to Bartlett et al. (2018). African-American and Latin
borrowers paid more for their mortgages. They found that fintech lenders do remove some face-
to-face biases since they discriminate 40% less on average. However, the algorithm lending alone
is not sufficient to eliminate discrimination in loan pricing.
Besides papers that studied each type of bank, several papers studied the impact of the
premium cut. Davis et al. (2017) study only focused on first-time buyers and data across 12 states.
They examined the effects of FHA surprise cut to its MIP on housing demand using ATTOM data
and the difference-in-difference method. The results showed that the FHA premium cut induced a
statistically significant 2.8 percentage point increase in the constant-quality price of homes
purchased by FHA borrowers relative to GSE borrowers, but no substantial change in the quality
of homes purchased.
10
On the other hand, Bhutta and Ringo (2019) measured the effect of MIP cut on all home
purchases and focused mainly on increasing the number of home purchase loans induced by
premium cuts. They used a regression discontinuity design and found that a reduction in FHA’s
annual mortgage insurance premium led to an almost immediate jump in home buying by FHA-
likely borrowers of about 14 percent. The reduced premiums led to more home purchase loans by
improving applicants’ DTI ratios, thus easing underwriting constraints. Since the FHA targets a
borrower population that may be relatively constrained, cuts to FHA premiums may be more
efficient at increasing home buying than cuts to interest rates in general. Thus, policies that
influence mortgage credit cost could significantly stimulate home buying in the broader population
through the DTI channel that the paper identifies.
3. Background and Research Motivation
3.1. The FHA markets
Among the federal guarantee programs, the FHA traditionally has focused the most on
lower-income borrowers with relatively weak credit profiles (Davis et al., 2017). Lenders often
require applicants with low down-payments to pay for mortgage insurance, which guarantees the
mortgages. The annual premium rates are generally the same for all borrowers regardless of credit
score. The annual premium is assessed as a fixed percentage of the expected average loan balance
in the coming year and is added to borrowers’ monthly interest and principal payments. Note that
the interest rate on an FHA-insured loan is negotiated between the borrower and lender.
FHA insurance protects the lender, rather than the borrower, in the event of borrower
default. A borrower who defaults on an FHA-insured mortgage will still experience the
consequences of foreclosure. To be eligible for FHA insurance, the mortgage must be originated
11
by a lender that has been approved by FHA, and the mortgage and the borrower must meet certain
criteria. FHA has required a minimum credit score of 500. Applicant’s prospective mortgage
payment should not exceed 31% of gross effective monthly income. FHA-insured loans have
lower down payment requirements, at least 3.5% cash contribution, than most conventional
mortgages. This makes FHA-insured mortgages attractive to first-time, lower- or moderate-income
homebuyers and borrowers with weak credit histories. There is no income limit for borrowers
seeking FHA-insured loans. However, FHA-insured mortgages cannot exceed a maximum
mortgage amount set by law which vary by area.
An FHA-insured mortgage is considered to be in default once the borrower is 30 days late
in making a payment. When an FHA-insured mortgage goes to foreclosure, the lender files a claim
with FHA for the remaining amount owed on the mortgage. In general, mortgage servicers may
initiate foreclosure on an FHA-insured loan when three monthly installments are due and unpaid,
and they must initiate foreclosure when six monthly installments are due and unpaid
FHA’s single-family mortgage insurance program is funded through FHA’s Mutual
Mortgage Insurance Fund (MMI Fund). Cash flows into the MMI Fund primarily from insurance
premiums and proceeds from the sale of foreclosures homes. Cash flows out of the MMI Fund
primarily to pay claims to lenders for mortgages that have defaulted.
3.2. 2015 FHA Mortgage Insurance Premium Cut
In this section, I discuss the motivation for using the FHA MIP cut as a demand shock for
this experiment. I argue that the MIP cut timing was not correlated with demand for shadow banks
loans, and the premium cut was not in anticipation of an increase non-bank lending.
The January 2015 premium cut came after previous several increases in FHA’s premiums.
Prior to 2010, the annual MIP was essentially flat for at least a decade. FHA began raising
12
premiums to help rebuild reserves more quickly after the FHA suffered sizeable losses on the 2008
loans (Avery et al. 2010; HUD 2012). According to the FHA, the MIP cut was projected to spur
250,000 new first-time homebuyers to get FHA loans over the next three years. The secretary of
HUD stated that the MIP cut by the Obama Administration will save the average borrower $900
annually and this is one of their efforts to reduce risks in the mortgage market and to protect
consumers. He also noted that even though the MIP has been lowered, the underwriting standards
would not be relaxed, buyers must still demonstrate their ability to qualify for a mortgage. Thus,
it was a purely political strategy by the government to reduce the MIP aiming to increase FHA
lending. The shock was not intended to favor the banking sector or particularly to increase shadow
banks’ lending.
Moreover, a paper by Bhutta and Ringo (2017) indicates that the announcement of the MIP
cut on January 7th appears to have been a real surprise because FHA’s reserves were still below
target levels at that time. In 2014, there were a couple documentations by the FHA suggesting that
it’s not the right time to do a rollback of the premiums yet. In November 2014, the FHA stated that
its capital ratio of 0.41% was below the congressionally mandated 2% target. A Housing Wire
article in December 2014 mentioned that changes in the FHA MIP were unlikely in 2015. Overall,
Bhutta and Ringo concluded that they did not find any news article or blog indicating any
expectation among real estate and mortgage industry participants for an FHA premium cut before
the announcement. Thus, I can assume that the insurance premium cut is an exogenous shock.
13
4. Data and Summary Statistics
4.1. Data and Sample Construction
I use data accumulated from Ginnie Mae’s single-family loan-level monthly record from
September 20133 to December 2015. The Ginnie Mae MBS (mortgage-backed securities) data
included a wide set of loan and borrower characteristics. This allowed me to investigate whether
shadow banks target specific type of borrowers based on their riskiness and whether differences
in loan volume and interest rates can be explained by difference in observable characteristics. To
create a sample, I only selected loans which are issued by top 100 lenders in each particular quarter.
After this first step, there were 3.5 million loans which represent more than 94% of the loans in
the total population. Next, I included only loans with purchasing and refinancing purposes in the
sample and excluded loans that have missing values. After cleaning data and excluding
observations that have missing data, I ended up with a sample of over 2.7 million loans, which is
around 68% of total population.
It is important to note that the Ginnie Mae data only includes the identity of the MBS issuer,
not the mortgage originator. Thus, I cannot fully identify which loans come from particular type
of lender. Fuster et al. (2018) compared the Ginnie Mae MBS data with HMDA (the Home
Mortgage Disclosure Act) and suggested that the issuer and originator are typically the same and
mismeasurements is only concentrated among small fintech lenders. However, this concern can be
omitted since my sample focus on top biggest 100 issuers in each quarter. It is unlikely that small
lenders are included in the sample. Thus, I refer to these issuers as loan originator or lenders in
this paper for simplicity.
3 Ginnie Mae data became first available in September 2013.
14
Loans’ and borrowers’ characteristics included in the sample are loan amount, interest
rates, agency type, issuer ID, credit score, total debt-to-expense ratio, first-time borrower indicator,
and state. With the agency type variable4, I can separate loans into FHA and non-FHA loans.
Identity of loan issuers can then be identified by matching the issuer ID with issuer names in Ginnie
Mae active issuer list. Then I manually classify each lender into bank, non-fintech, and fintech.
The lender is classified as “bank” if it has deposit or if it’s a subsidiary of a bank. For the rest of
shadow banks, I classify them as “non-fintech” if the online mortgage application process involves
human loan officer. Otherwise, the loan is categorized as “fintech”.
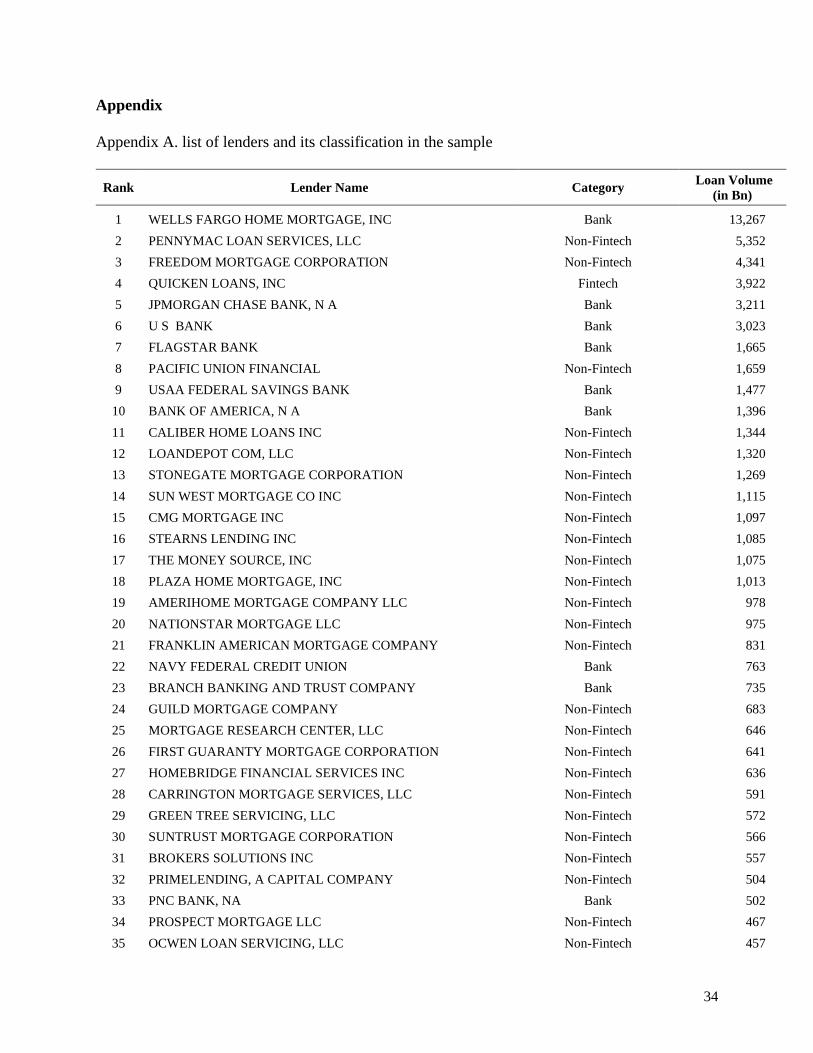
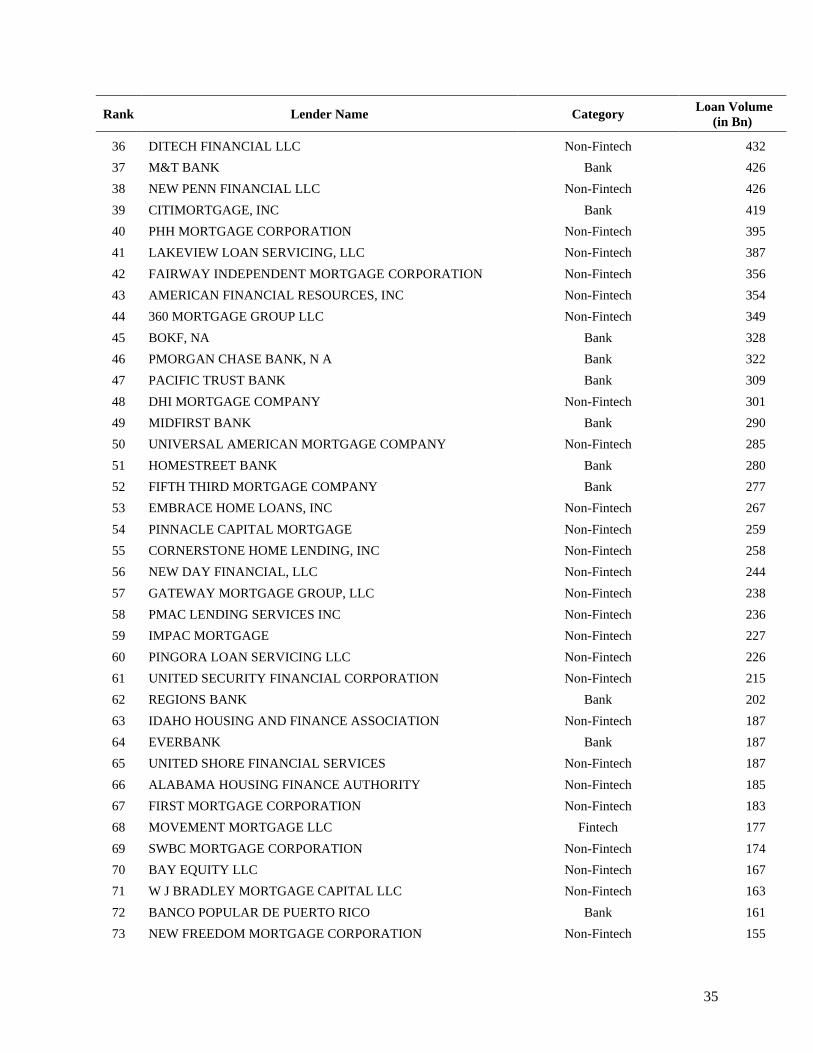
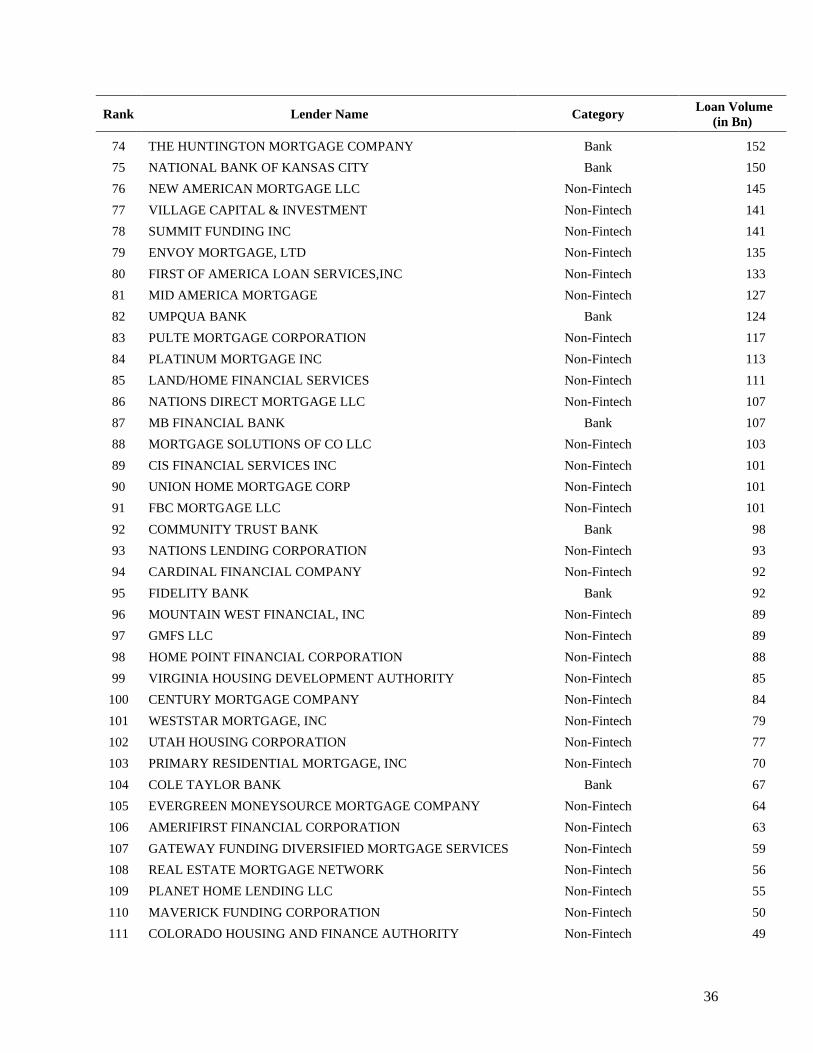
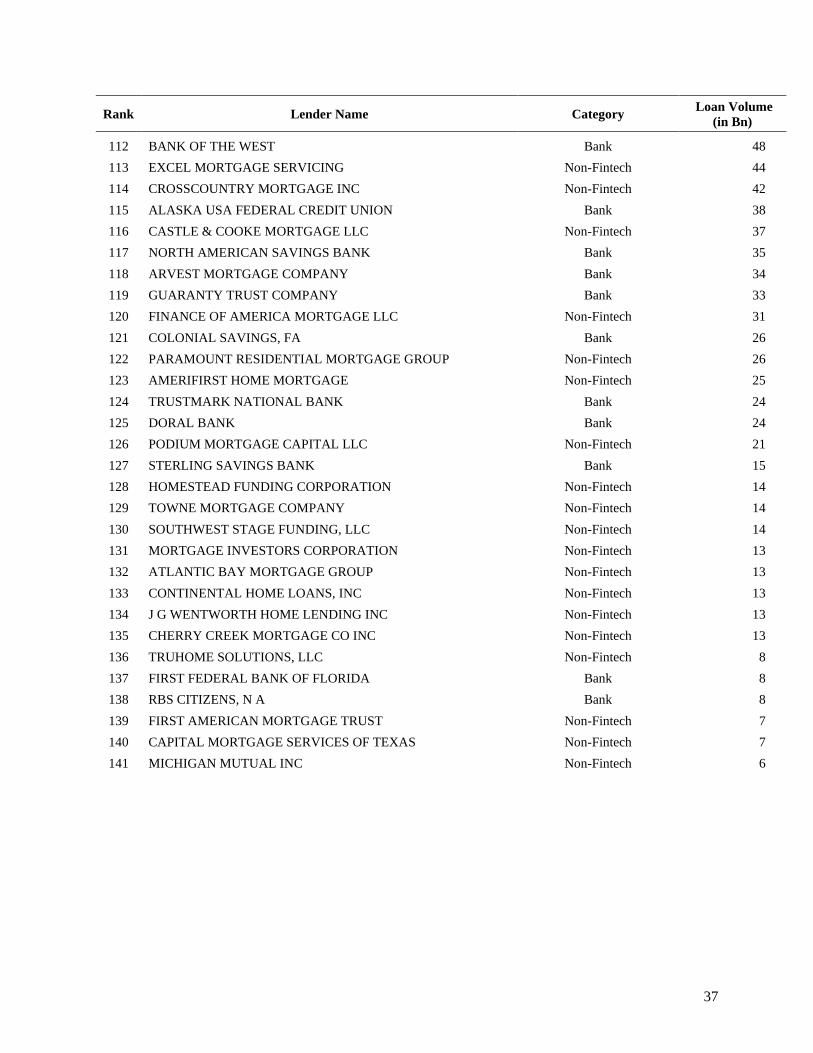
The sample consists of total 141 unique lenders5. There are 38 lenders that have been
classified as bank, 101 as non-fintech, and 2 lenders as fintech. More than half the total number of
loans are loans issued by non-fintech shadow banks. Almost 42% of total number of loans are bank
loans. Number of fintech loans only accounts for around 7% of total number of loans in the sample.
Focusing on total loan volume, the statistics are similar. 54% of total loan volume are loans issued
by non-fintech lenders, followed by bank lenders who issued 40% of total loan volume in the
sample. Only 6% of total loan volumes are issued by fintech lenders.
The biggest lender in the sample is Wells Fargo Home Mortgage, which is categorized as
a bank, followed by Pennymac Loan Services and Freedom Mortgage Corporation, which are non-
fintech. Quicken Loans, which is a fintech, ranked fourth in the sample. The other fintech in the
sample is Movement mortgage.
For the study of the loan performance, I used Ginnie Mae MBS (mortgage-backed
securities) portfolio data to observe default rates of loans issued during the year prior and the year
4 Loan agency type includes Native American (N), Rural Development (R), Veterans Administration (V), and
Federal Housing Administration (FHA). 5 The full list of lenders, including its market share and lender type, is in the appendix.
15
after the MIP cut per each lender type. The data is accumulated from Ginnie Mae I MBS program,
which all securities must bear fixed interest rates and all of the mortgages in a pool must bear the
same interest rate6. I used the main sample as a base, then I created 2 different subsamples - loans
issued pre- and post-period. The first subsample are loans that were issued within one year after
the premium cut or loans that were issued in year 2015. Another subsample accumulates loans that
were issued in 2014 or within a year before the premium cut. In each subsample, I observed the
performance of the loans for 5 years since its issuance. The sample includes first payment date,
month and year of the data, interest rate, loan-to-value ratio, credit score, debt to expense ratio,
loan agency type, lender identification number, and delinquency status. Again, I classified the
loans based on its loan type and lender type as I did with the main sample. Ginnie Mae MBS’s
delinquency status includes only loans that are 1 to 6 months delinquent. I classified the loan as
default if it’s at least 1-month delinquent within its first 5 years.
4.2. Summary Statistics
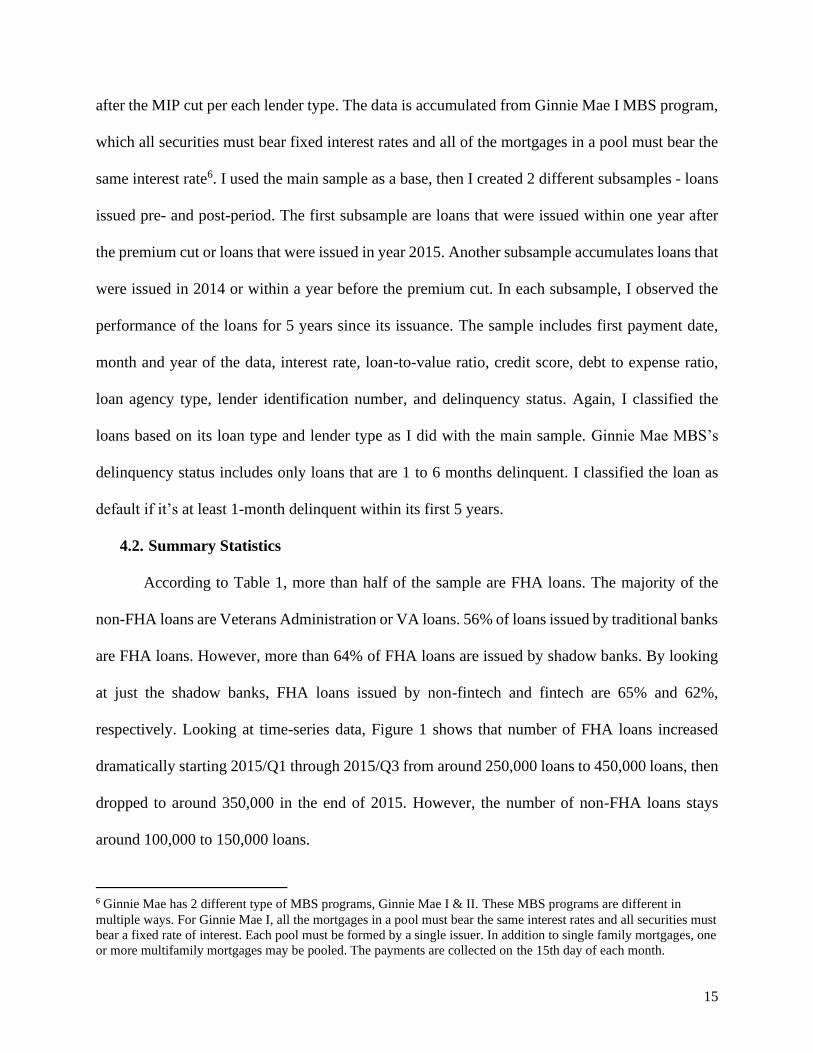
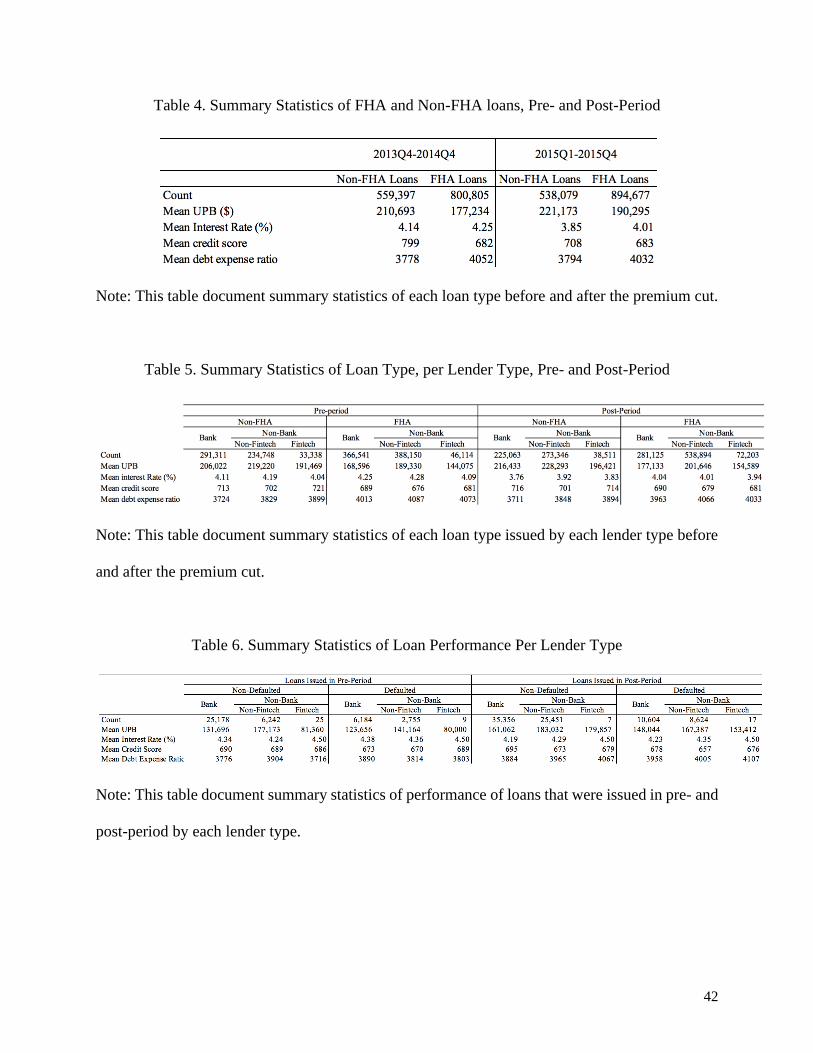
According to Table 1, more than half of the sample are FHA loans. The majority of the
non-FHA loans are Veterans Administration or VA loans. 56% of loans issued by traditional banks
are FHA loans. However, more than 64% of FHA loans are issued by shadow banks. By looking
at just the shadow banks, FHA loans issued by non-fintech and fintech are 65% and 62%,
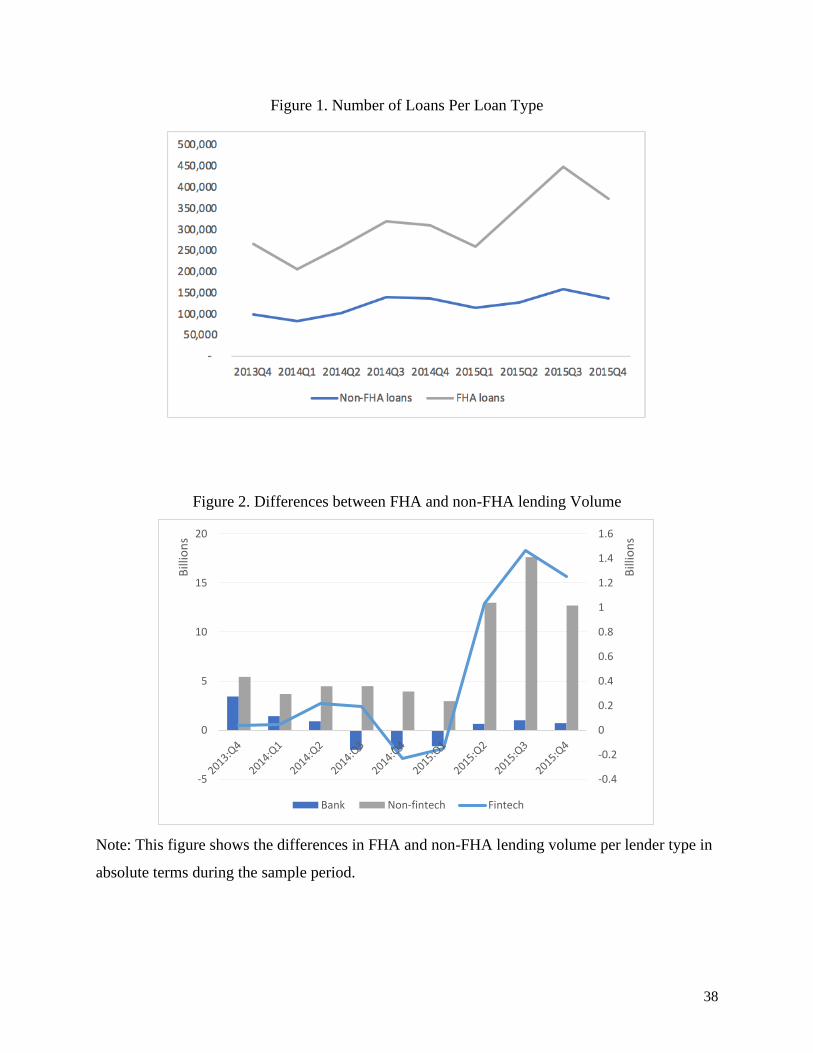
respectively. Looking at time-series data, Figure 1 shows that number of FHA loans increased
dramatically starting 2015/Q1 through 2015/Q3 from around 250,000 loans to 450,000 loans, then
dropped to around 350,000 in the end of 2015. However, the number of non-FHA loans stays
around 100,000 to 150,000 loans.
6 Ginnie Mae has 2 different type of MBS programs, Ginnie Mae I & II. These MBS programs are different in
multiple ways. For Ginnie Mae I, all the mortgages in a pool must bear the same interest rates and all securities must
bear a fixed rate of interest. Each pool must be formed by a single issuer. In addition to single family mortgages, one
or more multifamily mortgages may be pooled. The payments are collected on the 15th day of each month.
16
Table 2 provides summary statistics of loans issued by lender type and by pre- and post-
period, based on data collected under Ginnie Mae. From the beginning to the end of the sample
period, the number of unique non-fintech lender increased from 69 to 73, while the number of
bank lender decreased from 30 to 25. However, share of non-fintech increased from 36% to 62%,
while shares of fintech increased from 4% to 6.5%. Comparing between the first quarter of 2015
that MIP cut occurred and the second quarter of 2015, shares of traditional banks dropped by 5%
from 37% to 32%, while share of shadow banks increased the exact same percentage of 5% from
63% to 68%.
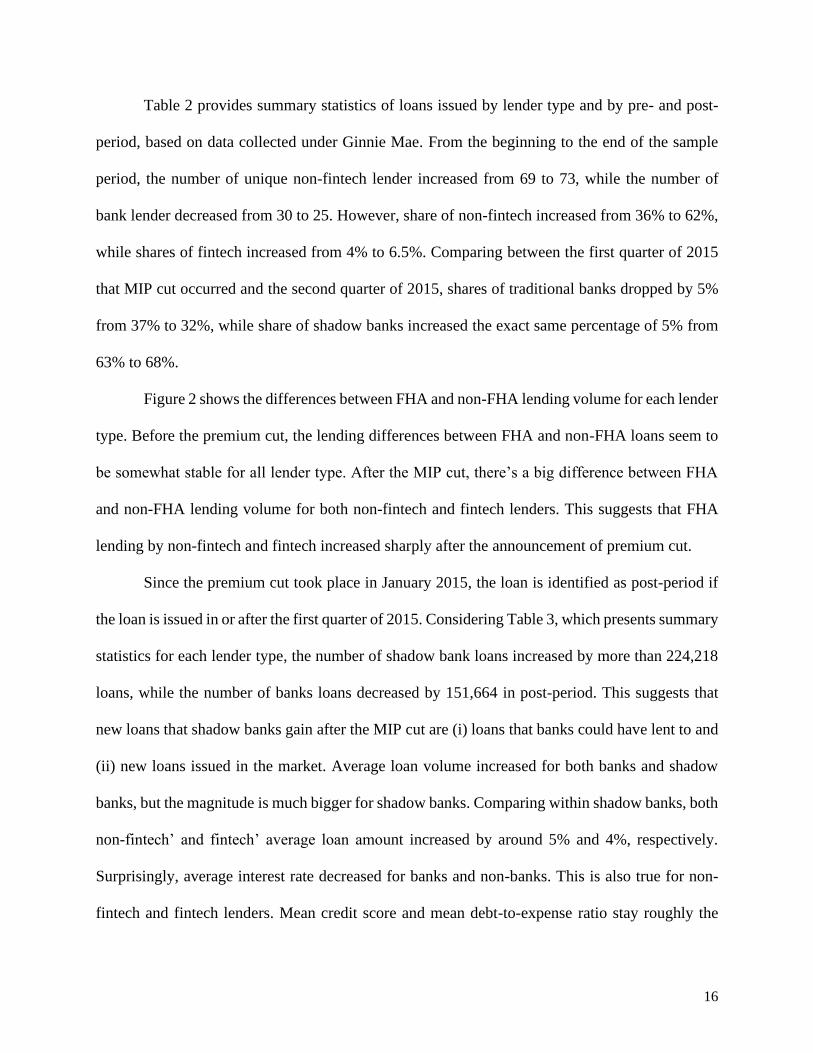
Figure 2 shows the differences between FHA and non-FHA lending volume for each lender
type. Before the premium cut, the lending differences between FHA and non-FHA loans seem to
be somewhat stable for all lender type. After the MIP cut, there’s a big difference between FHA
and non-FHA lending volume for both non-fintech and fintech lenders. This suggests that FHA
lending by non-fintech and fintech increased sharply after the announcement of premium cut.
Since the premium cut took place in January 2015, the loan is identified as post-period if
the loan is issued in or after the first quarter of 2015. Considering Table 3, which presents summary
statistics for each lender type, the number of shadow bank loans increased by more than 224,218
loans, while the number of banks loans decreased by 151,664 in post-period. This suggests that
new loans that shadow banks gain after the MIP cut are (i) loans that banks could have lent to and
(ii) new loans issued in the market. Average loan volume increased for both banks and shadow
banks, but the magnitude is much bigger for shadow banks. Comparing within shadow banks, both
non-fintech’ and fintech’ average loan amount increased by around 5% and 4%, respectively.
Surprisingly, average interest rate decreased for banks and non-banks. This is also true for non-
fintech and fintech lenders. Mean credit score and mean debt-to-expense ratio stay roughly the
17
same for all type of lenders, implying that borrowers’ characteristics are probably unchanged in
post-period.
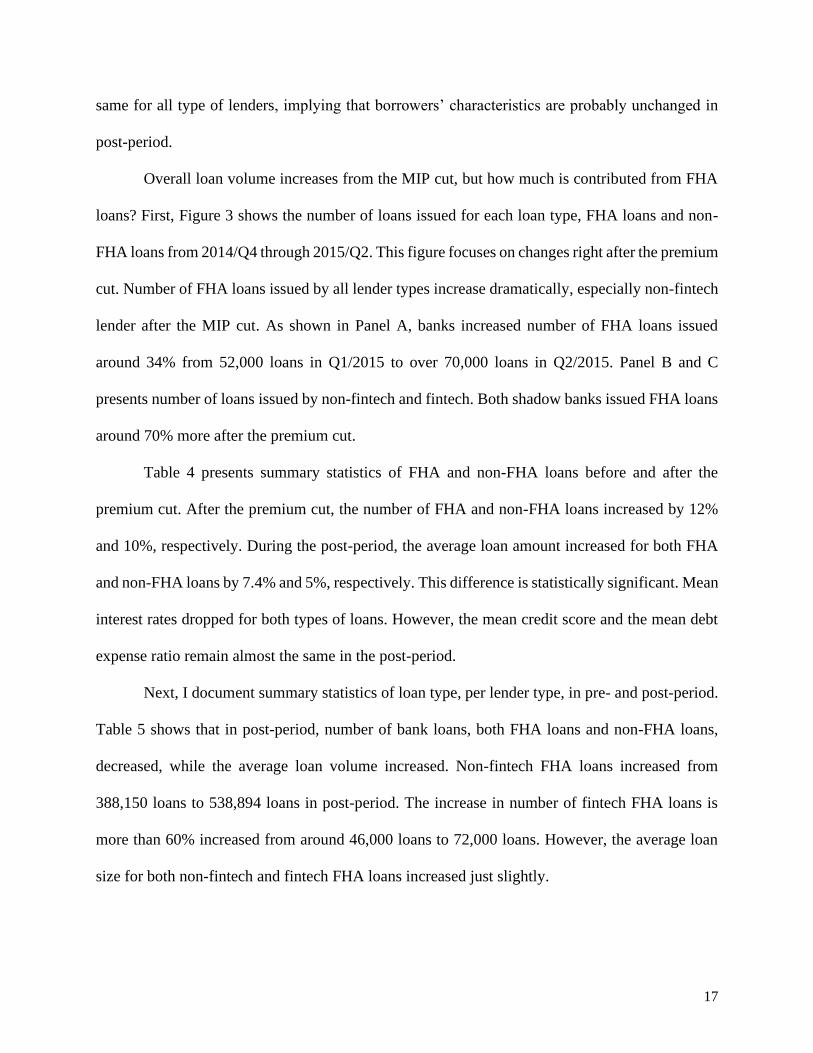
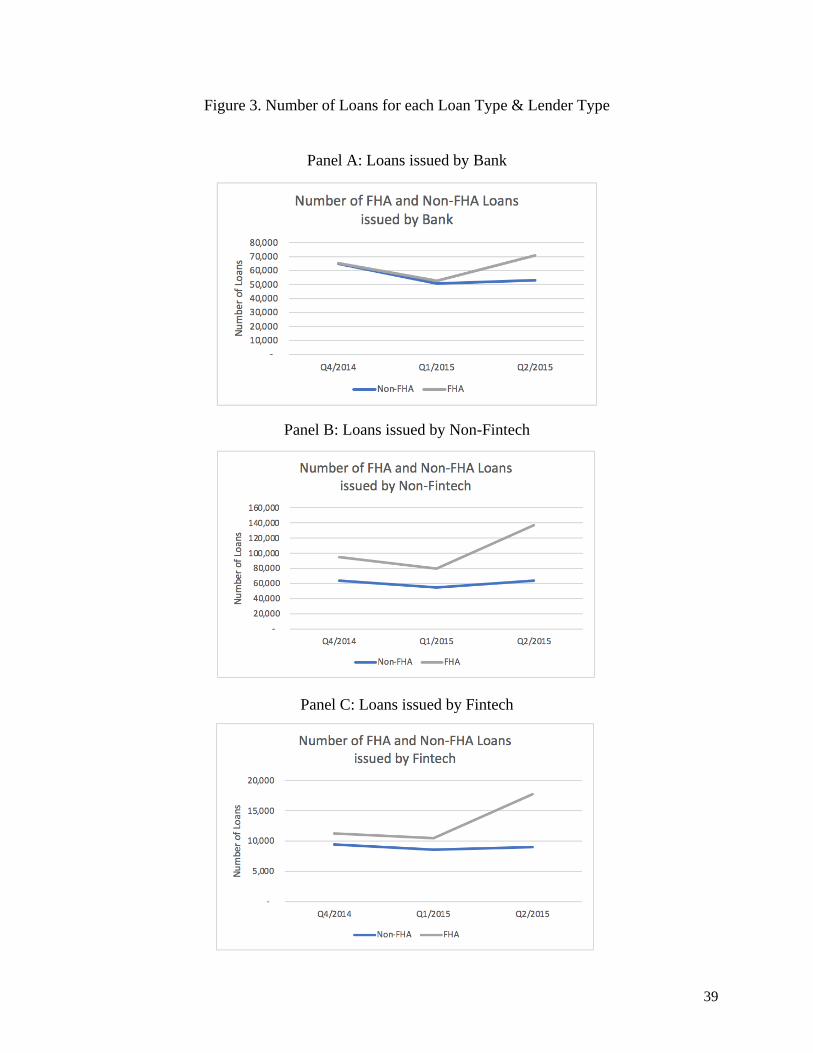
Overall loan volume increases from the MIP cut, but how much is contributed from FHA
loans? First, Figure 3 shows the number of loans issued for each loan type, FHA loans and non-
FHA loans from 2014/Q4 through 2015/Q2. This figure focuses on changes right after the premium
cut. Number of FHA loans issued by all lender types increase dramatically, especially non-fintech
lender after the MIP cut. As shown in Panel A, banks increased number of FHA loans issued
around 34% from 52,000 loans in Q1/2015 to over 70,000 loans in Q2/2015. Panel B and C
presents number of loans issued by non-fintech and fintech. Both shadow banks issued FHA loans
around 70% more after the premium cut.
Table 4 presents summary statistics of FHA and non-FHA loans before and after the
premium cut. After the premium cut, the number of FHA and non-FHA loans increased by 12%
and 10%, respectively. During the post-period, the average loan amount increased for both FHA
and non-FHA loans by 7.4% and 5%, respectively. This difference is statistically significant. Mean
interest rates dropped for both types of loans. However, the mean credit score and the mean debt
expense ratio remain almost the same in the post-period.
Next, I document summary statistics of loan type, per lender type, in pre- and post-period.
Table 5 shows that in post-period, number of bank loans, both FHA loans and non-FHA loans,
decreased, while the average loan volume increased. Non-fintech FHA loans increased from
388,150 loans to 538,894 loans in post-period. The increase in number of fintech FHA loans is
more than 60% increased from around 46,000 loans to 72,000 loans. However, the average loan
size for both non-fintech and fintech FHA loans increased just slightly.
18
The loan performance summary statistics of loan performance per lender type is presented
in Table 6. Data for loan performance is accumulated from the Ginnie Mae MBS portfolio data,
which is different from the Ginnie Mae loan-level data in the main analysis. For fintech loans, the
number of loans that were issued in post-period defaulted is higher (17 loans delinquent out of
total 24 loans) than fintech loans that were issued in pre-period (9 loans delinquent out of 34 loans).
Note that the observation counts are much for lower for shadow banks because the sample is only
limit to just FHA loans. Also, average loan size is much higher for fintech loans issued in post-
period than fintech loans issued in pre-period. The much higher average loan size for loans issued
in post-period might be one of the reasons why the number of delinquency loans is higher.
5. Research Design and Empirical Results
This section describes my empirical framework for studying the role shadow banks play in
the market and how they take market share away from traditional banks.
I use triple-differences or difference-in-difference-in-differences analysis to study this
quasi-experiment. In this paper, the treatment group consists of FHA loans, while control group is
non-FHA loans. The advantage of this method is that it eliminates omitted variable bias for omitted
variables that could affect the two groups equally over time.
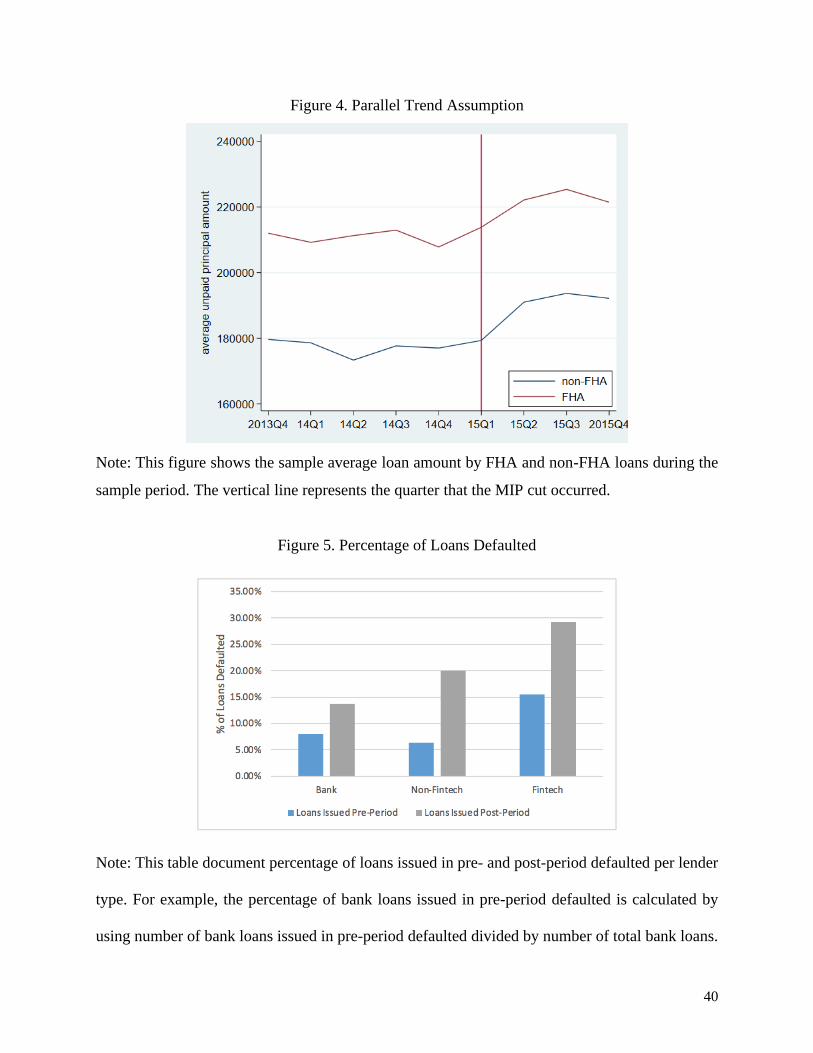
The triple-difference estimator requires a parallel trends assumption for the estimated effect
to have a causal interpretation. Even though the triple-difference is the difference between two
difference-in-differences, it does not need two parallel trend assumption (Olden and Moen, 2020).
Figure 3 shows number of loans issued for FHA and non-FHA loans by each lender type from
2014Q4 to 2015Q2, a quarter before and after the MIP cut. All 3 panels show parallel pre-trends
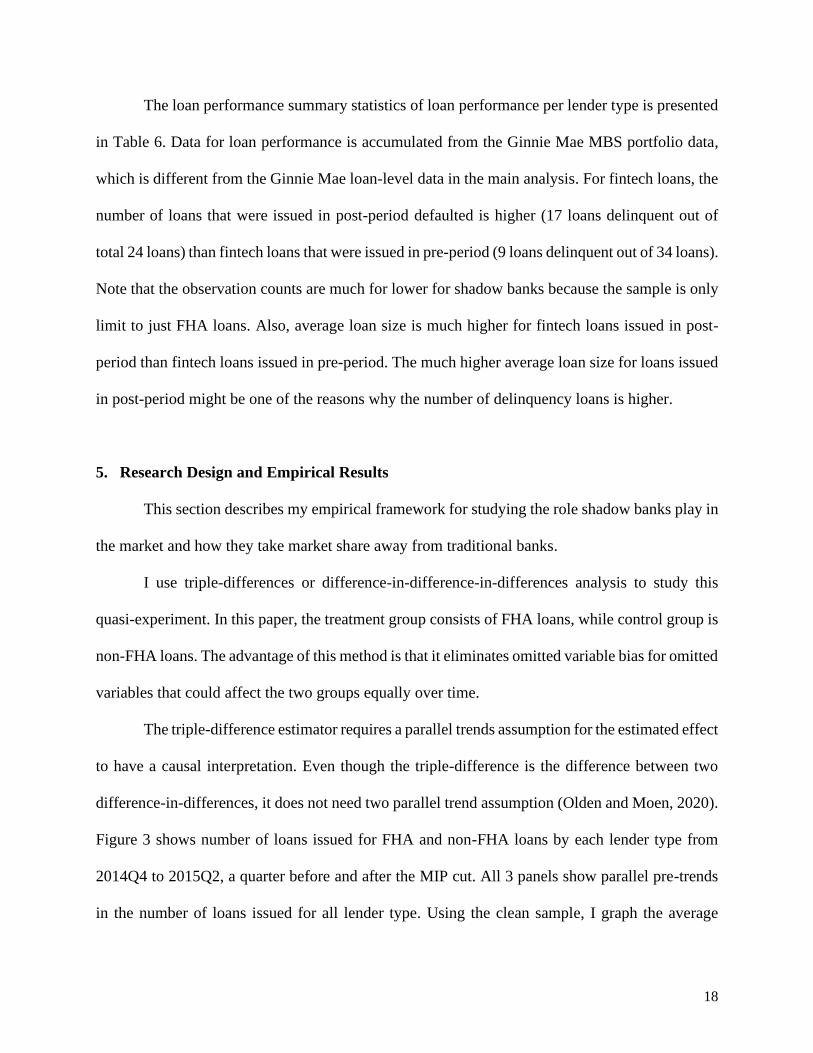
in the number of loans issued for all lender type. Using the clean sample, I graph the average
19
unpaid principal balance or average loan volume for treatment and control group over the sample
time period. Figure 4 shows that parallel trend assumption holds which ensures internal validity of
difference-in-difference model, meaning that omitted variables affect the treatment and control
groups over time equally. Thus, by comparing the difference between the two groups before and
after the MIP shock allow me to isolate the effect of the shock, controlling for the omitted
variables.
I have a few hypotheses on lending volume, interest rate, and default rates following the
FHA MIP cut. I expect the shadow bank loan volume to increase at a greater magnitude than banks
because shadow banks are much more active in FHA market. Due to regulatory constraint, banks
are not concentrated on the FHA market. For the interest rate, as the MIP which is considered as
the cost of capital decreased, I expect the interest rate to be lower since the MIP cut will attract
safer group of borrowers. Thus, I also expect the default rates of FHA loans in post-period for the
same reason.
5.1. Rise of shadow banks
To answer the question who borrows from non-fintech and fintech lenders, I formally test
what happened to lending volume of each lender type following the premium cut, using triple-
differences method. The triple differences compare pre- and post-event, bank and non-
fintech/fintech, and FHA and non-FHA loans and differences out differences in average levels.
The advantage of using triple differences is that it can filter the trend that non-banks are gaining
market share over time relative to banks, assuming that those market share trends are similar in
the FHA and non-FHA markets.
𝑈𝑃𝐵𝑖𝑗𝑠𝑡 = 𝛽1𝐹𝐻𝐴𝑖 + 𝛽2𝑃𝑜𝑠𝑡𝑃𝑒𝑟𝑖𝑜𝑑𝑡 + 𝛽3𝐵𝑎𝑛𝑘𝑗 + 𝛽4𝐹𝐻𝐴𝑖 × 𝑃𝑜𝑠𝑡𝑃𝑒𝑟𝑖𝑜𝑑𝑡
+ 𝛽5𝐹𝐻𝐴𝑖 × 𝐵𝑎𝑛𝑘𝑗 + 𝛽6𝑃𝑜𝑠𝑡𝑃𝑒𝑟𝑖𝑜𝑑𝑡 × 𝐵𝑎𝑛𝑘𝑗
20
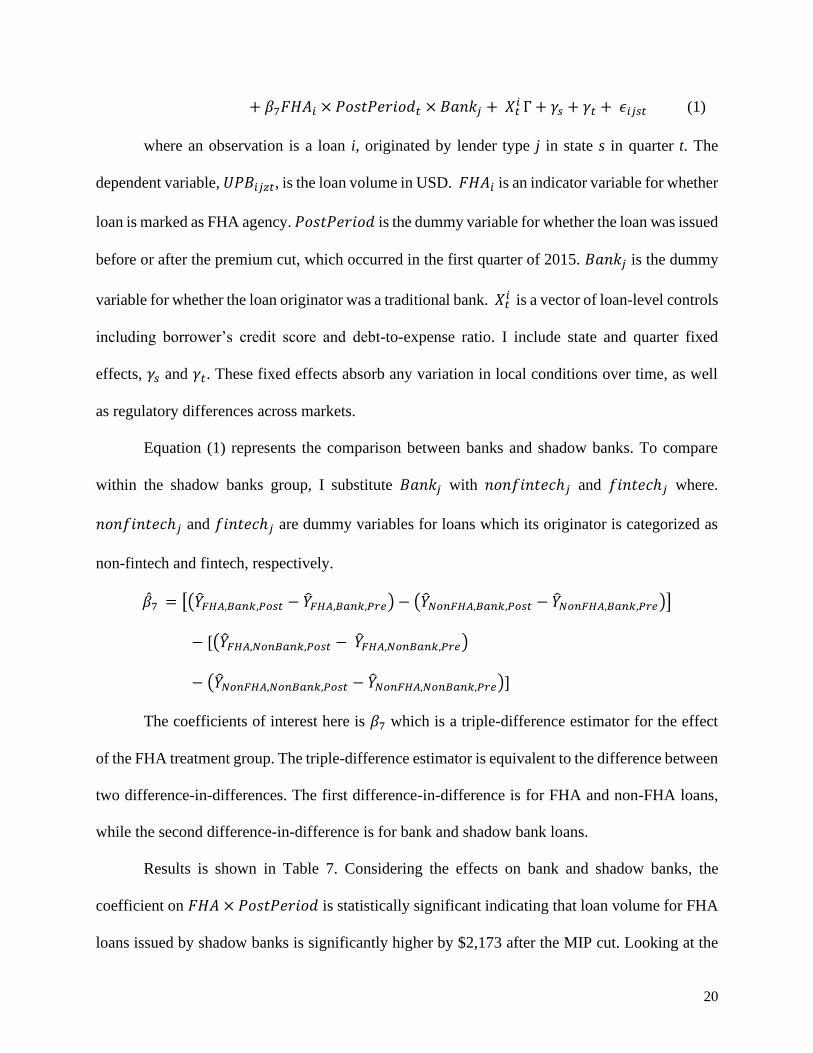
+ 𝛽7𝐹𝐻𝐴𝑖 × 𝑃𝑜𝑠𝑡𝑃𝑒𝑟𝑖𝑜𝑑𝑡 × 𝐵𝑎𝑛𝑘𝑗 + 𝑋𝑡 𝑖 Γ + 𝛾𝑠 + 𝛾𝑡 + 𝜖𝑖𝑗𝑠𝑡 (1)
where an observation is a loan i, originated by lender type j in state s in quarter t. The
dependent variable, 𝑈𝑃𝐵𝑖𝑗𝑧𝑡, is the loan volume in USD. 𝐹𝐻𝐴𝑖 is an indicator variable for whether
loan is marked as FHA agency. 𝑃𝑜𝑠𝑡𝑃𝑒𝑟𝑖𝑜𝑑 is the dummy variable for whether the loan was issued
before or after the premium cut, which occurred in the first quarter of 2015. 𝐵𝑎𝑛𝑘𝑗 is the dummy
variable for whether the loan originator was a traditional bank. 𝑋𝑡 𝑖 is a vector of loan-level controls
including borrower’s credit score and debt-to-expense ratio. I include state and quarter fixed
effects, 𝛾𝑠 and 𝛾𝑡. These fixed effects absorb any variation in local conditions over time, as well
as regulatory differences across markets.
Equation (1) represents the comparison between banks and shadow banks. To compare
within the shadow banks group, I substitute 𝐵𝑎𝑛𝑘𝑗 with 𝑛𝑜𝑛𝑓𝑖𝑛𝑡𝑒𝑐ℎ𝑗 and 𝑓𝑖𝑛𝑡𝑒𝑐ℎ𝑗 where.
𝑛𝑜𝑛𝑓𝑖𝑛𝑡𝑒𝑐ℎ𝑗 and 𝑓𝑖𝑛𝑡𝑒𝑐ℎ𝑗 are dummy variables for loans which its originator is categorized as
non-fintech and fintech, respectively.
�̂�7 = [(�̂�𝐹𝐻𝐴,𝐵𝑎𝑛𝑘,𝑃𝑜𝑠𝑡 − �̂�𝐹𝐻𝐴,𝐵𝑎𝑛𝑘,𝑃𝑟𝑒) − (�̂�𝑁𝑜𝑛𝐹𝐻𝐴,𝐵𝑎𝑛𝑘,𝑃𝑜𝑠𝑡 − �̂�𝑁𝑜𝑛𝐹𝐻𝐴,𝐵𝑎𝑛𝑘,𝑃𝑟𝑒)]
− [(�̂�𝐹𝐻𝐴,𝑁𝑜𝑛𝐵𝑎𝑛𝑘,𝑃𝑜𝑠𝑡 − �̂�𝐹𝐻𝐴,𝑁𝑜𝑛𝐵𝑎𝑛𝑘,𝑃𝑟𝑒)
− (�̂�𝑁𝑜𝑛𝐹𝐻𝐴,𝑁𝑜𝑛𝐵𝑎𝑛𝑘,𝑃𝑜𝑠𝑡 − �̂�𝑁𝑜𝑛𝐹𝐻𝐴,𝑁𝑜𝑛𝐵𝑎𝑛𝑘,𝑃𝑟𝑒)]
The coefficients of interest here is 𝛽7 which is a triple-difference estimator for the effect
of the FHA treatment group. The triple-difference estimator is equivalent to the difference between
two difference-in-differences. The first difference-in-difference is for FHA and non-FHA loans,
while the second difference-in-difference is for bank and shadow bank loans.
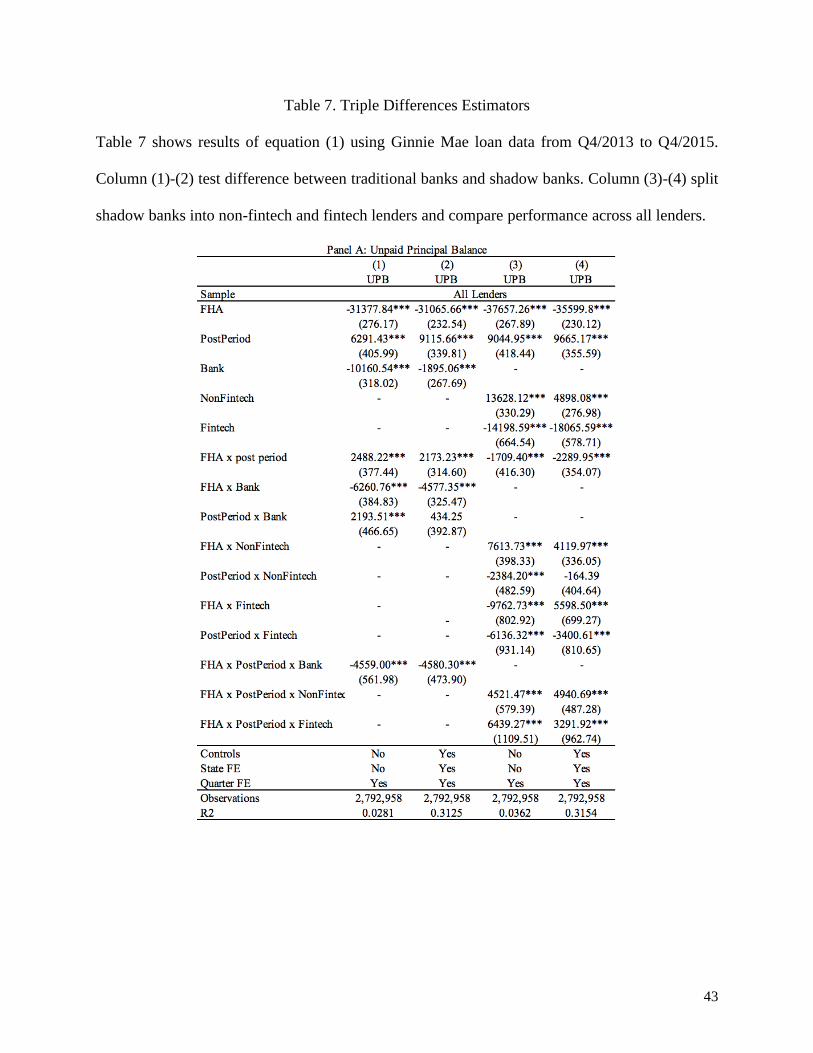
Results is shown in Table 7. Considering the effects on bank and shadow banks, the
coefficient on 𝐹𝐻𝐴 × 𝑃𝑜𝑠𝑡𝑃𝑒𝑟𝑖𝑜𝑑 is statistically significant indicating that loan volume for FHA
loans issued by shadow banks is significantly higher by $2,173 after the MIP cut. Looking at the
21
coefficient on 𝐹𝐻𝐴 × 𝑃𝑜𝑠𝑡𝑃𝑒𝑟𝑖𝑜𝑑 × 𝐵𝑎𝑛𝑘, banks’ loan volume is $4,580 less relative to non-
banks’ for FHA loans in the post-period. This finding is consistent with a previous paper by
Buchak et al. (2018), suggesting that shadow banks are much more active in the FHA market.
Comparing across all lenders as presented in column 4, the coefficient on 𝐹𝐻𝐴 × 𝑃𝑜𝑠𝑡𝑃𝑒𝑟𝑖𝑜𝑑 ×
𝑁𝑜𝑛𝐹𝑖𝑛𝑡𝑒𝑐ℎ is statistically significant suggesting that FHA loan issued by non-fintech lenders is
$4,940 more in post-period comparing to bank lenders. Fintech’s loan volume is higher in post-
period as well, but the magnitude is slightly less. This could be because fintech users tend to be
high-income and high-value (Gulamhuseiwala et al., 2015). Thus, they are less elastic to the
decrease in the premium cut.
Results in this section answer research question (2) and (3) that non-fintech and fintech
shadow bank lenders indeed increase their market share in mortgage market. One of the non-bank
lenders’ roles in the mortgage market could be lending to riskier borrowers that banks less
accommodate. Thus, non-bank lenders were able to increase their market share because their target
borrowers are FHA-likely borrowers, which are type of borrowers that banks less focus on.
5.2. What contributes to the rise of shadow banks?
To answer how shadow banks have been able to take market share from traditional bank
lenders, I exploit data by rearranging the loan by its loan type, lender type, and quarter. I calculate
total loan volume, average loan size, and number of loans for each loan type issued by particular
lender type in each quarter. Then I use following equations to run the regression
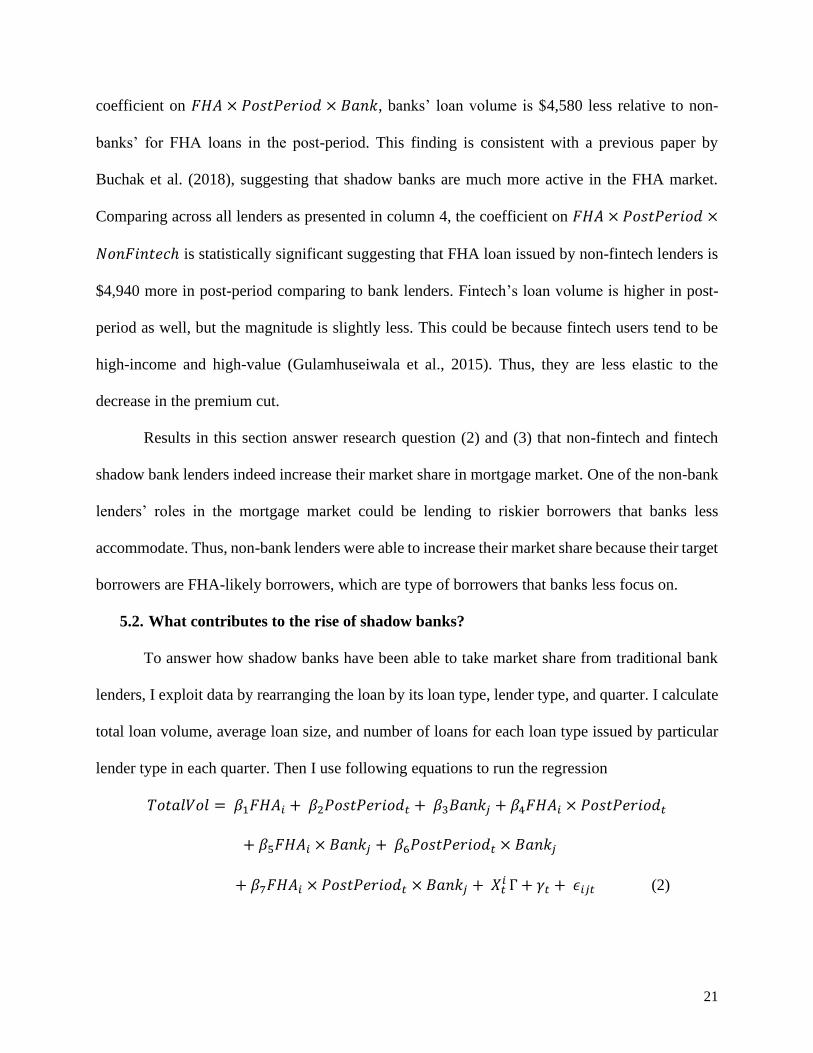
𝑇𝑜𝑡𝑎𝑙𝑉𝑜𝑙 = 𝛽1𝐹𝐻𝐴𝑖 + 𝛽2𝑃𝑜𝑠𝑡𝑃𝑒𝑟𝑖𝑜𝑑𝑡 + 𝛽3𝐵𝑎𝑛𝑘𝑗 + 𝛽4𝐹𝐻𝐴𝑖 × 𝑃𝑜𝑠𝑡𝑃𝑒𝑟𝑖𝑜𝑑𝑡
+ 𝛽5𝐹𝐻𝐴𝑖 × 𝐵𝑎𝑛𝑘𝑗 + 𝛽6𝑃𝑜𝑠𝑡𝑃𝑒𝑟𝑖𝑜𝑑𝑡 × 𝐵𝑎𝑛𝑘𝑗
+ 𝛽7𝐹𝐻𝐴𝑖 × 𝑃𝑜𝑠𝑡𝑃𝑒𝑟𝑖𝑜𝑑𝑡 × 𝐵𝑎𝑛𝑘𝑗 + 𝑋𝑡 𝑖 Γ + 𝛾𝑡 + 𝜖𝑖𝑗𝑡 (2)
22
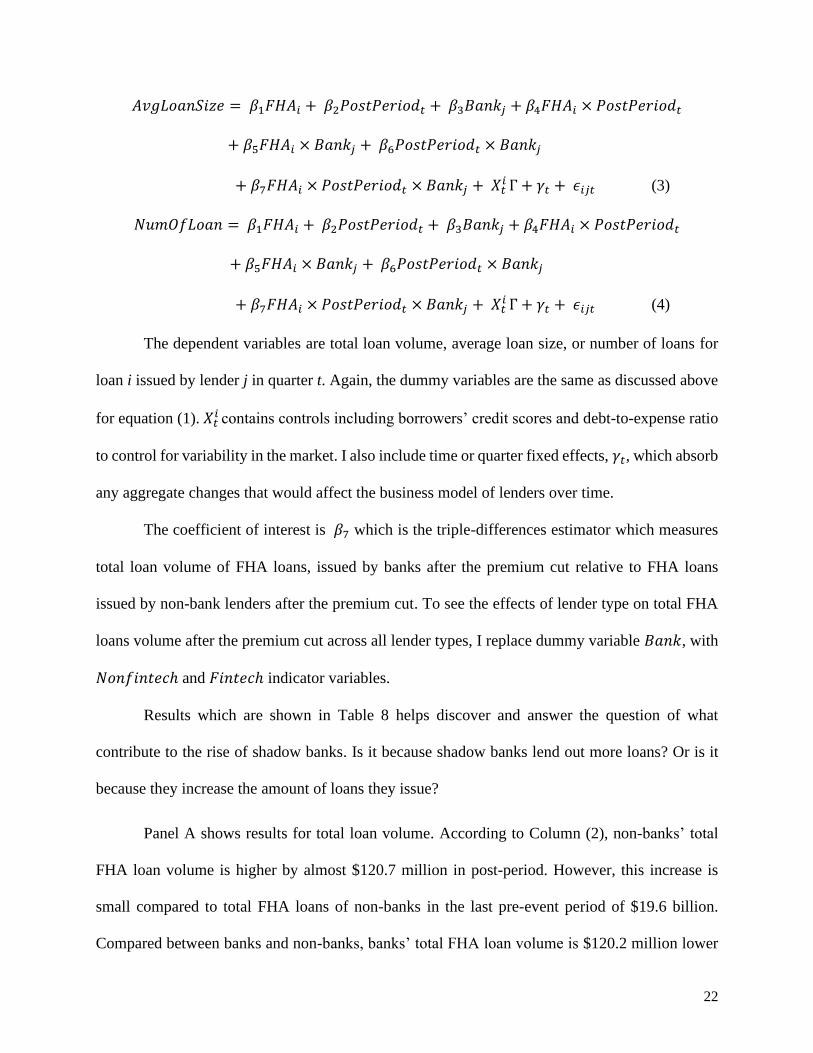
𝐴𝑣𝑔𝐿𝑜𝑎𝑛𝑆𝑖𝑧𝑒 = 𝛽1𝐹𝐻𝐴𝑖 + 𝛽2𝑃𝑜𝑠𝑡𝑃𝑒𝑟𝑖𝑜𝑑𝑡 + 𝛽3𝐵𝑎𝑛𝑘𝑗 + 𝛽4𝐹𝐻𝐴𝑖 × 𝑃𝑜𝑠𝑡𝑃𝑒𝑟𝑖𝑜𝑑𝑡
+ 𝛽5𝐹𝐻𝐴𝑖 × 𝐵𝑎𝑛𝑘𝑗 + 𝛽6𝑃𝑜𝑠𝑡𝑃𝑒𝑟𝑖𝑜𝑑𝑡 × 𝐵𝑎𝑛𝑘𝑗
+ 𝛽7𝐹𝐻𝐴𝑖 × 𝑃𝑜𝑠𝑡𝑃𝑒𝑟𝑖𝑜𝑑𝑡 × 𝐵𝑎𝑛𝑘𝑗 + 𝑋𝑡 𝑖 Γ + 𝛾𝑡 + 𝜖𝑖𝑗𝑡 (3)
𝑁𝑢𝑚𝑂𝑓𝐿𝑜𝑎𝑛 = 𝛽1𝐹𝐻𝐴𝑖 + 𝛽2𝑃𝑜𝑠𝑡𝑃𝑒𝑟𝑖𝑜𝑑𝑡 + 𝛽3𝐵𝑎𝑛𝑘𝑗 + 𝛽4𝐹𝐻𝐴𝑖 × 𝑃𝑜𝑠𝑡𝑃𝑒𝑟𝑖𝑜𝑑𝑡
+ 𝛽5𝐹𝐻𝐴𝑖 × 𝐵𝑎𝑛𝑘𝑗 + 𝛽6𝑃𝑜𝑠𝑡𝑃𝑒𝑟𝑖𝑜𝑑𝑡 × 𝐵𝑎𝑛𝑘𝑗
+ 𝛽7𝐹𝐻𝐴𝑖 × 𝑃𝑜𝑠𝑡𝑃𝑒𝑟𝑖𝑜𝑑𝑡 × 𝐵𝑎𝑛𝑘𝑗 + 𝑋𝑡 𝑖 Γ + 𝛾𝑡 + 𝜖𝑖𝑗𝑡 (4)
The dependent variables are total loan volume, average loan size, or number of loans for
loan i issued by lender j in quarter t. Again, the dummy variables are the same as discussed above
for equation (1). 𝑋𝑡 𝑖 contains controls including borrowers’ credit scores and debt-to-expense ratio
to control for variability in the market. I also include time or quarter fixed effects, 𝛾𝑡, which absorb
any aggregate changes that would affect the business model of lenders over time.
The coefficient of interest is 𝛽7 which is the triple-differences estimator which measures
total loan volume of FHA loans, issued by banks after the premium cut relative to FHA loans
issued by non-bank lenders after the premium cut. To see the effects of lender type on total FHA
loans volume after the premium cut across all lender types, I replace dummy variable 𝐵𝑎𝑛𝑘, with
𝑁𝑜𝑛𝑓𝑖𝑛𝑡𝑒𝑐ℎ and 𝐹𝑖𝑛𝑡𝑒𝑐ℎ indicator variables.
Results which are shown in Table 8 helps discover and answer the question of what
contribute to the rise of shadow banks. Is it because shadow banks lend out more loans? Or is it
because they increase the amount of loans they issue?
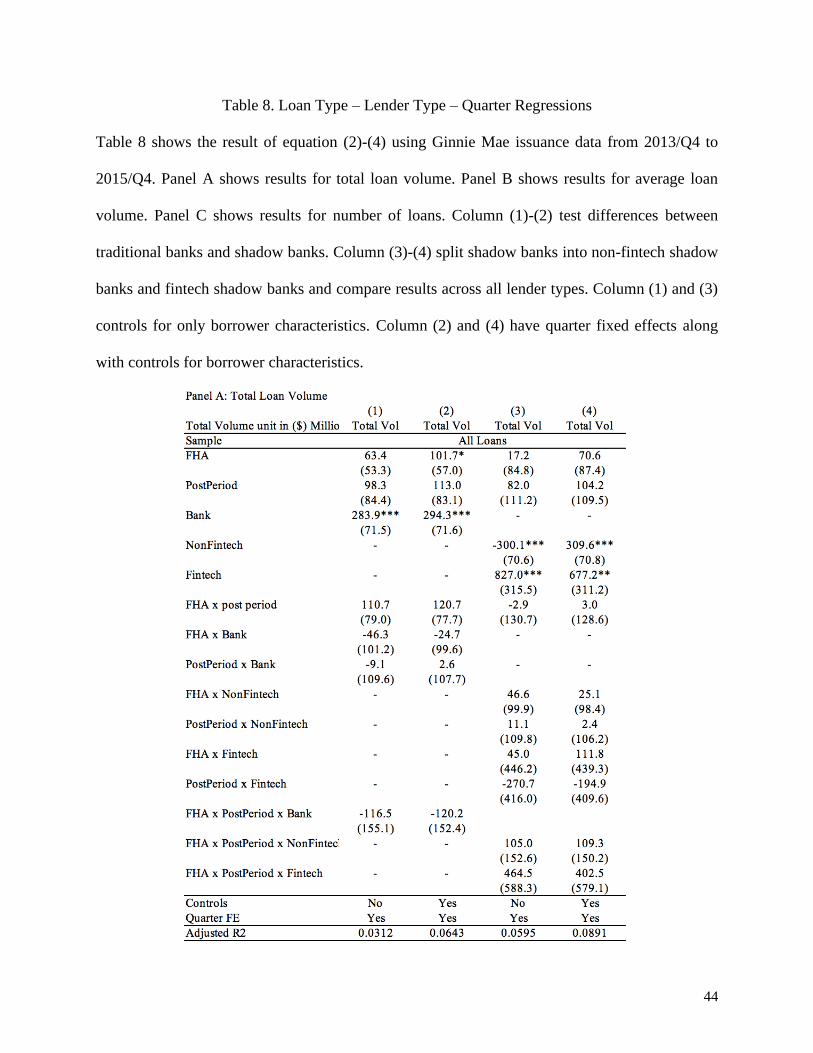
Panel A shows results for total loan volume. According to Column (2), non-banks’ total
FHA loan volume is higher by almost $120.7 million in post-period. However, this increase is
small compared to total FHA loans of non-banks in the last pre-event period of $19.6 billion.
Compared between banks and non-banks, banks’ total FHA loan volume is $120.2 million lower
23
than non-banks after the MIP cut according to the coefficient on 𝐹𝐻𝐴 × 𝑃𝑜𝑠𝑡𝑃𝑒𝑟𝑖𝑜𝑑 × 𝐵𝑎𝑛𝑘.
Comparing across all lender type, fintech’s total FHA loan volume is substantially higher than
total loan volume issued by other lenders by $402 million in post-period. Looking at the coefficient
on 𝐹𝐻𝐴 × 𝑃𝑜𝑠𝑡𝑃𝑒𝑟𝑖𝑜𝑑 × 𝑁𝑜𝑛𝐹𝑖𝑛𝑡𝑒𝑐ℎ, non-fintech shadow banks’ total FHA loan volume
increased just around $109 million, which is much smaller than that of fintech. Thus, non-banks
lenders, especially fintech, issued loans to serve new demands and acquire the losing demands that
banks have lost.
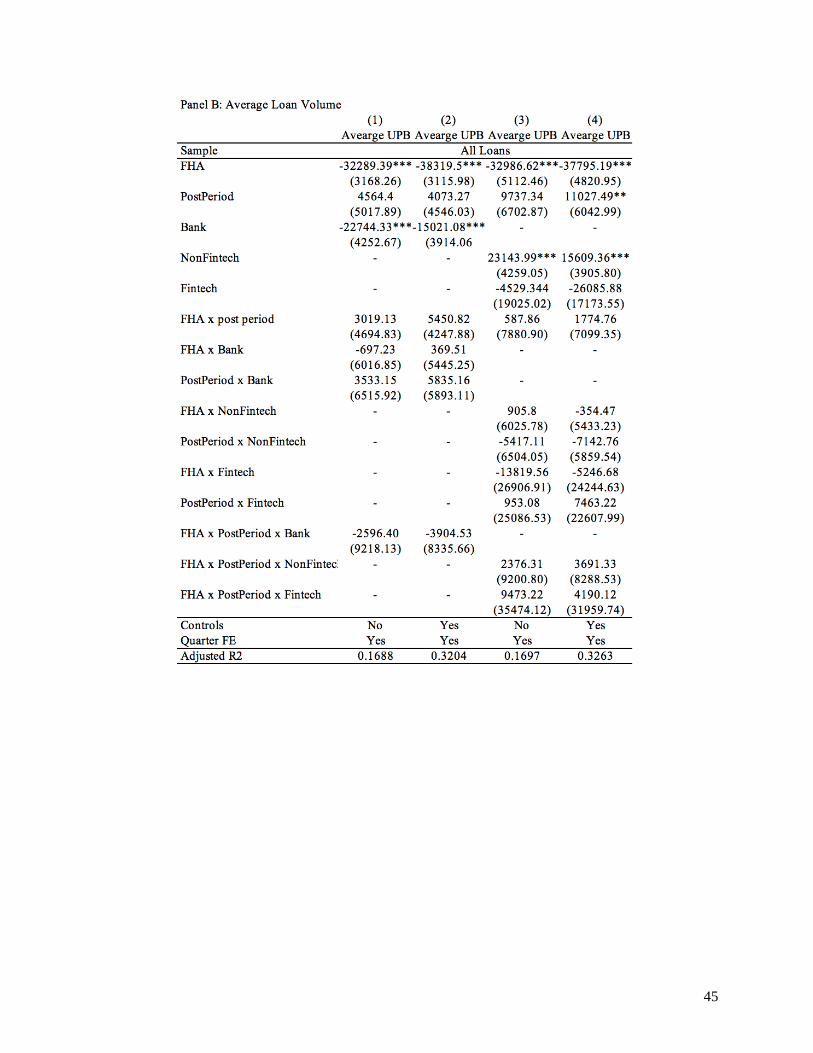
Next, I further analyze whether the average loan size or number of loans are factors behind
changes in shadow banks’ and banks’ FHA loan volume. In Column (2) and (4) in Panel B, the
average loan size does not significantly contribute to shadow banks’ total lending. Non-banks’
average loan size for FHA loans is around $5,450 higher in post-period.
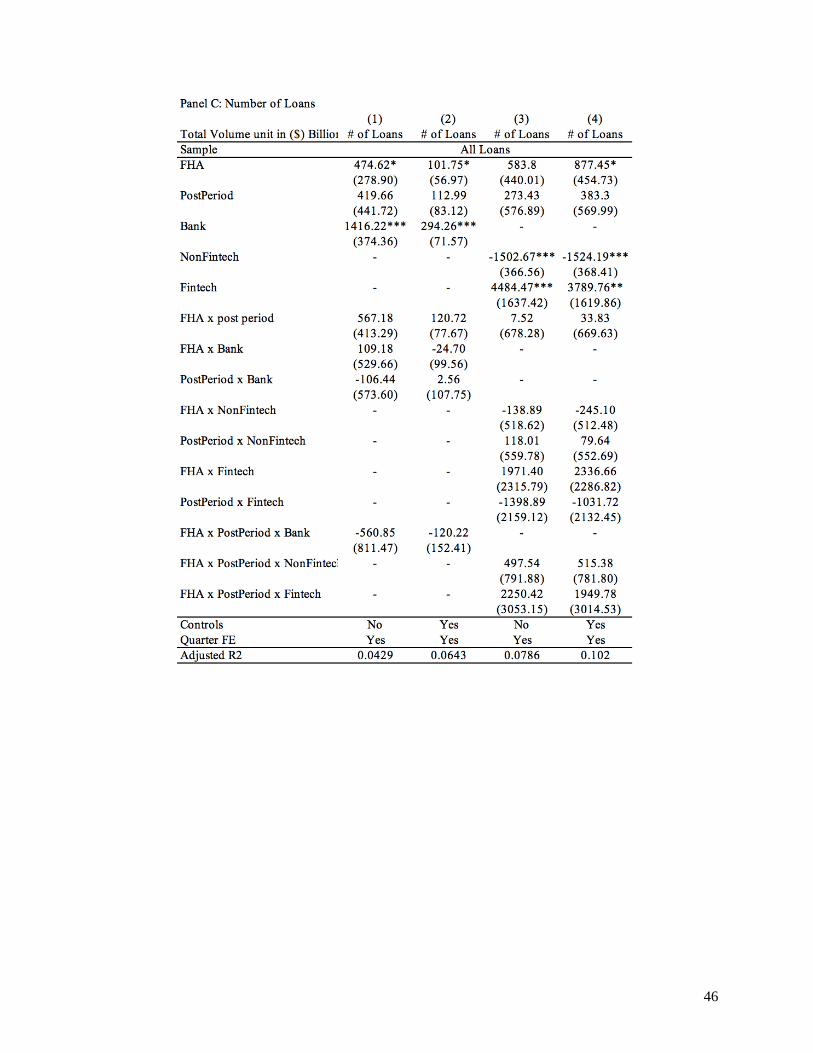
Lastly, results in Panel C shows how the number of loans issued explains the total loan
volume issued by each type of lender in post-period. In Column (2), shadow banks issued more
than 120 more FHA loans per lender in post-period relative to the pre-event period. However,
banks issued around 120 fewer FHA loans than shadow banks following the premium cut. Again,
the result suggests that non-banks took away the borrowers from banks. The decrease in banks’
lending seems to be almost perfectly offset by the gain in lending that shadow banks received.
Column (4) presents the triple differences estimators across all lender type. Looking at the
coefficient on 𝐹𝐻𝐴 × 𝑃𝑜𝑠𝑡𝑃𝑒𝑟𝑖𝑜𝑑 × 𝐹𝑖𝑛𝑡𝑒𝑐ℎ and 𝐹𝐻𝐴 × 𝑃𝑜𝑠𝑡𝑃𝑒𝑟𝑖𝑜𝑑 × 𝑁𝑜𝑛𝐹𝑖𝑛𝑡𝑒𝑐ℎ, fintech
issued more than 1,900 loans more than any lenders did, while non-fintech shadow banks only
increased their loan issuance by around 515 loans.
Even though results from rearranging data by loan type, lender type, and quarter are found
to be not statistically significant, the results are directionally consistent with my hypothesis.
24
Banks’s lending decreases relative to shadow banks mainly because their target borrowers are not
FHA concentrated. Regulatory arbitrage allows shadow banks to increase their lending through
issuing a greater number of loans and increasing their lending size per loan. The increase in shadow
bank lending is mostly driven by fintech lenders. Fintech increases their lending and take away
most of the demand from banks in the post-period. Their total loan volume, and number of loans
issued are substantially higher than non-fintech most likely a result from greater efficiency and
convenience due to technology arbitrage.
In the previous section, I’ve found that shadow bank did increase their lending and market
share while banks decreased. Results from this section help answering to research question (2)
what role these lenders play in mortgage market. Following the MIP cut, the number of FHA loans
issued by shadow banks increased relative non-FHA loans, while those issued by banks remained
essentially flat. This suggests that shadow banks accommodate risky group of borrowers that
banks less focus on, and thus fill in the lending gap. Results also help answering research question
(3) that shadow banks are able to increase their lending by issuing a greater number of loans and
issuing bigger loan amount.
5.3. Loan interest rates
I explore how the MIP cut affect loans’ interest rates. Changes in interest rate after the MIP
cut can be explained by (1) the strategic competition among lenders, (2) relative efficiency of
processing loans between lender types. The more efficient it is for a lender to process a loan, the
lower the interest rate a lender can offer, and (3) the pass-through of the MIP discount to the
borrowers, which focuses about time-series changes in pre- and post-period. The 50 basis points
cut in the MIP is imposed to benefit borrowers. If the interest rates in the post-period was
unchanged, this implies that there’s a full pass-through and that the borrower would reap the full
25
benefit of the 50 basis points decrease in the MIP. A paper by Bhutta and Ringo (2019) tests for a
discontinuity in interest rate around the MIP cut and found that there’s a full pass through of the
MIP reduction to borrowers. Their paper uses loan-level data from HMDA which cover nearly the
entire residential mortgage market. Since HMDA does not provide interest rate data, they use
interest rate lock data provided by Optimal Blue. However, lenders using the Optimal Blue
platform tend to be smaller. Thus, their data do not include loans originated by the largest banks
such as Wells Fargo which is the biggest lenders in my sample. In addition, their paper does not
do the cross-sectional with lender types like in my paper.
𝐼𝑛𝑡𝑒𝑟𝑒𝑠𝑡𝑖𝑗𝑠𝑡 = 𝛽1𝐹𝐻𝐴𝑖 + 𝛽2𝑃𝑜𝑠𝑡𝑃𝑒𝑟𝑖𝑜𝑑𝑡 + 𝛽3𝐵𝑎𝑛𝑘𝑗 + 𝛽4𝐹𝐻𝐴𝑖 × 𝑃𝑜𝑠𝑡𝑃𝑒𝑟𝑖𝑜𝑑𝑡
+ 𝛽5𝐹𝐻𝐴𝑖 × 𝐵𝑎𝑛𝑘𝑗 + 𝛽6𝑃𝑜𝑠𝑡𝑃𝑒𝑟𝑖𝑜𝑑𝑡 × 𝐵𝑎𝑛𝑘𝑗
+ 𝛽7𝐹𝐻𝐴𝑖 × 𝑃𝑜𝑠𝑡𝑃𝑒𝑟𝑖𝑜𝑑𝑡 × 𝐵𝑎𝑛𝑘𝑗 + 𝑋𝑡 𝑖 Γ + 𝛾𝑠 + 𝛾𝑡 + 𝜖𝑖𝑗𝑠𝑡 (5)
Equation (5) is the same as Equation (1) in section 5.1, except that the dependent variable
is 𝑖𝑛𝑡𝑒𝑟𝑒𝑠𝑡 which is an interest rate of loan 𝑖 issued by lender 𝑗 in state 𝑠 in quarter 𝑡. Again, this
equation uses triple differences method to compare FHA with non-FHA loans, loans in pre- with
post-period, and loans issued by banks and non-banks.
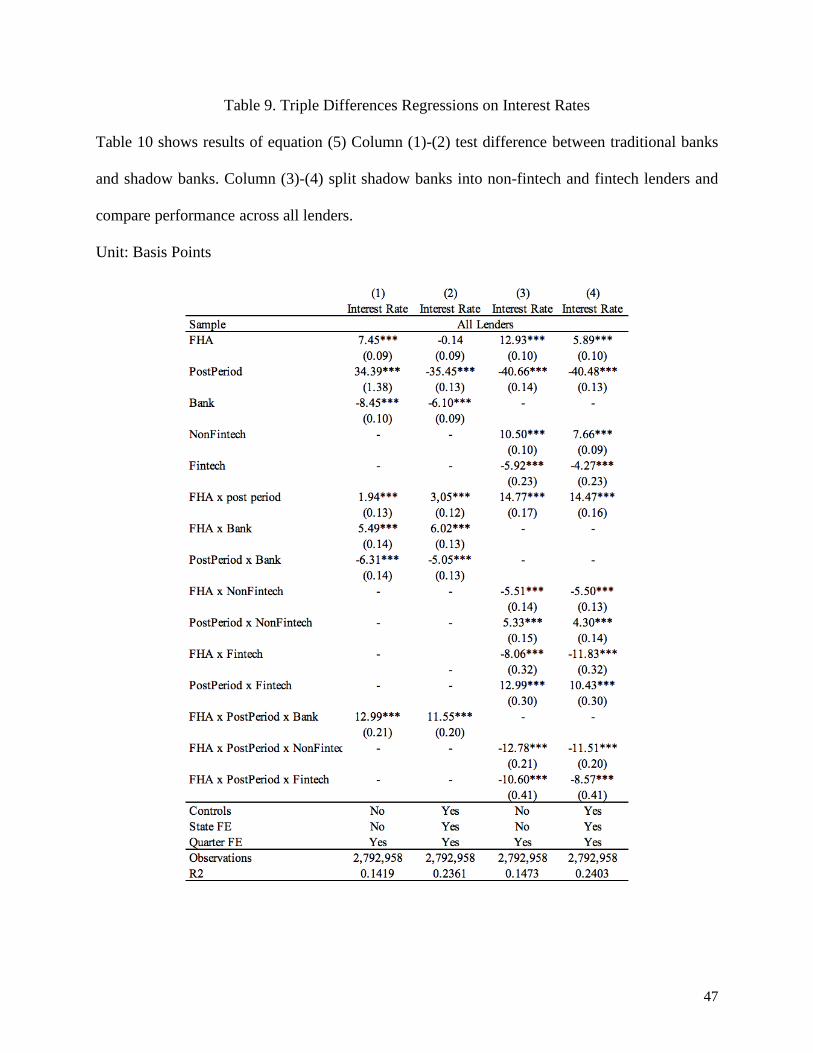
As presented in Table 9, in general, FHA loans’ interest rates are roughly 3.05 basis points
higher in post-period. Looking deeper to each type of lender, the coefficient of 𝐹𝐻𝐴 ×
𝑃𝑜𝑠𝑡𝑃𝑒𝑟𝑖𝑜𝑑 × 𝐵𝑎𝑛𝑘 shows that banks’ FHA loans interest rates are 11.5 basis points higher in
post-period. The cut in mortgage premium makes the loans become less expensive, so that lender
levied to raise prices. Thus, the increase in interest rate could be the pricing response of the bank.
In contrast, looking at the coefficients of 𝐹𝐻𝐴 × 𝑃𝑜𝑠𝑡𝑃𝑒𝑟𝑖𝑜𝑑 × 𝑁𝑜𝑛𝐹𝑖𝑛𝑡𝑒𝑐ℎ and
𝐹𝐻𝐴 × 𝑃𝑜𝑠𝑡𝑃𝑒𝑟𝑖𝑜𝑑 × 𝐹𝑖𝑛𝑡𝑒𝑐ℎ, I see that non-fintech and fintech’s FHA interest rates in post-
period are 11.5 and 8.5 basis points lower, respectively. This suggests that there’s more than 100%
26
pass through of the MIP cut to non-fintech and fintech borrowers since borrowers paid less on both
the MIP and the interest rate, reaping the full benefit of the 50-basis point decrease in the MIP and
extra benefit of lower interest rate. The decrease in interest rate is slightly lower for FHA loans
issued by fintech lenders.
Results for FHA loans issued by banks and shadow banks are consistent with hypothesis
(1) that banks had its own strategy to levy to raise price following the premium cut. On the other
hand, shadow banks interest rates are much lower following the MIP cut. Banks may value
profitability over market share, while shadow banks mainly focus on increasing their market share.
Interest rates for FHA loans issued by shadow banks decreased statistically, especially for
non-fintech loans. This does not seem to be consistent with the hypothesis (2) regarding relative
efficiency processing loans among lender type. I expect fintech to find it the least costly to take on
loans or that the magnitude of the decrease in interest rate for loans issued by fintech to be the
most comparing to banks because of the difference in regulatory arbitrage (of banks vs shadow
banks) and their advantage of technology arbitrage (of non-fintech vs fintech).
For hypothesis (3), my results for time-series changes in pre- vs post-period are slightly
different from a paper by Bhutta and Ringo (2019) due to differences in data source (HMDA vs
Ginnie Mae), sample construction (smaller lenders vs top 100 lenders), and testing method
(regression discontinuity vs triple-differences). Instead of full pass-through, my paper found that
there’s more than 100% pass-through of the MIP discount to shadow banks borrowers. Thus,
borrowers paid less on both the MIP and the interest rate.
This section helps answering research question (3) how non-bank lenders have been able
to take market share from traditional banks. Shadow banks, especially non-fintech, entice
borrowers by offering lower interest rates to bypass the MIP discount to the borrowers. Not only
27
do borrowers get benefits from the MIP cut, but they also receive the extra benefit of a lower
interest rate that shadow banks offer as well.
5.4. Loan Performance
Results from above show that shadow banks take away market share from banks. Does this
mean that they just approve loans to any borrowers, even riskier type of borrowers, in order to
increase market share? Moreover, since the cut in MIP easing the underwriting constraint and
improving borrowers’ DTI ratios, does this mean that the pool of new borrowers become riskier
and thus more likely default? Alternatively, if the cost of insurance has decreased, the marginal
new borrower, who previously found the insurance too expensive, are expected to be safer. I study
the riskiness of loans issued before and after the premium by each lender type using default rates
of the loan.
I investigate loan performance of loans issued prior and loans issued after the premium cut
using default rates accumulated from Ginnie Mae I MBS data. My sample includes all loans issued
in year 2015 for post-period sample and loans issued in year 2014 for pre-period sample. I then
observe the loan performance for 5 years after the loan was issued. If the loan was delinquent in
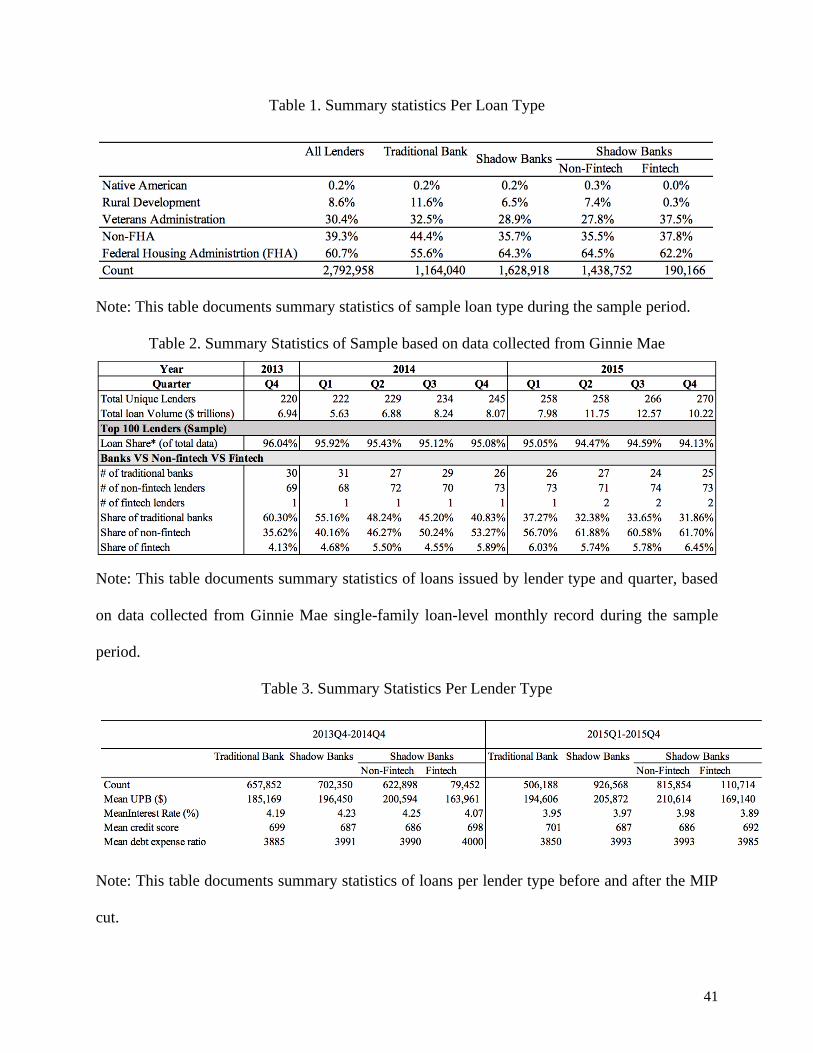
any given time within its first five year, then it’s classified as default. Figure 5 presents percentage
of loans issued in pre- and post-period defaulted per lender type. Loans issued in post-period have
higher default rates than loans issued in pre-period for all lender type. For loans issued in pre-
period, non-fintech loans had the lowest default rates of 6.4%, while fintech had the highest default
rates of over 15%. Looking at loans issued after the MIP cut, bank loans had the lowest default
rates of 13%, while fintech, again, had the highest default rates of 29%. The delinquency rates are
so much higher for loans issued in 2015 than in 2014 might be because the reduced MIP ceasing
28
the underwriting constraint since the MIP cut improves applicants’ DTI ratios make the pool of
borrowers become riskier.
I estimate differences in performance across lender type by running the following
regressions:
𝐷𝑒𝑓𝑎𝑢𝑙𝑡𝑖𝑗𝑠𝑡 = 𝛽1𝐹𝐻𝐴𝑖 + 𝛽2𝑃𝑜𝑠𝑡𝑃𝑒𝑟𝑖𝑜𝑑𝑡 + 𝛽3𝐵𝑎𝑛𝑘𝑗 + 𝛽4𝐹𝐻𝐴𝑖 × 𝑃𝑜𝑠𝑡𝑃𝑒𝑟𝑖𝑜𝑑𝑡
+ 𝛽5𝐹𝐻𝐴𝑖 × 𝐵𝑎𝑛𝑘𝑗 + 𝛽6𝑃𝑜𝑠𝑡𝑃𝑒𝑟𝑖𝑜𝑑𝑡 × 𝐵𝑎𝑛𝑘𝑗
+ 𝛽7𝐹𝐻𝐴𝑖 × 𝑃𝑜𝑠𝑡𝑃𝑒𝑟𝑖𝑜𝑑𝑡 × 𝐵𝑎𝑛𝑘𝑗 + 𝑋𝑡 𝑖 Γ + 𝛾𝑠 + 𝜖𝑖𝑗𝑠𝑡 (6)
𝐷𝑒𝑓𝑎𝑢𝑙𝑡𝑖𝑗𝑠𝑡 = 𝛽1𝑃𝑜𝑠𝑡𝑃𝑒𝑟𝑖𝑜𝑑𝑡 + 𝛽2𝑁𝑜𝑛𝐹𝑖𝑛𝑡𝑒𝑐ℎ𝑗 + 𝛽3𝐹𝑖𝑛𝑡𝑒𝑐ℎ𝑗
+ 𝛽4𝑃𝑜𝑠𝑡𝑃𝑒𝑟𝑖𝑜𝑑𝑡 × 𝑁𝑜𝑛𝐹𝑖𝑛𝑡𝑒𝑐ℎ𝑗 + 𝛽5𝑃𝑜𝑠𝑡𝑃𝑒𝑟𝑖𝑜𝑑𝑡 × 𝐹𝑖𝑛𝑡𝑒𝑐ℎ𝑗
+ 𝑋𝑡 𝑖 Γ + 𝛾𝑠 + 𝜖𝑖𝑗𝑠𝑡 (7)
Equation (6) and (7) are constructed to test how each lender type affects loan default rates.
𝐷𝑒𝑓𝑎𝑢𝑙𝑡 measures whether a mortgage 𝑖, originated by lender of type 𝑙, in state 𝑠, in month 𝑡, is
at least 1-month delinquent. 𝐵𝑎𝑛𝑘, 𝑁𝑜𝑛𝐹𝑖𝑛𝑡𝑒𝑐ℎ, and 𝐹𝑖𝑛𝑡𝑒𝑐ℎ are indicator variables whether the
loan is issued by a traditional bank, non-fintech, or fintech respectively. I control for the mortgage
interest rate, and borrowers’ characteristics, 𝑋𝑡 𝑖 , including LTV ratio, credit score, and debt-to-
expense ratio. I include state fixed effects, 𝛾𝑠, to control for variations in local conditions over
time. Note that Equation (6) is a triple-differences regression which makes 3 comparisons: banks
with non-banks, pre- with post-even, and FHA with non-FHA loans. Whereas Equation (7) which
compares among shadow bank lenders is a difference-in-difference regression on FHA loans only.
The assumption behind equation (7) is that there are no differential pre-trends in default rates, as
there are in total lending volume.
Table 10 presents the results. Looking at the coefficient on 𝐹𝐻𝐴 × 𝑃𝑜𝑠𝑡𝑃𝑒𝑟𝑖𝑜𝑑 × 𝐵𝑎𝑛𝑘 𝑖𝑛
column (1), I find that FHA loans issued by bank lenders in the post-period are 0.2 percentage
29
points less likely to default than shadow bank borrowers. Column (2) adds borrower controls and
state fixed effects. The effect increases slightly to 0.21 percentage points but remains statistically
significant. According to Column (4), the effect is mostly driven by fintech shadow bank lenders.
The coefficient on 𝑃𝑜𝑠𝑡𝑃𝑒𝑟𝑖𝑜𝑑 × 𝐹𝑖𝑛𝑡𝑒𝑐ℎ shows that fintech borrowers default at about 0.3
percentage points higher than banks for loans that were issued in post-period. On the other hand,
results for non-fintech loans indicate that non-fintech borrowers have slightly lower default rates
than traditional bank borrowers. Non-fintech are able to take away demand while still able to
screen relatively safer borrowers than fintech’s. This could be a result from the business
differences of fintech and non-fintech itself that non-fintech use human involvement in screening
their borrowers, thus allowing them to evaluate applicants’ characters that fintech’s algorithm
might not be able to.
Results from this section help shed lights on research question (1) who borrow from non-
fintech and fintech. I found that bank borrowers are less likely to default than shadow bank
borrowers. This might be because the majority of shadow banks loans are FHA loans whose target
customers are borrowers who have lower income and credit score. This might also help answering
to research question (3) that shadow banks having lower constraint on approving loans (such as
lower credit score and income minimum) than banks do allow them to lend to borrowers that banks
cannot accommodate and thus are able increase and take market share from banks.
6. Conclusion
My paper use the 2015 FHA MIP cut as a shock to study banks’ and shadow banks’ role
in residential mortgage market and how shadow banks increase their market share or take away
the mortgage demand from traditional banks. I found that riskier borrowers such as borrowers with

30
lower credit score and higher debt-expense ratio borrow from shadow banks. Moreover, shadow
bank borrowers are borrowers that banks cannot accommodate or do not lend to.
I found that FHA banks’ loan volume decreased significantly while shadow banks
increased their lending following the MIP cut. This is the case because shadow banks’ target
borrowers are considered to be riskier and thus, they are much more active in the FHA market.
Comparing across all lender type, both FHA non-fintech and fintech’s loan volume are higher in
period-period but the magnitude is slightly less for fintech.
I found that non-banks lenders, especially fintech, issued more loans to serve new demand
and acquire the losing demands that have lost contribute to the rise of shadow banks. Using data
per quarter, per lender type, and per loan type, the results for total loan volume and number of
loans issued both suggests that non-banks took away the borrowers from banks. The decrease in
banks’ number of loans seems to be almost perfectly offset by the gain in lending that shadow
banks received.
Moreover, shadow banks are able to take market share from traditional banks by having
lower interest rates relatively to banks. I found that bank’s interest rates are 11.5 basis points higher
in post-period. The cut in mortgage premium makes the loan become less expensive, so that lender
levied to raise price. This is the pricing response by the bank that they value profitability over
market share. Interest rates for non-fintech and fintech borrowers decreased by 11 and 8 basis
points, respectively. This implies that more than 100% pass-through of the MIP discount to shadow
bank borrowers since borrowers paid less on both the MIP and the interest rate, reaping the full
benefit of the 50-basis point decrease in the MIP and extra benefit of lower interest rate.
Since shadow banks increase the market share by taking demand away from banks, are
they able to do this because they just approve loans to any borrowers I found that FHA loans issued
31
by bank lenders in post-period are slightly less likely to default than shadow bank borrowers.
Comparing among shadow banks, fintech shadow banks borrowers default at a higher rate while
non-fintech borrowers have lower default rate than traditional banks for loans that were issued in
post-period. Non-fintech are able to take away demand while still able to screen relatively safer
borrowers than fintech’s This could be because of the difference in business nature of fintech and
non-fintech itself that non-fintech are able to use human involvement in screening their borrowers.
In conclusion, non-banks are disproportionately benefited from the MIP cut because they
are more likely to accommodate the riskier group of borrowers that traditional banks less focus on.
Banks’ strategy might be cream skimming safer group of borrowers. Shadow banks are a main
player in the market, filling in the lending gap that may not have been otherwise served by banks.
Non-bank lenders are able to lend more to risky borrowers for a few reasons including regulatory
arbitrage and their business models.
32
7. Reference
Bartlett, R., Morse, A., Stanton, R., and Wallace, N., 2018. Consumer Lending Discrimination in
the Era of FinTech. Unpublished working paper. University of California, Berkeley.
Bhutta, N., and Ringo, D., 2019. The Effect of Interest Rates on Home Buying: Evidence from a
Discontinuity in Mortgage Insurance Premiums, Available at SSRN:
https://papers.ssrn.com/sol3/papers.cfm?abstract_id=3029736
Buchak, G., Matvos, G., Piskorski, T., and Seru, A., 2018. Fintech-regulatory arbitrage and the
rise of shadow banking, Journal of Financial Economics 130, 453-483.
Buchak, G., Matvos, G., Piskorski, T., and Seru, A., 2020. Beyond the Balance Sheet Model of
Banking: Implications for Bank Regulation and Monetary Policy, NBER Working Paper.
Congressional Research Service (CRS), 2019. FHA-Insured Home Loans: An Overview,
Available at https://fas.org/sgp/crs/misc/RS20530.pdf
Davis, M. A. and Oliner, S. D. and Peter, T. and Pinto, E., 2018. The Impact of Federal Housing
Policy on Housing Demand and Homeownership: Evidence from a Quasi-Experiment. Available
at SSRN: https://ssrn.com/abstract=3099665
Di Maggio, M. and Yao, V., 2020. Fintech Borrowers: Lax-Screening or Cream-Skimming?
Available at SSRN: https://ssrn.com/abstract=3224957 or http://dx.doi.org/10.2139/ssrn.3224957
Fuster, A., Goldsmith-Pinkham, P., Ramadorai, T., and Walther, A., 2020. Predictably Unequal?
The Effects of Machine Learning on Credit Markets. Available at SSRN:
https://ssrn.com/abstract=3072038
33
Fuster, A., Plosser, M., Schnabl, P., and Vickery, J., 2018. The role of technology in mortgage
lending, NBER Working Paper.
Gopal, M. and Schnabl, P., 2020. The Rise of Finance Companies and FinTech Lenders in Small
Business Lending. NYU Stern School of Business, Available at
SSRN: https://ssrn.com/abstract=3600068
Gulamhuseinwala, I., and Bull, T., and Lewis, S., 2015. FinTech is Gaining Traction and Young,
High-Income Users are the Early Adopters. Journal of Financial Perspectives, Vol. 3, No. 3,
2015, Available at SSRN: https://ssrn.com/abstract=3083976
Jagtiani, J. A., Lambie-Hanson, L., and Lambie-Hanson, T., 2019. Fintech Lending and
Mortgage Credit Access. FRB of Philadelphia Working Paper No. 19-47, Available at
SSRN: https://ssrn.com/abstract=3494195 or http://dx.doi.org/https://doi.org/10.21799/frbp.wp.2
019.47
Olden, A. and Moen, J., 2020. The Triple Difference Estimator. NHH Dept. of Business and
Management Science Discussion Paper No. 2020/1, Available at
SSRN: https://ssrn.com/abstract=3582447 or http://dx.doi.org/10.2139/ssrn.3582447
Navaretti, G. B., Calzolari, G., Mansilla-Fernandez, J. M. and Pozzolo, A. F., 2018. Fintech and
Banking. Friends or Foes?. Available at
SSRN: https://ssrn.com/abstract=3099337 or http://dx.doi.org/10.2139/ssrn.3099337
Thakor, A. V., 2019. Fintech and banking: What do we know? Journal of Financial
Intermediation. Available at SSRN: https://ssrn.com/abstract=3429223
34
Appendix
Appendix A. list of lenders and its classification in the sample
Rank Lender Name Category Loan Volume
(in Bn)
1 WELLS FARGO HOME MORTGAGE, INC Bank 13,267
2 PENNYMAC LOAN SERVICES, LLC Non-Fintech 5,352
3 FREEDOM MORTGAGE CORPORATION Non-Fintech 4,341
4 QUICKEN LOANS, INC Fintech 3,922
5 JPMORGAN CHASE BANK, N A Bank 3,211
6 U S BANK Bank 3,023
7 FLAGSTAR BANK Bank 1,665
8 PACIFIC UNION FINANCIAL Non-Fintech 1,659
9 USAA FEDERAL SAVINGS BANK Bank 1,477
10 BANK OF AMERICA, N A Bank 1,396
11 CALIBER HOME LOANS INC Non-Fintech 1,344
12 LOANDEPOT COM, LLC Non-Fintech 1,320
13 STONEGATE MORTGAGE CORPORATION Non-Fintech 1,269
14 SUN WEST MORTGAGE CO INC Non-Fintech 1,115
15 CMG MORTGAGE INC Non-Fintech 1,097
16 STEARNS LENDING INC Non-Fintech 1,085
17 THE MONEY SOURCE, INC Non-Fintech 1,075
18 PLAZA HOME MORTGAGE, INC Non-Fintech 1,013
19 AMERIHOME MORTGAGE COMPANY LLC Non-Fintech 978
20 NATIONSTAR MORTGAGE LLC Non-Fintech 975
21 FRANKLIN AMERICAN MORTGAGE COMPANY Non-Fintech 831
22 NAVY FEDERAL CREDIT UNION Bank 763
23 BRANCH BANKING AND TRUST COMPANY Bank 735
24 GUILD MORTGAGE COMPANY Non-Fintech 683
25 MORTGAGE RESEARCH CENTER, LLC Non-Fintech 646
26 FIRST GUARANTY MORTGAGE CORPORATION Non-Fintech 641
27 HOMEBRIDGE FINANCIAL SERVICES INC Non-Fintech 636
28 CARRINGTON MORTGAGE SERVICES, LLC Non-Fintech 591
29 GREEN TREE SERVICING, LLC Non-Fintech 572
30 SUNTRUST MORTGAGE CORPORATION Non-Fintech 566
31 BROKERS SOLUTIONS INC Non-Fintech 557
32 PRIMELENDING, A CAPITAL COMPANY Non-Fintech 504
33 PNC BANK, NA Bank 502
34 PROSPECT MORTGAGE LLC Non-Fintech 467
35 OCWEN LOAN SERVICING, LLC Non-Fintech 457
35
Rank Lender Name Category Loan Volume
(in Bn)
36 DITECH FINANCIAL LLC Non-Fintech 432
37 M&T BANK Bank 426
38 NEW PENN FINANCIAL LLC Non-Fintech 426
39 CITIMORTGAGE, INC Bank 419
40 PHH MORTGAGE CORPORATION Non-Fintech 395
41 LAKEVIEW LOAN SERVICING, LLC Non-Fintech 387
42 FAIRWAY INDEPENDENT MORTGAGE CORPORATION Non-Fintech 356
43 AMERICAN FINANCIAL RESOURCES, INC Non-Fintech 354
44 360 MORTGAGE GROUP LLC Non-Fintech 349
45 BOKF, NA Bank 328
46 PMORGAN CHASE BANK, N A Bank 322
47 PACIFIC TRUST BANK Bank 309
48 DHI MORTGAGE COMPANY Non-Fintech 301
49 MIDFIRST BANK Bank 290
50 UNIVERSAL AMERICAN MORTGAGE COMPANY Non-Fintech 285
51 HOMESTREET BANK Bank 280
52 FIFTH THIRD MORTGAGE COMPANY Bank 277
53 EMBRACE HOME LOANS, INC Non-Fintech 267
54 PINNACLE CAPITAL MORTGAGE Non-Fintech 259
55 CORNERSTONE HOME LENDING, INC Non-Fintech 258
56 NEW DAY FINANCIAL, LLC Non-Fintech 244
57 GATEWAY MORTGAGE GROUP, LLC Non-Fintech 238
58 PMAC LENDING SERVICES INC Non-Fintech 236
59 IMPAC MORTGAGE Non-Fintech 227
60 PINGORA LOAN SERVICING LLC Non-Fintech 226
61 UNITED SECURITY FINANCIAL CORPORATION Non-Fintech 215
62 REGIONS BANK Bank 202
63 IDAHO HOUSING AND FINANCE ASSOCIATION Non-Fintech 187
64 EVERBANK Bank 187
65 UNITED SHORE FINANCIAL SERVICES Non-Fintech 187
66 ALABAMA HOUSING FINANCE AUTHORITY Non-Fintech 185
67 FIRST MORTGAGE CORPORATION Non-Fintech 183
68 MOVEMENT MORTGAGE LLC Fintech 177
69 SWBC MORTGAGE CORPORATION Non-Fintech 174
70 BAY EQUITY LLC Non-Fintech 167
71 W J BRADLEY MORTGAGE CAPITAL LLC Non-Fintech 163
72 BANCO POPULAR DE PUERTO RICO Bank 161
73 NEW FREEDOM MORTGAGE CORPORATION Non-Fintech 155
36
Rank Lender Name Category Loan Volume
(in Bn)
74 THE HUNTINGTON MORTGAGE COMPANY Bank 152
75 NATIONAL BANK OF KANSAS CITY Bank 150
76 NEW AMERICAN MORTGAGE LLC Non-Fintech 145
77 VILLAGE CAPITAL & INVESTMENT Non-Fintech 141
78 SUMMIT FUNDING INC Non-Fintech 141
79 ENVOY MORTGAGE, LTD Non-Fintech 135
80 FIRST OF AMERICA LOAN SERVICES,INC Non-Fintech 133
81 MID AMERICA MORTGAGE Non-Fintech 127
82 UMPQUA BANK Bank 124
83 PULTE MORTGAGE CORPORATION Non-Fintech 117
84 PLATINUM MORTGAGE INC Non-Fintech 113
85 LAND/HOME FINANCIAL SERVICES Non-Fintech 111
86 NATIONS DIRECT MORTGAGE LLC Non-Fintech 107
87 MB FINANCIAL BANK Bank 107
88 MORTGAGE SOLUTIONS OF CO LLC Non-Fintech 103
89 CIS FINANCIAL SERVICES INC Non-Fintech 101
90 UNION HOME MORTGAGE CORP Non-Fintech 101
91 FBC MORTGAGE LLC Non-Fintech 101
92 COMMUNITY TRUST BANK Bank 98
93 NATIONS LENDING CORPORATION Non-Fintech 93
94 CARDINAL FINANCIAL COMPANY Non-Fintech 92
95 FIDELITY BANK Bank 92
96 MOUNTAIN WEST FINANCIAL, INC Non-Fintech 89
97 GMFS LLC Non-Fintech 89
98 HOME POINT FINANCIAL CORPORATION Non-Fintech 88
99 VIRGINIA HOUSING DEVELOPMENT AUTHORITY Non-Fintech 85
100 CENTURY MORTGAGE COMPANY Non-Fintech 84
101 WESTSTAR MORTGAGE, INC Non-Fintech 79
102 UTAH HOUSING CORPORATION Non-Fintech 77
103 PRIMARY RESIDENTIAL MORTGAGE, INC Non-Fintech 70
104 COLE TAYLOR BANK Bank 67
105 EVERGREEN MONEYSOURCE MORTGAGE COMPANY Non-Fintech 64
106 AMERIFIRST FINANCIAL CORPORATION Non-Fintech 63
107 GATEWAY FUNDING DIVERSIFIED MORTGAGE SERVICES Non-Fintech 59
108 REAL ESTATE MORTGAGE NETWORK Non-Fintech 56
109 PLANET HOME LENDING LLC Non-Fintech 55
110 MAVERICK FUNDING CORPORATION Non-Fintech 50
111 COLORADO HOUSING AND FINANCE AUTHORITY Non-Fintech 49
37
Rank Lender Name Category Loan Volume
(in Bn)
112 BANK OF THE WEST Bank 48
113 EXCEL MORTGAGE SERVICING Non-Fintech 44
114 CROSSCOUNTRY MORTGAGE INC Non-Fintech 42
115 ALASKA USA FEDERAL CREDIT UNION Bank 38
116 CASTLE & COOKE MORTGAGE LLC Non-Fintech 37
117 NORTH AMERICAN SAVINGS BANK Bank 35
118 ARVEST MORTGAGE COMPANY Bank 34
119 GUARANTY TRUST COMPANY Bank 33
120 FINANCE OF AMERICA MORTGAGE LLC Non-Fintech 31
121 COLONIAL SAVINGS, FA Bank 26
122 PARAMOUNT RESIDENTIAL MORTGAGE GROUP Non-Fintech 26
123 AMERIFIRST HOME MORTGAGE Non-Fintech 25
124 TRUSTMARK NATIONAL BANK Bank 24
125 DORAL BANK Bank 24
126 PODIUM MORTGAGE CAPITAL LLC Non-Fintech 21
127 STERLING SAVINGS BANK Bank 15
128 HOMESTEAD FUNDING CORPORATION Non-Fintech 14
129 TOWNE MORTGAGE COMPANY Non-Fintech 14
130 SOUTHWEST STAGE FUNDING, LLC Non-Fintech 14
131 MORTGAGE INVESTORS CORPORATION Non-Fintech 13
132 ATLANTIC BAY MORTGAGE GROUP Non-Fintech 13
133 CONTINENTAL HOME LOANS, INC Non-Fintech 13
134 J G WENTWORTH HOME LENDING INC Non-Fintech 13
135 CHERRY CREEK MORTGAGE CO INC Non-Fintech 13
136 TRUHOME SOLUTIONS, LLC Non-Fintech 8
137 FIRST FEDERAL BANK OF FLORIDA Bank 8
138 RBS CITIZENS, N A Bank 8
139 FIRST AMERICAN MORTGAGE TRUST Non-Fintech 7
140 CAPITAL MORTGAGE SERVICES OF TEXAS Non-Fintech 7
141 MICHIGAN MUTUAL INC Non-Fintech 6
38
Figure 1. Number of Loans Per Loan Type
Figure 2. Differences between FHA and non-FHA lending Volume
Note: This figure shows the differences in FHA and non-FHA lending volume per lender type in
absolute terms during the sample period.
-0.4
-0.2
0
0.2
0.4
0.6
0.8
1
1.2
1.4
1.6
-5
0
5
10
15
20
Bill
ion
s
Bill
ion
s
Bank Non-fintech Fintech
39
Figure 3. Number of Loans for each Loan Type & Lender Type
Panel A: Loans issued by Bank
Panel B: Loans issued by Non-Fintech
Panel C: Loans issued by Fintech
40
Figure 4. Parallel Trend Assumption
Note: This figure shows the sample average loan amount by FHA and non-FHA loans during the
sample period. The vertical line represents the quarter that the MIP cut occurred.
Figure 5. Percentage of Loans Defaulted
Note: This table document percentage of loans issued in pre- and post-period defaulted per lender
type. For example, the percentage of bank loans issued in pre-period defaulted is calculated by
using number of bank loans issued in pre-period defaulted divided by number of total bank loans.
41
Table 1. Summary statistics Per Loan Type
Note: This table documents summary statistics of sample loan type during the sample period.
Table 2. Summary Statistics of Sample based on data collected from Ginnie Mae
Note: This table documents summary statistics of loans issued by lender type and quarter, based
on data collected from Ginnie Mae single-family loan-level monthly record during the sample
period.
Table 3. Summary Statistics Per Lender Type
Note: This table documents summary statistics of loans per lender type before and after the MIP
cut.
42
Table 4. Summary Statistics of FHA and Non-FHA loans, Pre- and Post-Period
Note: This table document summary statistics of each loan type before and after the premium cut.
Table 5. Summary Statistics of Loan Type, per Lender Type, Pre- and Post-Period
Note: This table document summary statistics of each loan type issued by each lender type before
and after the premium cut.
Table 6. Summary Statistics of Loan Performance Per Lender Type
Note: This table document summary statistics of performance of loans that were issued in pre- and
post-period by each lender type.
43
Table 7. Triple Differences Estimators
Table 7 shows results of equation (1) using Ginnie Mae loan data from Q4/2013 to Q4/2015.
Column (1)-(2) test difference between traditional banks and shadow banks. Column (3)-(4) split
shadow banks into non-fintech and fintech lenders and compare performance across all lenders.
44
Table 8. Loan Type – Lender Type – Quarter Regressions
Table 8 shows the result of equation (2)-(4) using Ginnie Mae issuance data from 2013/Q4 to
2015/Q4. Panel A shows results for total loan volume. Panel B shows results for average loan
volume. Panel C shows results for number of loans. Column (1)-(2) test differences between
traditional banks and shadow banks. Column (3)-(4) split shadow banks into non-fintech shadow
banks and fintech shadow banks and compare results across all lender types. Column (1) and (3)
controls for only borrower characteristics. Column (2) and (4) have quarter fixed effects along
with controls for borrower characteristics.
45
46
47
Table 9. Triple Differences Regressions on Interest Rates
Table 10 shows results of equation (5) Column (1)-(2) test difference between traditional banks
and shadow banks. Column (3)-(4) split shadow banks into non-fintech and fintech lenders and
compare performance across all lenders.
Unit: Basis Points
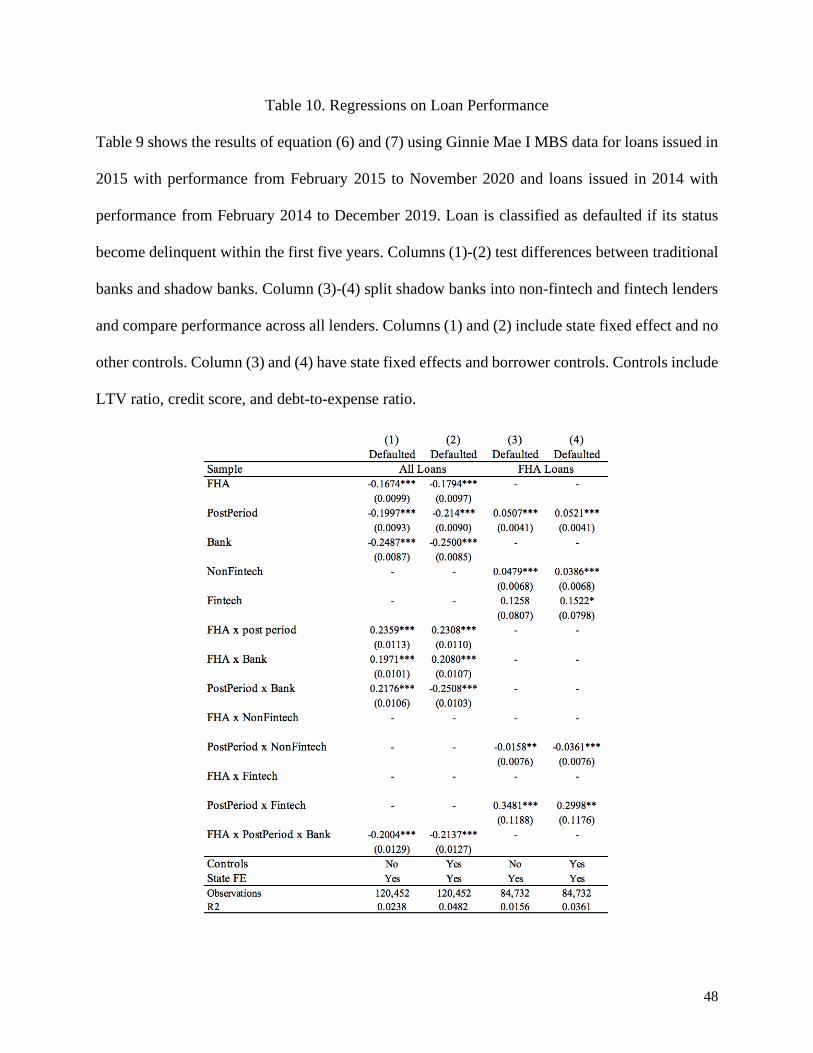
48
Table 10. Regressions on Loan Performance
Table 9 shows the results of equation (6) and (7) using Ginnie Mae I MBS data for loans issued in
2015 with performance from February 2015 to November 2020 and loans issued in 2014 with
performance from February 2014 to December 2019. Loan is classified as defaulted if its status
become delinquent within the first five years. Columns (1)-(2) test differences between traditional
banks and shadow banks. Column (3)-(4) split shadow banks into non-fintech and fintech lenders
and compare performance across all lenders. Columns (1) and (2) include state fixed effect and no
other controls. Column (3) and (4) have state fixed effects and borrower controls. Controls include
LTV ratio, credit score, and debt-to-expense ratio.


![A Comparison of the US and European Shadow Banking Systems ... · Definitions • Mculley ~ î ì ì ó : ^unlike regulated banks […], unregulated shadow banks fund themselves with](https://img.pdfslide.net/doc/110x75/5e37ea71309dfc2a7113eb46/a-comparison-of-the-us-and-european-shadow-banking-systems-definitions-a-mculley.jpg)