Embed Size (px)
DESCRIPTION
BAR GRAPHS. What is a bar graph?. A bar graph is a graphical way of showing comparisons by using rectangular shapes with lengths proportional to the measure of what is being compared. Example. - PowerPoint PPT Presentation
Citation preview
What is a bar graph?A bar graph is a graphical way of showing comparisons by using rectangular shapes with lengths proportional to the measure of what is being compared.
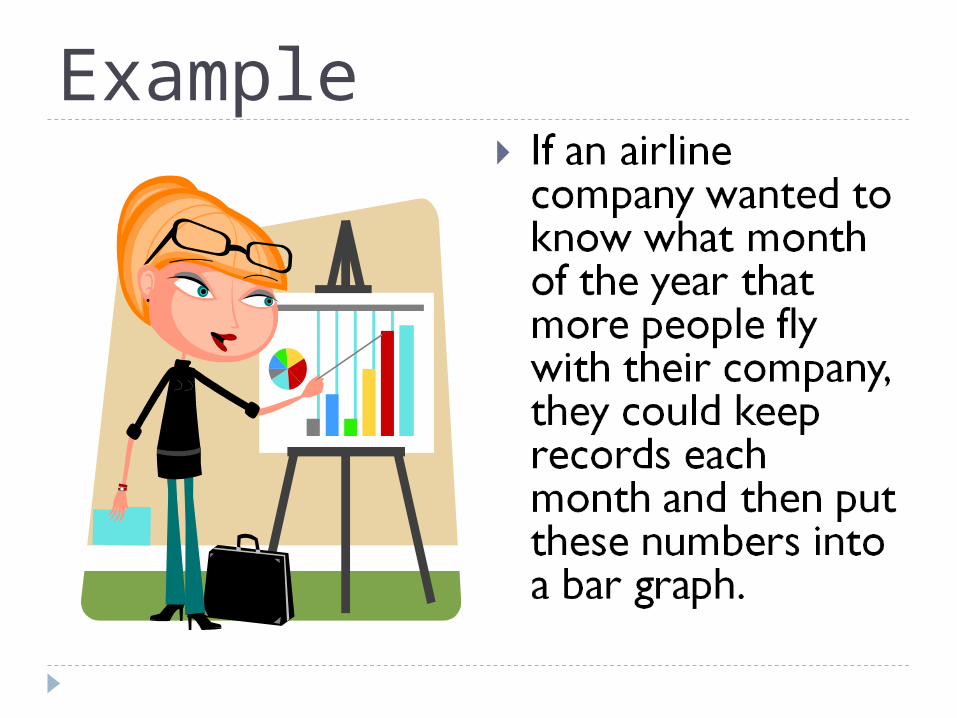
Example
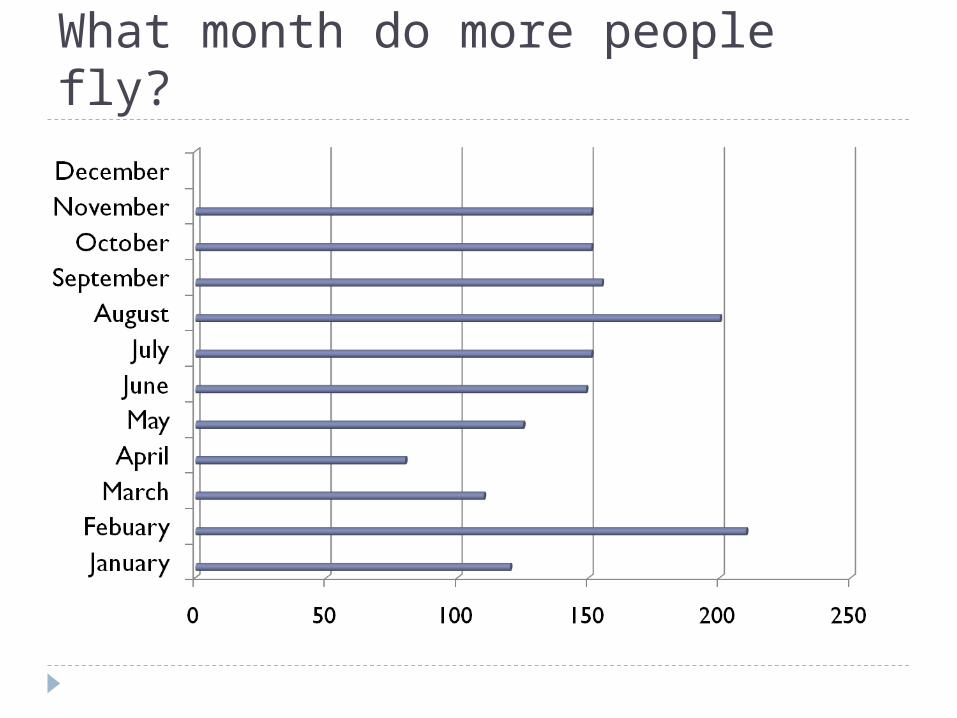
What month do more people fly?
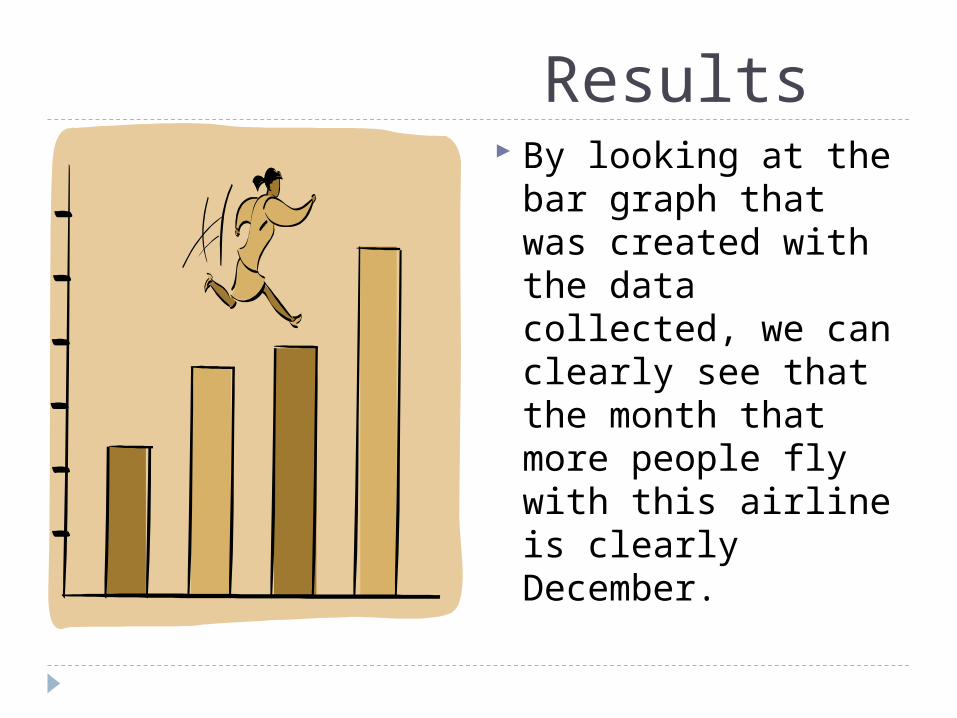
Results By looking at the
bar graph that was created with the data collected, we can clearly see that the month that more people fly with this airline is clearly December.
Can you make a bar graph?
You must first have information to put into the bar graph.
How will each breathe you blow into the balloon affect how big around the balloon gets?
Review How can a bar graph be useful?
Can anyone make a bar graph?
What must you have in order to make a bar graph?
Resources Students may visit
http://nces.ed.gov/ncskidsgraphing