Embed Size (px)
Citation preview
Barbara Mascialino, INFN Genova
An update on the An update on the Goodness of Fit Goodness of Fit
Statistical ToolkitStatistical Toolkit
B. Mascialino, A. Pfeiffer, M.G. Pia, A. Ribon, P. Viarengo
http://www.ge.infn.it/geant4/analysis/HEPstatistics
http://www.ge.infn.it/statisticaltoolkit
4th Geant4 Space Users’ Workshop
Barbara Mascialino, INFN Genova
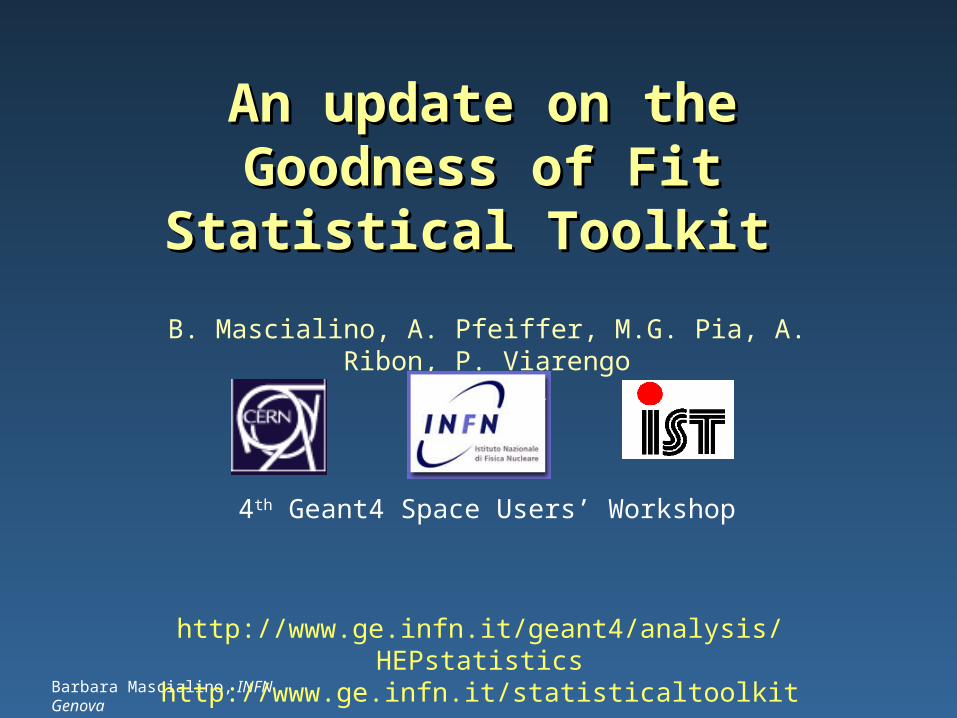
Goodness of Fit testing
Regression testing– Throughout the software life-cycle
Online DAQ– Monitoring detector behaviour w.r.t. a reference
Simulation validation– Comparison with experimental data
Reconstruction– Comparison of reconstructed vs. expected distributions
Physics analysis– Comparison with theoretical distributions– Comparisons of experimental distributions
Goodness-of-fitGoodness-of-fit testing is the mathematical foundationmathematical foundation for the comparison of data distributionscomparison of data distributions
THEORETICALDISTRIBUTION
SAMPLE
ONE-SAMPLE PROBLEMONE-SAMPLE PROBLEM
SAMPLE 2SAMPLE 1
TWO-SAMPLE PROBLEMTWO-SAMPLE PROBLEM
Use cases in experimental physics
Barbara Mascialino, INFN Genova
G.A.P Cirrone, S. Donadio, S. Guatelli, A. Mantero, B. Mascialino, S. Parlati, M.G. Pia, A. Pfeiffer, A. Ribon, P. Viarengo
“A Goodness-of-Fit Statistical Toolkit”IEEE- Transactions on Nuclear Science (2004), 51 (5): 2056-2063.
B. Mascialino, M.G. Pia, A. Pfeiffer, A. Ribon, P. Viarengo“New developments of the Goodness-of-Fit Statistical Toolkit”
IEEE- Transactions on Nuclear Science (2006), 53 (6), to be published
http://www.ge.infn.it/statisticaltoolkit/
Barbara Mascialino, INFN Genova
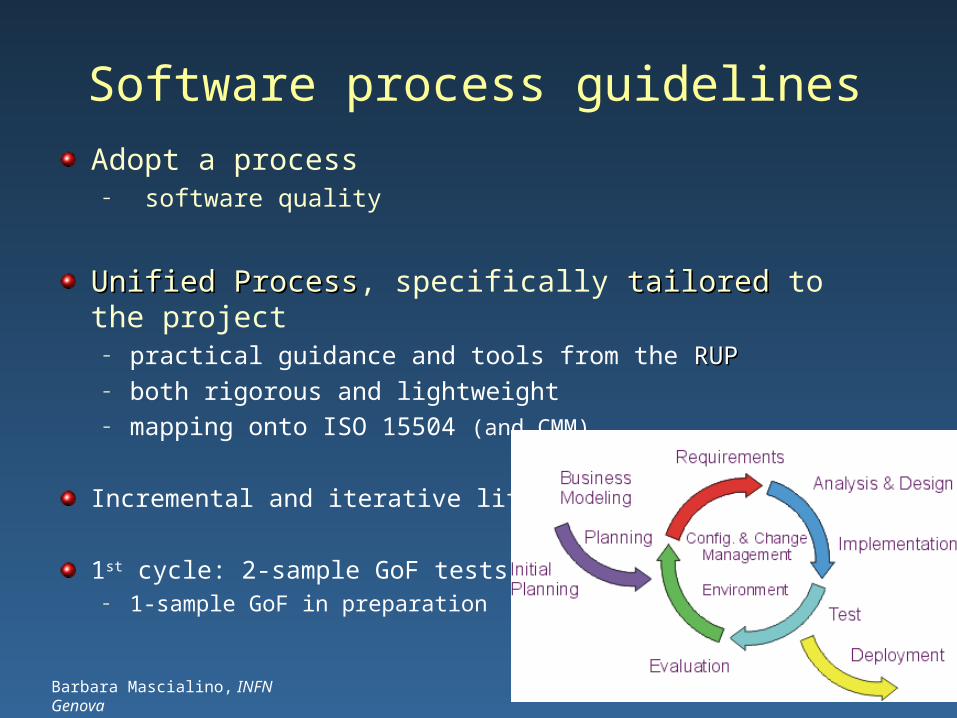
Software process guidelines
Adopt a process– software quality
Unified ProcessUnified Process, specifically tailoredtailored to the project– practical guidance and tools from the RUPRUP– both rigorous and lightweight– mapping onto ISO 15504 (and CMM)
Incremental and iterative life-cycle
1st cycle: 2-sample GoF tests– 1-sample GoF in preparation
Barbara Mascialino, INFN Genova
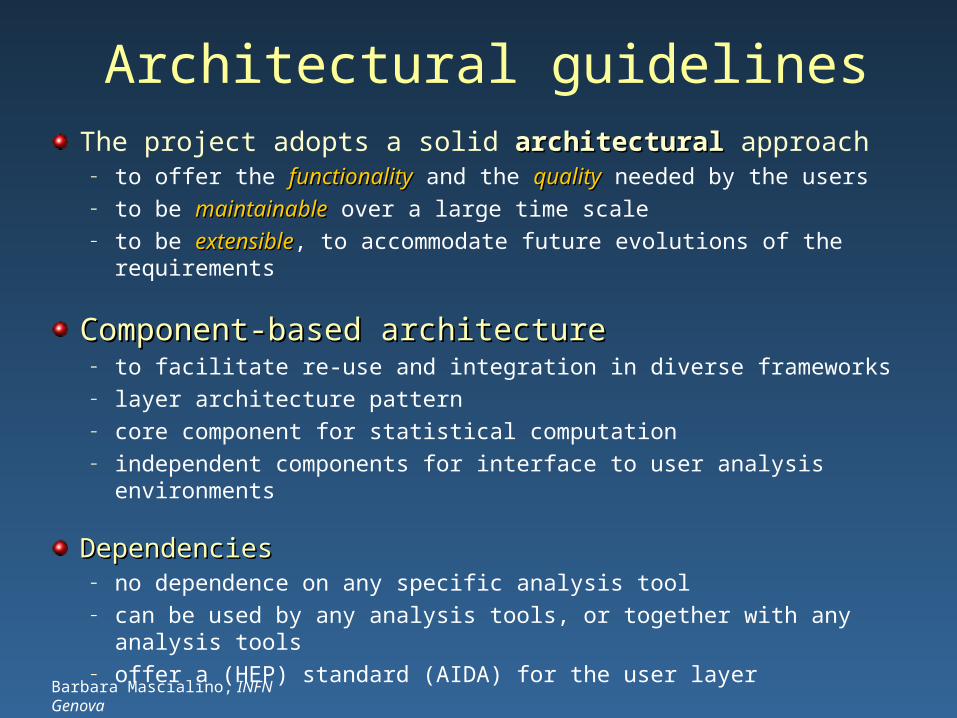
Architectural guidelinesThe project adopts a solid architectural architectural approach
– to offer the functionalityfunctionality and the qualityquality needed by the users– to be maintainablemaintainable over a large time scale– to be extensibleextensible, to accommodate future evolutions of the requirements
Component-based architectureComponent-based architecture– to facilitate re-use and integration in diverse frameworks– layer architecture pattern– core component for statistical computation– independent components for interface to user analysis environments
DependenciesDependencies– no dependence on any specific analysis tool– can be used by any analysis tools, or together with any analysis tools– offer a (HEP) standard (AIDA) for the user layer
Barbara Mascialino, INFN Genova
Barbara Mascialino, INFN Genova
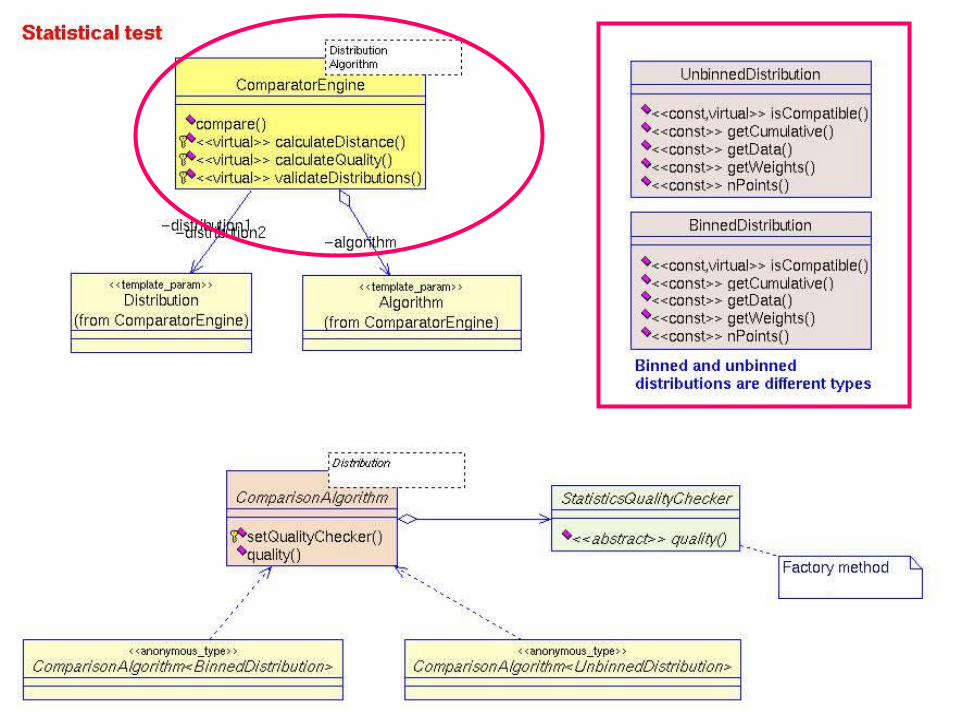
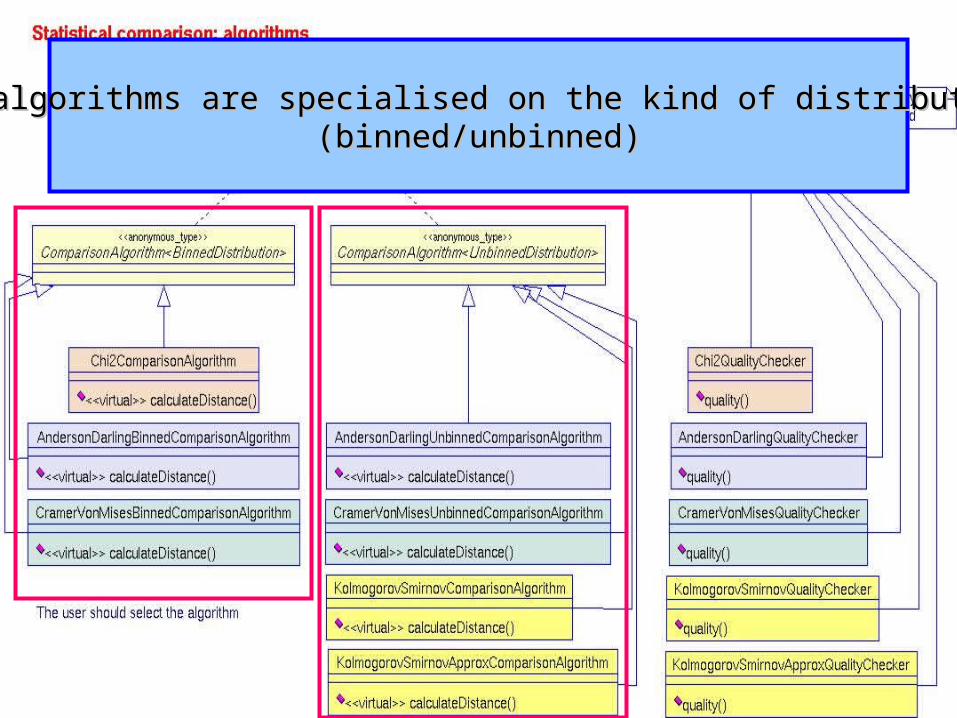
The algorithms are specialised on the kind of distribution The algorithms are specialised on the kind of distribution (binned/unbinned)(binned/unbinned)
Barbara Mascialino, INFN Genova
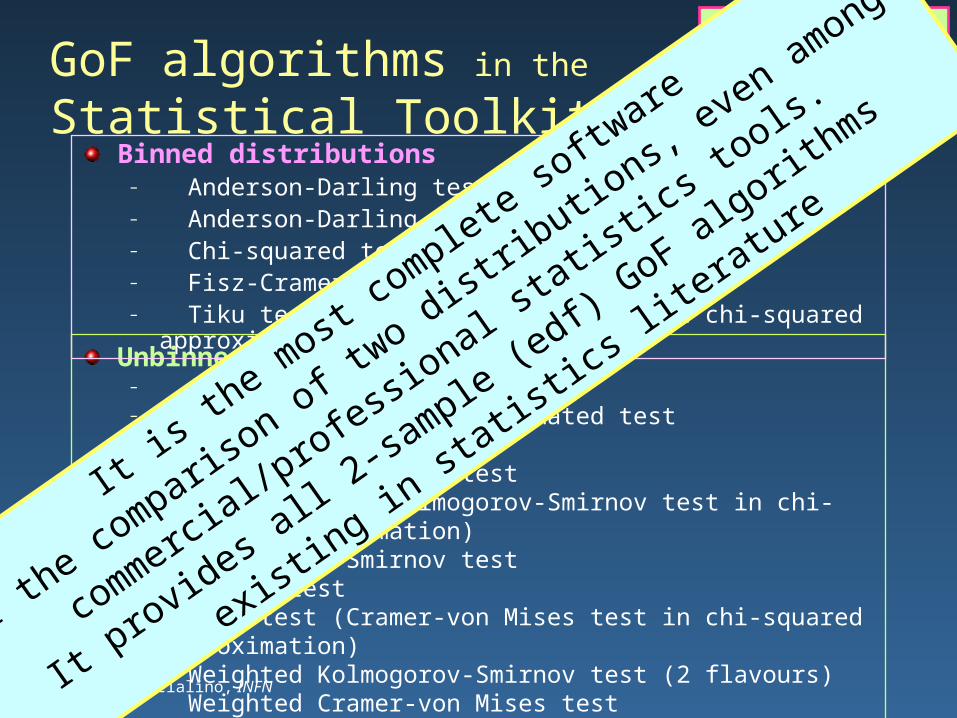
GoF algorithms in the Statistical Toolkit
Unbinned distributions – Anderson-Darling test– Anderson-Darling approximated test– Cramer-von Mises test– Generalised Girone test– Goodman test (Kolmogorov-Smirnov test in chi-squared approximation)– Kolmogorov-Smirnov test– Kuiper test– Tiku test (Cramer-von Mises test in chi-squared approximation)– Weighted Kolmogorov-Smirnov test (2 flavours)– Weighted Cramer-von Mises test
TWO-SAMPLE PROBLEM
Binned distributions – Anderson-Darling test– Anderson-Darling approximated test– Chi-squared test – Fisz-Cramer-von Mises test– Tiku test (Cramer-von Mises test in chi-squared approximation)
It is t
he most
complete so
ftware
for the co
mparison of tw
o distrib
utions,
even among
commerci
al/profess
ional statis
tics t
ools.
It provid
es all 2
-sample (e
df) GoF algorith
ms
existin
g in st
atistic
s lite
rature
Barbara Mascialino, INFN Genova
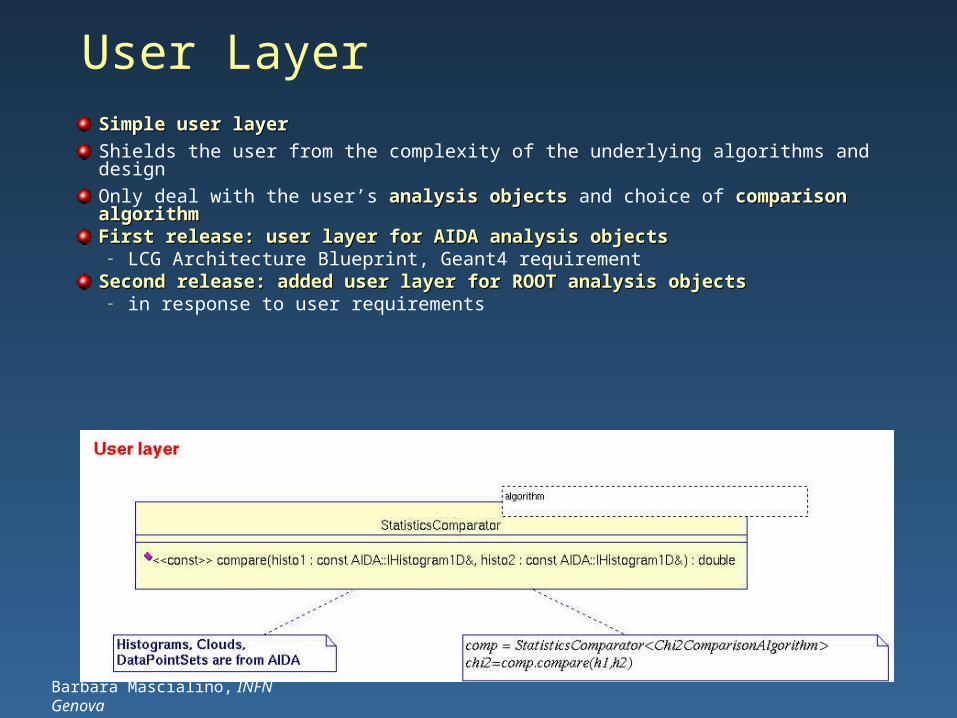
Simple user layerSimple user layer
Shields the user from the complexity of the underlying algorithms and design
Only deal with the user’s analysis objectsanalysis objects and choice of comparison algorithmcomparison algorithmFirst release: user layer for AIDA analysis objectsFirst release: user layer for AIDA analysis objects
– LCG Architecture Blueprint, Geant4 requirementSecond release: added user layer for ROOT analysis objectsSecond release: added user layer for ROOT analysis objects
– in response to user requirements
User Layer
Barbara Mascialino, INFN Genova
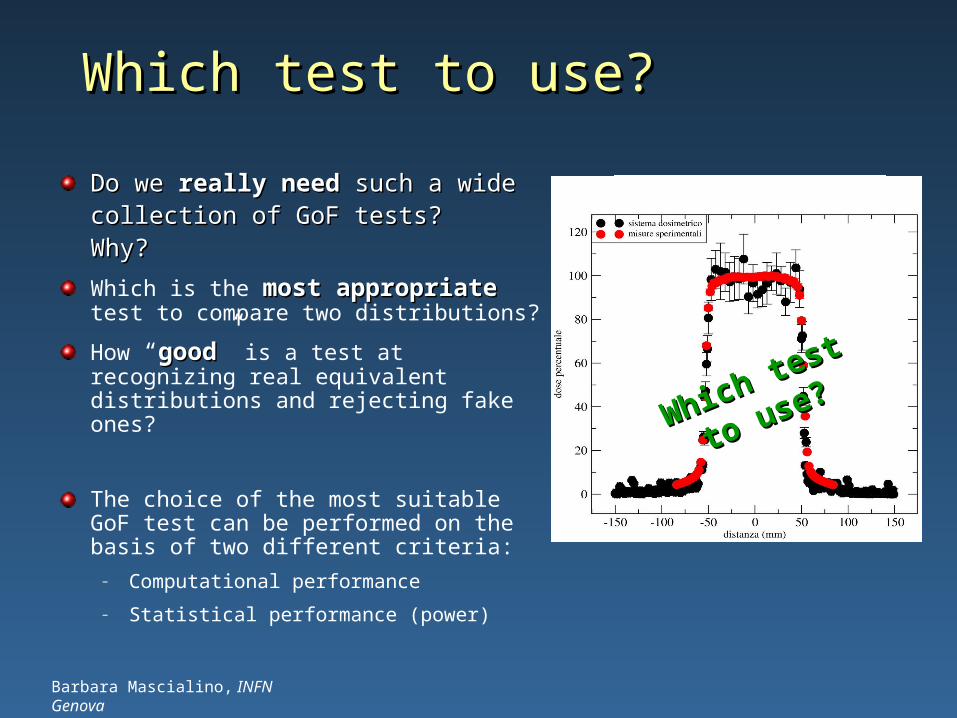
Which test to use?Which test to use?
Do weDo we really need really need such a wide such a wide collection of GoF tests? Why?collection of GoF tests? Why?
Which is the most appropriatemost appropriate test to compare two distributions?
How “goodgood” is a test at recognizing real equivalent distributions and rejecting fake ones?
The choice of the most suitable GoF test can be performed on the basis of two different criteria:
– Computational performance
– Statistical performance (power)
Which test
Which test
to use?to use?
Barbara Mascialino, INFN Genova
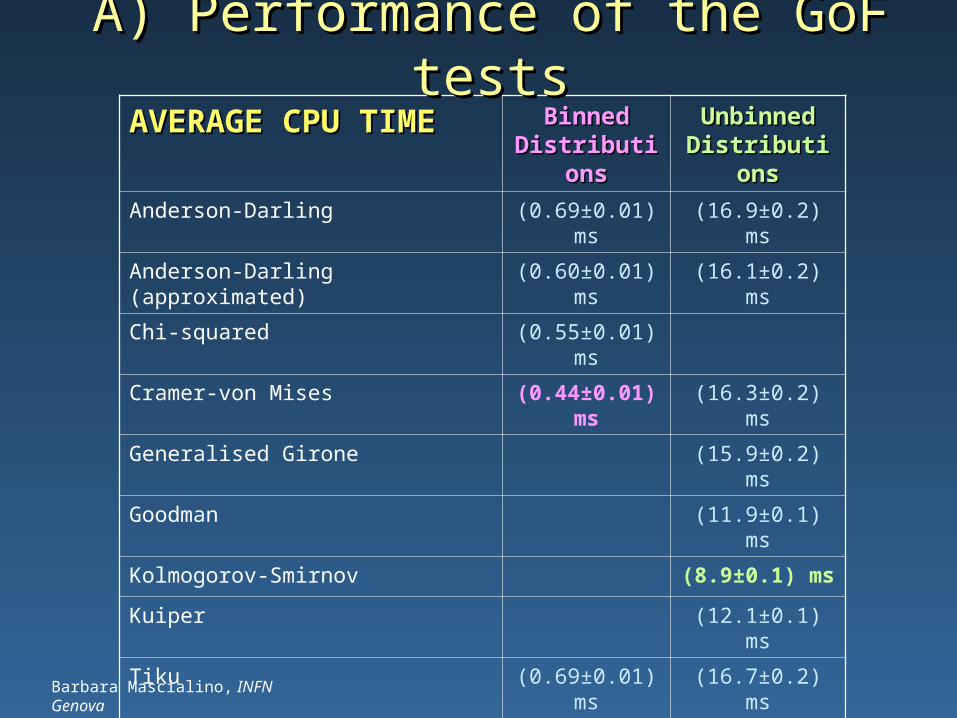
AVERAGE CPU TIMEAVERAGE CPU TIME Binned Binned DistributionsDistributions
Unbinned Unbinned DistributionsDistributions
Anderson-Darling (0.69±0.01) ms (16.9±0.2) ms
Anderson-Darling (approximated) (0.60±0.01) ms (16.1±0.2) ms
Chi-squared (0.55±0.01) ms
Cramer-von Mises (0.44±0.01) ms (16.3±0.2) ms
Generalised Girone (15.9±0.2) ms
Goodman (11.9±0.1) ms
Kolmogorov-Smirnov (8.9±0.1) ms
Kuiper (12.1±0.1) ms
Tiku (0.69±0.01) ms (16.7±0.2) ms
Watson (14.2±0.1) ms
Weighted Kolmogorov-Smirnov (AD) (14.0±0.1) ms
Weighted Kolmogorov-Smirnov (Buning) (14.0±0.1) ms
Weighted Cramer-von Mises (14.0±0.1) ms
A) Performance of the GoF testsA) Performance of the GoF tests
Barbara Mascialino, INFN Genova
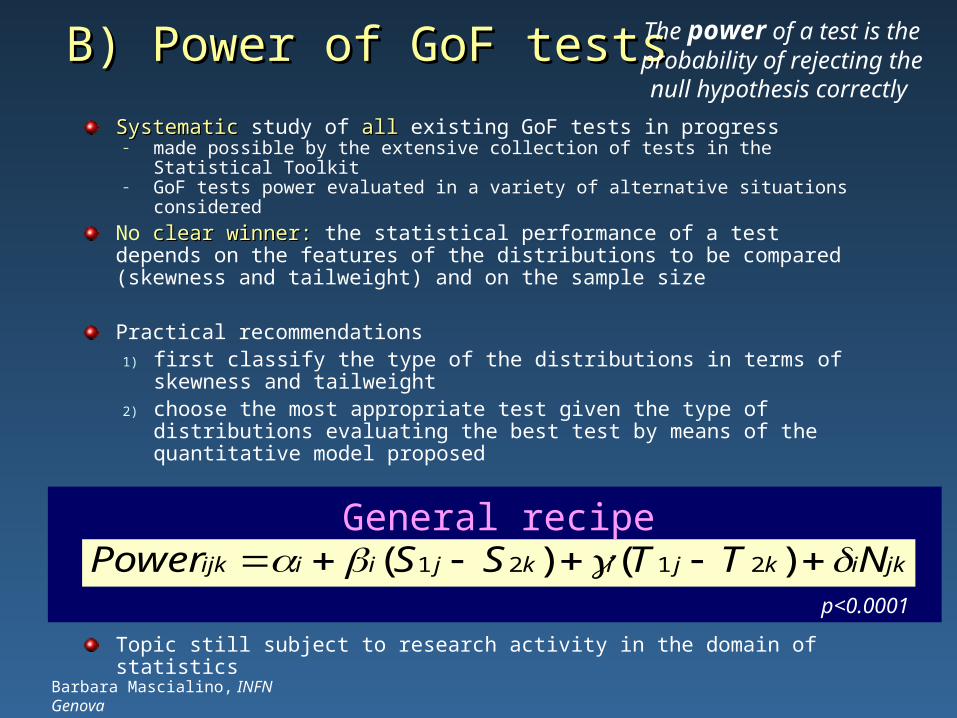
B) Power of GoF testsB) Power of GoF tests
SystematicSystematic study of allall existing GoF tests in progress– made possible by the extensive collection of tests in the Statistical Toolkit– GoF tests power evaluated in a variety of alternative situations considered
No clear winner: clear winner: the statistical performance of a test depends on the features of the distributions to be compared (skewness and tailweight) and on the sample size
Practical recommendations1) first classify the type of the distributions in terms of skewness and
tailweight2) choose the most appropriate test given the type of distributions evaluating
the best test by means of the quantitative model proposed
Topic still subject to research activity in the domain of statistics
jkikjikjiiijk NTTSSPower )()( 2121
p<0.0001
General recipe
The power of a test is the probability of rejecting the null
hypothesis correctly
Barbara Mascialino, INFN Genova
Examples of practical applications
Barbara Mascialino, INFN Genova
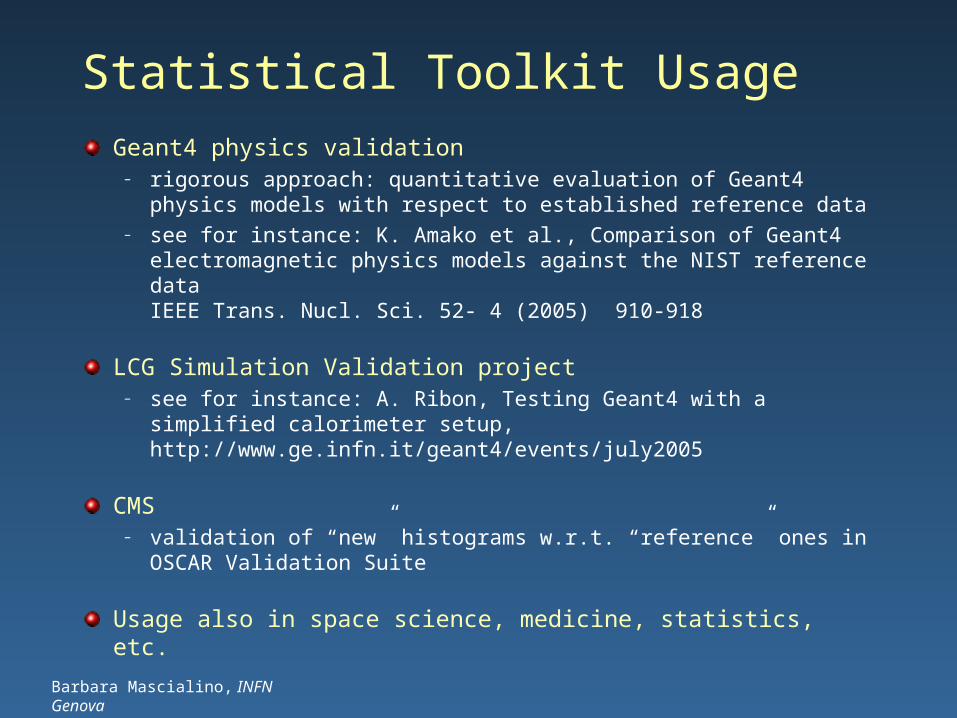
Statistical Toolkit Usage
Geant4 physics validation– rigorous approach: quantitative evaluation of Geant4 physics models with
respect to established reference data– see for instance: K. Amako et al., Comparison of Geant4 electromagnetic
physics models against the NIST reference dataIEEE Trans. Nucl. Sci. 52- 4 (2005) 910-918
LCG Simulation Validation project– see for instance: A. Ribon, Testing Geant4 with a simplified calorimeter
setup, http://www.ge.infn.it/geant4/events/july2005
CMS– validation of “new” histograms w.r.t. “reference” ones in OSCAR
Validation Suite
Usage also in space science, medicine, statistics, etc.
Barbara Mascialino, INFN Genova
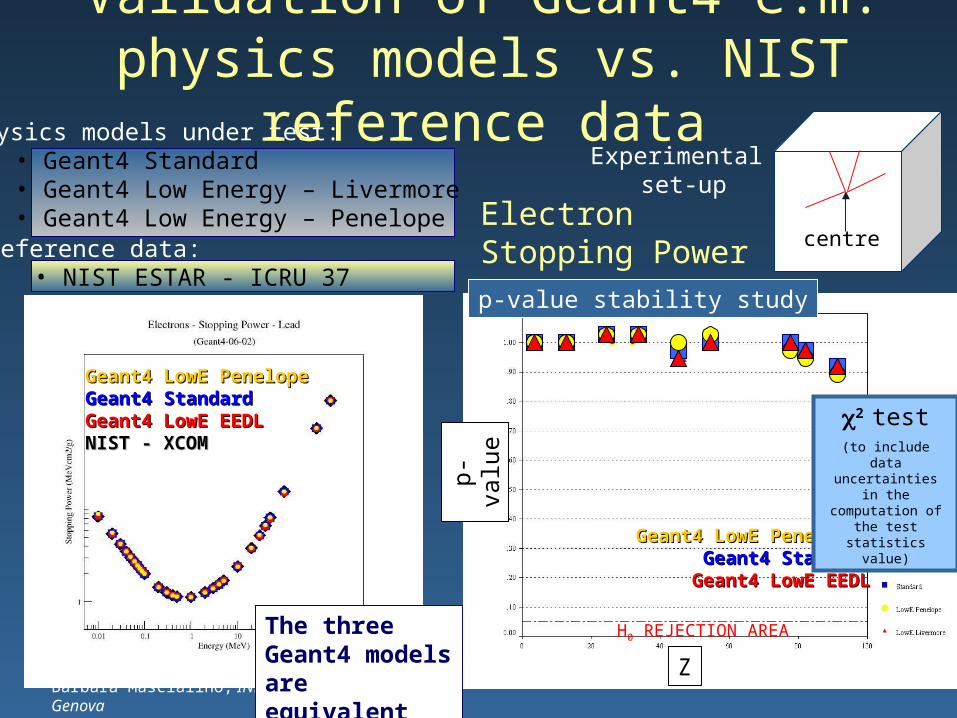
Electron Stopping Power
H0 REJECTION AREA
p-value stability study
centre
Experimental set-up
Physics models under test:• Geant4 Standard• Geant4 Low Energy – Livermore• Geant4 Low Energy – Penelope
Reference data:• NIST ESTAR - ICRU 37
p-va
lue
Z
Geant4 LowE PenelopeGeant4 LowE Penelope Geant4 StandardGeant4 StandardGeant4 LowE EEDLGeant4 LowE EEDLNIST - XCOMNIST - XCOM
The three Geant4 models are equivalent
Geant4 LowE PenelopeGeant4 LowE Penelope Geant4 StandardGeant4 Standard
Geant4 LowE EEDLGeant4 LowE EEDL
Validation of Geant4 e.m. physics models vs. NIST reference data
2 test(to include data
uncertainties in the computation of the test statistics value)
Barbara Mascialino, INFN Genova
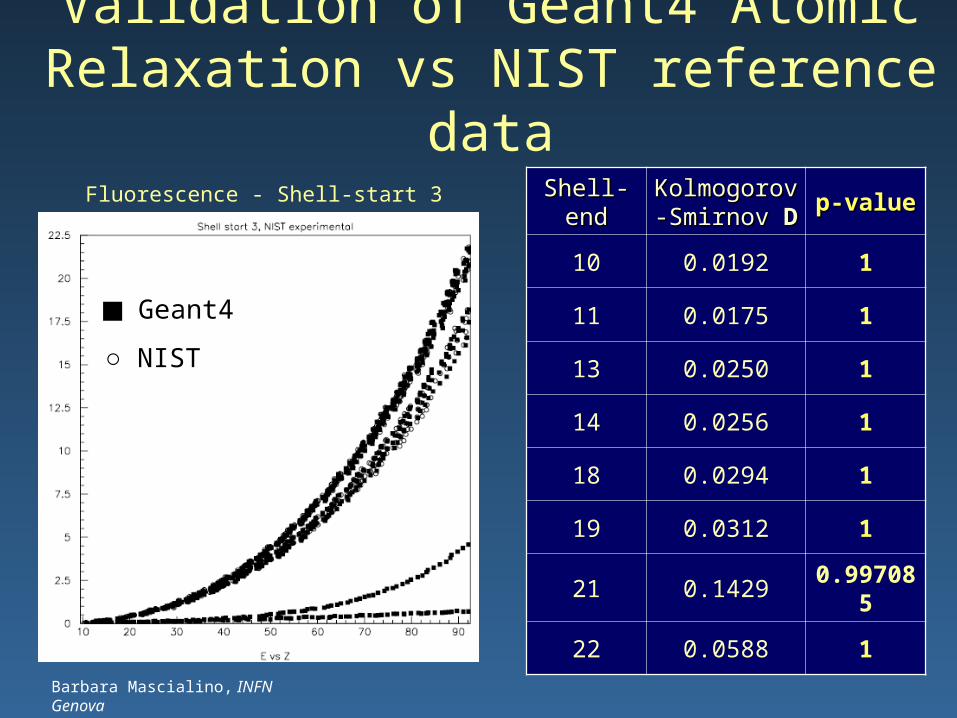
Validation of Geant4 Atomic Relaxation vs NIST reference data
Shell-endShell-end Kolmogorov-Kolmogorov-Smirnov Smirnov DD
p-valuep-value
10 0.0192 1
11 0.0175 1
13 0.0250 1
14 0.0256 1
18 0.0294 1
19 0.0312 1
21 0.1429 0.997085
22 0.0588 1
Geant4
○ NIST
Fluorescence - Shell-start 3
Barbara Mascialino, INFN Genova
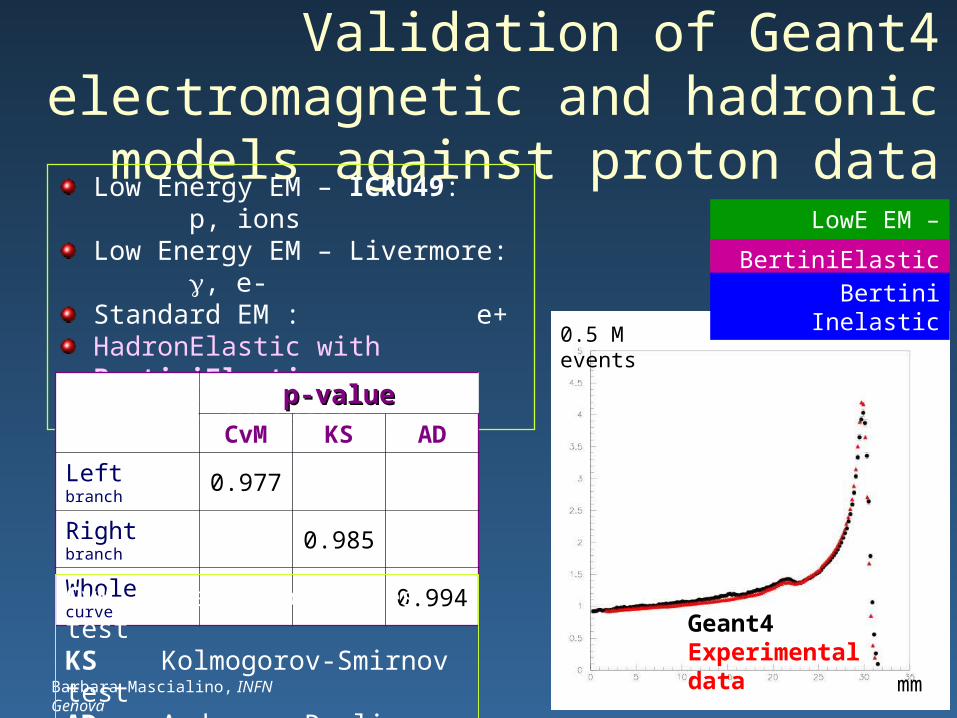
Validation of Geant4 electromagnetic and hadronic
models against proton dataLow Energy EM – ICRU49: p, ions Low Energy EM – Livermore: , e-Standard EM : e+HadronElastic with BertiniElasticBertini InelasticBertini Inelastic
p-valuep-value
CvM KS AD
Left branch 0.977
Right branch 0.985
Whole curve 0.994
LowE EM – ICRU49
BertiniElastic
CvM Cramer-von Mises testKS Kolmogorov-Smirnov testAD Anderson-Darling test
0.5 M events
mm
Geant4Experimental data
Bertini Inelastic
Barbara Mascialino, INFN Genova
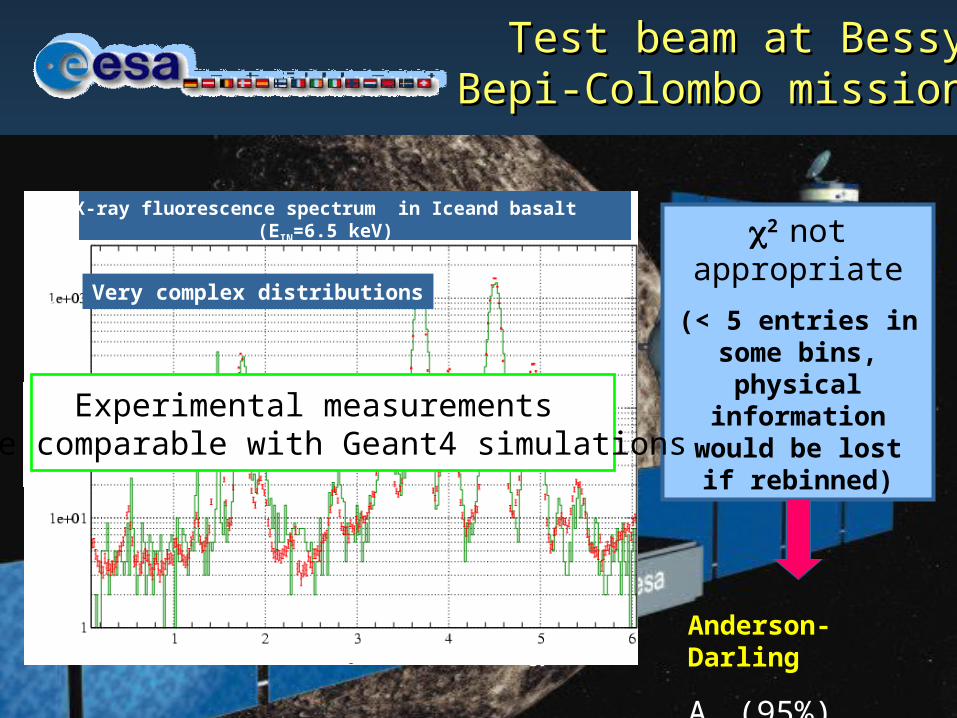
2 not appropriate
(< 5 entries in some bins, physical
information would be lost if rebinned)
Anderson-Darling
Ac (95%) =0.752
Test beam at BessyTest beam at BessyBepi-Colombo missionBepi-Colombo mission
Energy (keV)
Cou
nts
X-ray fluorescence spectrum in Iceand basalt(EIN=6.5 keV)
Very complex distributions
Experimental measurements are comparable with Geant4 simulations
Barbara Mascialino, INFN Genova
Ave
rage
ene
rgy
depo
sit (
MeV
)
Depth in the phantom (cm)
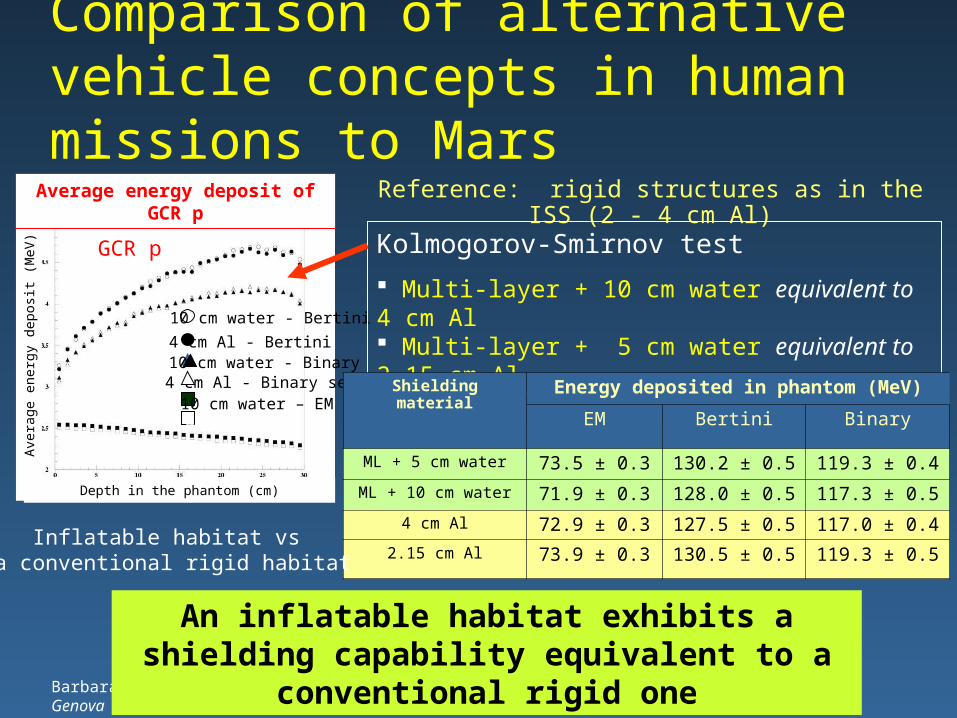
Average energy deposit of GCR p
GCR p
4 cm Al - Binary set
4 cm Al - Bertini10 cm water - Binary
10 cm water – EM4 cm Al – EM
10 cm water - Bertini
Comparison of alternative vehicle concepts in human missions to Mars
Reference: rigid structures as in the ISS (2 - 4 cm Al)
Kolmogorov-Smirnov test
Multi-layer + 10 cm water equivalent to 4 cm Al Multi-layer + 5 cm water equivalent to 2.15 cm Al
An inflatable habitat exhibits a shielding capability equivalent to a conventional rigid one
Shieldingmaterial
Energy deposited in phantom (MeV)
EM Bertini Binary
ML + 5 cm water 73.5 ± 0.3 130.2 ± 0.5 119.3 ± 0.4
ML + 10 cm water 71.9 ± 0.3 128.0 ± 0.5 117.3 ± 0.5
4 cm Al 72.9 ± 0.3 127.5 ± 0.5 117.0 ± 0.4
2.15 cm Al 73.9 ± 0.3 130.5 ± 0.5 119.3 ± 0.5Inflatable habitat vs
a conventional rigid habitat
Barbara Mascialino, INFN Genova
ConclusionsA novel, complete software software toolkit for statistical analysis is being developed
– all the two-sample GoF tests available in statistical domain + chi-squared test– rigorous architectural design– rigorous software process
It is the most complete software for the comparison of two It is the most complete software for the comparison of two distributions, even among commercial/professional statistics tools.distributions, even among commercial/professional statistics tools.
A systematic study of the power of GoF tests is in progress– unexplored area of research
Application in various domains– Geant4, HEP, space science, medicine…
Feedback and suggestions are very much appreciated