Embed Size (px)
Citation preview

Kraft Foods
Barclays Capital Back-to-School Conference
September 7, 2011

Irene Rosenfeld
Chairman and CEO
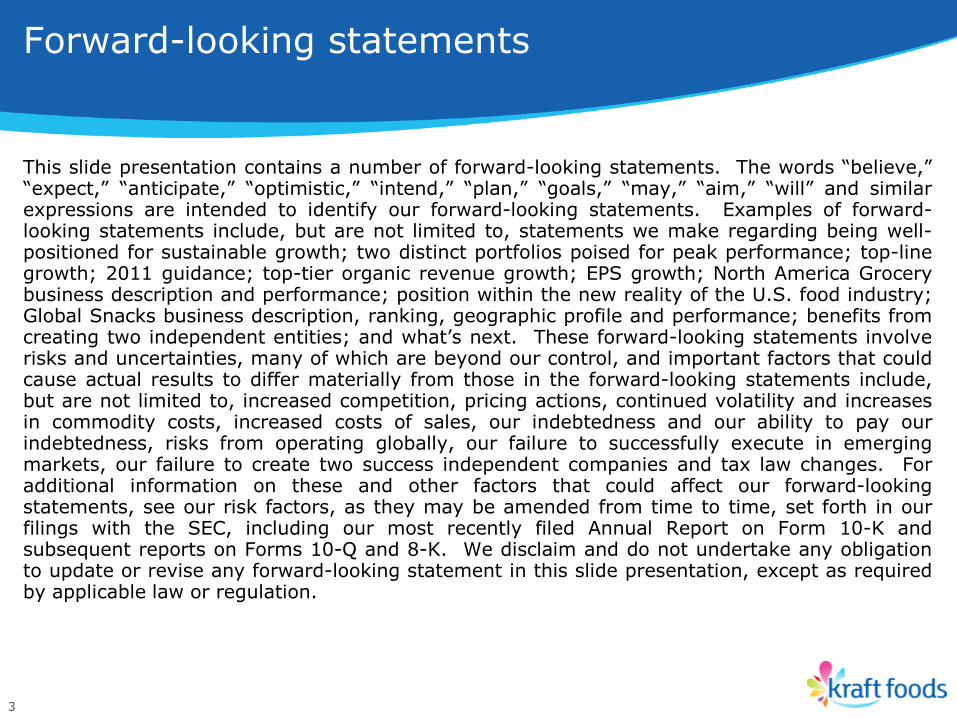
Forward-looking statements
This slide presentation contains a number of forward-looking statements. The words “believe,” “expect,” “anticipate,” “optimistic,” “intend,” “plan,” “goals,” “may,” “aim,” “will” and similar expressions are intended to identify our forward-looking statements. Examples of forward-looking statements include, but are not limited to, statements we make regarding being well-positioned for sustainable growth; two distinct portfolios poised for peak performance; top-line growth; 2011 guidance; top-tier organic revenue growth; EPS growth; North America Grocery business description and performance; position within the new reality of the U.S. food industry; Global Snacks business description, ranking, geographic profile and performance; benefits from creating two independent entities; and what’s next. These forward-looking statements involve risks and uncertainties, many of which are beyond our control, and important factors that could cause actual results to differ materially from those in the forward-looking statements include, but are not limited to, increased competition, pricing actions, continued volatility and increases in commodity costs, increased costs of sales, our indebtedness and our ability to pay our indebtedness, risks from operating globally, our failure to successfully execute in emerging markets, our failure to create two success independent companies and tax law changes. For additional information on these and other factors that could affect our forward-looking statements, see our risk factors, as they may be amended from time to time, set forth in our filings with the SEC, including our most recently filed Annual Report on Form 10-K and subsequent reports on Forms 10-Q and 8-K. We disclaim and do not undertake any obligation to update or revise any forward-looking statement in this slide presentation, except as required by applicable law or regulation.
3
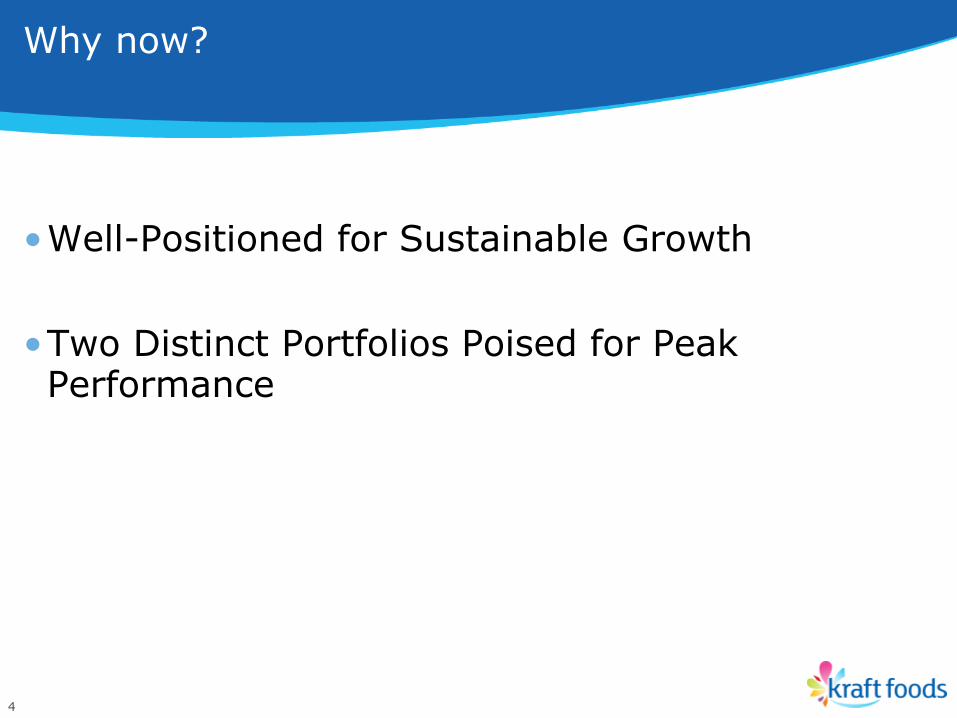
Why now?
•Well-Positioned for Sustainable Growth
•Two Distinct Portfolios Poised for Peak Performance
4
Three key ingredients to sustainable growth
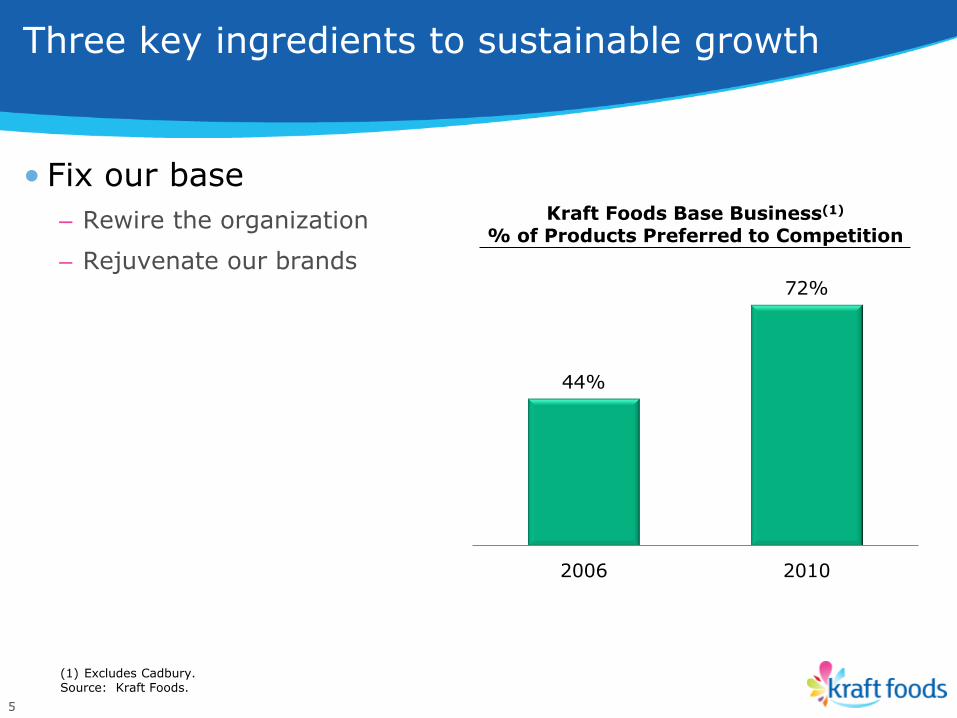
• Fix our base
– Rewire the organization
– Rejuvenate our brands
5
Kraft Foods Base Business(1)
% of Products Preferred to Competition
44%
72%
2006 2010
(1) Excludes Cadbury. Source: Kraft Foods.
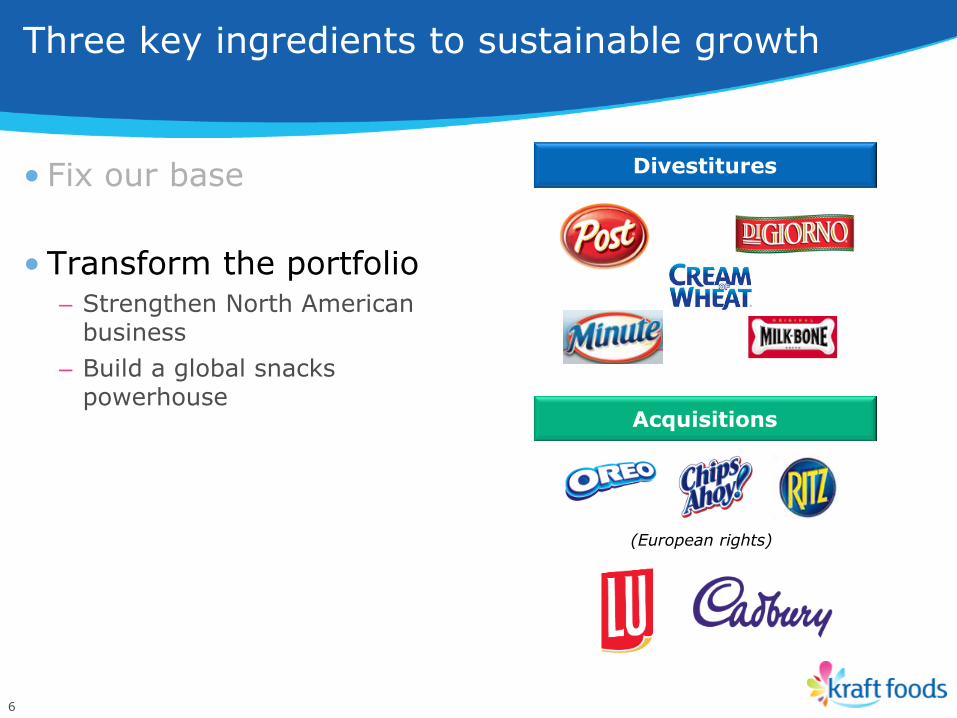
Three key ingredients to sustainable growth
• Fix our base
• Transform the portfolio – Strengthen North American
business
– Build a global snacks powerhouse
6
Divestitures
Acquisitions
(European rights)
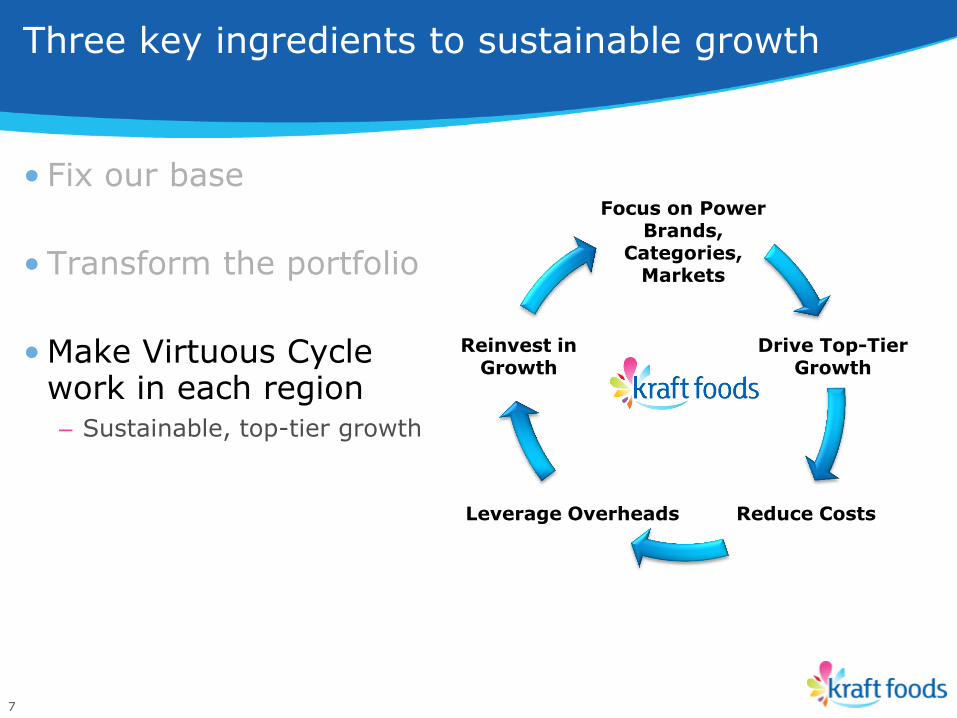
Three key ingredients to sustainable growth
• Fix our base
• Transform the portfolio
• Make Virtuous Cycle work in each region – Sustainable, top-tier growth
7
Focus on Power Brands,
Categories, Markets
Drive Top-Tier Growth
Reduce Costs Leverage Overheads
Reinvest in Growth
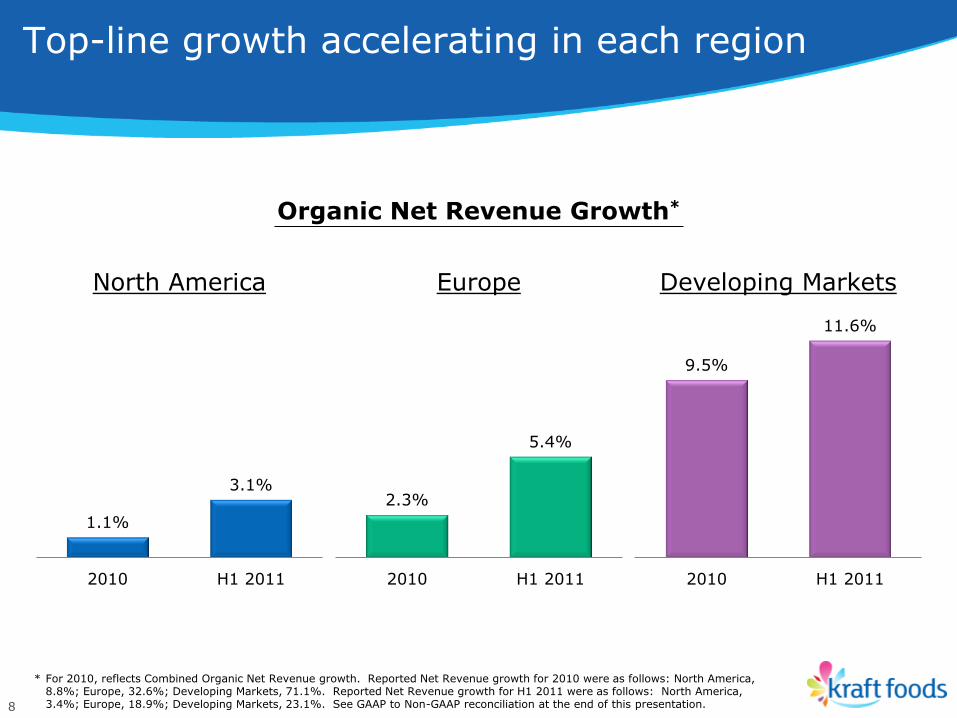
Top-line growth accelerating in each region
8
1.1%
3.1%
2010 H1 2011
North America
9.5%
11.6%
2010 H1 2011
Developing Markets
2.3%
5.4%
2010 H1 2011
Europe
* For 2010, reflects Combined Organic Net Revenue growth. Reported Net Revenue growth for 2010 were as follows: North America, 8.8%; Europe, 32.6%; Developing Markets, 71.1%. Reported Net Revenue growth for H1 2011 were as follows: North America, 3.4%; Europe, 18.9%; Developing Markets, 23.1%. See GAAP to Non-GAAP reconciliation at the end of this presentation.
Organic Net Revenue Growth*
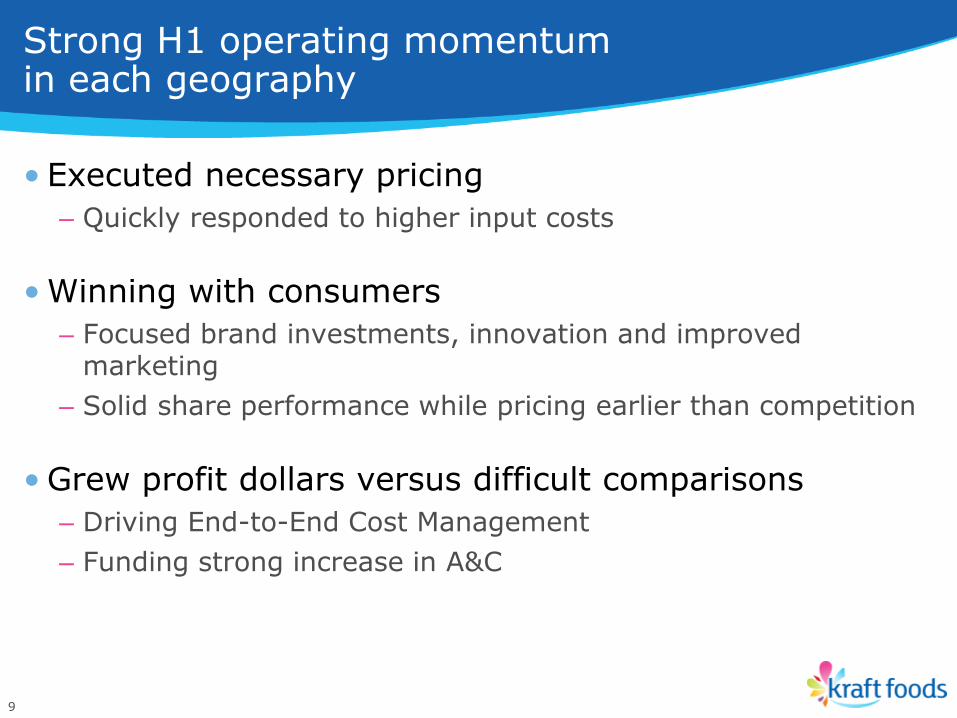
Strong H1 operating momentum in each geography
• Executed necessary pricing
– Quickly responded to higher input costs
• Winning with consumers
– Focused brand investments, innovation and improved marketing
– Solid share performance while pricing earlier than competition
• Grew profit dollars versus difficult comparisons
– Driving End-to-End Cost Management
– Funding strong increase in A&C
9
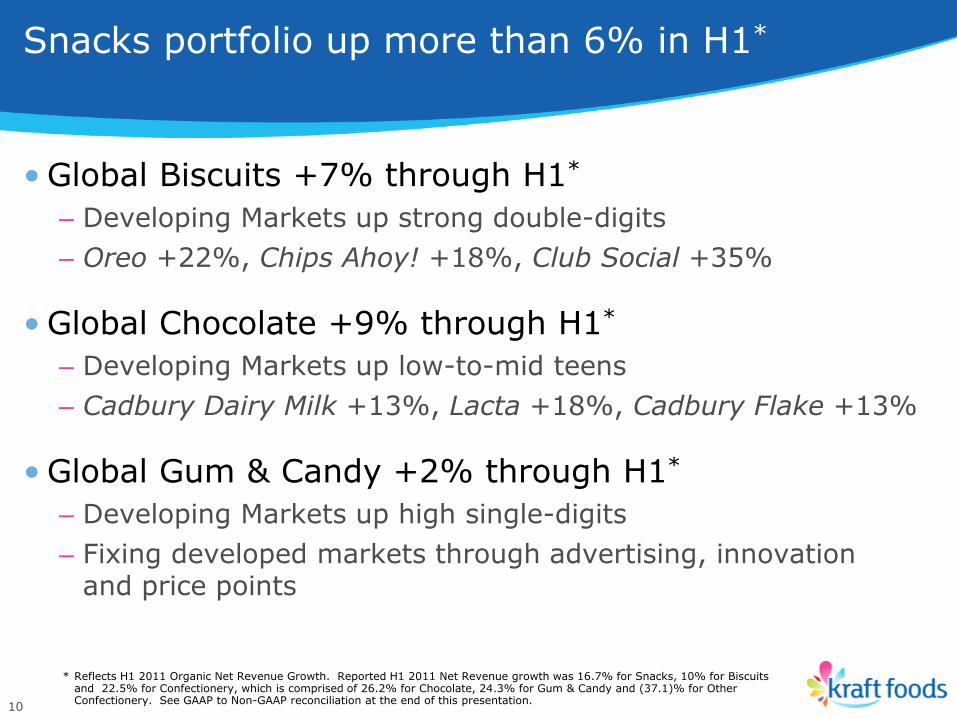
Snacks portfolio up more than 6% in H1*
• Global Biscuits +7% through H1*
– Developing Markets up strong double-digits
– Oreo +22%, Chips Ahoy! +18%, Club Social +35%
• Global Chocolate +9% through H1*
– Developing Markets up low-to-mid teens
– Cadbury Dairy Milk +13%, Lacta +18%, Cadbury Flake +13%
• Global Gum & Candy +2% through H1*
– Developing Markets up high single-digits
– Fixing developed markets through advertising, innovation and price points
10
* Reflects H1 2011 Organic Net Revenue Growth. Reported H1 2011 Net Revenue growth was 16.7% for Snacks, 10% for Biscuits and 22.5% for Confectionery, which is comprised of 26.2% for Chocolate, 24.3% for Gum & Candy and (37.1)% for Other Confectionery. See GAAP to Non-GAAP reconciliation at the end of this presentation.
Increased 2011 guidance with Q2 results
• Organic Net Revenue growth of at least 5%
– Taking additional pricing to address climbing input costs
• Operating EPS of at least $2.25
– Delivering strong operating results
– Reflecting year-to-date currency benefit
11
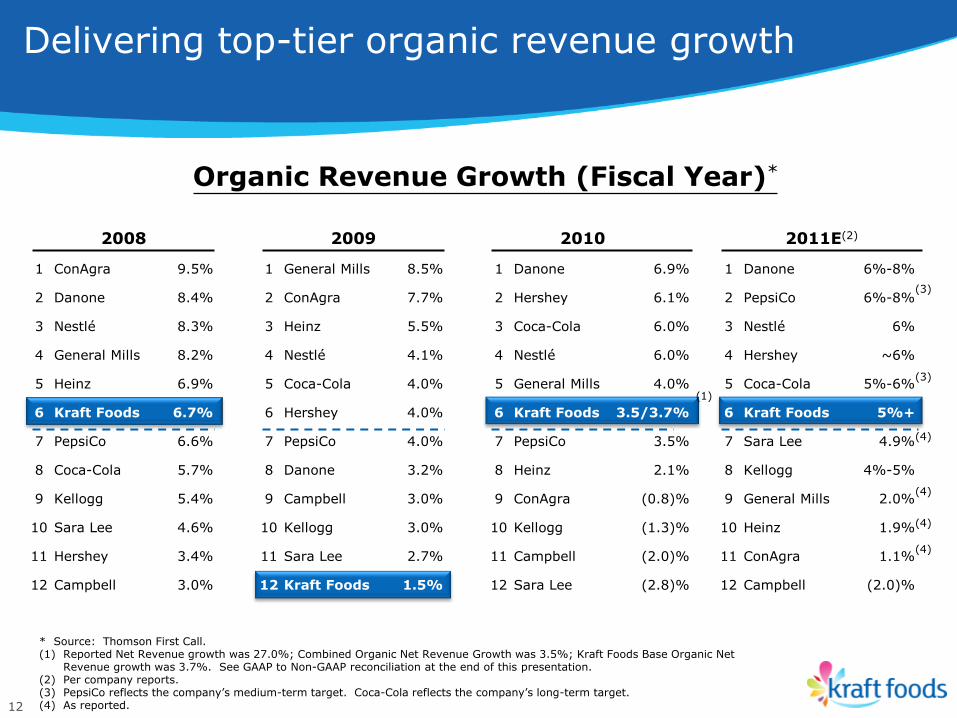
Delivering top-tier organic revenue growth
12
1 ConAgra 9.5% 1 General Mills 8.5% 1 Danone 6.9% 1 Danone 6%-8%
2 Danone 8.4% 2 ConAgra 7.7% 2 Hershey 6.1% 2 PepsiCo 6%-8%
3 Nestlé 8.3% 3 Heinz 5.5% 3 Coca-Cola 6.0% 3 Nestlé 6%
4 General Mills 8.2% 4 Nestlé 4.1% 4 Nestlé 6.0% 4 Hershey ~6%
5 Heinz 6.9% 5 Coca-Cola 4.0% 5 General Mills 4.0% 5 Coca-Cola 5%-6%
6 Kraft Foods 6.7% 6 Hershey 4.0% 6 Kraft Foods 3.5/3.7% 6 Kraft Foods 5%+
7 PepsiCo 6.6% 7 PepsiCo 4.0% 7 PepsiCo 3.5% 7 Sara Lee 4.9%
8 Coca-Cola 5.7% 8 Danone 3.2% 8 Heinz 2.1% 8 Kellogg 4%-5%
9 Kellogg 5.4% 9 Campbell 3.0% 9 ConAgra (0.8)% 9 General Mills 2.0%
10 Sara Lee 4.6% 10 Kellogg 3.0% 10 Kellogg (1.3)% 10 Heinz 1.9%
11 Hershey 3.4% 11 Sara Lee 2.7% 11 Campbell (2.0)% 11 ConAgra 1.1%
12 Campbell 3.0% 12 Kraft Foods 1.5% 12 Sara Lee (2.8)% 12 Campbell (2.0)%
* Source: Thomson First Call. (1) Reported Net Revenue growth was 27.0%; Combined Organic Net Revenue Growth was 3.5%; Kraft Foods Base Organic Net
Revenue growth was 3.7%. See GAAP to Non-GAAP reconciliation at the end of this presentation. (2) Per company reports. (3) PepsiCo reflects the company’s medium-term target. Coca-Cola reflects the company’s long-term target. (4) As reported.
Organic Revenue Growth (Fiscal Year)*
2008 2009 2010 2011E(2)
(1)
(4)
(4)
(4)
(4)
(3)
(3)
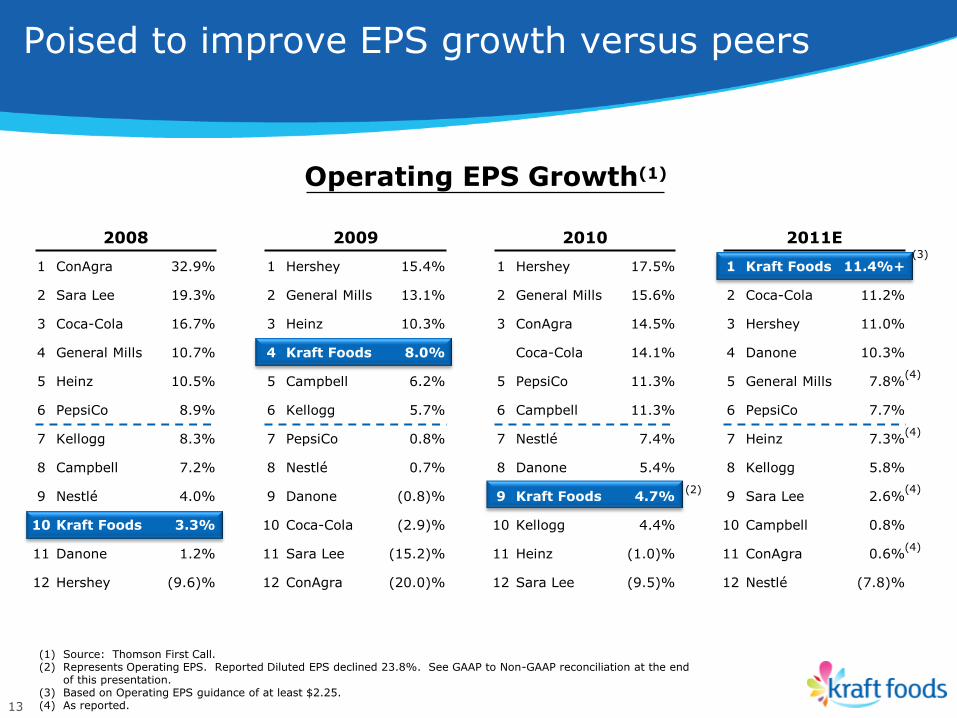
Poised to improve EPS growth versus peers
13
(1) Source: Thomson First Call. (2) Represents Operating EPS. Reported Diluted EPS declined 23.8%. See GAAP to Non-GAAP reconciliation at the end
of this presentation. (3) Based on Operating EPS guidance of at least $2.25. (4) As reported.
1 ConAgra 32.9% 1 Hershey 15.4% 1 Hershey 17.5% 1 Kraft Foods 11.4%+
2 Sara Lee 19.3% 2 General Mills 13.1% 2 General Mills 15.6% 2 Coca-Cola 11.2%
3 Coca-Cola 16.7% 3 Heinz 10.3% 3 ConAgra 14.5% 3 Hershey 11.0%
4 General Mills 10.7% 4 Kraft Foods 8.0% 4 Coca-Cola 14.1% 4 Danone 10.3%
5 Heinz 10.5% 5 Campbell 6.2% 5 PepsiCo 11.3% 5 General Mills 7.8%
6 PepsiCo 8.9% 6 Kellogg 5.7% 6 Campbell 11.3% 6 PepsiCo 7.7%
7 Kellogg 8.3% 7 PepsiCo 0.8% 7 Nestlé 7.4% 7 Heinz 7.3%
8 Campbell 7.2% 8 Nestlé 0.7% 8 Danone 5.4% 8 Kellogg 5.8%
9 Nestlé 4.0% 9 Danone (0.8)% 9 Kraft Foods 4.7% 9 Sara Lee 2.6%
10 Kraft Foods 3.3% 10 Coca-Cola (2.9)% 10 Kellogg 4.4% 10 Campbell 0.8%
11 Danone 1.2% 11 Sara Lee (15.2)% 11 Heinz (1.0)% 11 ConAgra 0.6%
12 Hershey (9.6)% 12 ConAgra (20.0)% 12 Sara Lee (9.5)% 12 Nestlé (7.8)%
2008 2009 2010 2011E
Operating EPS Growth(1)
(2)
(4)
(4)
(4)
(4)
(3)
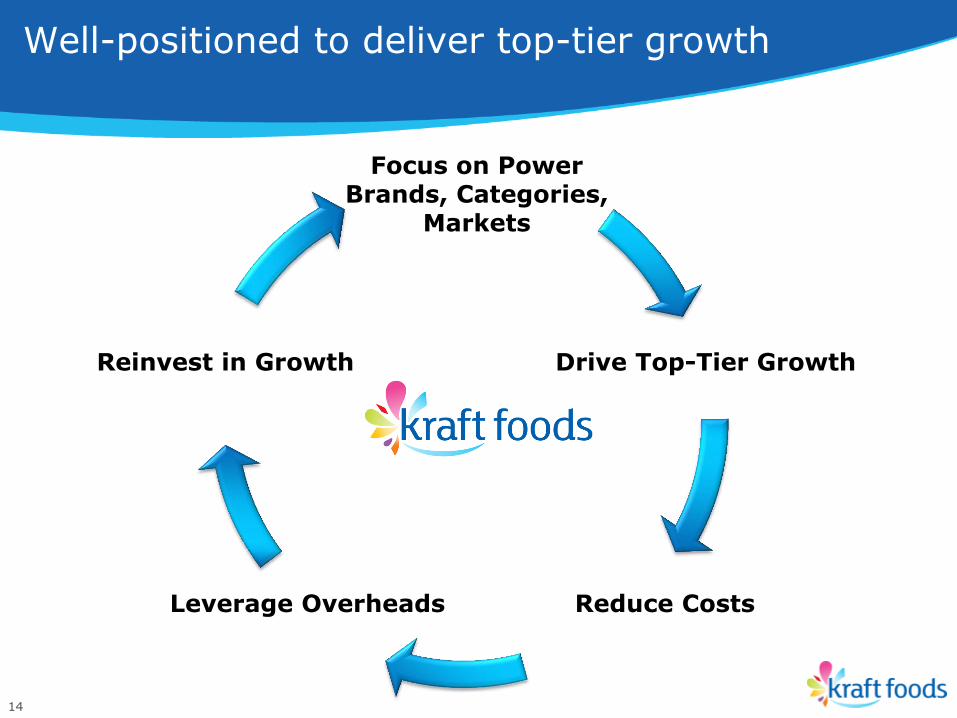
Well-positioned to deliver top-tier growth
14
Focus on Power Brands, Categories,
Markets
Drive Top-Tier Growth
Reduce Costs Leverage Overheads
Reinvest in Growth

Why now?
•Well-Positioned for Sustainable Growth
•Two Distinct Portfolios Poised for Peak Performance
15
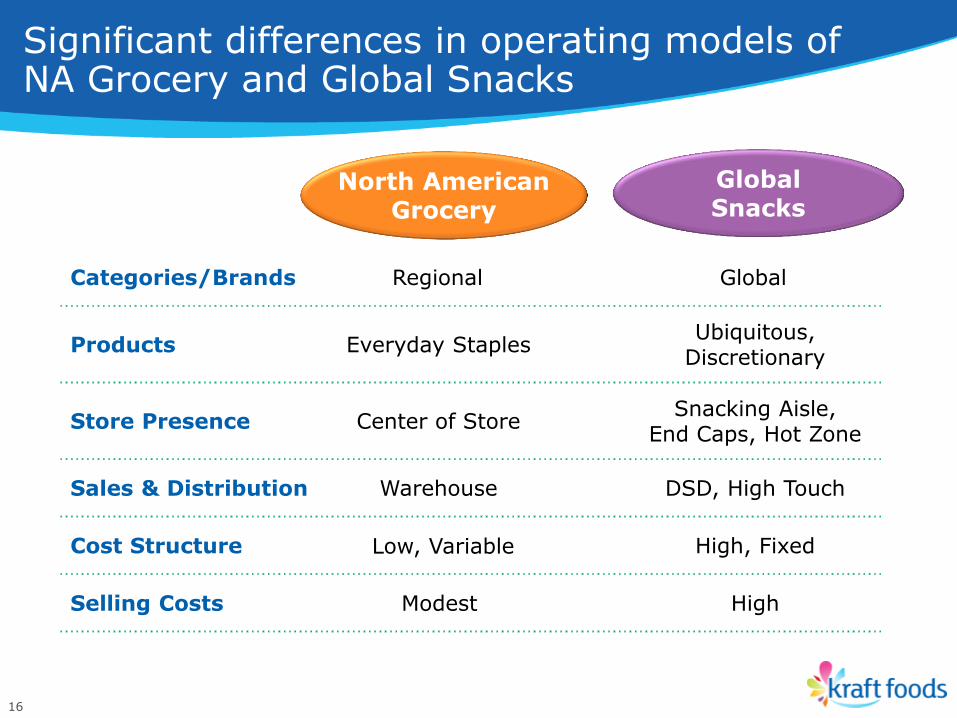
Significant differences in operating models of NA Grocery and Global Snacks
16
North American Grocery
Categories/Brands Regional
Global Snacks
Global
Products Everyday Staples
Store Presence Center of Store
Sales & Distribution Warehouse
Cost Structure Low, Variable
Selling Costs Modest
Ubiquitous, Discretionary
Snacking Aisle, End Caps, Hot Zone
DSD, High Touch
High, Fixed
High
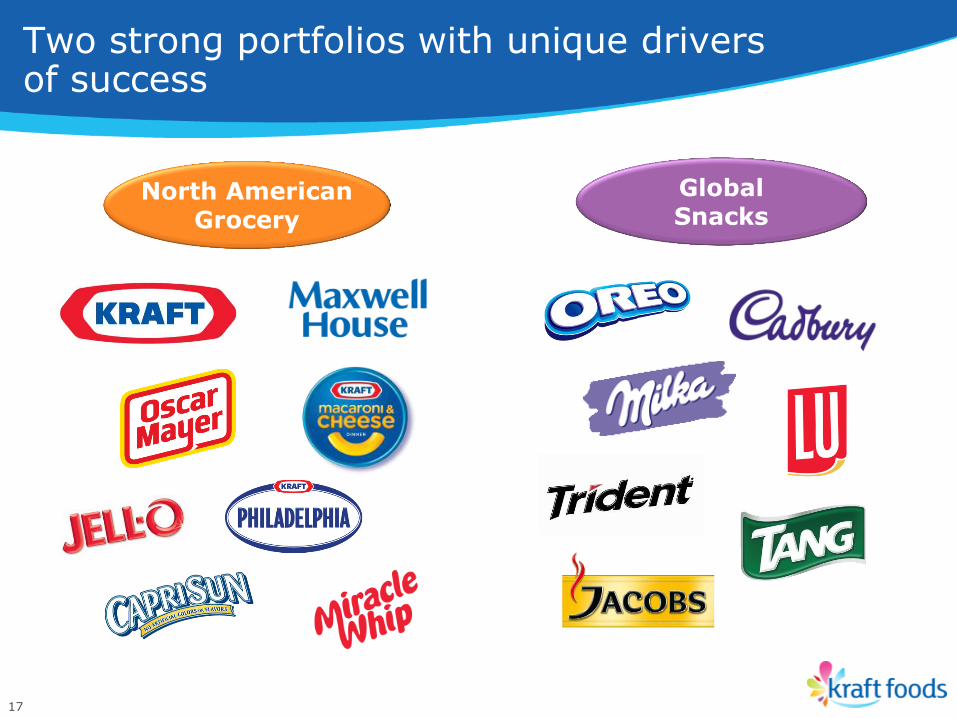
Two strong portfolios with unique drivers of success
17
Global Snacks
North American Grocery
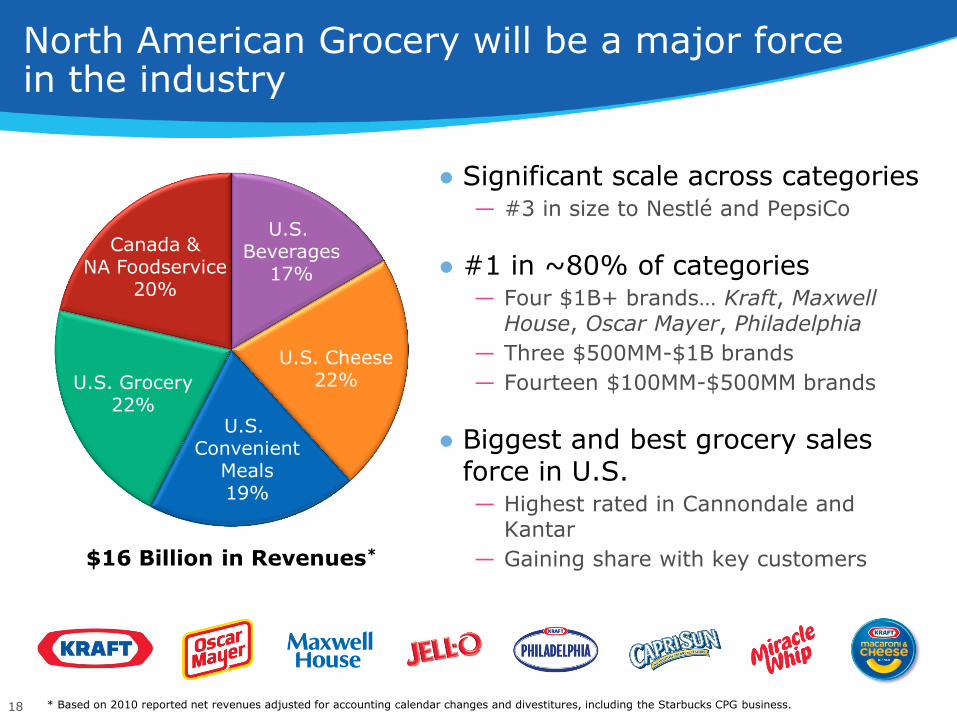
North American Grocery will be a major force in the industry
18
U.S. Beverages
17%
$16 Billion in Revenues*
U.S. Cheese 22%
U.S. Convenient
Meals 19%
U.S. Grocery 22%
Canada & NA Foodservice
20%
● Significant scale across categories — #3 in size to Nestlé and PepsiCo
● #1 in ~80% of categories — Four $1B+ brands… Kraft, Maxwell
House, Oscar Mayer, Philadelphia
— Three $500MM-$1B brands
— Fourteen $100MM-$500MM brands
● Biggest and best grocery sales force in U.S. — Highest rated in Cannondale and
Kantar
— Gaining share with key customers
* Based on 2010 reported net revenues adjusted for accounting calendar changes and divestitures, including the Starbucks CPG business.
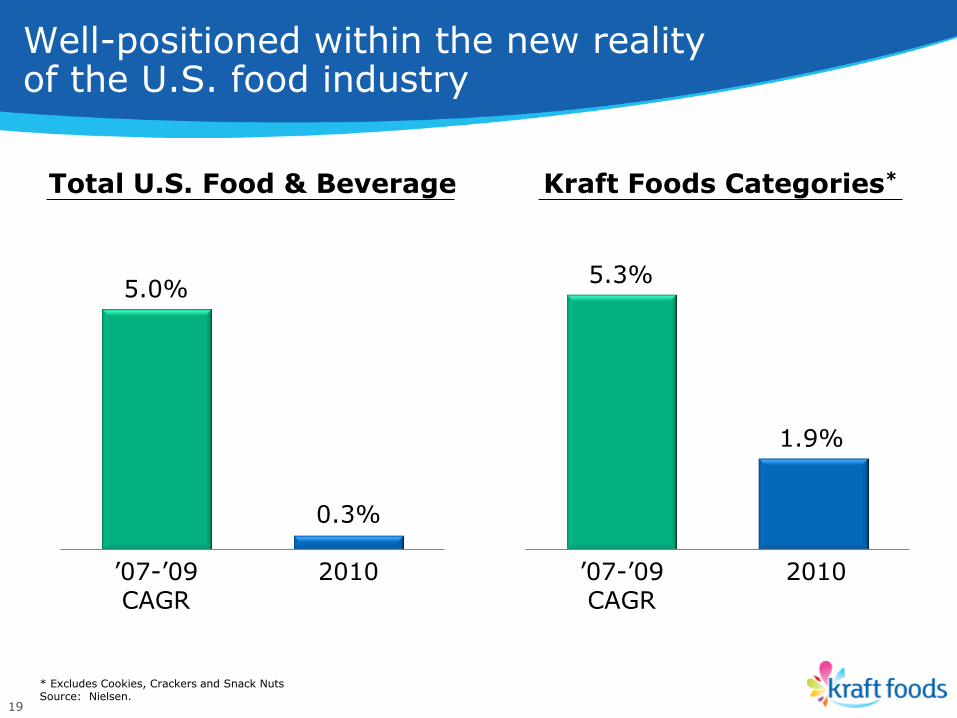
Well-positioned within the new reality of the U.S. food industry
19
* Excludes Cookies, Crackers and Snack Nuts Source: Nielsen.
’07-’09 CAGR
2010
5.3%
1.9%
Kraft Foods Categories*
’07-’09 CAGR
2010
5.0%
0.3%
Total U.S. Food & Beverage
North American Grocery will deliver consistent growth, significant free cash flow
20
• Moderate growth in line with categories
– Innovation and marketing excellence
– Disciplined portfolio management
– Grocery channel scale
• Strong margins with upside opportunity
– Trade spend optimization
– Lean Six Sigma
– Negative overhead growth
• Substantial free cash generation
– High dividend payout, growing dividend over time
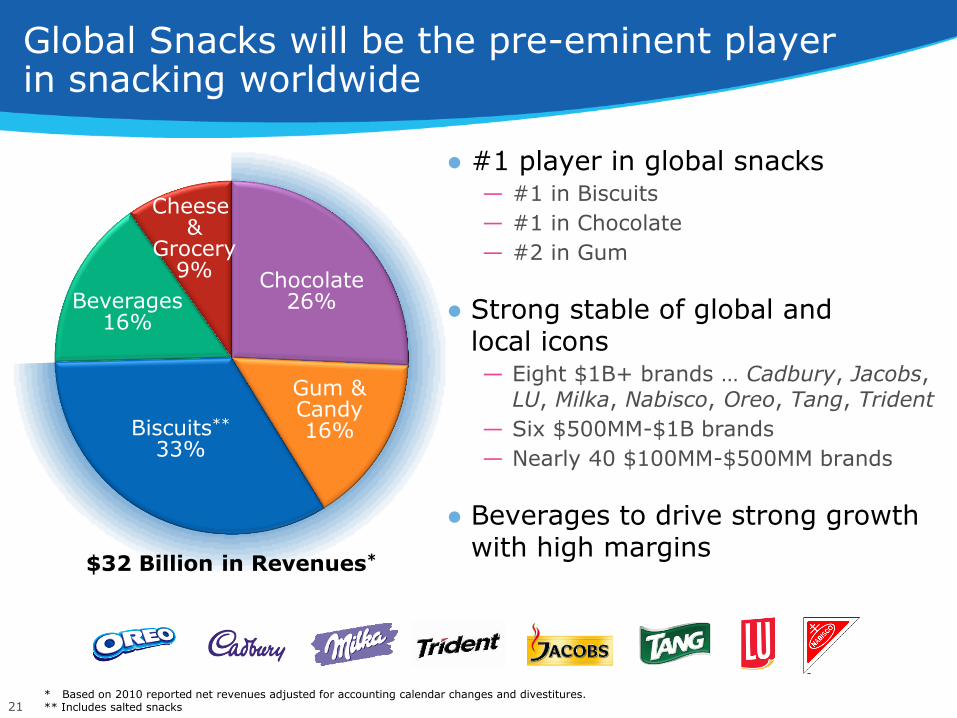
Global Snacks will be the pre-eminent player in snacking worldwide
21
● #1 player in global snacks — #1 in Biscuits
— #1 in Chocolate
— #2 in Gum
● Strong stable of global and local icons — Eight $1B+ brands … Cadbury, Jacobs,
LU, Milka, Nabisco, Oreo, Tang, Trident
— Six $500MM-$1B brands
— Nearly 40 $100MM-$500MM brands
● Beverages to drive strong growth with high margins
Chocolate 26%
Gum & Candy 16% Biscuits**
33%
Beverages 16%
Cheese &
Grocery 9%
* Based on 2010 reported net revenues adjusted for accounting calendar changes and divestitures. ** Includes salted snacks
$32 Billion in Revenues*
(1)
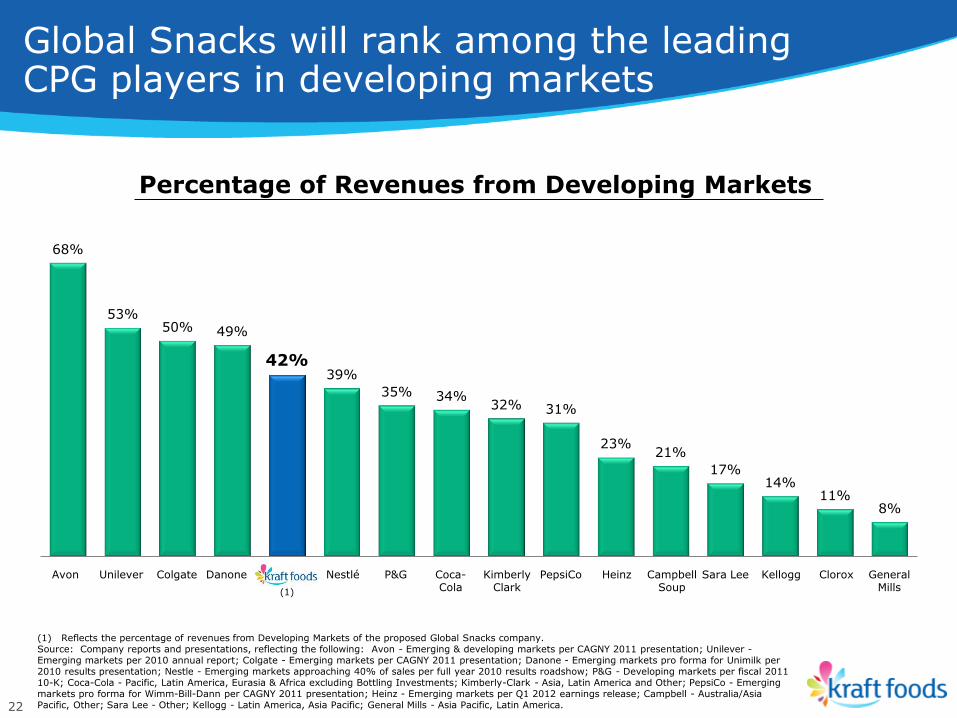
Global Snacks will rank among the leading CPG players in developing markets
22
(1) Reflects the percentage of revenues from Developing Markets of the proposed Global Snacks company. Source: Company reports and presentations, reflecting the following: Avon - Emerging & developing markets per CAGNY 2011 presentation; Unilever - Emerging markets per 2010 annual report; Colgate - Emerging markets per CAGNY 2011 presentation; Danone - Emerging markets pro forma for Unimilk per 2010 results presentation; Nestle - Emerging markets approaching 40% of sales per full year 2010 results roadshow; P&G - Developing markets per fiscal 2011 10-K; Coca-Cola - Pacific, Latin America, Eurasia & Africa excluding Bottling Investments; Kimberly-Clark - Asia, Latin America and Other; PepsiCo - Emerging markets pro forma for Wimm-Bill-Dann per CAGNY 2011 presentation; Heinz - Emerging markets per Q1 2012 earnings release; Campbell - Australia/Asia Pacific, Other; Sara Lee - Other; Kellogg - Latin America, Asia Pacific; General Mills - Asia Pacific, Latin America.
68%
53% 50% 49%
42% 39%
35% 34% 32% 31%
23% 21%
17% 14%
11% 8%
Avon
Percentage of Revenues from Developing Markets
Colgate P&G Danone Kimberly Clark
Heinz PepsiCo Coca- Cola
Campbell Soup
Nestlé Clorox Sara Lee Unilever Kellogg General Mills
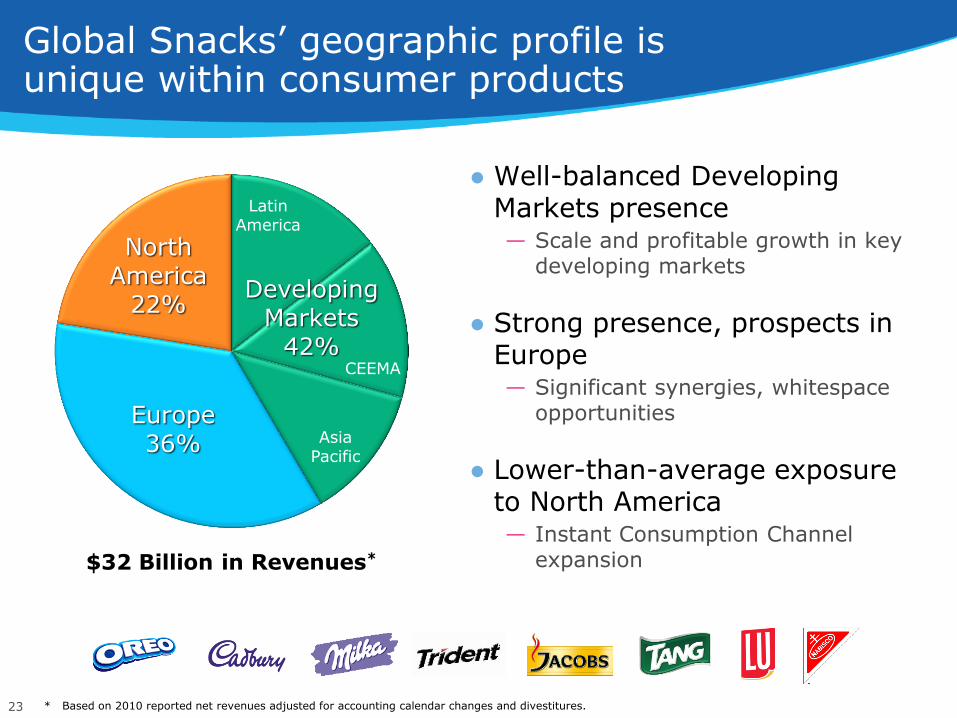
Global Snacks’ geographic profile is unique within consumer products
23
Latin America
CEEMA
Asia Pacific
Europe 36%
North America
22% Developing
Markets 42%
$32 Billion in Revenues*
● Well-balanced Developing Markets presence — Scale and profitable growth in key
developing markets
● Strong presence, prospects in Europe — Significant synergies, whitespace
opportunities
● Lower-than-average exposure to North America — Instant Consumption Channel
expansion
* Based on 2010 reported net revenues adjusted for accounting calendar changes and divestitures.
Global Snacks will deliver exceptional growth
24
• Industry-leading growth
– Global product platforms
– Developing Market presence
– Instant Consumption Channels
– Whitespace opportunities
• Leverage cost structure to drive margin gains
– Volume growth and improved product mix
• Reinvest to support future growth
• Top-tier EPS growth plus a modest dividend
Several important benefits from creating two independent entities
• Enable focus on distinct strategic priorities
– Customize operating models, cultures, organizational structures
• Optimize resource allocation and capital deployment
– North American Grocery resources dedicated to the Grocery business
• Increase transparency for shareholders
– Value each business versus respective peer set
– Expand shareholder base
25
What’s Next
• Continue to report as one company
• Tax Rulings by early Q2
• Initial Form 10 filing during Q2
• Complete transaction no later than Dec. 31, 2012
26
Summary
• Strong business momentum
• Virtuous cycle at work in every region
• Taking next logical step in evolution of Kraft Foods
27
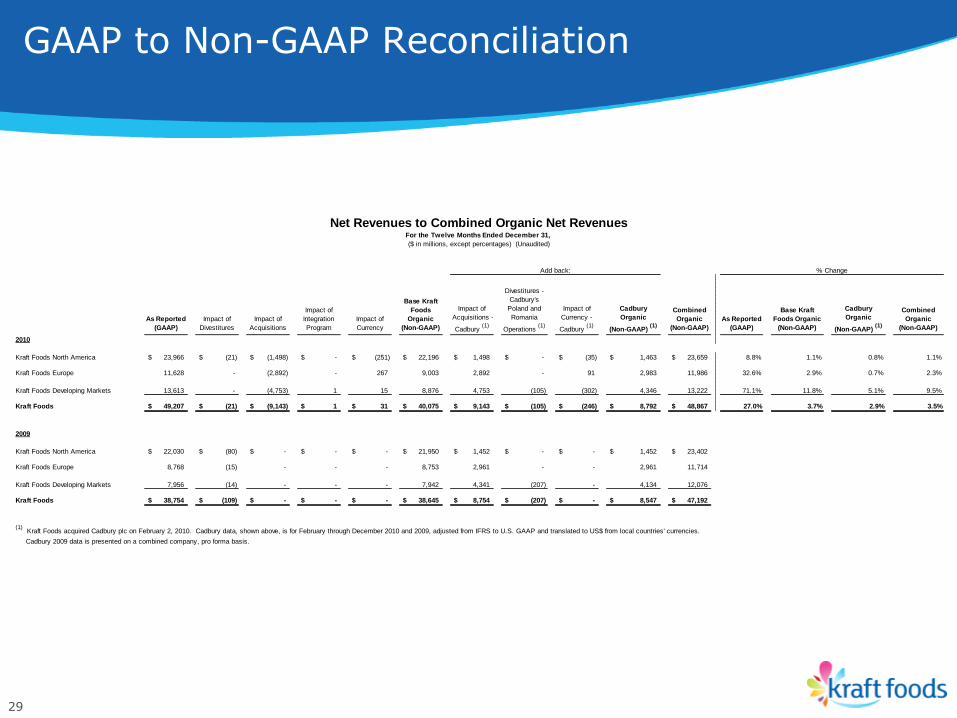
GAAP to Non-GAAP Reconciliation
29
As Reported
(GAAP)
Impact of
Divestitures
Impact of
Acquisitions
Impact of
Integration
Program
Impact of
Currency
Base Kraft
Foods
Organic
(Non-GAAP)
Impact of
Acquisitions -
Cadbury (1)
Divestitures -
Cadbury's
Poland and
Romania
Operations (1)
Impact of
Currency -
Cadbury (1)
Cadbury
Organic
(Non-GAAP) (1)
Combined
Organic
(Non-GAAP)
As Reported
(GAAP)
Base Kraft
Foods Organic
(Non-GAAP)
Cadbury
Organic
(Non-GAAP) (1)
Combined
Organic
(Non-GAAP)
2010
Kraft Foods North America 23,966$ (21)$ (1,498)$ -$ (251)$ 22,196$ 1,498$ -$ (35)$ 1,463$ 23,659$ 8.8% 1.1% 0.8% 1.1%
Kraft Foods Europe 11,628 - (2,892) - 267 9,003 2,892 - 91 2,983 11,986 32.6% 2.9% 0.7% 2.3%
Kraft Foods Developing Markets 13,613 - (4,753) 1 15 8,876 4,753 (105) (302) 4,346 13,222 71.1% 11.8% 5.1% 9.5%
Kraft Foods 49,207$ (21)$ (9,143)$ 1$ 31$ 40,075$ 9,143$ (105)$ (246)$ 8,792$ 48,867$ 27.0% 3.7% 2.9% 3.5%
2009
Kraft Foods North America 22,030$ (80)$ -$ -$ -$ 21,950$ 1,452$ -$ -$ 1,452$ 23,402$
Kraft Foods Europe 8,768 (15) - - - 8,753 2,961 - - 2,961 11,714
Kraft Foods Developing Markets 7,956 (14) - - - 7,942 4,341 (207) - 4,134 12,076
Kraft Foods 38,754$ (109)$ -$ -$ -$ 38,645$ 8,754$ (207)$ -$ 8,547$ 47,192$
(1) Kraft Foods acquired Cadbury plc on February 2, 2010. Cadbury data, shown above, is for February through December 2010 and 2009, adjusted from IFRS to U.S. GAAP and translated to US$ from local countries' currencies.
Cadbury 2009 data is presented on a combined company, pro forma basis.
Net Revenues to Combined Organic Net RevenuesFor the Twelve Months Ended December 31,
($ in millions, except percentages) (Unaudited)
Add back: % Change
GAAP to Non-GAAP Reconciliation
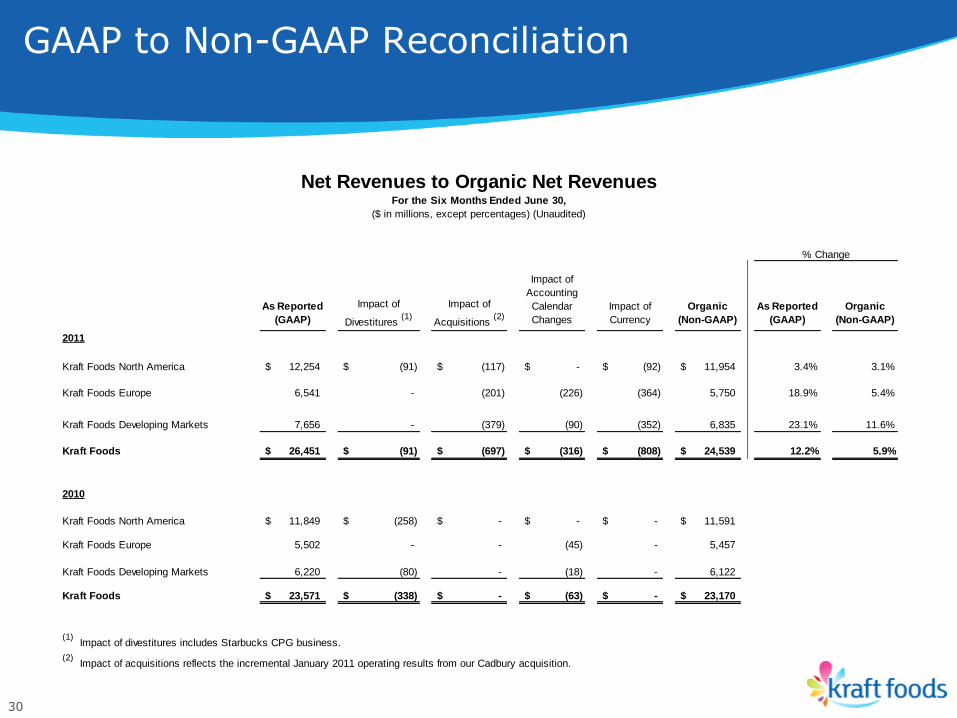
30
As Reported
(GAAP)
Impact of
Divestitures (1)
Impact of
Acquisitions (2)
Impact of
Accounting
Calendar
Changes
Impact of
Currency
Organic
(Non-GAAP)
As Reported
(GAAP)
Organic
(Non-GAAP)
2011
Kraft Foods North America 12,254$ (91)$ (117)$ -$ (92)$ 11,954$ 3.4% 3.1%
Kraft Foods Europe 6,541 - (201) (226) (364) 5,750 18.9% 5.4%
Kraft Foods Developing Markets 7,656 - (379) (90) (352) 6,835 23.1% 11.6%
Kraft Foods 26,451$ (91)$ (697)$ (316)$ (808)$ 24,539$ 12.2% 5.9%
2010
Kraft Foods North America 11,849$ (258)$ -$ -$ -$ 11,591$
Kraft Foods Europe 5,502 - - (45) - 5,457
Kraft Foods Developing Markets 6,220 (80) - (18) - 6,122
Kraft Foods 23,571$ (338)$ -$ (63)$ -$ 23,170$
(1) Impact of divestitures includes Starbucks CPG business.
(2) Impact of acquisitions reflects the incremental January 2011 operating results from our Cadbury acquisition.
Net Revenues to Organic Net RevenuesFor the Six Months Ended June 30,
($ in millions, except percentages) (Unaudited)
% Change
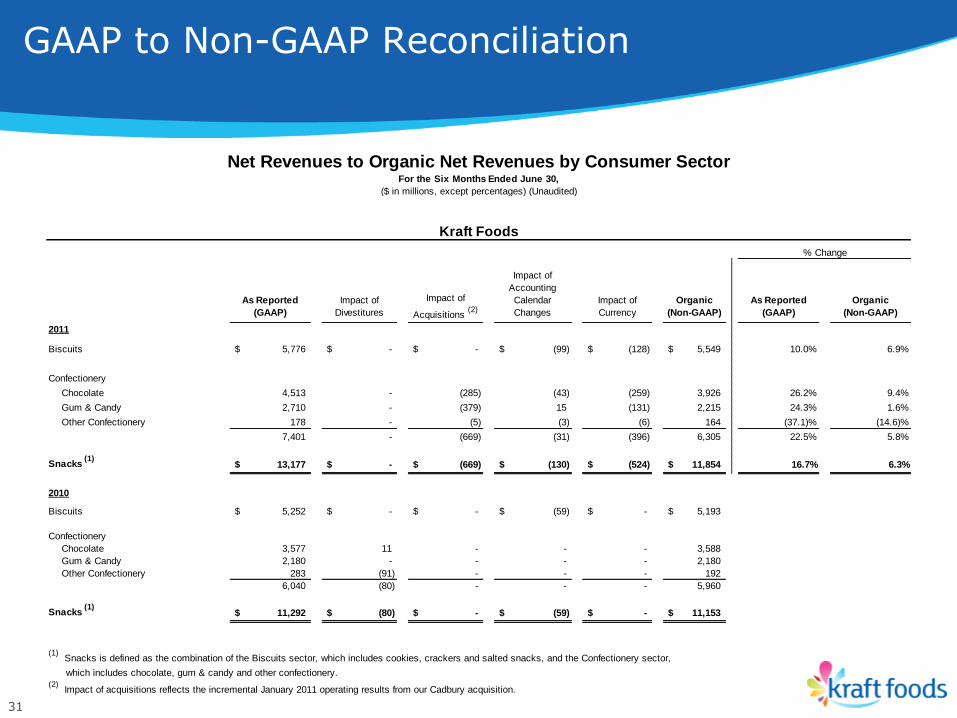
GAAP to Non-GAAP Reconciliation
31
As Reported
(GAAP)
Impact of
Divestitures
Impact of
Acquisitions (2)
Impact of
Accounting
Calendar
Changes
Impact of
Currency
Organic
(Non-GAAP)
As Reported
(GAAP)
Organic
(Non-GAAP)
2011
Biscuits 5,776$ -$ -$ (99)$ (128)$ 5,549$ 10.0% 6.9%
Confectionery
Chocolate 4,513 - (285) (43) (259) 3,926 26.2% 9.4%
Gum & Candy 2,710 - (379) 15 (131) 2,215 24.3% 1.6%
Other Confectionery 178 - (5) (3) (6) 164 (37.1)% (14.6)%
7,401 - (669) (31) (396) 6,305 22.5% 5.8%
Snacks (1)
13,177$ -$ (669)$ (130)$ (524)$ 11,854$ 16.7% 6.3%
2010
Biscuits 5,252$ -$ -$ (59)$ -$ 5,193$
Confectionery
Chocolate 3,577 11 - - - 3,588
Gum & Candy 2,180 - - - - 2,180
Other Confectionery 283 (91) - - - 192
6,040 (80) - - - 5,960
Snacks (1)
11,292$ (80)$ -$ (59)$ -$ 11,153$
(1) Snacks is defined as the combination of the Biscuits sector, which includes cookies, crackers and salted snacks, and the Confectionery sector,
which includes chocolate, gum & candy and other confectionery.(2)
Impact of acquisitions reflects the incremental January 2011 operating results from our Cadbury acquisition.
Net Revenues to Organic Net Revenues by Consumer SectorFor the Six Months Ended June 30,
($ in millions, except percentages) (Unaudited)
Kraft Foods
% Change
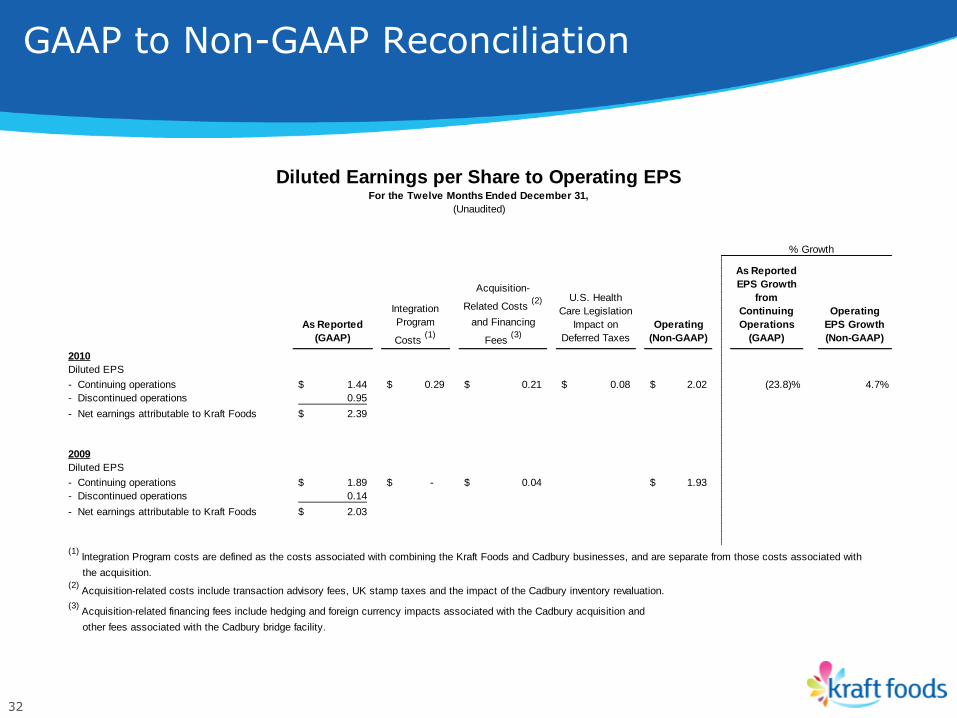
GAAP to Non-GAAP Reconciliation
32
As Reported
(GAAP)
Integration
Program
Costs (1)
Acquisition-
Related Costs (2)
and Financing
Fees (3)
U.S. Health
Care Legislation
Impact on
Deferred Taxes
Operating
(Non-GAAP)
As Reported
EPS Growth
from
Continuing
Operations
(GAAP)
Operating
EPS Growth
(Non-GAAP)
2010
Diluted EPS
- Continuing operations 1.44$ 0.29$ 0.21$ 0.08$ 2.02$ (23.8)% 4.7%
- Discontinued operations 0.95
- Net earnings attributable to Kraft Foods 2.39$
2009
Diluted EPS
- Continuing operations 1.89$ -$ 0.04$ 1.93$
- Discontinued operations 0.14
- Net earnings attributable to Kraft Foods 2.03$
(1) Integration Program costs are defined as the costs associated with combining the Kraft Foods and Cadbury businesses, and are separate from those costs associated with
the acquisition.(2)
Acquisition-related costs include transaction advisory fees, UK stamp taxes and the impact of the Cadbury inventory revaluation.
(3) Acquisition-related financing fees include hedging and foreign currency impacts associated with the Cadbury acquisition and
other fees associated with the Cadbury bridge facility.
% Growth
Diluted Earnings per Share to Operating EPSFor the Twelve Months Ended December 31,
(Unaudited)