Embed Size (px)
Citation preview
Barclays Back-to-School Consumer Conference
Michael Polk
President and Chief Executive Officer
September 4, 2013
Forward-Looking Statement Statements in this presentation that are not historical in nature constitute forward-looking statements. These forward-looking statements relate to information or assumptions about the effects of sales, income/(loss), earnings per share, operating income, operating or gross margin improvements or declines, the European Transformation Plan, Project Renewal, capital and other expenditures, cash flow, dividends, restructuring and restructuring-related costs, costs and cost savings, inflation or deflation, particularly with respect to commodities such as oil and resin, debt ratings, and management's plans, projections and objectives for future operations and performance. These statements are accompanied by words such as "anticipate," "expect," "project," "will," "believe," "estimate" and similar expressions. Actual results could differ materially from those expressed or implied in the forward-looking statements. Important factors that could cause actual results to differ materially from those suggested by the forward-looking statements include, but are not limited to, our dependence on the strength of retail, commercial and industrial sectors of the economy in light of the continuation or escalation of the global economic slowdown or regional sovereign debt issues; currency fluctuations; competition with other manufacturers and distributors of consumer products; major retailers' strong bargaining power; changes in the prices of raw materials and sourced products and our ability to obtain raw materials and sourced products in a timely manner from suppliers; our ability to develop innovative new products and to develop, maintain and strengthen our end-user brands; our ability to expeditiously close facilities and move operations while managing foreign regulations and other impediments; our ability to implement successfully information technology solutions throughout our organization; our ability to improve productivity and streamline operations; changes to our credit ratings; significant increases in the funding obligations related to our pension plans due to declining asset values, declining interest rates or otherwise; the imposition of tax liabilities greater than our provisions for such matters; the risks inherent in our foreign operations and those factors listed in the company’s latest quarterly report on Form 10-Q and Exhibit 99.1 thereto filed with the Securities and Exchange Commission. Changes in such assumptions or factors could produce significantly different results. The information contained in this presentation is as of the date indicated. The company assumes no obligation to update any forward-looking statements contained in this presentation as a result of new information or future events or developments. This presentation contains non-GAAP financial measures within the meaning of Regulation G promulgated by the Securities and Exchange Commission. Included in this presentation is a reconciliation of these non-GAAP financial measures to the most directly comparable financial measures calculated in accordance with GAAP.
Nancy O’Donnell VP, Investor Relations (770) 418-7723 [email protected]
Alisha Dubique Sr. Manager, Investor Relations (770) 418-7706 [email protected]
INVESTOR RELATIONS CONTACTS:
3
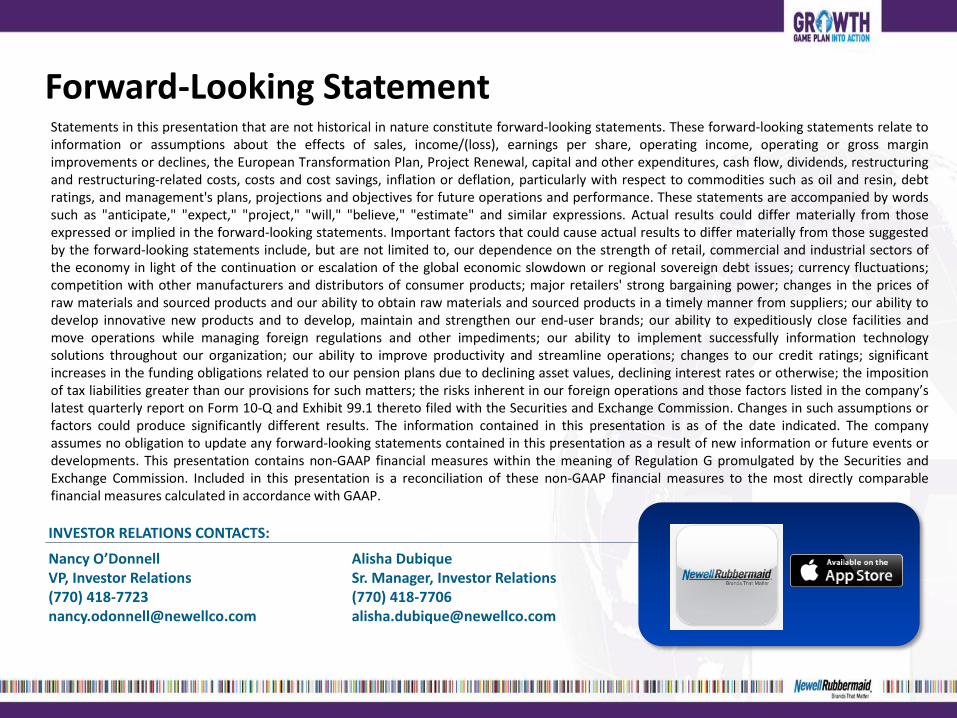
$6B in sales with leading brands in five business segments
writing
tools
home solutions
commercial products
baby
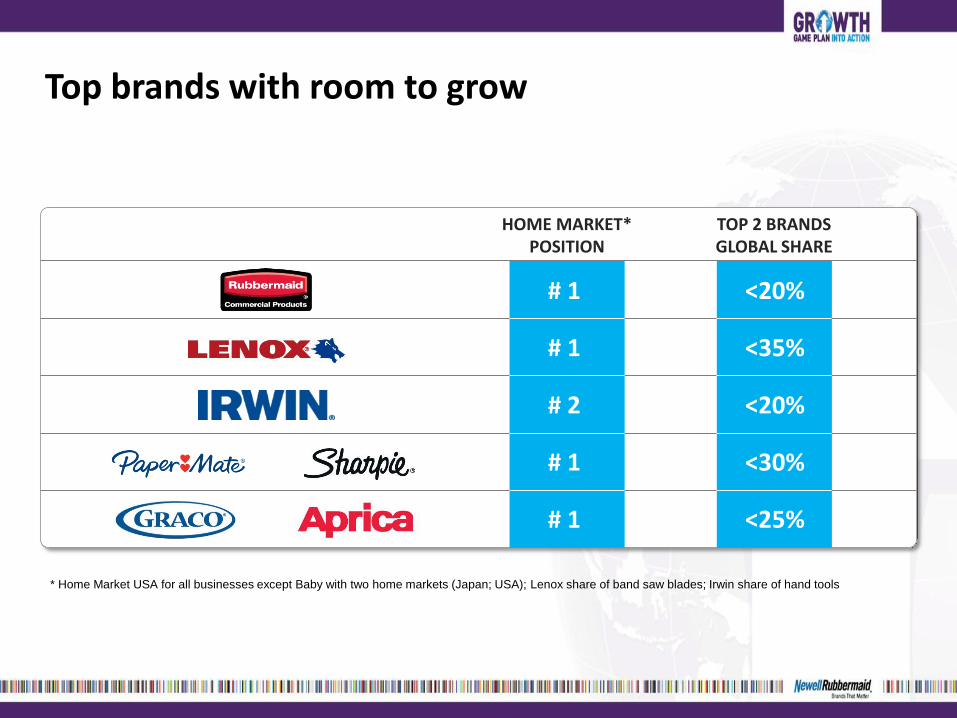
Top brands with room to grow
HOME MARKET* POSITION
TOP 2 BRANDS GLOBAL SHARE
# 1 <20%
# 1 <35%
# 2 <20%
# 1 <30%
# 1 <25%
* Home Market USA for all businesses except Baby with two home markets (Japan; USA); Lenox share of band saw blades; Irwin share of hand tools
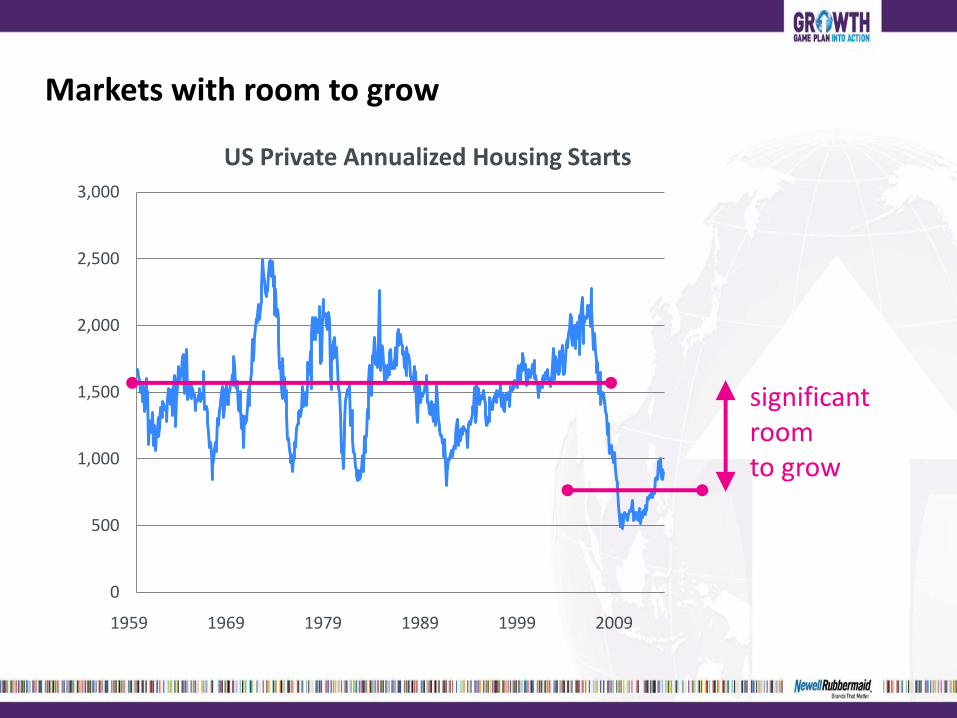
Markets with room to grow
0
500
1,000
1,500
2,000
2,500
3,000
1959 1969 1979 1989
US Private Annualized Housing Starts
1999 2009
significant room to grow
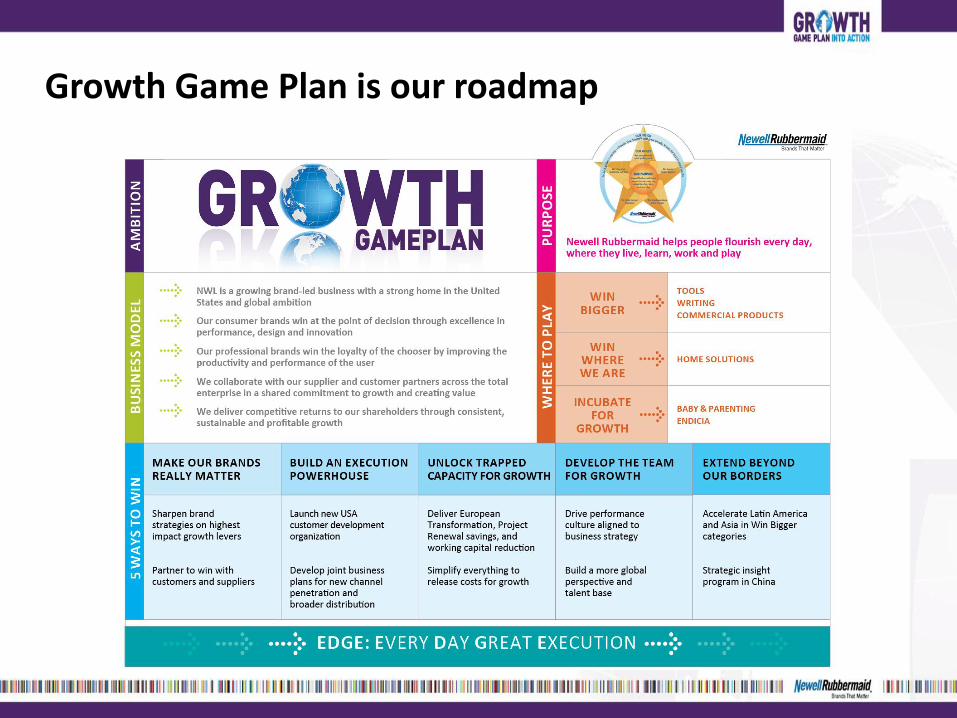
Growth Game Plan is our roadmap
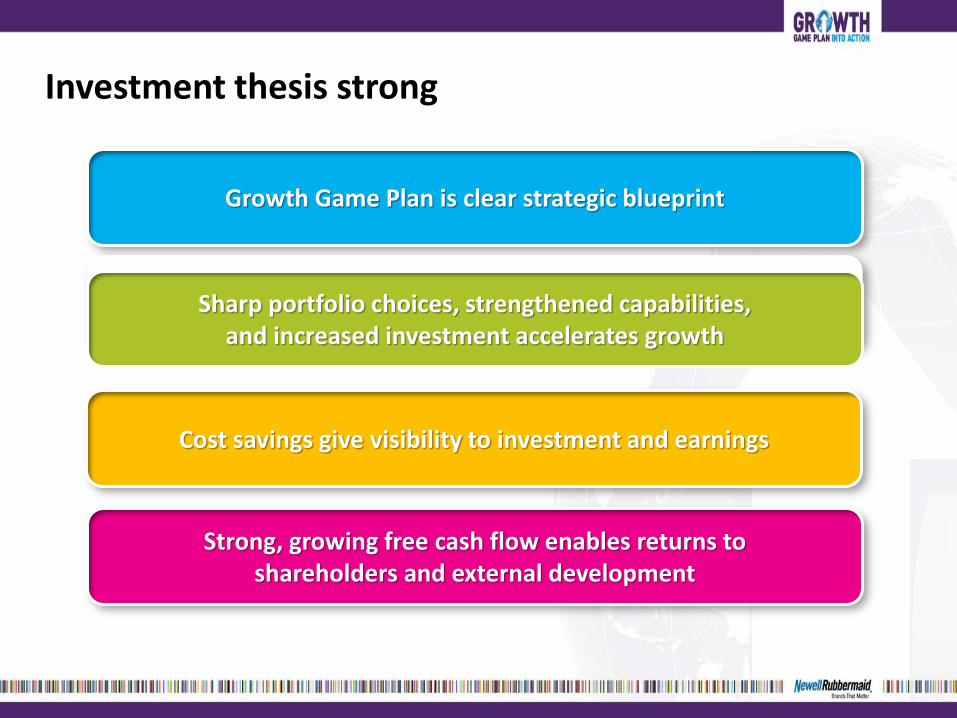
Growth Game Plan is clear strategic blueprint
Cost savings give visibility to investment and earnings
Sharp portfolio choices, strengthened capabilities, and increased investment accelerates growth
Strong, growing free cash flow enables returns to shareholders and external development
Investment thesis strong

We are making good progress
DELIVERY
consistently do what we say
STRATEGIC
shape the future
ACCELERATION
accelerate performance
2013
Core Sales +2-3% EPS* +3-6%
Core Sales +3-4% EPS* +5-8%
Core Sales >4% EPS* +6-9%
* Normalized EPS
2014 2012 2015 2016/17

Growth Game Plan sources of growth
45% 25% 30%

Enabled by reset of margin algorithm
operating income margin %
EMERGING
DEVELOPED
full portfolio, local needs and local price points
investment in sales and marketing
enabled by reducing high cost in developed world
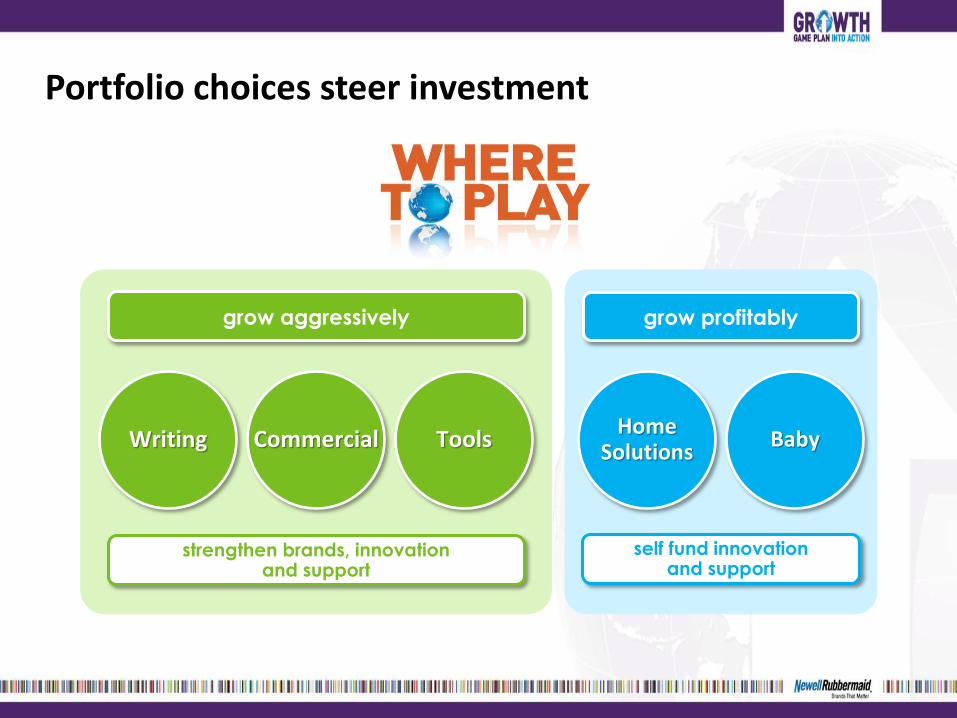
Portfolio choices steer investment
grow profitably
Tools Writing Commercial Home
Solutions Baby
grow aggressively
strengthen brands, innovation and support
self fund innovation and support
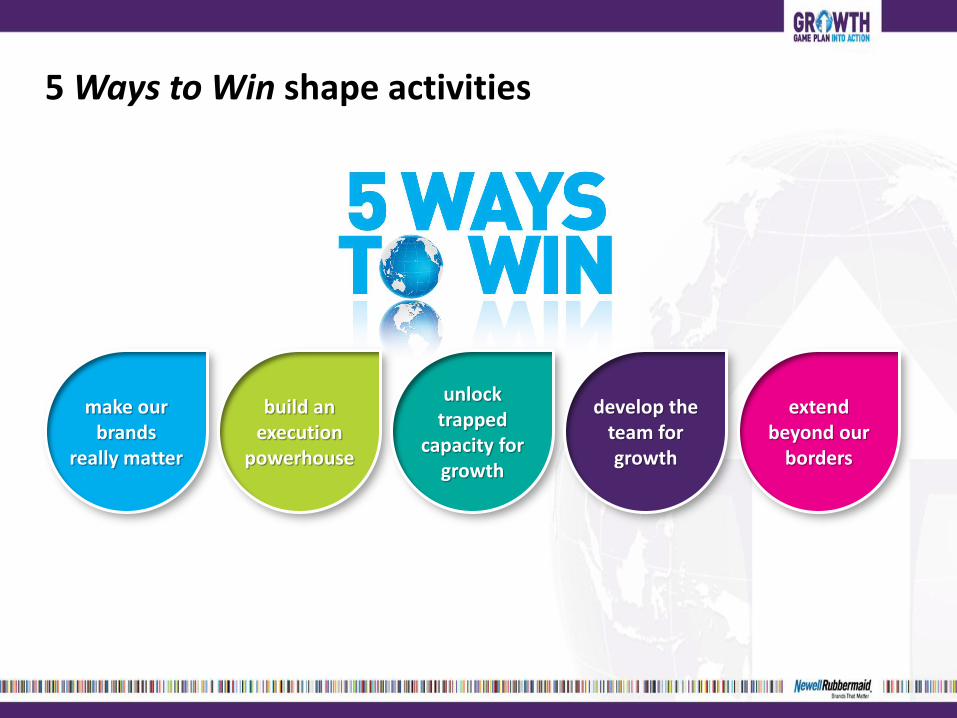
5 Ways to Win shape activities
make our brands
really matter
build an execution
powerhouse
unlock trapped
capacity for growth
develop the team for growth
extend beyond our
borders
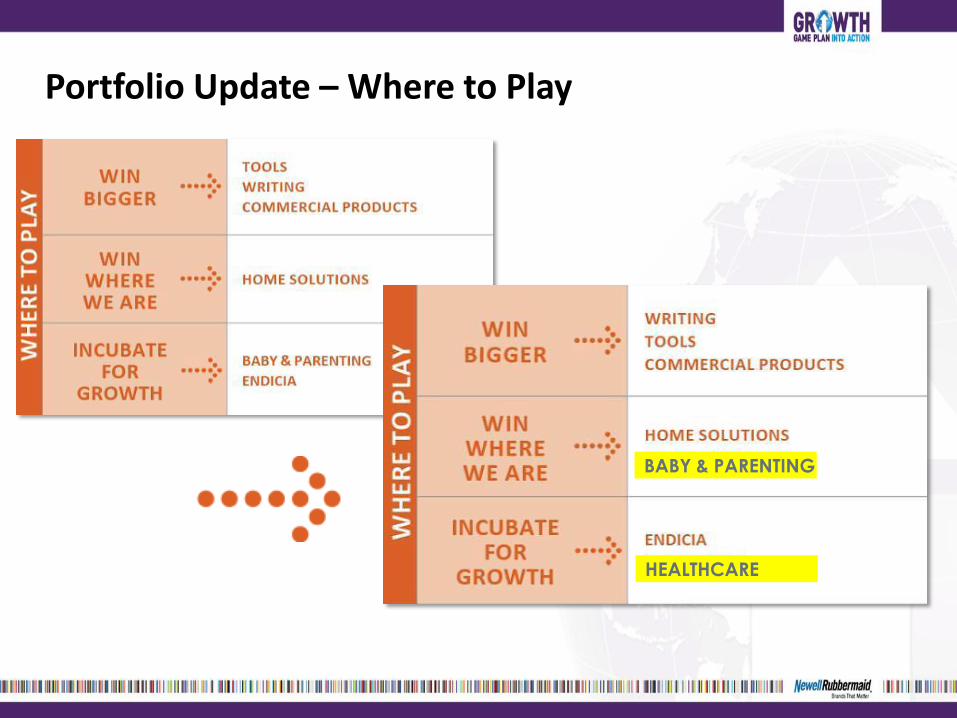
Portfolio Update – Where to Play
BABY & PARENTING
HEALTHCARE
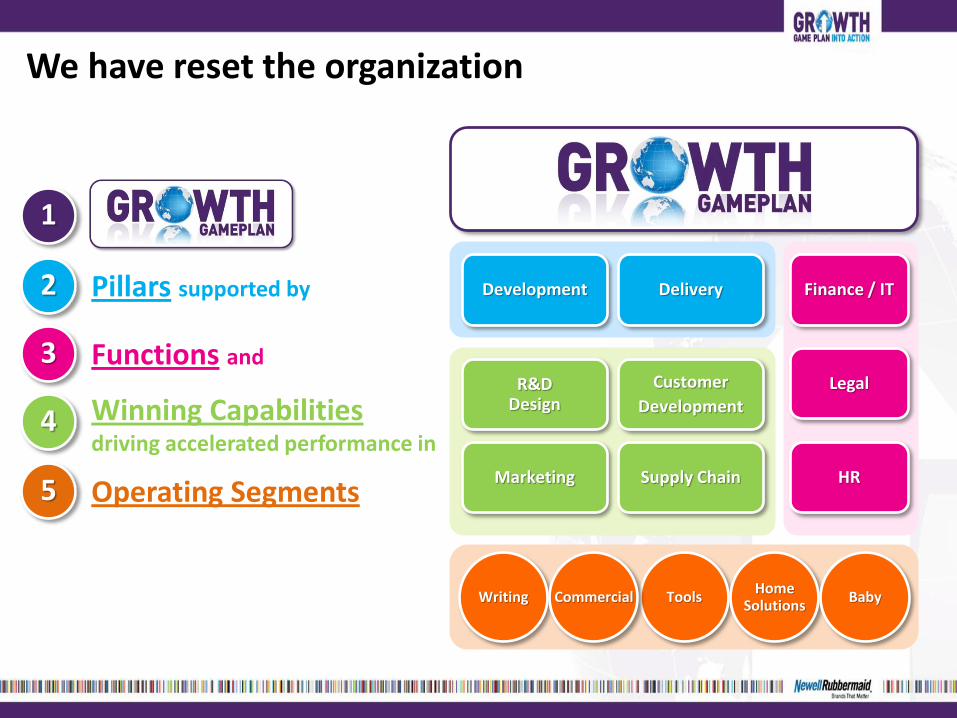
2 Pillars supported by
3 Functions and
4 Winning Capabilities driving accelerated performance in
5 Operating Segments
1
Tools Writing Commercial Home
Solutions Baby
Finance / IT
Legal
HR
R&D Design
Customer
Development
Marketing Supply Chain
Development Delivery
We have reset the organization
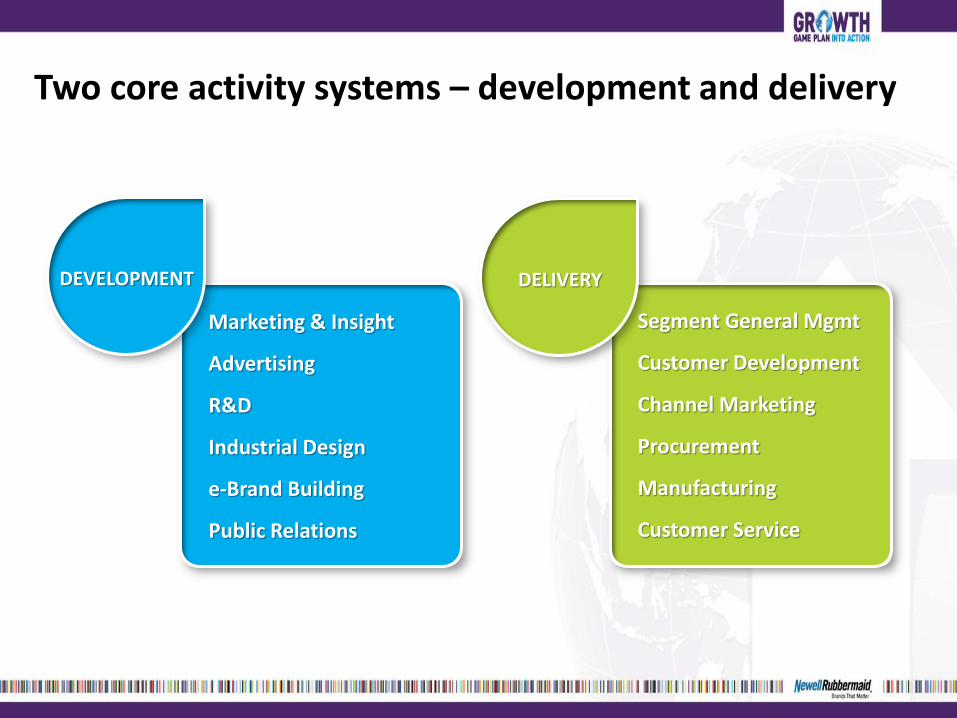
Two core activity systems – development and delivery
Marketing & Insight
Advertising
R&D
Industrial Design
e-Brand Building
Public Relations
Segment General Mgmt
Customer Development
Channel Marketing
Procurement
Manufacturing
Customer Service
DEVELOPMENT DELIVERY

Building four winning capabilities
grow profitably
Home Solutions
Baby
self fund innovation and support
Supply Chain
PLAN
SOURCE
MAKE
DELIVER
SERVE
Customer Development
Design
1000 ideas
Marketing & Insight
doubled insight invest
New InkJoy TV
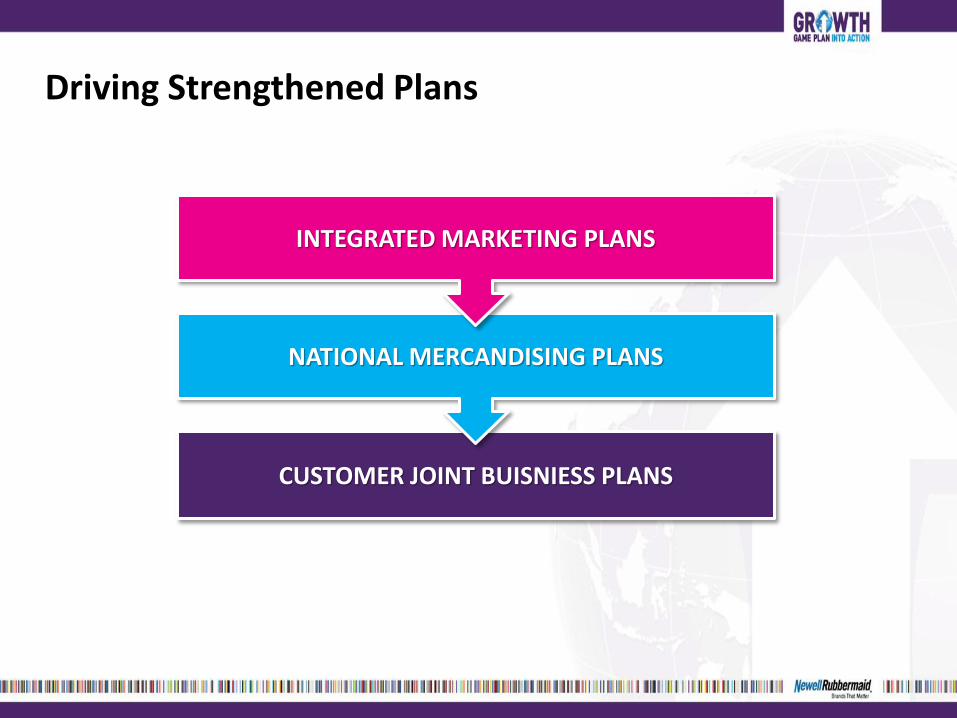
Driving Strengthened Plans
CUSTOMER JOINT BUISNIESS PLANS
NATIONAL MERCANDISING PLANS
INTEGRATED MARKETING PLANS
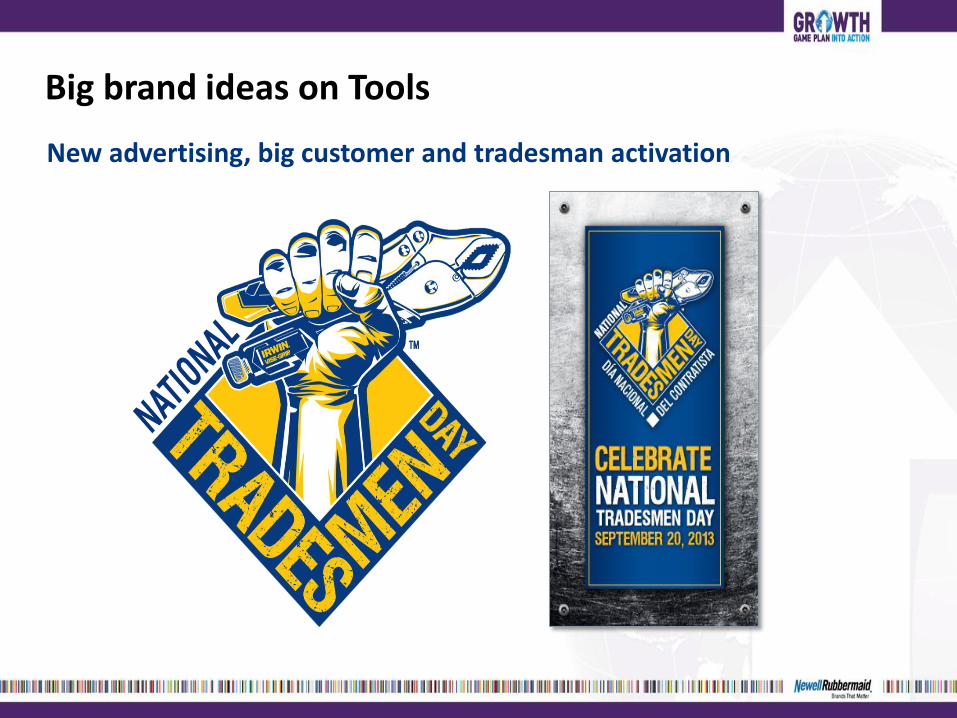
Big brand ideas on Tools
New advertising, big customer and tradesman activation
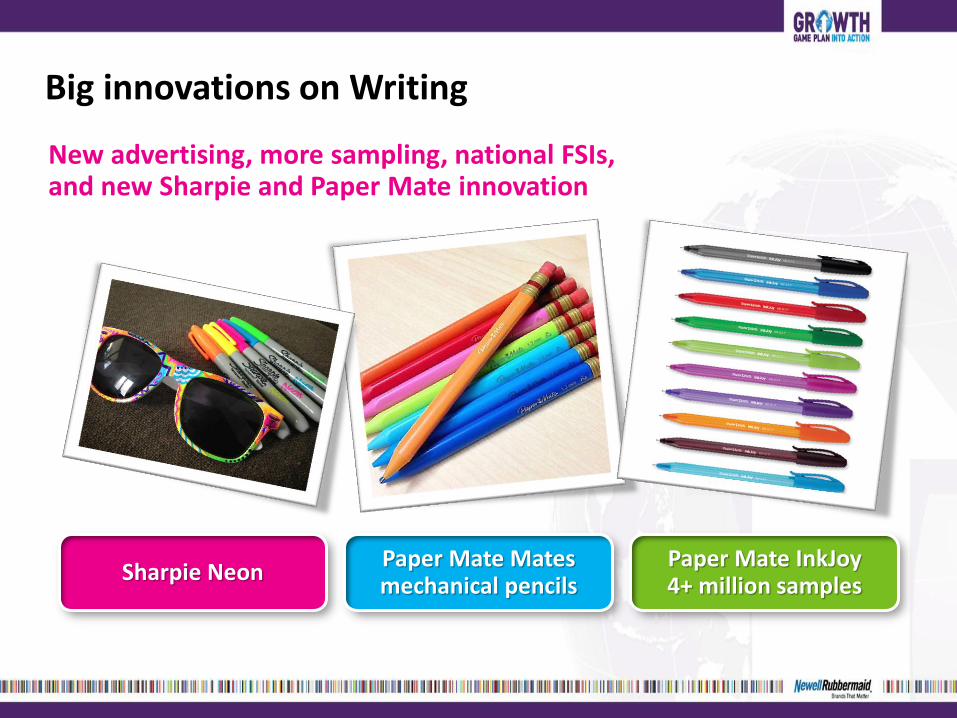
Big innovations on Writing
New advertising, more sampling, national FSIs, and new Sharpie and Paper Mate innovation
Sharpie Neon Paper Mate Mates mechanical pencils
Paper Mate InkJoy 4+ million samples

Big innovations on Baby
Sustained innovation wins in Japan and USA
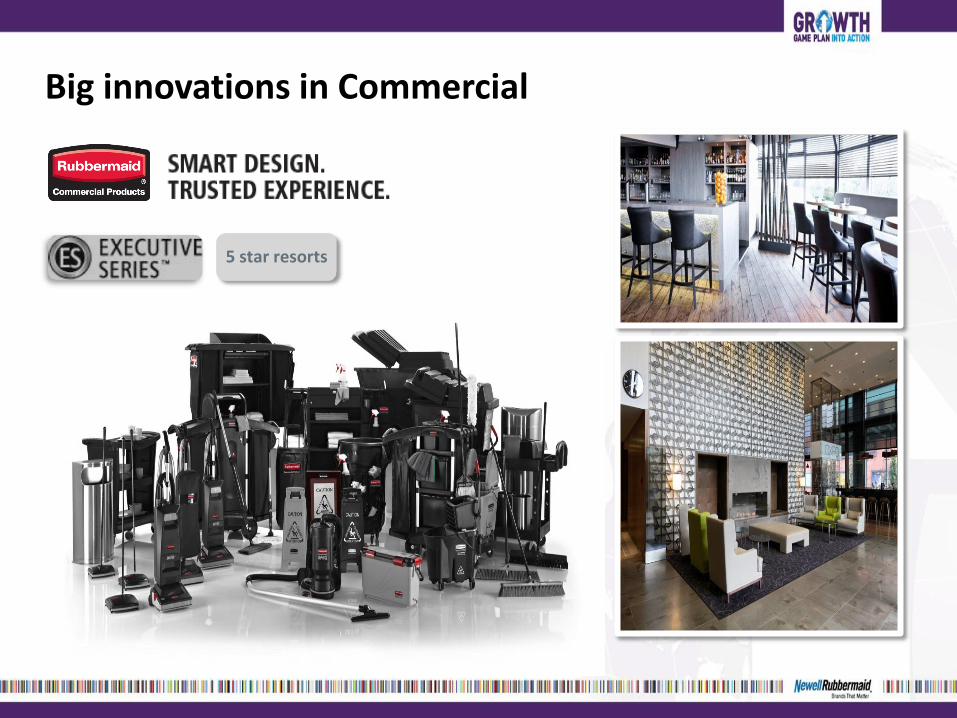
Big innovations in Commercial
5 star resorts

New Platforms on Tools
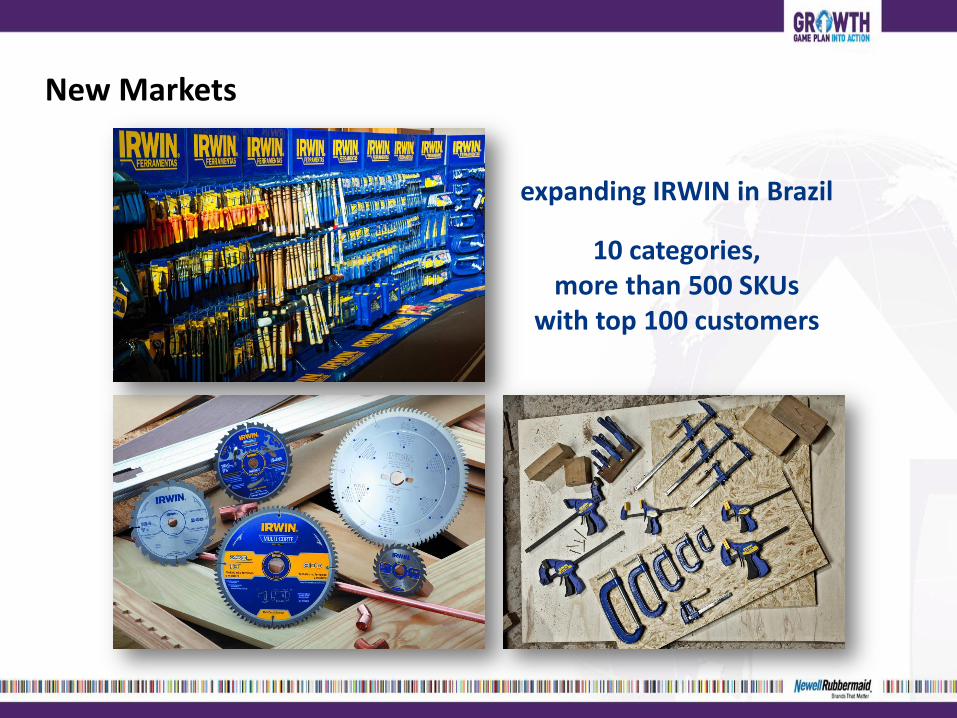
New Markets
expanding IRWIN in Brazil
10 categories, more than 500 SKUs
with top 100 customers
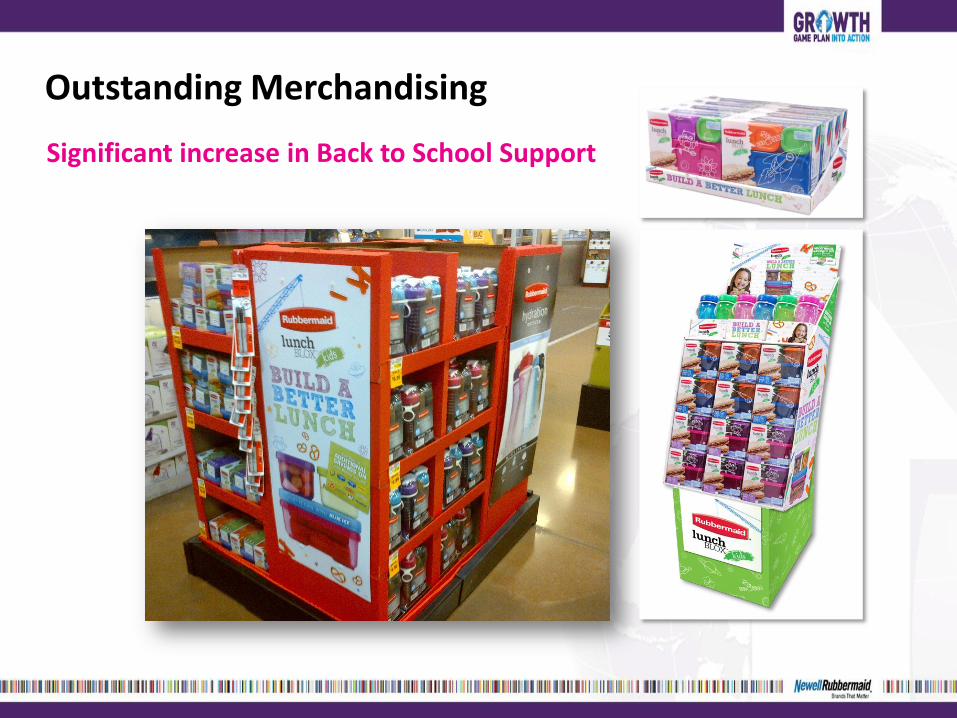
Outstanding Merchandising
Significant increase in Back to School Support
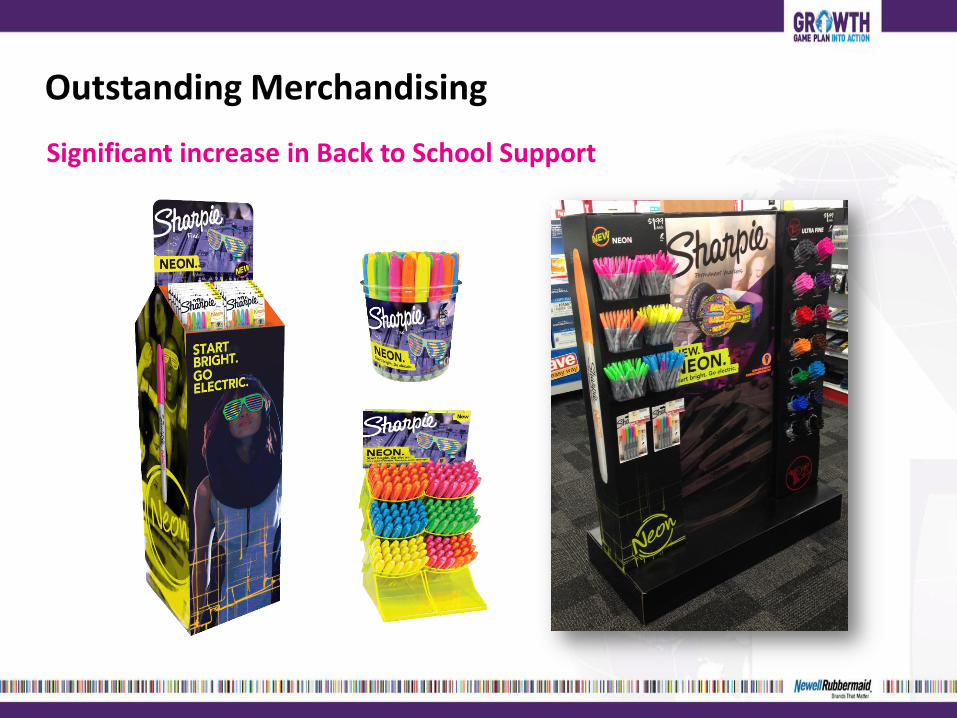
Outstanding Merchandising
Significant increase in Back to School Support
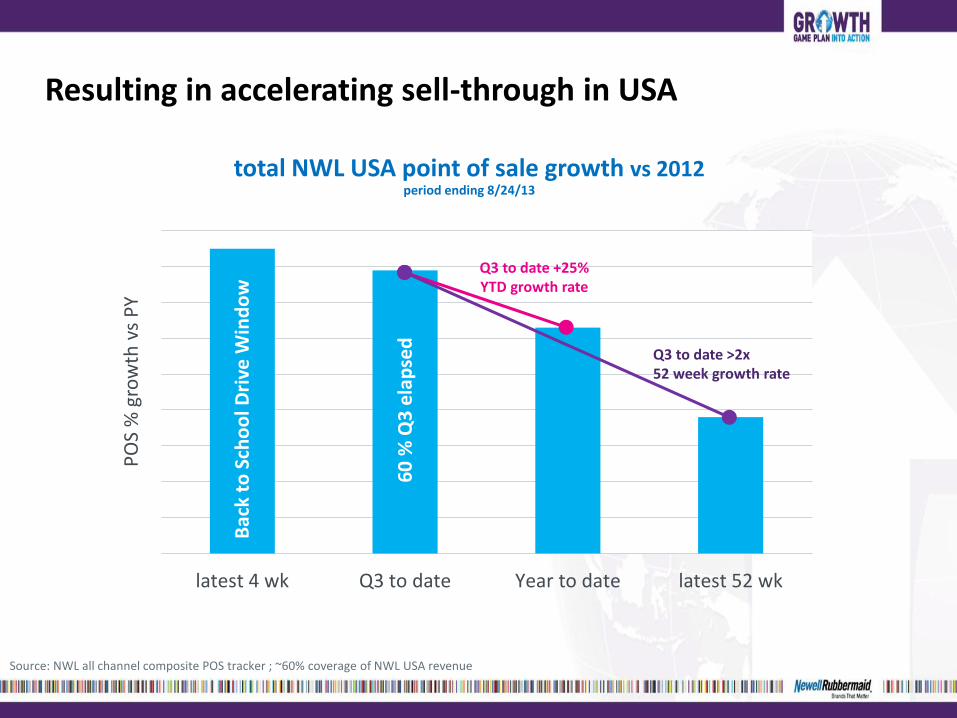
Resulting in accelerating sell-through in USA
latest 4 wk Q3 to date Year to date latest 52 wk
Source: NWL all channel composite POS tracker ; ~60% coverage of NWL USA revenue
PO
S %
gro
wth
vs
PY
Bac
k to
Sch
oo
l Dri
ve W
ind
ow
60
% Q
3 e
lap
sed
Q3 to date +25% YTD growth rate
Q3 to date >2x 52 week growth rate
total NWL USA point of sale growth vs 2012 period ending 8/24/13
And strong momentum across Latin America
Nearly 30% higher core growth rate in 2013
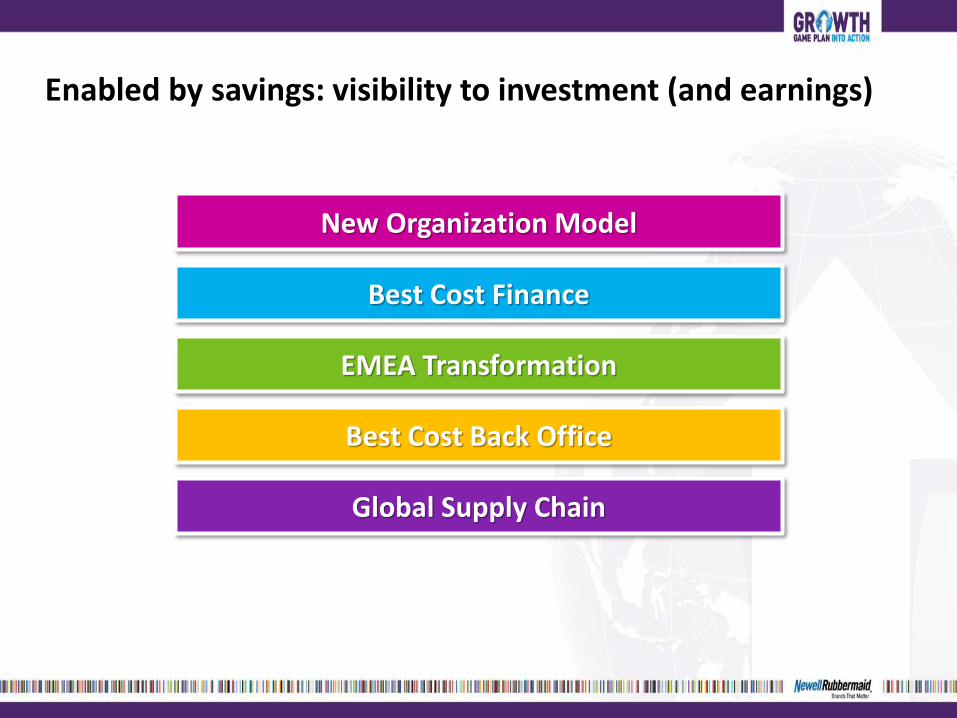
Enabled by savings: visibility to investment (and earnings)
EMEA Transformation
Best Cost Back Office
Best Cost Finance
New Organization Model
Global Supply Chain
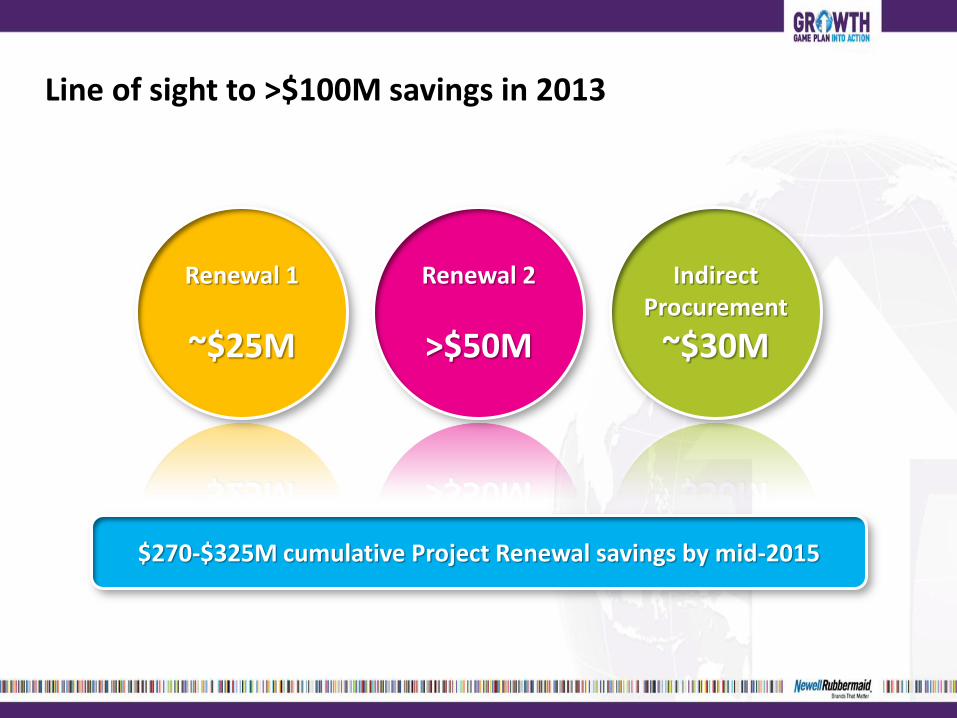
Line of sight to >$100M savings in 2013
Renewal 1
~$25M
Renewal 2
>$50M
Indirect Procurement
~$30M
$270-$325M cumulative Project Renewal savings by mid-2015
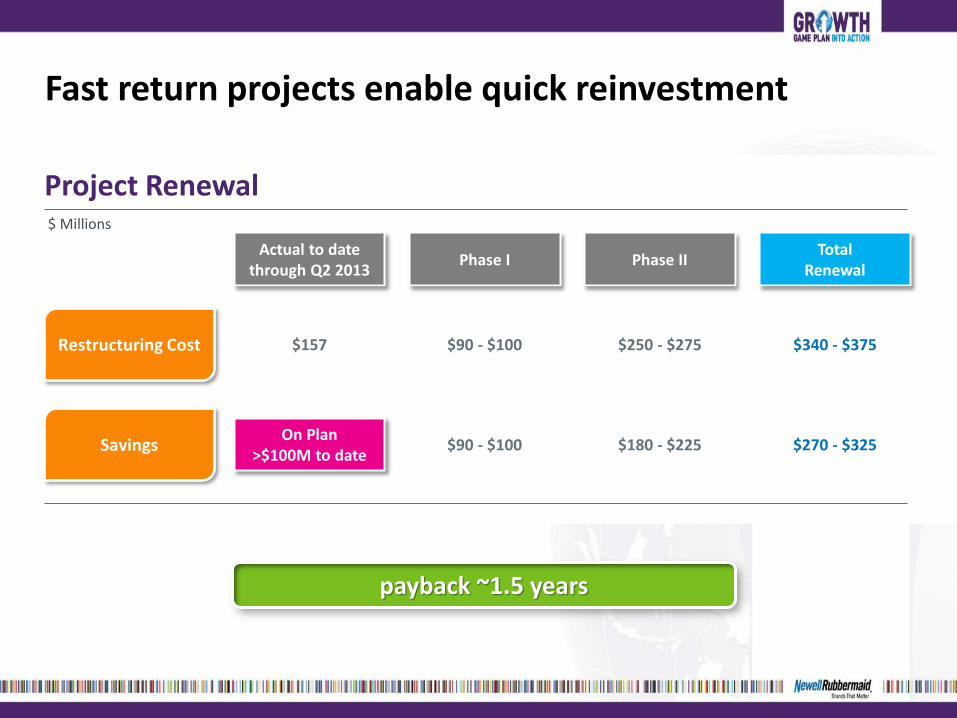
Fast return projects enable quick reinvestment
Restructuring Cost
Savings
Actual to date through Q2 2013
$157 $90 - $100
On Plan >$100M to date
$90 - $100
$ Millions
Phase I
Project Renewal
$250 - $275
$180 - $225
Phase II
$340 - $375
$270 - $325
payback ~1.5 years
Total Renewal
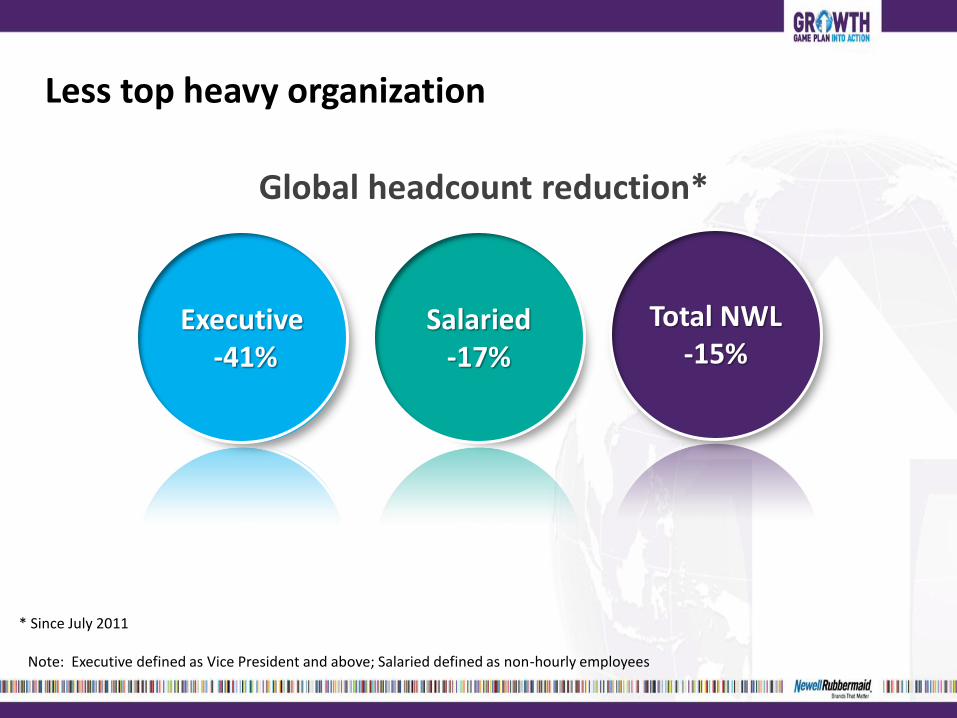
Less top heavy organization
Global headcount reduction*
Executive -41%
Salaried -17%
Total NWL -15%
* Since July 2011
Note: Executive defined as Vice President and above; Salaried defined as non-hourly employees
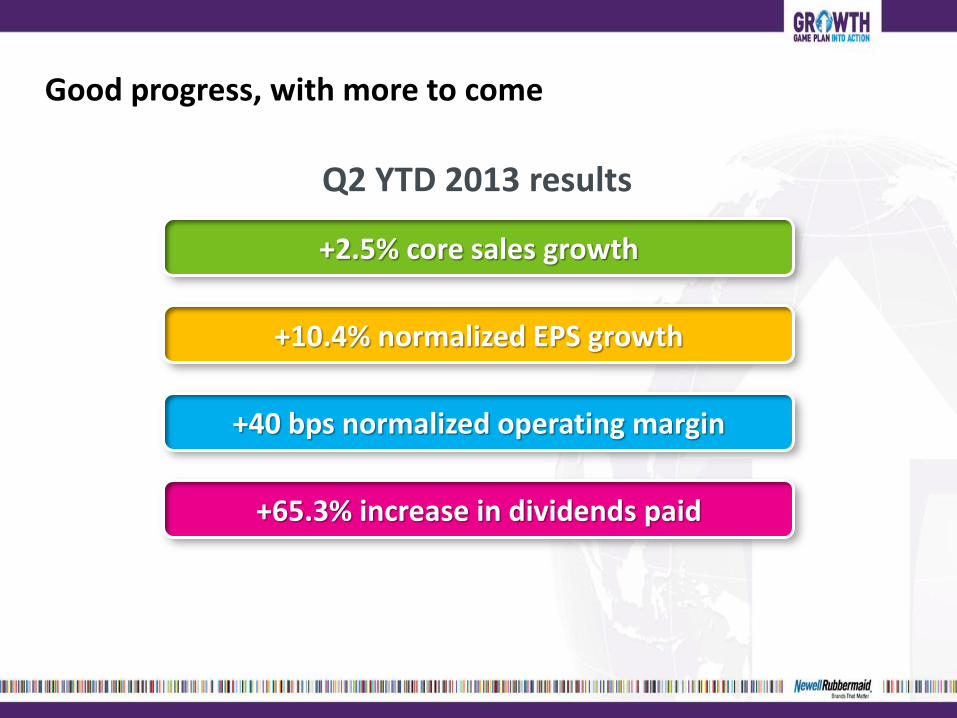
Good progress, with more to come
+2.5% core sales growth
+10.4% normalized EPS growth
+40 bps normalized operating margin
+65.3% increase in dividends paid
Q2 YTD 2013 results
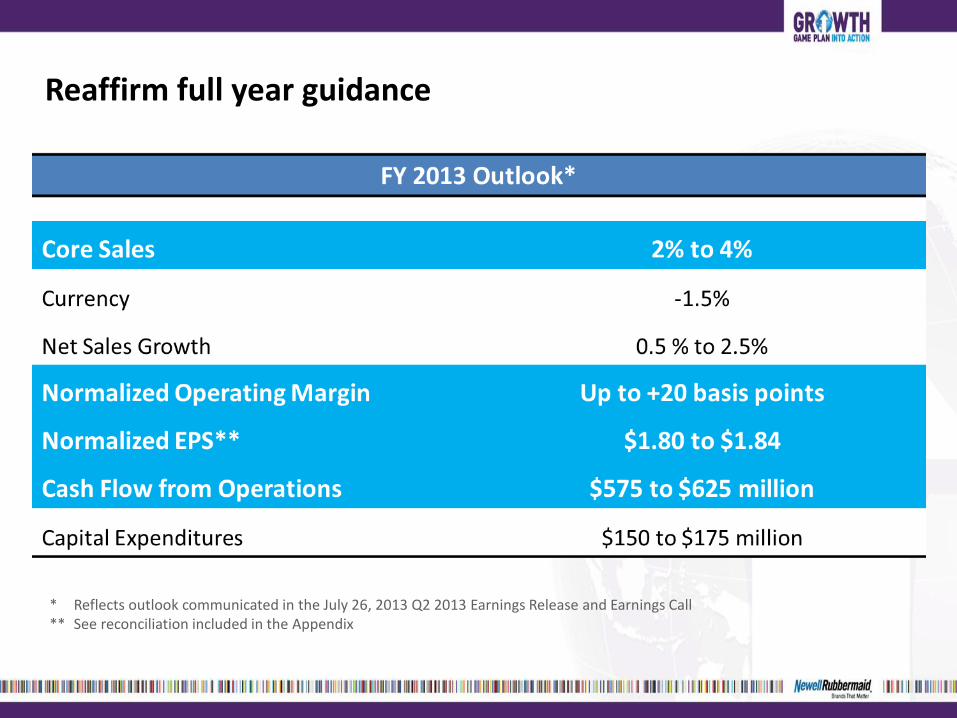
Reaffirm full year guidance
* Reflects outlook communicated in the July 26, 2013 Q2 2013 Earnings Release and Earnings Call ** See reconciliation included in the Appendix
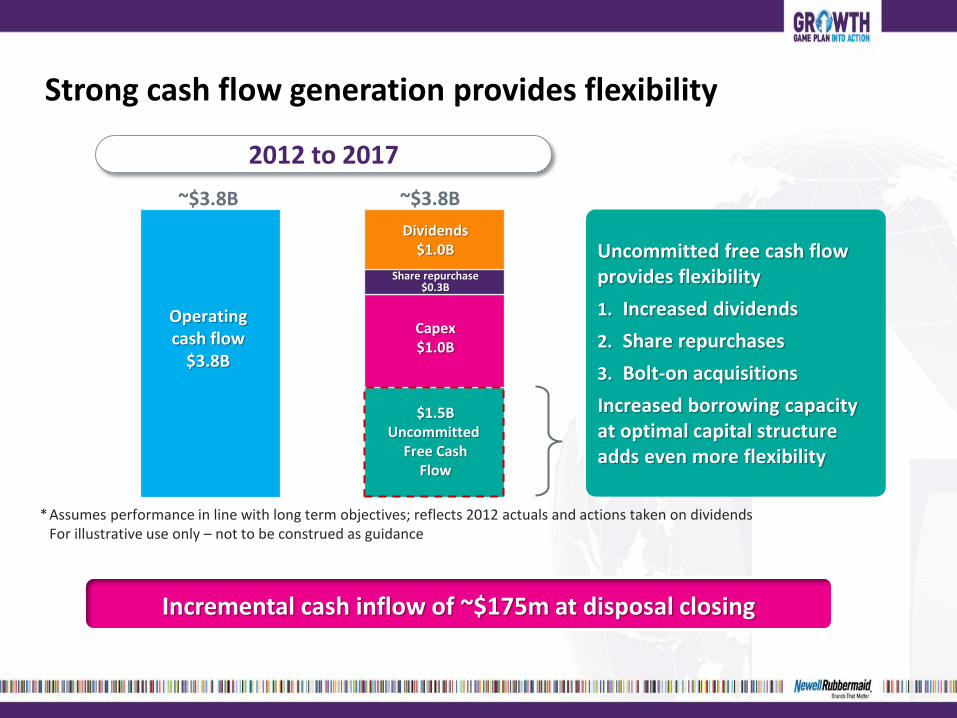
Strong cash flow generation provides flexibility
Operating cash flow
$3.5B
~$1.5 billion in uncommitted free cash flow over next 5 years provides flexibility for:
• Accelerated structural cost reductions
• Increased dividends
• Share repurchase
• Bolt-on acquisitions
Capex $1.0B
Dividends $1.0B
~$3.8B ~$3.8B
Share repurchase $0.3B
$1.5B Uncommitted
Free Cash Flow
Operating cash flow
$3.8B
* Assumes performance in line with long term objectives; reflects 2012 actuals and actions taken on dividends For illustrative use only – not to be construed as guidance
2012 to 2017
Uncommitted free cash flow provides flexibility
1. Increased dividends
2. Share repurchases
3. Bolt-on acquisitions
Increased borrowing capacity at optimal capital structure adds even more flexibility
Incremental cash inflow of ~$175m at disposal closing

Our confidence grows stronger everyday
Clear strategy
Strong, seasoned leadership team
Major increase in funds for investment or earnings
Disciplined, strategic approach to resource allocation
Organization with great capacity to change

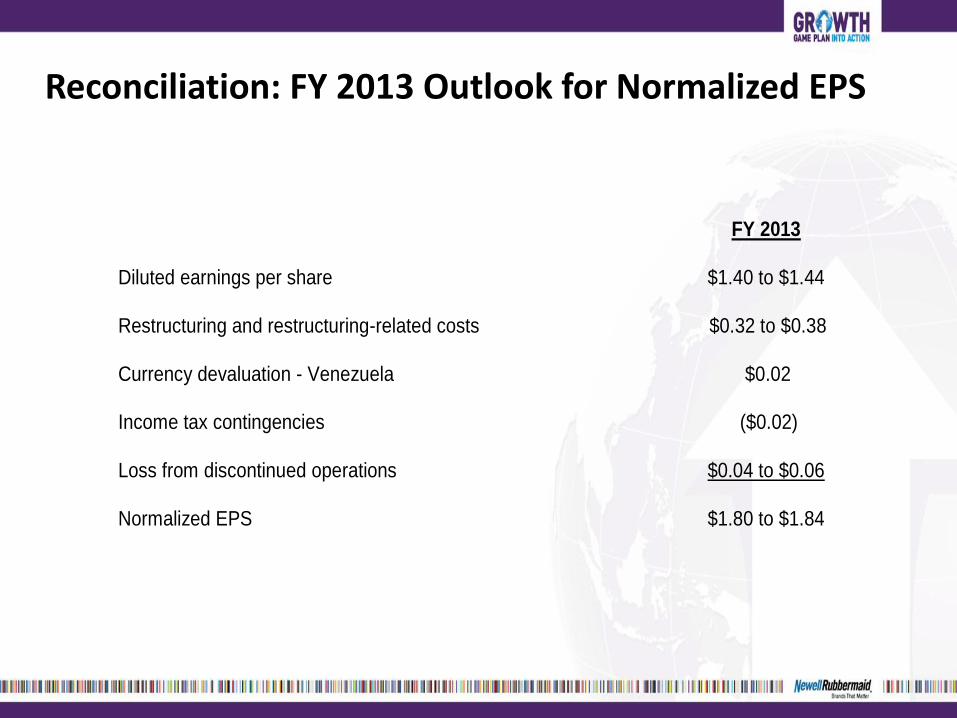
Reconciliation: FY 2013 Outlook for Normalized EPS
FY 2013 Diluted earnings per share $1.40 to $1.44
Restructuring and restructuring-related costs Currency devaluation - Venezuela Income tax contingencies Loss from discontinued operations
$0.32 to $0.38 $0.02 ($0.02)
$0.04 to $0.06
Normalized EPS $1.80 to $1.84