Embed Size (px)
Citation preview
Barking and Dagenham Retail and Town Centre Study Update Report
London Borough of Barking and Dagenham
September 2019
© 2019 Nathaniel Lichfield & Partners Ltd, trading as Lichfields. All Rights Reserved. Registered inEngland, no. 2778116. 14 Regent’s Wharf, All Saints Street, London N1 9RL Formatted for double sided printing. Plans based upon Ordnance Survey mapping with the permission of Her Majesty’s Stationery Office. © Crown Copyright reserved. Licence number AL50684A 13613/01/PW/PW 17754903v2

Barking and Dagenham Retail and Town Centre Study : Update Report
Executive Summary Objectives
All local authorities are required to assess the need for new town centres over the development plan period and should allocate sites to meet future growth. Town centre are under-going rapid changes. A positive and flexible approach should be adopted that can respond to the future Borough’s future needs.
The National Planning Policy Framework (NPPF, 2019) indicates that local plans should allocate a range of suitable sites to meet the scale and type of retail, leisure and other development needed in town centres, for at least 10 years. To accommodate growth, local planning authorities should assess the need to expand town centres to ensure a sufficient supply of suitable sites. The NPPF indicates local planning authorities should seek to focus development within town centres.
To meet these objectives, Lichfields was commissioned by the London Borough of Barking and Dagenham (LBBD) to prepare the Borough wide Economic Development Study May 2014 (EDS). Since 2014 town centres have experienced seismic changes and the economic climate is very difference. A fresh analysis is new required to underpin the Council’s emerging new development plan.
The existing situation
The recovery from the last recession has been slower than expected. This economic climate and Brexit uncertainties have had a significant impact on the retail and leisure sectors. Market conditions are still very challenging. New forms of retailing (multi-channel shopping) have continued to grow. The continuation of these trends will present significant challenges to town centres. Town centre needs to serve a viable role and need to diversify.
The shopping hierarchy in Barking is complex. Customers have a wide range and choice of destination. Barking town centre continues to be the main shopping centre in the Borough, support by smaller district centres at Dagenham Heathway, Chadwell Heath and Green Lane, and a large number of neighbourhood centres of varying size. The existing provision of shopping centres within the Borough continues to offer a balanced distribution of facilities serving local communities. However, competition from multi-channel shopping and larger competing centres is fierce e.g. Romford, Lakeside and Central London. This competition restricts the Borough’s market share of expenditure and its ability to attract new investment.
Barking town centre continues to provide a reasonable number of convenience and comparison retail units and a mix of both multiple and independent traders. The centre is particularly strong within the value/discount sector supported by the street market stalls. Shopping facilities are supported by a variety of non-retail services, community and leisure facilities. The centre has a good provision of banks, hairdressers, estate agents, café, takeaways and community facilities. However, the evening economy in terms of restaurants, leisure and entertainment facilities could be improved.
Dagenham Heathway, Chadwell Heath and Green Lane are strong community based centres. They have a good range of retail and non-retail services which primarily serve the day to day needs of their local catchment area. Their comparison shopping offer is focused on lower order day to day products. Food and grocery shopping is a key element of these centre’s overall attraction.
Residents in the Borough have relatively good access to range of commercial leisure and entertainment, including facilities in neighbouring Boroughs (good access by car) and Central London (good access by public transport). The main concentration of commercial leisure uses is at Dagenham Leisure Park, which includes Vue multiplex cinema, bingo hall, ten-pin bowling, health and fitness suite, McDonald’s and a budget hotel.
Future requirements
Population and expenditure growth over the plan period up to 2034 should provide potential for new investment, if the Borough can maintain its current market share.
Barking and Dagenham Retail and Town Centre Study : Update Report
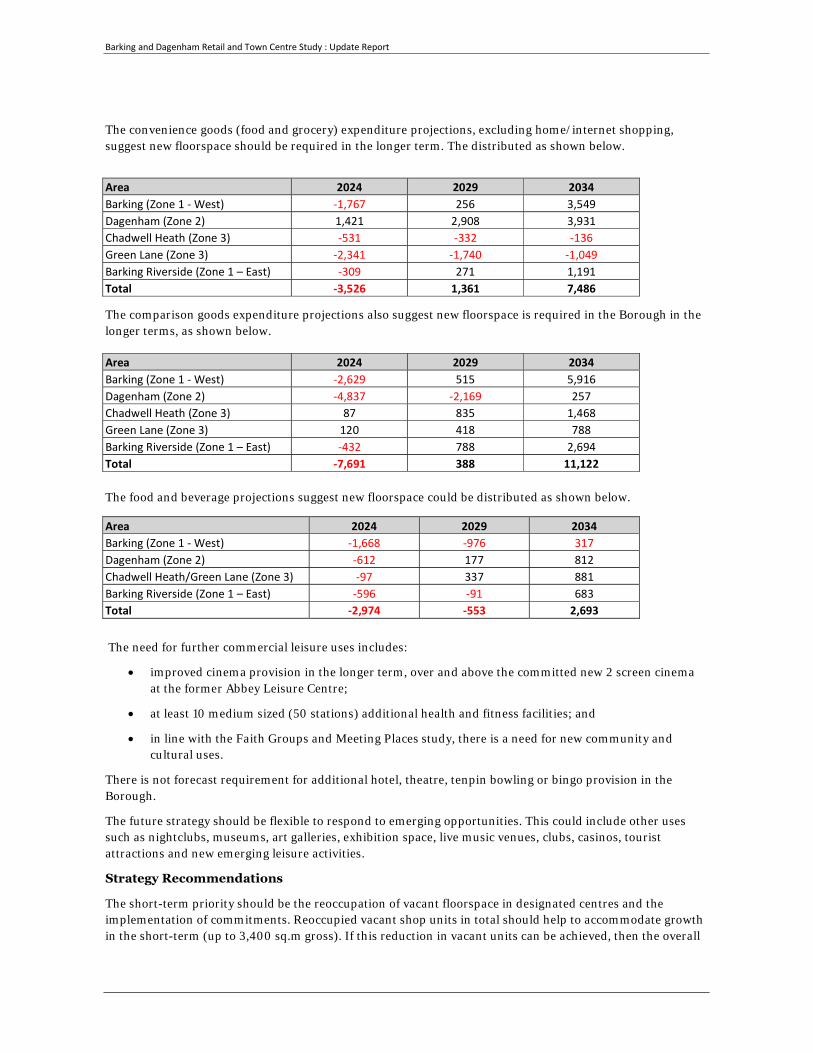
The convenience goods (food and grocery) expenditure projections, excluding home/internet shopping, suggest new floorspace should be required in the longer term. The distributed as shown below.
Area 2024 2029 2034 Barking (Zone 1 - West) -1,767 256 3,549 Dagenham (Zone 2) 1,421 2,908 3,931 Chadwell Heath (Zone 3) -531 -332 -136 Green Lane (Zone 3) -2,341 -1,740 -1,049 Barking Riverside (Zone 1 – East) -309 271 1,191 Total -3,526 1,361 7,486
The comparison goods expenditure projections also suggest new floorspace is required in the Borough in the longer terms, as shown below.
The food and beverage projections suggest new floorspace could be distributed as shown below.
The need for further commercial leisure uses includes:
• improved cinema provision in the longer term, over and above the committed new 2 screen cinema at the former Abbey Leisure Centre;
• at least 10 medium sized (50 stations) additional health and fitness facilities; and
• in line with the Faith Groups and Meeting Places study, there is a need for new community and cultural uses.
There is not forecast requirement for additional hotel, theatre, tenpin bowling or bingo provision in the Borough.
The future strategy should be flexible to respond to emerging opportunities. This could include other uses such as nightclubs, museums, art galleries, exhibition space, live music venues, clubs, casinos, tourist attractions and new emerging leisure activities.
Strategy Recommendations
The short-term priority should be the reoccupation of vacant floorspace in designated centres and the implementation of commitments. Reoccupied vacant shop units in total should help to accommodate growth in the short-term (up to 3,400 sq.m gross). If this reduction in vacant units can be achieved, then the overall
Area 2024 2029 2034 Barking (Zone 1 - West) -2,629 515 5,916 Dagenham (Zone 2) -4,837 -2,169 257 Chadwell Heath (Zone 3) 87 835 1,468 Green Lane (Zone 3) 120 418 788 Barking Riverside (Zone 1 – East) -432 788 2,694 Total -7,691 388 11,122
Area 2024 2029 2034 Barking (Zone 1 - West) -1,668 -976 317 Dagenham (Zone 2) -612 177 812 Chadwell Heath/Green Lane (Zone 3) -97 337 881 Barking Riverside (Zone 1 – East) -596 -91 683 Total -2,974 -553 2,693
Barking and Dagenham Retail and Town Centre Study : Update Report
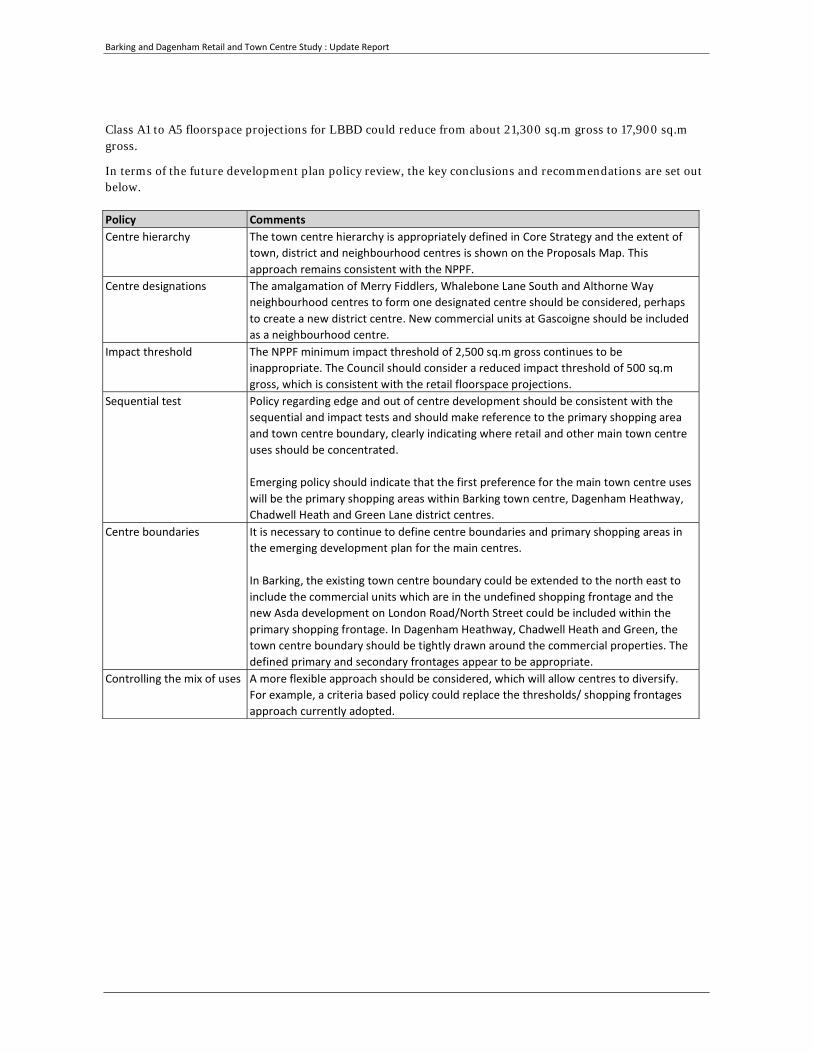
Class A1 to A5 floorspace projections for LBBD could reduce from about 21,300 sq.m gross to 17,900 sq.m gross.
In terms of the future development plan policy review, the key conclusions and recommendations are set out below. Policy Comments Centre hierarchy The town centre hierarchy is appropriately defined in Core Strategy and the extent of
town, district and neighbourhood centres is shown on the Proposals Map. This approach remains consistent with the NPPF.
Centre designations The amalgamation of Merry Fiddlers, Whalebone Lane South and Althorne Way neighbourhood centres to form one designated centre should be considered, perhaps to create a new district centre. New commercial units at Gascoigne should be included as a neighbourhood centre.
Impact threshold The NPPF minimum impact threshold of 2,500 sq.m gross continues to be inappropriate. The Council should consider a reduced impact threshold of 500 sq.m gross, which is consistent with the retail floorspace projections.
Sequential test Policy regarding edge and out of centre development should be consistent with the sequential and impact tests and should make reference to the primary shopping area and town centre boundary, clearly indicating where retail and other main town centre uses should be concentrated. Emerging policy should indicate that the first preference for the main town centre uses will be the primary shopping areas within Barking town centre, Dagenham Heathway, Chadwell Heath and Green Lane district centres.
Centre boundaries It is necessary to continue to define centre boundaries and primary shopping areas in the emerging development plan for the main centres. In Barking, the existing town centre boundary could be extended to the north east to include the commercial units which are in the undefined shopping frontage and the new Asda development on London Road/North Street could be included within the primary shopping frontage. In Dagenham Heathway, Chadwell Heath and Green, the town centre boundary should be tightly drawn around the commercial properties. The defined primary and secondary frontages appear to be appropriate.
Controlling the mix of uses A more flexible approach should be considered, which will allow centres to diversify. For example, a criteria based policy could replace the thresholds/ shopping frontages approach currently adopted.

Barking and Dagenham Retail and Town Centre Study : Update Report
Contents 1.0 Introduction 1
Barking and Dagenham Economic Development Study 2014 1
Update Report 2019 Objectives 1
2.0 National planning policy 3
3.0 Retail and town centre hierarchy 7
The London Plan Hierarchy 7
Relative Attraction of Centres 9
Property Indicators 12
Retail Provision in LBBD 12
4.0 Barking town centre health check 20
Key roles 20
Mix of uses 20
Vacancy Rate 22
Accessibility 22
Environmental Quality 23
SWOT Analysis 23
5.0 Dagenham Heathway health check 27
Key Roles 27
Mix of Uses 27
SWOT analysis 30
6.0 Chadwell Heath health check 32
Key Roles 32
Mix of Uses 32
SWOT analysis 35
7.0 Green Lane health check 37
Key Roles 37
Mix of Uses 37
SWOT analysis 40
8.0 Other centres and destinations 41
Retail warehouse and leisure parks 41
Barking and Dagenham Retail and Town Centre Study : Update Report
9.0 Local centres 42
10.0 Retail capacity assessment 46
Population and Expenditure 47
Existing Retail Floorspace 2019 47
Existing Spending Patterns 47
Capacity for Convenience Goods Floorspace 49
Capacity for Comparison Goods Floorspace 50
11.0 Other Town Centre Uses 53
Food and beverage 53
Other Class A1 and A2 Service Uses 56
Commercial Leisure 56
12.0 Accommodating Growth 64
Introduction 64
Strategy for accommodating growth 65
Development Opportunities 66
13.0 Policy Review 69
Introduction 69
Scale of Development 70
Review of Centre Boundaries and Frontages 71
14.0 Conclusion 78
Retail and food/beverage floorspace capacity 78
Other Main Town Centre Uses 78
Strategy for Accommodating Growth 79
Policy Review 79
Future Monitoring 80
Barking and Dagenham Retail and Town Centre Study : Update Report
Figures Figure 3.1 London Borough of Barking and Dagenham Town and District Centres 8
Figure 9.1 Local Needs Index 45
Figure 10.1 LBBD Study Area 46
Figure 11.1 Existing Hotel Accommodation in LBBD 62
Figure 13.1 Suggested amendments to town centre boundary 72
Figure 13.2 Suggested amendments to Barking town centre retail frontage 76
Tables Table 3.1 Javelin’s Venuescore UK shopping Index 10
Table 3.2 Retail and service provision in London Borough of Barking and Dagenham and other selected centres 13
Table 4.1 Mix of Uses (Class A1 – A5) - Barking 20
Table 4.2 Mix of Comparison Uses - Barking 21
Table 4.3 Mix of Service Uses - Barking 22
Table 5.1 Mix of Uses (Class A1 – A5) – Dagenham Heathway 27
Table 5.2 Mix of Comparison Uses – Dagenham Heathway 28
Table 6.1 Mix of Uses - Chadwell Heath 32
Table 6.2 Mix of Comparison Retailers - Chadwell Heath 33
Table 6.3 Mix of Service Uses - Chadwell Heath 34
Table 7.1 Mix of Uses - Green Lane 37
Table 7.2 Mix of Comparison Retailers - Green Lane 38
Table 7.3 Mix of Service Uses - Green Lane 39
Table 10.1 Comparison Average Sales Densities 48
Table 10.2 Convenience Goods Floorspace Capacity (sq.m gross) 50
Table 10.3 Comparison Goods Floorspace Capacity (sq.m gross) 52
Table 11.1 GB Goad Plan Town Centres Use Class Mix 54
Table 11.2 Food and Beverage Floorspace Capacity (sq.m gross) 55
Table 11.3 Cinema Potential in LBBD 57
Table 11.4 LBBD Health and Fitness Suites 58
Table 11.5 Existing Hotel Provision in LBBD 62
Table 11.6 Hotel Planning Permissions 63

Barking and Dagenham Retail and Town Centre Study : Update Report
Table 12.1 Summary of Class A1, A3 to A5 Floorspace Requirements up to 2029 (sq.m gross) 64
Table 14.1 Convenience goods capacity up to 2034 (sq.m gross) 78
Table 14.2 Comparison goods capacity up to 2034 (sq.m gross) 78
Table 14.3 Food and beverage capacity up to 2034 (sq.m gross) 78
Barking and Dagenham Retail and Town Centre Study : Update Report
Appendices Appendix 1 Barking Goad Plan
Appendix 2 Dagenham Heathway Goad Plan
Appendix 3 Chadwell Heath Goad Plan
Appendix 4 Green Lane Goad Plan
Appendix 5 Methodology
Appendix 6 Study Area
Appendix 7 Convenience Goods Capacity
Appendix 8 Comparison Goods Capacity
Appendix 9 Food and Beverage Capacity
Appendix 10 Development Opportunities

Barking and Dagenham Retail and Town Centre Study : Update Report
Pg 1
1.0 Introduction Barking and Dagenham Economic Development Study 2014
1.1 Lichfields was commissioned by the London Borough of Barking and Dagenham (LBBD) to prepare the Borough wide Economic Development Study May 2014 (EDS). This report provides a partial update of the EDS, relating to retail and leisure uses.
1.2 The main objectives of the EDS in relation to retail and other town centre uses were to identify:
1 the quantitative and qualitative need for convenience and comparison floorspace for main town centre uses in Barking and Dagenham from 2012-2016, 2017-21, 2022-2027 and 2028-2032;
2 any deficiencies in the provision of convenience and comparison shopping and other facilities which serve people's day to day needs;
3 capacity of existing centres to accommodate new town centre development, taking account of the role of changes in the hierarchy;
4 centres in decline where change needs to be managed; and
5 capture additional population growth spend, taking account of new and planned residential developments.
Update Report 2019 Objectives 1.3 This report updates and rolls forward the retail and food/beverage floorspace capacity
projections to 2034, including:
1 the implications of the revised National Planning Policy Framework (NPPF - February 2019);
2 an update of population projections based on the GLA’s 2016 SHLAA ward based projections;
3 adoption of Experian's local expenditure data (the latest 2017 base year data has been obtained for the study area zones);
4 adoption of Experian's latest (December 2018) expenditure growth and home shopping forecasts (special forms of trading - SFT);
5 revised retail sales floorspace for main food stores, based on the latest StorePoint 2019 database;
6 benchmark turnover estimates for existing and proposed food store floorspace based on Global Data 2018 information;
7 Experian's latest growth forecasts for sale density/turnover efficiencies;
8 an update of planned commitments; and
9 analysis and recommendations on the implications of the updated need assessment and commentary on how this can be met.
1.4 Experian's latest expenditure projections and deductions for home shopping were published in December 2018, and therefore take account Experian's recent views on general retail market conditions and uncertainties regarding Brexit.
1.5 The EDS 2014 adopted the results of a household telephone shopper survey undertaken by NEMS in October 2013. The findings of this survey remain robust because there have been no

Barking and Dagenham Retail and Town Centre Study : Update Report
Pg 2
significant changes within or near the study area that will have altered shopping and leisure patterns. Experian’s latest expenditure information provides details of changes due to the growth in home and multi-channel shopping since 2013. The retail market shares adopted in the 2014 Study exclude home and multi-channel shopping. The market shares have been adjusted where necessary to reflect other changes since October 2013.

Barking and Dagenham Retail and Town Centre Study : Update Report
Pg 3
2.0 National planning policy 2.1 The EDS was prepared in 2014 and was based on the guidance set out in the NPPF (published
by the Department for Communities and Local Government on 27 March 2012). The revised NPPF (February 2019) consolidates a series of proposals that have been made in the last two and half years, and which have been included in various consultation documents. The policies in the revised NPPF are material considerations when determining planning applications.
2.2 In relation to town centres, the revised NPPF does not change the overall aims of policy, although there are some important modifications. These changes are logical points of clarification that address areas of debate that have arisen in recent years. The rapid changes that are affecting the retail sector and town centres are acknowledged and reflected in the revised NPPF. It recognises that diversification is key to the long-term vitality and viability of town centres, to ‘respond to rapid changes in the retail and leisure industries’. Accordingly, planning policies should clarify ‘the range of uses permitted in such locations, as part of a positive strategy for the future of each centre’.
2.3 It is widely accepted that very long-term projections have inherent uncertainties. In response to these uncertainties, local planning authorities are no longer required to allocate sites to meet the need for town centre uses over the full plan period. The need for new town centre uses should still be accommodated over a minimum ten-year period, which reflects the complexities in bringing forward town centre development sites. In line with the Government’s economic growth agenda, a positive approach to meeting community needs is still required.
2.4 A key change (para. 86 – change underlined) is “main town centre uses should be located in town centres, then in edge of centre locations; and only if suitable sites are not available (or expected to become available within a reasonable period) should out of centre sites be considered”. The reason for this change is to avoid prejudicing more central sites that are in the pipeline but not available straight away. The definition of a “reasonable period” is still open to debate, but logically this period should relate to the likely timetable for delivery of the application proposal.
2.5 The NPPF’s presumption in favour of sustainable development remains. For plan-making this means that:
a plans should positively seek opportunities to meet the development needs of their area, and be sufficiently flexible to adapt to rapid change;
b policies should, as a minimum, provide for objectively assessed needs for housing and other uses, as well as any needs that cannot be met within neighbouring areas, unless:
i the application of policies in this Framework that protect areas or assets of importance provides a strong reason for restricting the overall scale, type or distribution of development in the plan area; or
ii any adverse impacts of doing so would significantly and demonstrably outweigh the benefits, when assessed against the other policies in the Framework.
2.6 The development plan must include strategic policies to address each local planning authority’s priorities for the development and use of land in its area. These strategic policies can be produced in different ways, depending on the issues and opportunities facing each area (para. 17). Policies to address non-strategic matters should be included in local plans that contain both strategic and non-strategic policies, and/or in local or neighbourhood plans that contain just non-strategic policies (para. 18).
Barking and Dagenham Retail and Town Centre Study : Update Report
Pg 4
2.7 Strategic policies should set out an overall strategy for the pattern, scale and quality of development, and make sufficient provision for (para. 20):
a housing (including affordable housing), employment, retail, leisure and other commercial development;
b infrastructure for transport, telecommunications, security, waste management, water supply, wastewater, flood risk and coastal change management, and the provision of minerals and energy (including heat);
c community facilities (such as health, education and cultural infrastructure); and
d conservation and enhancement of the natural, built and historic environment, including landscapes and green infrastructure, and planning measures to address climate change mitigation and adaptation.
2.8 Strategic policies should provide a clear strategy for bringing land forward, and at a sufficient rate, to address objectively assessed needs over the plan period, in line with the presumption in favour of sustainable development. This should include planning for and allocating sufficient sites to deliver the strategic priorities of the area (except insofar as these needs can be demonstrated to be met more appropriately through other mechanisms, such as brownfield registers or non-strategic policies) (para. 21).
2.9 The preparation and review of all policies should be underpinned by relevant and up-to-date evidence. This should be adequate and proportionate, focused tightly on supporting and justifying the policies concerned, accounting for relevant market signals (para. 31). Planning policies should:
a set out a clear economic vision and strategy which positively and proactively encourages sustainable economic growth, having regard to Local Industrial Strategies and other local policies for economic development and regeneration;
b set criteria, or identify strategic sites, for local and inward investment to match the strategy and to meet anticipated needs over the plan period;
c seek to address potential barriers to investment, such as inadequate infrastructure, services or housing, or a poor environment; and
d be flexible enough to accommodate needs not anticipated in the plan, allow for new and flexible working practices (such as live-work accommodation), and to enable a rapid response to changes in economic circumstances.
2.10 In terms of retail, planning policies and decisions should support the role that town centres play at the heart of local communities, by taking a positive approach to their growth, management and adaptation. Planning policies should (para. 85):
a define a network and hierarchy of town centres and promote their long-term vitality and viability – by allowing them to grow and diversify in a way that can respond to rapid changes in the retail and leisure industries, allows a suitable mix of uses (including housing) and reflects their distinctive characters;
b define the extent of town centres and primary shopping areas, and make clear the range of uses permitted in such locations, as part of a positive strategy for the future of each centre;
c retain and enhance existing markets and, where appropriate, re-introduce or create new ones;
d allocate a range of suitable sites in town centres to meet the scale and type of development likely to be needed, looking at least ten years ahead. Meeting anticipated
Barking and Dagenham Retail and Town Centre Study : Update Report
Pg 5
needs for retail, leisure, office and other main town centre uses over this period should not be compromised by limited site availability, so town centre boundaries should be kept under review where necessary;
e where suitable and viable town centre sites are not available for main town centre uses, allocate appropriate edge of centre sites that are well connected to the town centre. If sufficient edge of centre sites cannot be identified, policies should explain how identified needs can be met in other accessible locations that are well connected to the town centre; and
f recognise that residential development often plays an important role in ensuring the vitality of centres and encourage residential development on appropriate sites.
2.11 Applications for retail and town centre uses that are not in an existing centre and are not in accordance with an up-to-date Local Plan will be assessed against NPPF policies and the key sequential and impact tests.
2.12 The sequential approach test indicates main town centre uses should locate in town centres, then in edge of centre locations; and only if suitable sites are not available (or expected to become available within a reasonable period) should out of centre sites be considered (para. 86). When considering edge of centre and out of centre proposals, preference should be given to accessible sites which are well connected to the town centre. Applicants and local planning authorities should demonstrate flexibility on issues such as format and scale, so that opportunities to utilise suitable town centre or edge of centre sites are fully explored (para. 87).
2.13 The NPPF states that local planning authorities should require an impact assessment for applications for retail and leisure development outside of town centres, which are not in accordance with an up-to-date development plan and are over a proportionate, locally set floorspace threshold. If there is not a locally set threshold, the default threshold is 2,500 sq.m (para. 89). This should include an assessment of:
a the impact of the proposal on existing, committed and planned public and private investment in a centre or centres in the catchment area of the proposal; and
b the impact of the proposal on town centre vitality and viability, including local consumer choice and trade in the town centre and the wider retail catchment (as applicable to the scale and nature of the scheme).
2.14 Where an application fails to satisfy the sequential test or is likely to have a significant adverse impact on one of more of the above factors, it should be refused (para. 90).
2.15 The designation of primary shopping areas or centre boundaries is important when applying the sequential approach, to direct retail and town centre uses to sustainable locations and determine whether a retail impact assessment is required. The NPPF continues to indicate that the first preference for retail uses should be the primary shopping area. The first preference for leisure uses is normally the wider defined town centre, which usually includes the PSA and other parts of the town centre.
2.16 The revised NPPF does not refer to primary and secondary frontages, which previously made up the primary shopping area. The aim of the new NPPF appears to create more flexibility and encourage positive strategies for town centres. However, the primary shopping area is still the defined area where retail development is concentrated.
General Permitted Development Order
2.17 Recent changes to the General Permitted Development Order (GPDO) have also had an impact on some town centres. These measures allow for greater flexibility for changes of use e.g. Class A
Barking and Dagenham Retail and Town Centre Study : Update Report
Pg 6
uses to C3 residential use and Class A1 uses to Class A2 uses. These measures can change the composition of town centres, including the amount of Class A1 space is likely to reduce in some centres. The measures may lead to a reduction in vacant shop premises, particularly in peripheral shop frontages where there are concentrations of smaller units, but conversely it could have an impact on the ability of operators to find space in areas where demand is higher.
2.18 James Brokenshire’s recent written ministerial statement (March 2019) confirmed the reforms to the GPDO. This statement seeks to support the high street by introducing “additional flexibilities” for business, including:
• clarification on the ability of Class A uses to diversify and incorporate ancillary uses without undermining the amenity of the area;
• introduction of a new permitted development right to allow shops (A1), financial and professional services (A2), hot food takeaways (A5), betting shops, pay day loan shop and launderettes to change use to office use (B1); and
• to allow hot food takeaways (A5) to change to residential use (C3).
2.19 Temporary change of uses to a building will be extended from two to three years so that more community uses can take advantage of the temporary rights. The statement also includes permitted development right for upwards extensions on buildings, where the existing streetscape is respected. These changes will have implications for town centres and the ability to control the mix of uses. The implications for emerging development plan policies need to be considered.
Barking and Dagenham Retail and Town Centre Study : Update Report
Pg 7
3.0 Retail and town centre hierarchy 3.1 This section updates the assessment of the hierarchy and role of centres within LBBD, and their
relationship within the sub-region.
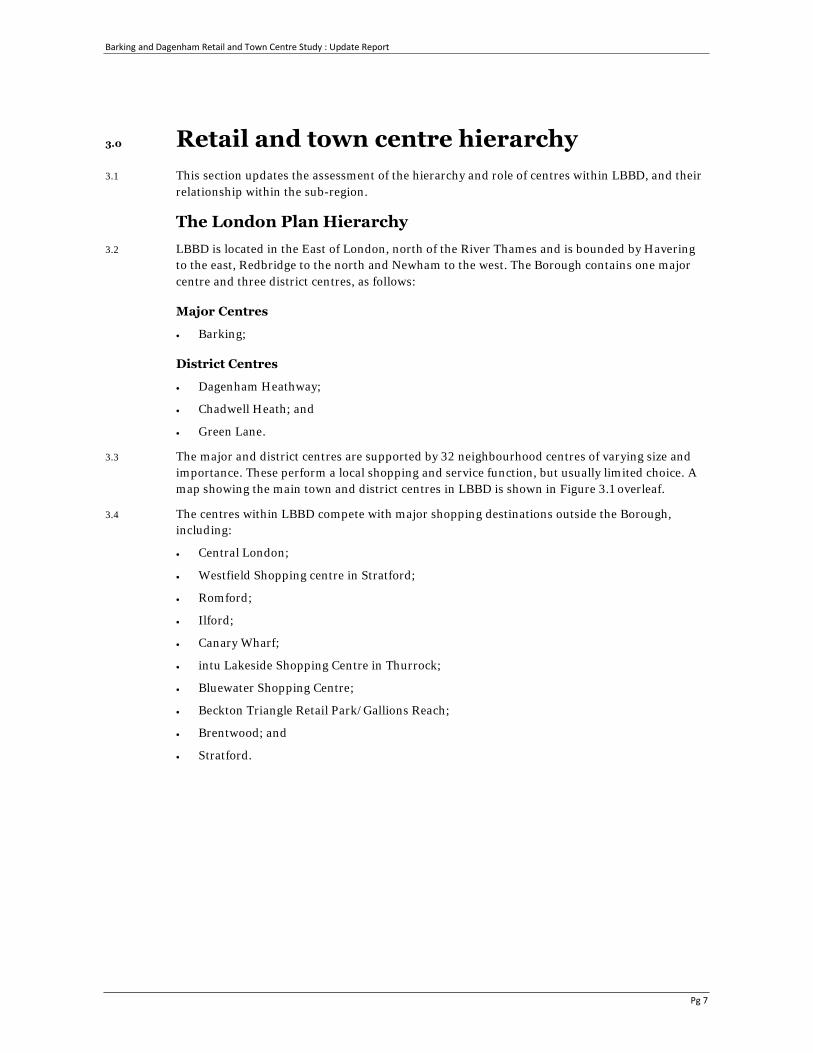
The London Plan Hierarchy 3.2 LBBD is located in the East of London, north of the River Thames and is bounded by Havering
to the east, Redbridge to the north and Newham to the west. The Borough contains one major centre and three district centres, as follows:
Major Centres
• Barking;
District Centres
• Dagenham Heathway;
• Chadwell Heath; and
• Green Lane.
3.3 The major and district centres are supported by 32 neighbourhood centres of varying size and importance. These perform a local shopping and service function, but usually limited choice. A map showing the main town and district centres in LBBD is shown in Figure 3.1 overleaf.
3.4 The centres within LBBD compete with major shopping destinations outside the Borough, including:
• Central London;
• Westfield Shopping centre in Stratford;
• Romford;
• Ilford;
• Canary Wharf;
• intu Lakeside Shopping Centre in Thurrock;
• Bluewater Shopping Centre;
• Beckton Triangle Retail Park/Gallions Reach;
• Brentwood; and
• Stratford.
Barking and Dagenham Retail and Town Centre Study : Update Report
Pg 8
Figure 3.1 London Borough of Barking and Dagenham Town and District Centres
Source: Lichfields
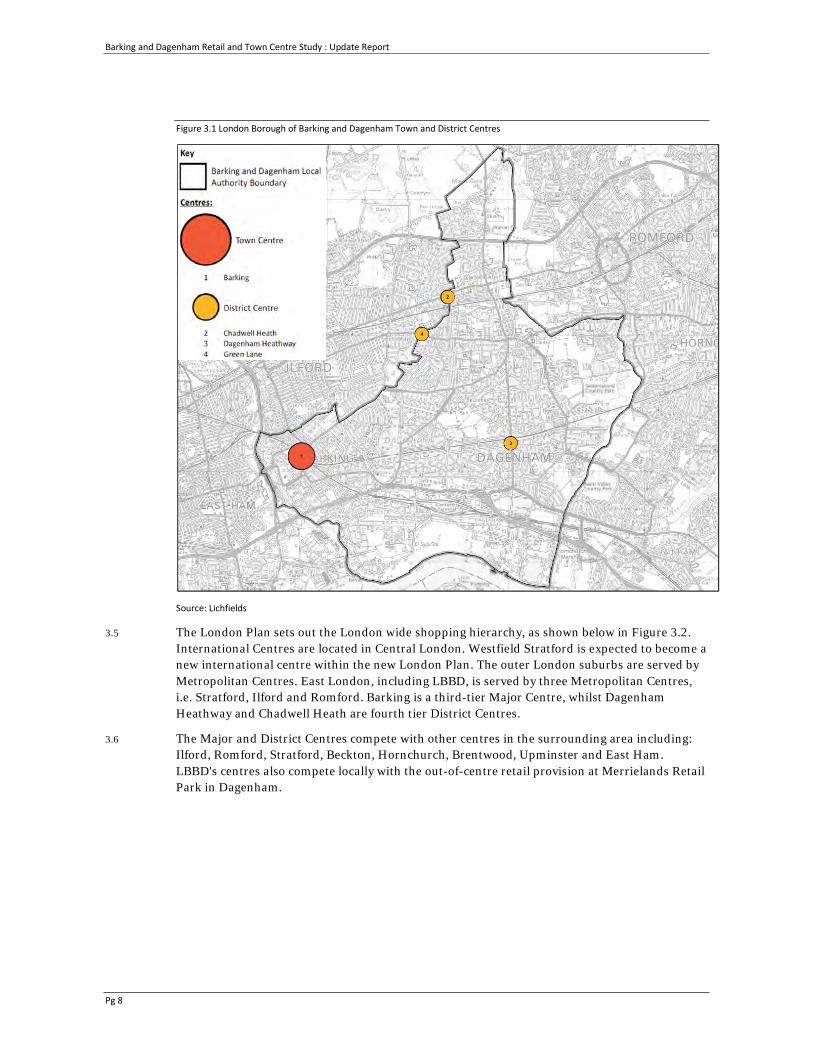
3.5 The London Plan sets out the London wide shopping hierarchy, as shown below in Figure 3.2. International Centres are located in Central London. Westfield Stratford is expected to become a new international centre within the new London Plan. The outer London suburbs are served by Metropolitan Centres. East London, including LBBD, is served by three Metropolitan Centres, i.e. Stratford, Ilford and Romford. Barking is a third-tier Major Centre, whilst Dagenham Heathway and Chadwell Heath are fourth tier District Centres.
3.6 The Major and District Centres compete with other centres in the surrounding area including: Ilford, Romford, Stratford, Beckton, Hornchurch, Brentwood, Upminster and East Ham. LBBD's centres also compete locally with the out-of-centre retail provision at Merrielands Retail Park in Dagenham.
Barking and Dagenham Retail and Town Centre Study : Update Report
Pg 9
Figure 3.2 London's town centre network
Source: GLA London Plan (2016)
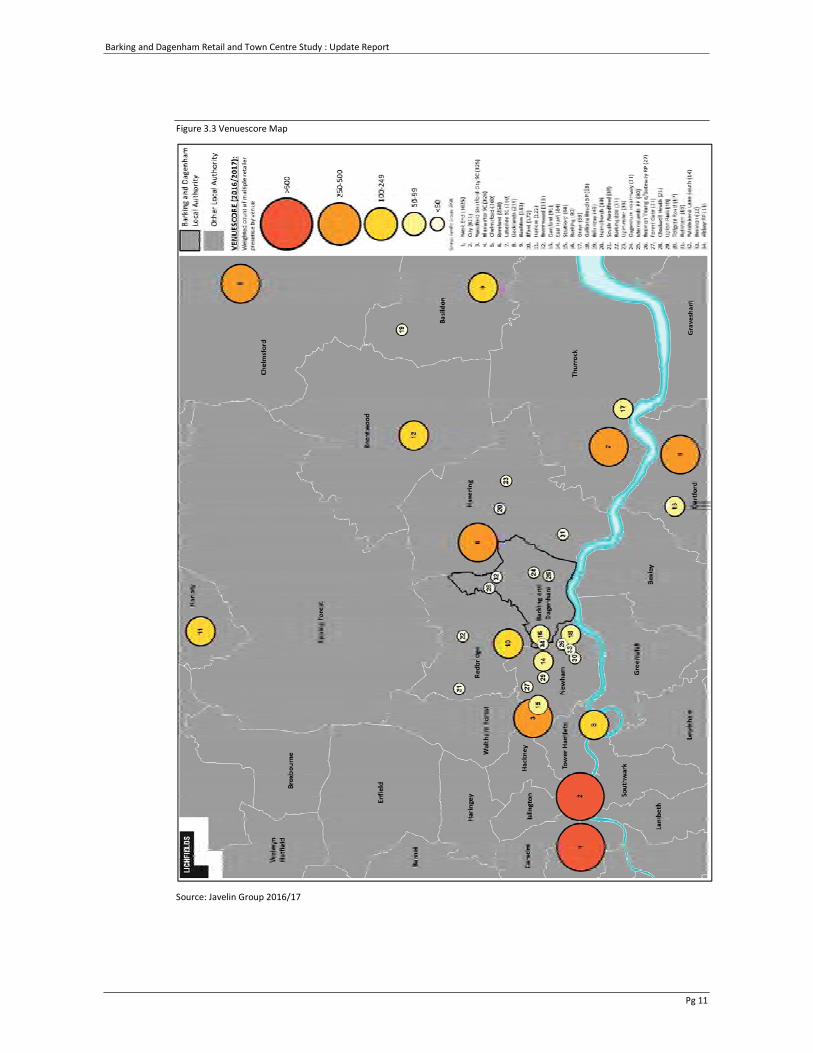
Relative Attraction of Centres 3.7 Venuescore ranks the UK's top 2,000 retail destinations including town centres, malls, retail
warehouse parks and factory outlet centres. The results for the Borough and other relevant centres are shown in Table 3.1 and the main centres are shown on the plan below.
3.8 Each shopping destination is given a weighted score for multiple retailers present. The score attached to each retailer is weighted depending on their overall impact on shopping patterns. The Venuescore usually correlates to the actual market size of the shopping destination in terms of consumer expenditure, but some larger shopping centres such as Westfield have fewer but larger stores and town centres with a higher proportion of independent stores can generate spending levels in excess of their relative Venuescores. Javelin also assesses the market position of the larger town centres based on the retailers present and the centre's relative position along a spectrum running from discount to luxury (i.e. lower, middle to upscale).
3.9 Consistent with the London Plan, the Javelin index ranks Barking as the main centre within the Borough, ranked 343rd in the UK. Dagenham Heathway and Chadwell Heath district centres and Merrielands Retail Park feature in the rankings but achieve relatively low scores. Central London, Bluewater, Westfield and intu Lakeside are ranked at the top of the hierarchy. Major centres including Ilford, Brentwood and Romford are all ranked within the top 250, their scores reflect the higher number of national multiple retailers. These centres serve a wider catchment than Barking. The lack of national multiple retailers in other centres in LBBD results in relatively low Venuescores.
Barking and Dagenham Retail and Town Centre Study : Update Report
Pg 10
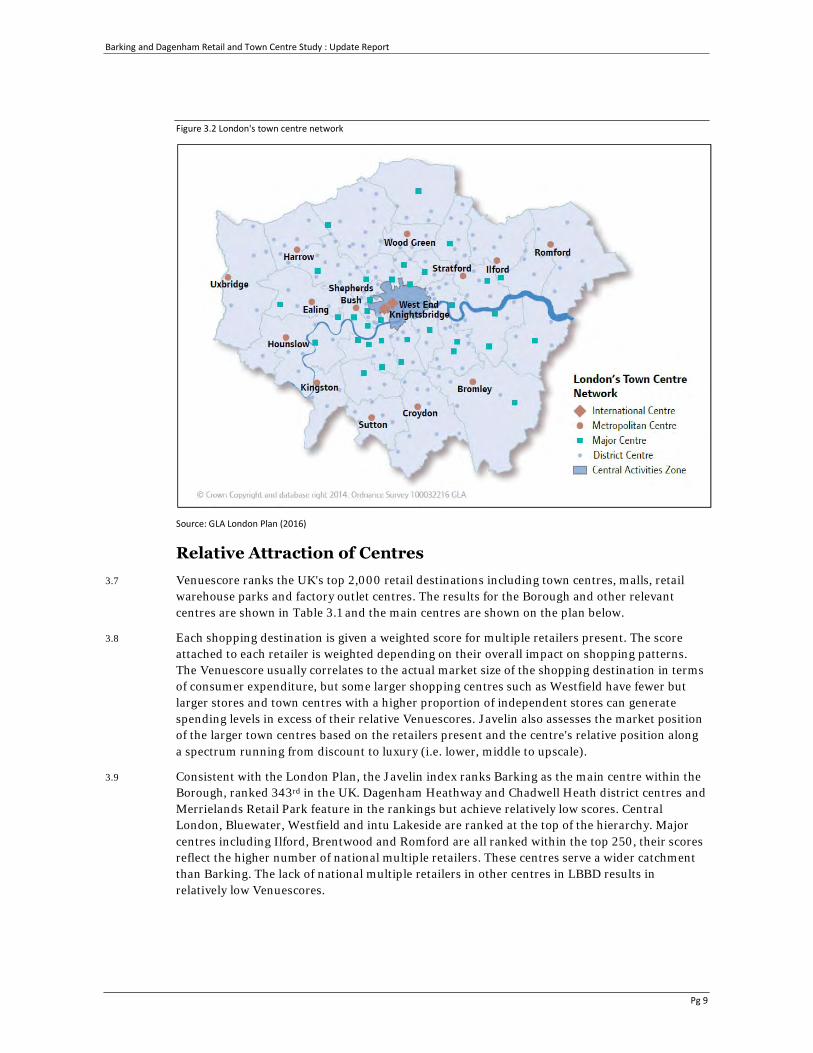
Table 3.1 Javelin’s Venuescore UK shopping Index
Centre UK Rank 2016/17
Venuescore 2016/17
Change in score since 2013
Market position
London, West End 1 1,625 +232 upper middle Westfield, Stratford 26 325 +4 upper middle Bluewater 27 324 -4 upper middleRomford 45 258 +15 middleIntu Lakeside 48 250 +13 upper middle Docklands (Canary Wharf) 57 229 +65 upscale Ilford 115 172 -9 middleBrentwood 217 113 +3 middleStratford 326 84 +3 lower middle East Ham 326 84 +4 n/a Barking 343 80 +3 lower middleBeckton Gallions Reach 508 58 +1 middleHornchurch 781 40 +1 middle Upminster 968 33 -14 middle Merrielands Retail Park 1074 30 +5 lower middleDagenham Heathway 1044 31 +5 n/aBeckton Triangle/Gateway RP 1187 27 -2 middle Chadwell Heath 1481 21 +5 middle
Source: Javelin Group 2017
3.10 The top three ranked centres also have the higher market position, with a focus on luxury rather than discount products. These three centres attract customers from across East London, and a higher proportion of the most affluent customers when compared with other centres. Romford and Ilford are considered to be middle market by Javelin, whilst Barking is considered to be lower market, i.e. focusing on discount and value sectors.
Barking and Dagenham Retail and Town Centre Study : Update Report
Pg 11
Figure 3.3 Venuescore Map
Source: Javelin Group 2016/17
Barking and Dagenham Retail and Town Centre Study : Update Report
Pg 12
Property Indicators 3.11 The relative performance of and influence of retail centres can be demonstrated by commercial
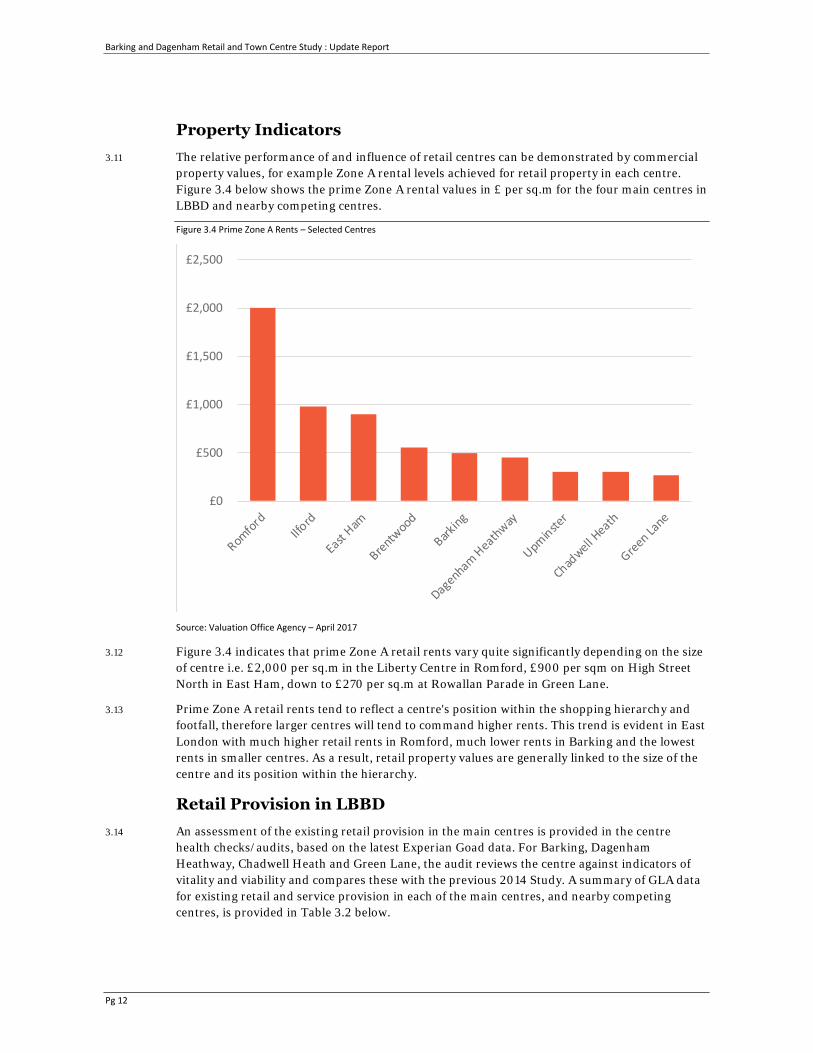
property values, for example Zone A rental levels achieved for retail property in each centre. Figure 3.4 below shows the prime Zone A rental values in £ per sq.m for the four main centres in LBBD and nearby competing centres.
Figure 3.4 Prime Zone A Rents – Selected Centres
Source: Valuation Office Agency – April 2017
3.12 Figure 3.4 indicates that prime Zone A retail rents vary quite significantly depending on the size of centre i.e. £2,000 per sq.m in the Liberty Centre in Romford, £900 per sqm on High Street North in East Ham, down to £270 per sq.m at Rowallan Parade in Green Lane.
3.13 Prime Zone A retail rents tend to reflect a centre's position within the shopping hierarchy and footfall, therefore larger centres will tend to command higher rents. This trend is evident in East London with much higher retail rents in Romford, much lower rents in Barking and the lowest rents in smaller centres. As a result, retail property values are generally linked to the size of the centre and its position within the hierarchy.
Retail Provision in LBBD 3.14 An assessment of the existing retail provision in the main centres is provided in the centre
health checks/audits, based on the latest Experian Goad data. For Barking, Dagenham Heathway, Chadwell Heath and Green Lane, the audit reviews the centre against indicators of vitality and viability and compares these with the previous 2014 Study. A summary of GLA data for existing retail and service provision in each of the main centres, and nearby competing centres, is provided in Table 3.2 below.
£0
£500
£1,000
£1,500
£2,000
£2,500
Barking and Dagenham Retail and Town Centre Study : Update Report
Pg 13
Table 3.2 Retail and service provision in London Borough of Barking and Dagenham and other selected centres
Centre Convenience goods floorspace
(sq.m gross)
Comparison goods floorspace
(sq.m gross)
Retail service floorspace
(sq.m gross)
Total floorspace (sq.m gross)
Barking 13,470 17,772 3,710 34,952 Dagenham Heathway 1,880 5,910 1,140 8,930 Chadwell Heath 6,710 3,790 2,210 12,710Green Lane 620 1,020 1,140 2,780 LBBD total 22,680 28,492 8,200 59,372 Romford 27,950 116,818 9,510 154,278 Ilford 12,850 67,057 4,320 84,227East Ham 11,660 20,950 2,430 34,570
Source: GLA Health Check Data 2016.
3.15 Barking is the main centre in the Borough in terms of the amount of floorspace and is comparable in size to East Ham. It is the primary destination for comparison shopping within the Borough. Romford and Ilford have a significantly higher provision of retail floorspace than Barking.
3.16 This table demonstrate the high degree of competition. It will be important for the Borough's main centres to maintain and strengthen their role in the retail hierarchy. The smaller centres should continue to perform a more local function.
Diversity of Main Town Centre Uses
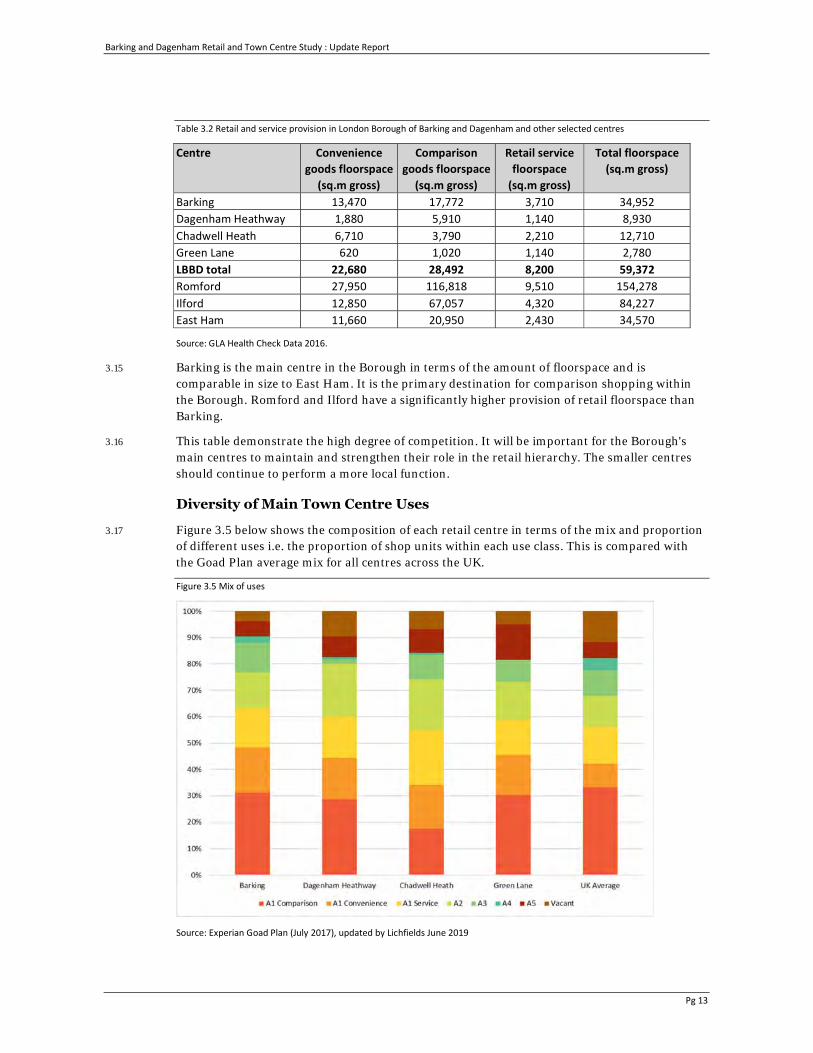
3.17 Figure 3.5 below shows the composition of each retail centre in terms of the mix and proportion of different uses i.e. the proportion of shop units within each use class. This is compared with the Goad Plan average mix for all centres across the UK.
Figure 3.5 Mix of uses
Source: Experian Goad Plan (July 2017), updated by Lichfields June 2019
Barking and Dagenham Retail and Town Centre Study : Update Report
Pg 14
3.18 The centres have a good mix of uses, but all centres have a lower proportion of Class A1 comparison goods retail and Class A4 pubs and bars than the national average. Vacancy rates are relatively low across the LBBD's centres when compared with the UK average. A more detailed analysis of provision within each centre is set out in Sections 4 to 7.
Retailer representation
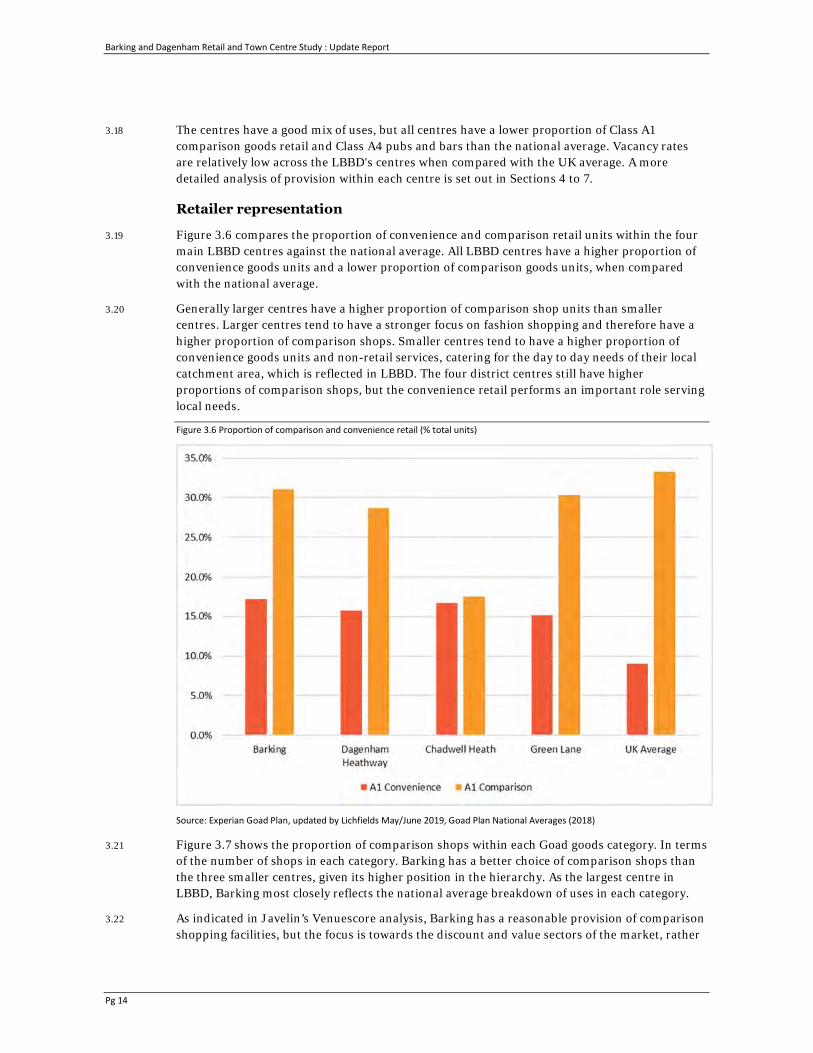
3.19 Figure 3.6 compares the proportion of convenience and comparison retail units within the four main LBBD centres against the national average. All LBBD centres have a higher proportion of convenience goods units and a lower proportion of comparison goods units, when compared with the national average.
3.20 Generally larger centres have a higher proportion of comparison shop units than smaller centres. Larger centres tend to have a stronger focus on fashion shopping and therefore have a higher proportion of comparison shops. Smaller centres tend to have a higher proportion of convenience goods units and non-retail services, catering for the day to day needs of their local catchment area, which is reflected in LBBD. The four district centres still have higher proportions of comparison shops, but the convenience retail performs an important role serving local needs.
Figure 3.6 Proportion of comparison and convenience retail (% total units)
Source: Experian Goad Plan, updated by Lichfields May/June 2019, Goad Plan National Averages (2018)
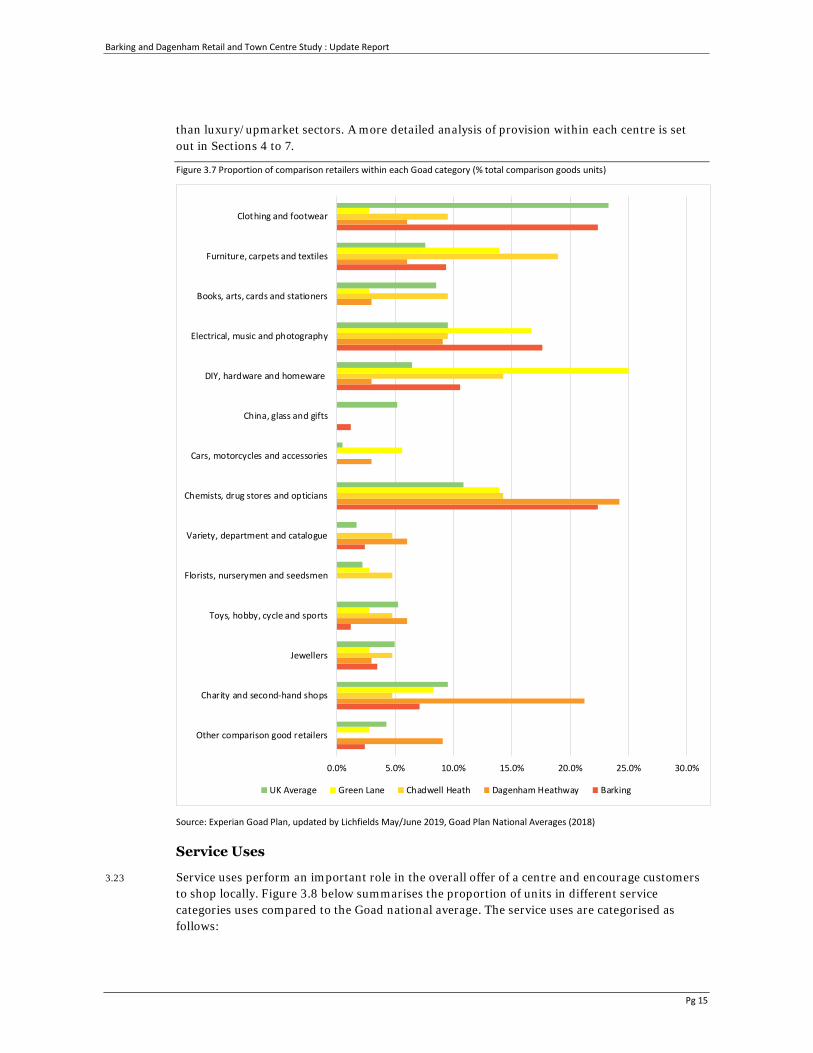
3.21 Figure 3.7 shows the proportion of comparison shops within each Goad goods category. In terms of the number of shops in each category. Barking has a better choice of comparison shops than the three smaller centres, given its higher position in the hierarchy. As the largest centre in LBBD, Barking most closely reflects the national average breakdown of uses in each category.
3.22 As indicated in Javelin’s Venuescore analysis, Barking has a reasonable provision of comparison shopping facilities, but the focus is towards the discount and value sectors of the market, rather
Barking and Dagenham Retail and Town Centre Study : Update Report
Pg 15
than luxury/upmarket sectors. A more detailed analysis of provision within each centre is set out in Sections 4 to 7.
Figure 3.7 Proportion of comparison retailers within each Goad category (% total comparison goods units)
Source: Experian Goad Plan, updated by Lichfields May/June 2019, Goad Plan National Averages (2018)
Service Uses
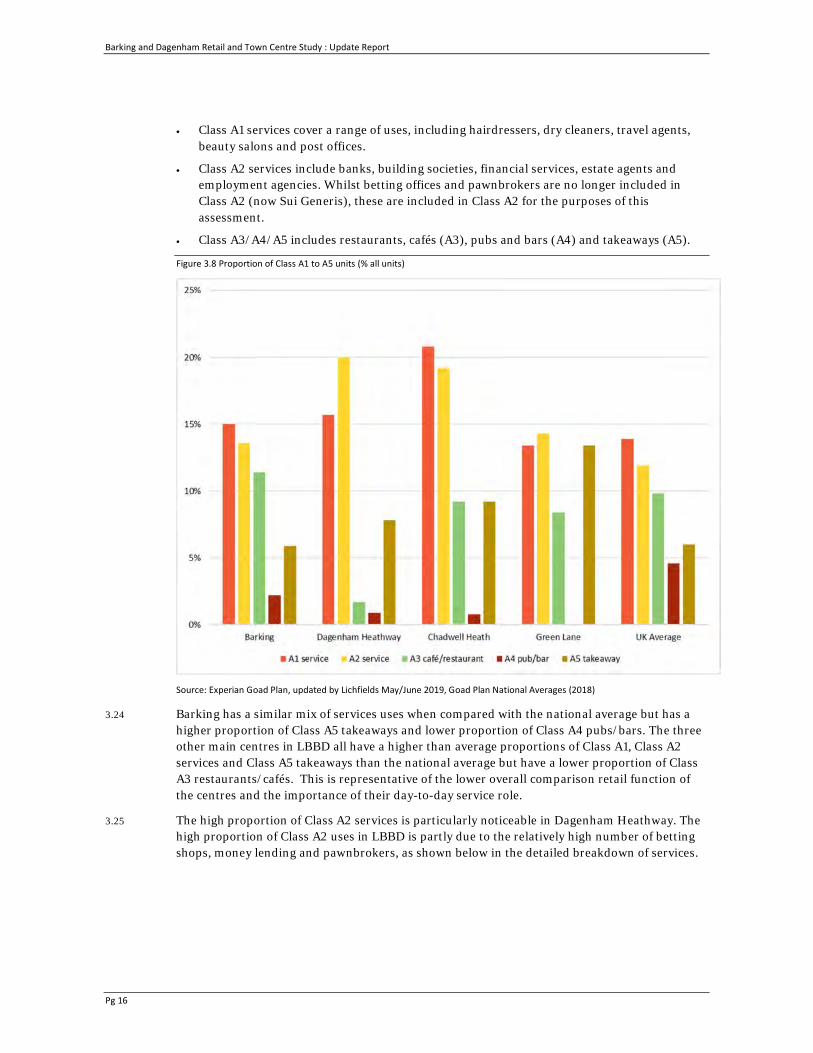
3.23 Service uses perform an important role in the overall offer of a centre and encourage customers to shop locally. Figure 3.8 below summarises the proportion of units in different service categories uses compared to the Goad national average. The service uses are categorised as follows:
0.0% 5.0% 10.0% 15.0% 20.0% 25.0% 30.0%
Other comparison good retailers
Charity and second-hand shops
Jewellers
Toys, hobby, cycle and sports
Florists, nurserymen and seedsmen
Variety, department and catalogue
Chemists, drug stores and opticians
Cars, motorcycles and accessories
China, glass and gifts
DIY, hardware and homeware
Electrical, music and photography
Books, arts, cards and stationers
Furniture, carpets and textiles
Clothing and footwear
UK Average Green Lane Chadwell Heath Dagenham Heathway Barking
Barking and Dagenham Retail and Town Centre Study : Update Report
Pg 16
• Class A1 services cover a range of uses, including hairdressers, dry cleaners, travel agents, beauty salons and post offices.
• Class A2 services include banks, building societies, financial services, estate agents and employment agencies. Whilst betting offices and pawnbrokers are no longer included in Class A2 (now Sui Generis), these are included in Class A2 for the purposes of this assessment.
• Class A3/A4/A5 includes restaurants, cafés (A3), pubs and bars (A4) and takeaways (A5).
Figure 3.8 Proportion of Class A1 to A5 units (% all units)
Source: Experian Goad Plan, updated by Lichfields May/June 2019, Goad Plan National Averages (2018)
3.24 Barking has a similar mix of services uses when compared with the national average but has a higher proportion of Class A5 takeaways and lower proportion of Class A4 pubs/bars. The three other main centres in LBBD all have a higher than average proportions of Class A1, Class A2 services and Class A5 takeaways than the national average but have a lower proportion of Class A3 restaurants/cafés. This is representative of the lower overall comparison retail function of the centres and the importance of their day-to-day service role.
3.25 The high proportion of Class A2 services is particularly noticeable in Dagenham Heathway. The high proportion of Class A2 uses in LBBD is partly due to the relatively high number of betting shops, money lending and pawnbrokers, as shown below in the detailed breakdown of services.
Barking and Dagenham Retail and Town Centre Study : Update Report
Pg 17
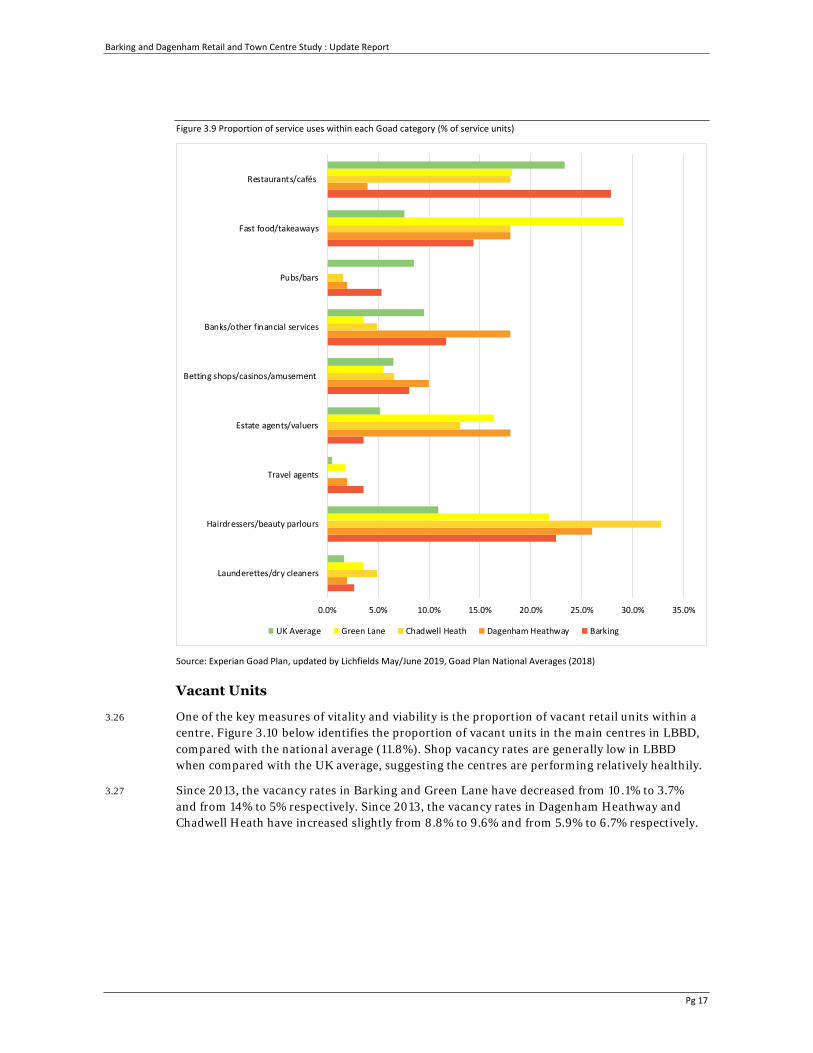
Figure 3.9 Proportion of service uses within each Goad category (% of service units)
Source: Experian Goad Plan, updated by Lichfields May/June 2019, Goad Plan National Averages (2018)
Vacant Units
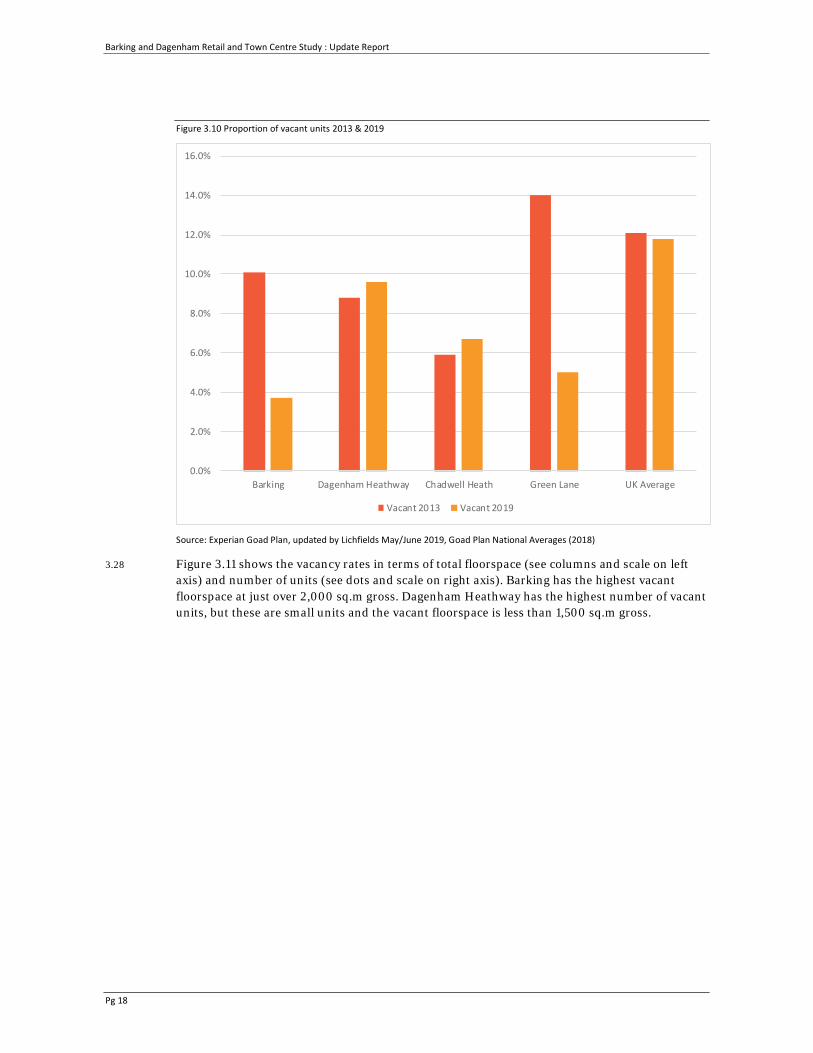
3.26 One of the key measures of vitality and viability is the proportion of vacant retail units within a centre. Figure 3.10 below identifies the proportion of vacant units in the main centres in LBBD, compared with the national average (11.8%). Shop vacancy rates are generally low in LBBD when compared with the UK average, suggesting the centres are performing relatively healthily.
3.27 Since 2013, the vacancy rates in Barking and Green Lane have decreased from 10.1% to 3.7% and from 14% to 5% respectively. Since 2013, the vacancy rates in Dagenham Heathway and Chadwell Heath have increased slightly from 8.8% to 9.6% and from 5.9% to 6.7% respectively.
0.0% 5.0% 10.0% 15.0% 20.0% 25.0% 30.0% 35.0%
Launderettes/dry cleaners
Hairdressers/beauty parlours
Travel agents
Estate agents/valuers
Betting shops/casinos/amusement
Banks/other financial services
Pubs/bars
Fast food/takeaways
Restaurants/cafés
UK Average Green Lane Chadwell Heath Dagenham Heathway Barking
Barking and Dagenham Retail and Town Centre Study : Update Report
Pg 18
Figure 3.10 Proportion of vacant units 2013 & 2019
Source: Experian Goad Plan, updated by Lichfields May/June 2019, Goad Plan National Averages (2018)
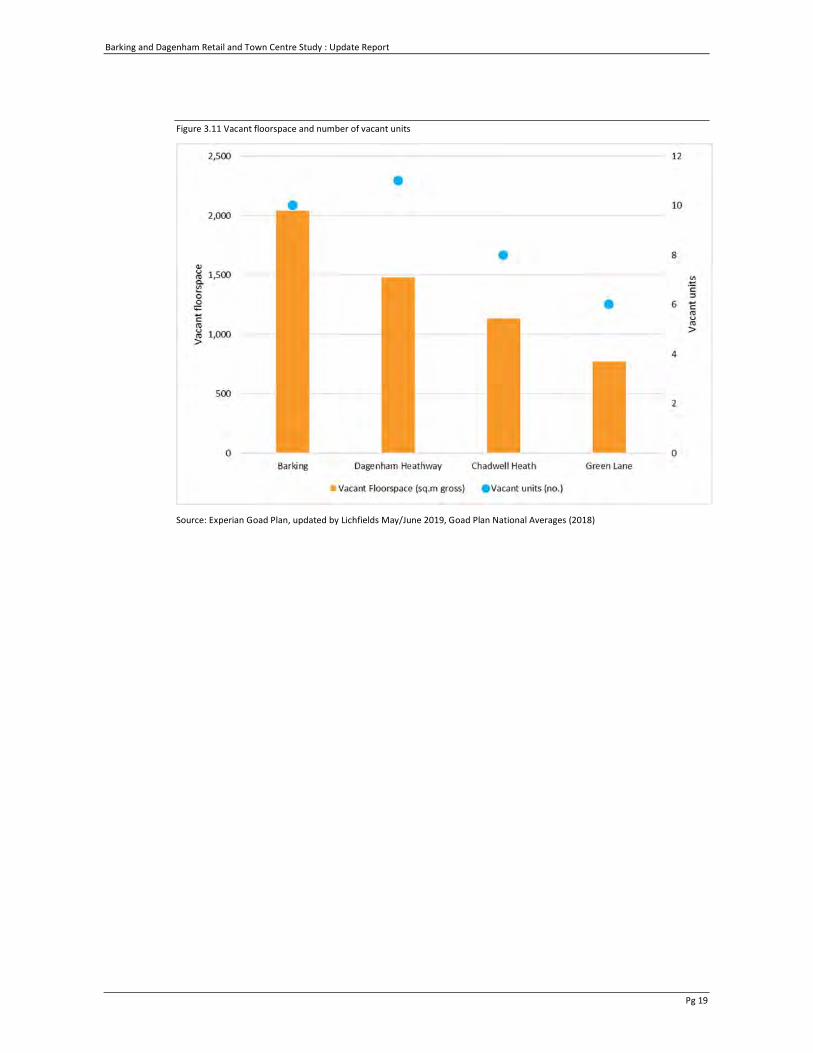
3.28 Figure 3.11 shows the vacancy rates in terms of total floorspace (see columns and scale on left axis) and number of units (see dots and scale on right axis). Barking has the highest vacant floorspace at just over 2,000 sq.m gross. Dagenham Heathway has the highest number of vacant units, but these are small units and the vacant floorspace is less than 1,500 sq.m gross.
0.0%
2.0%
4.0%
6.0%
8.0%
10.0%
12.0%
14.0%
16.0%
Barking Dagenham Heathway Chadwell Heath Green Lane UK Average
Vacant 2013 Vacant 2019
Barking and Dagenham Retail and Town Centre Study : Update Report
Pg 19
Figure 3.11 Vacant floorspace and number of vacant units
Source: Experian Goad Plan, updated by Lichfields May/June 2019, Goad Plan National Averages (2018)
Barking and Dagenham Retail and Town Centre Study : Update Report
Pg 20
4.0 Barking town centre health check Key roles
4.1 Barking is defined as a third tier Major Centre in the London Plan, located to the west of the Borough. It is the largest town centre in the Borough with the strongest comparison shopping offer and more national multiple operators than other centres in LBBD. The main retail areas in the centre include Vicarage Fields Shopping Centre, East Street, Ripple Road and the Station Quarter which is located around Barking train and underground station. A Tesco Superstore is located to the edge of the town centre.
4.2 Barking Town Centre's key roles include:
• Comparison shopping: a good selection of national multiple retailers and independent shops selling a range of both low and higher order comparison goods.
• Convenience shopping: a relatively new Asda located within the Genoa Building development, Lidl on Ripple Road and Iceland on East Street provide the main convenience offer within the centre. These are complimented by a diverse range of independent food stores. To the edge of the town centre, is a Tesco Superstore.
• Services: good selection of retail services including restaurants, cafés, banks, dry cleaners, internet cafés, hairdressers/barbers and beauty salons.
• Leisure: snooker club, theatre, and leisure centre.
• Community uses: community halls, health centre, learning centre, local Council offices, dental surgery and places of worship.
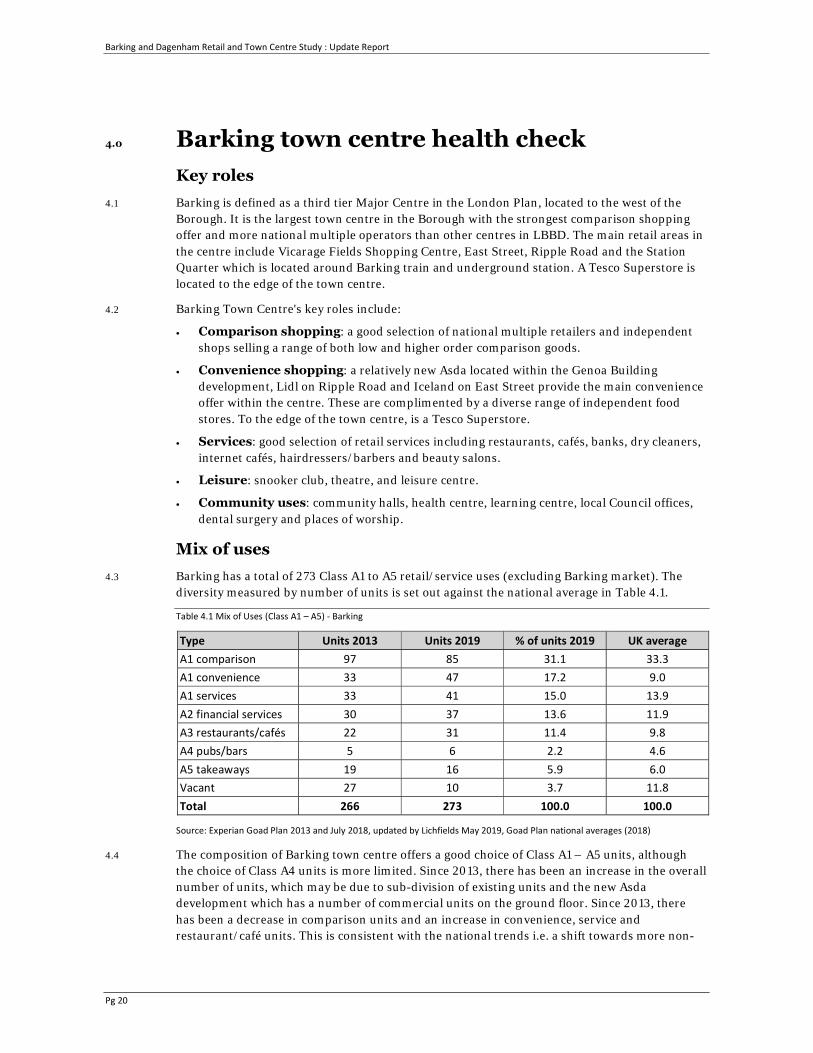
Mix of uses 4.3 Barking has a total of 273 Class A1 to A5 retail/service uses (excluding Barking market). The
diversity measured by number of units is set out against the national average in Table 4.1.
Table 4.1 Mix of Uses (Class A1 – A5) - Barking
Type Units 2013 Units 2019 % of units 2019 UK average A1 comparison 97 85 31.1 33.3 A1 convenience 33 47 17.2 9.0 A1 services 33 41 15.0 13.9 A2 financial services 30 37 13.6 11.9 A3 restaurants/cafés 22 31 11.4 9.8 A4 pubs/bars 5 6 2.2 4.6 A5 takeaways 19 16 5.9 6.0 Vacant 27 10 3.7 11.8 Total 266 273 100.0 100.0
Source: Experian Goad Plan 2013 and July 2018, updated by Lichfields May 2019, Goad Plan national averages (2018)
4.4 The composition of Barking town centre offers a good choice of Class A1 – A5 units, although the choice of Class A4 units is more limited. Since 2013, there has been an increase in the overall number of units, which may be due to sub-division of existing units and the new Asda development which has a number of commercial units on the ground floor. Since 2013, there has been a decrease in comparison units and an increase in convenience, service and restaurant/café units. This is consistent with the national trends i.e. a shift towards more non-
Barking and Dagenham Retail and Town Centre Study : Update Report
Pg 21
retail service and food/beverage uses. The vacancy rate has decreased significantly since 2013, indicating the demand for premises is healthy.
4.5 A coloured Goad Plan, detailing the mix of uses in Barking town centre can be found at Appendix 1.
Retailer Representation
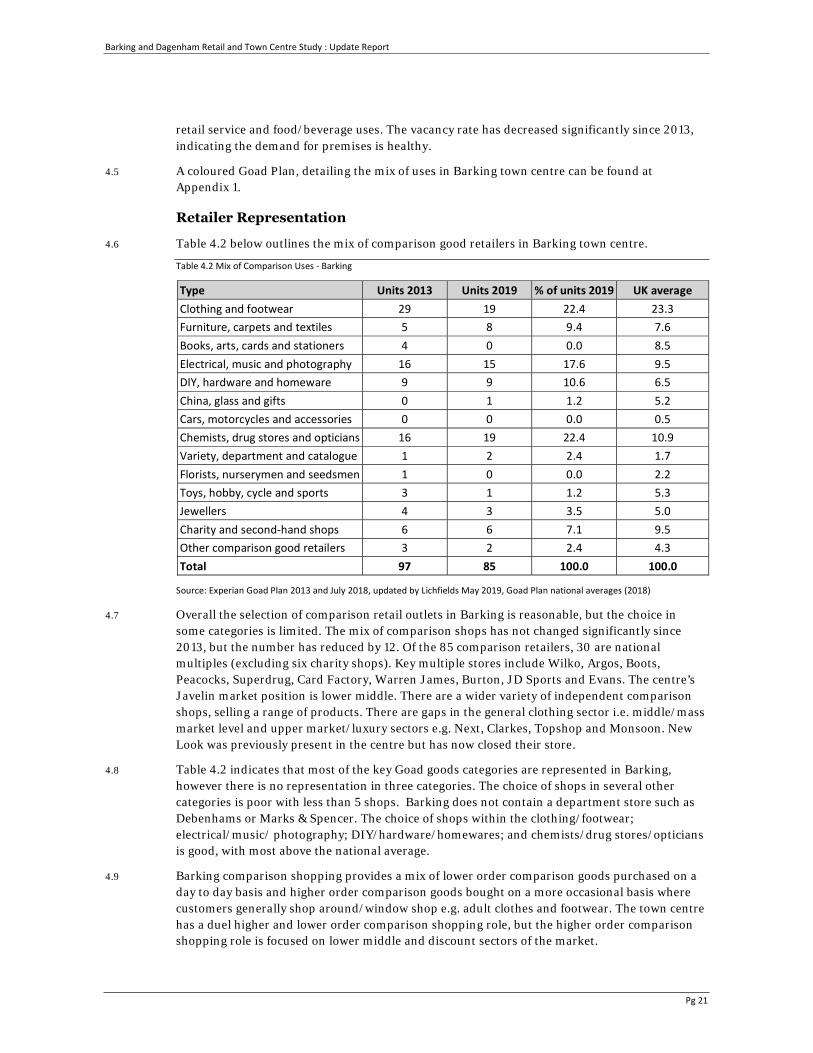
4.6 Table 4.2 below outlines the mix of comparison good retailers in Barking town centre.
Table 4.2 Mix of Comparison Uses - Barking
Type Units 2013 Units 2019 % of units 2019 UK average Clothing and footwear 29 19 22.4 23.3 Furniture, carpets and textiles 5 8 9.4 7.6 Books, arts, cards and stationers 4 0 0.0 8.5 Electrical, music and photography 16 15 17.6 9.5 DIY, hardware and homeware 9 9 10.6 6.5 China, glass and gifts 0 1 1.2 5.2 Cars, motorcycles and accessories 0 0 0.0 0.5 Chemists, drug stores and opticians 16 19 22.4 10.9 Variety, department and catalogue 1 2 2.4 1.7 Florists, nurserymen and seedsmen 1 0 0.0 2.2 Toys, hobby, cycle and sports 3 1 1.2 5.3 Jewellers 4 3 3.5 5.0 Charity and second-hand shops 6 6 7.1 9.5 Other comparison good retailers 3 2 2.4 4.3 Total 97 85 100.0 100.0
Source: Experian Goad Plan 2013 and July 2018, updated by Lichfields May 2019, Goad Plan national averages (2018)
4.7 Overall the selection of comparison retail outlets in Barking is reasonable, but the choice in some categories is limited. The mix of comparison shops has not changed significantly since 2013, but the number has reduced by 12. Of the 85 comparison retailers, 30 are national multiples (excluding six charity shops). Key multiple stores include Wilko, Argos, Boots, Peacocks, Superdrug, Card Factory, Warren James, Burton, JD Sports and Evans. The centre’s Javelin market position is lower middle. There are a wider variety of independent comparison shops, selling a range of products. There are gaps in the general clothing sector i.e. middle/mass market level and upper market/luxury sectors e.g. Next, Clarkes, Topshop and Monsoon. New Look was previously present in the centre but has now closed their store.
4.8 Table 4.2 indicates that most of the key Goad goods categories are represented in Barking, however there is no representation in three categories. The choice of shops in several other categories is poor with less than 5 shops. Barking does not contain a department store such as Debenhams or Marks & Spencer. The choice of shops within the clothing/footwear; electrical/music/ photography; DIY/hardware/homewares; and chemists/drug stores/opticians is good, with most above the national average.
4.9 Barking comparison shopping provides a mix of lower order comparison goods purchased on a day to day basis and higher order comparison goods bought on a more occasional basis where customers generally shop around/window shop e.g. adult clothes and footwear. The town centre has a duel higher and lower order comparison shopping role, but the higher order comparison shopping role is focused on lower middle and discount sectors of the market.
Barking and Dagenham Retail and Town Centre Study : Update Report
Pg 22
4.10 The Council operates a street market in Barking Town Centre. It is held every week on Tuesdays. Thursdays, Fridays and Saturdays. It is a traditional East London general market with a multi-cultural theme. The market has a range of stalls which provide a good choice of products including clothing, household products, foods and hardware. It is an important part of the town centre's attraction, and gives Barking added local distinctiveness. The market serves as a focal/meeting point for residents, as well as growing in attraction to many shoppers from outside the local area.
Service Uses
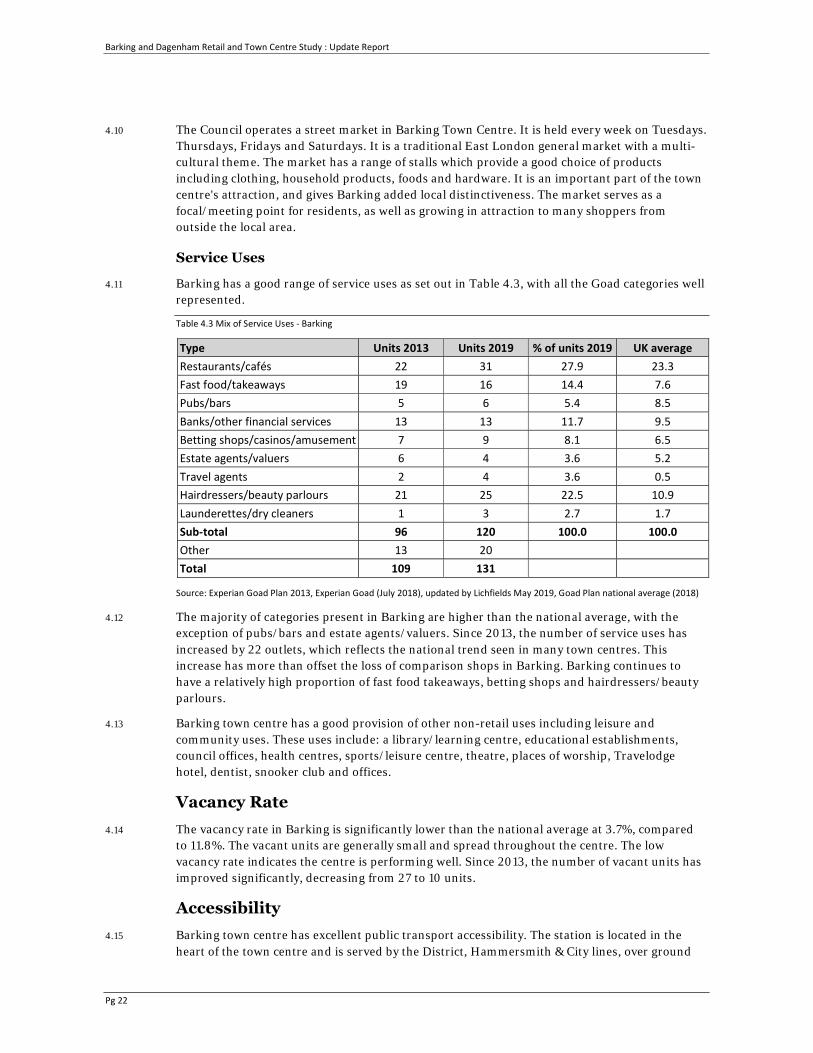
4.11 Barking has a good range of service uses as set out in Table 4.3, with all the Goad categories well represented.
Table 4.3 Mix of Service Uses - Barking
Type Units 2013 Units 2019 % of units 2019 UK average Restaurants/cafés 22 31 27.9 23.3 Fast food/takeaways 19 16 14.4 7.6 Pubs/bars 5 6 5.4 8.5 Banks/other financial services 13 13 11.7 9.5 Betting shops/casinos/amusement 7 9 8.1 6.5 Estate agents/valuers 6 4 3.6 5.2 Travel agents 2 4 3.6 0.5 Hairdressers/beauty parlours 21 25 22.5 10.9 Launderettes/dry cleaners 1 3 2.7 1.7 Sub-total 96 120 100.0 100.0 Other 13 20 Total 109 131
Source: Experian Goad Plan 2013, Experian Goad (July 2018), updated by Lichfields May 2019, Goad Plan national average (2018)
4.12 The majority of categories present in Barking are higher than the national average, with the exception of pubs/bars and estate agents/valuers. Since 2013, the number of service uses has increased by 22 outlets, which reflects the national trend seen in many town centres. This increase has more than offset the loss of comparison shops in Barking. Barking continues to have a relatively high proportion of fast food takeaways, betting shops and hairdressers/beauty parlours.
4.13 Barking town centre has a good provision of other non-retail uses including leisure and community uses. These uses include: a library/learning centre, educational establishments, council offices, health centres, sports/leisure centre, theatre, places of worship, Travelodge hotel, dentist, snooker club and offices.
Vacancy Rate 4.14 The vacancy rate in Barking is significantly lower than the national average at 3.7%, compared
to 11.8%. The vacant units are generally small and spread throughout the centre. The low vacancy rate indicates the centre is performing well. Since 2013, the number of vacant units has improved significantly, decreasing from 27 to 10 units.
Accessibility 4.15 Barking town centre has excellent public transport accessibility. The station is located in the
heart of the town centre and is served by the District, Hammersmith & City lines, over ground
Barking and Dagenham Retail and Town Centre Study : Update Report
Pg 23
and a variety of bus routes. The town centre is also well connected to the road network with easy access to the A12, A13, M25 and north circular. Less than 1% of household survey respondents in the 2013 survey indicated that better bus or transport links would make them shop more often in Barking town centre.
4.16 The town centre has a number of accessible car parks, including:
• Axe Street (100 spaces)
• Vicarage Road (Vicarage Fields) (200 spaces – surface level)
• Ripple Road (70 spaces)
• London Road multi-storey (650 spaces)
• Asda, North Street (350 spaces)
• Vicarage Field (330 spaces – roof top)
Environmental Quality 4.17 As in 2013, the environmental quality in the centre is mixed. Station Parade a linear route with
fairly heavy traffic flow, with buses regularly passing through the street. As a result, this shopping street has reduced pedestrian accessibility and safety and reduced overall environmental quality due to noise and air pollution associated with traffic.
4.18 Ripple Road, East Street and the Vicarage Field shopping centre are all highly accessible for pedestrians. East Street is fully pedestrianised and hosts a street market selling a range of convenience and comparison goods. The paving, street furniture and upkeep of some shop fronts in this part of the centre however is poor which detracts from the quality of public realm. The new Asda development on the corner of London Road and North Street has enhanced the environment in this area, offering modern retail units, with residential accommodation above. In addition, the Town Square development is of good quality and enhances the overall quality of the environment.
4.19 The quality of public realm overall is good, as a result of the development of well-designed modern buildings and the implementation of street scene improvements including planting, paving and seating. The Vicarage Field shopping centre offers a safe and highly accessible shopping environment for pedestrians, although the centre is dated and occupied by discount/value retailers, which, together with the aged internal fixtures and fittings in the centre significantly reduces the quality of the public realm.
4.20 The centre contains a wide range of buildings in terms of use and architectural design. The most important historic buildings are located along East Street and all contain A1, A2, A3 and A5 uses. Several new and retrofitted modern buildings contain a wider range of uses including the recent Asda footsore, the new Abbey Leisure Centre, Travelodge hotel, library, residential flats with ground floor commercial units, theatre.
4.21 The centre has CCTV coverage and the overall environment is safe and comfortable.
SWOT Analysis
Strengths
• For a medium sized town centre, Barking has a reasonable number of convenience and comparison retail units (about 130 units), despite the reduction in the number of comparison units since 2013. There is a mix of both multiple and independent traders. The
Barking and Dagenham Retail and Town Centre Study : Update Report
Pg 24
centre is particularly strong within the value/discount sector, supported by the street market stalls.
• The street market has a variety of stalls selling a range of clothing, household products, food and hardware. It helps to differentiate Barking from other competing town centres and provides an added attraction for customers. It adds to the vibrancy of the high street.
• Shopping facilities are complimented and supported by a variety of non-retail services, community and leisure facilities. The centre has a good provision of banks, hairdressers, estate agents, cafés, takeaways and community facilities including a library, new leisure centre, theatre, health centres and places of worship.
• The centre has a lower vacancy rate when compared with the national average, which suggests operator demand for space is strong and the centre is performing well. The vacancy rate has decreased significantly since 2013.
• The centre is relatively compact and there is high footfall within the retail core. The centre provides a variety of covered, pedestrianised and traditional high street shopping areas. The centre has a strong community feel.
• Barking has excellent public transport links. National rail services operate from the station in addition to the Hammersmith & City and District underground lines. There are a number of local bus services serving the centre making it very well connected to the surrounding area. Road accessibility to the A12, A13, north circular and M25 are also excellent. These linkages adequately serve the centre's primary catchment area. Car parking is conveniently located within and around the centre.
• The centre has recently received a significant amount of investment in new buildings such as the new Abbey Leisure Centre and the Asda development. In addition, previous investment in the Town Square provided modern commercial units, including a Travelodge hotel, library, theatre and new apartments. These developments have brought with them associated improvements to the public realm in the form of new paving, lighting, planting and street furniture.
• The mixed-use development at London Road/North Street in Barking, including the new Asda store, acts as a convenience anchor store for Barking town centre.
Weaknesses
• Barking town centre is a third-tier centre within the East London shopping hierarchy. It falls within the catchment areas of larger competing centres e.g. Ilford, Romford, Lakeside and Central London. The strength of this competition restricts the extent of Barking's primary catchment area and its market share of expenditure. It also restricts its ability to attract multiple operators.
• Barking has a below average proportion of multiple operators. There is no high-profile department/variety store operator to anchor the centre, such as Debenhams or Marks & Spencer. There are gaps in the clothing sector i.e. limited middle/mass market level shops and no upper market/luxury level shops.
• The household and business survey results from 2013 suggested there is a degree of dissatisfaction with the choice and quality of non-food shops across all four main centres in the Borough. Most businesses suggested the centres are "too down market". The reduction in comparison goods shops since 2013 suggests these concerns are still relevant.
• Although the range and choice of shopping in Barking meets the needs of many customers in the primary catchment area, the centre does not meet the needs of all customers, particularly more affluent households. As a result, there is a significant amount of

Barking and Dagenham Retail and Town Centre Study : Update Report
Pg 25
comparison goods expenditure that leaks from the centre's primary catchment area to competing centres.
• Despite the large number of non-retail service uses within Barking there are gaps in provision, such as restaurants/bars (rather than takeaways). In addition, the evening economy in terms of leisure and entertainment facilities is relatively under-represented.
• The interior of Vicarage Fields Shopping Centre is relatively dated which detracts from the overall shopping environment.
• Along the Station Parade, relatively heavy traffic flows act as a barrier to pedestrian access and reduce safety for other road users.
Opportunities
• Population within the study area is expected to increase between 2019 and 2034 by 28% (Appendix 7, Table 1). As a consequence of growth in population and per capita spending, convenience goods spending within the study area is forecast to increase by 37% by 2034 (Appendix 7, Table 2), and comparison goods spending is forecast to increase by 96% (Appendix 8, Table 2). Barking will benefit from this significant growth by attracting more customers and expenditure, which in turn should increase demand from operators. Barking is well placed to benefit from the major residential development currently taking place at Barking Riverside, providing the mix of uses and offer is right.
• The high level of comparison goods expenditure leakage from Barking town centre's catchment area may provide an opportunity for new development to increase the Barking's market share of expenditure and reduce expenditure leakage.
• There are further opportunities for development/regeneration within the centre, including under-used office stock and areas where high-density mixed-use development including residential uses could be brought forward. These developments should bring associated improvements to the public realm, and shop fronts can be improved. Collectively these developments and improvements should significantly enhance Barking as a place to shop, live, work or visit.
• There may be a number of mass market and lower-middle level operators who could be attracted to the centre in the future, i.e. if suitable premises are made available.
• The importance of the evening economy within shopping centres is recognised by shopping centre owners, and this has led to an increase in food and beverage uses. There is an opportunity to improve this sector in Barking and other main centres in the Borough, as there are currently limited national chain operators.
• Barking's excellent accessibility and public transport links provide the potential to extend the centres catchment area if other improvements are made within the town centre.
• There several future initiatives that could benefit Barking town centre. Proposals to relocate three City Markets to Barking Power Station, a new food college, affordable workspace and NHS plans to consolidate facilities in Barking town centre could help to generate new visitors to the area and spin off trade.
Threats
• The 2013 survey results suggested there is a perception Barking town centre is too downmarket. Since the survey, aside from Costa Coffee, no significant new higher order operators have opened in the town centre. This will need to be addressed over time in order to avoid negative impacts on investment confidence.
Barking and Dagenham Retail and Town Centre Study : Update Report
Pg 26
• The continuation of national trends including the polarisation of investment from multiple operators into the largest centres and multi-channel/home shopping increasing real terms could undermine Barking's position in the shopping hierarchy reducing the number of customers and expenditure.
• The need for Barking market and the small independent units in the town centre could be threatened, e.g. through gentrification of the area and competing development pressures. Development pressures for non-retail uses as part of mixed uses development with the town centre needs to be balanced with maintaining opportunities for retail uses, particularly independent traders.
• Competing centres will inevitably improve in the future. If Barking does not improve it will not maintain its position in the hierarchy and the high level of comparison goods expenditure leakage to areas outside the Borough will increase further.
Barking and Dagenham Retail and Town Centre Study : Update Report
Pg 27
5.0 Dagenham Heathway health check Key Roles
5.1 Dagenham Heathway is a linear shopping centre which extends north to south along the main shopping street 'The Heathway'. The entrance to Heathway Shopping Centre – a ground floor indoor shopping precinct – is also accessed off the Heathway.
5.2 Dagenham Heathway is defined as a district centre which is centrally located to the South of the Borough surrounded by residential areas. The centre has a good offer of retail and service uses as well as complimentary community uses, such as the library which is a relatively new investment and addition to the centre. It also functions as a transport hub; Dagenham Heathway Station is located at the mid-point of the shopping parade which is well served by local bus routes.
5.3 Dagenham Heathway's key roles include:
• Convenience shopping: Lidl and Iceland provide the main supermarket offer, located along the main shopping street, the Heathway. There is also a Tesco Express outside Heathway Shopping Centre. The main supermarket offer is supplemented by a broad range of small independent food stores, butchers, bakers and fishmongers.
• Comparison shopping: a small number of national multiple retailers selling a range of high and low order goods are located in the centre. For example, Boots and JD Sports are all located within Heathway Shopping Centre. The comparison shopping offer is mainly made up of smaller independent shops along the Heathway.
• Retail services: a good selection of retail service units including numerous national high street banks, estate agents, travel agents, beauty salons and hairdressers.
• Community facilities: limited to a library. There is a Doctor’s surgery and community hall within a short walking distance from the Heathway.
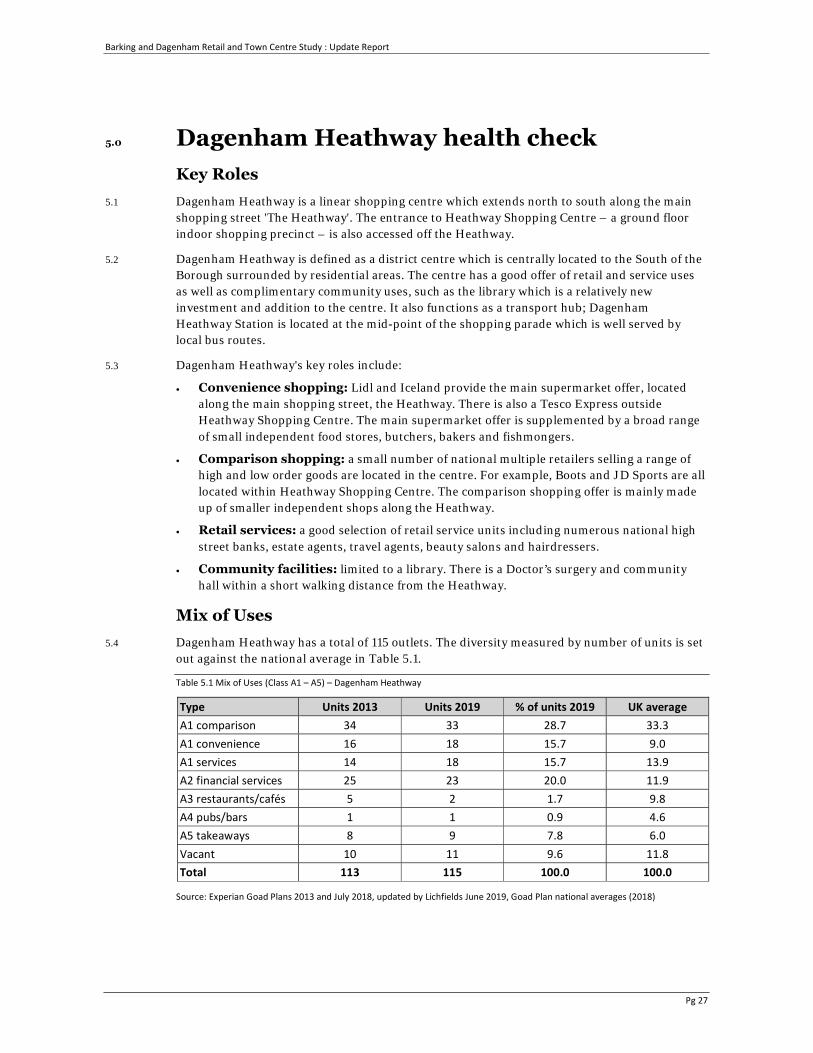
Mix of Uses 5.4 Dagenham Heathway has a total of 115 outlets. The diversity measured by number of units is set
out against the national average in Table 5.1.
Table 5.1 Mix of Uses (Class A1 – A5) – Dagenham Heathway
Type Units 2013 Units 2019 % of units 2019 UK average A1 comparison 34 33 28.7 33.3 A1 convenience 16 18 15.7 9.0 A1 services 14 18 15.7 13.9 A2 financial services 25 23 20.0 11.9 A3 restaurants/cafés 5 2 1.7 9.8 A4 pubs/bars 1 1 0.9 4.6 A5 takeaways 8 9 7.8 6.0 Vacant 10 11 9.6 11.8 Total 113 115 100.0 100.0
Source: Experian Goad Plans 2013 and July 2018, updated by Lichfields June 2019, Goad Plan national averages (2018)
Barking and Dagenham Retail and Town Centre Study : Update Report
Pg 28
5.5 The composition of Dagenham Heathway offers a reasonable choice of Class A1 – A5 units, although the choice of Class A3 and A4 units is very limited. Since 2013, the mix of units has remained broadly consistent, although there has been a reduction in Class A3 uses. The number of vacant units has only increased by one since 2013, and the vacancy rate is below the national average.
5.6 A coloured Goad Plan, detailing the mix of uses in Dagenham Heathway, can be found at Appendix 2.
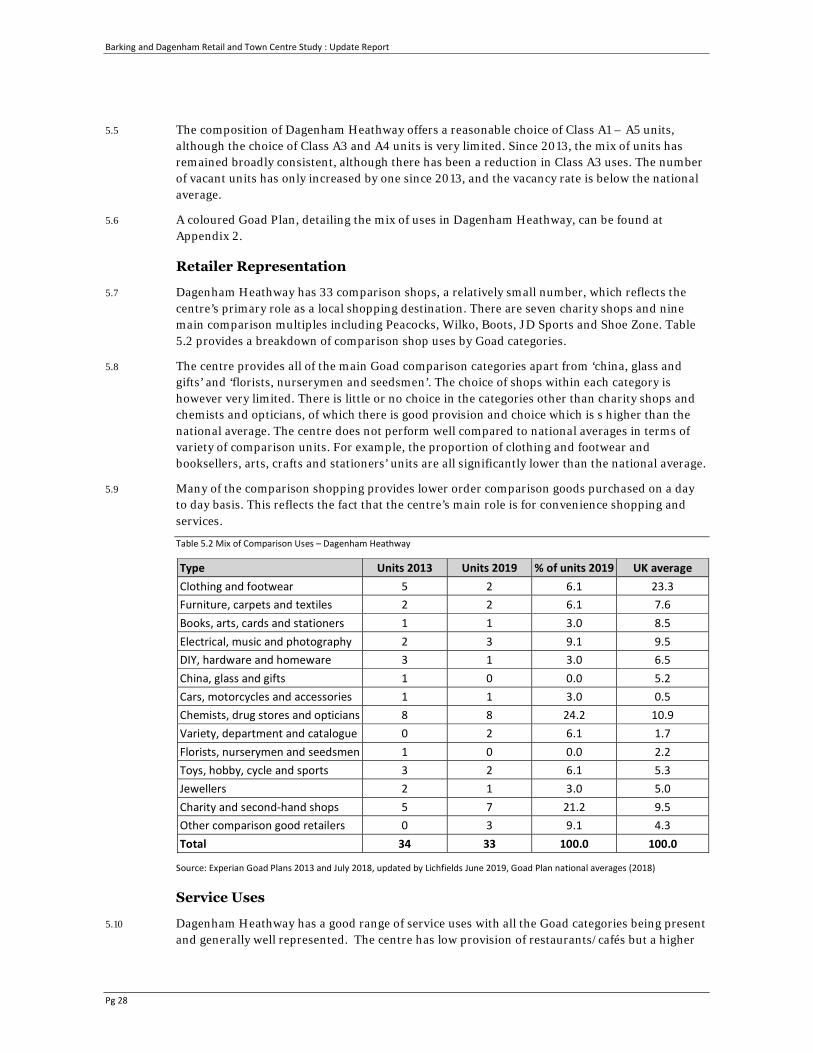
Retailer Representation
5.7 Dagenham Heathway has 33 comparison shops, a relatively small number, which reflects the centre’s primary role as a local shopping destination. There are seven charity shops and nine main comparison multiples including Peacocks, Wilko, Boots, JD Sports and Shoe Zone. Table 5.2 provides a breakdown of comparison shop uses by Goad categories.
5.8 The centre provides all of the main Goad comparison categories apart from ‘china, glass and gifts’ and ‘florists, nurserymen and seedsmen’. The choice of shops within each category is however very limited. There is little or no choice in the categories other than charity shops and chemists and opticians, of which there is good provision and choice which is s higher than the national average. The centre does not perform well compared to national averages in terms of variety of comparison units. For example, the proportion of clothing and footwear and booksellers, arts, crafts and stationers’ units are all significantly lower than the national average.
5.9 Many of the comparison shopping provides lower order comparison goods purchased on a day to day basis. This reflects the fact that the centre’s main role is for convenience shopping and services.
Table 5.2 Mix of Comparison Uses – Dagenham Heathway
Type Units 2013 Units 2019 % of units 2019 UK average Clothing and footwear 5 2 6.1 23.3 Furniture, carpets and textiles 2 2 6.1 7.6 Books, arts, cards and stationers 1 1 3.0 8.5 Electrical, music and photography 2 3 9.1 9.5 DIY, hardware and homeware 3 1 3.0 6.5 China, glass and gifts 1 0 0.0 5.2 Cars, motorcycles and accessories 1 1 3.0 0.5 Chemists, drug stores and opticians 8 8 24.2 10.9 Variety, department and catalogue 0 2 6.1 1.7 Florists, nurserymen and seedsmen 1 0 0.0 2.2 Toys, hobby, cycle and sports 3 2 6.1 5.3 Jewellers 2 1 3.0 5.0 Charity and second-hand shops 5 7 21.2 9.5 Other comparison good retailers 0 3 9.1 4.3 Total 34 33 100.0 100.0
Source: Experian Goad Plans 2013 and July 2018, updated by Lichfields June 2019, Goad Plan national averages (2018)
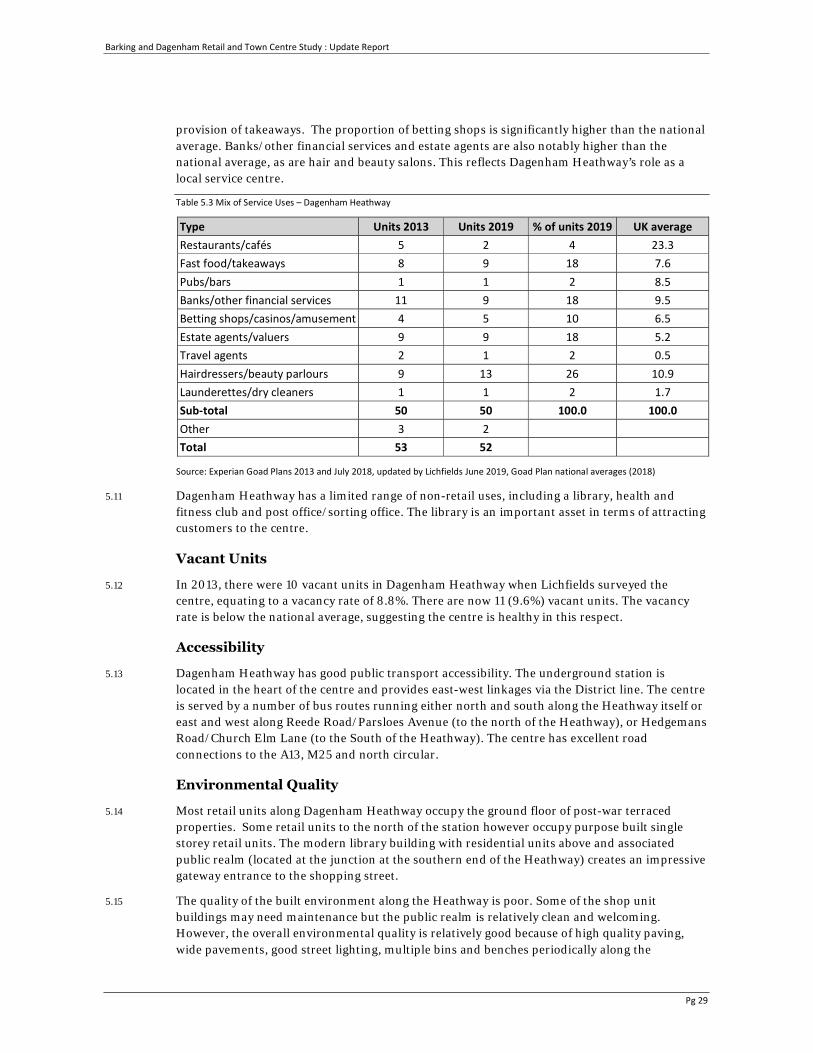
Service Uses
5.10 Dagenham Heathway has a good range of service uses with all the Goad categories being present and generally well represented. The centre has low provision of restaurants/cafés but a higher
Barking and Dagenham Retail and Town Centre Study : Update Report
Pg 29
provision of takeaways. The proportion of betting shops is significantly higher than the national average. Banks/other financial services and estate agents are also notably higher than the national average, as are hair and beauty salons. This reflects Dagenham Heathway’s role as a local service centre.
Table 5.3 Mix of Service Uses – Dagenham Heathway
Type Units 2013 Units 2019 % of units 2019 UK average Restaurants/cafés 5 2 4 23.3 Fast food/takeaways 8 9 18 7.6 Pubs/bars 1 1 2 8.5 Banks/other financial services 11 9 18 9.5 Betting shops/casinos/amusement 4 5 10 6.5 Estate agents/valuers 9 9 18 5.2 Travel agents 2 1 2 0.5 Hairdressers/beauty parlours 9 13 26 10.9 Launderettes/dry cleaners 1 1 2 1.7 Sub-total 50 50 100.0 100.0 Other 3 2 Total 53 52
Source: Experian Goad Plans 2013 and July 2018, updated by Lichfields June 2019, Goad Plan national averages (2018)
5.11 Dagenham Heathway has a limited range of non-retail uses, including a library, health and fitness club and post office/sorting office. The library is an important asset in terms of attracting customers to the centre.
Vacant Units
5.12 In 2013, there were 10 vacant units in Dagenham Heathway when Lichfields surveyed the centre, equating to a vacancy rate of 8.8%. There are now 11 (9.6%) vacant units. The vacancy rate is below the national average, suggesting the centre is healthy in this respect.
Accessibility
5.13 Dagenham Heathway has good public transport accessibility. The underground station is located in the heart of the centre and provides east-west linkages via the District line. The centre is served by a number of bus routes running either north and south along the Heathway itself or east and west along Reede Road/Parsloes Avenue (to the north of the Heathway), or Hedgemans Road/Church Elm Lane (to the South of the Heathway). The centre has excellent road connections to the A13, M25 and north circular.
Environmental Quality
5.14 Most retail units along Dagenham Heathway occupy the ground floor of post-war terraced properties. Some retail units to the north of the station however occupy purpose built single storey retail units. The modern library building with residential units above and associated public realm (located at the junction at the southern end of the Heathway) creates an impressive gateway entrance to the shopping street.
5.15 The quality of the built environment along the Heathway is poor. Some of the shop unit buildings may need maintenance but the public realm is relatively clean and welcoming. However, the overall environmental quality is relatively good because of high quality paving, wide pavements, good street lighting, multiple bins and benches periodically along the
Barking and Dagenham Retail and Town Centre Study : Update Report
Pg 30
Heathway and cycle parking spaces. While the Heathway is a busy road with heavy traffic flow, road narrowing has improved pedestrian safety and accessibility and there are good crossing points – especially immediately outside Dagenham Heathway station.
SWOT analysis 5.16 The strengths, weaknesses, opportunities and threats at Dagenham Heathway remain similar to
the previous study.
Strengths
• Dagenham Heathway is a very compact purpose-built shopping centre. It has a strong footfall along the Heathway and in the shopping centre. It is a linear street with shopping down the entirety of both sides, which creates a good circular route for shoppers.
• As a medium sized district centre, Dagenham Heathway has a good range of retail and non-retail services which primarily serve the day to day needs of the local catchment area. Its comparison shopping offer is focused on lower order day to day products. Service uses include banks, hairdressers, estate agents, travel agents and dry cleaners. The library is an important asset that helps to attract customers and increases the range of reasons to visit.
• The centre is anchored by two supermarkets (Lidl and Iceland), with parking facilities. There is also a Tesco Express and a good provision of independent specialist food stores including butchers, bakers, a seafood store and various international food shops which supplement the main food store offer. Food and grocery shopping facilities are key to the retail offer.
• The vacancy rate remains below the national average, which suggests independent outlet demand for shop units is in line with supply and the centre is relatively strong in this regard.
• Accessibility in to the centre is very good with Dagenham Heathway Tube Station on the District line right in the middle of the Heathway. A number of local bus services stop along the main road, connecting the centre to the wider local area.
• The environmental quality is good as a result of high-quality paving and street furniture such as planters, seating and bus stops. There are also planters along the Heathway.
Weaknesses
• Dagenham Heathway's comparison role is relatively limited. For a medium sized centre, Dagenham Heathway has a low proportion of comparison goods retailers and a low proportion of national multiple retailers, which can draw customers to the centre from a wider area. The centre has a limited provision of shops selling higher order comparison goods bought on an occasional basis where customers will generally want to shop around in more than one outlet.
• The centre has a relatively weak evening economy. There is a pub on the Heathway but in general, there is a lack of leisure uses, restaurants and bars to provide evening entertainment. The proportion of A3/A4 services is lower than the national average.
• Heavy traffic flows along the Heathway act as a barrier to pedestrian flows. The junctions at each end of the Heathway are particularly busy.
• The general appearance of some shop fronts is poor due to lack of maintenance which detracts from the quality of the built environment.
• Dagenham Heathway has limited physical potential to expand.
Barking and Dagenham Retail and Town Centre Study : Update Report
Pg 31
Opportunities
• Dagenham Heathway's good accessibility and public transport links provide the potential to extend the centres catchment area.
• Despite the relatively low vacancy rate there are some units available to accommodate new outlets, especially within the indoor shopping centre.
• Dagenham Heathway is well located to benefit from population and expenditure growth generated by major residential development at Barking Riverside.
• The Merrielands Retail Park is relatively close to Dagenham Heathway. This area is the main focus of large format retail stores and leisure facilities in the Borough. The types of shops and uses here are different to Dagenham Heathway and therefore they can complement one another by providing different retail offers. The Retail Park is likely to continue to generate some spin off trade for Dagenham Heathway, through linked trips.
Threats
• The lack of opportunities to expand will affect the centre's ability to accommodate growth and the role of the centre within the hierarchy could decline.
• The continuation of national trends including the polarisation of investment from multiple operators into the largest centres and multi-channel/home shopping increasing real terms could undermine Dagenham Heathway’s position in the shopping hierarchy reducing the number of customers and expenditure.
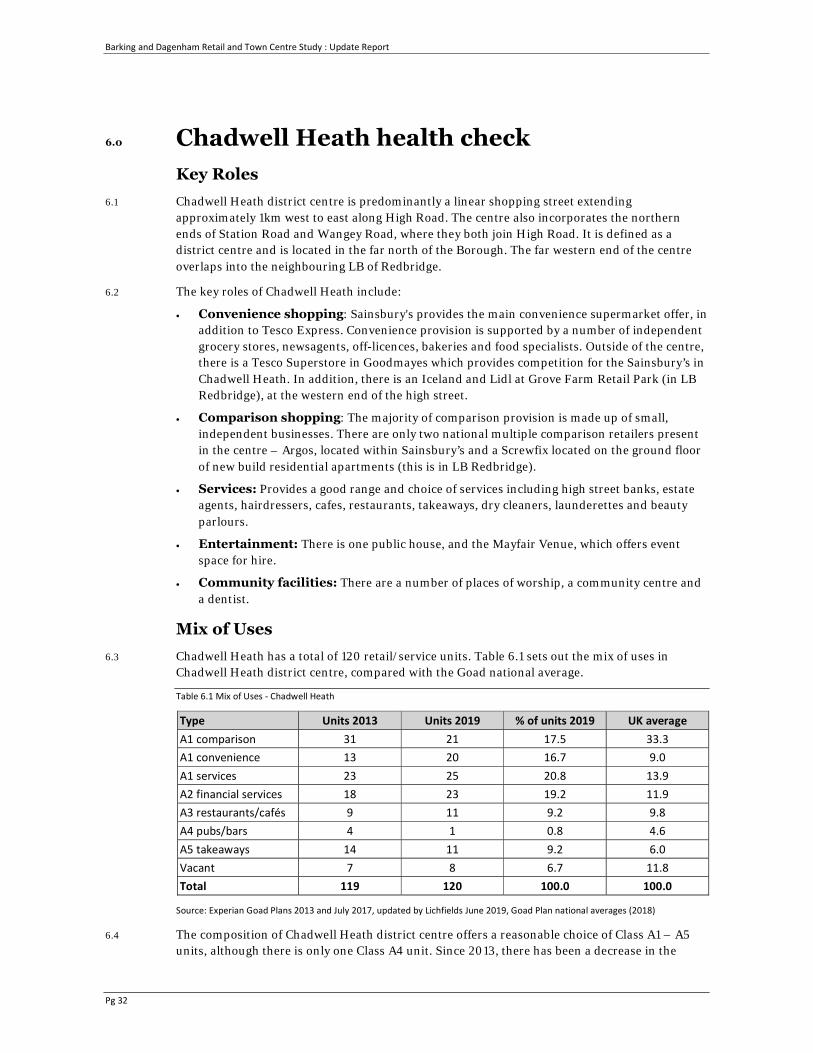
Barking and Dagenham Retail and Town Centre Study : Update Report
Pg 32
6.0 Chadwell Heath health check Key Roles
6.1 Chadwell Heath district centre is predominantly a linear shopping street extending approximately 1km west to east along High Road. The centre also incorporates the northern ends of Station Road and Wangey Road, where they both join High Road. It is defined as a district centre and is located in the far north of the Borough. The far western end of the centre overlaps into the neighbouring LB of Redbridge.
6.2 The key roles of Chadwell Heath include:
• Convenience shopping: Sainsbury's provides the main convenience supermarket offer, in addition to Tesco Express. Convenience provision is supported by a number of independent grocery stores, newsagents, off-licences, bakeries and food specialists. Outside of the centre, there is a Tesco Superstore in Goodmayes which provides competition for the Sainsbury’s in Chadwell Heath. In addition, there is an Iceland and Lidl at Grove Farm Retail Park (in LB Redbridge), at the western end of the high street.
• Comparison shopping: The majority of comparison provision is made up of small, independent businesses. There are only two national multiple comparison retailers present in the centre – Argos, located within Sainsbury’s and a Screwfix located on the ground floor of new build residential apartments (this is in LB Redbridge).
• Services: Provides a good range and choice of services including high street banks, estate agents, hairdressers, cafes, restaurants, takeaways, dry cleaners, launderettes and beauty parlours.
• Entertainment: There is one public house, and the Mayfair Venue, which offers event space for hire.
• Community facilities: There are a number of places of worship, a community centre and a dentist.
Mix of Uses 6.3 Chadwell Heath has a total of 120 retail/service units. Table 6.1 sets out the mix of uses in
Chadwell Heath district centre, compared with the Goad national average.
Table 6.1 Mix of Uses - Chadwell Heath
Type Units 2013 Units 2019 % of units 2019 UK average A1 comparison 31 21 17.5 33.3 A1 convenience 13 20 16.7 9.0 A1 services 23 25 20.8 13.9 A2 financial services 18 23 19.2 11.9 A3 restaurants/cafés 9 11 9.2 9.8 A4 pubs/bars 4 1 0.8 4.6 A5 takeaways 14 11 9.2 6.0 Vacant 7 8 6.7 11.8 Total 119 120 100.0 100.0
Source: Experian Goad Plans 2013 and July 2017, updated by Lichfields June 2019, Goad Plan national averages (2018)
6.4 The composition of Chadwell Heath district centre offers a reasonable choice of Class A1 – A5 units, although there is only one Class A4 unit. Since 2013, there has been a decrease in the
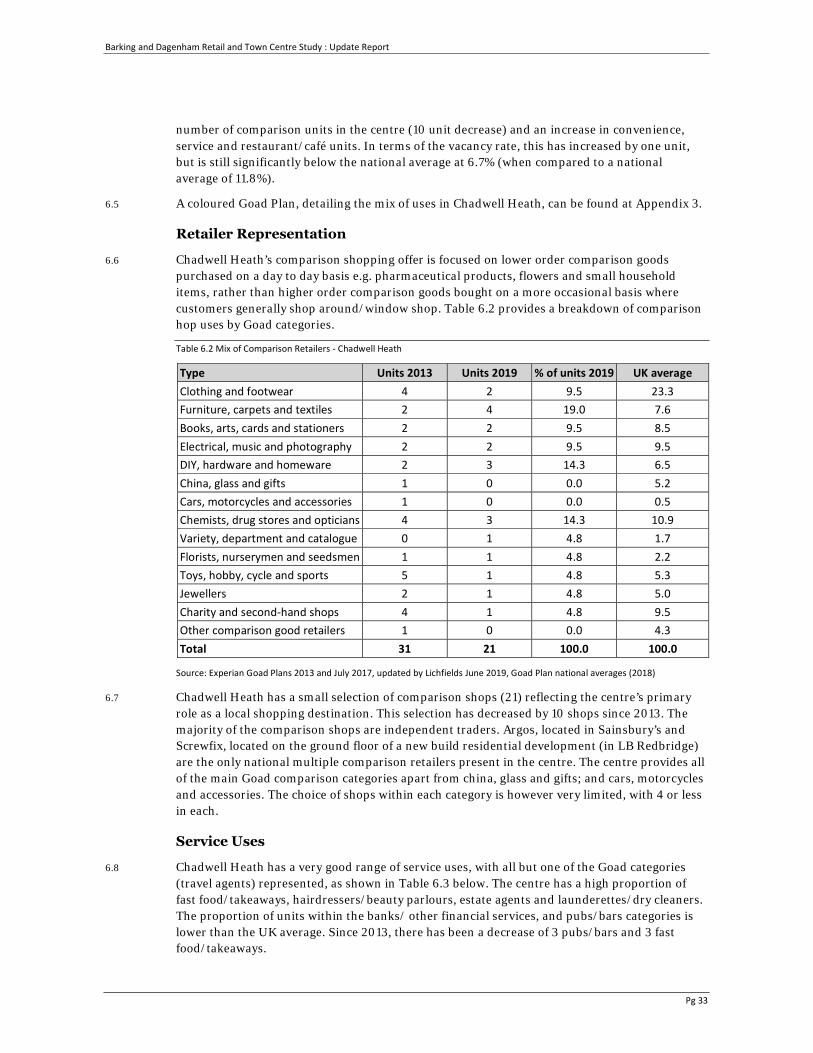
Barking and Dagenham Retail and Town Centre Study : Update Report
Pg 33
number of comparison units in the centre (10 unit decrease) and an increase in convenience, service and restaurant/café units. In terms of the vacancy rate, this has increased by one unit, but is still significantly below the national average at 6.7% (when compared to a national average of 11.8%).
6.5 A coloured Goad Plan, detailing the mix of uses in Chadwell Heath, can be found at Appendix 3.
Retailer Representation
6.6 Chadwell Heath’s comparison shopping offer is focused on lower order comparison goods purchased on a day to day basis e.g. pharmaceutical products, flowers and small household items, rather than higher order comparison goods bought on a more occasional basis where customers generally shop around/window shop. Table 6.2 provides a breakdown of comparison hop uses by Goad categories.
Table 6.2 Mix of Comparison Retailers - Chadwell Heath
Type Units 2013 Units 2019 % of units 2019 UK average Clothing and footwear 4 2 9.5 23.3 Furniture, carpets and textiles 2 4 19.0 7.6 Books, arts, cards and stationers 2 2 9.5 8.5 Electrical, music and photography 2 2 9.5 9.5 DIY, hardware and homeware 2 3 14.3 6.5 China, glass and gifts 1 0 0.0 5.2 Cars, motorcycles and accessories 1 0 0.0 0.5 Chemists, drug stores and opticians 4 3 14.3 10.9 Variety, department and catalogue 0 1 4.8 1.7 Florists, nurserymen and seedsmen 1 1 4.8 2.2 Toys, hobby, cycle and sports 5 1 4.8 5.3 Jewellers 2 1 4.8 5.0 Charity and second-hand shops 4 1 4.8 9.5 Other comparison good retailers 1 0 0.0 4.3 Total 31 21 100.0 100.0
Source: Experian Goad Plans 2013 and July 2017, updated by Lichfields June 2019, Goad Plan national averages (2018)
6.7 Chadwell Heath has a small selection of comparison shops (21) reflecting the centre’s primary role as a local shopping destination. This selection has decreased by 10 shops since 2013. The majority of the comparison shops are independent traders. Argos, located in Sainsbury’s and Screwfix, located on the ground floor of a new build residential development (in LB Redbridge) are the only national multiple comparison retailers present in the centre. The centre provides all of the main Goad comparison categories apart from china, glass and gifts; and cars, motorcycles and accessories. The choice of shops within each category is however very limited, with 4 or less in each.
Service Uses
6.8 Chadwell Heath has a very good range of service uses, with all but one of the Goad categories (travel agents) represented, as shown in Table 6.3 below. The centre has a high proportion of fast food/takeaways, hairdressers/beauty parlours, estate agents and launderettes/dry cleaners. The proportion of units within the banks/ other financial services, and pubs/bars categories is lower than the UK average. Since 2013, there has been a decrease of 3 pubs/bars and 3 fast food/takeaways.
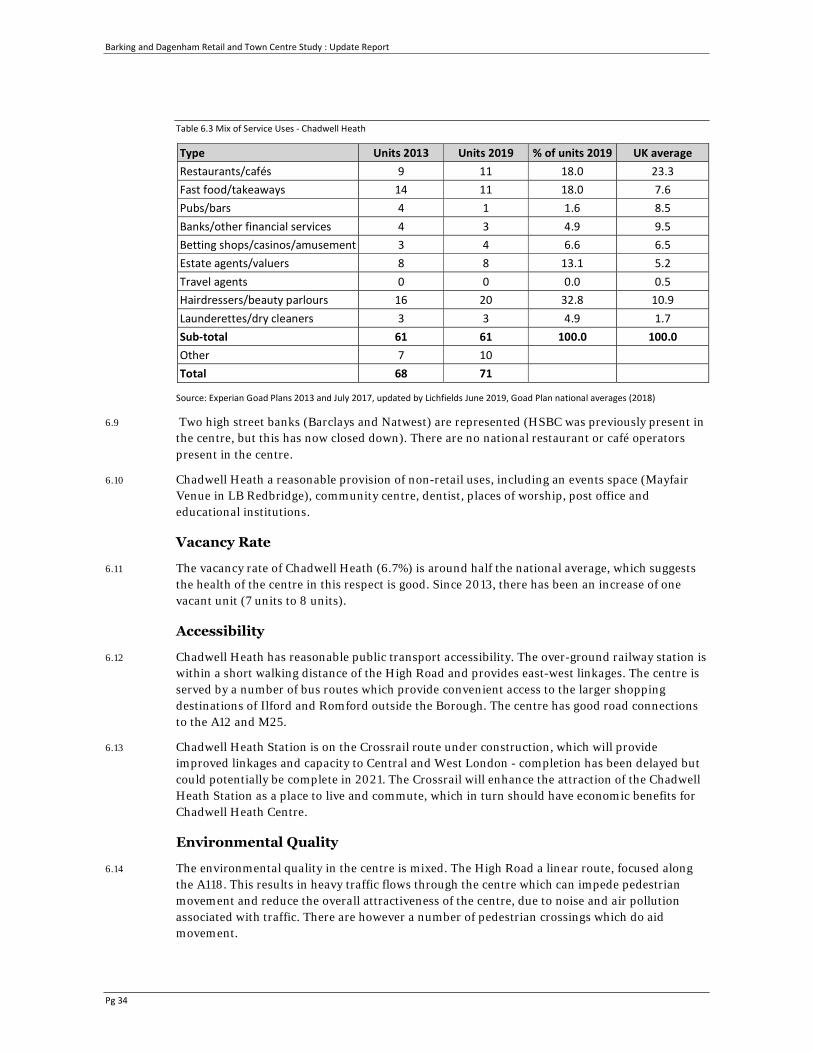
Barking and Dagenham Retail and Town Centre Study : Update Report
Pg 34
Table 6.3 Mix of Service Uses - Chadwell Heath
Type Units 2013 Units 2019 % of units 2019 UK average Restaurants/cafés 9 11 18.0 23.3 Fast food/takeaways 14 11 18.0 7.6 Pubs/bars 4 1 1.6 8.5 Banks/other financial services 4 3 4.9 9.5 Betting shops/casinos/amusement 3 4 6.6 6.5 Estate agents/valuers 8 8 13.1 5.2 Travel agents 0 0 0.0 0.5 Hairdressers/beauty parlours 16 20 32.8 10.9 Launderettes/dry cleaners 3 3 4.9 1.7 Sub-total 61 61 100.0 100.0 Other 7 10 Total 68 71
Source: Experian Goad Plans 2013 and July 2017, updated by Lichfields June 2019, Goad Plan national averages (2018)
6.9 Two high street banks (Barclays and Natwest) are represented (HSBC was previously present in the centre, but this has now closed down). There are no national restaurant or café operators present in the centre.
6.10 Chadwell Heath a reasonable provision of non-retail uses, including an events space (Mayfair Venue in LB Redbridge), community centre, dentist, places of worship, post office and educational institutions.
Vacancy Rate
6.11 The vacancy rate of Chadwell Heath (6.7%) is around half the national average, which suggests the health of the centre in this respect is good. Since 2013, there has been an increase of one vacant unit (7 units to 8 units).
Accessibility
6.12 Chadwell Heath has reasonable public transport accessibility. The over-ground railway station is within a short walking distance of the High Road and provides east-west linkages. The centre is served by a number of bus routes which provide convenient access to the larger shopping destinations of Ilford and Romford outside the Borough. The centre has good road connections to the A12 and M25.
6.13 Chadwell Heath Station is on the Crossrail route under construction, which will provide improved linkages and capacity to Central and West London - completion has been delayed but could potentially be complete in 2021. The Crossrail will enhance the attraction of the Chadwell Heath Station as a place to live and commute, which in turn should have economic benefits for Chadwell Heath Centre.
Environmental Quality
6.14 The environmental quality in the centre is mixed. The High Road a linear route, focused along the A118. This results in heavy traffic flows through the centre which can impede pedestrian movement and reduce the overall attractiveness of the centre, due to noise and air pollution associated with traffic. There are however a number of pedestrian crossings which do aid movement.

Barking and Dagenham Retail and Town Centre Study : Update Report
Pg 35
6.15 Most buildings are pre-Second World War terraces, interspersed with semi-detached and terraced housing. Overall, the shop fronts are mostly of good quality and well maintained, but some could benefit from investment. There is street lighting and street furniture throughout the centre which improves the environmental quality. There is some sporadic planting, however investment in this would benefit the environmental quality.
SWOT analysis
Strengths
• As a medium sized district centre, Chadwell Heath has a good range of retail and non-retail services which primarily serve the day to day needs of the local catchment area. Its comparison shopping offer is focused on lower order day to day products. Service uses include banks, hairdressers, estate agents and dry cleaners.
• The centre is anchored by a Sainsbury and Tesco Express food stores. The centre has a good provision of independent specialist food stores including a baker and off license. Food and grocery shopping is a key element of the centre's overall attraction.
• The vacancy rate is significantly below the national average, which suggests independent outlet demand for shop units is in line with supply.
• Accessibility in to the centre is reasonable with an over ground station and a number of bus routes serving the centre. The Sainsbury's store car park helps to generate linked trips.
• There are wide pavements with street furniture provided in areas, which encourages people to stay longer in the centre.
Weaknesses
• Chadwell Heath's comparison role is relatively limited and lacks national multiple comparison retailers that can draw customers to the centre from a wider area. The centre has a below average number of comparison retailers, especially clothing and footwear retailers and only two national multiple retailers are represented.
• There are no national restaurant or café chains present in the centre.
• The centre is a linear shopping street that lacks a main focal point and does not provide a natural for pedestrians. The busy road running through the centre creates a noisy, polluted environment and can make it difficult to cross the road.
• Chadwell Heath has limited physical potential to expand.
Opportunities
• Chadwell Heath station is on the Crossrail route which will enhance the attraction of the area as a place to live and commute, which in turn have economic benefits for Chadwell Heath centre, including increase footfall through the centre and station.
• The former White Horse public house is a potential development site which could provide a new public house on the ground floor, with residential above. This could help increase the attractiveness of the centre.
Threats
• If the centre cannot attract growth, the role of the centre within the hierarchy could decline.
• The continuation of national trends including the polarisation of investment from multiple operators into the largest centres and multi-channel/home shopping increasing real terms

Barking and Dagenham Retail and Town Centre Study : Update Report
Pg 36
could undermine Chadwell Heath’s position in the shopping hierarchy reducing the number of customers and expenditure.
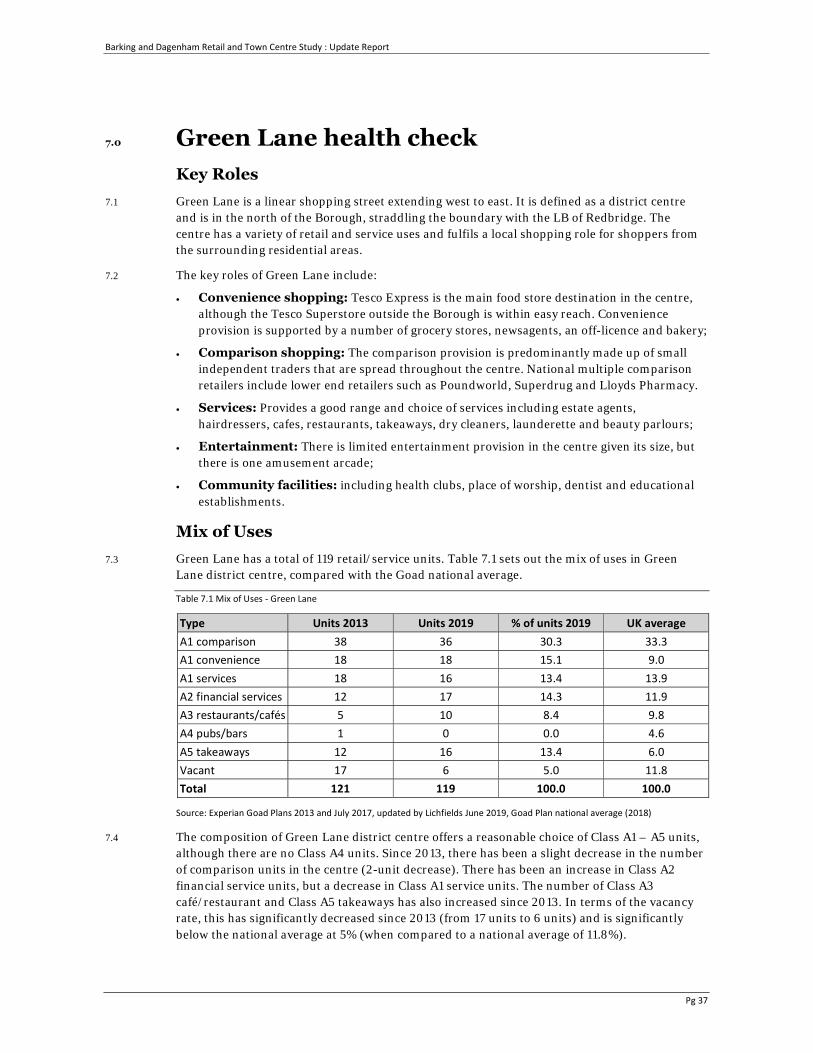
Barking and Dagenham Retail and Town Centre Study : Update Report
Pg 37
7.0 Green Lane health check Key Roles
7.1 Green Lane is a linear shopping street extending west to east. It is defined as a district centre and is in the north of the Borough, straddling the boundary with the LB of Redbridge. The centre has a variety of retail and service uses and fulfils a local shopping role for shoppers from the surrounding residential areas.
7.2 The key roles of Green Lane include:
• Convenience shopping: Tesco Express is the main food store destination in the centre, although the Tesco Superstore outside the Borough is within easy reach. Convenience provision is supported by a number of grocery stores, newsagents, an off-licence and bakery;
• Comparison shopping: The comparison provision is predominantly made up of small independent traders that are spread throughout the centre. National multiple comparison retailers include lower end retailers such as Poundworld, Superdrug and Lloyds Pharmacy.
• Services: Provides a good range and choice of services including estate agents, hairdressers, cafes, restaurants, takeaways, dry cleaners, launderette and beauty parlours;
• Entertainment: There is limited entertainment provision in the centre given its size, but there is one amusement arcade;
• Community facilities: including health clubs, place of worship, dentist and educational establishments.
Mix of Uses 7.3 Green Lane has a total of 119 retail/service units. Table 7.1 sets out the mix of uses in Green
Lane district centre, compared with the Goad national average.
Table 7.1 Mix of Uses - Green Lane
Type Units 2013 Units 2019 % of units 2019 UK average A1 comparison 38 36 30.3 33.3 A1 convenience 18 18 15.1 9.0 A1 services 18 16 13.4 13.9 A2 financial services 12 17 14.3 11.9 A3 restaurants/cafés 5 10 8.4 9.8 A4 pubs/bars 1 0 0.0 4.6 A5 takeaways 12 16 13.4 6.0 Vacant 17 6 5.0 11.8 Total 121 119 100.0 100.0
Source: Experian Goad Plans 2013 and July 2017, updated by Lichfields June 2019, Goad Plan national average (2018)
7.4 The composition of Green Lane district centre offers a reasonable choice of Class A1 – A5 units, although there are no Class A4 units. Since 2013, there has been a slight decrease in the number of comparison units in the centre (2-unit decrease). There has been an increase in Class A2 financial service units, but a decrease in Class A1 service units. The number of Class A3 café/restaurant and Class A5 takeaways has also increased since 2013. In terms of the vacancy rate, this has significantly decreased since 2013 (from 17 units to 6 units) and is significantly below the national average at 5% (when compared to a national average of 11.8%).
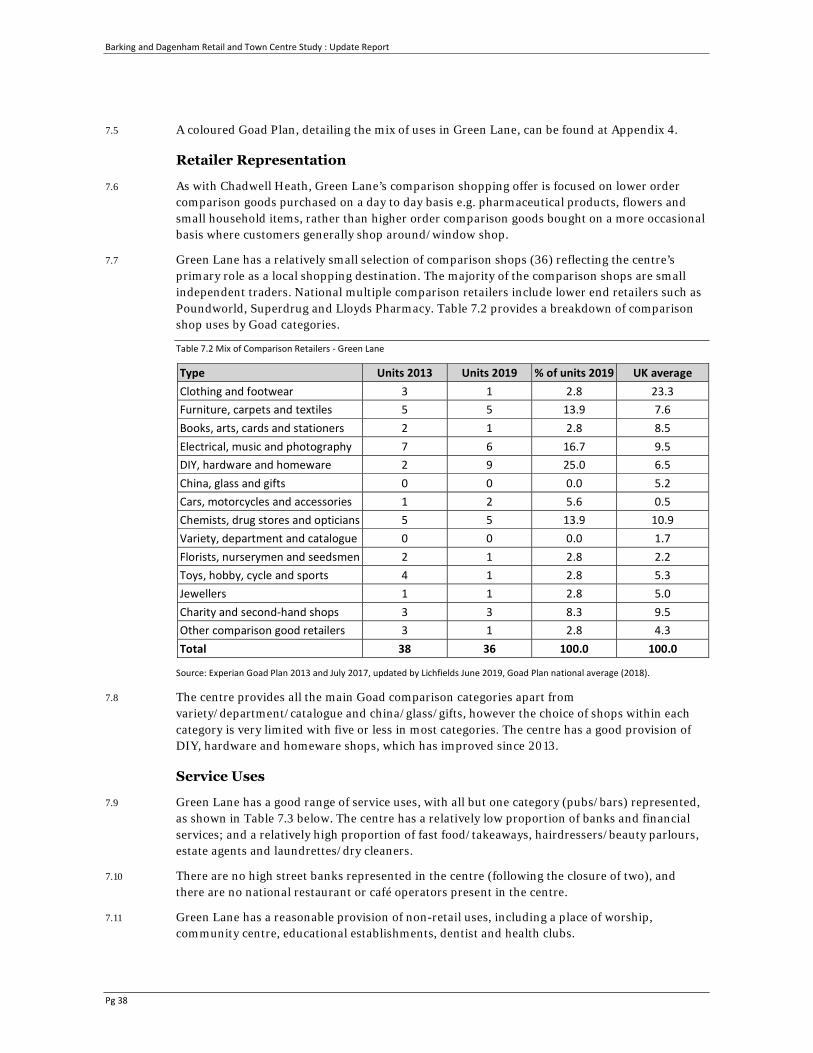
Barking and Dagenham Retail and Town Centre Study : Update Report
Pg 38
7.5 A coloured Goad Plan, detailing the mix of uses in Green Lane, can be found at Appendix 4.
Retailer Representation
7.6 As with Chadwell Heath, Green Lane’s comparison shopping offer is focused on lower order comparison goods purchased on a day to day basis e.g. pharmaceutical products, flowers and small household items, rather than higher order comparison goods bought on a more occasional basis where customers generally shop around/window shop.
7.7 Green Lane has a relatively small selection of comparison shops (36) reflecting the centre’s primary role as a local shopping destination. The majority of the comparison shops are small independent traders. National multiple comparison retailers include lower end retailers such as Poundworld, Superdrug and Lloyds Pharmacy. Table 7.2 provides a breakdown of comparison shop uses by Goad categories.
Table 7.2 Mix of Comparison Retailers - Green Lane
Type Units 2013 Units 2019 % of units 2019 UK average Clothing and footwear 3 1 2.8 23.3 Furniture, carpets and textiles 5 5 13.9 7.6 Books, arts, cards and stationers 2 1 2.8 8.5 Electrical, music and photography 7 6 16.7 9.5 DIY, hardware and homeware 2 9 25.0 6.5 China, glass and gifts 0 0 0.0 5.2 Cars, motorcycles and accessories 1 2 5.6 0.5 Chemists, drug stores and opticians 5 5 13.9 10.9 Variety, department and catalogue 0 0 0.0 1.7 Florists, nurserymen and seedsmen 2 1 2.8 2.2 Toys, hobby, cycle and sports 4 1 2.8 5.3 Jewellers 1 1 2.8 5.0 Charity and second-hand shops 3 3 8.3 9.5 Other comparison good retailers 3 1 2.8 4.3 Total 38 36 100.0 100.0
Source: Experian Goad Plan 2013 and July 2017, updated by Lichfields June 2019, Goad Plan national average (2018).
7.8 The centre provides all the main Goad comparison categories apart from variety/department/catalogue and china/glass/gifts, however the choice of shops within each category is very limited with five or less in most categories. The centre has a good provision of DIY, hardware and homeware shops, which has improved since 2013.
Service Uses
7.9 Green Lane has a good range of service uses, with all but one category (pubs/bars) represented, as shown in Table 7.3 below. The centre has a relatively low proportion of banks and financial services; and a relatively high proportion of fast food/takeaways, hairdressers/beauty parlours, estate agents and laundrettes/dry cleaners.
7.10 There are no high street banks represented in the centre (following the closure of two), and there are no national restaurant or café operators present in the centre.
7.11 Green Lane has a reasonable provision of non-retail uses, including a place of worship, community centre, educational establishments, dentist and health clubs.
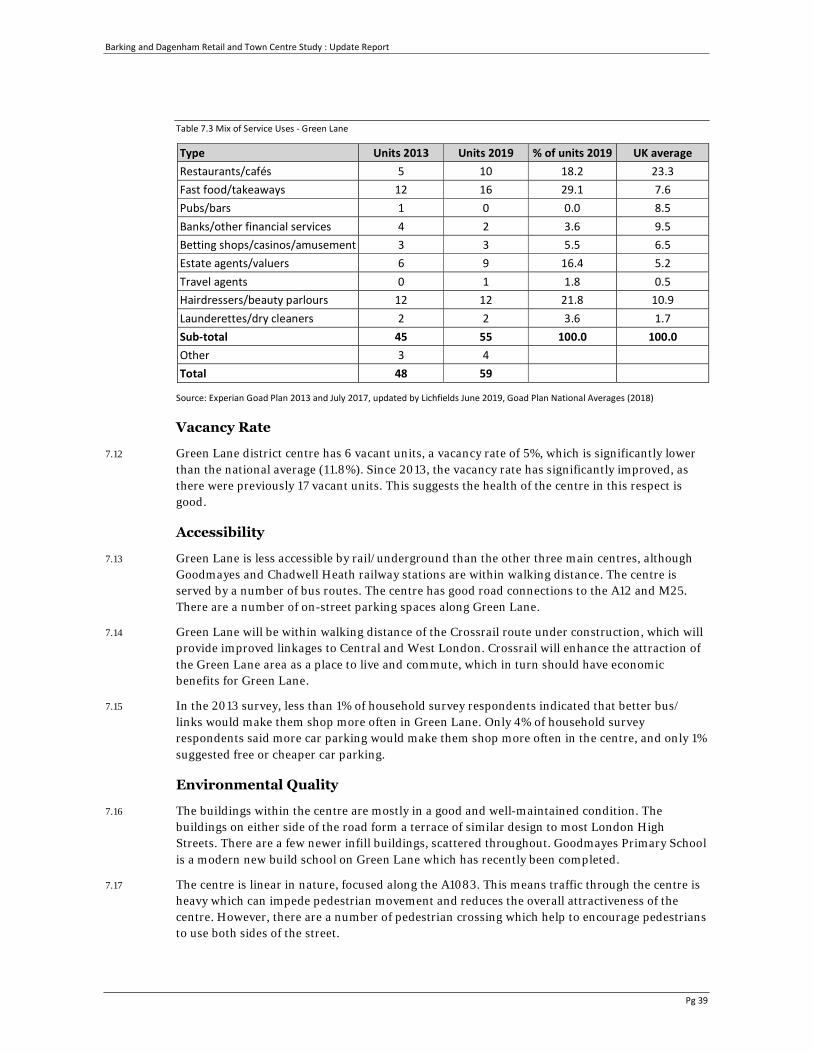
Barking and Dagenham Retail and Town Centre Study : Update Report
Pg 39
Table 7.3 Mix of Service Uses - Green Lane
Type Units 2013 Units 2019 % of units 2019 UK average Restaurants/cafés 5 10 18.2 23.3 Fast food/takeaways 12 16 29.1 7.6 Pubs/bars 1 0 0.0 8.5 Banks/other financial services 4 2 3.6 9.5 Betting shops/casinos/amusement 3 3 5.5 6.5 Estate agents/valuers 6 9 16.4 5.2 Travel agents 0 1 1.8 0.5 Hairdressers/beauty parlours 12 12 21.8 10.9 Launderettes/dry cleaners 2 2 3.6 1.7 Sub-total 45 55 100.0 100.0 Other 3 4 Total 48 59
Source: Experian Goad Plan 2013 and July 2017, updated by Lichfields June 2019, Goad Plan National Averages (2018)
Vacancy Rate
7.12 Green Lane district centre has 6 vacant units, a vacancy rate of 5%, which is significantly lower than the national average (11.8%). Since 2013, the vacancy rate has significantly improved, as there were previously 17 vacant units. This suggests the health of the centre in this respect is good.
Accessibility
7.13 Green Lane is less accessible by rail/underground than the other three main centres, although Goodmayes and Chadwell Heath railway stations are within walking distance. The centre is served by a number of bus routes. The centre has good road connections to the A12 and M25. There are a number of on-street parking spaces along Green Lane.
7.14 Green Lane will be within walking distance of the Crossrail route under construction, which will provide improved linkages to Central and West London. Crossrail will enhance the attraction of the Green Lane area as a place to live and commute, which in turn should have economic benefits for Green Lane.
7.15 In the 2013 survey, less than 1% of household survey respondents indicated that better bus/ links would make them shop more often in Green Lane. Only 4% of household survey respondents said more car parking would make them shop more often in the centre, and only 1% suggested free or cheaper car parking.
Environmental Quality
7.16 The buildings within the centre are mostly in a good and well-maintained condition. The buildings on either side of the road form a terrace of similar design to most London High Streets. There are a few newer infill buildings, scattered throughout. Goodmayes Primary School is a modern new build school on Green Lane which has recently been completed.
7.17 The centre is linear in nature, focused along the A1083. This means traffic through the centre is heavy which can impede pedestrian movement and reduces the overall attractiveness of the centre. However, there are a number of pedestrian crossing which help to encourage pedestrians to use both sides of the street.
Barking and Dagenham Retail and Town Centre Study : Update Report
Pg 40
7.18 There is some street furniture and planting, however the centre would benefit from benches and further planting. The majority of the pavements are wide which aids pedestrian movement. The northern end of Goodmayes Park abuts the centre towards the western end. This helps to improve the environment and reduce the congested feel of the road.
SWOT analysis
Strengths
• Green Lane has a good range of retail and non-retail services which primarily serve the day to day needs of the local catchment area. Its comparison shopping offer is focused on lower order day to day products. Service uses include takeaways and hairdressers.
• The centre is anchored by a Tesco Express. The centre has a good provision of independent specialist food stores including baker's and off license. Food and grocery shopping is a key element of the centre's overall attraction.
• The centre has wide pavements which facilitate pedestrian flows and prevent overcrowding during busier times. The provision of on-street parking outside the shops enables easy access. The centre is next to Goodmayes Park which provides a pleasant area to rest and enjoy.
• The centre has a lower than average shop vacancy rate, suggesting the centre is healthy in this regard.
Weaknesses
• Green Lane's comparison role if relatively limited and lacks national multiple comparison retailers that can draw customers to the centre from a wider area. The provision of community facilities is more limited than other district centres.
• The centre is a linear shopping street that lacks a main focal point and does not provide a natural for pedestrians. The busy road running through the centre creates a noisy, polluted environment and can make it difficult to cross the road, although there are a number of pedestrian crossings.
• The parking provision is limited, with only on-street parking.
• Green Lane is located in close proximity to Goodmayes which provides a range of shops and food and beverage uses. Green Lane also receives competition from the Tesco Superstore located outside the Borough.
Opportunities
• Green Lane is less accessible in terms of public transport when compared with the other district centres but is within walking distance of the Crossrail route. The Crossrail route will enhance the attraction of the area as a place to live and commute, which in turn have economic benefits for Green Lane.
Threats
• The continuation of national trends including the polarisation of investment from multiple operators into the largest centres and multi-channel/home shopping increasing real terms could undermine Green Lane’s position in the shopping hierarchy reducing the number of customers and expenditure.
Barking and Dagenham Retail and Town Centre Study : Update Report
Pg 41
8.0 Other centres and destinations Retail warehouse and leisure parks
8.1 There is one retail warehouse park and one leisure park within the Borough. Abbey Retail Park in Barking has now been demolished and is due to be developed for over 1,000 new homes and some commercial floorspace. Whalebone Retail Park has been redeveloped to provide an Asda food store. There is also a B&M Bargains and McDonald’s in the area.
8.2 The role of the main retail warehouse park and leisure park in the Borough are set out below.
Merrielands Crescent
8.3 Merrielands Crescent is located in the south the Borough on the A1306. This park provides a good mix of comparison and convenience goods retailing, comprising Aldi, Argos, B&M Bargains, Halfords, TK Maxx, Pound Stretcher and Pets at Home. There is also a KFC at the retail park.
8.4 The Aldi store and the nearby Asda attract main and bulk food shopping trips. The Dagenham Leisure Park is nearby, with leisure centre, bingo hall and cinema. Together these uses provide a significant cluster of facilities that have a wide draw. In addition to residents within the Borough, this location's excellent access via the A13 and A1306 enables these facilities to serve residents within Tower Hamlets, Newham and Havering.
8.5 Over the years, the retail park has experienced a shift away from the traditional bulky goods retailers i.e. Homebase, Dreams, Carpetright and Topps Tiles which were previously present at the park. Through this change, the façades of some of the units have been modernised, creating a higher quality shopping environment.
London East Leisure Park (Dagenham Leisure Park)
8.6 London East Leisure Park is located in the south of the Borough to the west of Merrielands Crescent on the A13. The area provides a cluster of leisure and entertainment uses anchored by a Vue multiplex cinema, Mecca bingo hall, tenpin bowling (20 lanes) facility and health and fitness club. These uses are supported by ancillary uses including a drive thru McDonalds and a Travelodge hotel.
8.7 The leisure park is accessed via the A1306 but is poorly integrated with nearby retail stores and public transport nodes in terms of pedestrian access. The leisure park is predominantly a car borne destination.
8.8 Together these uses provide a significant cluster of facilities that have a wide draw. In addition to residents within the Borough, this location's excellent access via the A13 and A1306 enables these facilities to serve residents within Tower Hamlets, Newham, Redbridge and Havering.
Barking and Dagenham Retail and Town Centre Study : Update Report
Pg 42
9.0 Local centres 9.1 The existing provision of local shopping centres within the Borough (neighbourhood centres and
parades) offers a balanced distribution of local facilities serving local communities. These facilities complement the four main centres and have an important role in serving the day-to-day needs in their local areas.
9.2 In addition to the audit of the main centres in LBBD, we have undertaken a local needs index of the neighbourhood centres and parades within the Borough. Our analysis splits the centres into "large" (more than 45 commercial units), "medium" (between 16 and 44 commercial units) or "small" (15 commercial units or less).
9.3 The shopping centres, parades and clusters vary in size, from only five commercial units (Movers Lane) to as large as 273 (Barking town centre). In summary, LBBD contains:
• 10 centres classified as small;
• 18 centres classified as medium; and
• 6 centres classified as large.
9.4 The key focus in auditing local centres has been in assessing the "needs" of local residents and to what extent each is meeting these "needs". There is no clear definition of need, but it is considered that residents could expect to find some, or all of the following shops, services and community uses within easy walking distance of their home:
• food or convenience store suitable for top-up shopping;
• bank;
• post office;
• newsagent;
• off licence;
• chemist;
• takeaway, café or restaurant;
• public house;
• bookmakers;
• laundrette/dry cleaners;
• hairdressers/beauty salon;
• florist;
• estate agents;
• community hall;
• doctor's surgery; and
• library.
9.5 Each local centre has been allocated a score out of 16, based on the number of categories of shops and services listed above (one point per category represented) that are available in the centre. The local needs index is set out in Table 9.1 below.
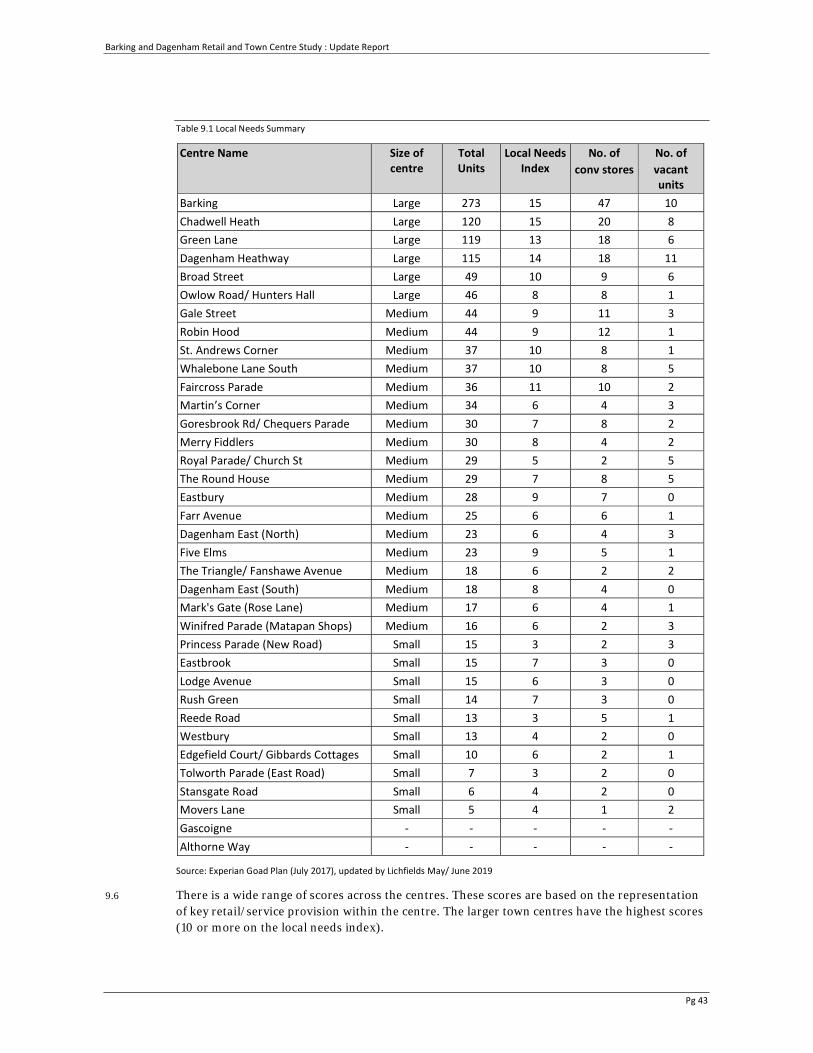
Barking and Dagenham Retail and Town Centre Study : Update Report
Pg 43
Table 9.1 Local Needs Summary
Centre Name Size of centre
Total Units
Local Needs Index
No. of conv stores
No. of vacant units
Barking Large 273 15 47 10 Chadwell Heath Large 120 15 20 8 Green Lane Large 119 13 18 6 Dagenham Heathway Large 115 14 18 11 Broad Street Large 49 10 9 6 Owlow Road/ Hunters Hall Large 46 8 8 1 Gale Street Medium 44 9 11 3 Robin Hood Medium 44 9 12 1 St. Andrews Corner Medium 37 10 8 1 Whalebone Lane South Medium 37 10 8 5 Faircross Parade Medium 36 11 10 2 Martin’s Corner Medium 34 6 4 3 Goresbrook Rd/ Chequers Parade Medium 30 7 8 2 Merry Fiddlers Medium 30 8 4 2 Royal Parade/ Church St Medium 29 5 2 5 The Round House Medium 29 7 8 5 Eastbury Medium 28 9 7 0 Farr Avenue Medium 25 6 6 1 Dagenham East (North) Medium 23 6 4 3 Five Elms Medium 23 9 5 1 The Triangle/ Fanshawe Avenue Medium 18 6 2 2 Dagenham East (South) Medium 18 8 4 0 Mark's Gate (Rose Lane) Medium 17 6 4 1 Winifred Parade (Matapan Shops) Medium 16 6 2 3 Princess Parade (New Road) Small 15 3 2 3 Eastbrook Small 15 7 3 0 Lodge Avenue Small 15 6 3 0 Rush Green Small 14 7 3 0 Reede Road Small 13 3 5 1 Westbury Small 13 4 2 0 Edgefield Court/ Gibbards Cottages Small 10 6 2 1 Tolworth Parade (East Road) Small 7 3 2 0 Stansgate Road Small 6 4 2 0 Movers Lane Small 5 4 1 2 Gascoigne - - - - - Althorne Way - - - - -
Source: Experian Goad Plan (July 2017), updated by Lichfields May/ June 2019
9.6 There is a wide range of scores across the centres. These scores are based on the representation of key retail/service provision within the centre. The larger town centres have the highest scores (10 or more on the local needs index).
Barking and Dagenham Retail and Town Centre Study : Update Report
Pg 44
9.7 In addition to this it is important to consider the ability of these centres in meeting top-up shopping needs. Therefore, the number of convenience stores with the ability to provide local top-up shopping (e.g. a grocer, local corner shop or small supermarket) in the parade is also considered.
9.8 Barking town centre and Chadwell Heath provide all but one of the identified categories of shops and services, scoring 15 on the local needs index, which would suggest the local residents of the area are well served by their local shopping centre. By contrast, Tolworth Parade, Reede Road and Princess Parade only attract a score of 3 on the local needs index, which would suggest a very limited level of local needs being met.
9.9 Since the 2013 report, the existing uses, including the commercial units, at Althorne Way (designated as a neighbourhood centre) have been demolished. The site is currently under construction for residential use. The proposals also include a purpose built unit for the re-provision of the Class A1 pharmacy which was previously present in the centre. No other commercial units are proposed. Gascoigne is also designated as a neighbourhood centre, and at the time of the previous study had 8 units. These units have now been demolished, along with a number of residential units and the site is being redeveloped for residential with commercial units on the ground floor.
9.10 The local needs index is not a precise measure of whether a local shopping centre is meeting the needs of local residents, as there are many other factors to consider:
• the relative size a local parade will dictate the range of shops and services each centre can offer;
• the close proximity of other town centres, local centres and 'standalone' shops means that local need may be met at an alternative location within walking distance and local needs are therefore still being met;
• the quality of the shopping centre or parade, in terms of its environment, type and range of retailers will affect how it is perceived and used by local residents; and
• the relative accessibility of each centre will be an important factor in how local people use the local shops and services. For example, a major traffic route, which is difficult for pedestrians to cross, may influence shopping patterns in the area.
9.11 It is considered that the local needs index provides a useful indicator of whether a local centre or important local parade is meeting some or all the needs of local residents.
9.12 The local centres and their respective scores are plotted on a plan overleaf. A 500 metres and 800 metres radius from each centre is also shown, which represents what should be considered to be a reasonable and maximum walking distance.
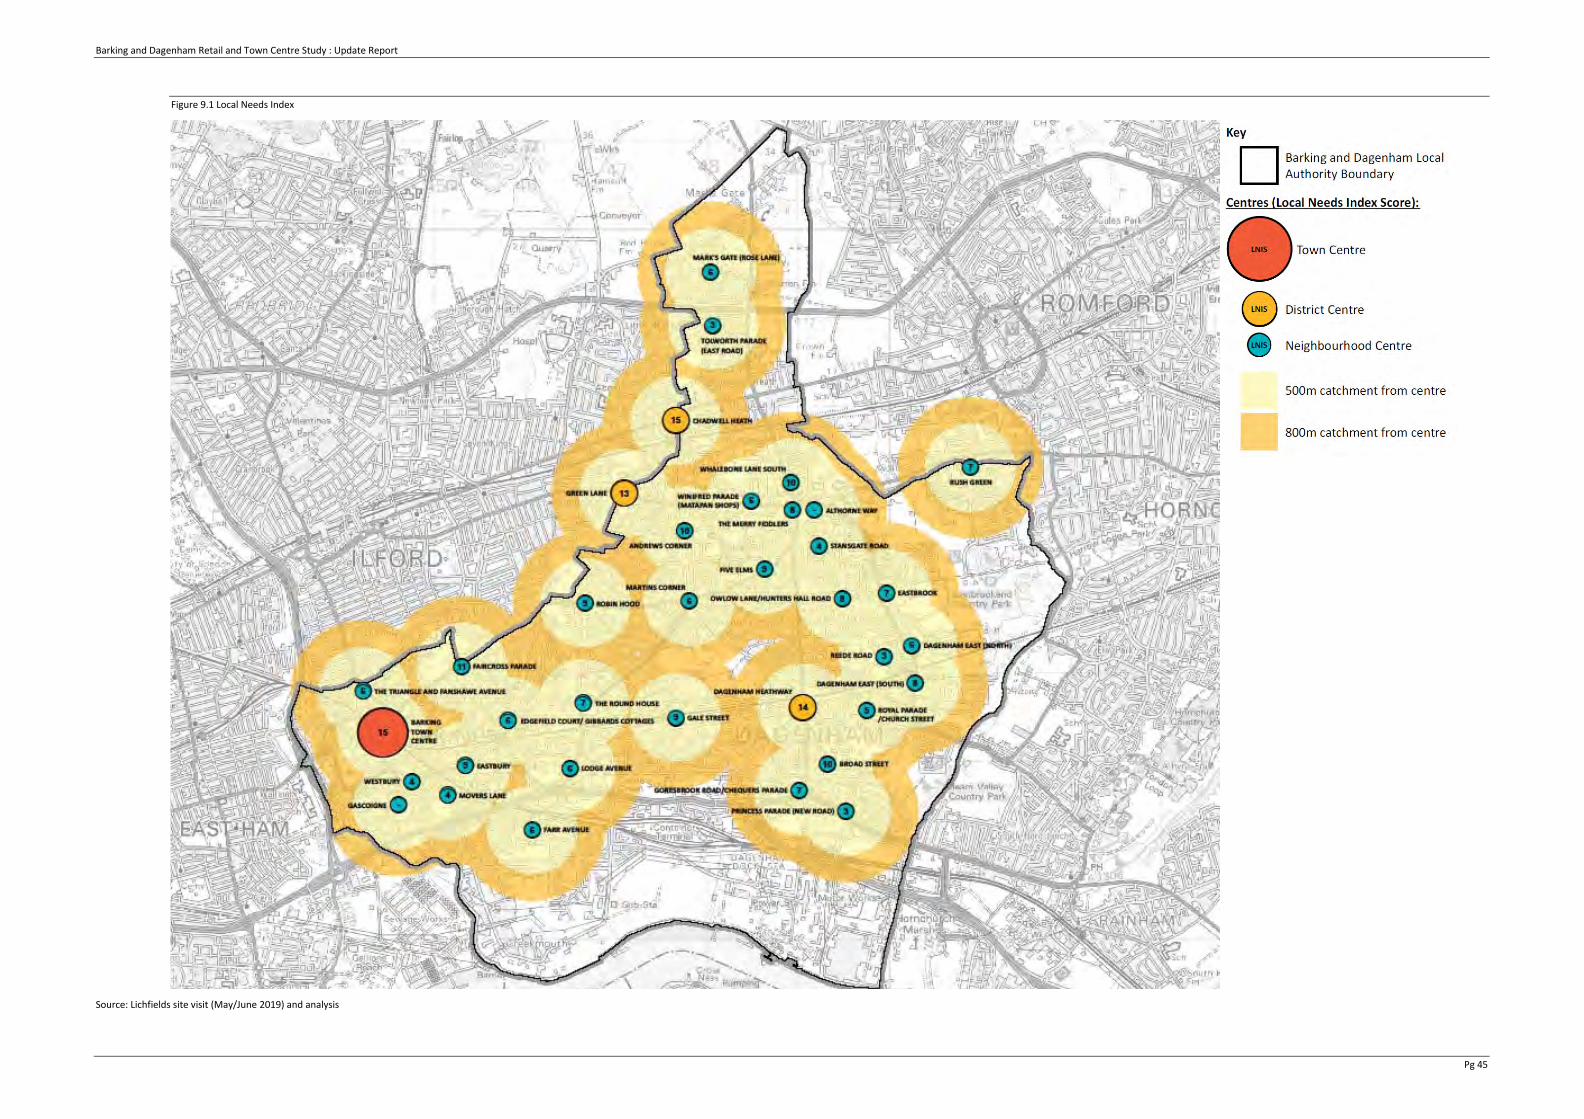
Barking and Dagenham Retail and Town Centre Study : Update Report
Pg 45
Figure 9.1 Local Needs Index
Source: Lichfields site visit (May/June 2019) and analysis
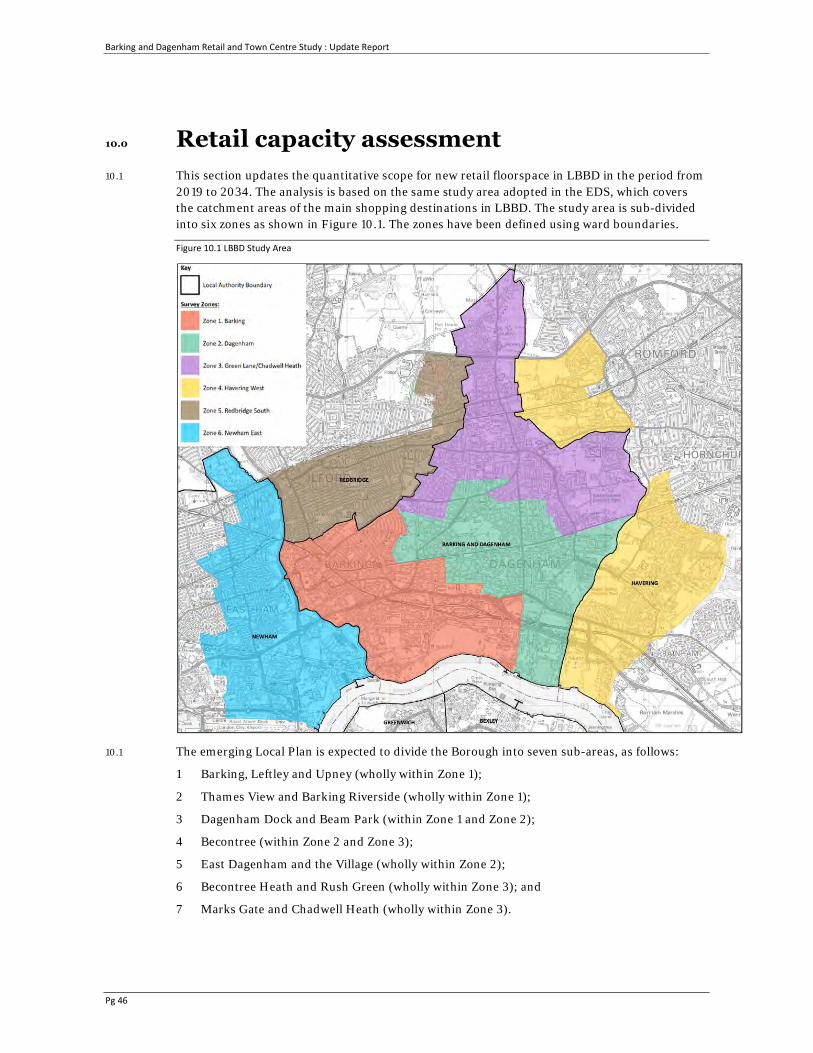
Barking and Dagenham Retail and Town Centre Study : Update Report
Pg 46
10.0 Retail capacity assessment 10.1 This section updates the quantitative scope for new retail floorspace in LBBD in the period from
2019 to 2034. The analysis is based on the same study area adopted in the EDS, which covers the catchment areas of the main shopping destinations in LBBD. The study area is sub-divided into six zones as shown in Figure 10.1. The zones have been defined using ward boundaries.
Figure 10.1 LBBD Study Area
10.1 The emerging Local Plan is expected to divide the Borough into seven sub-areas, as follows:
1 Barking, Leftley and Upney (wholly within Zone 1);
2 Thames View and Barking Riverside (wholly within Zone 1);
3 Dagenham Dock and Beam Park (within Zone 1 and Zone 2);
4 Becontree (within Zone 2 and Zone 3);
5 East Dagenham and the Village (wholly within Zone 2);
6 Becontree Heath and Rush Green (wholly within Zone 3); and
7 Marks Gate and Chadwell Heath (wholly within Zone 3).
Barking and Dagenham Retail and Town Centre Study : Update Report
Pg 47
Population and Expenditure 10.2 The study area population for 2019 and projections to 2034 are set out in Table 1 in Appendix 7.
Population data has been obtained from the GLA 2016 Round of Demographic Projections SHLAA-based ward projections. Population within the study area is expected to increase between 2019 and 2034 by 27.5% (+122,444 people).
10.3 LBBD has a relatively young population (children and young adults) and lower proportions of middle and old aged people. This age structure is reflected within Experian's local expenditure estimates adopted in this study. This age structure is expected to change in the future with growing proportions of both middle aged and old aged people. This trend is expected across London and nationally.
10.4 Table 2 in Appendix 7 sets out the forecast growth in spending per head for convenience goods within each zone in the study area up to 2034. Forecasts of comparison goods spending per capita are shown in Table 2 in Appendix 8.
10.5 As a consequence of growth in population and per capita spending, convenience goods spending within the study area is forecast to increase by 27% from £781.25 million in 2019 to £991.25 million in 2034, as shown in Table 3 (Appendix 7).
10.6 Comparison goods spending is forecast to increase by 96% between 2019 and 2034, increasing from £999.14 million in 2019 to £1,954.65 million in 2034, as shown in Table 3 (Appendix 8).
10.7 It should be noted that comparison goods spending is forecast to increase more than convenience spending as the amount spent on convenience goods does not increase proportionately with disposable income whereas spending on non-food goods does.
10.8 These figures relate to real growth and exclude inflation.
Existing Retail Floorspace 2019 10.9 Existing convenience goods retail sales floorspace within LBBD is 40,709 sq.m net, as set out in
Table 11 in Appendix 7. This floorspace figure excludes comparison sales floorspace within food stores. The comparable floorspace figure in 2013 was 31,375 sq.m net, which suggests convenience goods sales floorspace has increased by 9,334 sq.m net. This increase is primarily due to the new Asda stores in Barking and at Whalebone Lane.
10.10 Comparison goods retail floorspace within LBBD is estimated as 38,184 sq.m net, as shown in Table 11 in Appendix 8. The comparable floorspace figure in 2013 was 37,642 sq.m net, which suggests comparison goods sales floorspace has increased marginally by 542 sq.m net.
Existing Spending Patterns 10.11 The results of the household shopper survey undertaken by NEMS in October 2013 were used to
calculate base year market shares. The 2013 base year market shares for convenience goods shopping are shown in Table 4 in Appendix 7. LBBD’s overall market share of convenience goods expenditure in the study area was 46.5% in 2013.
10.12 The 2013 base year market shares for comparison goods shopping are shown in Table 4 in Appendix 8. LBBD’s overall market share of comparison goods expenditure in the study area was 17.7% in 2013.
10.13 These base year market shares have been used to reassess existing 2019 shopping patterns within the study area. The shares have been adjusted to take account of completed development since 2013 and changes in shopping provision. A summary of the methodology is set out in Appendix 5.
Barking and Dagenham Retail and Town Centre Study : Update Report
Pg 48
Convenience Shopping
10.14 The estimates of 2019 market shares within each study area zone are shown in Table 5 in Appendix 7. The level of convenience goods expenditure attracted to shops/stores in LBBD in 2019 is estimated to be £410.56 million as shown in Table 6 in Appendix 7. This includes estimates of inflow from beyond the study area, applying the market shares, identified in Table 5. The market share of total convenience expenditure generated within the study area that is retained by shops/stores in LBBD (i.e. excluding any inflow to these shops/ stores from beyond the study area) is estimated to be 49.9% (£390.04 million out of £781.25 million available expenditure in the study area). The implementation of commitments and increase in convenience goods sales floorspace since 2013 have increased the market share from 46.5% in 2013 to 49.9% in 2019.
10.15 The total benchmark turnover of the existing convenience sales floorspace within LBBD is £390.77 million (Table 11, Appendix 7), compared with the actual turnover of £410.56 million. These figures suggest that collectively convenience retail facilities in LBBD are trading about 5% above average, with surplus convenience expenditure of £19.79 million. Existing convenience goods floorspace in the Borough is trading healthily.
10.16 In 2013 convenience good floorspace was trading over 18% above benchmark. The implementation of commitments and increase in convenience goods sales floorspace has reduced trading levels to only 5% above.
10.17 Based on Lichfields’ recent experience, food stores within London tend to trade above national average sales densities. Food stores in London tend to be smaller with less circulation space and therefore the sales density per unit of floorspace is likely to be higher.
Comparison Shopping
10.18 The estimated comparison goods expenditure currently attracted by shopping facilities within LBBD is £183.65 million in 2019, as shown in Table 6, Appendix 8. This includes estimates of inflow from beyond the study area. The market share of total comparison goods expenditure generated within the study area that is retained by centres/facilities in LBBD (i.e. excluding any inflow to these shops/stores from beyond the study area) is around 17% (£167.14 million out of £999.14 million available expenditure in the study area).
10.19 The lower retention levels compared with the convenience goods market shares reflects the influence of higher order centres outside LBBD, in particular Romford, intu Lakeside, Beckton, Ilford, Westfield Stratford and Central London.
10.20 Based on this expenditure estimate, the overall average sales density for existing comparison sales floorspace (38,184 sq.m net) is £4,810 per sq.m net. The analysis of existing comparison shopping patterns in 2019 suggests the following average sales density figures for the centres in LBBD shown in Table 10.1. It should be noted that the net floorspace figures exclude comparison retail floorspace within local shops in neighbourhood parades.
Table 10.1 Comparison Average Sales Densities
Area Average sales density 2019 (£ per sq.m net)
Barking (Zone 1) £3,454 Dagenham (Zone 2) £6,114 Chadwell Heath/Green Lane (Zone 3) £5,374LBBD Average £4,180
Barking and Dagenham Retail and Town Centre Study : Update Report
Pg 49
10.21 Based on Lichfields’ recent experience across the country, average sales densities for comparison floorspace can vary significantly. Average sales densities above £6,000 per sq.m net are usually only achieved by relatively large shopping centres. In smaller centres, usually where the property costs are much lower, these high sales densities are not normally achieved. Average sales densities of between £3,000 and £6,000 per sq.m net are generally achieved in medium sized and smaller centres. Overall trading levels are satisfactory in LBBD. An allowance should be made for existing floorspace to increase its sales density in real terms in the future to maintain the vitality and viability of town centres in the Borough.
Capacity for Convenience Goods Floorspace 10.22 Table 7 in Appendix 7 shows the future market shares for convenience floorspace which have
been adjusted to take account of the proposed commitments including development at Barking Riverside.
10.23 It is appropriate and realistic to plan to maintain the Borough's market shares over the study period. Planning for a decline in market share would not be sustainable and would not address the needs of local residents. It should be noted that as the forecast increase in internet spending is accounted for in projecting available expenditure, and this will have the effect of reducing the actual requirement for additional floorspace. Food store commitments in LBBD will change shopping patterns in the future and could increase expenditure retention in the Borough. However, it should be noted that if the commitments do not come forward, this would release expenditure capacity.
10.24 Information has been provided by LBBD on major retail commitments within the Borough. The following have been including in the assessment:
1 Vicarage Fields, Barking – up to 3,500 sq.m uplift in Class A1-A5 floorspace. Assumed 20% convenience good retail;
2 Abbey Road Retail Park, Barking – up to 2,011 sq.m of Class A1-A5 floorspace. Assumed 40% convenience retail;
3 Gascoigne Estate West, Barking – 350 sq.m Class A1-A3/D1 floorspace. Assumed 25% convenience retail;
4 Gascoigne Estate East, Barking – 1,850 sq.m of Class A1-A3/B1 floorspace. Assumed 25% convenience retail;
5 Fresh Wharf Estate, Barking – 952 sq.m of Class A1-A4/D1 floorspace. Assumed 25% convenience retail;
6 Beam Park, Dagenham – 1,670 sq.m Class A1 floorspace. Assumed 50% convenience; and
7 Coopers Arms Public House, Chadwell Heath – 687 sq.m Class A1-A4 floorspace. Assumed 40% convenience retail.
10.25 In addition, the Barking Riverside development is expected to include new district and neighbourhood centres. The development has planning permission for up to 19,700 sq.m gross of Class A1 to A5 floorspace. This will include one large retail unit of between 2,500 to 8,000 sq.m to be occupied by a food store. The precise content of the new centres is unclear, but for this assessment it is assumed that 60% of the overall floorspace (11,820 sq.m) will be occupied by Class A1 retail. This floorspace will have a sales area of around 8,800 sq.m net. A split of 45% convenience goods sales and 55% comparison sales has been adopted.
10.26 Taking these commitments into account, available convenience goods expenditure has been projected forward to 2024, 2029 and 2034, and is summarised in Table 12 in Appendix 7. Convenience expenditure available to facilities within the Borough is expected to increase from

Barking and Dagenham Retail and Town Centre Study : Update Report
Pg 50
£410.56 million in 2019 to £539.38 million in 2034. A growth rate in turnover efficiency of 0.7% from 2019 to 2020; 0.4% in 2020 to 2021; 0.2% per annum between 2021 and 2025; and 0% beyond 2025 has been adopted, as recommended by Experian (Retail Planner Briefing Note 16 – December 2018).
10.27 Table 12 subtracts the benchmark turnover of existing and committed floorspace from available expenditure to calculate the amount of surplus expenditure that may be available for further new development. Within the Borough, there is a projected convenience goods expenditure deficit in 2024 of -£30.31 million, due to the implementation of commitments. Continued expenditure growth creates a small surplus of +£11.72 million in 2029, increasing to a surplus of £64.47 million in 2034.
10.28 The surplus expenditure projections have been converted into potential new floorspace estimates in Table 13 in Appendix 7 and summarised in Table 10.2 below. Surplus expenditure is converted into floorspace estimates based on an assumed average sales density figure of £12,000 per sq.m, based on a generic average turnover density for main food supermarket operators.
Table 10.2 Convenience Goods Floorspace Capacity (sq.m gross)
Area 2024 2029 2034 Barking (Zone 1 - West) -1,767 256 3,549 Dagenham (Zone 2) 1,421 2,908 3,931Chadwell Heath (Zone 3) -531 -332 -136 Green Lane (Zone 3) -2,341 -1,740 -1,049 Barking Riverside (Zone 1 – East) -309 271 1,191 Total -3,526 1,361 7,486
Source: Table 13, Appendix 7
10.29 The surplus of available expenditure up to 2029 indicates that there is a medium-term requirement for additional convenience goods floorspace in the Borough of 1,361 sq.m gross at 2029, increasing to 7,486 sq.m gross by 2034.
10.30 The 2014 EDS suggested a similar projection of 6,297 sq.m gross by 2032.
Capacity for Comparison Goods Floorspace 10.31 The household survey suggests that the Borough's retention of comparison goods expenditure is
significantly lower than for convenience goods. The lower level of comparison expenditure retention is due to the strength of competing comparison goods facilities in neighbouring authorities, in particular Romford, intu Lakeside, Beckton, Ilford, Westfield Stratford and Central London. Residents will generally shop around more for comparison goods and travel further to visit large shopping destinations.
10.32 Table 7 in Appendix 8 shows the future market shares for comparison floorspace allowing for commitments.
10.33 Future improvements to comparison retail provision within the Borough could help to claw back some additional expenditure leakage from the study area. However major developments in neighbouring authorities will limit the ability of shopping facilities in the Borough to increase their market share of expenditure. Retail development will be necessary in LBBD in order to maintain existing market share in the future. An appropriate strategy for LBBD should be to seek to maintain existing 2019 market shares for the existing centres in the face of increasing future competition, whilst maintaining the vitality and viability of centres.
Barking and Dagenham Retail and Town Centre Study : Update Report
Pg 51
10.34 The following commitments have been included in this assessment:
1 Vicarage Fields, Barking – up to 3,500 sq.m uplift in Class A1-A5 floorspace. Assumed 50% comparison retail;
2 Abbey Road Retail Park, Barking – up to 2,011 sq.m of Class A1-A5 floorspace. Assumed 40% comparison retail;
3 Gascoigne Estate West, Barking – 350 sq.m Class A1-A3/D1 floorspace. Assumed 25% comparison retail;
4 Gascoigne Estate East, Barking – 1,850 sq.m of Class A1-A3/B1 floorspace. Assumed 25% comparison retail;
5 Former Abbey Leisure Centre, Barking – 158 sq.m of commercial floorspace. Assumed 100% comparison retail;
6 Fresh Wharf Estate, Barking – 952 sq.m of Class A1-A4/D1 floorspace. Assumed 25% comparison retail;
7 Merrielands Development Site, Dagenham – 4,097 sq.m retail warehouse floorspace. Assumed 100% comparison retail;
8 Beam Park, Dagenham – 1,670 sq.m Class A1 floorspace. Assumed 50% comparison retail; and
9 Coopers Arms Public House, Chadwell Heath – 687 sq.m Class A1-A4 floorspace. Assumed 40% comparison.
10.35 In addition, the Barking Riverside development is expected to include 11,820 sq.m gross occupied by Class A1 retail. This floorspace will have a sales area of around 8,800 sq.m net. A split of 45% convenience goods sales and 55% comparison sales has been adopted.
10.36 In total, these commitments have a sales floorspace of 11,371 sq.m bet and an expected turnover of £64.64 million at 2024, assuming a projected average sales density of £5,685 per sq.m net.
10.37 Taking these commitments into account, available comparison goods expenditure has been projected forward to 2024, 2029 and 2034, and is summarised in Table 12. Comparison expenditure available to facilities within the Borough is expected to increase from £183.65 million in 2019 to £402.15 million in 2034.
10.38 For this assessment, existing comparison goods floorspace is estimated to be trading at equilibrium in 2019 (i.e. satisfactory levels). Table 12, Appendix 8 assumes that the turnover of comparison floorspace will increase in real terms in the future. A growth rate of 2.1% in 2019 to 2020; 2.5% in 2020 to 2021; 2.8% per annum between 2021 and 2025; and 2.3% beyond 2025 has been adopted, and these growth rates are required to maintain the health and viability of town centres, as recommended by Experian (Retail Planner Briefing Note 16 – December 2018). Trends indicate that comparison retailers historically will achieve some growth in trading efficiency. This is a function of spend growing at faster rates than new floorspace provision and retailers' ability to absorb real increases in their costs by increasing their turnover to floorspace ratio.
10.39 Table 12 in Appendix 8 subtracts the turnover of existing floorspace from available expenditure to calculate the amount of surplus expenditure that may be available for new development. Within the Borough, there is an expenditure deficit up to 2024, if commitments are implemented. By 2029, there will be a small expenditure surplus of £1.87 million, and by 2034 future expenditure growth generates an expenditure surplus of £60.11 million.
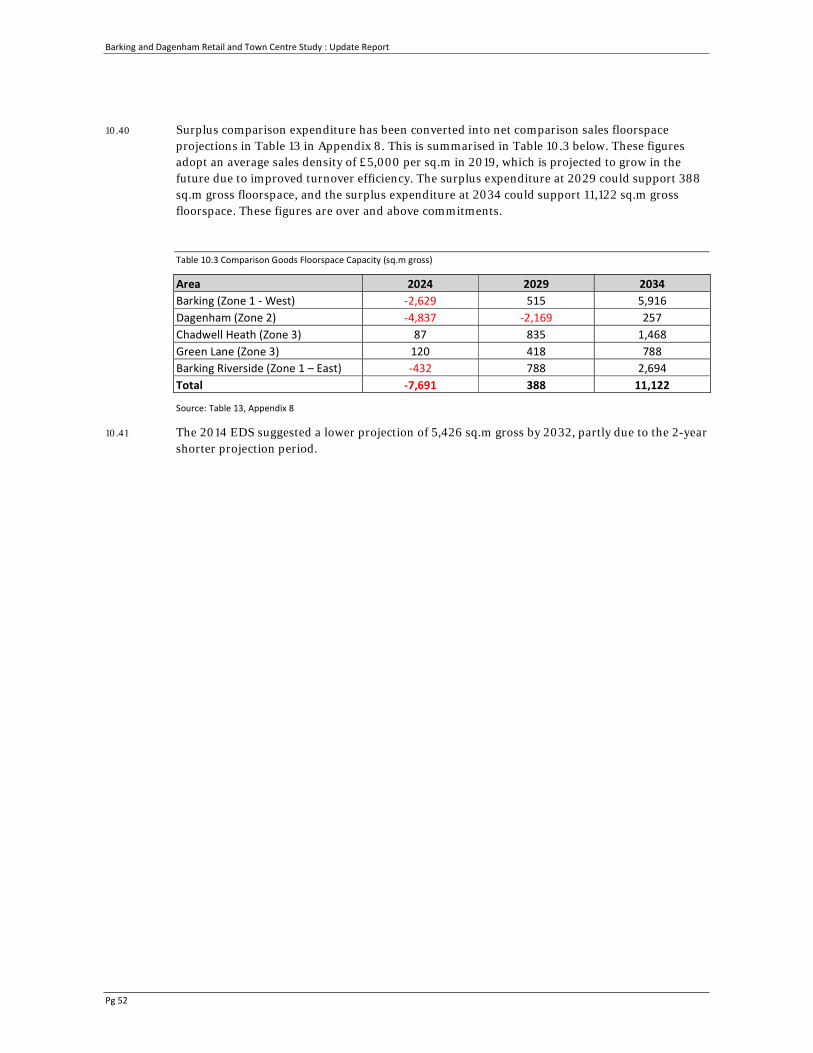
Barking and Dagenham Retail and Town Centre Study : Update Report
Pg 52
10.40 Surplus comparison expenditure has been converted into net comparison sales floorspace projections in Table 13 in Appendix 8. This is summarised in Table 10.3 below. These figures adopt an average sales density of £5,000 per sq.m in 2019, which is projected to grow in the future due to improved turnover efficiency. The surplus expenditure at 2029 could support 388 sq.m gross floorspace, and the surplus expenditure at 2034 could support 11,122 sq.m gross floorspace. These figures are over and above commitments.
Table 10.3 Comparison Goods Floorspace Capacity (sq.m gross)
Area 2024 2029 2034Barking (Zone 1 - West) -2,629 515 5,916 Dagenham (Zone 2) -4,837 -2,169 257 Chadwell Heath (Zone 3) 87 835 1,468 Green Lane (Zone 3) 120 418 788Barking Riverside (Zone 1 – East) -432 788 2,694 Total -7,691 388 11,122
Source: Table 13, Appendix 8
10.41 The 2014 EDS suggested a lower projection of 5,426 sq.m gross by 2032, partly due to the 2-year shorter projection period.
Barking and Dagenham Retail and Town Centre Study : Update Report
Pg 53
11.0 Other Town Centre Uses 11.1 This section assesses the need for other main town centre uses including eating and drinking
establishments (Class A3, A4 and A5) and commercial leisure i.e. cinema/multiplex, tenpin bowling, bingo, theatres, nightclubs and private health and fitness clubs.
Food and beverage 11.2 The food and beverage sector continues to be fast moving and creative, with a steady flow of new
concepts emerging, although growth has slowed in recent years. Within this sector there was a significant increase in the number of national multiple chains which have sought to increase their geographical coverage. Recently some chains have experienced difficulties resulting in closures, which shows operators may have over-stretched.
11.3 These types of food and drink operators (Class A3 and A4) i.e. restaurants, bars and pubs have supported other major leisure uses, in particular cinema developments. Within town centres, the demand has increased, including a significant expansion in the number of coffee shops, such as Starbucks, Costa Coffee and Café Nero. National branded pub/restaurant chains have invested heavily and not exclusively in larger centres. Themed restaurants have also expanded rapidly.
11.4 The key categories for the food and beverage offer are:
• Impulse: characterised by their produce range that is typically highly visual and hand-held so that it can be eaten “on the go”;
• Speed eating fast food: food that can be purchased and consumed quickly, therefore price is low and ambience is less important. This sector is dominated by traditional high volume fast food offers such as burgers and fried chicken;
• Refuel and relax: a drink, snack and a short break in a pleasant environment rather than focusing on eating a main meal; and
• Casual dining/leisure dining: incorporating several food styles, types and ethnic origins. The ambience and environment of casual dining is as important as the food, drink and service provided. The style is informal but is normally table service.
11.5 National information available from Experian Goad Plans indicates that the proportion of non-retail uses within town centres has increased over the last decade as shown in Table 11.1. The proportion of Class A1 retail uses in Goad town centres has decreased by around 25% between 2000 and 2018, whilst Class A3/A5 food and drink uses have significantly increased in proportional terms, despite the increase in shop vacancy rate.
11.6 Growth in Class A3 to A5 uses within town centres is likely to continue in the future, as town centres seek to broaden their attraction in response to the increase in multi-channel shopping.
11.7 At present, the proportion of Class A3 uses within Chadwell Heath is around the national average (9.2%). The proportion is slightly higher than the national average in Barking (11.4%) and lower than the national average in Green Lane and Dagenham Heathway (8.4% and 1.7% retrospectively). The proportion of Class A4 uses in each centre is below the national average and the proportion of Class A5 uses is higher than the national average in all centres except Barking, where it is comparable with the national average. The qualitative priority for future Class A3 uses within the main centres is Class A3 restaurant rather than Class A5 takeaway uses.

Barking and Dagenham Retail and Town Centre Study : Update Report
Pg 54
Table 11.1 GB Goad Plan Town Centres Use Class Mix
Type of Unit % change 2000 - 2018
Proportion of Total Number of Units (%) 2000 2005 2009 2012 2018
Class A1 (Retail) -25.4 59.1 56.4 54.0 49.5 44.1Class A1/A2 (Services) +46.5 18.5 19.9 20.1 20.8 27.1 Class A3/A5* +47.3 11.2 13.7 14.5 16.1 16.5 Vacant/under Const. +9.8 11.2 10.1 11.4 13.7 12.3 Total - 100.0 100.0 100.0 100.0 100.0
Source: Experian Goad Centre Reports *excludes Bars/Public Houses (A4)
11.8 Within the other neighbourhood centres in the Borough, there are 160 Class A3, A4 and A5 uses, of which 63% are Class A5 takeaways. The Borough has a high representation of takeaways and cafés, but a relatively poor provision of restaurants and bars. This provision has however increased by 32 units, from 128 Class A3-A5 units in 2013.
11.9 In total, there are 274 identified Class A3, A4 and A5 uses within the Borough. In 2013, there were 233 identified Class A3, A4 and A5 uses within the Borough. The Barking Riverside development will include new district and neighbourhood centres. The development has planning permission for up to 19,700 sq.m gross of Class A1 to A5 floorspace. This study assumes that 20% of the overall floorspace (3,900 sq.m) could be occupied by Class A3, A4 and A5 uses.
Food and Beverage Expenditure
11.10 Experian's latest 2017 local expenditure figures have been adopted. Food and beverage expenditure per capita projections are shown in Table 2 in Appendix 9.
11.11 Total food and beverage expenditure is shown in Table 3 in Appendix 9, based on population figures in Table 1 and average expenditure in Table 2. Food and drink expenditure within the study area as a whole is expected to increase from £373.85 million in 2019 to about £570.31 million in 2034, an increase of about 53% i.e. half of this is due to growth in population and the other half due to national forecast growth in expenditure per person.
Base Year Food and Beverage Patterns
11.12 Existing food and beverage expenditure patterns have been modelled based on the household survey results within the study area zones. Base year (2019) penetration rates are shown in Table 4 in Appendix 9 and expenditure patterns are shown in Table 5.
11.13 LBBD's market share of all expenditure within the study area (excluding expenditure inflow) is about 22%. Allowing for expenditure inflow, LBBD existing facilities attract £88.2 million. There are 274 food and beverage outlets in the Borough as shown in Table 10 in Appendix 9. The £88.2 million turnover estimate is approximately £322,000 per outlet. Large good quality restaurant/bars would be expected to achieve a turnover of between £0.5 million to £1 million. Food and beverage facilities in LBBD appear to be trading satisfactorily.
Projected Food and Beverage Patterns
11.14 It is appropriate and realistic to plan to maintain the Borough's market shares over the study period. Table 7 in Appendix 8 shows the future market shares for comparison floorspace allowing for commitments. Available food and beverage expenditure has been projected forward to 2024, 2029 and 2034, and is summarised in Table 12, Appendix 9.
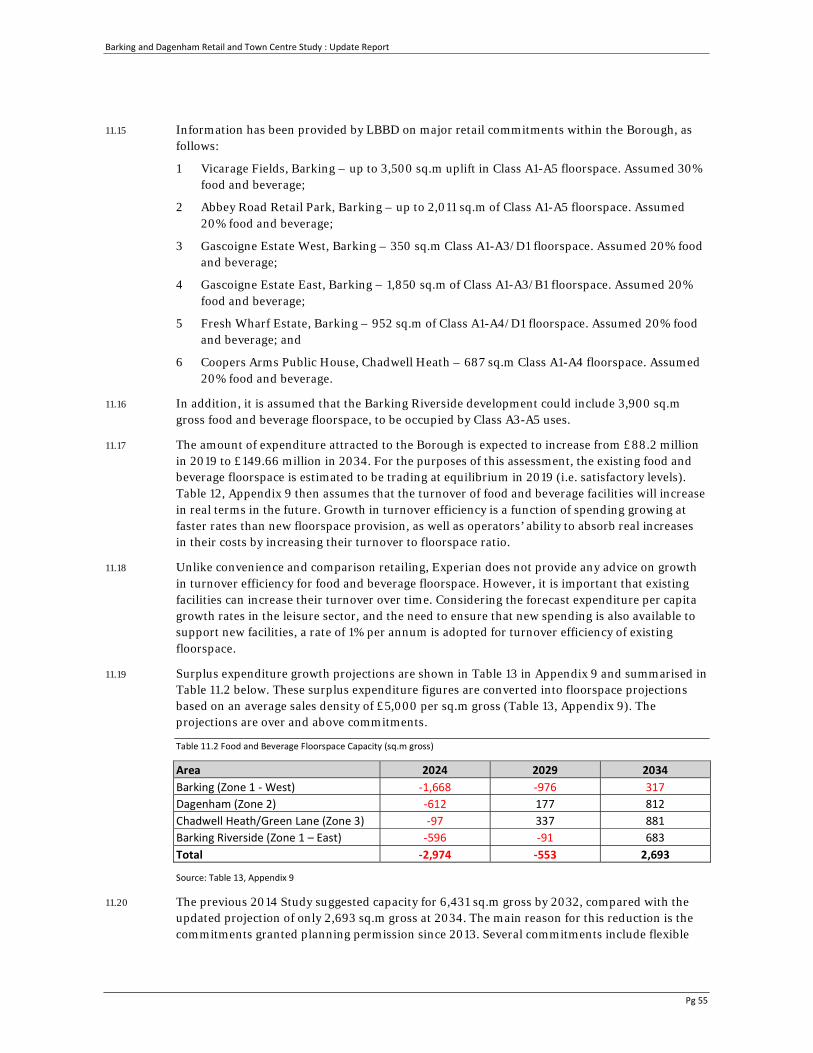
Barking and Dagenham Retail and Town Centre Study : Update Report
Pg 55
11.15 Information has been provided by LBBD on major retail commitments within the Borough, as follows:
1 Vicarage Fields, Barking – up to 3,500 sq.m uplift in Class A1-A5 floorspace. Assumed 30% food and beverage;
2 Abbey Road Retail Park, Barking – up to 2,011 sq.m of Class A1-A5 floorspace. Assumed 20% food and beverage;
3 Gascoigne Estate West, Barking – 350 sq.m Class A1-A3/D1 floorspace. Assumed 20% food and beverage;
4 Gascoigne Estate East, Barking – 1,850 sq.m of Class A1-A3/B1 floorspace. Assumed 20% food and beverage;
5 Fresh Wharf Estate, Barking – 952 sq.m of Class A1-A4/D1 floorspace. Assumed 20% food and beverage; and
6 Coopers Arms Public House, Chadwell Heath – 687 sq.m Class A1-A4 floorspace. Assumed 20% food and beverage.
11.16 In addition, it is assumed that the Barking Riverside development could include 3,900 sq.m gross food and beverage floorspace, to be occupied by Class A3-A5 uses.
11.17 The amount of expenditure attracted to the Borough is expected to increase from £88.2 million in 2019 to £149.66 million in 2034. For the purposes of this assessment, the existing food and beverage floorspace is estimated to be trading at equilibrium in 2019 (i.e. satisfactory levels). Table 12, Appendix 9 then assumes that the turnover of food and beverage facilities will increase in real terms in the future. Growth in turnover efficiency is a function of spending growing at faster rates than new floorspace provision, as well as operators’ ability to absorb real increases in their costs by increasing their turnover to floorspace ratio.
11.18 Unlike convenience and comparison retailing, Experian does not provide any advice on growth in turnover efficiency for food and beverage floorspace. However, it is important that existing facilities can increase their turnover over time. Considering the forecast expenditure per capita growth rates in the leisure sector, and the need to ensure that new spending is also available to support new facilities, a rate of 1% per annum is adopted for turnover efficiency of existing floorspace.
11.19 Surplus expenditure growth projections are shown in Table 13 in Appendix 9 and summarised in Table 11.2 below. These surplus expenditure figures are converted into floorspace projections based on an average sales density of £5,000 per sq.m gross (Table 13, Appendix 9). The projections are over and above commitments.
Table 11.2 Food and Beverage Floorspace Capacity (sq.m gross)
Area 2024 2029 2034 Barking (Zone 1 - West) -1,668 -976 317Dagenham (Zone 2) -612 177 812 Chadwell Heath/Green Lane (Zone 3) -97 337 881 Barking Riverside (Zone 1 – East) -596 -91 683 Total -2,974 -553 2,693
Source: Table 13, Appendix 9
11.20 The previous 2014 Study suggested capacity for 6,431 sq.m gross by 2032, compared with the updated projection of only 2,693 sq.m gross at 2034. The main reason for this reduction is the commitments granted planning permission since 2013. Several commitments include flexible
Barking and Dagenham Retail and Town Centre Study : Update Report
Pg 56
commercial uses, which could include Class A3-A5 units. This limits the capacity for further Class A3-A5 uses, assuming these commitments are implemented.
Other Class A1 and A2 Service Uses 11.21 The retail, food and drink floorspace projections do not include non-retail Class A1 services or
Class A2 services. Based on the Goad national average, one would expect around 25% of shop premises to be occupied by these uses within centres.
11.22 The proportion of Class A1 and Class A2 services in the four main centres is higher than the national average (25.8%). Chadwell Heath has the highest provision (40%), followed by Dagenham Heathway (36%), Barking (29%) and Green Lane (28%). The provision in all centres has increased since 2013.
11.23 Whilst Class A2 uses no longer include money lenders, pawnbrokers and bookmakers (as these are now Sui Generis), they have been included within Class A2 for the purposes of this assessment. The qualitative audit of centres indicates there is a high representation of these uses within LBBD, e.g. there are 20 betting shops within the four centres. The provision of additional space to accommodate further uses of this kind is not a priority. Given the current high provision of Class A1/A2 service uses in the Borough, including local centres, new town centre development within the Borough should provide less than 15% of floorspace for these uses. A figure of 5% may be more appropriate.
Commercial Leisure 11.24 Residents in LBBD have relatively good access to range of commercial leisure and
entertainment, including facilities in neighbouring Boroughs (good access by car) and Central London (good access by public transport). Most of the key sectors are represented. Major leisure facilities such as multiplex cinemas, ten-pin bowling centres, ice rinks and family entertainment centres require a large catchment population, and often benefit from clustering together on leisure parks. They are usually less accessible by public transport.
11.25 LBBD has a large catchment population. This catchment population has good access to major leisure facilities in Newham, Lakeside, Stratford, Docklands and Central London. The proximity of major leisure facilities in these surrounding local authorities may limit the potential for major commercial leisure facilities within LBBD.
11.26 The main concentration of commercial leisure uses is at Dagenham Leisure Park, which includes Vue multiplex cinema, bingo hall, ten-pin bowling, health and fitness suite, McDonald’s and a budget hotel. This park serves LBBD and also neighbouring Borough's due to high levels of car access via the A13.
Cinemas
11.27 Cinema admissions in the UK declined steadily during the 1950s, 1960s and 1970s, a period when the ownership of televisions increased significantly. Cinema admissions continued to decline in the early 1980s but increased steadily after 1984 up to 2002. There was a peak in cinema admissions in 2002 at 175.9 million. Total admissions in 2016 were 168.3 million. In 2017, the figure rose slightly to 170.6 million (Source: British Film Institute). Cinema trips have plateaued since 2002, despite population growth of 9.6% during this period (59.4 million to 65.1 million). The national average visitation rate is 2.7 trips per person per annum.
11.28 The Cinema Advertising Association identities 771 cinema facilities with 4,115 screens. Lichfields’ national CINeSCOPE model identifies approximately 800,000 cinema seats in the UK. The CINeSCOPE model assesses the provision of cinema screens/seats against projected
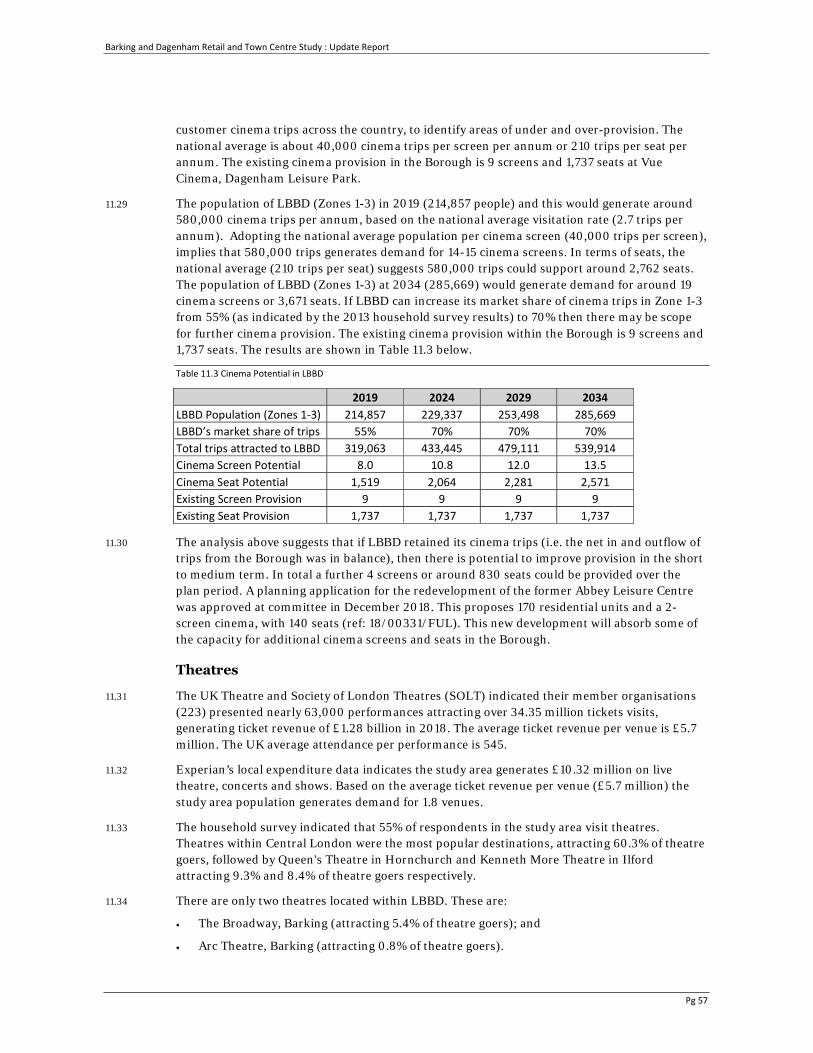
Barking and Dagenham Retail and Town Centre Study : Update Report
Pg 57
customer cinema trips across the country, to identify areas of under and over-provision. The national average is about 40,000 cinema trips per screen per annum or 210 trips per seat per annum. The existing cinema provision in the Borough is 9 screens and 1,737 seats at Vue Cinema, Dagenham Leisure Park.
11.29 The population of LBBD (Zones 1-3) in 2019 (214,857 people) and this would generate around 580,000 cinema trips per annum, based on the national average visitation rate (2.7 trips per annum). Adopting the national average population per cinema screen (40,000 trips per screen), implies that 580,000 trips generates demand for 14-15 cinema screens. In terms of seats, the national average (210 trips per seat) suggests 580,000 trips could support around 2,762 seats. The population of LBBD (Zones 1-3) at 2034 (285,669) would generate demand for around 19 cinema screens or 3,671 seats. If LBBD can increase its market share of cinema trips in Zone 1-3 from 55% (as indicated by the 2013 household survey results) to 70% then there may be scope for further cinema provision. The existing cinema provision within the Borough is 9 screens and 1,737 seats. The results are shown in Table 11.3 below.
Table 11.3 Cinema Potential in LBBD
2019 2024 2029 2034 LBBD Population (Zones 1-3) 214,857 229,337 253,498 285,669 LBBD’s market share of trips 55% 70% 70% 70% Total trips attracted to LBBD 319,063 433,445 479,111 539,914 Cinema Screen Potential 8.0 10.8 12.0 13.5 Cinema Seat Potential 1,519 2,064 2,281 2,571 Existing Screen Provision 9 9 9 9 Existing Seat Provision 1,737 1,737 1,737 1,737
11.30 The analysis above suggests that if LBBD retained its cinema trips (i.e. the net in and outflow of trips from the Borough was in balance), then there is potential to improve provision in the short to medium term. In total a further 4 screens or around 830 seats could be provided over the plan period. A planning application for the redevelopment of the former Abbey Leisure Centre was approved at committee in December 2018. This proposes 170 residential units and a 2-screen cinema, with 140 seats (ref: 18/00331/FUL). This new development will absorb some of the capacity for additional cinema screens and seats in the Borough.
Theatres
11.31 The UK Theatre and Society of London Theatres (SOLT) indicated their member organisations (223) presented nearly 63,000 performances attracting over 34.35 million tickets visits, generating ticket revenue of £1.28 billion in 2018. The average ticket revenue per venue is £5.7 million. The UK average attendance per performance is 545.
11.32 Experian’s local expenditure data indicates the study area generates £10.32 million on live theatre, concerts and shows. Based on the average ticket revenue per venue (£5.7 million) the study area population generates demand for 1.8 venues.
11.33 The household survey indicated that 55% of respondents in the study area visit theatres. Theatres within Central London were the most popular destinations, attracting 60.3% of theatre goers, followed by Queen's Theatre in Hornchurch and Kenneth More Theatre in Ilford attracting 9.3% and 8.4% of theatre goers respectively.
11.34 There are only two theatres located within LBBD. These are:
• The Broadway, Barking (attracting 5.4% of theatre goers); and
• Arc Theatre, Barking (attracting 0.8% of theatre goers).
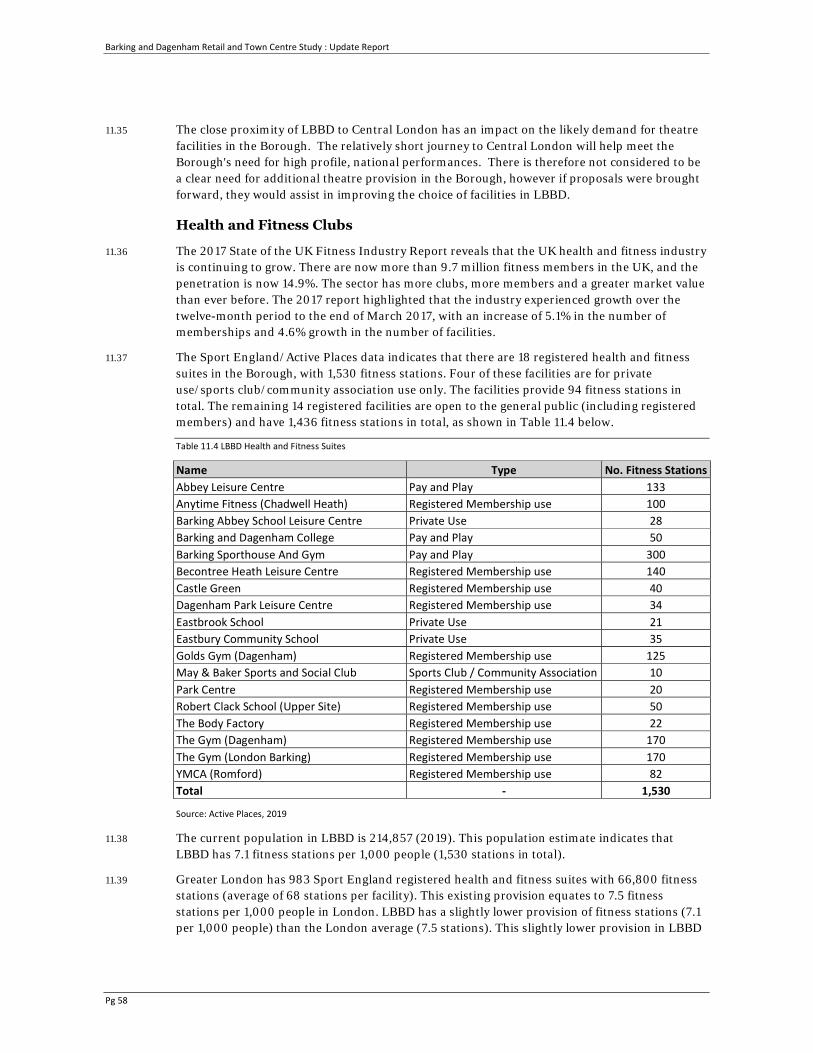
Barking and Dagenham Retail and Town Centre Study : Update Report
Pg 58
11.35 The close proximity of LBBD to Central London has an impact on the likely demand for theatre facilities in the Borough. The relatively short journey to Central London will help meet the Borough's need for high profile, national performances. There is therefore not considered to be a clear need for additional theatre provision in the Borough, however if proposals were brought forward, they would assist in improving the choice of facilities in LBBD.
Health and Fitness Clubs
11.36 The 2017 State of the UK Fitness Industry Report reveals that the UK health and fitness industry is continuing to grow. There are now more than 9.7 million fitness members in the UK, and the penetration is now 14.9%. The sector has more clubs, more members and a greater market value than ever before. The 2017 report highlighted that the industry experienced growth over the twelve-month period to the end of March 2017, with an increase of 5.1% in the number of memberships and 4.6% growth in the number of facilities.
11.37 The Sport England/Active Places data indicates that there are 18 registered health and fitness suites in the Borough, with 1,530 fitness stations. Four of these facilities are for private use/sports club/community association use only. The facilities provide 94 fitness stations in total. The remaining 14 registered facilities are open to the general public (including registered members) and have 1,436 fitness stations in total, as shown in Table 11.4 below.
Table 11.4 LBBD Health and Fitness Suites
Name Type No. Fitness StationsAbbey Leisure Centre Pay and Play 133Anytime Fitness (Chadwell Heath) Registered Membership use 100 Barking Abbey School Leisure Centre Private Use 28 Barking and Dagenham College Pay and Play 50 Barking Sporthouse And Gym Pay and Play 300Becontree Heath Leisure Centre Registered Membership use 140 Castle Green Registered Membership use 40 Dagenham Park Leisure Centre Registered Membership use 34 Eastbrook School Private Use 21Eastbury Community School Private Use 35 Golds Gym (Dagenham) Registered Membership use 125 May & Baker Sports and Social Club Sports Club / Community Association 10 Park Centre Registered Membership use 20Robert Clack School (Upper Site) Registered Membership use 50 The Body Factory Registered Membership use 22 The Gym (Dagenham) Registered Membership use 170 The Gym (London Barking) Registered Membership use 170YMCA (Romford) Registered Membership use 82 Total - 1,530
Source: Active Places, 2019
11.38 The current population in LBBD is 214,857 (2019). This population estimate indicates that LBBD has 7.1 fitness stations per 1,000 people (1,530 stations in total).
11.39 Greater London has 983 Sport England registered health and fitness suites with 66,800 fitness stations (average of 68 stations per facility). This existing provision equates to 7.5 fitness stations per 1,000 people in London. LBBD has a slightly lower provision of fitness stations (7.1 per 1,000 people) than the London average (7.5 stations). This slightly lower provision in LBBD
Barking and Dagenham Retail and Town Centre Study : Update Report
Pg 59
may be due to the high level of net out commuting and work-related linked trips to facilities in Central London.
11.40 Growth in population between 2019 and 2034 in Zones 1-3 is +70,800 people. This additional population could support 530 fitness stations based on the London average or 500 fitness stations based on the LBBD average. There could be scope for at least 10 medium sized (50 stations) additional health and fitness facilities in the Borough by 2034.
Tenpin Bowling
11.41 There is one tenpin bowling facility in LBBD – Hollywood Bowl at Dagenham Leisure Park (20 lanes). Other nearby bowling destinations include Namco Funscape Romford, Rollerbowl, Romford, All Star Lanes Stratford, Hollywood Bowl at the 02, The City Pavilion Romford, and facilities in Central London.
11.42 The household survey results suggest that 27.4% of households in the study area visit tenpin bowling facilities, and of those who visit bowling facilities they mainly go to Dagenham Bowling (now Hollywood Bowl) (36%), followed by Namco Romford (15%) and The City Pavilion, Romford (14%).
11.43 The population of LBBD (214,857 in 2019) could theoretically support 17-18 lanes, based on one lane per 12,000 people (national average). Population growth within LBBD (70,812 between 2019 and 2034), could support a further 5-6 lanes by 2034.
11.44 The close proximity of LBBD to other tenpin bowling facilities has an impact on the likely demand for additional facilities in the Borough. There is therefore not considered to be a clear need for additional tenpin bowling provision in the Borough, however if proposals were brought forward, they would assist in improving the choice of facilities in LBBD.
Bingo, Games of Change and Gambling
11.45 Gala and Mecca are the main bingo operators, controlling over half of the UK market. Marketing of the bingo sector has been more proactive in recent years and Gala and Mecca have invested in premises, moving out of dated premises (i.e. converted cinemas) into purpose-built units. Bingo clubs have become increasingly sophisticated and have actively sought to attract all age groups. The bingo sector usually prefers central locations that are accessible by public transport and by foot.
11.46 The Gambling Commission indicates there are 650 bingo facilities in Great Britain (2018) and 152 casinos. This equates to approximately one bingo facility per 100,000 people, and one casino per 425,000 people. The adult (over 18) population in the LBBD (Zones 1-3) at 2019 (assumed to be around 129,000 people1) could support 1.3 bingo facilities and 0.3 casinos.
11.47 The household survey results indicated that only 12.7% of households in the study area visit bingo facilities. Of these, 45% visited Mecca at Dagenham Leisure Park and 9% visited Mecca at The Mall Mercury Gardens in Romford. The Mecca in Chadwell Heath, just over the border closed down in 2014.
11.48 Within LBBD there is just one Mecca at Dagenham Leisure Park. There is also a Mecca in Romford town centre, a Buzz Bingo in Stratford and a Buzz Bingo in Barkingside. The Mecca at Chadwell Heath has closed down since the last Study. This provision is sufficient to meet the
1 Based on the proportion of adult population (18+) being 80% - Source: Experian 2016 (average of the 18+ population for each zone)
Barking and Dagenham Retail and Town Centre Study : Update Report
Pg 60
requirements of the existing and future population of LBBD, and there is no clear need to plan for additional bingo facilities. There is no clear need for casinos in the Borough.
Trampoline centres
11.49 Indoor trampoline centres are a relatively new leisure activity in the UK. In America outdoor trampoline centres were popular in the late 1950s and 1960s. This format first seen in America has been adopted and modernised and is now becoming a popular indoor leisure activity for a variety of age groups in the UK. The UK’s first indoor trampoline centre was opened by Bounce on 31 May 2014.
11.50 Trampoline centres offer a new, recreational experience for both children and adults. They typically have over 100 interconnected trampolines on site, consisting of differing courts including a Main Arena, Dodgeball Court, Kids Court, Slam Dunk Area, Foam Pit, Airbag Jump, Touch Walls, Gladiator Pits and Tumble Tracks, as well as an arcade and party rooms.
11.51 There are two indoor trampoline centres in the Borough – Jump London Trampoline Park and Barking Better Extreme. The area is therefore well served by trampoline centres, and there is no obvious need for a further facility in the Borough. However, the strategy should be flexible to respond to any emerging opportunities.
Community Uses
11.52 Community uses such as libraries, halls, museums and religious institutions account for less than 7% of existing town centre floorspace based on Goad Plan data. Barking town centre has the highest proportion with 7%, followed by Chadwell Heath (5%), Green Lane (4%) and Dagenham Heathway (3%). The majority of this floorspace is occupied by libraries and places of worship. There is a limited provision of museums, galleries and play centres within the four town centres.
11.53 Respondents to the household survey were asked where they normally visit community facilities such as libraries and community halls. Within LBBD (Zone 1 to 3), 63% of respondents indicated they visit community facilities, and of these respondents over 86% normally visit facilities within LBBD. Barking town centre was the most popular destination, followed by Dagenham Heathway. Town centres play an important focal point for community uses.
11.54 The household survey results included questions relating to improvements that would make respondents shop in town centres more often. These results did not highlight significant deficiencies in community facilities. Less than 1% of respondents mentioned more play centres or more toilets. The business survey results also did not highlight issues relating to the absence of community facilities.
11.55 There are 7 libraries in LBBD. The Council's strategy (2013 to 2016) for libraries aims to provide the highest quality, affordable and accessible library service for all those living, working and studying in LBBD. LBBD's population is expected to increase by about 33% by 2034. Based on current provision, 2 new libraries could be required to serve new residential areas, and these could form part of new neighbourhood/local centres.
11.56 There are 19 registered community halls or rooms for hire in LBBD. Based on current provision, 6 new community halls could be required to serve new residential areas, and these could also form part of new neighbourhood/local centres.
11.57 The Council commissioned a Faith Groups and Meeting Places evidence base study dated November 2017. This included a future need assessment. The study estimates an additional 38,400 sq.m of purpose-built religious meeting space between 2017 to 2050, equating to 1,164
Barking and Dagenham Retail and Town Centre Study : Update Report
Pg 61
sq.m per annum. The study suggests LBBD could require 5,820 sq.m between 2019 to 2024, increasing to 11,640 sq.m by 2029 and 17,460 sq.m gross by 2034.
11.58 Future mixed developments within town centres, should seek to include appropriate accommodation for new community and cultural uses.
Hotels
11.59 The UK hotel market represents a significant part of the leisure economy. British residents alone spent £23.7 billion on overnight trips within Great Britain in 2017 (source: Visit England). This is an increase of £4.2 billion since 2012. The latest available data for Visit England's serviced accommodation audit (2016) shows that there were 33,374 serviced accommodation establishments registered with national tourist boards, which provide 1.8 million bed spaces. The serviced accommodation market is split with 32% of the market taken up by Bed & Breakfast accommodation, 36% Hotels and 21% Guesthouses.
11.60 The latest available data from Visit England on occupancy rates (February 2019) is 73% for room occupancy (up from 67% in July 2013) and 52% bed space occupancy (up from 51% in July 2013) in hotels in England. For city/large town locations, including hotels, guesthouses and B&Bs, the average room occupancy is 74%, compared to 68% in small towns, 61% in the countryside and 70% in seaside locations. Bed space occupancy in city/large town locations was 52% over the same period.
11.61 The Visit England data shows that occupancy rates have increased over the period from 2010, when room occupancy over a 12-month period in city/large town locations was 69%, 55% in small towns, 52% in the countryside and 54% in seaside locations. In London, room occupancy in 2018 was recorded at 77%, compared with 78% in 2017.
11.62 A recent trend in tourism has been the growth of non-serviced accommodation. Non-serviced accommodation is typically that in which private properties are rented to visitors. Most notably, the rise of Airbnb as a service enabling homeowners to rent out all or part of their property provides visitors with a different option to traditional hotels. Research by Colliers International “Airbnb in London” (2017) confirms overnight stays booked with Airbnb in London rose by a 130% from just over 2 million in 2015 to 4.62 million in 2016. Furthermore, nearly 9% of overnight visitors to London made use of Airbnb for their accommodation, up from nearly 4% in 2015. In relation to LBBD specifically, this was one of the London Boroughs with the lowest amount of accommodation booked on Airbnb.
11.63 Table 11.5 below summarises the hotel provision within the wider catchment area. It should be noted that this excludes Airbnb’s, guest houses, bed and breakfasts and establishments with less than 10 bedrooms.
11.64 Seven of the 10 hotels are part of chains. Premier Inn dominates the chain market with three hotels in the Borough, with Travelodge and Ibis both having two hotels in the Borough. Provision is focused towards lower-end / budget hotels, with no 4-5 star hotels.
11.65 The GLA Economics Paper “Projections of demand and supply for visitor accommodation in London to 2050” (April 2017) identifies that there were 145,737 serviced rooms in London in 2015, 562 of which are located in Barking and Dagenham (0.4% of London’s total share). Figure 11.1 provides an extract from the GLA Economics Paper showing the distribution of hotel accommodation in LBBD.
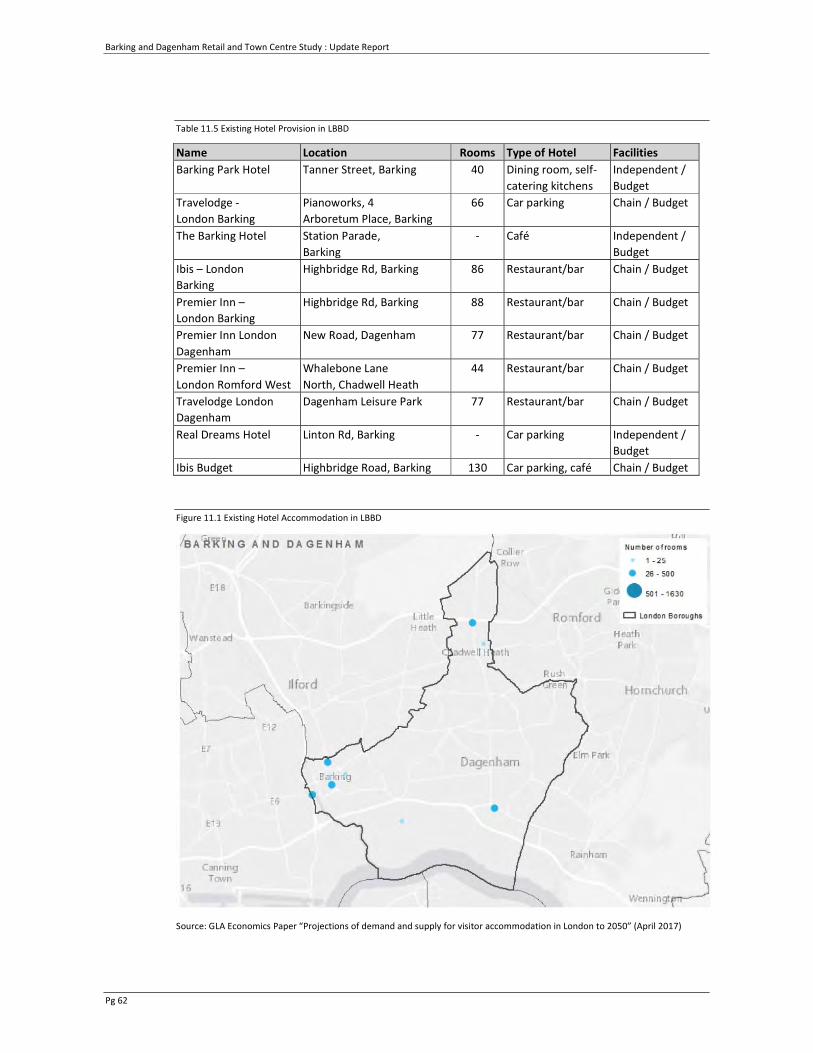
Barking and Dagenham Retail and Town Centre Study : Update Report
Pg 62
Table 11.5 Existing Hotel Provision in LBBD
Name Location Rooms Type of Hotel Facilities Barking Park Hotel Tanner Street, Barking 40 Dining room, self-
catering kitchens Independent / Budget
Travelodge - London Barking
Pianoworks, 4 Arboretum Place, Barking
66 Car parking Chain / Budget
The Barking Hotel Station Parade, Barking
- Café Independent / Budget
Ibis – London Barking
Highbridge Rd, Barking 86 Restaurant/bar Chain / Budget
Premier Inn – London Barking
Highbridge Rd, Barking 88 Restaurant/bar Chain / Budget
Premier Inn London Dagenham
New Road, Dagenham 77 Restaurant/bar Chain / Budget
Premier Inn – London Romford West
Whalebone Lane North, Chadwell Heath
44 Restaurant/bar Chain / Budget
Travelodge London Dagenham
Dagenham Leisure Park 77 Restaurant/bar Chain / Budget
Real Dreams Hotel Linton Rd, Barking - Car parking Independent / Budget
Ibis Budget Highbridge Road, Barking 130 Car parking, café Chain / Budget
Figure 11.1 Existing Hotel Accommodation in LBBD
Source: GLA Economics Paper “Projections of demand and supply for visitor accommodation in London to 2050” (April 2017)
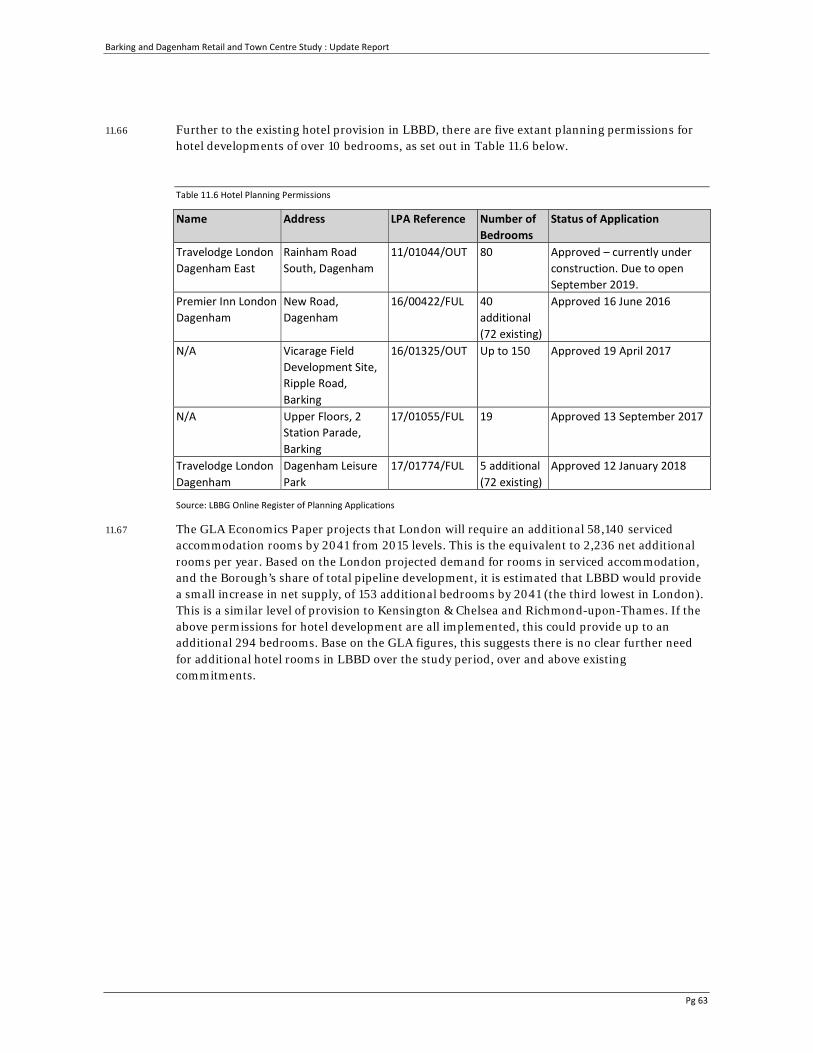
Barking and Dagenham Retail and Town Centre Study : Update Report
Pg 63
11.66 Further to the existing hotel provision in LBBD, there are five extant planning permissions for hotel developments of over 10 bedrooms, as set out in Table 11.6 below.
Table 11.6 Hotel Planning Permissions
Name Address LPA Reference Number of Bedrooms
Status of Application
Travelodge London Dagenham East
Rainham Road South, Dagenham
11/01044/OUT 80 Approved – currently under construction. Due to open September 2019.
Premier Inn London Dagenham
New Road, Dagenham
16/00422/FUL 40 additional (72 existing)
Approved 16 June 2016
N/A Vicarage Field Development Site, Ripple Road, Barking
16/01325/OUT Up to 150 Approved 19 April 2017
N/A Upper Floors, 2 Station Parade, Barking
17/01055/FUL 19 Approved 13 September 2017
Travelodge London Dagenham
Dagenham Leisure Park
17/01774/FUL 5 additional (72 existing)
Approved 12 January 2018
Source: LBBG Online Register of Planning Applications
11.67 The GLA Economics Paper projects that London will require an additional 58,140 serviced accommodation rooms by 2041 from 2015 levels. This is the equivalent to 2,236 net additional rooms per year. Based on the London projected demand for rooms in serviced accommodation, and the Borough’s share of total pipeline development, it is estimated that LBBD would provide a small increase in net supply, of 153 additional bedrooms by 2041 (the third lowest in London). This is a similar level of provision to Kensington & Chelsea and Richmond-upon-Thames. If the above permissions for hotel development are all implemented, this could provide up to an additional 294 bedrooms. Base on the GLA figures, this suggests there is no clear further need for additional hotel rooms in LBBD over the study period, over and above existing commitments.
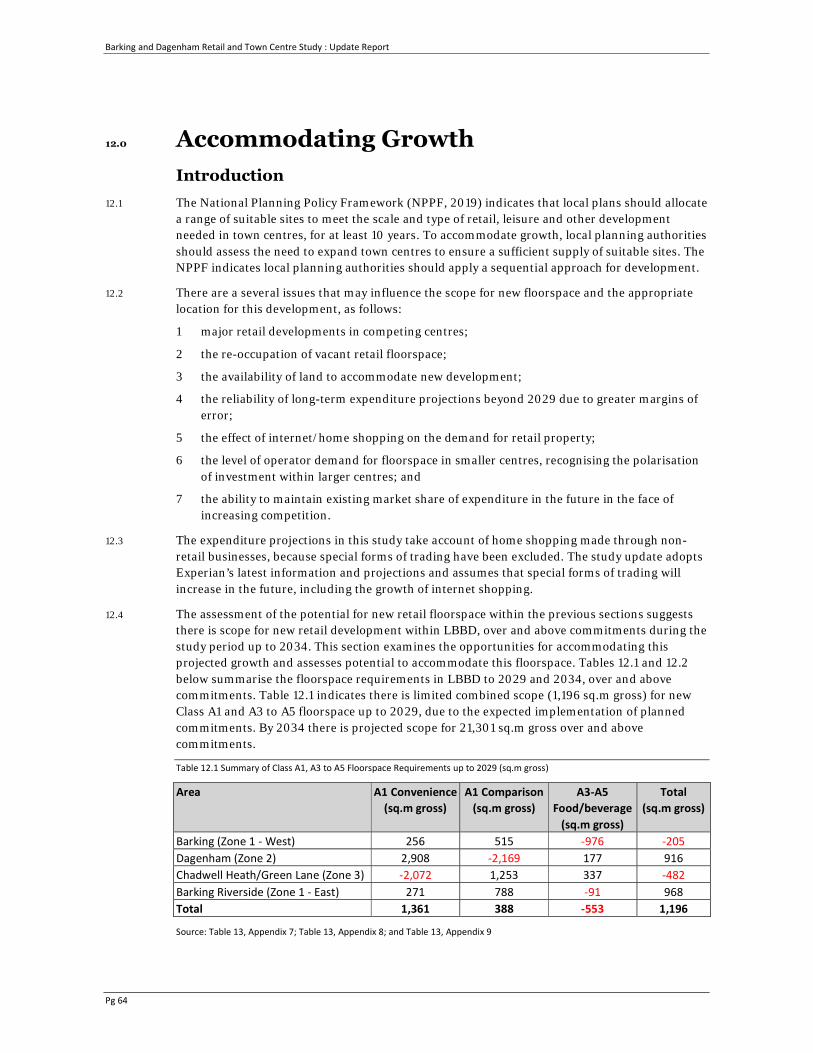
Barking and Dagenham Retail and Town Centre Study : Update Report
Pg 64
12.0 Accommodating Growth Introduction
12.1 The National Planning Policy Framework (NPPF, 2019) indicates that local plans should allocate a range of suitable sites to meet the scale and type of retail, leisure and other development needed in town centres, for at least 10 years. To accommodate growth, local planning authorities should assess the need to expand town centres to ensure a sufficient supply of suitable sites. The NPPF indicates local planning authorities should apply a sequential approach for development.
12.2 There are a several issues that may influence the scope for new floorspace and the appropriate location for this development, as follows:
1 major retail developments in competing centres;
2 the re-occupation of vacant retail floorspace;
3 the availability of land to accommodate new development;
4 the reliability of long-term expenditure projections beyond 2029 due to greater margins of error;
5 the effect of internet/home shopping on the demand for retail property;
6 the level of operator demand for floorspace in smaller centres, recognising the polarisation of investment within larger centres; and
7 the ability to maintain existing market share of expenditure in the future in the face of increasing competition.
12.3 The expenditure projections in this study take account of home shopping made through non-retail businesses, because special forms of trading have been excluded. The study update adopts Experian’s latest information and projections and assumes that special forms of trading will increase in the future, including the growth of internet shopping.
12.4 The assessment of the potential for new retail floorspace within the previous sections suggests there is scope for new retail development within LBBD, over and above commitments during the study period up to 2034. This section examines the opportunities for accommodating this projected growth and assesses potential to accommodate this floorspace. Tables 12.1 and 12.2 below summarise the floorspace requirements in LBBD to 2029 and 2034, over and above commitments. Table 12.1 indicates there is limited combined scope (1,196 sq.m gross) for new Class A1 and A3 to A5 floorspace up to 2029, due to the expected implementation of planned commitments. By 2034 there is projected scope for 21,301 sq.m gross over and above commitments.
Table 12.1 Summary of Class A1, A3 to A5 Floorspace Requirements up to 2029 (sq.m gross)
Area A1 Convenience(sq.m gross)
A1 Comparison (sq.m gross)
A3-A5 Food/beverage
(sq.m gross)
Total (sq.m gross)
Barking (Zone 1 - West) 256 515 -976 -205 Dagenham (Zone 2) 2,908 -2,169 177 916 Chadwell Heath/Green Lane (Zone 3) -2,072 1,253 337 -482 Barking Riverside (Zone 1 - East) 271 788 -91 968Total 1,361 388 -553 1,196
Source: Table 13, Appendix 7; Table 13, Appendix 8; and Table 13, Appendix 9
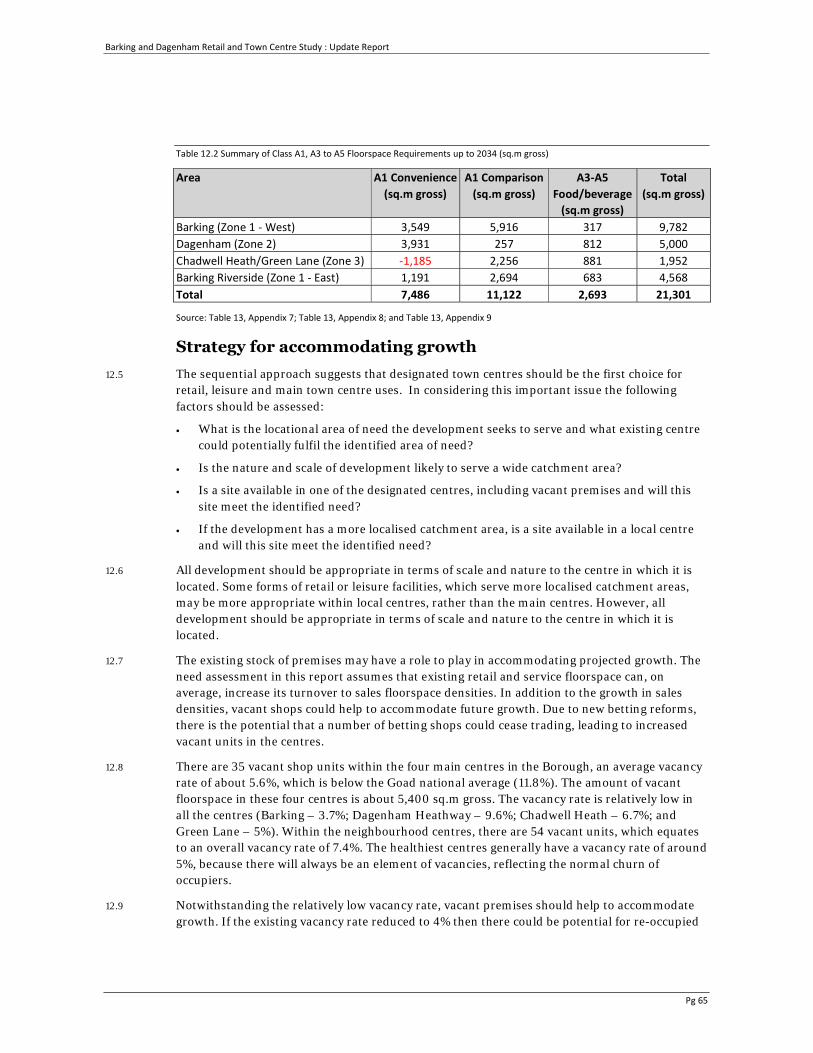
Barking and Dagenham Retail and Town Centre Study : Update Report
Pg 65
Table 12.2 Summary of Class A1, A3 to A5 Floorspace Requirements up to 2034 (sq.m gross)
Area A1 Convenience(sq.m gross)
A1 Comparison (sq.m gross)
A3-A5 Food/beverage
(sq.m gross)
Total (sq.m gross)
Barking (Zone 1 - West) 3,549 5,916 317 9,782Dagenham (Zone 2) 3,931 257 812 5,000Chadwell Heath/Green Lane (Zone 3) -1,185 2,256 881 1,952 Barking Riverside (Zone 1 - East) 1,191 2,694 683 4,568 Total 7,486 11,122 2,693 21,301
Source: Table 13, Appendix 7; Table 13, Appendix 8; and Table 13, Appendix 9
Strategy for accommodating growth 12.5 The sequential approach suggests that designated town centres should be the first choice for
retail, leisure and main town centre uses. In considering this important issue the following factors should be assessed:
• What is the locational area of need the development seeks to serve and what existing centre could potentially fulfil the identified area of need?
• Is the nature and scale of development likely to serve a wide catchment area?
• Is a site available in one of the designated centres, including vacant premises and will this site meet the identified need?
• If the development has a more localised catchment area, is a site available in a local centre and will this site meet the identified need?
12.6 All development should be appropriate in terms of scale and nature to the centre in which it is located. Some forms of retail or leisure facilities, which serve more localised catchment areas, may be more appropriate within local centres, rather than the main centres. However, all development should be appropriate in terms of scale and nature to the centre in which it is located.
12.7 The existing stock of premises may have a role to play in accommodating projected growth. The need assessment in this report assumes that existing retail and service floorspace can, on average, increase its turnover to sales floorspace densities. In addition to the growth in sales densities, vacant shops could help to accommodate future growth. Due to new betting reforms, there is the potential that a number of betting shops could cease trading, leading to increased vacant units in the centres.
12.8 There are 35 vacant shop units within the four main centres in the Borough, an average vacancy rate of about 5.6%, which is below the Goad national average (11.8%). The amount of vacant floorspace in these four centres is about 5,400 sq.m gross. The vacancy rate is relatively low in all the centres (Barking – 3.7%; Dagenham Heathway – 9.6%; Chadwell Heath – 6.7%; and Green Lane – 5%). Within the neighbourhood centres, there are 54 vacant units, which equates to an overall vacancy rate of 7.4%. The healthiest centres generally have a vacancy rate of around 5%, because there will always be an element of vacancies, reflecting the normal churn of occupiers.
12.9 Notwithstanding the relatively low vacancy rate, vacant premises should help to accommodate growth. If the existing vacancy rate reduced to 4% then there could be potential for re-occupied
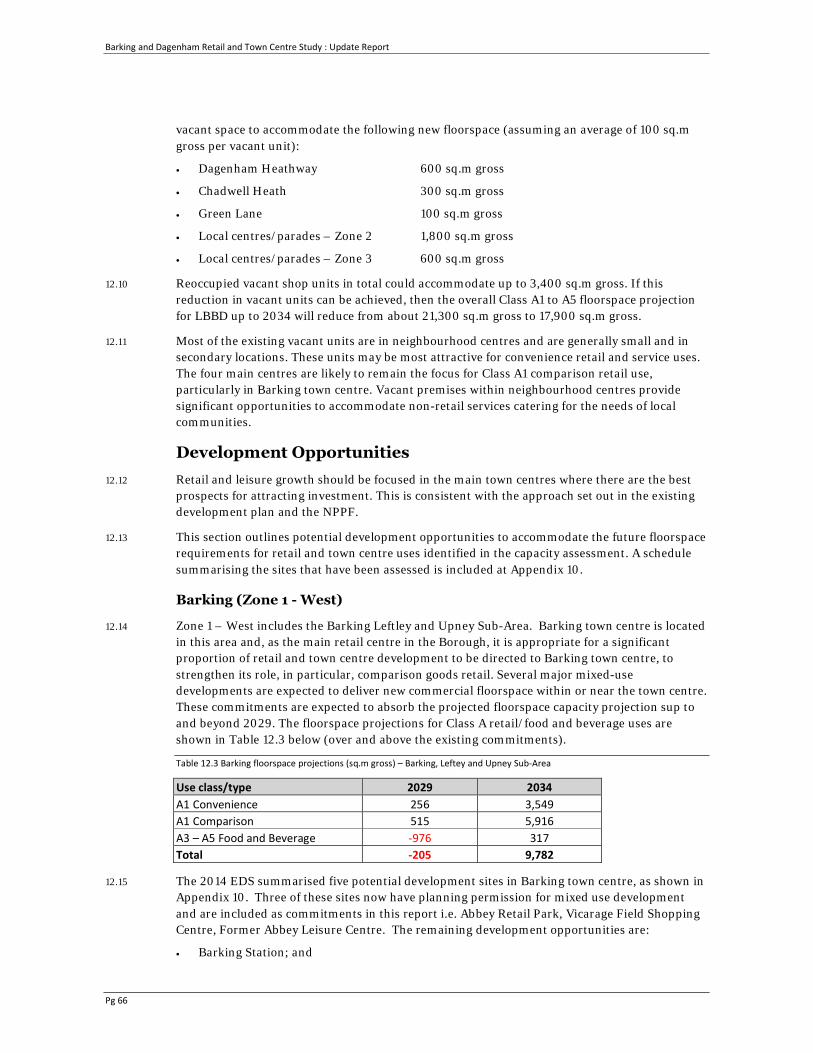
Barking and Dagenham Retail and Town Centre Study : Update Report
Pg 66
vacant space to accommodate the following new floorspace (assuming an average of 100 sq.m gross per vacant unit):
• Dagenham Heathway 600 sq.m gross
• Chadwell Heath 300 sq.m gross
• Green Lane 100 sq.m gross
• Local centres/parades – Zone 2 1,800 sq.m gross
• Local centres/parades – Zone 3 600 sq.m gross
12.10 Reoccupied vacant shop units in total could accommodate up to 3,400 sq.m gross. If this reduction in vacant units can be achieved, then the overall Class A1 to A5 floorspace projection for LBBD up to 2034 will reduce from about 21,300 sq.m gross to 17,900 sq.m gross.
12.11 Most of the existing vacant units are in neighbourhood centres and are generally small and in secondary locations. These units may be most attractive for convenience retail and service uses. The four main centres are likely to remain the focus for Class A1 comparison retail use, particularly in Barking town centre. Vacant premises within neighbourhood centres provide significant opportunities to accommodate non-retail services catering for the needs of local communities.
Development Opportunities 12.12 Retail and leisure growth should be focused in the main town centres where there are the best
prospects for attracting investment. This is consistent with the approach set out in the existing development plan and the NPPF.
12.13 This section outlines potential development opportunities to accommodate the future floorspace requirements for retail and town centre uses identified in the capacity assessment. A schedule summarising the sites that have been assessed is included at Appendix 10.
Barking (Zone 1 - West)
12.14 Zone 1 – West includes the Barking Leftley and Upney Sub-Area. Barking town centre is located in this area and, as the main retail centre in the Borough, it is appropriate for a significant proportion of retail and town centre development to be directed to Barking town centre, to strengthen its role, in particular, comparison goods retail. Several major mixed-use developments are expected to deliver new commercial floorspace within or near the town centre. These commitments are expected to absorb the projected floorspace capacity projection sup to and beyond 2029. The floorspace projections for Class A retail/food and beverage uses are shown in Table 12.3 below (over and above the existing commitments).
Table 12.3 Barking floorspace projections (sq.m gross) – Barking, Leftey and Upney Sub-Area
Use class/type 2029 2034 A1 Convenience 256 3,549A1 Comparison 515 5,916 A3 – A5 Food and Beverage -976 317 Total -205 9,782
12.15 The 2014 EDS summarised five potential development sites in Barking town centre, as shown in Appendix 10. Three of these sites now have planning permission for mixed use development and are included as commitments in this report i.e. Abbey Retail Park, Vicarage Field Shopping Centre, Former Abbey Leisure Centre. The remaining development opportunities are:
• Barking Station; and
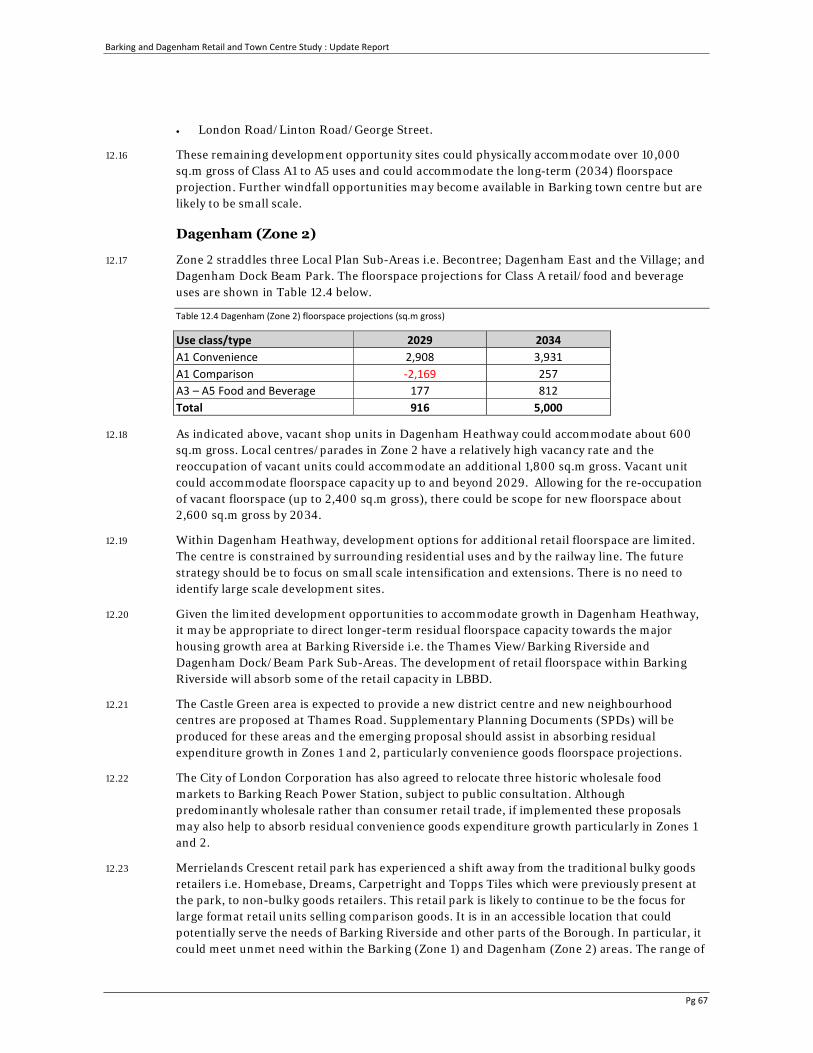
Barking and Dagenham Retail and Town Centre Study : Update Report
Pg 67
• London Road/Linton Road/George Street.
12.16 These remaining development opportunity sites could physically accommodate over 10,000 sq.m gross of Class A1 to A5 uses and could accommodate the long-term (2034) floorspace projection. Further windfall opportunities may become available in Barking town centre but are likely to be small scale.
Dagenham (Zone 2)
12.17 Zone 2 straddles three Local Plan Sub-Areas i.e. Becontree; Dagenham East and the Village; and Dagenham Dock Beam Park. The floorspace projections for Class A retail/food and beverage uses are shown in Table 12.4 below.
Table 12.4 Dagenham (Zone 2) floorspace projections (sq.m gross)
Use class/type 2029 2034 A1 Convenience 2,908 3,931 A1 Comparison -2,169 257A3 – A5 Food and Beverage 177 812 Total 916 5,000
12.18 As indicated above, vacant shop units in Dagenham Heathway could accommodate about 600 sq.m gross. Local centres/parades in Zone 2 have a relatively high vacancy rate and the reoccupation of vacant units could accommodate an additional 1,800 sq.m gross. Vacant unit could accommodate floorspace capacity up to and beyond 2029. Allowing for the re-occupation of vacant floorspace (up to 2,400 sq.m gross), there could be scope for new floorspace about 2,600 sq.m gross by 2034.
12.19 Within Dagenham Heathway, development options for additional retail floorspace are limited. The centre is constrained by surrounding residential uses and by the railway line. The future strategy should be to focus on small scale intensification and extensions. There is no need to identify large scale development sites.
12.20 Given the limited development opportunities to accommodate growth in Dagenham Heathway, it may be appropriate to direct longer-term residual floorspace capacity towards the major housing growth area at Barking Riverside i.e. the Thames View/Barking Riverside and Dagenham Dock/Beam Park Sub-Areas. The development of retail floorspace within Barking Riverside will absorb some of the retail capacity in LBBD.
12.21 The Castle Green area is expected to provide a new district centre and new neighbourhood centres are proposed at Thames Road. Supplementary Planning Documents (SPDs) will be produced for these areas and the emerging proposal should assist in absorbing residual expenditure growth in Zones 1 and 2, particularly convenience goods floorspace projections.
12.22 The City of London Corporation has also agreed to relocate three historic wholesale food markets to Barking Reach Power Station, subject to public consultation. Although predominantly wholesale rather than consumer retail trade, if implemented these proposals may also help to absorb residual convenience goods expenditure growth particularly in Zones 1 and 2.
12.23 Merrielands Crescent retail park has experienced a shift away from the traditional bulky goods retailers i.e. Homebase, Dreams, Carpetright and Topps Tiles which were previously present at the park, to non-bulky goods retailers. This retail park is likely to continue to be the focus for large format retail units selling comparison goods. It is in an accessible location that could potentially serve the needs of Barking Riverside and other parts of the Borough. In particular, it could meet unmet need within the Barking (Zone 1) and Dagenham (Zone 2) areas. The range of
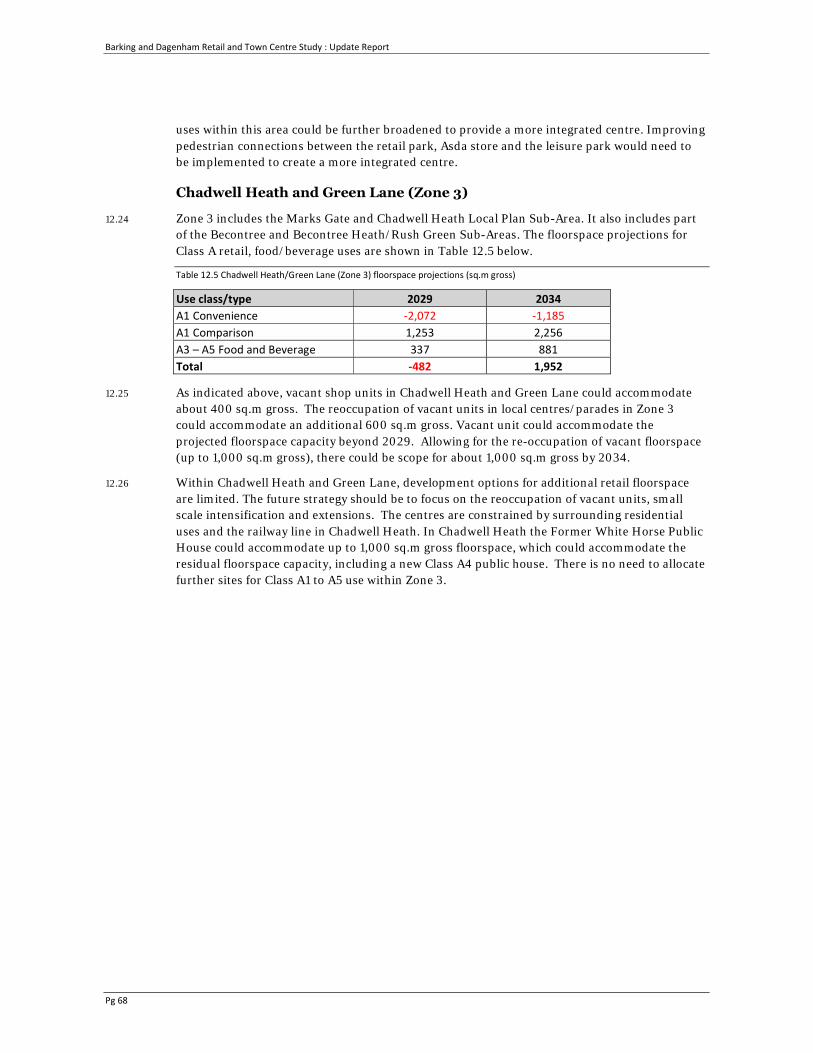
Barking and Dagenham Retail and Town Centre Study : Update Report
Pg 68
uses within this area could be further broadened to provide a more integrated centre. Improving pedestrian connections between the retail park, Asda store and the leisure park would need to be implemented to create a more integrated centre.
Chadwell Heath and Green Lane (Zone 3)
12.24 Zone 3 includes the Marks Gate and Chadwell Heath Local Plan Sub-Area. It also includes part of the Becontree and Becontree Heath/Rush Green Sub-Areas. The floorspace projections for Class A retail, food/beverage uses are shown in Table 12.5 below.
Table 12.5 Chadwell Heath/Green Lane (Zone 3) floorspace projections (sq.m gross)
Use class/type 2029 2034A1 Convenience -2,072 -1,185 A1 Comparison 1,253 2,256 A3 – A5 Food and Beverage 337 881 Total -482 1,952
12.25 As indicated above, vacant shop units in Chadwell Heath and Green Lane could accommodate about 400 sq.m gross. The reoccupation of vacant units in local centres/parades in Zone 3 could accommodate an additional 600 sq.m gross. Vacant unit could accommodate the projected floorspace capacity beyond 2029. Allowing for the re-occupation of vacant floorspace (up to 1,000 sq.m gross), there could be scope for about 1,000 sq.m gross by 2034.
12.26 Within Chadwell Heath and Green Lane, development options for additional retail floorspace are limited. The future strategy should be to focus on the reoccupation of vacant units, small scale intensification and extensions. The centres are constrained by surrounding residential uses and the railway line in Chadwell Heath. In Chadwell Heath the Former White Horse Public House could accommodate up to 1,000 sq.m gross floorspace, which could accommodate the residual floorspace capacity, including a new Class A4 public house. There is no need to allocate further sites for Class A1 to A5 use within Zone 3.
Barking and Dagenham Retail and Town Centre Study : Update Report
Pg 69
13.0 Policy Review Introduction
13.1 This section reviews the current policy approach to retail and town centre uses. The 2013 study provided a review of shopping frontage and boundary policies options within LBBD, but this pre-dated the revised NPPF. The study noted the need for town centres to maintain their primary retail function, whilst increasing their diversity with a range of complementary uses. The importance of a balance between retail and other town centre activity has increased since 2013/2014, as town centres increasingly need to compete with on-line shopping. Town centres need a better mix of uses that extend activity throughout the daytime and into the evenings.
13.2 The PPG indicates that development plans should develop (and keep under review) town centre strategies that plan for a 3-5 year period, whilst also giving a Local Plan a lifetime view. Plans should identify the scale of need for main town centre uses and assess whether the need can be met on town centre sites or through the expansion of centres. The revised NPPF (2019) indicates that local plans should allocate a range of suitable sites to meet the scale and type of retail, leisure and other development needed in town centres for at least 10 years. The need for development should not be compromised by limited site availability. To accommodate growth, local planning authorities should keep town centre boundaries under review.
13.3 Consistent with the sequential approach, town centres are expected to be the focus for retail and leisure development. The NPPF does not require development to be of an appropriate scale and nature in relation to the centre in which it is located, but larger town centres have the best prospects for attracting investment from developers and multiple operators.
13.4 The designation of primary shopping areas or centre boundaries is important when applying the sequential approach, to direct retail and town centre uses to sustainable locations and determine whether a retail impact assessment is required. The revised NPPF continues to indicate that the first preference for retail uses should be the primary shopping area. The first preference for leisure uses is normally the wider defined town centre, which usually includes the primary shopping area and other parts of the town centre.
13.5 The NPPF states that, when assessing applications for retail and leisure development outside of town centres which are not in accordance with an up to date local plan, local planning authorities should require an impact assessment if the development is over a proportionate, locally set threshold. If there is no locally set threshold, the default threshold is 2,500 sq. m gross. The PPG provides guidance on setting locally appropriate thresholds, and indicates it will be important to consider:
• the scale of proposals relative to town centres;
• the existing viability and vitality of town centres;
• cumulative effects of recent developments;
• whether local town centres are vulnerable;
• the likely effects of development on any town centre strategy; and the impact on any other planned investment.
13.6 This section examines the existing policy approach within LBBD, including retail impact thresholds and retail frontages/boundaries.
Barking and Dagenham Retail and Town Centre Study : Update Report
Pg 70
Scale of Development
Impact
13.7 The PPG states that where authorities do not have their own floorspace thresholds for impact assessments in local development plans, national policy requires impact assessments to be submitted for retail and leisure developments over 2,500 sq.m gross. The PPG acknowledges that it may occasionally be relevant to consider the impact of proposals below this floorspace threshold, for example if they are large developments when compared with the size of a nearby centre, or likely to have a disproportionate effect or ‘tip the balance’ of a vulnerable centre. Maintaining the sequential and impact test will allow each proposal to be considered on its individual merits.
13.8 The NPPF minimum threshold of 2,500 sq.m gross continues to be inappropriate as a blanket threshold across LBBD, because this scale of development would represent a significant proportion of the overall retail projections for most centres in the Borough. Retail development smaller than 2,500 sq.m gross could have a significant adverse impact, on centres within the Borough.
13.9 Whilst the shop vacancy rate is relatively low in Barking, Chadwell Heath and Green Lane, retail commitments are expected to exceed expenditure growth up to 2024 and absorb most of the growth up to 2029. Cumulatively within commitments, additional retail developments under 2,500 sq.m gross could have a significant adverse impact on these centres. Shop vacancy rates are generally higher in Dagenham Heathway and Zone 2 and centres in this area are also vulnerable to future trade diversion and impact.
13.10 The Council should consider reduced impact threshold within a retail policy in the Local Plan review. A reduced impact threshold of 500 sq.m gross, similar to LB Newham’s threshold (300 sq.m net) could be adopted. A 500 sq.m gross threshold is consistent with the retail floorspace projections within each study area zone up to 2029, as set out in Tables 10.2 and 10.3.
Sequential test
13.11 The designation of town centre boundaries and primary shopping areas are important when applying the sequential approach, to direct retail and town centre uses to sustainable locations and to determine whether a retail/leisure impact assessment is required. These boundaries are also important in determining what locations will represent appropriate edge of centre locations for retail and other main town centre uses.
13.12 The NPPF indicates that the first preference for retail uses is usually the primary shopping area, which will comprise a defined area where retail development is concentrated. This suggests new retail uses outside the primary shopping area, but still within the town centre boundary, would be edge of centre in planning policy terms and therefore subject to the impact and sequential tests.
13.13 The first preference for other town centre uses, such as commercial leisure and office uses, is normally the wider defined town centre, which usually includes the primary shopping area and other parts of the town centre. The revised NPPF does not refer to primary and secondary frontages, which previously made up the primary shopping area. The aim of the new NPPF appears to create more flexibility and encourage positive strategies for town centres. However, the primary shopping area is still the defined area where retail development should be concentrated.
13.14 Policy regarding edge and out of centre development should be consistent with the NPPF in terms of the sequential and impact tests and should be worded to make reference to the primary
Barking and Dagenham Retail and Town Centre Study : Update Report
Pg 71
shopping area and town centre boundary, clearly indicating where retail and other main town centre uses should be concentrated (i.e. the sequential approach indicates that retail uses should be focused within the primary shopping area and other town centre uses should be focused within the wider town centre boundary, unless it can be demonstrated that there are no suitable and available sites). In many small centres the primary shopping area and the town centre boundary may cover the same area and it may be unnecessary to designate two boundaries.
13.15 Policy wording should also be aware of the revised NPPF. As outlined in Section 2 of this study, the most pertinent suggested change in the revised NPPF (underlined) is at paragraph 87 - “main town centre uses should be located in town centres, then edge of centre locations; and only if suitable sites are not available (or expected to become available within a reasonable period) should out of centre sites be considered”.
Review of Centre Boundaries and Frontages 13.16 The town centre hierarchy is appropriately defined in Core Strategy Policy CM5. The extent of
town, district and neighbourhood centres is shown on the current development plan Proposals Map. These boundaries clearly relate to the application of the sequential and impact tests (Policy BE3). The Borough Wide Development Policies DPD (March 2011) seeks to direct retail and other key town centre uses to town centres (policy BE2) and requires proposed retail development in edge or out of town centre sites to be considered against the sequential approach (policy BE3). This approach remains consistent with the NPPF, and the emerging plan should continue to clearly define the extent of town, district and neighbourhood centres.
13.17 The Proposals Map and Barking Town Centre Area Action Plan (February 2011) identify three areas within the town centre i.e. primary and secondary shopping areas or frontages and unprotected areas. The purpose of these designations is to control the mix of uses rather than determining whether development is in-centre, edge-of-centre or out-of-centre in sequential terms. In this case, it is necessary to continue to define a centre boundary and primary and secondary areas in the emerging development plan.
13.18 The Site Specific Allocations DPD (December 2010) lists the properties included as primary and secondary shopping frontages in Dagenham Heathway, Chadwell Heath and Green Lane, but these are not shown on the Proposals Map. To avoid confusion, the emerging plan proposals map should show all centre boundary and frontage designations.
13.19 Current policies seek to limit the proportion of non-Class A1 retail uses within the primary and secondary shopping frontages of Barking, Dagenham Heathway, Chadwell Heath and Green Lane and in the defined neighbourhood centres (policy BE1).
13.20 The continued need for, and extent of primary and secondary frontages should be considered within the new LBBD Local Plan.
Primary Shopping Areas and Centre Boundaries
13.21 In Barking town centre the centre boundary is tightly drawn around the retail and commercial area. The existing Barking town centre boundary includes adjoining areas with leisure, business and other key town centre uses that extend beyond the main shopping areas. Future policies should make clear whether the designated centre boundary or primary shopping frontage/area is the appropriate and sequentially preferable location for retail uses and/or other main town centre uses.
13.22 The existing town centre boundary could however be extended to the north east to include the commercial units which are in the undefined shopping frontage, as shown in green below.
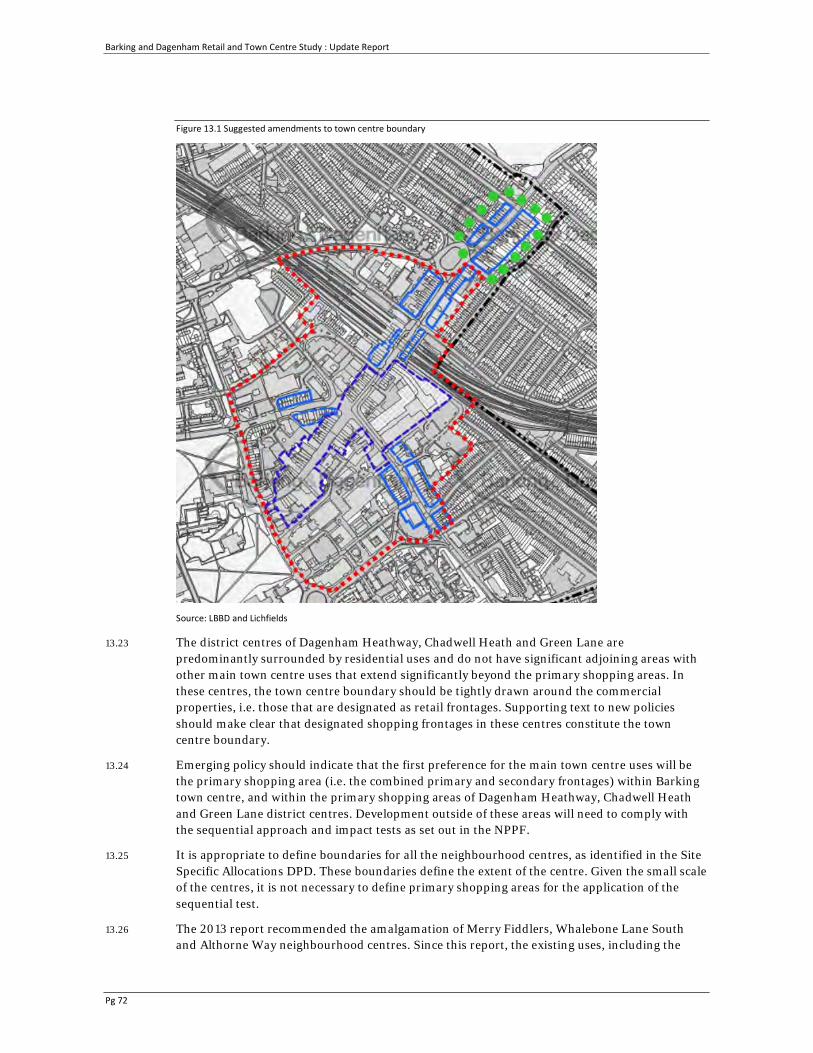
Barking and Dagenham Retail and Town Centre Study : Update Report
Pg 72
Figure 13.1 Suggested amendments to town centre boundary
Source: LBBD and Lichfields
13.23 The district centres of Dagenham Heathway, Chadwell Heath and Green Lane are predominantly surrounded by residential uses and do not have significant adjoining areas with other main town centre uses that extend significantly beyond the primary shopping areas. In these centres, the town centre boundary should be tightly drawn around the commercial properties, i.e. those that are designated as retail frontages. Supporting text to new policies should make clear that designated shopping frontages in these centres constitute the town centre boundary.
13.24 Emerging policy should indicate that the first preference for the main town centre uses will be the primary shopping area (i.e. the combined primary and secondary frontages) within Barking town centre, and within the primary shopping areas of Dagenham Heathway, Chadwell Heath and Green Lane district centres. Development outside of these areas will need to comply with the sequential approach and impact tests as set out in the NPPF.
13.25 It is appropriate to define boundaries for all the neighbourhood centres, as identified in the Site Specific Allocations DPD. These boundaries define the extent of the centre. Given the small scale of the centres, it is not necessary to define primary shopping areas for the application of the sequential test.
13.26 The 2013 report recommended the amalgamation of Merry Fiddlers, Whalebone Lane South and Althorne Way neighbourhood centres. Since this report, the existing uses, including the
Barking and Dagenham Retail and Town Centre Study : Update Report
Pg 73
commercial units, at Althorne Way have been demolished. The site is currently under construction for residential use. The proposals also include a purpose-built unit for the re-provision of the Class A1 pharmacy which was previously present in the centre. No other commercial units are proposed. Notwithstanding this, there is still potential to amalgamate Merry Fiddlers, Whalebone Lane South and Althorne Way, perhaps to create a new district centre. The centres are all in close proximity and combined have around 68 units (including the new unit proposed at Althorne Way). These commercial areas function as one rather than a number of separate smaller centres. The Morrison's store provides an anchor to the area.
13.27 Gascoigne is also designated as a neighbourhood centre, and at the time of the previous study had 8 units. These units have now been demolished, along with a number of residential units and the site is being redeveloped for residential with commercial units on the ground floor. These new commercial units should be included as a neighbourhood centre.
Primary and Secondary Shopping Frontages
13.28 The revised NPPF does not suggest policies relating to the mix of Class A and non-Class A uses within primary and secondary shopping frontages should not be adopted, but the NPPF implies a more flexible approach should be considered based on local circumstances.
13.29 Town centres should provide a range and mix of complementary uses. A balance between retail, entertainment and leisure activity helps town centres compete with on-line shopping. Town centres need a good mix of uses that extend activity throughout the daytime and into the evenings. This approach is recognised in the revised NPPF, and it is necessary to review the primary and secondary shopping frontage designations and the policy approach within these areas.
13.30 In smaller centres, it is necessary to retain a critical mass of both shops and services (Class A1 to A5), to ensure the vitality and vitality of the centre is maintained. Some form of control to maintain local access to shops and services needs to be considered. The appropriate approach should be considered on a centre by centre basis, as one approach is unlikely to be suitable for all centres.
Available options
13.31 There are two broad policy approaches that can be adopted to control the mix of uses within town centres as follows:
• percentage thresholds restricting the amount of non-retail uses in designated frontages;
• criteria based policies that allow changes of use subject to specific requirements.
13.32 The threshold approach is currently adopted in Barking and Dagenham. The merits of the alternative criteria based approach should be considered based on the analysis below.
13.33 Based on Lichfields’ experience the adoption of percentage thresholds can be difficult to monitor and the approach can be inflexible. However, the approach is transparent, providing clear guidance. Criteria based policies are more flexible, allowing change of use applications to be assessed on their individual merits. However, the application of criteria based policies can be less transparent and subjective. Both approaches are widely adopted across London and the South East and there is no right or wrong approach.
13.34 In addition to these two policy options, the Council should consider the following strategic approaches:
Barking and Dagenham Retail and Town Centre Study : Update Report
Pg 74
• strengthening shop frontages policies to provide more control over the loss of Class A1 retail uses. This would usually involve extending the areas of protected frontages and/or reducing the maximum threshold for non-retail uses (as currently set out in Policy BE1);
• retaining the current development plan policies (e.g. BE1) that seek to control the extent of non-retail uses within designated frontages;
• relaxing shop frontages policies to allow a more flexible approach to enable more non-retail uses. This would usually involve reducing the areas of protected frontage, increasing the maximum threshold for non-retail uses or the introduction of a criteria based policy; or
• a laissez-faire approach that does not seek to protect retail and town centre uses, on the basis that the market will determine the appropriate mix of uses within town centres.
13.35 The NPPF (paragraph 85) indicates that policies can make clear the range of uses that will be permitted in town centres and the primary shopping area, as part of a positive strategy for the future of each centre. A balanced mix of uses is required in town centres, which promotes growth. There is a reasonable degree of flexibility for local authorities to take account of local circumstances during the plan making process, and in this respect the revised NPPF is not prescriptive.
13.36 The suitability of the approach in LBBD also needs to be considered in the context of recent changes in the mix of uses within frontages, the floorspace projections and changes to the General Permitted Development Order (GPDO). The changes to the GPDO will have an impact on the effectiveness of frontage policies. These measures allow for greater flexibility for changes of use from retail to non-retail uses subject to Prior Approval e.g. Class A uses to C3 residential use and Class A1 to non-A1 uses. These measures could change the composition of town centres, including reducing the amount of Class A1 space where shop units are predominantly small (less than 150 sq.m gross). The ability to control non-A1 uses has diminished and the need to protect larger retail units may have increased.
13.37 The floorspace capacity projections suggest there is a need to retain Class A1 to A5 uses and to maintain the vitality and viability of centres. Food and beverage uses may also need to be controlled to prevent adverse impacts on residential amenity. Future policy should provide sufficient flexibility to allow improvements to non-retail uses in appropriate locations that does not impact on nearby residential uses. A ban on all changes of use from Class A1 across frontages would not promote diversity and could stifle investment, which would be potentially damaging to the vitality and viability of centres. Particularly in secondary shopping areas, the introduction of more restrictive shop frontage policies may be inappropriate as it could lead to an increase in vacant units, because demand for Class A1 retail occupiers is unlikely to be as strong within peripheral parts of the town centres. Furthermore, these areas generally have smaller units and the ability to control changes of use will be affected by change to the GPDO. Nevertheless, a proliferation of non-retail uses could be harmful to centre's vitality and viability.
13.38 Based on our experience across London, the typical maximum proportion of non-A1 use permitted within primary shopping frontages usually ranges from 20% to 30%. For secondary shopping frontages, the typical maximum proportion of non-A1 use allowed within secondary shopping frontages usually ranges from 50% to 70%, but often these secondary areas are unrestricted. These proportions generally prevent clusters of non-retail use, whilst still maintaining some control on the overall predominance of Class A1 use in the core areas.
Barking town centre
13.39 The current policy for Barking town centre sets out a maximum of 15% of the measured primary shopping frontages and 30% of the measured secondary shopping frontages will be permitted
Barking and Dagenham Retail and Town Centre Study : Update Report
Pg 75
for Class A2-A5 uses (policy BE1 of the Borough Wide Development Policies DPD). The existing primary and secondary shopping frontages are tightly drawn in Barking town centre, with a more extensive "fringe" of unrestricted frontages surrounding the retail core, allowing for flexibility of uses within the town centre and the vacancy rate is relatively low in Barking town centre (3.7%) which implies a less restrictive approach is not required. Furthermore, the floorspace capacity figures for Barking indicate predominantly new Class A1 uses is required over the plan period. However, the overall proportion of Class A1 units (63.3%) in Barking is still above the national average (56.2%), which suggests a more restrictive approach is unnecessary.
13.40 An analysis of the existing breakdown of uses within Barking's primary shopping frontage suggests that the policy threshold (15%) has been breached as 32% (or 43 units) of units are currently not within Class A1 uses within the defined primary frontage. As in the 2013 study, the health check has not identified any particular concentrations of vacant units, and there is no immediate need to radically change shopping policies in order to encourage non-Class A1 to reoccupy vacant units or to regenerate rundown areas.
13.41 On balance and given that the threshold in the primary shopping area has been breached but the overall proportion of Class A1 use is still above the national average, the appropriate threshold could be revisited and potentially increased i.e. to 30%. Two options should be considered in Barking town centre:
1 a slightly more flexible approach could be also adopted in the secondary frontages e.g. with a threshold increase from 30% to 50%; alternatively
2 a criteria based policy could be introduced.
13.42 Criteria based policies would allow changes of use form retail to non-retail use where:
• an extensive area of dead frontage or concentration of non-retail use would not be created;
• the new use would contribute to, rather than harm, the attraction of the locality to customers/visitors;
• the unit has been vacant for some time (i.e. over 12 months) and has been activity marketed within success; and where
• the new uses would not create amenity problems for nearby uses in terms of noise, smells, litter or parking/highways issues.
13.43 If a criteria based approach is adopted then the primary and secondary frontages could be deleted. A town centre boundary and primary shopping area would still be required for the sequential test as outlined above.
13.44 If the threshold approach is retained, then the extent of defined retail frontages in Barking town centre should be considered. The frontages appear to be appropriately drawn based on the current mix of uses. However, the primary shopping frontage could be extended to include the new Asda development on London Road/North Street, as shown in green below.
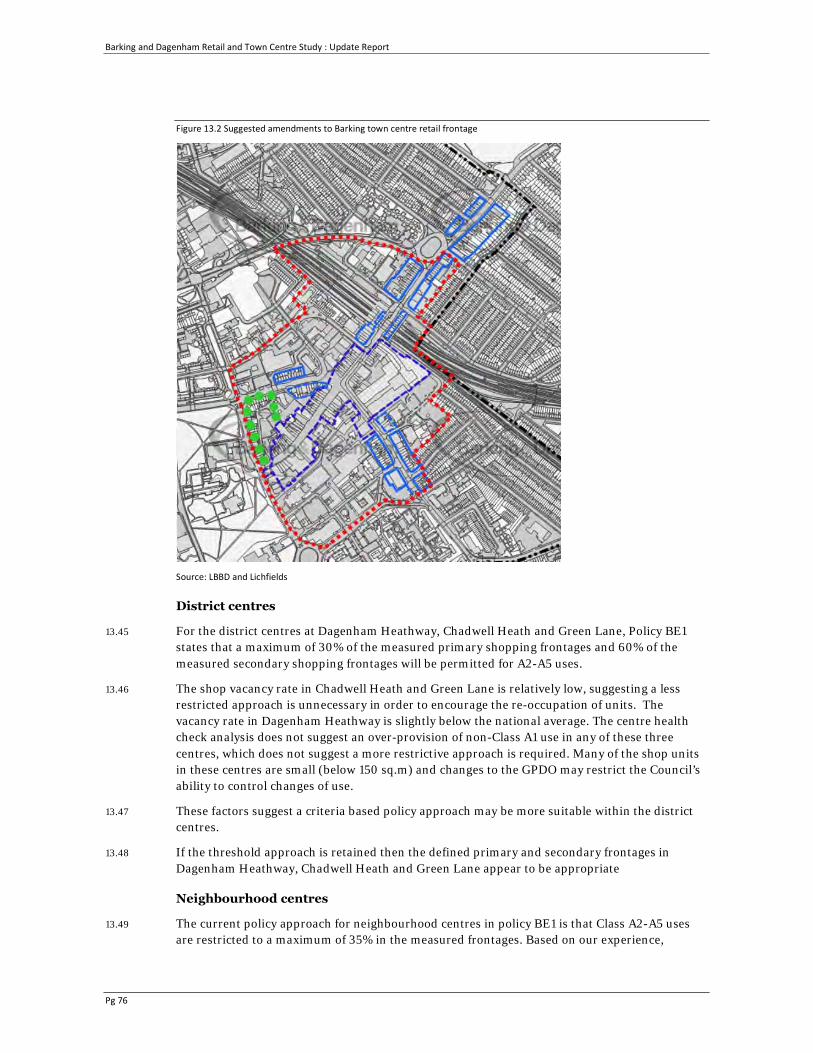
Barking and Dagenham Retail and Town Centre Study : Update Report
Pg 76
Figure 13.2 Suggested amendments to Barking town centre retail frontage
Source: LBBD and Lichfields
District centres
13.45 For the district centres at Dagenham Heathway, Chadwell Heath and Green Lane, Policy BE1 states that a maximum of 30% of the measured primary shopping frontages and 60% of the measured secondary shopping frontages will be permitted for A2-A5 uses.
13.46 The shop vacancy rate in Chadwell Heath and Green Lane is relatively low, suggesting a less restricted approach is unnecessary in order to encourage the re-occupation of units. The vacancy rate in Dagenham Heathway is slightly below the national average. The centre health check analysis does not suggest an over-provision of non-Class A1 use in any of these three centres, which does not suggest a more restrictive approach is required. Many of the shop units in these centres are small (below 150 sq.m) and changes to the GPDO may restrict the Council’s ability to control changes of use.
13.47 These factors suggest a criteria based policy approach may be more suitable within the district centres.
13.48 If the threshold approach is retained then the defined primary and secondary frontages in Dagenham Heathway, Chadwell Heath and Green Lane appear to be appropriate
Neighbourhood centres
13.49 The current policy approach for neighbourhood centres in policy BE1 is that Class A2-A5 uses are restricted to a maximum of 35% in the measured frontages. Based on our experience,
Barking and Dagenham Retail and Town Centre Study : Update Report
Pg 77
smaller local centres tend to have a higher proportion of non-A1 service uses. There are 54 vacant units within the neighbourhood centres. A more flexible approach e.g. increasing the maximum threshold from 35% to 50% could assist in reducing the number of vacant units. However, as for district centres, a criteria based policy approach may be more suitable within these centres.
13.50 The Council's Hot Food Takeaway SPD (2010) includes a maximum 5% threshold within centres/frontages, but policy BE1 of the Borough Wide Development Policies DPD confirms hot Class A5 uses are restricted to a maximum of 15% of the measured frontage. The Goad national average for Class A5 uses is 6%. The higher 15% threshold has not breached in the four main centres in LBBD, as the percentages range from around 6% to just over 13%. These figures suggest the policy is not overly restrictive.
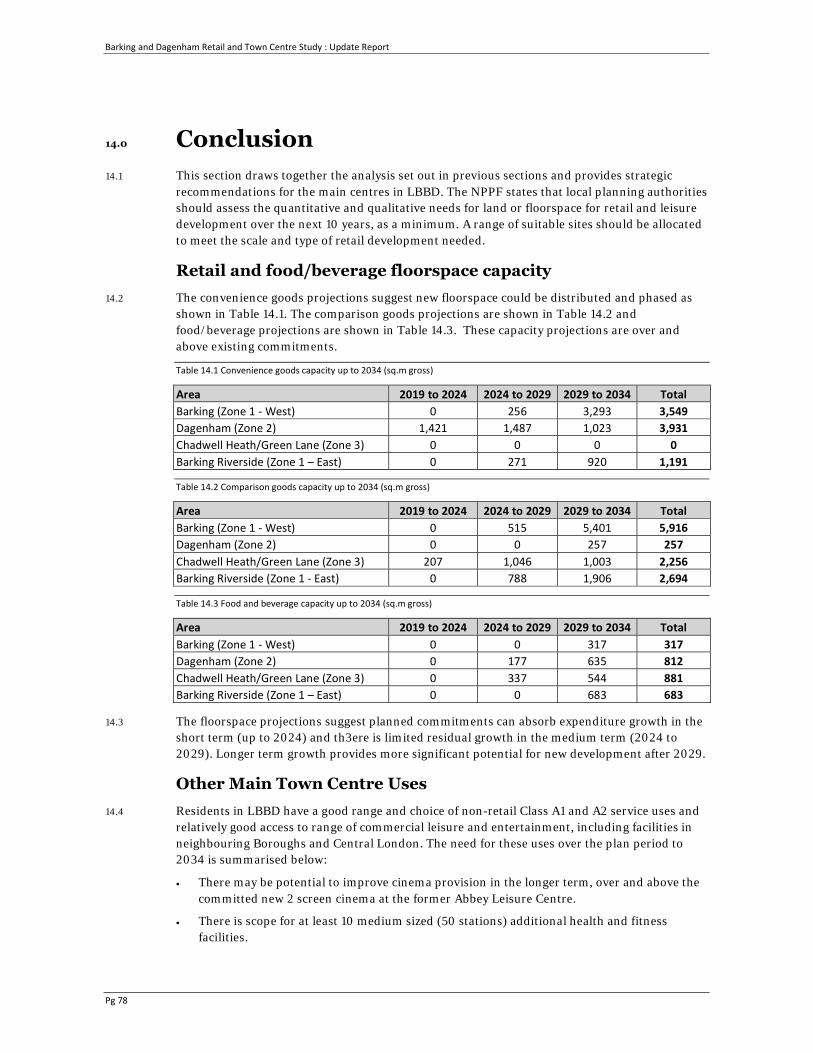
Barking and Dagenham Retail and Town Centre Study : Update Report
Pg 78
14.0 Conclusion 14.1 This section draws together the analysis set out in previous sections and provides strategic
recommendations for the main centres in LBBD. The NPPF states that local planning authorities should assess the quantitative and qualitative needs for land or floorspace for retail and leisure development over the next 10 years, as a minimum. A range of suitable sites should be allocated to meet the scale and type of retail development needed.
Retail and food/beverage floorspace capacity 14.2 The convenience goods projections suggest new floorspace could be distributed and phased as
shown in Table 14.1. The comparison goods projections are shown in Table 14.2 and food/beverage projections are shown in Table 14.3. These capacity projections are over and above existing commitments.
Table 14.1 Convenience goods capacity up to 2034 (sq.m gross)
Area 2019 to 2024 2024 to 2029 2029 to 2034 TotalBarking (Zone 1 - West) 0 256 3,293 3,549 Dagenham (Zone 2) 1,421 1,487 1,023 3,931 Chadwell Heath/Green Lane (Zone 3) 0 0 0 0 Barking Riverside (Zone 1 – East) 0 271 920 1,191
Table 14.2 Comparison goods capacity up to 2034 (sq.m gross)
Area 2019 to 2024 2024 to 2029 2029 to 2034 Total Barking (Zone 1 - West) 0 515 5,401 5,916 Dagenham (Zone 2) 0 0 257 257 Chadwell Heath/Green Lane (Zone 3) 207 1,046 1,003 2,256Barking Riverside (Zone 1 - East) 0 788 1,906 2,694
Table 14.3 Food and beverage capacity up to 2034 (sq.m gross)
Area 2019 to 2024 2024 to 2029 2029 to 2034 Total Barking (Zone 1 - West) 0 0 317 317Dagenham (Zone 2) 0 177 635 812 Chadwell Heath/Green Lane (Zone 3) 0 337 544 881 Barking Riverside (Zone 1 – East) 0 0 683 683
14.3 The floorspace projections suggest planned commitments can absorb expenditure growth in the short term (up to 2024) and th3ere is limited residual growth in the medium term (2024 to 2029). Longer term growth provides more significant potential for new development after 2029.
Other Main Town Centre Uses 14.4 Residents in LBBD have a good range and choice of non-retail Class A1 and A2 service uses and
relatively good access to range of commercial leisure and entertainment, including facilities in neighbouring Boroughs and Central London. The need for these uses over the plan period to 2034 is summarised below:
• There may be potential to improve cinema provision in the longer term, over and above the committed new 2 screen cinema at the former Abbey Leisure Centre.
• There is scope for at least 10 medium sized (50 stations) additional health and fitness facilities.
Barking and Dagenham Retail and Town Centre Study : Update Report
Pg 79
• In line with the Faith Groups and Meeting Places study there is a need for new community and cultural uses.
• There is not considered to be a clear need for additional hotel, theatre, tenpin bowling or bingo provision in the Borough.
14.5 The strategy for LBBD should be flexible to respond to any emerging opportunities. This could include other uses such as nightclubs, museums, art galleries, exhibition space, live music venues, clubs, casinos, tourist attractions and new emerging leisure activities.
Strategy for Accommodating Growth 14.6 The floorspace projections shown in this study provide broad guidance. The short-term priority
should be the reoccupation of vacant floorspace in designated centres and the implementation of commitments. Reoccupied vacant shop units in total could accommodate up to 3,400 sq.m gross. If this reduction in vacant units can be achieved, then the overall Class A1 to A5 floorspace projections for LBBD could reduce from about 21,300 sq.m gross to 17,900 sq.m gross.
14.7 Development opportunities in Barking should be capable of accommodating residual long-term growth, in particular the Barking Station area. Development at Barking Riverside and new district and neighbourhood centres at Castle Green and Thames Road will also absorb expenditure growth. Elsewhere small-scale development and intensification should absorb longer-term growth.
Policy Review 14.8 The NPPF minimum impact threshold of 2,500 sq.m gross continues to be inappropriate for
LBBD. The Council should consider reduced impact threshold of 500 sq.m gross, which is consistent with the retail floorspace projections within each study area zone.
14.9 The town centre hierarchy is appropriately defined in Core Strategy Policy CM5 and the extent of town, district and neighbourhood centres is shown on the Proposals Map. This approach remains consistent with the NPPF.
14.10 The amalgamation of Merry Fiddlers, Whalebone Lane South and Althorne Way neighbourhood centres to form one designated centre should be considered, perhaps to create a new district centre. New commercial units at Gascoigne should be included as a neighbourhood centre.
14.11 In Barking town centre future policy should continue to define a centre boundary and primary shopping area. The emerging plan proposals map should show all centre boundary and frontage designations for Dagenham Heathway, Chadwell Heath and Green Lane and neighbourhood centres. The continued need for, and extent of primary and secondary frontages should be considered within the new LBBD Local Plan.
14.12 In Barking town centre the existing town centre boundary could be extended to the north east to include the commercial units which are in the undefined shopping frontage, and the new Asda development on London Road/North Street could be included within the primary shopping frontage. The non-A1 threshold in the primary shopping area has been breached. The threshold could be increased to 30%, to provide some additional flexibility. A more flexible approach could be also adopted in the secondary frontages e.g. with a threshold increase from 30% to 50%. Alternatively, a criteria based policy approach could be adopted to provide more flexibility.
14.13 Within the three district centres a more flexible approach could be adopted e.g. increasing the maximum threshold from 35% to 50%, or a criteria based policy approach.
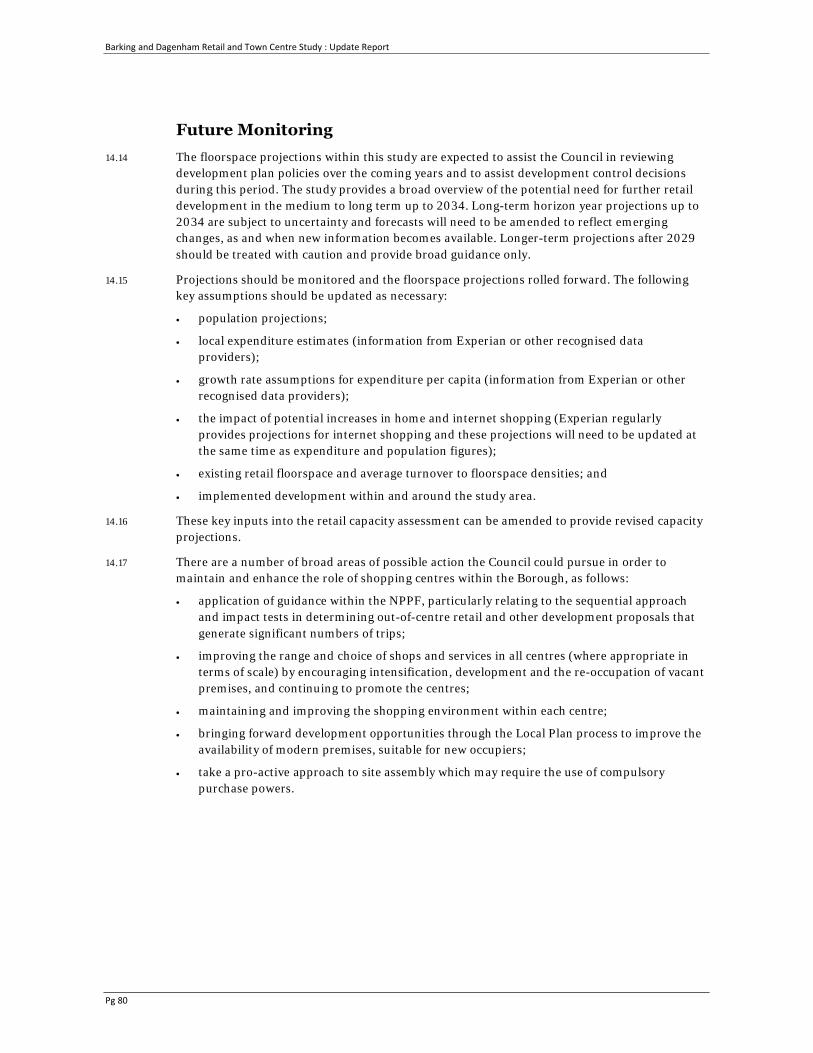
Barking and Dagenham Retail and Town Centre Study : Update Report
Pg 80
Future Monitoring 14.14 The floorspace projections within this study are expected to assist the Council in reviewing
development plan policies over the coming years and to assist development control decisions during this period. The study provides a broad overview of the potential need for further retail development in the medium to long term up to 2034. Long-term horizon year projections up to 2034 are subject to uncertainty and forecasts will need to be amended to reflect emerging changes, as and when new information becomes available. Longer-term projections after 2029 should be treated with caution and provide broad guidance only.
14.15 Projections should be monitored and the floorspace projections rolled forward. The following key assumptions should be updated as necessary:
• population projections;
• local expenditure estimates (information from Experian or other recognised data providers);
• growth rate assumptions for expenditure per capita (information from Experian or other recognised data providers);
• the impact of potential increases in home and internet shopping (Experian regularly provides projections for internet shopping and these projections will need to be updated at the same time as expenditure and population figures);
• existing retail floorspace and average turnover to floorspace densities; and
• implemented development within and around the study area.
14.16 These key inputs into the retail capacity assessment can be amended to provide revised capacity projections.
14.17 There are a number of broad areas of possible action the Council could pursue in order to maintain and enhance the role of shopping centres within the Borough, as follows:
• application of guidance within the NPPF, particularly relating to the sequential approach and impact tests in determining out-of-centre retail and other development proposals that generate significant numbers of trips;
• improving the range and choice of shops and services in all centres (where appropriate in terms of scale) by encouraging intensification, development and the re-occupation of vacant premises, and continuing to promote the centres;
• maintaining and improving the shopping environment within each centre;
• bringing forward development opportunities through the Local Plan process to improve the availability of modern premises, suitable for new occupiers;
• take a pro-active approach to site assembly which may require the use of compulsory purchase powers.

Barking and Dagenham Retail and Town Centre Study: Appendix 1 Barking Goad Plan
Appendix 1 Barking Goad Plan

Barking and Dagenham Retail and Town Centre Study: Appendix 1 Barking Goad Plan
Barking and Dagenham Retail and Town Centre Study: Appendix 2 Dagenham Heathway Goad Plan
Appendix 2 Dagenham Heathway Goad Plan
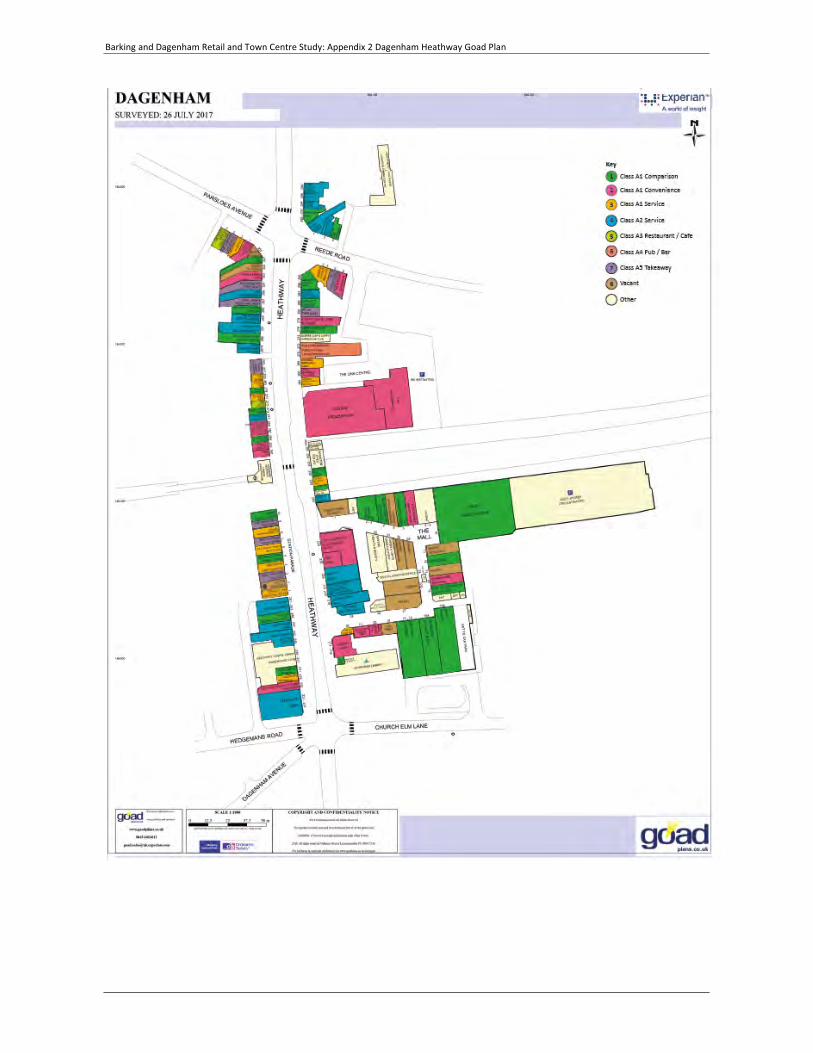
Barking and Dagenham Retail and Town Centre Study: Appendix 2 Dagenham Heathway Goad Plan

Barking and Dagenham Retail and Town Centre Study: Appendix 3 Chadwell Heath Goad Plan
Appendix 3 Chadwell Heath Goad Plan
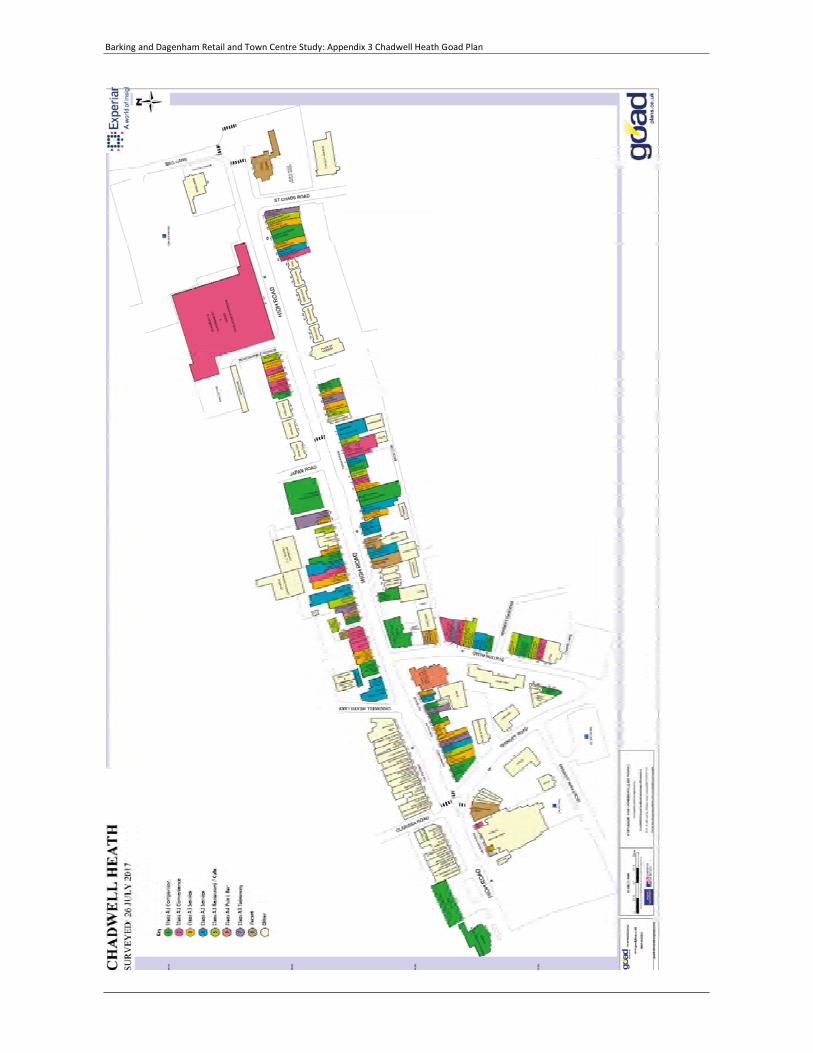
Barking and Dagenham Retail and Town Centre Study: Appendix 3 Chadwell Heath Goad Plan

Barking and Dagenham Retail and Town Centre Study: Appendix 4 Green Lane Goad Plan
Appendix 4 Green Lane Goad Plan
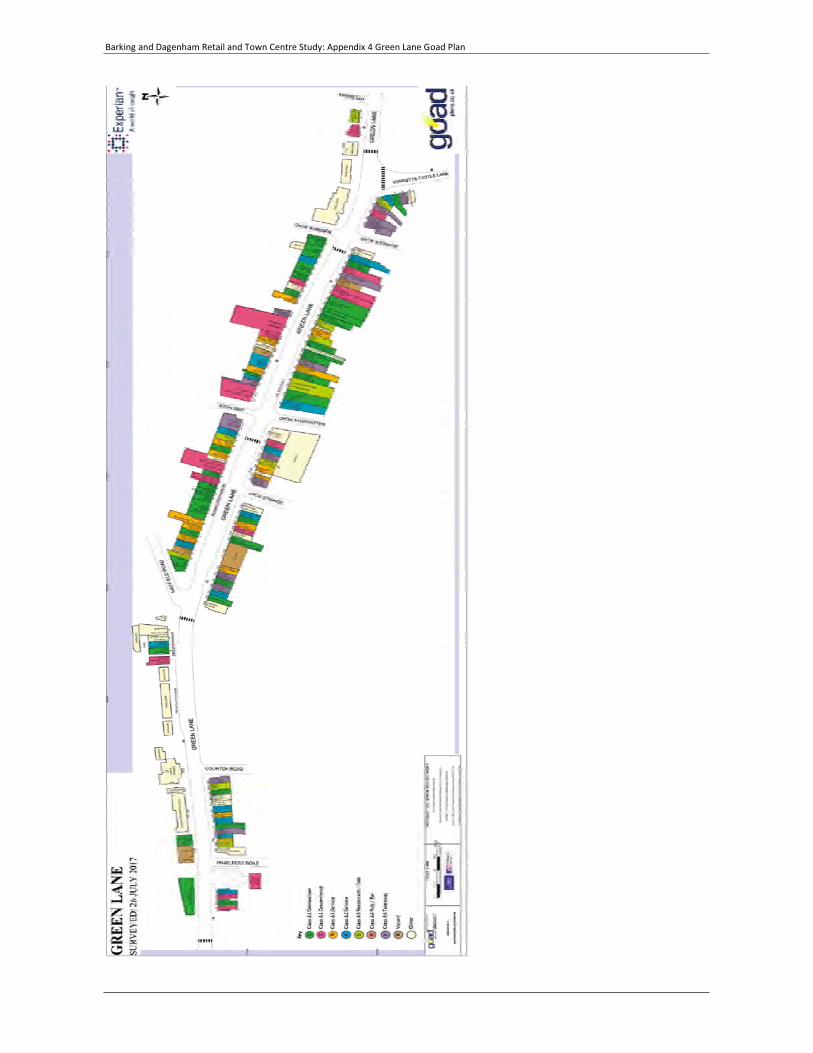
Barking and Dagenham Retail and Town Centre Study: Appendix 4 Green Lane Goad Plan

Barking and Dagenham Retail and Town Centre Study: Appendix 5 Methodology
Appendix 5 Methodology
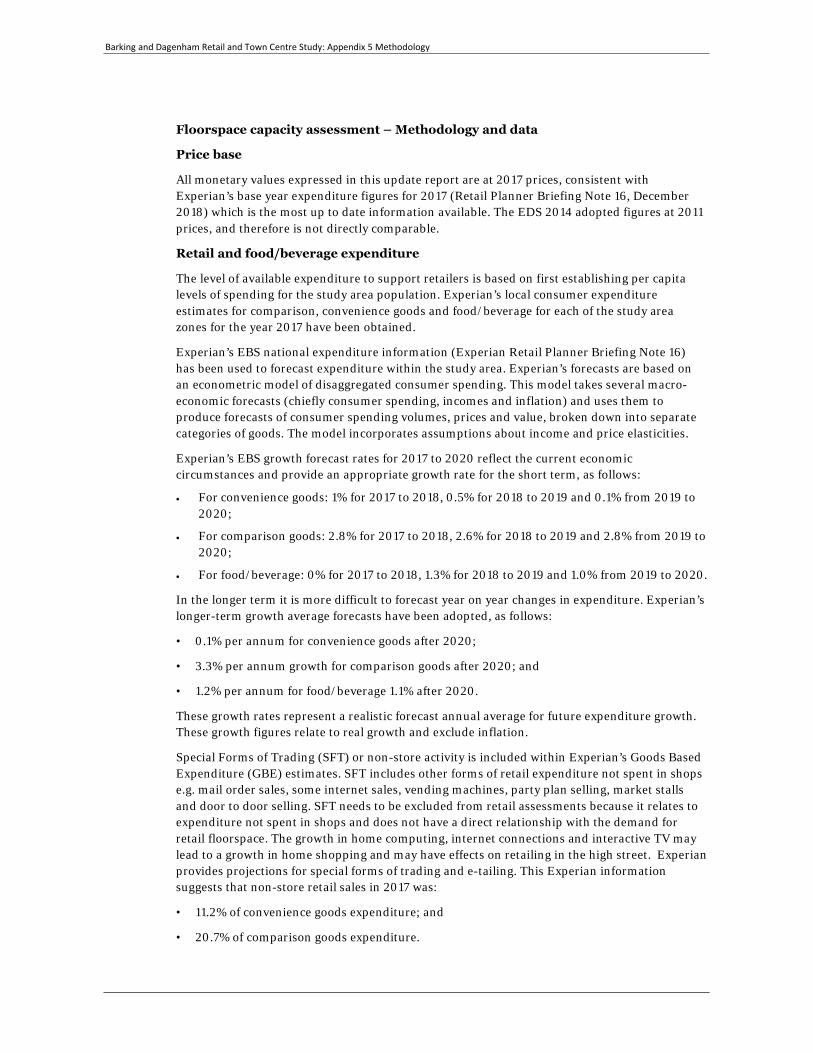
Barking and Dagenham Retail and Town Centre Study: Appendix 5 Methodology
Floorspace capacity assessment – Methodology and data
Price base
All monetary values expressed in this update report are at 2017 prices, consistent with Experian’s base year expenditure figures for 2017 (Retail Planner Briefing Note 16, December 2018) which is the most up to date information available. The EDS 2014 adopted figures at 2011 prices, and therefore is not directly comparable.
Retail and food/beverage expenditure
The level of available expenditure to support retailers is based on first establishing per capita levels of spending for the study area population. Experian’s local consumer expenditure estimates for comparison, convenience goods and food/beverage for each of the study area zones for the year 2017 have been obtained.
Experian’s EBS national expenditure information (Experian Retail Planner Briefing Note 16) has been used to forecast expenditure within the study area. Experian’s forecasts are based on an econometric model of disaggregated consumer spending. This model takes several macro-economic forecasts (chiefly consumer spending, incomes and inflation) and uses them to produce forecasts of consumer spending volumes, prices and value, broken down into separate categories of goods. The model incorporates assumptions about income and price elasticities.
Experian’s EBS growth forecast rates for 2017 to 2020 reflect the current economic circumstances and provide an appropriate growth rate for the short term, as follows:
• For convenience goods: 1% for 2017 to 2018, 0.5% for 2018 to 2019 and 0.1% from 2019 to 2020;
• For comparison goods: 2.8% for 2017 to 2018, 2.6% for 2018 to 2019 and 2.8% from 2019 to 2020;
• For food/beverage: 0% for 2017 to 2018, 1.3% for 2018 to 2019 and 1.0% from 2019 to 2020.
In the longer term it is more difficult to forecast year on year changes in expenditure. Experian’s longer-term growth average forecasts have been adopted, as follows:
• 0.1% per annum for convenience goods after 2020;
• 3.3% per annum growth for comparison goods after 2020; and
• 1.2% per annum for food/beverage 1.1% after 2020.
These growth rates represent a realistic forecast annual average for future expenditure growth. These growth figures relate to real growth and exclude inflation.
Special Forms of Trading (SFT) or non-store activity is included within Experian’s Goods Based Expenditure (GBE) estimates. SFT includes other forms of retail expenditure not spent in shops e.g. mail order sales, some internet sales, vending machines, party plan selling, market stalls and door to door selling. SFT needs to be excluded from retail assessments because it relates to expenditure not spent in shops and does not have a direct relationship with the demand for retail floorspace. The growth in home computing, internet connections and interactive TV may lead to a growth in home shopping and may have effects on retailing in the high street. Experian provides projections for special forms of trading and e-tailing. This Experian information suggests that non-store retail sales in 2017 was:
• 11.2% of convenience goods expenditure; and
• 20.7% of comparison goods expenditure.
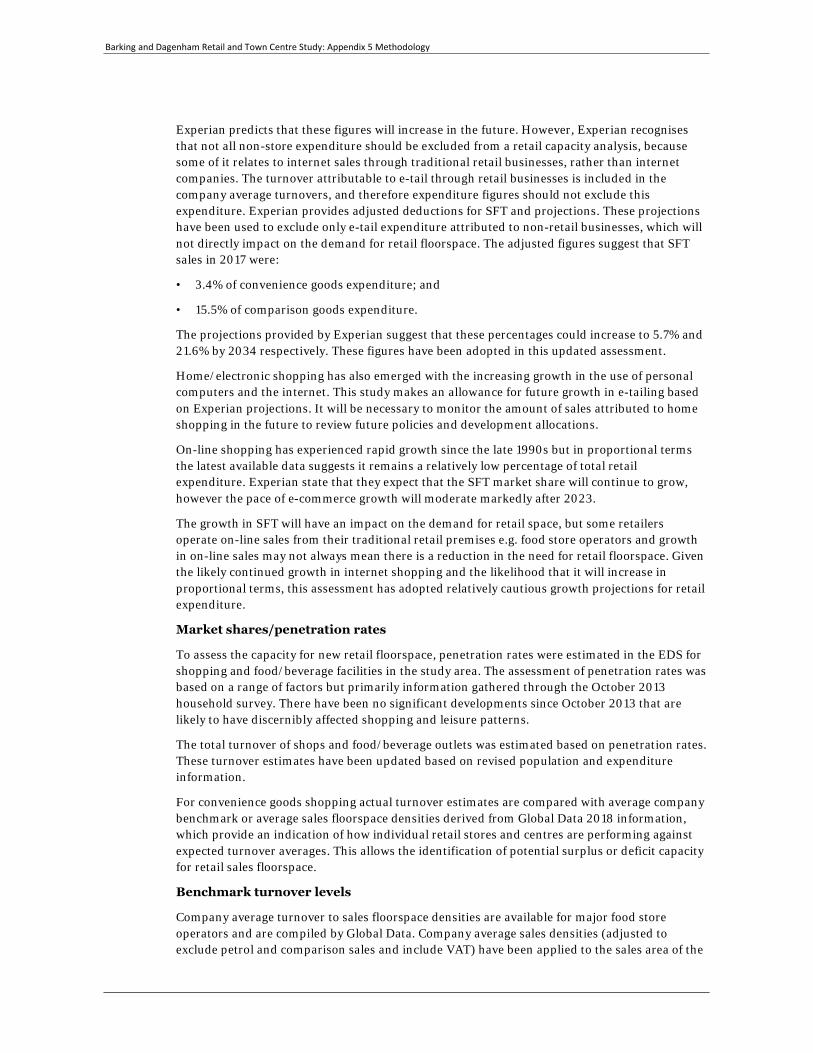
Barking and Dagenham Retail and Town Centre Study: Appendix 5 Methodology
Experian predicts that these figures will increase in the future. However, Experian recognises that not all non-store expenditure should be excluded from a retail capacity analysis, because some of it relates to internet sales through traditional retail businesses, rather than internet companies. The turnover attributable to e-tail through retail businesses is included in the company average turnovers, and therefore expenditure figures should not exclude this expenditure. Experian provides adjusted deductions for SFT and projections. These projections have been used to exclude only e-tail expenditure attributed to non-retail businesses, which will not directly impact on the demand for retail floorspace. The adjusted figures suggest that SFT sales in 2017 were:
• 3.4% of convenience goods expenditure; and
• 15.5% of comparison goods expenditure.
The projections provided by Experian suggest that these percentages could increase to 5.7% and 21.6% by 2034 respectively. These figures have been adopted in this updated assessment.
Home/electronic shopping has also emerged with the increasing growth in the use of personal computers and the internet. This study makes an allowance for future growth in e-tailing based on Experian projections. It will be necessary to monitor the amount of sales attributed to home shopping in the future to review future policies and development allocations.
On-line shopping has experienced rapid growth since the late 1990s but in proportional terms the latest available data suggests it remains a relatively low percentage of total retail expenditure. Experian state that they expect that the SFT market share will continue to grow, however the pace of e-commerce growth will moderate markedly after 2023.
The growth in SFT will have an impact on the demand for retail space, but some retailers operate on-line sales from their traditional retail premises e.g. food store operators and growth in on-line sales may not always mean there is a reduction in the need for retail floorspace. Given the likely continued growth in internet shopping and the likelihood that it will increase in proportional terms, this assessment has adopted relatively cautious growth projections for retail expenditure.
Market shares/penetration rates
To assess the capacity for new retail floorspace, penetration rates were estimated in the EDS for shopping and food/beverage facilities in the study area. The assessment of penetration rates was based on a range of factors but primarily information gathered through the October 2013 household survey. There have been no significant developments since October 2013 that are likely to have discernibly affected shopping and leisure patterns.
The total turnover of shops and food/beverage outlets was estimated based on penetration rates. These turnover estimates have been updated based on revised population and expenditure information.
For convenience goods shopping actual turnover estimates are compared with average company benchmark or average sales floorspace densities derived from Global Data 2018 information, which provide an indication of how individual retail stores and centres are performing against expected turnover averages. This allows the identification of potential surplus or deficit capacity for retail sales floorspace.
Benchmark turnover levels
Company average turnover to sales floorspace densities are available for major food store operators and are compiled by Global Data. Company average sales densities (adjusted to exclude petrol and comparison sales and include VAT) have been applied to the sales area of the
Barking and Dagenham Retail and Town Centre Study: Appendix 5 Methodology
large food stores, and a benchmark turnover for each store has been calculated. This benchmark turnover is not necessarily the actual turnover of the food store, but it does provide a useful benchmark for assessing existing shopping patterns and the adequacy of current floorspace in quantitative terms.
Recent changes in convenience goods sales areas since the EDS was produced have been derived from the Institute of Oxford Retail Consultants (ORC) StorePoint database. Estimates for comparison sales floorspace within large food stores has been deducted, for consistency with the use of goods based expenditure figures.
Average sales densities are not widely available for small convenience shops, particularly independent retailers. Based on the mix of shops present in each centre and Lichfields’ experience of trading levels of small independent shops informed by household shopper surveys elsewhere, an average sales density of £5,000 per sq.m net for convenience shops/stores was adopted in the EDS. This has been inflated to £6,000 per sq.m net to reflect the change in 2011 to 2017 prices in this report and growth in turnover efficiencies.
Increases in turnover densities
Experian’s Retail Planner Briefing Note 16, December 2018 indicates comparison goods retail sales floorspace is expected to increase its sales density by 3.7% during in 2017 to 2018; 2.1% in 2018 to 2019; 2.1% in 2019 to 2020; 2.5% in 2020 to 2021; 2.8% per annum between 2021 and 2025; and 2.3% beyond 2025. These increases have been adopted and will absorb some of the future expenditure growth.
For convenience goods, Experian indicates sales floorspace is expected to increase its sales density by 0.7% during in 2017 to 2018; 0% in 2018 to 2019; 0.7% in 2019 to 2020; 0.4% in 2020 to 2021; 0.2% per annum between 2021 and 2025; and 0% beyond 2025.
Experian does not provide projections for food and beverage sales densities. An average growth rate of 0.5% per annum has been adopted, consistent with the EDS.


Barking and Dagenham Retail and Town Centre Study: Appendix 6 Study Area
Appendix 6 Study Area
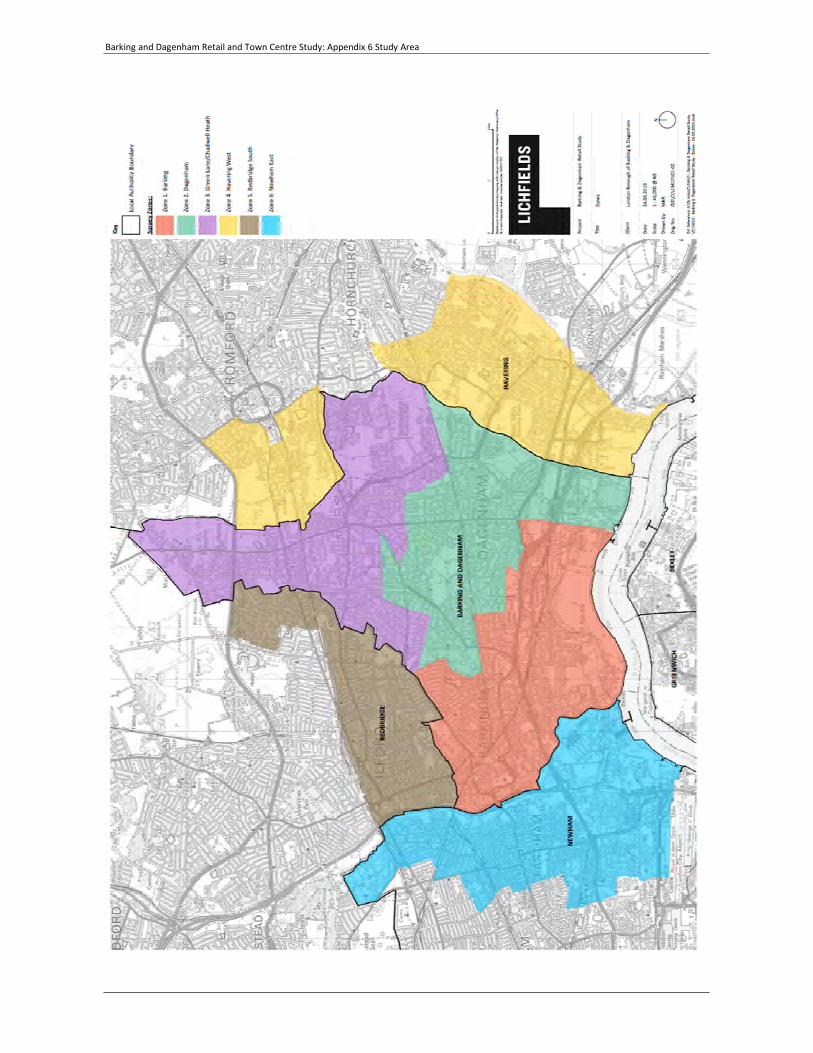
Barking and Dagenham Retail and Town Centre Study: Appendix 6 Study Area

Barking and Dagenham Retail and Town Centre Study: Appendix 7 Convenience Goods Capacity
Appendix 7 Convenience Goods Capacity

Barking and Dagenham Retail and Town Centre Study: Appendix 7 Convenience Goods Capacity
Table 1: Study Area Population
2019 2024 2029 2034
Zone 1 - Barking 71,490 85,836 100,298 128,746
Zone 2 - Dagenham 69,162 71,238 78,995 79,975
Zone 3 - Green Lane/Chadwell Heath 74,205 72,263 74,205 76,948
Zone 4 - Havering West 48,299 56,899 62,624 64,706
Zone 5 - Redbridge South 82,749 92,275 95,592 99,206
Zone 6 - Newham East 99,076 97,594 109,765 117,844
Total 444,981 476,105 521,479 567,425
Sources: GLA 2016 Round of Demographic Projections - SHLAA-based ward projections
Table 2: Convenience Goods Expenditure per person (£)
2019 2024 2029 2034
Zone 1 - Barking 1,722 1,714 1,714 1,717
Zone 2 - Dagenham 1,941 1,933 1,932 1,936
Zone 3 - Green Lane/Chadwell Heath 1,911 1,902 1,902 1,905
Zone 4 - Havering West 1,981 1,972 1,972 1,975
Zone 5 - Redbridge South 1,633 1,626 1,626 1,628
Zone 6 - Newham East 1,527 1,520 1,520 1,523
Sources: Experian 2017Growth Rates: +12.5% 2018-2022, 3.3% per annum between 2022-2025 and 3.3% per annum beyond 2025 Data in 2017 prices Excludes Special Forms of Trading
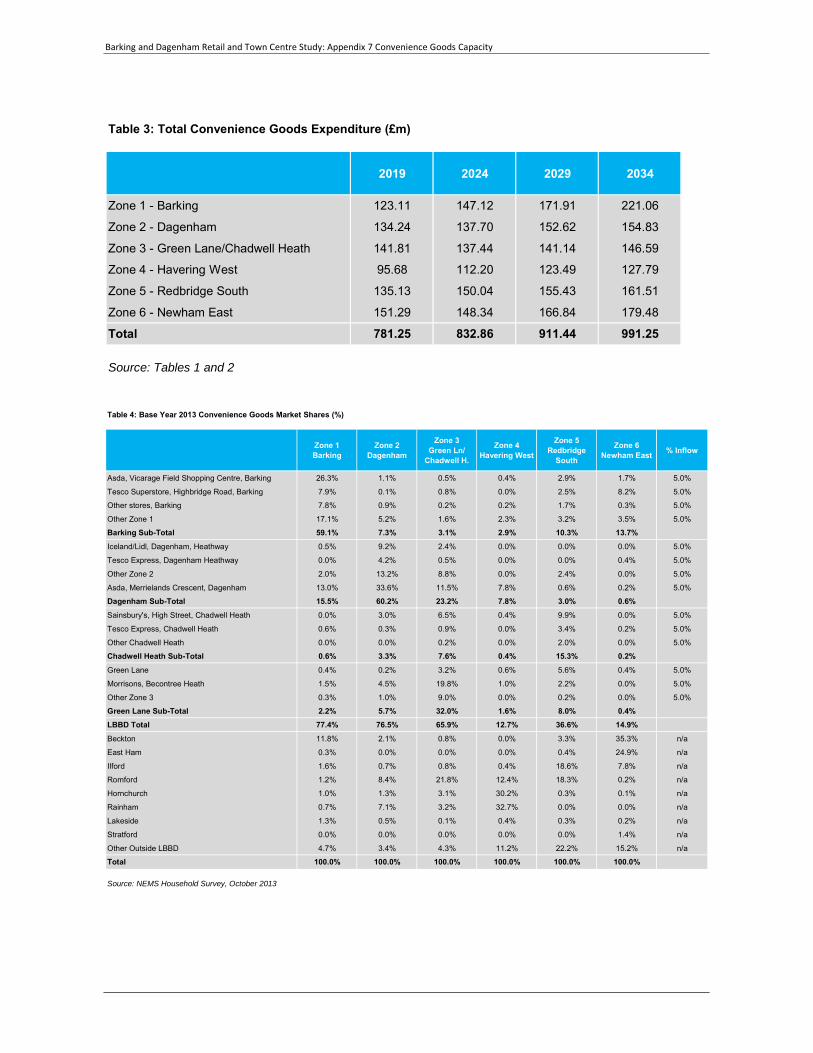
Barking and Dagenham Retail and Town Centre Study: Appendix 7 Convenience Goods Capacity
Table 3: Total Convenience Goods Expenditure (£m)
2019 2024 2029 2034
Zone 1 - Barking 123.11 147.12 171.91 221.06
Zone 2 - Dagenham 134.24 137.70 152.62 154.83
Zone 3 - Green Lane/Chadwell Heath 141.81 137.44 141.14 146.59
Zone 4 - Havering West 95.68 112.20 123.49 127.79
Zone 5 - Redbridge South 135.13 150.04 155.43 161.51
Zone 6 - Newham East 151.29 148.34 166.84 179.48
Total 781.25 832.86 911.44 991.25
Source: Tables 1 and 2
Table 4: Base Year 2013 Convenience Goods Market Shares (%)
Zone 1Barking
Zone 2Dagenham
Zone 3Green Ln/
Chadwell H.
Zone 4Havering West
Zone 5Redbridge
South
Zone 6Newham East % Inflow
Asda, Vicarage Field Shopping Centre, Barking 26.3% 1.1% 0.5% 0.4% 2.9% 1.7% 5.0%
Tesco Superstore, Highbridge Road, Barking 7.9% 0.1% 0.8% 0.0% 2.5% 8.2% 5.0%
Other stores, Barking 7.8% 0.9% 0.2% 0.2% 1.7% 0.3% 5.0%
Other Zone 1 17.1% 5.2% 1.6% 2.3% 3.2% 3.5% 5.0%
Barking Sub-Total 59.1% 7.3% 3.1% 2.9% 10.3% 13.7%Iceland/Lidl, Dagenham, Heathway 0.5% 9.2% 2.4% 0.0% 0.0% 0.0% 5.0%
Tesco Express, Dagenham Heathway 0.0% 4.2% 0.5% 0.0% 0.0% 0.4% 5.0%
Other Zone 2 2.0% 13.2% 8.8% 0.0% 2.4% 0.0% 5.0%
Asda, Merrielands Crescent, Dagenham 13.0% 33.6% 11.5% 7.8% 0.6% 0.2% 5.0%
Dagenham Sub-Total 15.5% 60.2% 23.2% 7.8% 3.0% 0.6%Sainsbury's, High Street, Chadwell Heath 0.0% 3.0% 6.5% 0.4% 9.9% 0.0% 5.0%
Tesco Express, Chadwell Heath 0.6% 0.3% 0.9% 0.0% 3.4% 0.2% 5.0%
Other Chadwell Heath 0.0% 0.0% 0.2% 0.0% 2.0% 0.0% 5.0%
Chadwell Heath Sub-Total 0.6% 3.3% 7.6% 0.4% 15.3% 0.2%Green Lane 0.4% 0.2% 3.2% 0.6% 5.6% 0.4% 5.0%
Morrisons, Becontree Heath 1.5% 4.5% 19.8% 1.0% 2.2% 0.0% 5.0%
Other Zone 3 0.3% 1.0% 9.0% 0.0% 0.2% 0.0% 5.0%
Green Lane Sub-Total 2.2% 5.7% 32.0% 1.6% 8.0% 0.4%LBBD Total 77.4% 76.5% 65.9% 12.7% 36.6% 14.9%Beckton 11.8% 2.1% 0.8% 0.0% 3.3% 35.3% n/a
East Ham 0.3% 0.0% 0.0% 0.0% 0.4% 24.9% n/a
Ilford 1.6% 0.7% 0.8% 0.4% 18.6% 7.8% n/a
Romford 1.2% 8.4% 21.8% 12.4% 18.3% 0.2% n/a
Hornchurch 1.0% 1.3% 3.1% 30.2% 0.3% 0.1% n/a
Rainham 0.7% 7.1% 3.2% 32.7% 0.0% 0.0% n/a
Lakeside 1.3% 0.5% 0.1% 0.4% 0.3% 0.2% n/a
Stratford 0.0% 0.0% 0.0% 0.0% 0.0% 1.4% n/a
Other Outside LBBD 4.7% 3.4% 4.3% 11.2% 22.2% 15.2% n/a
Total 100.0% 100.0% 100.0% 100.0% 100.0% 100.0%
Source: NEMS Household Survey, October 2013
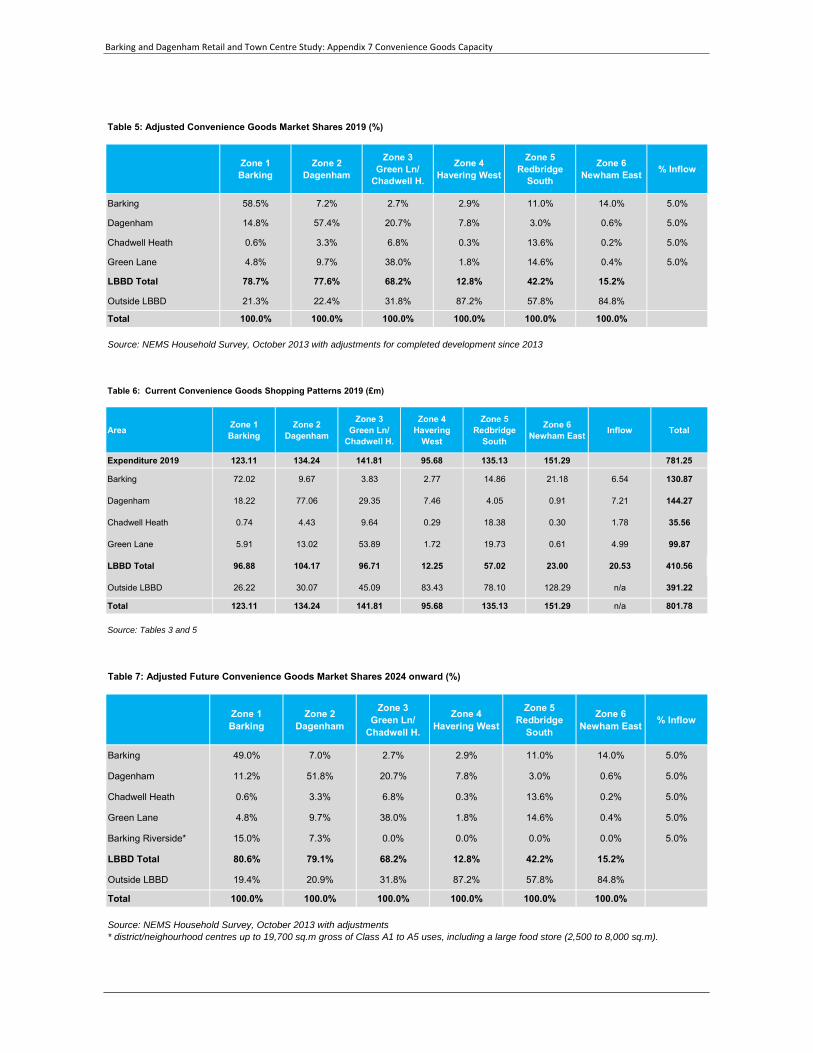
Barking and Dagenham Retail and Town Centre Study: Appendix 7 Convenience Goods Capacity
Table 5: Adjusted Convenience Goods Market Shares 2019 (%)
Zone 1Barking
Zone 2Dagenham
Zone 3Green Ln/
Chadwell H.
Zone 4Havering West
Zone 5Redbridge
South
Zone 6Newham East % Inflow
Barking 58.5% 7.2% 2.7% 2.9% 11.0% 14.0% 5.0%
Dagenham 14.8% 57.4% 20.7% 7.8% 3.0% 0.6% 5.0%
Chadwell Heath 0.6% 3.3% 6.8% 0.3% 13.6% 0.2% 5.0%
Green Lane 4.8% 9.7% 38.0% 1.8% 14.6% 0.4% 5.0%
LBBD Total 78.7% 77.6% 68.2% 12.8% 42.2% 15.2%
Outside LBBD 21.3% 22.4% 31.8% 87.2% 57.8% 84.8%
Total 100.0% 100.0% 100.0% 100.0% 100.0% 100.0%
Source: NEMS Household Survey, October 2013 with adjustments for completed development since 2013
Table 6: Current Convenience Goods Shopping Patterns 2019 (£m)
Area Zone 1Barking
Zone 2Dagenham
Zone 3Green Ln/
Chadwell H.
Zone 4Havering
West
Zone 5Redbridge
South
Zone 6Newham East Inflow Total
Expenditure 2019 123.11 134.24 141.81 95.68 135.13 151.29 781.25
Barking 72.02 9.67 3.83 2.77 14.86 21.18 6.54 130.87
Dagenham 18.22 77.06 29.35 7.46 4.05 0.91 7.21 144.27
Chadwell Heath 0.74 4.43 9.64 0.29 18.38 0.30 1.78 35.56
Green Lane 5.91 13.02 53.89 1.72 19.73 0.61 4.99 99.87
LBBD Total 96.88 104.17 96.71 12.25 57.02 23.00 20.53 410.56
Outside LBBD 26.22 30.07 45.09 83.43 78.10 128.29 n/a 391.22
Total 123.11 134.24 141.81 95.68 135.13 151.29 n/a 801.78
Source: Tables 3 and 5
Table 7: Adjusted Future Convenience Goods Market Shares 2024 onward (%)
Zone 1Barking
Zone 2Dagenham
Zone 3Green Ln/
Chadwell H.
Zone 4Havering West
Zone 5Redbridge
South
Zone 6Newham East % Inflow
Barking 49.0% 7.0% 2.7% 2.9% 11.0% 14.0% 5.0%
Dagenham 11.2% 51.8% 20.7% 7.8% 3.0% 0.6% 5.0%
Chadwell Heath 0.6% 3.3% 6.8% 0.3% 13.6% 0.2% 5.0%
Green Lane 4.8% 9.7% 38.0% 1.8% 14.6% 0.4% 5.0%
Barking Riverside* 15.0% 7.3% 0.0% 0.0% 0.0% 0.0% 5.0%
LBBD Total 80.6% 79.1% 68.2% 12.8% 42.2% 15.2%
Outside LBBD 19.4% 20.9% 31.8% 87.2% 57.8% 84.8%
Total 100.0% 100.0% 100.0% 100.0% 100.0% 100.0%
Source: NEMS Household Survey, October 2013 with adjustments* district/neighourhood centres up to 19,700 sq.m gross of Class A1 to A5 uses, including a large food store (2,500 to 8,000 sq.m).
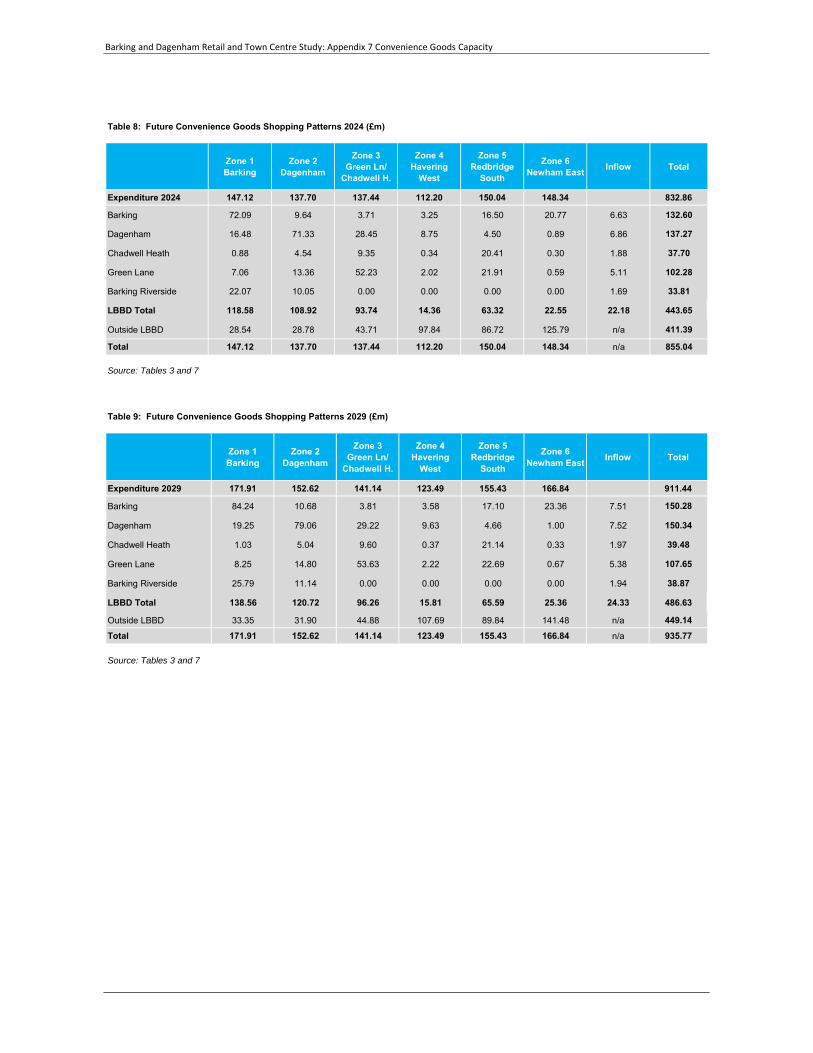
Barking and Dagenham Retail and Town Centre Study: Appendix 7 Convenience Goods Capacity
Table 8: Future Convenience Goods Shopping Patterns 2024 (£m)
Zone 1Barking
Zone 2Dagenham
Zone 3Green Ln/
Chadwell H.
Zone 4Havering
West
Zone 5Redbridge
South
Zone 6Newham East Inflow Total
Expenditure 2024 147.12 137.70 137.44 112.20 150.04 148.34 832.86
Barking 72.09 9.64 3.71 3.25 16.50 20.77 6.63 132.60
Dagenham 16.48 71.33 28.45 8.75 4.50 0.89 6.86 137.27
Chadwell Heath 0.88 4.54 9.35 0.34 20.41 0.30 1.88 37.70
Green Lane 7.06 13.36 52.23 2.02 21.91 0.59 5.11 102.28
Barking Riverside 22.07 10.05 0.00 0.00 0.00 0.00 1.69 33.81
LBBD Total 118.58 108.92 93.74 14.36 63.32 22.55 22.18 443.65
Outside LBBD 28.54 28.78 43.71 97.84 86.72 125.79 n/a 411.39
Total 147.12 137.70 137.44 112.20 150.04 148.34 n/a 855.04
Source: Tables 3 and 7
Table 9: Future Convenience Goods Shopping Patterns 2029 (£m)
Zone 1Barking
Zone 2Dagenham
Zone 3Green Ln/
Chadwell H.
Zone 4Havering
West
Zone 5Redbridge
South
Zone 6Newham East Inflow Total
Expenditure 2029 171.91 152.62 141.14 123.49 155.43 166.84 911.44
Barking 84.24 10.68 3.81 3.58 17.10 23.36 7.51 150.28
Dagenham 19.25 79.06 29.22 9.63 4.66 1.00 7.52 150.34
Chadwell Heath 1.03 5.04 9.60 0.37 21.14 0.33 1.97 39.48
Green Lane 8.25 14.80 53.63 2.22 22.69 0.67 5.38 107.65
Barking Riverside 25.79 11.14 0.00 0.00 0.00 0.00 1.94 38.87
LBBD Total 138.56 120.72 96.26 15.81 65.59 25.36 24.33 486.63
Outside LBBD 33.35 31.90 44.88 107.69 89.84 141.48 n/a 449.14Total 171.91 152.62 141.14 123.49 155.43 166.84 n/a 935.77
Source: Tables 3 and 7
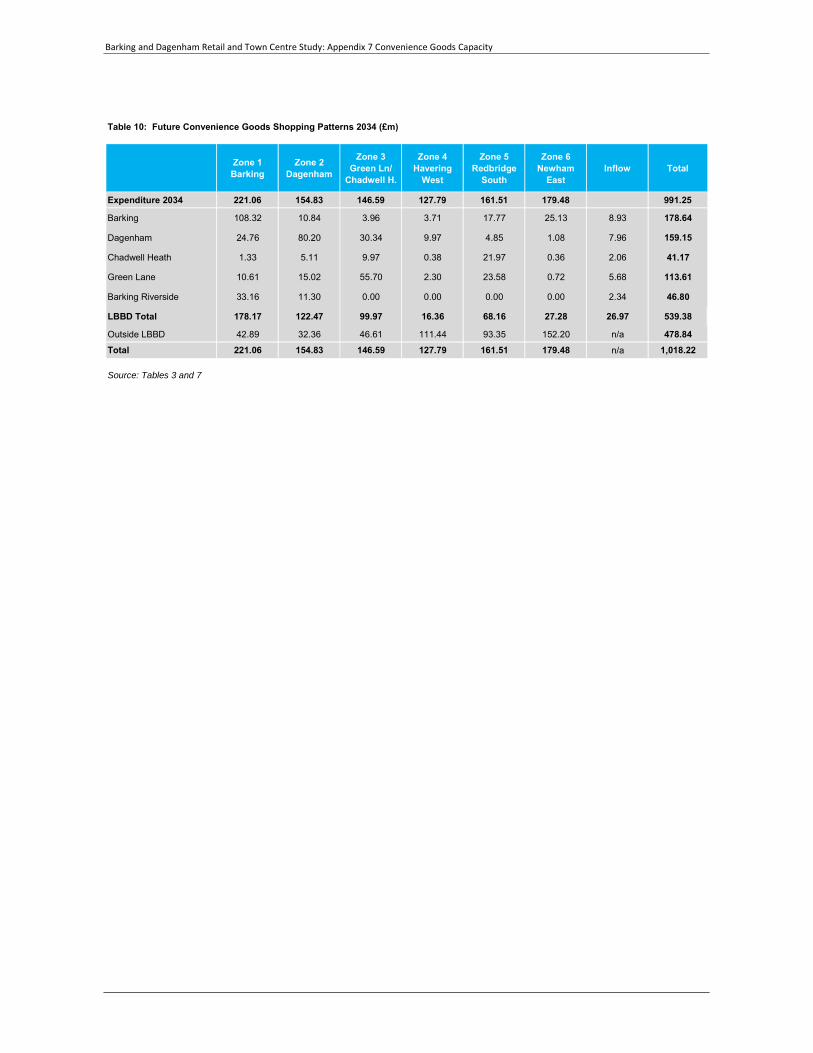
Barking and Dagenham Retail and Town Centre Study: Appendix 7 Convenience Goods Capacity
Table 10: Future Convenience Goods Shopping Patterns 2034 (£m)
Zone 1Barking
Zone 2Dagenham
Zone 3Green Ln/
Chadwell H.
Zone 4Havering
West
Zone 5Redbridge
South
Zone 6Newham
EastInflow Total
Expenditure 2034 221.06 154.83 146.59 127.79 161.51 179.48 991.25
Barking 108.32 10.84 3.96 3.71 17.77 25.13 8.93 178.64
Dagenham 24.76 80.20 30.34 9.97 4.85 1.08 7.96 159.15
Chadwell Heath 1.33 5.11 9.97 0.38 21.97 0.36 2.06 41.17
Green Lane 10.61 15.02 55.70 2.30 23.58 0.72 5.68 113.61
Barking Riverside 33.16 11.30 0.00 0.00 0.00 0.00 2.34 46.80
LBBD Total 178.17 122.47 99.97 16.36 68.16 27.28 26.97 539.38
Outside LBBD 42.89 32.36 46.61 111.44 93.35 152.20 n/a 478.84Total 221.06 154.83 146.59 127.79 161.51 179.48 n/a 1,018.22
Source: Tables 3 and 7
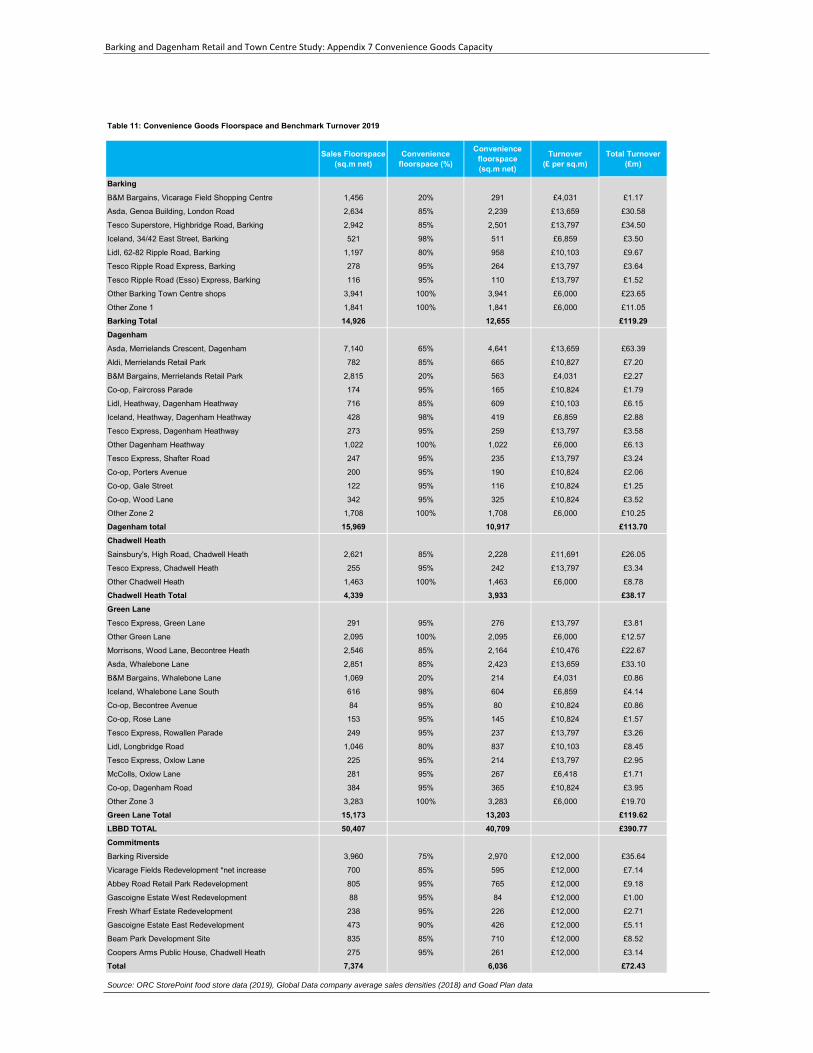
Barking and Dagenham Retail and Town Centre Study: Appendix 7 Convenience Goods Capacity
Table 11: Convenience Goods Floorspace and Benchmark Turnover 2019
Sales Floorspace (sq.m net)
Convenience floorspace (%)
Convenience floorspace (sq.m net)
Turnover(£ per sq.m)
Total Turnover(£m)
BarkingB&M Bargains, Vicarage Field Shopping Centre 1,456 20% 291 £4,031 £1.17
Asda, Genoa Building, London Road 2,634 85% 2,239 £13,659 £30.58
Tesco Superstore, Highbridge Road, Barking 2,942 85% 2,501 £13,797 £34.50
Iceland, 34/42 East Street, Barking 521 98% 511 £6,859 £3.50
Lidl, 62-82 Ripple Road, Barking 1,197 80% 958 £10,103 £9.67
Tesco Ripple Road Express, Barking 278 95% 264 £13,797 £3.64
Tesco Ripple Road (Esso) Express, Barking 116 95% 110 £13,797 £1.52
Other Barking Town Centre shops 3,941 100% 3,941 £6,000 £23.65
Other Zone 1 1,841 100% 1,841 £6,000 £11.05
Barking Total 14,926 12,655 £119.29DagenhamAsda, Merrielands Crescent, Dagenham 7,140 65% 4,641 £13,659 £63.39
Aldi, Merrielands Retail Park 782 85% 665 £10,827 £7.20
B&M Bargains, Merrielands Retail Park 2,815 20% 563 £4,031 £2.27
Co-op, Faircross Parade 174 95% 165 £10,824 £1.79
Lidl, Heathway, Dagenham Heathway 716 85% 609 £10,103 £6.15
Iceland, Heathway, Dagenham Heathway 428 98% 419 £6,859 £2.88
Tesco Express, Dagenham Heathway 273 95% 259 £13,797 £3.58
Other Dagenham Heathway 1,022 100% 1,022 £6,000 £6.13
Tesco Express, Shafter Road 247 95% 235 £13,797 £3.24
Co-op, Porters Avenue 200 95% 190 £10,824 £2.06
Co-op, Gale Street 122 95% 116 £10,824 £1.25
Co-op, Wood Lane 342 95% 325 £10,824 £3.52
Other Zone 2 1,708 100% 1,708 £6,000 £10.25
Dagenham total 15,969 10,917 £113.70Chadwell HeathSainsbury's, High Road, Chadwell Heath 2,621 85% 2,228 £11,691 £26.05
Tesco Express, Chadwell Heath 255 95% 242 £13,797 £3.34
Other Chadwell Heath 1,463 100% 1,463 £6,000 £8.78
Chadwell Heath Total 4,339 3,933 £38.17Green LaneTesco Express, Green Lane 291 95% 276 £13,797 £3.81
Other Green Lane 2,095 100% 2,095 £6,000 £12.57
Morrisons, Wood Lane, Becontree Heath 2,546 85% 2,164 £10,476 £22.67
Asda, Whalebone Lane 2,851 85% 2,423 £13,659 £33.10
B&M Bargains, Whalebone Lane 1,069 20% 214 £4,031 £0.86
Iceland, Whalebone Lane South 616 98% 604 £6,859 £4.14
Co-op, Becontree Avenue 84 95% 80 £10,824 £0.86
Co-op, Rose Lane 153 95% 145 £10,824 £1.57
Tesco Express, Rowallen Parade 249 95% 237 £13,797 £3.26
Lidl, Longbridge Road 1,046 80% 837 £10,103 £8.45
Tesco Express, Oxlow Lane 225 95% 214 £13,797 £2.95
McColls, Oxlow Lane 281 95% 267 £6,418 £1.71
Co-op, Dagenham Road 384 95% 365 £10,824 £3.95
Other Zone 3 3,283 100% 3,283 £6,000 £19.70
Green Lane Total 15,173 13,203 £119.62LBBD TOTAL 50,407 40,709 £390.77CommitmentsBarking Riverside 3,960 75% 2,970 £12,000 £35.64
Vicarage Fields Redevelopment *net increase 700 85% 595 £12,000 £7.14
Abbey Road Retail Park Redevelopment 805 95% 765 £12,000 £9.18
Gascoigne Estate West Redevelopment 88 95% 84 £12,000 £1.00
Fresh Wharf Estate Redevelopment 238 95% 226 £12,000 £2.71
Gascoigne Estate East Redevelopment 473 90% 426 £12,000 £5.11
Beam Park Development Site 835 85% 710 £12,000 £8.52
Coopers Arms Public House, Chadwell Heath 275 95% 261 £12,000 £3.14
Total 7,374 6,036 £72.43
Source: ORC StorePoint food store data (2019), Global Data company average sales densities (2018) and Goad Plan data
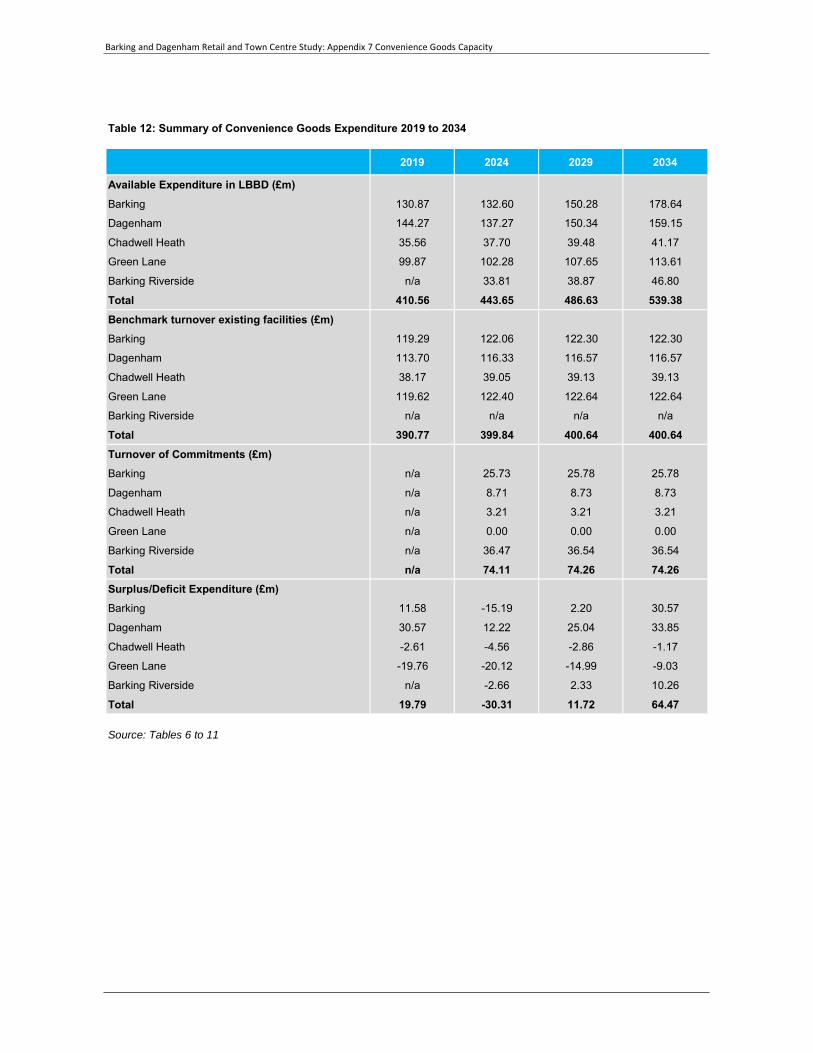
Barking and Dagenham Retail and Town Centre Study: Appendix 7 Convenience Goods Capacity
Table 12: Summary of Convenience Goods Expenditure 2019 to 2034
2019 2024 2029 2034
Available Expenditure in LBBD (£m)Barking 130.87 132.60 150.28 178.64
Dagenham 144.27 137.27 150.34 159.15
Chadwell Heath 35.56 37.70 39.48 41.17
Green Lane 99.87 102.28 107.65 113.61
Barking Riverside n/a 33.81 38.87 46.80
Total 410.56 443.65 486.63 539.38Benchmark turnover existing facilities (£m)Barking 119.29 122.06 122.30 122.30
Dagenham 113.70 116.33 116.57 116.57
Chadwell Heath 38.17 39.05 39.13 39.13
Green Lane 119.62 122.40 122.64 122.64
Barking Riverside n/a n/a n/a n/a
Total 390.77 399.84 400.64 400.64Turnover of Commitments (£m)Barking n/a 25.73 25.78 25.78
Dagenham n/a 8.71 8.73 8.73
Chadwell Heath n/a 3.21 3.21 3.21
Green Lane n/a 0.00 0.00 0.00
Barking Riverside n/a 36.47 36.54 36.54
Total n/a 74.11 74.26 74.26Surplus/Deficit Expenditure (£m)Barking 11.58 -15.19 2.20 30.57
Dagenham 30.57 12.22 25.04 33.85
Chadwell Heath -2.61 -4.56 -2.86 -1.17
Green Lane -19.76 -20.12 -14.99 -9.03
Barking Riverside n/a -2.66 2.33 10.26
Total 19.79 -30.31 11.72 64.47
Source: Tables 6 to 11
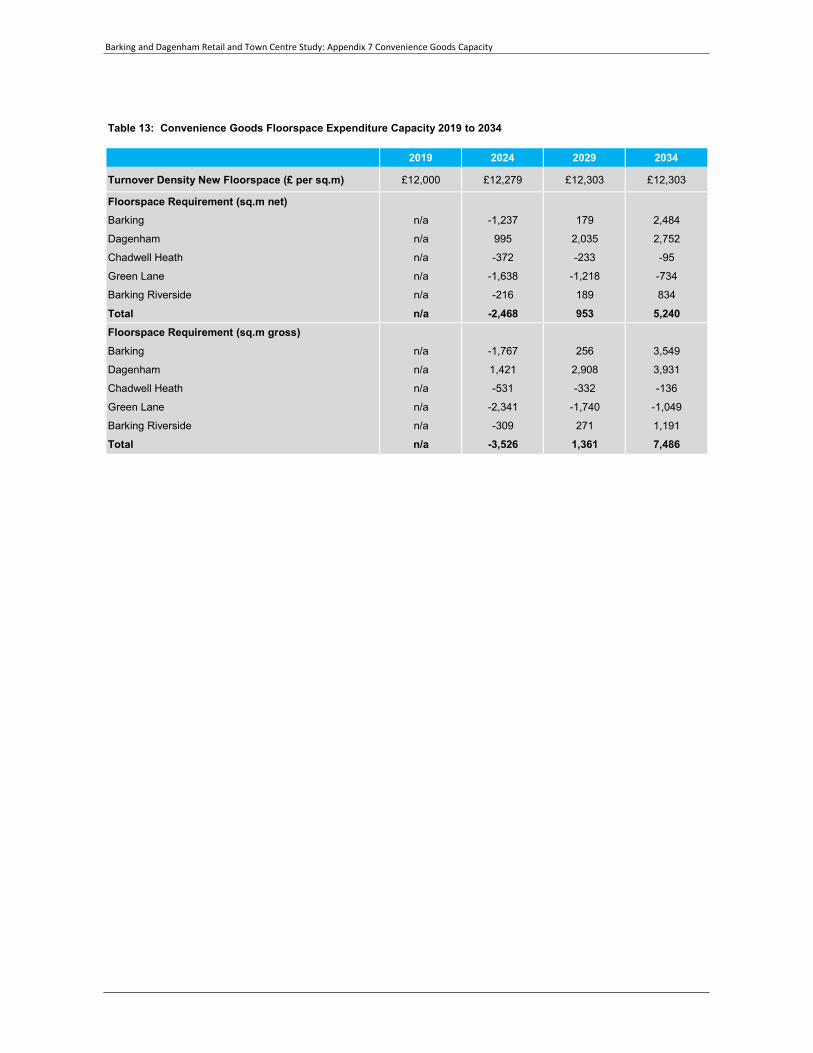
Barking and Dagenham Retail and Town Centre Study: Appendix 7 Convenience Goods Capacity
Table 13: Convenience Goods Floorspace Expenditure Capacity 2019 to 2034
2019 2024 2029 2034
Turnover Density New Floorspace (£ per sq.m) £12,000 £12,279 £12,303 £12,303
Floorspace Requirement (sq.m net)Barking n/a -1,237 179 2,484
Dagenham n/a 995 2,035 2,752
Chadwell Heath n/a -372 -233 -95
Green Lane n/a -1,638 -1,218 -734
Barking Riverside n/a -216 189 834
Total n/a -2,468 953 5,240Floorspace Requirement (sq.m gross)Barking n/a -1,767 256 3,549
Dagenham n/a 1,421 2,908 3,931
Chadwell Heath n/a -531 -332 -136
Green Lane n/a -2,341 -1,740 -1,049
Barking Riverside n/a -309 271 1,191
Total n/a -3,526 1,361 7,486


Barking and Dagenham Retail and Town Centre Study: Appendix 8 Comparison Goods Capacity
Appendix 8 Comparison Goods Capacity
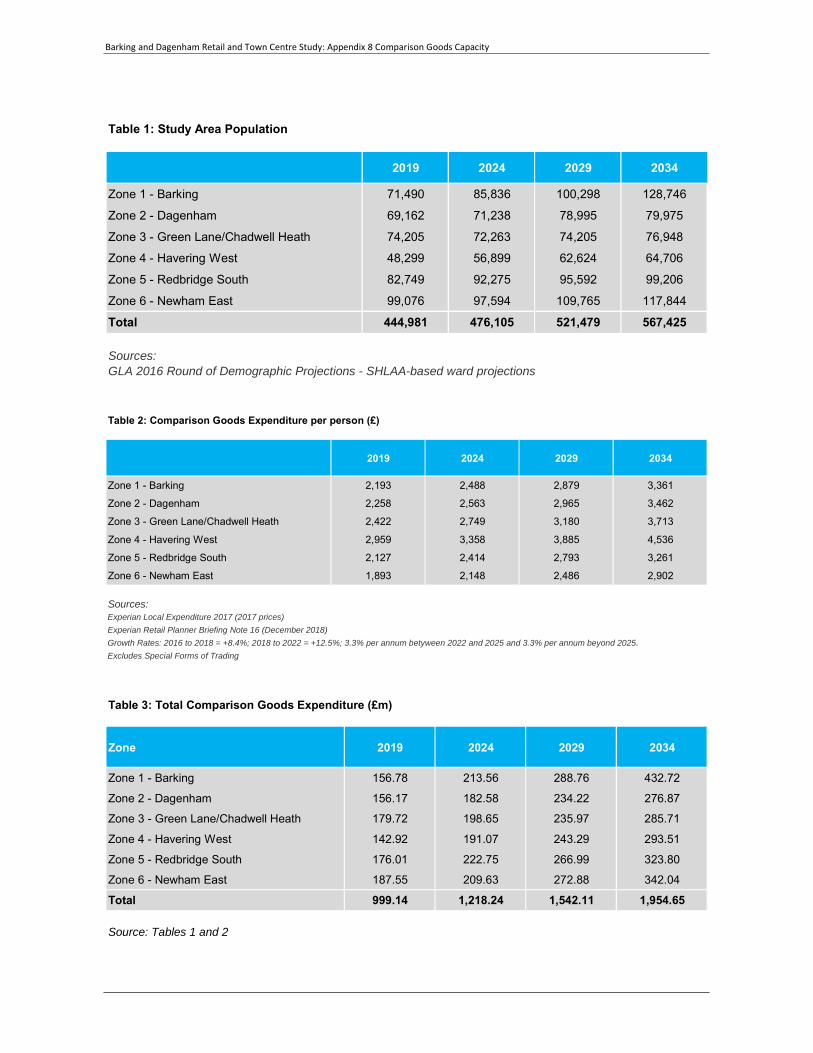
Barking and Dagenham Retail and Town Centre Study: Appendix 8 Comparison Goods Capacity
Table 1: Study Area Population
2019 2024 2029 2034
Zone 1 - Barking 71,490 85,836 100,298 128,746
Zone 2 - Dagenham 69,162 71,238 78,995 79,975
Zone 3 - Green Lane/Chadwell Heath 74,205 72,263 74,205 76,948
Zone 4 - Havering West 48,299 56,899 62,624 64,706
Zone 5 - Redbridge South 82,749 92,275 95,592 99,206
Zone 6 - Newham East 99,076 97,594 109,765 117,844
Total 444,981 476,105 521,479 567,425
Sources: GLA 2016 Round of Demographic Projections - SHLAA-based ward projections
Table 2: Comparison Goods Expenditure per person (£)
2019 2024 2029 2034
Zone 1 - Barking 2,193 2,488 2,879 3,361
Zone 2 - Dagenham 2,258 2,563 2,965 3,462
Zone 3 - Green Lane/Chadwell Heath 2,422 2,749 3,180 3,713
Zone 4 - Havering West 2,959 3,358 3,885 4,536
Zone 5 - Redbridge South 2,127 2,414 2,793 3,261
Zone 6 - Newham East 1,893 2,148 2,486 2,902
Sources: Experian Local Expenditure 2017 (2017 prices)Experian Retail Planner Briefing Note 16 (December 2018)Growth Rates: 2016 to 2018 = +8.4%; 2018 to 2022 = +12.5%; 3.3% per annum betyween 2022 and 2025 and 3.3% per annum beyond 2025.Excludes Special Forms of Trading
Table 3: Total Comparison Goods Expenditure (£m)
Zone 2019 2024 2029 2034
Zone 1 - Barking 156.78 213.56 288.76 432.72
Zone 2 - Dagenham 156.17 182.58 234.22 276.87
Zone 3 - Green Lane/Chadwell Heath 179.72 198.65 235.97 285.71
Zone 4 - Havering West 142.92 191.07 243.29 293.51
Zone 5 - Redbridge South 176.01 222.75 266.99 323.80
Zone 6 - Newham East 187.55 209.63 272.88 342.04
Total 999.14 1,218.24 1,542.11 1,954.65
Source: Tables 1 and 2
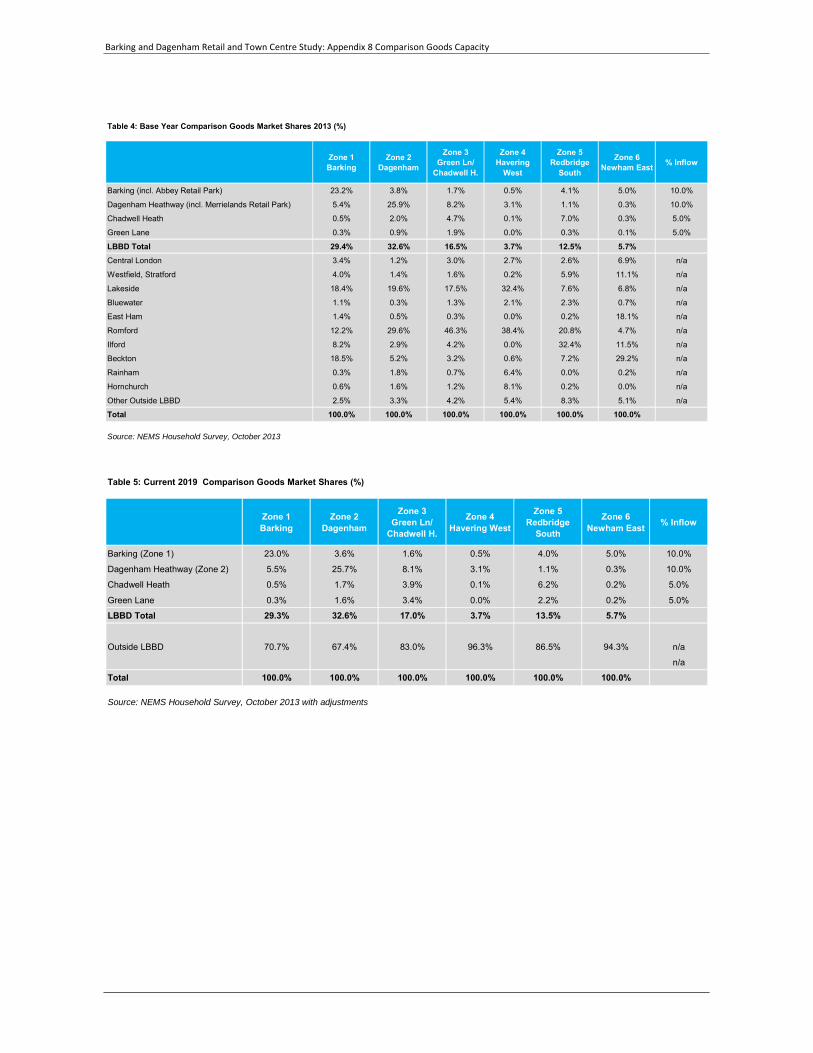
Barking and Dagenham Retail and Town Centre Study: Appendix 8 Comparison Goods Capacity
Table 4: Base Year Comparison Goods Market Shares 2013 (%)
Zone 1Barking
Zone 2Dagenham
Zone 3Green Ln/
Chadwell H.
Zone 4Havering
West
Zone 5Redbridge
South
Zone 6Newham East % Inflow
Barking (incl. Abbey Retail Park) 23.2% 3.8% 1.7% 0.5% 4.1% 5.0% 10.0%
Dagenham Heathway (incl. Merrielands Retail Park) 5.4% 25.9% 8.2% 3.1% 1.1% 0.3% 10.0%
Chadwell Heath 0.5% 2.0% 4.7% 0.1% 7.0% 0.3% 5.0%
Green Lane 0.3% 0.9% 1.9% 0.0% 0.3% 0.1% 5.0%
LBBD Total 29.4% 32.6% 16.5% 3.7% 12.5% 5.7%Central London 3.4% 1.2% 3.0% 2.7% 2.6% 6.9% n/a
Westfield, Stratford 4.0% 1.4% 1.6% 0.2% 5.9% 11.1% n/a
Lakeside 18.4% 19.6% 17.5% 32.4% 7.6% 6.8% n/a
Bluewater 1.1% 0.3% 1.3% 2.1% 2.3% 0.7% n/a
East Ham 1.4% 0.5% 0.3% 0.0% 0.2% 18.1% n/a
Romford 12.2% 29.6% 46.3% 38.4% 20.8% 4.7% n/a
Ilford 8.2% 2.9% 4.2% 0.0% 32.4% 11.5% n/a
Beckton 18.5% 5.2% 3.2% 0.6% 7.2% 29.2% n/a
Rainham 0.3% 1.8% 0.7% 6.4% 0.0% 0.2% n/a
Hornchurch 0.6% 1.6% 1.2% 8.1% 0.2% 0.0% n/a
Other Outside LBBD 2.5% 3.3% 4.2% 5.4% 8.3% 5.1% n/a
Total 100.0% 100.0% 100.0% 100.0% 100.0% 100.0%
Source: NEMS Household Survey, October 2013
Table 5: Current 2019 Comparison Goods Market Shares (%)
Zone 1Barking
Zone 2Dagenham
Zone 3Green Ln/
Chadwell H.
Zone 4Havering West
Zone 5Redbridge
South
Zone 6Newham East % Inflow
Barking (Zone 1) 23.0% 3.6% 1.6% 0.5% 4.0% 5.0% 10.0%
Dagenham Heathway (Zone 2) 5.5% 25.7% 8.1% 3.1% 1.1% 0.3% 10.0%
Chadwell Heath 0.5% 1.7% 3.9% 0.1% 6.2% 0.2% 5.0%
Green Lane 0.3% 1.6% 3.4% 0.0% 2.2% 0.2% 5.0%
LBBD Total 29.3% 32.6% 17.0% 3.7% 13.5% 5.7%
Outside LBBD 70.7% 67.4% 83.0% 96.3% 86.5% 94.3% n/a
n/a
Total 100.0% 100.0% 100.0% 100.0% 100.0% 100.0%
Source: NEMS Household Survey, October 2013 with adjustments
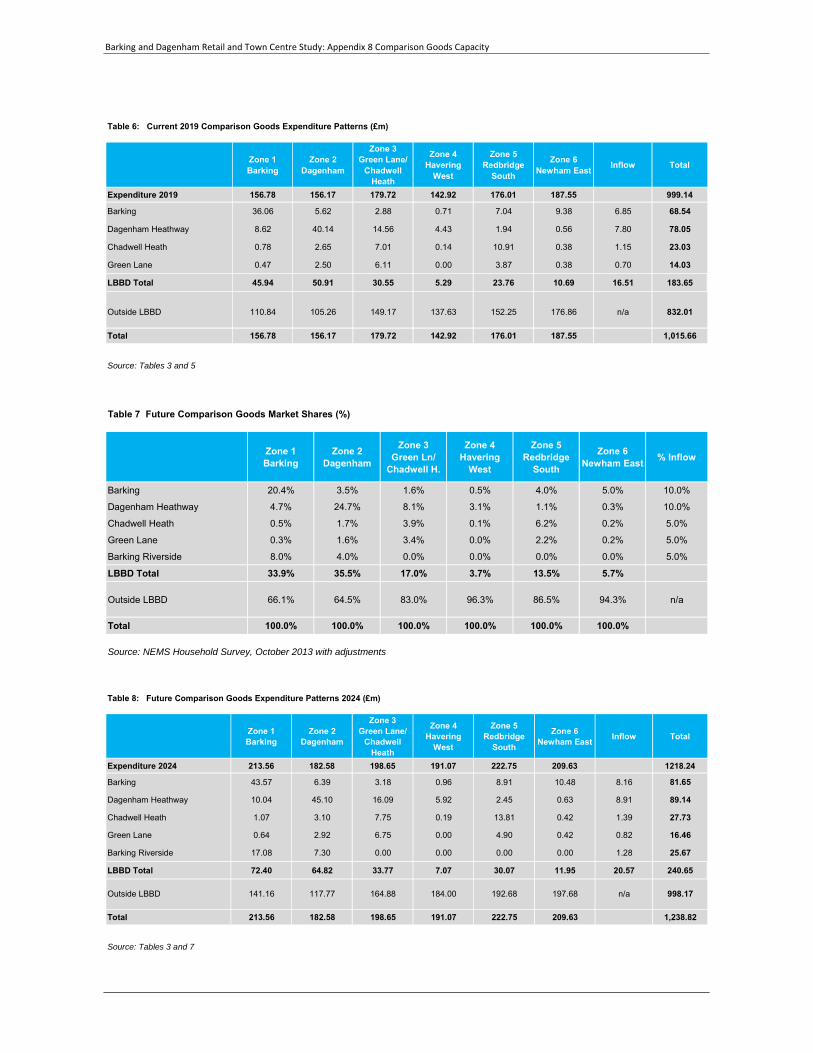
Barking and Dagenham Retail and Town Centre Study: Appendix 8 Comparison Goods Capacity
Table 6: Current 2019 Comparison Goods Expenditure Patterns (£m)
Zone 1Barking
Zone 2Dagenham
Zone 3Green Lane/
Chadwell Heath
Zone 4Havering
West
Zone 5Redbridge
South
Zone 6Newham East Inflow Total
Expenditure 2019 156.78 156.17 179.72 142.92 176.01 187.55 999.14
Barking 36.06 5.62 2.88 0.71 7.04 9.38 6.85 68.54
Dagenham Heathway 8.62 40.14 14.56 4.43 1.94 0.56 7.80 78.05
Chadwell Heath 0.78 2.65 7.01 0.14 10.91 0.38 1.15 23.03
Green Lane 0.47 2.50 6.11 0.00 3.87 0.38 0.70 14.03
LBBD Total 45.94 50.91 30.55 5.29 23.76 10.69 16.51 183.65
Outside LBBD 110.84 105.26 149.17 137.63 152.25 176.86 n/a 832.01
Total 156.78 156.17 179.72 142.92 176.01 187.55 1,015.66
Source: Tables 3 and 5
Table 7 Future Comparison Goods Market Shares (%)
Zone 1Barking
Zone 2Dagenham
Zone 3Green Ln/
Chadwell H.
Zone 4Havering
West
Zone 5Redbridge
South
Zone 6Newham East % Inflow
Barking 20.4% 3.5% 1.6% 0.5% 4.0% 5.0% 10.0%
Dagenham Heathway 4.7% 24.7% 8.1% 3.1% 1.1% 0.3% 10.0%
Chadwell Heath 0.5% 1.7% 3.9% 0.1% 6.2% 0.2% 5.0%
Green Lane 0.3% 1.6% 3.4% 0.0% 2.2% 0.2% 5.0%
Barking Riverside 8.0% 4.0% 0.0% 0.0% 0.0% 0.0% 5.0%
LBBD Total 33.9% 35.5% 17.0% 3.7% 13.5% 5.7%
Outside LBBD 66.1% 64.5% 83.0% 96.3% 86.5% 94.3% n/a
Total 100.0% 100.0% 100.0% 100.0% 100.0% 100.0%
Source: NEMS Household Survey, October 2013 with adjustments
Table 8: Future Comparison Goods Expenditure Patterns 2024 (£m)
Zone 1Barking
Zone 2Dagenham
Zone 3Green Lane/
Chadwell Heath
Zone 4Havering
West
Zone 5Redbridge
South
Zone 6Newham East Inflow Total
Expenditure 2024 213.56 182.58 198.65 191.07 222.75 209.63 1218.24
Barking 43.57 6.39 3.18 0.96 8.91 10.48 8.16 81.65
Dagenham Heathway 10.04 45.10 16.09 5.92 2.45 0.63 8.91 89.14
Chadwell Heath 1.07 3.10 7.75 0.19 13.81 0.42 1.39 27.73
Green Lane 0.64 2.92 6.75 0.00 4.90 0.42 0.82 16.46
Barking Riverside 17.08 7.30 0.00 0.00 0.00 0.00 1.28 25.67
LBBD Total 72.40 64.82 33.77 7.07 30.07 11.95 20.57 240.65
Outside LBBD 141.16 117.77 164.88 184.00 192.68 197.68 n/a 998.17
Total 213.56 182.58 198.65 191.07 222.75 209.63 1,238.82
Source: Tables 3 and 7
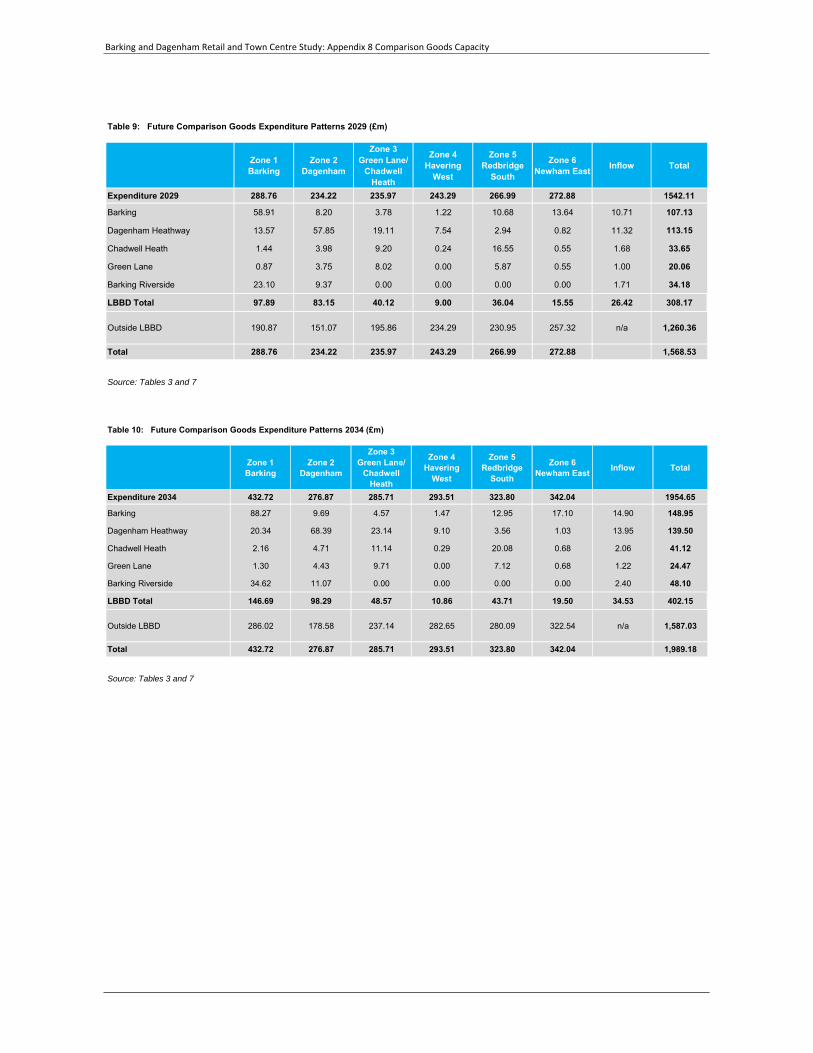
Barking and Dagenham Retail and Town Centre Study: Appendix 8 Comparison Goods Capacity
Table 9: Future Comparison Goods Expenditure Patterns 2029 (£m)
Zone 1Barking
Zone 2Dagenham
Zone 3Green Lane/
Chadwell Heath
Zone 4Havering
West
Zone 5Redbridge
South
Zone 6Newham East Inflow Total
Expenditure 2029 288.76 234.22 235.97 243.29 266.99 272.88 1542.11
Barking 58.91 8.20 3.78 1.22 10.68 13.64 10.71 107.13
Dagenham Heathway 13.57 57.85 19.11 7.54 2.94 0.82 11.32 113.15
Chadwell Heath 1.44 3.98 9.20 0.24 16.55 0.55 1.68 33.65
Green Lane 0.87 3.75 8.02 0.00 5.87 0.55 1.00 20.06
Barking Riverside 23.10 9.37 0.00 0.00 0.00 0.00 1.71 34.18
LBBD Total 97.89 83.15 40.12 9.00 36.04 15.55 26.42 308.17
Outside LBBD 190.87 151.07 195.86 234.29 230.95 257.32 n/a 1,260.36
Total 288.76 234.22 235.97 243.29 266.99 272.88 1,568.53
Source: Tables 3 and 7
Table 10: Future Comparison Goods Expenditure Patterns 2034 (£m)
Zone 1Barking
Zone 2Dagenham
Zone 3Green Lane/
Chadwell Heath
Zone 4Havering
West
Zone 5Redbridge
South
Zone 6Newham East Inflow Total
Expenditure 2034 432.72 276.87 285.71 293.51 323.80 342.04 1954.65
Barking 88.27 9.69 4.57 1.47 12.95 17.10 14.90 148.95
Dagenham Heathway 20.34 68.39 23.14 9.10 3.56 1.03 13.95 139.50
Chadwell Heath 2.16 4.71 11.14 0.29 20.08 0.68 2.06 41.12
Green Lane 1.30 4.43 9.71 0.00 7.12 0.68 1.22 24.47
Barking Riverside 34.62 11.07 0.00 0.00 0.00 0.00 2.40 48.10
LBBD Total 146.69 98.29 48.57 10.86 43.71 19.50 34.53 402.15
Outside LBBD 286.02 178.58 237.14 282.65 280.09 322.54 n/a 1,587.03
Total 432.72 276.87 285.71 293.51 323.80 342.04 1,989.18
Source: Tables 3 and 7

Barking and Dagenham Retail and Town Centre Study: Appendix 8 Comparison Goods Capacity
Table 11 Comparison Goods Floorspace 2019
Comparison Floorspace (sq.m gross)
Comparison Sales Floorspace (sq.m net)
BarkingBarking Town Centre comparison shops 20,710 14,497
Comparison floorspace in food stores n/a 1,106
Wickes, Hertford Road 5,300 4,240
Barking Total 20,710 19,843Merrielands Retail ParkAldi n/a 117
Argos 1,470 340
B&M Bargains 3,519 2,815
Halfords 925 740
TK Maxx 935 748
Pound Stretcher 542 434
Pets at Home 538 430
Asda n/a 2,499
Merrielands Retail Park Total 7,929 8,123Dagenham Heathway Dagenham Heathway Centre comparison shops 6,370 4,459
Comparison floorspace in food stores (Zone 2) n/a 184
Dagenham Heathway Total 6,370 4,643Chadwell HeathChadwell Heath Centre comparison shops 4,080 2,856
Green LaneGreen Lane Centre comparison shops 4,570 3,199
Comparison floorspace in food stores (Zone 3) n/a 2,376
Green Lane Total 4,570 5,575LBBD TOTAL 39,579 38,184CommitmentsBarking Riverside 6,500 4,840
Vicarage Fields Redevelopment *net increase 1,750 1,313
Abbey Road Retail Park Redevelopment 804 603
Gascoigne Estate West Redevelopment 88 66
Former Abbey Leisure Centre Redevelopment 158 119
Fresh Wharf Estate Redevelopment 238 179
Gascoigne Estate East Redevelopment 463 347
Merrielands Development Site 4,097 3,073
Beam Park Development Site 835 626
Coopers Arms Public House, Chadwell Heath 275 206
Total 15,208 11,371
Source: Global Sales Data, VOA, Experian Goad and LBBD
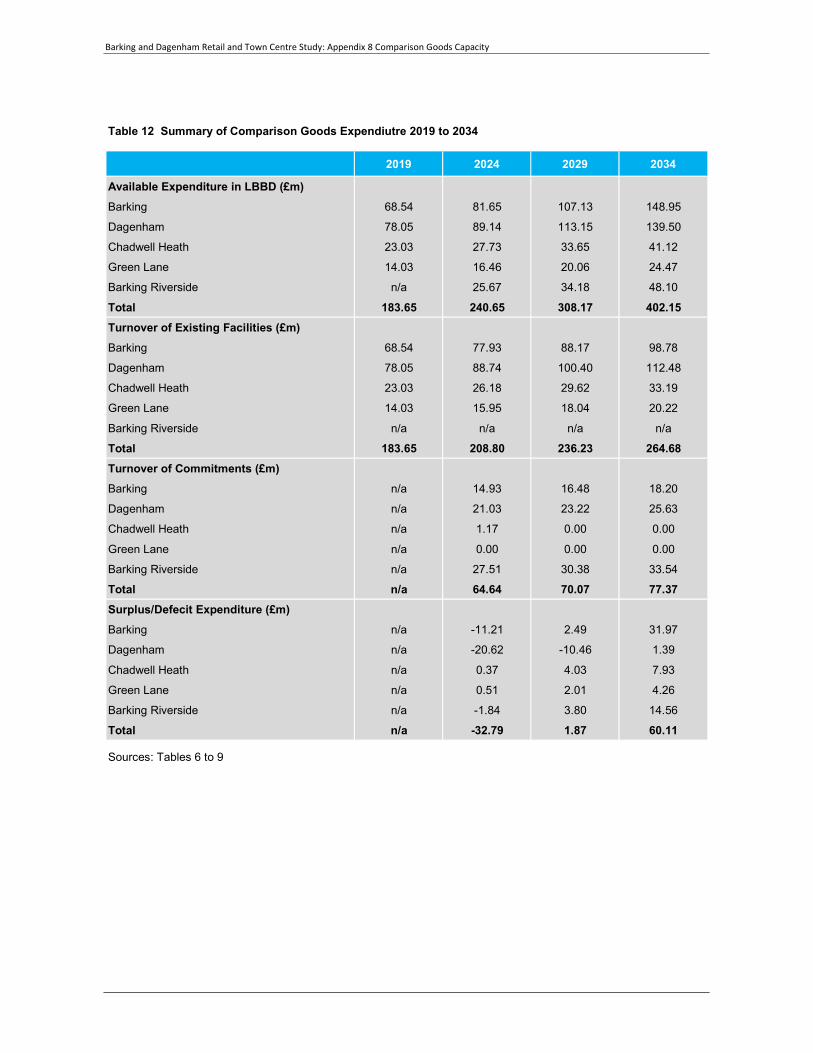
Barking and Dagenham Retail and Town Centre Study: Appendix 8 Comparison Goods Capacity
Table 12 Summary of Comparison Goods Expendiutre 2019 to 2034
2019 2024 2029 2034
Available Expenditure in LBBD (£m)Barking 68.54 81.65 107.13 148.95
Dagenham 78.05 89.14 113.15 139.50
Chadwell Heath 23.03 27.73 33.65 41.12
Green Lane 14.03 16.46 20.06 24.47
Barking Riverside n/a 25.67 34.18 48.10
Total 183.65 240.65 308.17 402.15Turnover of Existing Facilities (£m)Barking 68.54 77.93 88.17 98.78
Dagenham 78.05 88.74 100.40 112.48
Chadwell Heath 23.03 26.18 29.62 33.19
Green Lane 14.03 15.95 18.04 20.22
Barking Riverside n/a n/a n/a n/a
Total 183.65 208.80 236.23 264.68Turnover of Commitments (£m)Barking n/a 14.93 16.48 18.20
Dagenham n/a 21.03 23.22 25.63
Chadwell Heath n/a 1.17 0.00 0.00
Green Lane n/a 0.00 0.00 0.00
Barking Riverside n/a 27.51 30.38 33.54
Total n/a 64.64 70.07 77.37Surplus/Defecit Expenditure (£m)Barking n/a -11.21 2.49 31.97
Dagenham n/a -20.62 -10.46 1.39
Chadwell Heath n/a 0.37 4.03 7.93
Green Lane n/a 0.51 2.01 4.26
Barking Riverside n/a -1.84 3.80 14.56
Total n/a -32.79 1.87 60.11
Sources: Tables 6 to 9
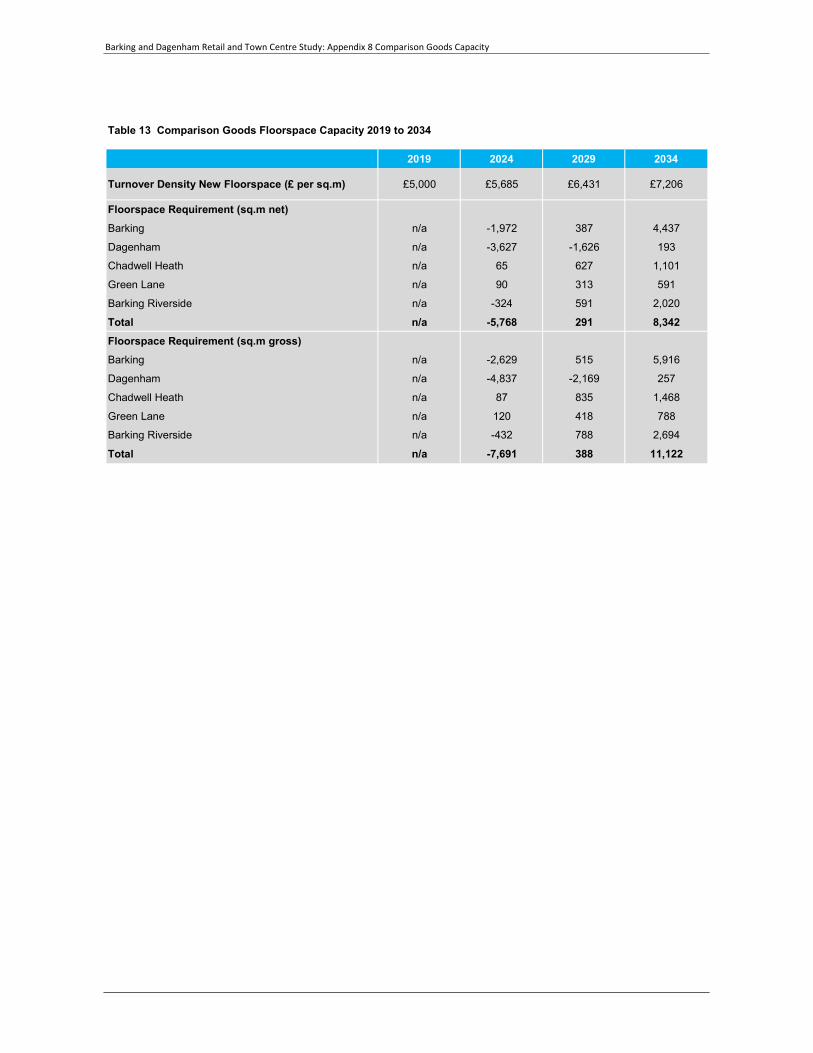
Barking and Dagenham Retail and Town Centre Study: Appendix 8 Comparison Goods Capacity
Table 13 Comparison Goods Floorspace Capacity 2019 to 2034
2019 2024 2029 2034
Turnover Density New Floorspace (£ per sq.m) £5,000 £5,685 £6,431 £7,206
Floorspace Requirement (sq.m net)Barking n/a -1,972 387 4,437
Dagenham n/a -3,627 -1,626 193
Chadwell Heath n/a 65 627 1,101
Green Lane n/a 90 313 591
Barking Riverside n/a -324 591 2,020
Total n/a -5,768 291 8,342Floorspace Requirement (sq.m gross)Barking n/a -2,629 515 5,916
Dagenham n/a -4,837 -2,169 257
Chadwell Heath n/a 87 835 1,468
Green Lane n/a 120 418 788
Barking Riverside n/a -432 788 2,694
Total n/a -7,691 388 11,122

Barking and Dagenham Retail and Town Centre Study: Appendix 9 Food and Beverage Capacity
Appendix 9 Food and Beverage Capacity
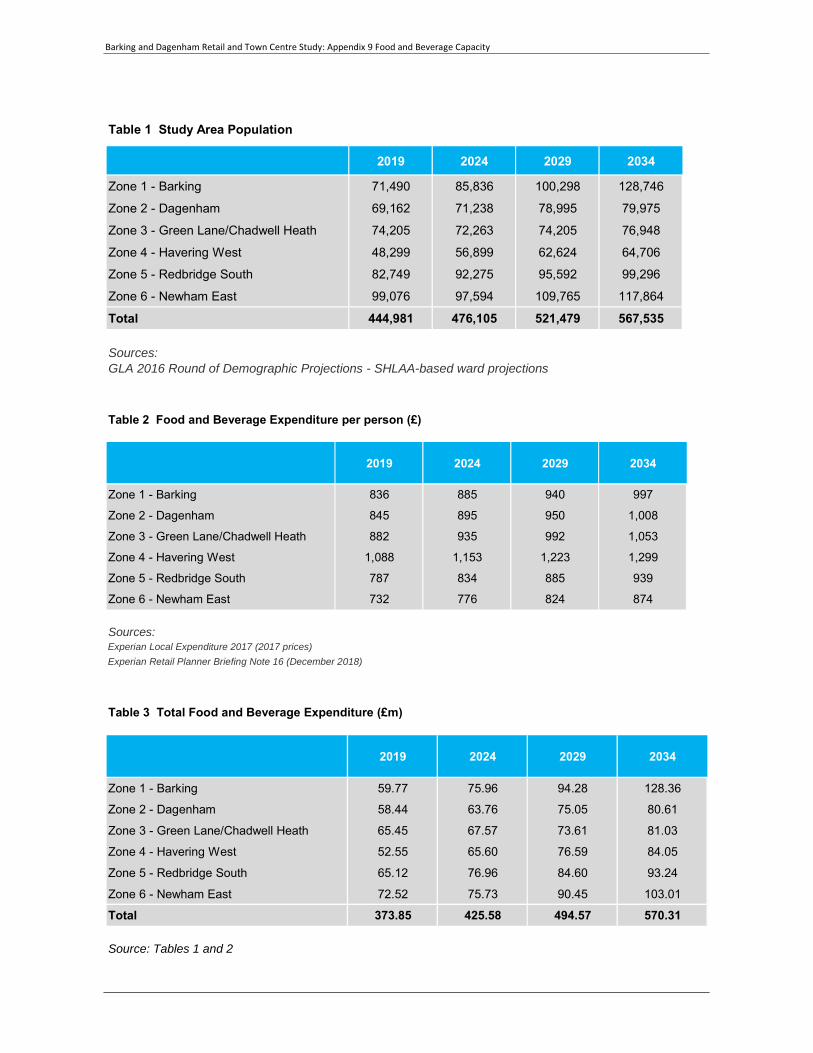
Barking and Dagenham Retail and Town Centre Study: Appendix 9 Food and Beverage Capacity
Table 1 Study Area Population
2019 2024 2029 2034
Zone 1 - Barking 71,490 85,836 100,298 128,746
Zone 2 - Dagenham 69,162 71,238 78,995 79,975
Zone 3 - Green Lane/Chadwell Heath 74,205 72,263 74,205 76,948
Zone 4 - Havering West 48,299 56,899 62,624 64,706
Zone 5 - Redbridge South 82,749 92,275 95,592 99,296
Zone 6 - Newham East 99,076 97,594 109,765 117,864
Total 444,981 476,105 521,479 567,535
Sources: GLA 2016 Round of Demographic Projections - SHLAA-based ward projections
Table 2 Food and Beverage Expenditure per person (£)
2019 2024 2029 2034
Zone 1 - Barking 836 885 940 997
Zone 2 - Dagenham 845 895 950 1,008
Zone 3 - Green Lane/Chadwell Heath 882 935 992 1,053
Zone 4 - Havering West 1,088 1,153 1,223 1,299
Zone 5 - Redbridge South 787 834 885 939
Zone 6 - Newham East 732 776 824 874
Sources: Experian Local Expenditure 2017 (2017 prices)Experian Retail Planner Briefing Note 16 (December 2018)
Table 3 Total Food and Beverage Expenditure (£m)
2019 2024 2029 2034
Zone 1 - Barking 59.77 75.96 94.28 128.36
Zone 2 - Dagenham 58.44 63.76 75.05 80.61
Zone 3 - Green Lane/Chadwell Heath 65.45 67.57 73.61 81.03
Zone 4 - Havering West 52.55 65.60 76.59 84.05
Zone 5 - Redbridge South 65.12 76.96 84.60 93.24
Zone 6 - Newham East 72.52 75.73 90.45 103.01
Total 373.85 425.58 494.57 570.31
Source: Tables 1 and 2
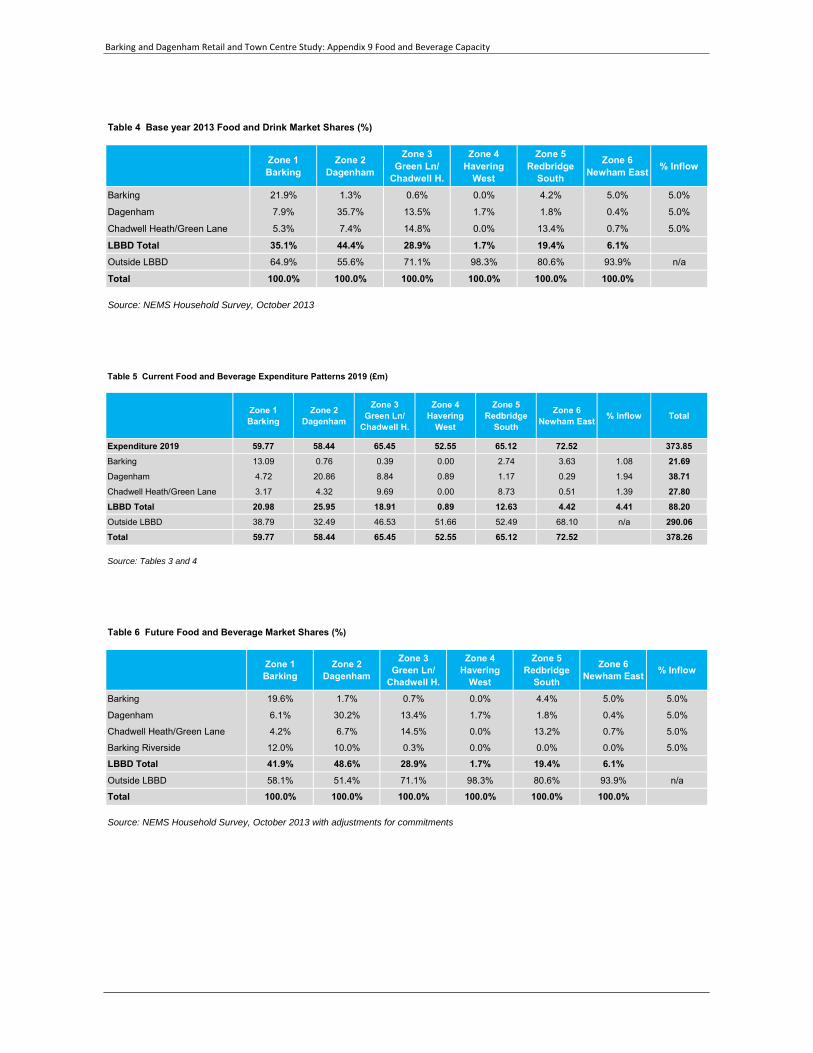
Barking and Dagenham Retail and Town Centre Study: Appendix 9 Food and Beverage Capacity
Table 4 Base year 2013 Food and Drink Market Shares (%)
Zone 1Barking
Zone 2Dagenham
Zone 3Green Ln/
Chadwell H.
Zone 4Havering
West
Zone 5Redbridge
South
Zone 6Newham East % Inflow
Barking 21.9% 1.3% 0.6% 0.0% 4.2% 5.0% 5.0%
Dagenham 7.9% 35.7% 13.5% 1.7% 1.8% 0.4% 5.0%
Chadwell Heath/Green Lane 5.3% 7.4% 14.8% 0.0% 13.4% 0.7% 5.0%
LBBD Total 35.1% 44.4% 28.9% 1.7% 19.4% 6.1%Outside LBBD 64.9% 55.6% 71.1% 98.3% 80.6% 93.9% n/a
Total 100.0% 100.0% 100.0% 100.0% 100.0% 100.0%
Source: NEMS Household Survey, October 2013
Table 5 Current Food and Beverage Expenditure Patterns 2019 (£m)
Zone 1Barking
Zone 2Dagenham
Zone 3Green Ln/
Chadwell H.
Zone 4Havering
West
Zone 5Redbridge
South
Zone 6Newham East % Inflow Total
Expenditure 2019 59.77 58.44 65.45 52.55 65.12 72.52 373.85Barking 13.09 0.76 0.39 0.00 2.74 3.63 1.08 21.69Dagenham 4.72 20.86 8.84 0.89 1.17 0.29 1.94 38.71Chadwell Heath/Green Lane 3.17 4.32 9.69 0.00 8.73 0.51 1.39 27.80LBBD Total 20.98 25.95 18.91 0.89 12.63 4.42 4.41 88.20Outside LBBD 38.79 32.49 46.53 51.66 52.49 68.10 n/a 290.06Total 59.77 58.44 65.45 52.55 65.12 72.52 378.26
Source: Tables 3 and 4
Table 6 Future Food and Beverage Market Shares (%)
Zone 1Barking
Zone 2Dagenham
Zone 3Green Ln/
Chadwell H.
Zone 4Havering
West
Zone 5Redbridge
South
Zone 6Newham East % Inflow
Barking 19.6% 1.7% 0.7% 0.0% 4.4% 5.0% 5.0%
Dagenham 6.1% 30.2% 13.4% 1.7% 1.8% 0.4% 5.0%
Chadwell Heath/Green Lane 4.2% 6.7% 14.5% 0.0% 13.2% 0.7% 5.0%
Barking Riverside 12.0% 10.0% 0.3% 0.0% 0.0% 0.0% 5.0%
LBBD Total 41.9% 48.6% 28.9% 1.7% 19.4% 6.1%Outside LBBD 58.1% 51.4% 71.1% 98.3% 80.6% 93.9% n/a
Total 100.0% 100.0% 100.0% 100.0% 100.0% 100.0%
Source: NEMS Household Survey, October 2013 with adjustments for commitments
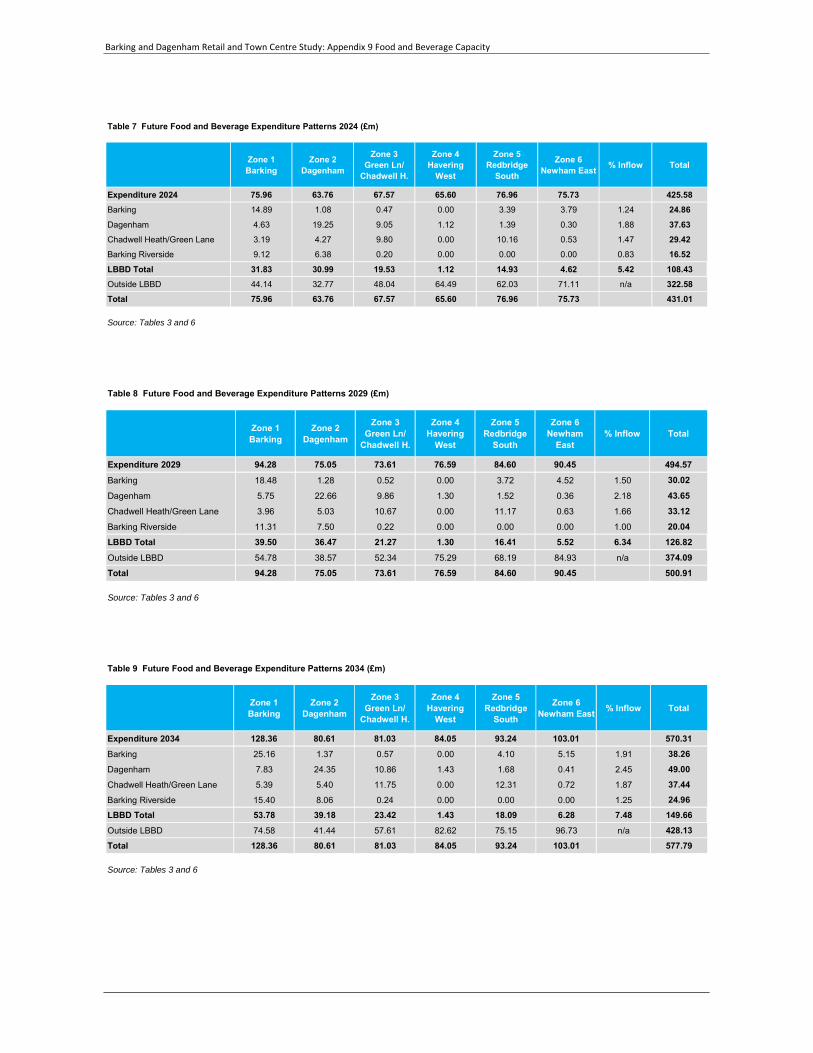
Barking and Dagenham Retail and Town Centre Study: Appendix 9 Food and Beverage Capacity
Table 7 Future Food and Beverage Expenditure Patterns 2024 (£m)
Zone 1Barking
Zone 2Dagenham
Zone 3Green Ln/
Chadwell H.
Zone 4Havering
West
Zone 5Redbridge
South
Zone 6Newham East % Inflow Total
Expenditure 2024 75.96 63.76 67.57 65.60 76.96 75.73 425.58Barking 14.89 1.08 0.47 0.00 3.39 3.79 1.24 24.86Dagenham 4.63 19.25 9.05 1.12 1.39 0.30 1.88 37.63Chadwell Heath/Green Lane 3.19 4.27 9.80 0.00 10.16 0.53 1.47 29.42Barking Riverside 9.12 6.38 0.20 0.00 0.00 0.00 0.83 16.52LBBD Total 31.83 30.99 19.53 1.12 14.93 4.62 5.42 108.43Outside LBBD 44.14 32.77 48.04 64.49 62.03 71.11 n/a 322.58Total 75.96 63.76 67.57 65.60 76.96 75.73 431.01
Source: Tables 3 and 6
Table 8 Future Food and Beverage Expenditure Patterns 2029 (£m)
Zone 1Barking
Zone 2Dagenham
Zone 3Green Ln/
Chadwell H.
Zone 4Havering
West
Zone 5Redbridge
South
Zone 6Newham
East% Inflow Total
Expenditure 2029 94.28 75.05 73.61 76.59 84.60 90.45 494.57Barking 18.48 1.28 0.52 0.00 3.72 4.52 1.50 30.02Dagenham 5.75 22.66 9.86 1.30 1.52 0.36 2.18 43.65Chadwell Heath/Green Lane 3.96 5.03 10.67 0.00 11.17 0.63 1.66 33.12Barking Riverside 11.31 7.50 0.22 0.00 0.00 0.00 1.00 20.04LBBD Total 39.50 36.47 21.27 1.30 16.41 5.52 6.34 126.82Outside LBBD 54.78 38.57 52.34 75.29 68.19 84.93 n/a 374.09Total 94.28 75.05 73.61 76.59 84.60 90.45 500.91
Source: Tables 3 and 6
Table 9 Future Food and Beverage Expenditure Patterns 2034 (£m)
Zone 1Barking
Zone 2Dagenham
Zone 3Green Ln/
Chadwell H.
Zone 4Havering
West
Zone 5Redbridge
South
Zone 6Newham East % Inflow Total
Expenditure 2034 128.36 80.61 81.03 84.05 93.24 103.01 570.31Barking 25.16 1.37 0.57 0.00 4.10 5.15 1.91 38.26Dagenham 7.83 24.35 10.86 1.43 1.68 0.41 2.45 49.00Chadwell Heath/Green Lane 5.39 5.40 11.75 0.00 12.31 0.72 1.87 37.44Barking Riverside 15.40 8.06 0.24 0.00 0.00 0.00 1.25 24.96LBBD Total 53.78 39.18 23.42 1.43 18.09 6.28 7.48 149.66Outside LBBD 74.58 41.44 57.61 82.62 75.15 96.73 n/a 428.13Total 128.36 80.61 81.03 84.05 93.24 103.01 577.79
Source: Tables 3 and 6
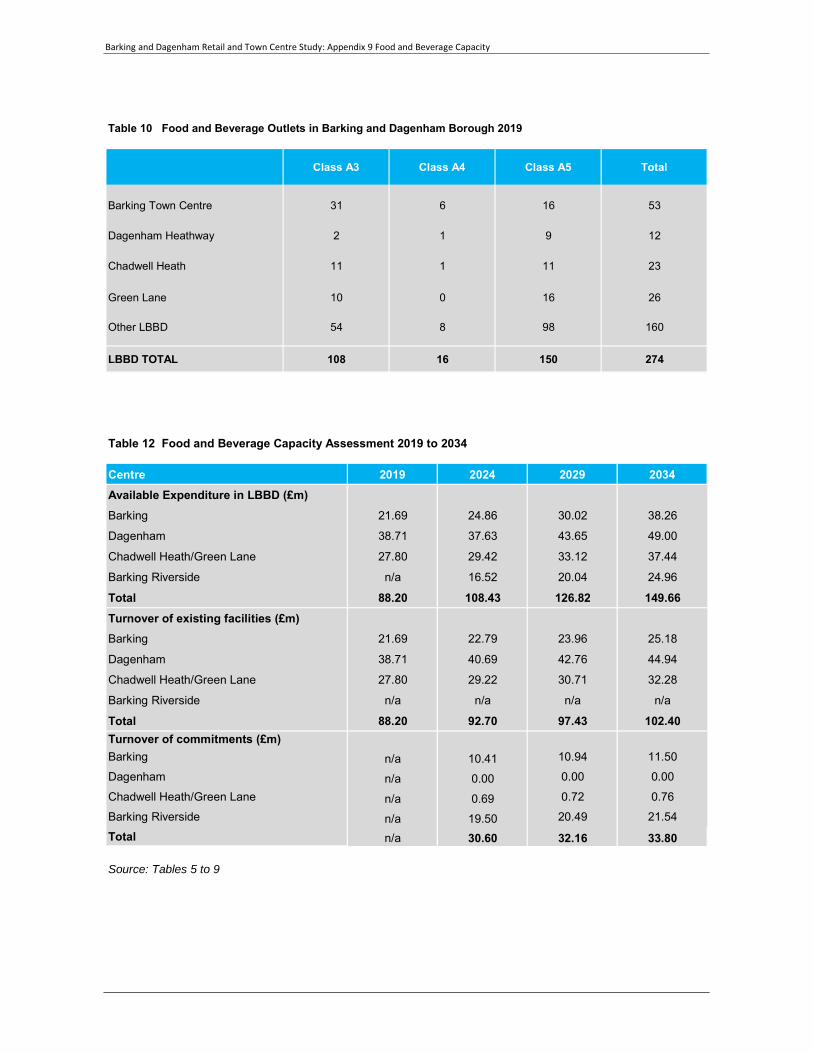
Barking and Dagenham Retail and Town Centre Study: Appendix 9 Food and Beverage Capacity
Table 10 Food and Beverage Outlets in Barking and Dagenham Borough 2019
Class A3 Class A4 Class A5 Total
Barking Town Centre 31 6 16 53
Dagenham Heathway 2 1 9 12
Chadwell Heath 11 1 11 23
Green Lane 10 0 16 26
Other LBBD 54 8 98 160
LBBD TOTAL 108 16 150 274
Table 12 Food and Beverage Capacity Assessment 2019 to 2034
Centre 2019 2024 2029 2034Available Expenditure in LBBD (£m)Barking 21.69 24.86 30.02 38.26
Dagenham 38.71 37.63 43.65 49.00
Chadwell Heath/Green Lane 27.80 29.42 33.12 37.44
Barking Riverside n/a 16.52 20.04 24.96
Total 88.20 108.43 126.82 149.66Turnover of existing facilities (£m)Barking 21.69 22.79 23.96 25.18
Dagenham 38.71 40.69 42.76 44.94
Chadwell Heath/Green Lane 27.80 29.22 30.71 32.28
Barking Riverside n/a n/a n/a n/a
Total 88.20 92.70 97.43 102.40Turnover of commitments (£m)Barking n/a 10.41 10.94 11.50Dagenham n/a 0.00 0.00 0.00
Chadwell Heath/Green Lane n/a 0.69 0.72 0.76Barking Riverside n/a 19.50 20.49 21.54Total n/a 30.60 32.16 33.80
Source: Tables 5 to 9
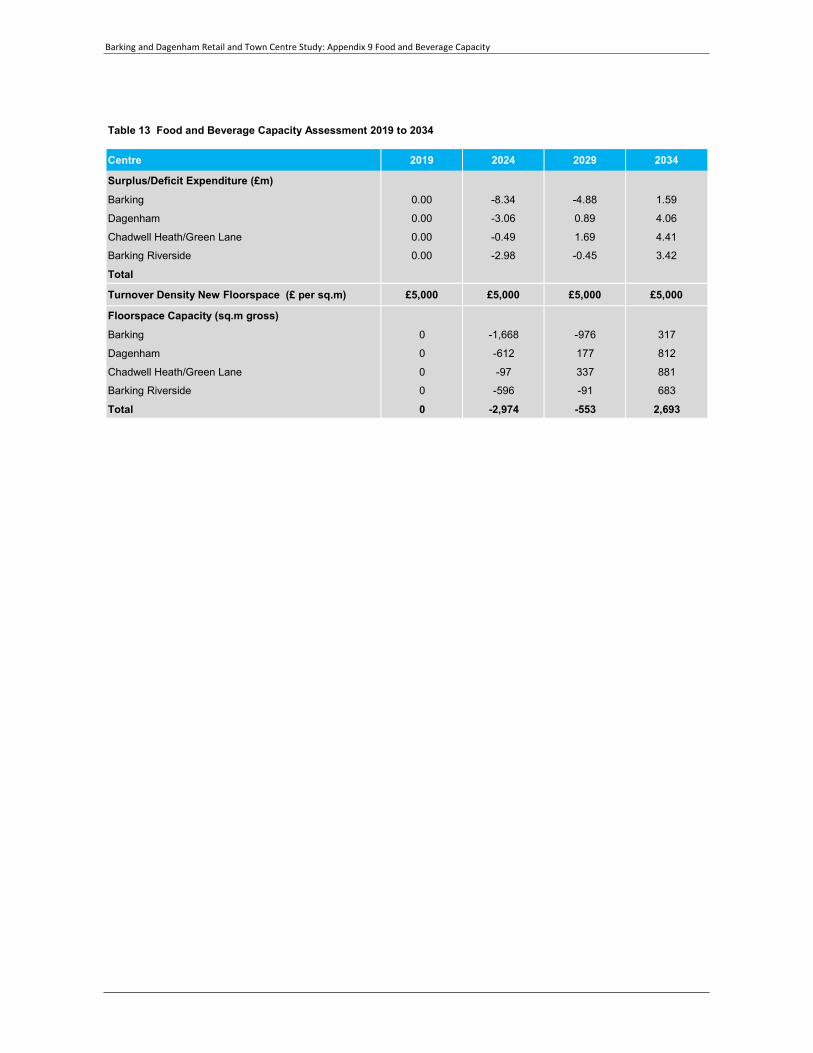
Barking and Dagenham Retail and Town Centre Study: Appendix 9 Food and Beverage Capacity
Table 13 Food and Beverage Capacity Assessment 2019 to 2034
Centre 2019 2024 2029 2034
Surplus/Deficit Expenditure (£m)Barking 0.00 -8.34 -4.88 1.59
Dagenham 0.00 -3.06 0.89 4.06
Chadwell Heath/Green Lane 0.00 -0.49 1.69 4.41
Barking Riverside 0.00 -2.98 -0.45 3.42
Total
Turnover Density New Floorspace (£ per sq.m) £5,000 £5,000 £5,000 £5,000
Floorspace Capacity (sq.m gross)Barking 0 -1,668 -976 317
Dagenham 0 -612 177 812
Chadwell Heath/Green Lane 0 -97 337 881
Barking Riverside 0 -596 -91 683
Total 0 -2,974 -553 2,693

Barking and Dagenham Retail and Town Centre Study: Appendix 10 Development Opportunities
Appendix 10 Development Opportunities
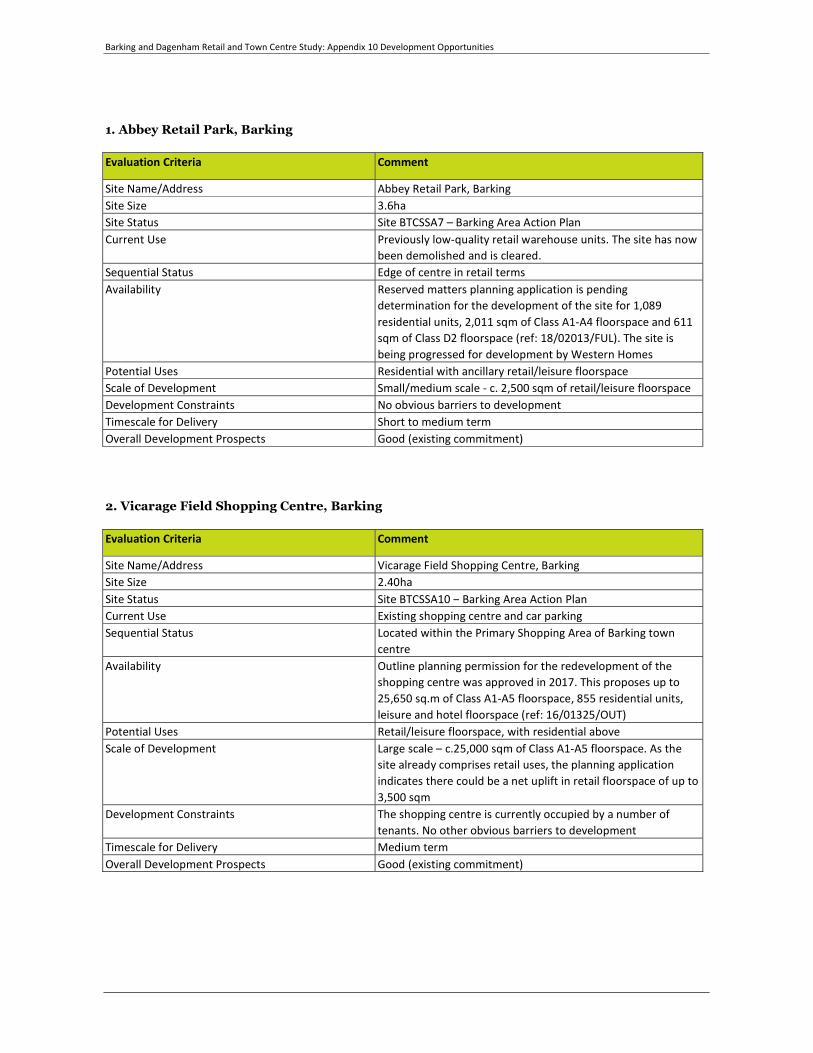
Barking and Dagenham Retail and Town Centre Study: Appendix 10 Development Opportunities
1. Abbey Retail Park, Barking
2. Vicarage Field Shopping Centre, Barking Evaluation Criteria Comment
Site Name/Address Vicarage Field Shopping Centre, Barking Site Size 2.40ha Site Status Site BTCSSA10 – Barking Area Action Plan Current Use Existing shopping centre and car parking Sequential Status Located within the Primary Shopping Area of Barking town
centre Availability Outline planning permission for the redevelopment of the
shopping centre was approved in 2017. This proposes up to 25,650 sq.m of Class A1-A5 floorspace, 855 residential units, leisure and hotel floorspace (ref: 16/01325/OUT)
Potential Uses Retail/leisure floorspace, with residential above Scale of Development Large scale – c.25,000 sqm of Class A1-A5 floorspace. As the
site already comprises retail uses, the planning application indicates there could be a net uplift in retail floorspace of up to 3,500 sqm
Development Constraints The shopping centre is currently occupied by a number of tenants. No other obvious barriers to development
Timescale for Delivery Medium term Overall Development Prospects Good (existing commitment)
Evaluation Criteria Comment
Site Name/Address Abbey Retail Park, Barking Site Size 3.6ha Site Status Site BTCSSA7 – Barking Area Action Plan Current Use Previously low-quality retail warehouse units. The site has now
been demolished and is cleared. Sequential Status Edge of centre in retail terms Availability Reserved matters planning application is pending
determination for the development of the site for 1,089 residential units, 2,011 sqm of Class A1-A4 floorspace and 611 sqm of Class D2 floorspace (ref: 18/02013/FUL). The site is being progressed for development by Western Homes
Potential Uses Residential with ancillary retail/leisure floorspace Scale of Development Small/medium scale - c. 2,500 sqm of retail/leisure floorspace Development Constraints No obvious barriers to development Timescale for Delivery Short to medium term Overall Development Prospects Good (existing commitment)
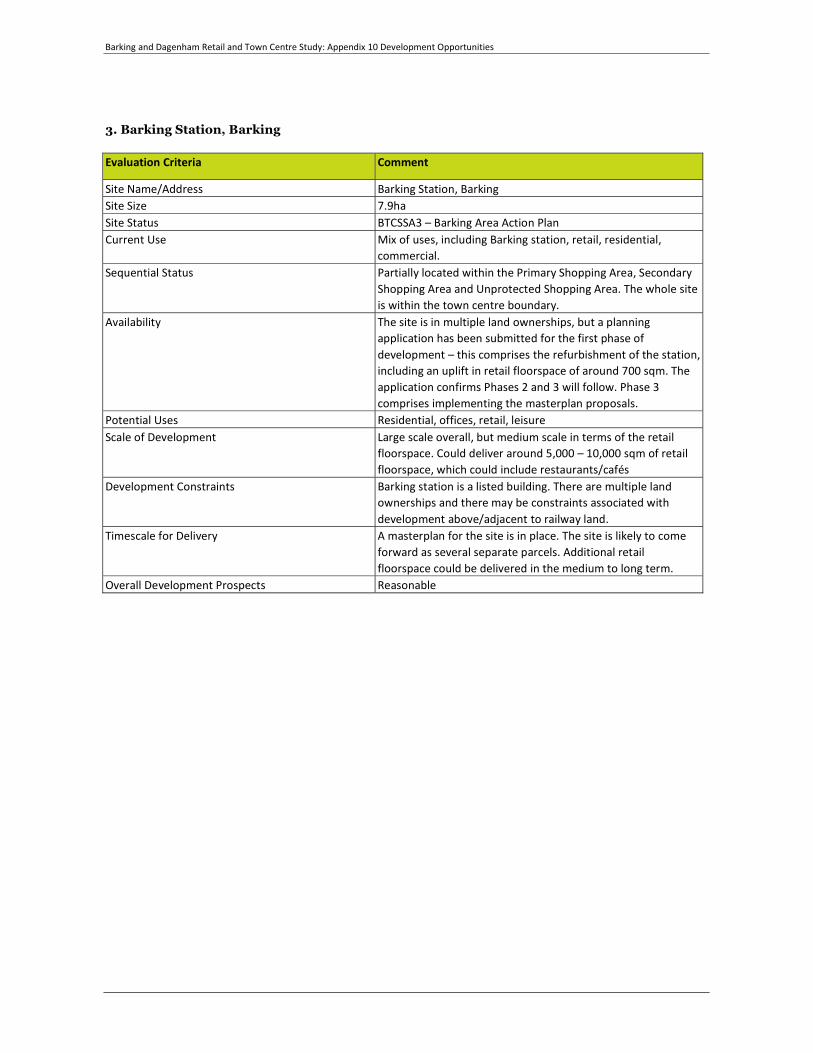
Barking and Dagenham Retail and Town Centre Study: Appendix 10 Development Opportunities
3. Barking Station, Barking Evaluation Criteria Comment
Site Name/Address Barking Station, BarkingSite Size 7.9ha Site Status BTCSSA3 – Barking Area Action Plan Current Use Mix of uses, including Barking station, retail, residential,
commercial. Sequential Status Partially located within the Primary Shopping Area, Secondary
Shopping Area and Unprotected Shopping Area. The whole site is within the town centre boundary.
Availability The site is in multiple land ownerships, but a planning application has been submitted for the first phase of development – this comprises the refurbishment of the station, including an uplift in retail floorspace of around 700 sqm. The application confirms Phases 2 and 3 will follow. Phase 3 comprises implementing the masterplan proposals.
Potential Uses Residential, offices, retail, leisure Scale of Development Large scale overall, but medium scale in terms of the retail
floorspace. Could deliver around 5,000 – 10,000 sqm of retail floorspace, which could include restaurants/cafés
Development Constraints Barking station is a listed building. There are multiple land ownerships and there may be constraints associated with development above/adjacent to railway land.
Timescale for Delivery A masterplan for the site is in place. The site is likely to come forward as several separate parcels. Additional retail floorspace could be delivered in the medium to long term.
Overall Development Prospects Reasonable
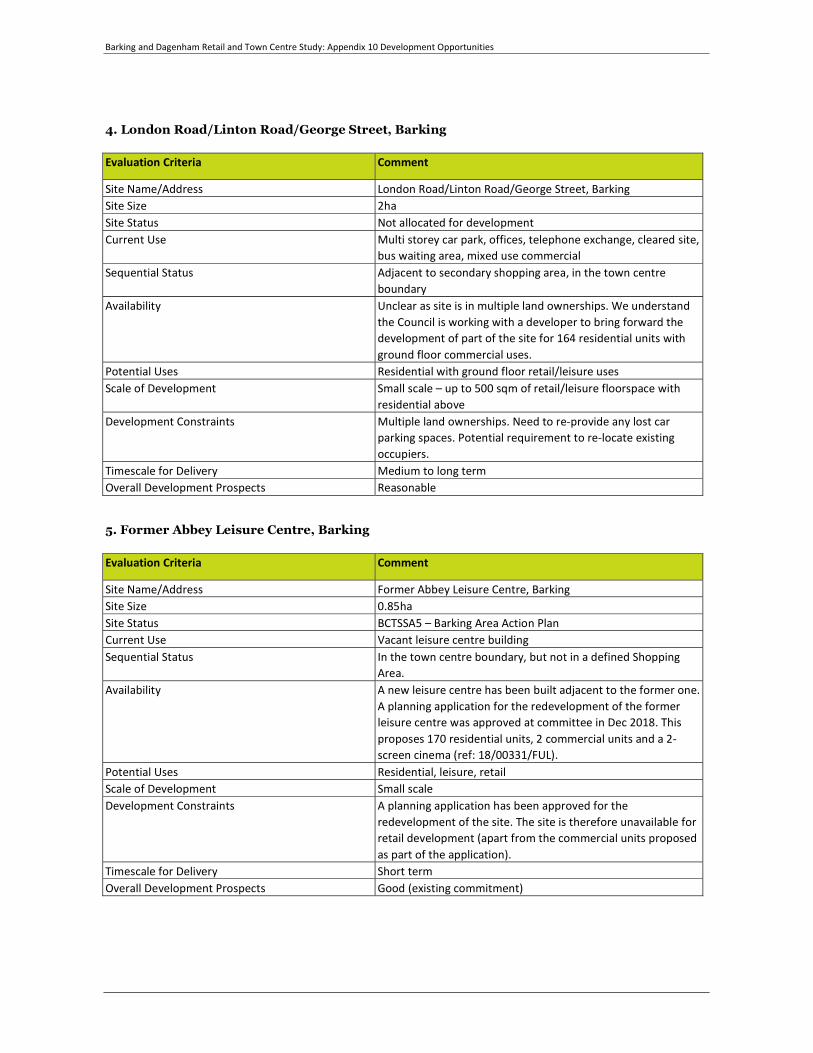
Barking and Dagenham Retail and Town Centre Study: Appendix 10 Development Opportunities
4. London Road/Linton Road/George Street, Barking Evaluation Criteria Comment
Site Name/Address London Road/Linton Road/George Street, Barking Site Size 2ha Site Status Not allocated for development Current Use Multi storey car park, offices, telephone exchange, cleared site,
bus waiting area, mixed use commercial Sequential Status Adjacent to secondary shopping area, in the town centre
boundary Availability Unclear as site is in multiple land ownerships. We understand
the Council is working with a developer to bring forward the development of part of the site for 164 residential units with ground floor commercial uses.
Potential Uses Residential with ground floor retail/leisure uses Scale of Development Small scale – up to 500 sqm of retail/leisure floorspace with
residential aboveDevelopment Constraints Multiple land ownerships. Need to re-provide any lost car
parking spaces. Potential requirement to re-locate existing occupiers.
Timescale for Delivery Medium to long term Overall Development Prospects Reasonable
5. Former Abbey Leisure Centre, Barking Evaluation Criteria Comment
Site Name/Address Former Abbey Leisure Centre, BarkingSite Size 0.85ha Site Status BCTSSA5 – Barking Area Action Plan Current Use Vacant leisure centre building Sequential Status In the town centre boundary, but not in a defined Shopping
Area. Availability A new leisure centre has been built adjacent to the former one.
A planning application for the redevelopment of the former leisure centre was approved at committee in Dec 2018. This proposes 170 residential units, 2 commercial units and a 2-screen cinema (ref: 18/00331/FUL).
Potential Uses Residential, leisure, retailScale of Development Small scale Development Constraints A planning application has been approved for the
redevelopment of the site. The site is therefore unavailable for retail development (apart from the commercial units proposed as part of the application).
Timescale for Delivery Short term Overall Development Prospects Good (existing commitment)
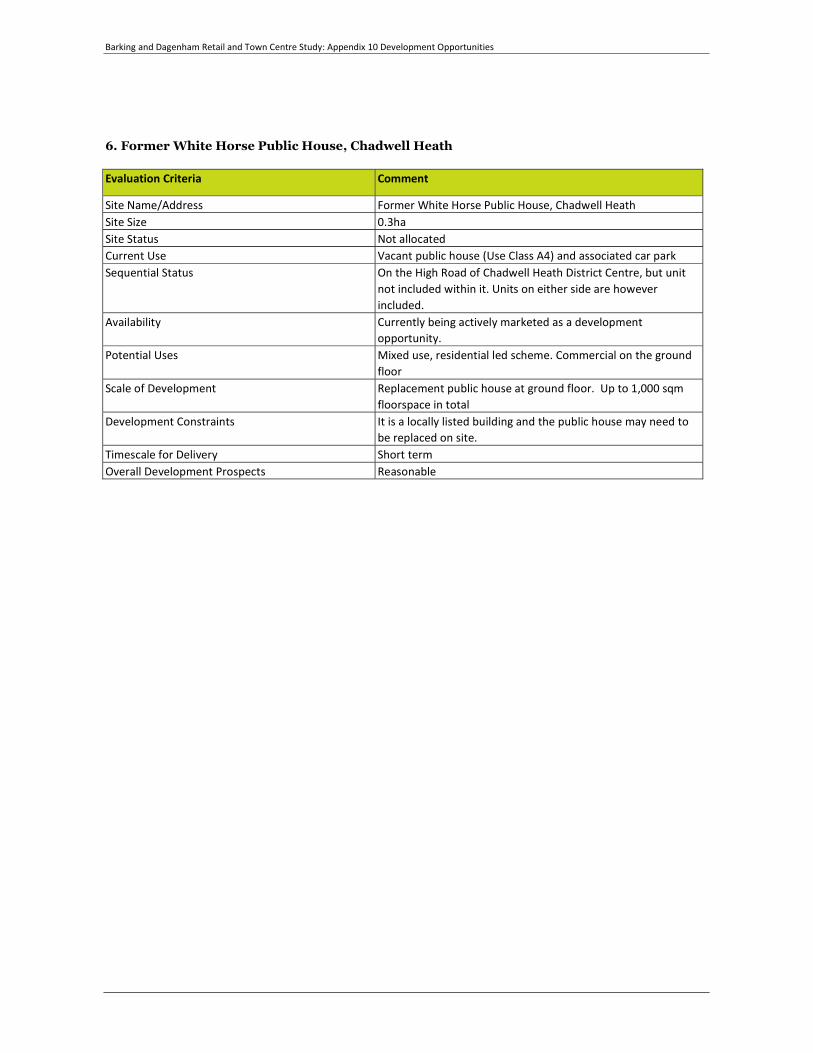
Barking and Dagenham Retail and Town Centre Study: Appendix 10 Development Opportunities
6. Former White Horse Public House, Chadwell Heath Evaluation Criteria Comment
Site Name/Address Former White Horse Public House, Chadwell Heath Site Size 0.3ha Site Status Not allocatedCurrent Use Vacant public house (Use Class A4) and associated car park Sequential Status On the High Road of Chadwell Heath District Centre, but unit
not included within it. Units on either side are however included.
Availability Currently being actively marketed as a development opportunity.
Potential Uses Mixed use, residential led scheme. Commercial on the ground floor
Scale of Development Replacement public house at ground floor. Up to 1,000 sqm floorspace in total
Development Constraints It is a locally listed building and the public house may need to be replaced on site.
Timescale for Delivery Short term Overall Development Prospects Reasonable