Embed Size (px)
Citation preview

Basel Committee on Banking Supervision
Basel III Monitoring Report
September 2013
A revised document has been issued in March 2014. http://www.bis.org/publ/bcbs278.htm

Queries regarding this document should be addressed to the Secretariat of the Basel Committee on Banking Supervision (e-mail: [email protected]).
This publication is available on the BIS website (www.bis.org).
© Bank for International Settlements 2013. All rights reserved. Brief excerpts may be reproduced or translated provided the source is stated.
ISBN 92-9131-924-4 (print)
ISBN 92-9197-924-4 (online)
A revised document has been issued in March 2014. http://www.bis.org/publ/bcbs278.htm

Basel III Monitoring Report September 2013 iii
Basel III Monitoring Report
September 2013
Large internationally active banks’ risk-based capital shortfalls continue to decrease ........................................ 1
Detailed results of the Basel III monitoring exercise as of 31 December 2012 ....................................................... 5
1. General remarks .............................................................................................................................................................. 5
1.1 Scope of the monitoring exercise ................................................................................................................... 5
1.2 Sample of participating banks .......................................................................................................................... 6
1.3 Methodology ........................................................................................................................................................... 7
1.4 Data quality .............................................................................................................................................................. 7
1.5 Interpretation of results ...................................................................................................................................... 7
2. Regulatory capital, capital requirements and capital shortfalls.................................................................... 8
2.1 Capital ratios ............................................................................................................................................................ 9
2.2 Capital shortfalls ................................................................................................................................................... 12
2.3 Level of capital ...................................................................................................................................................... 13
2.4 Composition of capital ...................................................................................................................................... 14
2.5 Leverage ratio........................................................................................................................................................ 15
2.6 Relationship between the leverage ratio and risk-based capital requirements ......................... 17
3. Liquidity ............................................................................................................................................................................ 19
3.1 Liquidity Coverage Ratio ................................................................................................................................... 19
3.2 Net Stable Funding Ratio ................................................................................................................................. 23
Statistical Annex ............................................................................................................................................................................... 25
Previous monitoring reports published by the Basel Committee ................................................................................ 33
Basel III phase-in arrangements ................................................................................................................................................ 35
A revised document has been issued in March 2014. http://www.bis.org/publ/bcbs278.htm

iv Basel III Monitoring Report September 2013
Notations used in this report
billion thousand million
The term “country” as used in this publication also covers territorial entities that are not states as understood by international law and practice but for which data are separately and independently available.
A revised document has been issued in March 2014. http://www.bis.org/publ/bcbs278.htm

Monitoring Report September 2013 v
Quantitative Impact Study Working Group of the Basel Committee on Banking Supervision
Chairman Mr Martin Birn, Secretariat of the Basel Committee on Banking Supervision, Bank for International Settlements, Basel
The representatives in italics are members of the analysis team and provided analytical support at the Secretariat.
Argentina Ms Verónica Balzarotti Central Bank of Argentina
Australia Mr David Wong Australian Prudential Regulation Authority, Sydney
Belgium Ms Claire Renoirte Banking, Finance and Insurance Commission, Brussels
Brazil Mr Frederico Torres de Souza Banco Central do Brasil, Brasilia
Canada Mr Brian Rumas Office of the Superintendent of Financial Institutions, Ottawa
China Mr Miao Yufeng China Banking Regulatory Commission, Beijing
France Ms Dominique Durant French Prudential Supervisory Authority, Paris
Mr Thomas Beretti Ms Mira Lamriben Ms Léa Le Queau
Germany Ms Dorothee Holl Deutsche Bundesbank, Frankfurt
Mr Daniel Foos Mr Daniel Legran
Hong Kong SAR Mr Andy Cheung Hong Kong Monetary Authority
India Mr Rajnish Kumar Reserve Bank of India, Mumbai
Indonesia Mr Boyke W Suadi Bank Indonesia, Jakarta
Italy Mr Francesco Cannata Bank of Italy, Rome
Mr Luca Serafini
Japan Mr Susumu Kobayashi Bank of Japan, Tokyo
Mr Yukihiro Nakamura
Ms Rie Asakura Financial Services Agency, Tokyo
Mr Tomoyoshi Teramura
Korea Mr Hwang Hwang Ahn Financial Supervisory Service, Seoul
Luxembourg Mr Pierrot Rasqué Surveillance Commission for the Financial Sector, Luxembourg
Netherlands Mr Ron Jongen Netherlands Bank, Amsterdam
Russia Ms Anna Kartashova Central Bank of the Russian Federation, Moscow
Saudi Arabia Mr Syed Mehdi Hassan Saudi Arabian Monetary Agency, Riyadh
Singapore Mr Keng Heng Tan Monetary Authority of Singapore
South Africa Mr Jaco Vermeulen South African Reserve Bank, Pretoria
Spain Mr Adolfo Rodriguez Bank of Spain, Madrid
A revised document has been issued in March 2014. http://www.bis.org/publ/bcbs278.htm

vi Basel III Monitoring Report September 2013
Sweden Mr Andreas Borneus Finansinspektionen, Stockholm
Switzerland Mr Uwe Steinhauser Swiss Financial Market Supervisory Authority FINMA, Berne
Turkey Mr Sadik Atalay Banking Regulation and Supervision Agency, Ankara
United Kingdom Mr Tobias Neumann Bank of England, London
Mr Peter Thomas Prudential Regulation Authority, London
Ms Sita Patel
United States Mr Eric Kennedy Board of Governors of the Federal Reserve System, Washington, DC Mr David Emmel
Ms Eva Shi Federal Reserve Bank of New York
Mr Phillip Weed
Ms Andrea Plante Federal Deposit Insurance Corporation, Washington, DC Mr Kyle Hadley
Mr Karl Reitz Mr Paul Vigil Mr Peter Yen
Mr David Elkes Office of the Comptroller of the Currency, Washington, DC
EU Mr Audrius Pranckevicius European Commission, Brussels
Secretariat Mr Marcus Jellinghaus Mr Davy Reinard
Bank for International Settlements, Basel
Mr Gabriele Gasperini Mr Markus Zoss
A revised document has been issued in March 2014. http://www.bis.org/publ/bcbs278.htm

Basel III Monitoring Report September 2013 1
Large internationally active banks’ risk-based capital shortfalls continue to decrease
Highlights of the Basel III monitoring exercise as of 31 December 2012
To ascertain the impact on banks of the Basel III framework,1 the Basel Committee on Banking Supervision monitors the impact of the reforms in order to gather evidence on its dynamics. For this purpose, a semi-annual monitoring framework has been set up on the risk-based capital ratio, the leverage ratio, and the liquidity metrics using data collected by national supervisors on a representative sample of institutions in each country. This report is the fourth publication of results of the Basel III monitoring exercise2 and summarises the aggregate results using data as of 31 December 2012. The Committee believes that the information contained in the report will provide the relevant stakeholders with a useful benchmark for analysis.
Information considered for this report was obtained by data submissions of individual banks to their national supervisors on a voluntary and confidential basis. A total of 223 banks participated in the study, including 101 Group 1 banks and 122 Group 2 banks.3 Members’ coverage of their banking sector is very high for Group 1 banks, reaching 100% coverage for some countries, while coverage is comparatively lower for Group 2 banks and varied across countries.
In general, this report does not take into account any transitional arrangements such as phase-in of deductions and grandfathering arrangements. Rather, the estimates presented generally assume full implementation of the final Basel III requirements based on data as of 31 December 2012. No assumptions have been made about banks’ profitability or behavioural responses, such as changes in bank capital or balance sheet composition, since this date or in the future. For this reason, the results are not comparable to current industry estimates, which tend to be based on forecasts and consider management actions to mitigate the impact, and incorporate estimates where information is not publicly available.
1 Basel Committee on Banking Supervision, Basel III: A global framework for more resilient banks and the banking system,
December 2010 and revised June 2011; Basel Committee on Banking Supervision, Basel III: International framework for liquidity risk measurement, standards and monitoring, December 2010; Basel Committee on Banking Supervision, Basel III: The Liquidity Coverage Ratio and liquidity risk monitoring tools, January 2013. These documents are available on the Committee’s website at www.bis.org/bcbs/basel3.htm.
2 A list of previous publications is included in the Annex. 3 Group 1 banks are those that have Tier 1 capital in excess of €3 billion and are internationally active. All other banks are
considered Group 2 banks.
A revised document has been issued in March 2014. http://www.bis.org/publ/bcbs278.htm
2 Basel III Monitoring Report September 2013
Risk-based capital requirements
In the analysis of the risk-based capital requirements, this report focuses on the following items, assuming the positions as of 31 December 2012 were subject to the fully phased-in Basel III standards:
• Changes to bank capital ratios under the new requirements, and estimates of any capital deficiencies relative to fully phased-in minimum and target capital requirements (including capital surcharges for global systemically important banks – G-SIBs);
• Changes to the definition of capital that result from the new capital standard, referred to as common equity Tier 1 (CET1), including a reallocation of deductions to CET1, and changes to the eligibility criteria for Additional Tier 1 and Tier 2 capital; and
• Increases in risk-weighted assets resulting from changes to the definition of capital, securitisation exposures, trading book and counterparty credit risk requirements.
Capital shortfalls
Assuming full implementation of the Basel III requirements as of 31 December 2012, including changes to the definition of capital and risk-weighted assets, and ignoring phase-in arrangements, Group 1 banks would have an overall shortfall of €2.2 billion for the CET1 minimum capital requirement of 4.5%, which rises to €115.0 billion for a CET1 target level of 7.0% (ie including the capital conservation buffer); the latter target also includes the G-SIB surcharge according to the list of banks published by the Financial Stability Board in November 2012 where applicable.4 As a point of reference, the sum of profits after tax prior to distributions across the same sample of Group 1 banks during 2012 was €419.4 billion.
Compared to the previous report, the aggregate CET1 shortfall with respect to the 4.5% minimum for Group 1 banks has improved – it is €1.5 billion or 40.1% lower than previously. At the CET1 target level of 7.0% (plus the surcharges on G-SIBs as applicable), the aggregate CET1 shortfall for Group 1 banks has also improved – it is €82.9 billion or 41.9% lower than previously.
Under the same assumptions, the capital shortfall for Group 2 banks included in the Basel III monitoring sample is estimated at €11.4 billion for the CET1 minimum of 4.5% and €25.6 billion for a CET1 target level of 7.0%. While this represents an increase compared to the previous period, this is mainly due to some Group 2 banks which are included for the first time (ie the sample has been expanded in size) and a very small part of the sample with an increase in shortfalls. The sum of Group 2 bank profits after tax prior to distributions in 2012 was €29.5 billion.
Capital ratios
Compared to the current regulatory framework, the average CET1 ratio under the Basel III framework would decline from 11.4% to 9.2% for Group 1 banks and from 10.3% to 8.6% for Group 2 banks. The Tier 1 capital ratios of Group 1 banks would decline, on average from 12.5% to 9.4% and total capital ratios would decline from 15.1% to 10.6%. As with the CET1 ratios, the decline in other capital ratios is comparatively less pronounced for Group 2 banks; Tier 1 capital ratios would decline on average from 10.8% to 9.0% and total capital ratios would decline on average from 14.2% to 10.8%.
4 See Financial Stability Board, Update of group of global systemically important banks (G-SIBs), 1 November 2012
(www.financialstabilityboard.org/publications/r_121031ac.pdf).
A revised document has been issued in March 2014. http://www.bis.org/publ/bcbs278.htm

Basel III Monitoring Report September 2013 3
Leverage ratio
The weighted average Basel III Tier 1 leverage ratios for all banks and for Group 1 banks are respectively 3.8% and 3.7%. For Group 2 banks, the average Basel III Tier 1 leverage ratio is 4.1%. Note that the calculations in this report are only approximations of the latest proposals on the leverage ratio published by the Committee in June 20135 and do not fully reflect the new treatments foreseen for credit derivatives. Assuming all banks meet an 8.5% Basel III capital ratio, an additional capital increase of €71.7 billion for Group 1 banks and €12.6 billion for Group 2 banks is required for all banks to meet the minimum leverage ratio standard.
Liquidity standards
The Liquidity Coverage Ratio (LCR) was revised by the Committee in January 20136 and will come into effect on 1 January 2015. The minimum requirement will be set at 60% and then rise in equal annual steps to reach 100% in 2019. The end-December 2012 reporting period was the first data collection exercise for which a comprehensive calculation of the revised LCR standard could be conducted. Given such data was not collected for the end-June 2012 period, period-over-period comparisons for the LCR are therefore not provided; however comparisons are provided using end-December 2012 data between the revised LCR standard issued in January 2013 and the original LCR standard issued in December 2010.7 Key observations from this comparison include:
• A total of 101 Group 1 and 121 Group 2 banks participated in the liquidity monitoring exercise for the end-December 2012 reference period.
• The weighted average LCR for the Group 1 bank sample was 119%. For Group 2 banks, the average LCR was 126%. These figures compare to average LCRs of 95% and 99% for Group 1 banks and Group 2 banks, respectively, under the December 2010 version of the LCR standards.
• 68% of the 222 banks in the sample reported an LCR that met or exceeded a 100% minimum requirement, while 90% banks reported an LCR at or above a 60% minimum requirement.
• The aggregate LCR shortfall at a minimum requirement of 100% was €563 billion, which represents approximately 0.9% of the €63.1 trillion total assets of the aggregate sample. The aggregate LCR shortfall at a minimum requirement of 60% was €248 billion (less than 0.4% of banks’ assets).
The Net Stable Funding Ratio (NSFR) is currently subject to an observation period which includes a review clause to address any unintended consequences prior to its respective implementation date of 1 January 2018. Basel III monitoring results for the end-December 2012 reporting period give an indication of the impact of the calibration of the standard based on the December 2010 text. The weighted average NSFR for the Group 1 bank sample improved slightly to 100%, compared to 99% at the June 2012 reporting date. For Group 2 banks, the average NSFR declined slightly to 99%, compared to 100% as of June 2012. The aggregate shortfall of stable funding was €2.0 trillion, compared to €2.4 trillion at the June 2012 reporting date.
5 Basel Committee on Banking Supervision, Revised Basel III leverage ratio framework and disclosure requirements – consultative
document, June 2013 (www.bis.org/publ/bcbs251.htm). 6 Basel Committee on Banking Supervision, Basel III: The Liquidity Coverage Ratio and liquidity risk monitoring tools, January
2013 (www.bis.org/publ/bcbs238.pdf). 7 Basel Committee on Banking Supervision, Basel III: International framework for liquidity risk measurement, standards and
monitoring, December 2010 (www.bis.org/publ/bcbs188.pdf).
A revised document has been issued in March 2014. http://www.bis.org/publ/bcbs278.htm

A revised document has been issued in March 2014. http://www.bis.org/publ/bcbs278.htm

Basel III Monitoring Report September 2013 5
Detailed results of the Basel III monitoring exercise as of 31 December 2012
1. General remarks
At its 12 September 2010 meeting, the Group of Governors and Heads of Supervision (GHOS), the oversight body of the Basel Committee on Banking Supervision, announced a substantial strengthening of existing capital requirements and fully endorsed the agreements it reached on 26 July 2010.1 These capital reforms, together with the introduction of two international liquidity standards, delivered on the core of the global financial reform agenda presented to the Seoul G20 Leaders summit in November 2010. Subsequent to the initial comprehensive quantitative impact study published in December 2010, the Committee continues to monitor and evaluate the impact of these capital, leverage and liquidity requirements (collectively referred to as “Basel III”) on a semi-annual basis.2 This report summarises results of the latest Basel III monitoring exercise using 31 December 2012 data.3
1.1 Scope of the monitoring exercise
All 27 Committee member countries participated in the Basel III monitoring exercise as of 31 December 2012. The estimates presented are based on data submitted by the participating banks to their national supervisors in reporting questionnaires and in accordance with the instructions prepared by the Committee in February 2013.4 The questionnaire covered components of eligible capital, the calculation of risk-weighted assets (RWA), the calculation of a leverage ratio, and components of the liquidity metrics. The final data were submitted to the Secretariat of the Committee in June 2013.
The purpose of the exercise is to provide the Committee with an ongoing assessment of the impact on participating banks of the capital and liquidity standards set out in the following documents:
1 See the 26 July 2010 press release “The Group of Governors and Heads of Supervision reach broad agreement on Basel
Committee capital and liquidity reform package” (www.bis.org/press/p100726.htm) and the 12 September 2010 press release “Group of Governors and Heads of Supervision announces higher global minimum capital standards” (www.bis.org/press/p100912.htm).
2 A list of previous publications is included in the Annex. 3 The data for Japan are as of the end of September 2012, as banks in that country report on a biannual basis as of the end of
March and the end of September to correspond to the fiscal year-end period. Further, the data for Canada reflect a reporting date of 31 October 2012, which corresponds to Canadian banks’ fiscal fourth-quarter end.
4 See Basel Committee on Banking Supervision, Instructions for Basel III implementation monitoring, February 2013 (www.bis.org/bcbs/qis/).
A revised document has been issued in March 2014. http://www.bis.org/publ/bcbs278.htm

6 Basel III Monitoring Report September 2013
• Revisions to the Basel II market risk framework5 and Guidelines for computing capital for incremental risk in the trading book;6
• Enhancements to the Basel II framework7 which include the revised risk weights for re-securitisations held in the banking book;
• Basel III: A global framework for more resilient banks and the banking system as well as the Committee’s 13 January 2011 press release on loss absorbency at the point of non-viability;8
• International framework for liquidity risk measurement, standards and monitoring;9
• Global systemically important banks: Assessment methodology and the additional loss absorbency requirement as well as the upated list of G-SIBs published by the Financial Stability Board in November 2012;10 and
• Basel III: The Liquidity Coverage Ratio and liquidity risk monitoring tools.11
1.2 Sample of participating banks
A total of 223 banks participated in the study, including 101 Group 1 banks and 122 Group 2 banks.12 Group 1 banks are those that have Tier 1 capital in excess of €3 billion and are internationally active. All other banks are considered Group 2 banks. Banks were asked to provide data as of 31 December 2012 at the consolidated level. Subsidiaries are not included in the analyses to avoid double counting. For Group 1 banks members’ coverage of their banking sector was very high reaching 100% coverage for some countries. Coverage for Group 2 banks was comparatively lower and varied across countries.
Not all banks provided data relating to all parts of the Basel III framework. Accordingly, a small number of banks are excluded from individual sections of the Basel III monitoring analysis due to incomplete data. In certain sections, data are based on a consistent sample of banks. This consistent sample represents only those banks that reported necessary data at the June 2011 (labelled “H1 2011”), December 2011 (“H2 2011”), June 2012 (“H1 2012”) and December 2012 (“H2 2012”) reporting dates, in order to make more meaningful period-to-period comparisons.
The Committee appreciates the significant efforts contributed by both banks and national supervisors to this ongoing data collection exercise.
5 Basel Committee on Banking Supervision, Revisions to the Basel II market risk framework, July 2009
(www.bis.org/publ/bcbs158.htm). 6 Basel Committee on Banking Supervision, Guidelines for computing capital for incremental risk in the trading book, July 2009
(www.bis.org/publ/bcbs159.htm). 7 Basel Committee on Banking Supervision, Enhancements to the Basel II framework, July 2009
(www.bis.org/publ/bcbs157.htm). 8 The Committee’s 13 January 2011 press release on loss absorbency at the point of non-viability is available at
www.bis.org/press/p110113.htm. 9 Basel Committee on Banking Supervision, Basel III: International framework for liquidity risk measurement, standards and
monitoring, December 2010 (www.bis.org/publ/bcbs188.htm). 10 Basel Committee on Banking Supervision, Global systemically important banks: Assessment methodology and the additional
loss absorbency requirement, November 2011 (www.bis.org/publ/bcbs207.htm); Financial Stability Board, Update of group of global systemically important banks (G-SIBs), 1 November 2012 (www.financialstabilityboard.org/publications/ r_121031ac.pdf).
11 Basel Committee on Banking Supervision, Basel III: The Liquidity Coverage Ratio and liquidity risk monitoring tools, January 2013 (www.bis.org/publ/bcbs238.htm).
12 See Table A.1 in the Statistical Annex for details on the sample.
A revised document has been issued in March 2014. http://www.bis.org/publ/bcbs278.htm

Basel III Monitoring Report September 2013 7
1.3 Methodology
Unless otherwise noted, the impact assessment was carried out by comparing banks’ capital positions under Basel III to the current regulatory framework implemented by the national supervisor.13 With the exception of transitional arrangements for non-correlation trading securitisation positions in the trading book,14 Basel III results are calculated without considering transitional arrangements pertaining to the phase-in of deductions and grandfathering arrangements.
Reported average amounts in this document have been calculated by creating a composite bank at a total sample level, which effectively means that the total sample averages are weighted. For example, the average common equity Tier 1 capital ratio is the sum of all banks’ common equity Tier 1 capital for the total sample divided by the sum of all banks’ risk-weighted assets for the total sample. Similarly, the average Tier 1 leverage ratio is the sum of all banks’ Tier 1 capital for the total sample divided by the sum of all banks’ leverage ratio exposures for the total sample.
To maintain confidentiality, many of the results shown in this report are presented using box plot charts. The median value is represented by a thick horizontal line, with 50% of the values falling in the range shown by the box. In contrast to the presentation in previous reports, the upper and lower end points of the thin vertical lines show the range of the entire sample unless noted otherwise.
To estimate the impact of implementing the Basel III framework on capital, comparisons are made between those elements of Tier 1 capital which are not subject to a limit under the national implementation of Basel I or Basel II, and CET1 under Basel III.
1.4 Data quality
For this monitoring exercise, participating banks submitted comprehensive and detailed non-public data on a voluntary and best-efforts basis. As with the previous studies, national supervisors worked extensively with banks to ensure data quality, completeness, and consistency with the published reporting instructions. Banks are included in the various analyses that follow only to the extent they were able to provide sufficient quality data to complete the analyses.
Data quality has improved significantly throughout the iterations of the Basel III monitoring exercise, although it is still the case that some differences across banks could be attributed to differing interpretations of the standards, rather than underlying differences in risk.
1.5 Interpretation of results
The following caveats apply to the interpretation of results shown in this report:
• When comparing results to prior reports, sample differences as well as minor revisions to previous periods’ data need to be taken into account. Sample differences also explain why results presented for the December 2012 reporting date may differ from the H2 2012 data point in charts and tables showing the time series for the consistent sample of banks as described above.
13 Although banks in the United States are currently subject to Basel I capital requirements, most submitted data for this
exercise on a Basel II basis. Banks in China report on a Basel I basis. 14 For non-correlation trading securitisations in the trading book, capital charges are calculated as the larger of the capital
charge for net long or net short positions. After 31 December 2013, the charge for these positions will change to the sum of capital charges for net long and net short positions.
A revised document has been issued in March 2014. http://www.bis.org/publ/bcbs278.htm

8 Basel III Monitoring Report September 2013
• The new standards for counterparty credit risk are not fully accounted for in the report, as banks have not been asked to provide data for capital charges for exposures to central counterparties (CCPs).15
• The actual impact of the new requirements will almost surely be lower than shown in this report given the phased-in implementation of the standards and interim adjustments made by the banking sector to changing economic conditions and the regulatory environment. For example, the results do not consider bank profitability, changes in capital or portfolio composition, or other management responses to the policy changes since 31 December 2012 or in the future. For this reason, the results are not comparable to industry estimates, which tend to be based on forecasts and consider management actions to mitigate the impact, as well as incorporate estimates where information is not publicly available.
• The Basel III capital amounts shown in this report assume that all common equity deductions are fully phased in and all non-qualifying capital instruments are fully phased out, ie it is assumed that none of these capital instruments will be replaced by eligible instruments. As such, these amounts underestimate the amount of Tier 1 capital and Tier 2 capital held by a bank as they do not give any recognition for non-qualifying instruments that are actually phased out over nine years.
• The treatment of deductions and non-qualifying capital instruments also affects figures reported in the leverage ratio section. The assumption that none of these capital instruments will be replaced by eligible instruments will become less of an issue as the implementation date of the leverage ratio nears. In particular, in 2013, the capital amounts based on the capital requirements in place on the Basel III monitoring reporting date will reflect the amount of non-qualifying capital instruments included in capital at that time. These amounts will therefore be more representative of the capital held by banks at the implementation date of the leverage ratio.
2. Regulatory capital, capital requirements and capital shortfalls
Table 1 shows the aggregate capital ratios under the current and Basel III frameworks and the capital shortfalls if Basel III were fully implemented (“view 2022”), both for the definition of capital and the calculation of risk-weighted assets, as of December 2012. Details on capital ratios and capital shortfalls are provided in Sections 2.1 and 2.2.
The Basel III framework includes the following phase-in provisions for capital ratios:
• For CET1, the highest form of loss absorbing capital, the minimum requirement will be raised to 4.5% and will be phased-in by 1 January 2015;
• For Tier 1 capital, the minimum requirement will be raised to 6.0% and will be phased-in by 1 January 2015;
• For total capital, the minimum requirement remains at 8.0%;
• Regulatory adjustments (ie possibly stricter sets of deductions that apply under Basel III) will be fully phased-in by 1 January 2018;
• An additional 2.5% capital conservation buffer above the regulatory minimum capital ratios, which must be met with CET1, will be phased-in by 1 January 2019; and
15 Basel Committee on Banking Supervision, Capital requirements for bank exposures to central counterparties, July 2012
(www.bis.org/publ/bcbs227.htm).
A revised document has been issued in March 2014. http://www.bis.org/publ/bcbs278.htm

Basel III Monitoring Report September 2013 9
• The additional loss absorbency requirement for G-SIBs, which ranges from 1.0% to 3.5%, will be phased in fully by 1 January 2019. It will be applied as the extension of the capital conservation buffer and must be met with CET1.
The Annex includes a detailed overview of the Basel Committee’s phase-in arrangements.
Aggregate capital ratios and (incremental) capital shortfalls1 Table 1
Fully implemented requirement, in per cent
Capital ratios, in per cent
Capital shortfalls, in billions of euros
Minimum
Minimum plus capital
conservation buffer
Current Basel III Minimum Overall target2
Group 1
CET1 capital 4.5 7.0 11.4 9.2 2.2 115.0
Tier 1 capital 6.0 8.5 12.5 9.4 10.2 154.8
Total capital 8.0 10.5 15.1 10.6 45.7 171.3
Sum 58.2 441.0
Group 2
CET1 capital 4.5 7.0 10.3 8.6 11.4 25.6
Tier 1 capital 6.0 8.5 10.8 9.0 2.3 11.5
Total capital 8.0 10.5 14.2 10.8 8.7 14.6
Sum 22.5 51.6 1 The shortfall is calculated as the sum across individual banks where a shortfall is observed. The calculation includes all changes to risk-weighted assets (eg definition of capital, counterparty credit risk, trading book and securitisation in the banking book). The Tier 1 and total capital shortfalls are incremental assuming the higher tier capital requirements are fully met. 2 The shortfalls at the overall target level include the capital conservation buffer and the capital surcharges for 28 G-SIBs as applicable.
Source: Basel Committee on Banking Supervision.
2.1 Capital ratios
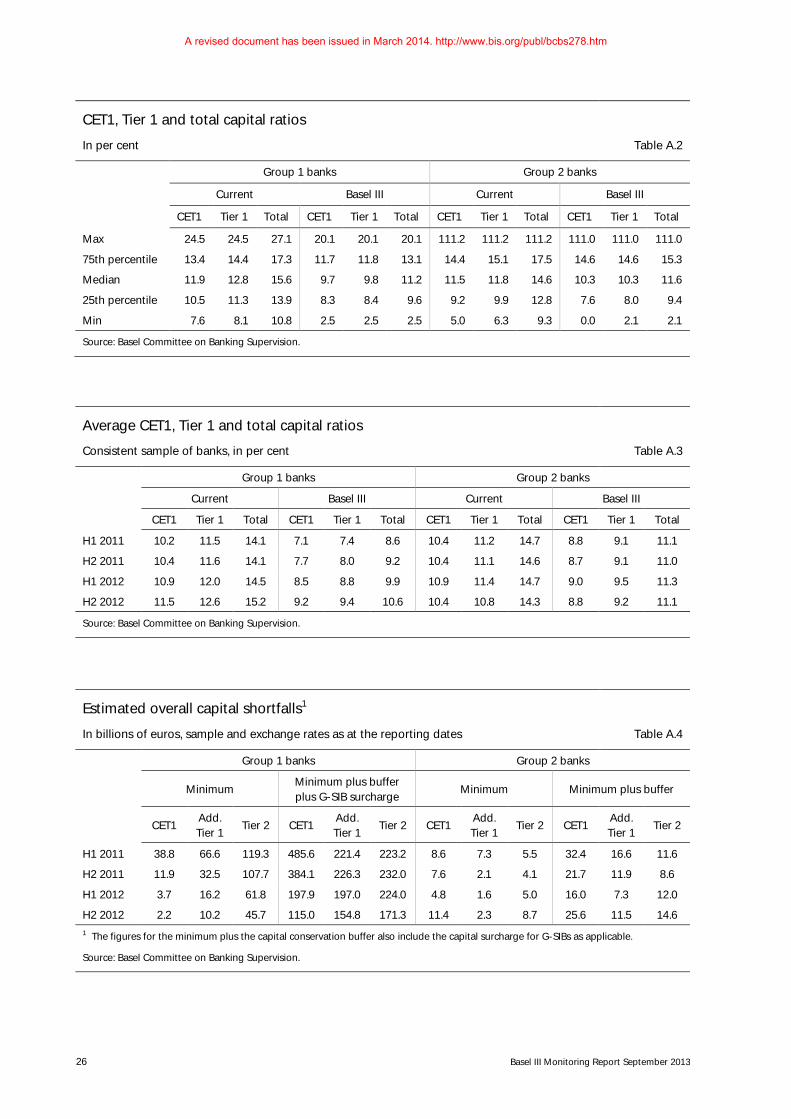
As compared to current CET1, the average CET1 capital ratio of Group 1 banks would have fallen by around one-fifth from 11.4% to 9.2% (a decline of 2.2 percentage points) when Basel III deductions and risk-weighted assets are taken into account. The reduction in the CET1 capital ratio of Group 2 banks is smaller (from 10.3% to 8.6%), which indicates that the new framework has greater impact on larger banks. Results show significant variation across banks as shown in Graph 1. The reduction in CET1 ratios is driven by the new definition of eligible capital, deductions that were not previously applied at the common equity level of Tier 1 capital in most countries (numerator), and by increases in risk-weighted assets (denominator). Banks engaged heavily in trading or counterparty credit activities tend to show the largest denominator effects as these activities attract substantively higher capital charges under the new framework.
Tier 1 capital ratios of Group 1 banks would on average decline 3.1 percentage points from 12.5% to 9.4%, and total capital ratios of this same group would decline on average by 4.5 percentage points from 15.1% to 10.6%. As with CET1, Group 2 banks show a more moderate decline in Tier 1 capital ratios from 10.8% to 9.0%, and a decline in total capital ratios from 14.2% to 10.8%.
A revised document has been issued in March 2014. http://www.bis.org/publ/bcbs278.htm

10 Basel III Monitoring Report September 2013
CET1, Tier 1 and total capital ratios Graph 1
Group 1 banks Per cent Per cent
Group 2 banks
Per cent Per cent
1 The median value is represented by a thick horizontal line, with 50% of the values falling in the range shown by the box. The upper and lower end points of the vertical lines show the range of the entire sample. Some banks with capital ratios above 20% are included in the calculation but are not shown in the graph.
Source: Basel Committee on Banking Supervision. See also Table A.2.
Graph 2 shows that out of the 100 banks in the Group 1 sample, 99% show a CET1 ratio under Basel III that is at least equal to the 4.5% minimum capital requirement and 90% show a CET1 ratio above the 7.0% target ratio (ie, the minimum capital requirement plus the capital conservation buffer). Of the 116 banks in the Group 2 sample, 109 (94%) report a CET1 ratio equal to or higher than 4.5%; while 95 banks (82%) also achieve the target of 7.0%.
A revised document has been issued in March 2014. http://www.bis.org/publ/bcbs278.htm

Basel III Monitoring Report September 2013 11
Distribution of Basel III CET1 ratios Graph 2
Group 1 banks Group 2 banks
Source: Basel Committee on Banking Supervision.
Graph 3 shows the average capital ratios under the current regime and Basel III for Group 1 and Group 2 banks for the periods end-June 2011, end-December 2011, end-June 2012 and end-December 2012. Current capital ratios remained the same or improved only slightly for both Group 1 and Group 2 banks. However, the CET1, Tier 1 and total capital ratios for Group 1 banks under the Basel III framework improved by 2.1, 2.0 and 2.0 percentage points, respectively, over the previous 18 months. For Group 2 banks, capital ratios remained almost stable. The general improvement in Basel III capital ratios for both groups is due to Basel III-eligible capital added, slightly lower overall risk-weighted assets and to a lesser extent due to lower levels of deductions that reduce CET1.
Average CET1, Tier 1 and total capital ratios
Consistent sample of banks Graph 3
Group 1 banks Group 2 banks Per cent Per cent Per cent Per cent
Source: Basel Committee on Banking Supervision. See also Table A.3.
A revised document has been issued in March 2014. http://www.bis.org/publ/bcbs278.htm

12 Basel III Monitoring Report September 2013
2.2 Capital shortfalls
Graph 4 and Table 1 provide estimates of the amount of capital that Group 1 and Group 2 banks would need based on data as of 31 December 2012 in addition to capital already held at the reporting date, in order to meet the target CET1, Tier 1 and total capital ratios under Basel III assuming fully phased-in target requirements and deductions. Under these assumptions, the CET1 capital shortfall for Group 1 banks with respect to the 4.5% CET1 minimum requirement is €2.2 billion. The CET1 shortfall with respect to the 4.5% requirement for Group 2 banks, where coverage of the sector is considerably smaller, is estimated at €11.4 billion. For a CET1 target of 7.0% (ie the 4.5% CET1 minimum plus the 2.5% capital conservation buffer) plus any capital surcharge for Group 1 G-SIBs as applicable according to the updated list of banks published by the Financial Stability Board in November 2012, Group 1 banks’ shortfall is €115.0 billion and Group 2 banks’ shortfall is €25.6 billion. Of the 28 G-SIBs included in this Basel III monitoring exercise, 15 G-SIBs have already reached the CET1 target level plus the surcharge. Eight G-SIBs have a shortfall at the CET1 target level due only to the application of the capital surcharge for G-SIBs. As a point of reference, the aggregate sum of after-tax profits prior to distributions during 2012 for Group 1 and Group 2 banks in the same sample was €419.4 billion and €29.5 billion, respectively.
Assuming the 4.5% CET1 minimum capital requirements were fully met (ie there were no CET1 shortfalls), Group 1 banks would need an additional €10.2 billion of additional Tier 1 or CET1 capital to meet the minimum Tier 1 capital ratio requirement of 6.0%. Assuming banks already hold 7.0% CET1 capital plus the surcharges on G-SIBs as applicable, Group 1 banks would need an additional €154.8 billion of additional Tier 1 or CET1 capital to meet the Tier 1 capital target ratio of 8.5% (ie the 6.0% Tier 1 minimum plus the 2.5% CET1 capital conservation buffer) plus the surcharges on G-SIBs as applicable, respectively. Group 2 banks would need an additional €2.3 billion and an additional €11.5 billion to meet these respective Tier 1 capital minimum and target ratio requirements.
Assuming CET1 and Tier 1 capital requirements were fully met (ie, there were no shortfalls in either CET1 or Tier 1 capital), Group 1 banks would need an additional €45.7 billion of Tier 2 or higher quality capital to meet the minimum total capital ratio requirement of 8.0% and an additional €171.3 billion of Tier 2 or higher quality capital to meet the total capital target ratio of 10.5% (ie the 8.0% Tier 1 minimum plus the 2.5% CET1 capital conservation buffer) plus the surcharges on G-SIBs as applicable. Group 2 banks would need an additional €8.7 billion of Tier 2 or higher quality capital and an additional €14.6 billion of Tier 2 or higher quality capital to meet these respective total capital minimum and target ratio requirements.
As indicated above, no assumptions have been made about bank profits or behavioural responses, such as changes in balance sheet composition, which will serve to reduce the impact of capital shortfalls over time.
Compared to the June 2012 exercise, the aggregate CET1 shortfall with respect to the 4.5% minimum for Group 1 banks has improved – it is €1.5 billion or 40.1% lower than previously. At the CET1 target level of 7.0% plus the surcharges on G-SIBs as applicable, the aggregate CET1 shortfall for Group 1 banks has also improved – it is €82.9 billion or 41.9% lower than previously (see Graph 4).
For Group 2 banks total shortfalls increased compared to the previous period. However, this is mainly due to some Group 2 banks which are included for the first time and a very small part of the sample with an increase in shortfalls.
A revised document has been issued in March 2014. http://www.bis.org/publ/bcbs278.htm

Basel III Monitoring Report September 2013 13
Estimated overall capital shortfalls1
Sample and exchange rates as at the reporting dates Graph 4
Group 1 banks Group 2 banks € bn € bn € bn € bn
1 The figures for the minimum plus the capital conservation buffer also include the capital surcharge for G-SIBs as applicable. The height of each bar shows the aggregated capital shortfall considering requirements for each tier (ie, CET1, Tier 1, and Total) of capital. The sample of banks is not consistent over the two-year period (Group 1 includes 101 banks in H1 2011 and H2 2011 and 100 banks in H1 2012 and H2 2012; Group 2 includes 110 banks in H1 2011, 108 in H2 2011, 105 in H1 2012 and 116 in H2 2012).
Source: Basel Committee on Banking Supervision. See also Table A.4.
2.3 Level of capital
Graph 5 shows the development of the level of CET1 capital of all banks in the sample separately for Group 1 banks, Group 2 banks and G-SIBs. From end-June 2011 to end-December 2012, the level of Group 1 banks’ CET1 has increased by €438 billion to €2,496 billion. Almost half of the increase, €214 billion, can be attributed to the G-SIBs in the sample which collectively held €1,312 billion of capital at the end of 2012. The capital raised by Group 1 banks varied between €41.2 billion in the first half of 2011 and €26.8 billion in the second half of 2011. Of these amounts, between €12.5 billion and €19.7 billion were raised by the G-SIBs in the sample.
A revised document has been issued in March 2014. http://www.bis.org/publ/bcbs278.htm

14 Basel III Monitoring Report September 2013
Level of CET1 capital and CET1 capital raised
Consistent sample of banks, exchange rates as of 31 December 2012 Graph 5
Level of CET1 capital € billions
CET1 capital raised € billions
Source: Basel Committee on Banking Supervision. See also Table A.5.
Over the second half of 2012, the Group 1 banks in the sample raised €29.2 billion of CET1 capital (see Table 2). Approximately half of this amount was raised by 17 of the 28 G-SIBs in the sample.
Capital raised during H2 2012
In billions of euros Table 2
Number of banks
Number of banks which raised capital
during H2 2012
CET1 Additional Tier 1
Tier 2
Group 1 100 40 29.2 6.8 17.0
of which: G-SIBs 28 17 14.3 3.4 9.4
Group 2 115 36 5.8 0.0 2.0
Source: Basel Committee on Banking Supervision.
2.4 Composition of capital
Graph 6 shows the composition of total capital for Group 1 and Group 2 banks under the current national regime and after full implementation of Basel III.
For Group 1 banks, the share of Basel III CET1 to total capital is 86.7%. Additional Tier 1 and Tier 2 capital amount to 2.1% and 11.2% of the total capital of Group 1 banks, respectively. Of the Group 1 bank sample, 66% hold Basel III CET1 representing 90% or more of Basel III total capital. In the Group 2 sample, banks hold a somewhat lower share of CET1 at 79.4% with correspondingly higher shares of additional Tier 1 capital (3.3%) and Tier 2 capital (17.3%). Under the current national regime, the share of CET1 to total capital is lower at 75.7% for Group 1 banks and at 72.5% for Group 2 banks, with correspondingly higher shares of additional Tier 1 and Tier 2 capital.
A revised document has been issued in March 2014. http://www.bis.org/publ/bcbs278.htm

Basel III Monitoring Report September 2013 15
Structure of regulatory capital under the current national regime and Basel III1
Consistent sample of banks Graph 6
Group 1 banks Group 2 banks Per cent Per cent Per cent Per cent
1 Any remainder in current columns represents Tier 3 capital.
Source: Basel Committee on Banking Supervision. See also Table A.6.
Regarding the composition of Basel III CET1 capital itself, paid-in capital (45.7% for Group 1 banks and 42.9% for Group 2 banks) and retained earnings (50.4% for Group 1 banks and 49.4% for Group 2 banks) comprises the predominant form of gross CET1 outstanding. Accumulated other comprehensive income (AOCI) makes up a substantial portion of CET1 outstanding in a few countries but only contributes 3.0% of gross CET1 on average for Group 1 banks and 5.1% for Group 2 banks. Meanwhile, total minority interest given recognition in CET1 contributes only 0.9% and 2.5% to outstanding CET1 balances of Group 1 and Group 2 banks, respectively.
2.5 Leverage ratio
The results regarding the leverage ratio are provided using two measures of a Tier 1 capital numerator:
• Basel III Tier 1, which is the fully phased-in Basel III definition of Tier 1 capital; and
• Current Tier 1, which is Tier 1 capital eligible under the Basel III agreement at the reporting date.
The leverage ratio exposure measure includes:
• on-balance sheet exposures recorded at accounting values with the exception of securities financing transactions and derivatives;
• securities financing transaction exposures recorded at gross values and including a counterparty exposure measure;
• derivatives exposures (including credit derivatives) recorded at current replacement cost and including an add-on for potential future exposure based on the current exposure method, without considering the effect of any collateral received;
• off-balance sheet exposures calculated using a 100% credit conversion factor except for unconditionally cancellable commitments, which are included using a 10% credit conversion factor; and
• additional exposures from investees that are consolidated for accounting purposes and not for risk-based regulatory purposes.
A revised document has been issued in March 2014. http://www.bis.org/publ/bcbs278.htm

16 Basel III Monitoring Report September 2013
Note that the calculations in this report are only approximations of the latest proposals on the leverage ratio published by the Committee in June 201316 and do in particular not fully reflect the new treatments foreseen for credit derivatives.
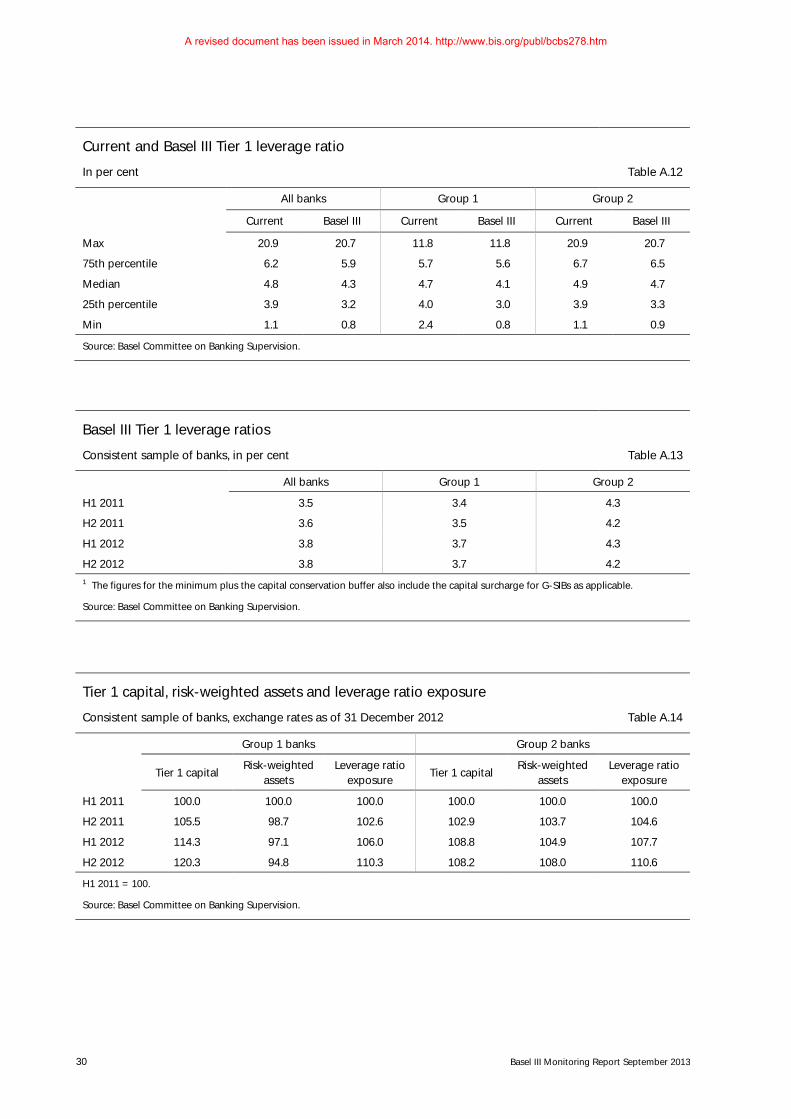
Total exposures of the 101 Group 1 banks in the sample according to the definition of the denominator in the Basel III Tier 1 leverage ratio were €68.8 trillion while total exposures for the 118 Group 2 banks were €6.0 trillion. Graph 7 presents leverage ratios based on current Tier 1 and Basel III Tier 1 capital. The chart provides this information for all banks, Group 1 banks and Group 2 banks. The weighted average current Tier 1 leverage ratio for all banks and for Group 1 banks is 4.4%. For Group 2 banks, it is 4.6%. The weighted average Basel III Tier 1 leverage ratio for all banks is 3.8%, for Group 1 banks it is 3.7%, and for Group 2 banks the average is 4.1%.
The analysis shows that Group 2 banks are generally less leveraged than Group 1 banks, and this difference increases under Basel III when the requirements are fully phased in. It is likely that a portion of this effect is due to the changes in the definition of capital, which, as seen in Section 2, are likely to affect Group 1 banks more than Group 2 banks.
Current Tier 1 and Basel III Tier 1 leverage ratios1 Graph 7
All banks Per cent
Group 1 Per cent
Group 2 Per cent
1 The median value is represented by thick and horizontal line, with 50% of the values falling in the range shown by the box. The upper and lower end points of the vertical lines generally show the range of the entire sample. Group 2 banks with leverage ratios above 12% are included in the calculation but are not shown in the graph.
Source: Basel Committee on Banking Supervision. See also Table A.12.
Under the current Tier 1 leverage ratio, 19 banks in the sample would not meet the 3% Tier 1 leverage ratio level, including 7 Group 1 banks and 12 Group 2 banks. Under the Basel III Tier 1 leverage ratio, 51 banks in the sample would not meet the 3% Tier 1 leverage ratio level, including 25 Group 1 banks and 26 Group 2 banks.
Graph 8 shows how the leverage ratios under the current and Basel III definitions of capital evolve over time for a consistent sample of 97 Group 1 and 101 Group 2 banks which provided leverage ratio data for all four reporting dates from June 2011 to December 2012. The overall result is mainly driven by an increase in the Basel III leverage ratio of Group 1 banks from 3.4% in June 2011 to 3.7% in December 2012. The leverage ratios for Group 1 banks using the current definition of capital as well as Group 2 banks’ ratios are largely unchanged.
16 Basel Committee on Banking Supervision, Revised Basel III leverage ratio framework and disclosure requirements – consultative
document, June 2013 (www.bis.org/publ/bcbs251.htm).
A revised document has been issued in March 2014. http://www.bis.org/publ/bcbs278.htm

Basel III Monitoring Report September 2013 17
Basel III Tier 1 leverage ratios
Consistent sample of banks Graph 8
All banks Per cent
Group 1 Per cent
Group 2 Per cent
Source: Basel Committee on Banking Supervision. See also Table A.13.
2.6 Relationship between the leverage ratio and risk-based capital requirements
Graph 9 shows the evolution of the components of the capital ratios over time for the same consistent set of banks. The components are Tier 1 capital, risk-weighted assets and total leverage exposure. For Group 1 banks, capital and exposure have been steadily increasing during this time period. However, risk-weighted assets at Group 1 banks have been steadily declining.
Tier 1 capital, risk-weighted assets and leverage ratio exposure
Consistent sample of banks, exchange rates as of 31 December 2012 Graph 9
Group 1 30 June 2011 = 100
Group 2 30 June 2011 = 100
Source: Basel Committee on Banking Supervision. See also Table A.14.
Graph 10 shows the interaction between the Tier 1 leverage and risk-based ratios. The left part of the graph shows leverage ratios (scaled on the horizontal axis) and risk-based capital ratios (scaled on the vertical axis) using Basel III Tier 1 capital. Group 1 banks’ ratios are marked with a red dot, while Group 2 banks’ ratios are marked with a blue dot.
A revised document has been issued in March 2014. http://www.bis.org/publ/bcbs278.htm

18 Basel III Monitoring Report September 2013
The dashed horizontal line represents the 8.5% minimum Tier 1 capital ratio plus capital conservation buffer, which 62 banks in the sample do not meet (25 from Group 1, 37 from Group 2). The dashed vertical line represents the 3% minimum leverage ratio, which 48 banks do not meet (23 Group 1 and 25 Group 2).
The fraction of banks that do not meet the minimum leverage ratio standard is relatively higher (25.0%) in Group 1 than in Group 2 (22.1%). In total, 32 banks (17 Group 1 and 15 Group 2) meet neither the minimum capital ratio nor the minimum leverage ratio and are thus plotted in the lower-left quadrant of the graph.
The diagonal represents points with an equal proportion of the minimum plus buffer risk-based Tier 1 capital ratio (8.5%) and of the minimum leverage ratio (3%). Due to the definition of the ratios, it also represents a normative proportion of 8.5/3=2.83 between total exposure and RWA. For banks which are plotted above the diagonal (30.4% of Group 1 banks and 24.8% of Group 2 banks), this proportion is currently higher, which means that the risk-based capital ratios are more easily fulfilled than the leverage ratio, with the same amount of Tier 1 capital. For banks which are plotted below the diagonal, the proportion exposure/RWA is lower than 2.83, which means that risk-based capital ratios are more difficult to fulfil than the leverage ratio, compared to this normative proportion represented by the diagonal.
The right part of the graph shows the change in ratios that result from a capital increase to the 8.5% Tier 1 risk-based standard for those banks that do not meet that standard. The affected banks are located on the dashed horizontal line.
After raising capital, 15 additional banks (six from Group 1, nine from Group 2) meet the 3% minimum Basel III leverage ratio. For the other 33 banks that do not meet the 3% threshold before raising capital, an additional leverage ratio shortfall needs to be filled to meet the 3% threshold. In absolute numbers, this means that assuming all banks meet an 8.5% Basel III capital ratio, additional capital increases of €71.7 billion for Group 1 and €12.6 billion for Group 2 banks are required to meet the minimum leverage ratio standard).
Tier 1 capital, risk-weighted assets and leverage ratio exposure
Consistent sample of banks Graph 10
Before capital raising Per cent
After capital raising Per cent
Source: Basel Committee on Banking Supervision.
A revised document has been issued in March 2014. http://www.bis.org/publ/bcbs278.htm

Basel III Monitoring Report September 2013 19
3. Liquidity
3.1 Liquidity Coverage Ratio
One of the two standards introduced by the Committee is a 30-day Liquidity Coverage Ratio (LCR) which is intended to promote short-term resilience to potential liquidity disruptions. The LCR has been designed to require global banks to have sufficient high-quality liquid assets to withstand a stressed 30-day funding scenario specified by supervisors. The LCR numerator consists of a stock of unencumbered, high-quality liquid assets that must be available to cover any net outflow, while the denominator is comprised of cash outflows less cash inflows (subject to a cap at 75% of outflows) that are expected to occur in a severe stress scenario.
The LCR was revised by the Committee in January 201317 and will come into effect on 1 January 2015. The minimum requirement will be set at 60% and will then rise in equal annual steps to reach 100% in 2019. The end-December 2012 reporting period was the first data collection exercise for which a comprehensive calculation of the revised LCR standard could be conducted. Given such data was not collected for the end-June 2012 period, unlike other sections of the report, period-over-period comparisons for the LCR are not provided; however comparisons are provided using end-December 2012 data between the revised LCR standard issued in January 2013 and the original LCR standard issued in December 2010.18
101 Group 1 and 121 Group 2 banks provided sufficient data in the 31 December 2012 Basel III monitoring exercise to calculate the LCR according to the revised standard. The weighted average LCR was 119% for Group 1 banks and 126% for Group 2 banks under the revised standard issued in January 2013. These figures compare to average LCRs of 95% and 99% for Group 1 banks and Group 2 banks, respectively, under the December 2010 version of the LCR standard. Some of the drivers of the improvement in the aggregate average LCRs between the original December 2010 standard and the revised January 2013 standards relate to changes in the calibration of run-off rates and drawdown rates (eg those related to non-operational deposits provided by and liquidity facilities provided to non-financial corporates, sovereigns, central banks, PSEs and multilateral development banks) and the incorporation of Level 2B assets in the pool of high-quality liquid assets.
The aggregate numbers under the revised LCR standard do not speak to the range of results across participating banks. Graph 11 below gives an indication of the distribution of bank results; the thick red line indicates the 100% minimum requirement, the thick horizontal lines indicate the median for the respective bank group. 68% of the banks in the Basel III monitoring sample already meet or exceed the final LCR minimum requirement of 100%, while 90% have LCRs that are at or above the initial 60% minimum requirement.
17 Basel Committee on Banking Supervision, Basel III: The Liquidity Coverage Ratio and liquidity risk monitoring tools, January
2013 (www.bis.org/publ/bcbs238.pdf). 18 Basel Committee on Banking Supervision, Basel III: International framework for liquidity risk measurement, standards and
monitoring, December 2010 (www.bis.org/publ/bcbs188.pdf).
A revised document has been issued in March 2014. http://www.bis.org/publ/bcbs278.htm

20 Basel III Monitoring Report September 2013
Liquidity Coverage Ratio1 Graph 11
Per cent
1 The median value is represented by a thick horizontal line, with 50% of the values falling in the range shown by the box. The upper and lower end points of the thin vertical lines show the range of the entire sample. The sample is capped at 400% meaning that all banks with an LCR above 400% were set to 400%. The red horizontal lines represent the 60% minimum (2015, dashed line) and the 100% minimum (2019, solid line).
Source: Basel Committee on Banking Supervision. See also Table A.15.
For the banks in the sample, Basel III monitoring results show a shortfall (ie the difference between high-quality liquid assets and net cash outflows) of €563 billion (which represents approximately 0.9% of the €63.1 trillion total assets of the aggregate sample) as of 31 December 2012, if banks were to make no changes whatsoever to their liquidity risk profile. This number is only reflective of the aggregate shortfall for banks that are below an LCR minimum requirement of 100% and does not reflect surplus liquid assets at banks above a 100% requirement. At an LCR minimum requirement of 60%, the aggregate shortfall for the banks in the sample was €248 billion (less than 0.4% of banks’ assets). Banks that are below a required minimum have until 2015 to meet the standard by scaling back business activities that are most vulnerable to a significant short-term liquidity shock or by lengthening the term of their funding beyond 30 days. Banks may also increase their holdings of liquid assets.
The key components of outflows and inflows are shown in Table 3. Group 1 banks show a notably larger percentage of total outflows, when compared to balance sheet liabilities, than Group 2 banks. This can be explained by the relatively greater contribution of wholesale funding activities and commitments within the Group 1 sample, whereas Group 2 banks, as a whole, are less reliant on these types of activities.
A revised document has been issued in March 2014. http://www.bis.org/publ/bcbs278.htm

Basel III Monitoring Report September 2013 21
LCR outflows and inflows (post-factor) as a percentage of balance sheet liabilities1
In per cent Table 3
Category Group 1 Group 2
Outflows to…
Unsecured retail and small business customers 2.3 2.6
Unsecured non-financial corporates 3.6 1.9
Unsecured sovereign, central bank, public sector entities (PSEs) and multilateral development banks (MDBs)
0.8 0.7
Unsecured financial institutions and other legal entities 5.3 3.8
Other unsecured wholesale funding incl. unsecured debt issuance 1.2 0.7
Secured funding and collateral swaps 1.9 0.8
Collateral, securitisations and own debt 0.9 0.4
Credit and liquidity facilities 1.7 0.6
Other contractual and contingent cash outflows including derivative payables 1.6 1.9
Total outflows2 19.3 13.4
Inflows from…
Financial institutions 1.9 1.8
Retail and small business customers, non-financial corporates, central banks and other entities
1.4 1.3
Secured lending and collateral swaps 1.7 0.6
Other cash inflows including derivative receivables 0.5 1.0
Total inflows2,3 5.6 4.6 1 As reported in the net stable funding ratio. 2 May contain rounding differences. 3 The 75% cap is only applied to the “total inflow” category, which leads the sum of the individual inflow categories for Group 2 banks to exceed the total inflow contribution on account of banks that report inflows that exceeded the cap.
Source: Basel Committee on Banking Supervision.
75% cap on total inflows
As at 31 December 2012, no Group 1 and 20 Group 2 banks reported inflows that exceeded the 75% cap. Of the 20 Group 2 banks, four fail to meet an LCR minimum requirement of 100%, so the cap is binding on them at that required minimum level.
Composition of high-quality liquid assets
The composition of high-quality liquid assets currently held at banks is depicted in Graph 12. The majority of Group 1 and Group 2 banks’ holdings, in aggregate, are comprised of Level 1 assets; however the sample, on whole, shows diversity in their holdings of eligible liquid assets. Within Level 1 assets, 0% risk-weighted securities issued or guaranteed by sovereigns, central banks and PSEs, and cash and central bank reserves comprise the most significant portions of the qualifying pool. Comparatively, within the Level 2A asset class, the majority of holdings are comprised of 20% risk-weighted securities issued or guaranteed by sovereigns, central banks or PSEs. Eligible non-financial common equity shares comprise the majority of holdings of Level 2B assets.
A revised document has been issued in March 2014. http://www.bis.org/publ/bcbs278.htm

22 Basel III Monitoring Report September 2013
Composition of holdings of eligible liquid assets
All banks Graph 12
Source: Basel Committee on Banking Supervision.
Caps on Level 2B and Level 2 assets
€58.3 billion of Level 2 assets are excluded due to the 15% Level 2B cap and the 40% overall Level 2 cap. In total, 23 banks are constrained, of which five banks are constrained only by the Level 2B cap, 16 banks are constrained only by the Level 2 cap, and two banks are constrained by both caps. Of the 23 total banks that are constrained, two fail to meet an LCR minimum requirement of 100%.
Comparison of liquid assets and inflows to outflows and caps
Graph 13 combines the above LCR components by comparing liquidity resources (pool of high-quality liquid assets and inflows) to outflows. Note that the €1,488 billion gross surplus shown in the graph differs from the €563 billion gross shortfall at an LCR minimum requirement of 100% that is noted above, as it is assumed here that excess assets at one bank can offset those at another. In practice the aggregate position in the industry is likely to lie somewhere between these two numbers depending on how efficiently banks redistribute liquidity around the system.
A revised document has been issued in March 2014. http://www.bis.org/publ/bcbs278.htm

Basel III Monitoring Report September 2013 23
Comparison of pool of high-quality liquid assets plus inflows to outflows and cap
All banks Graph 13
€ billions
Source: Basel Committee on Banking Supervision. See also Table A.16.
3.2 Net Stable Funding Ratio
The second standard introduced by the Basel III reforms is the Net Stable Funding Ratio (NSFR), a longer-term structural ratio to address liquidity mismatches and provide incentives for banks to use stable sources to fund their activities.
101 Group 1 and 121 Group 2 banks provided sufficient data in the 31 December 2012 Basel III monitoring exercise to calculate the NSFR according to the Basel III liquidity framework issued in December 2010. 53% of these banks already meet or exceed the 100% minimum NSFR requirement, compared to 51% at the end of June 2012, with 92% at a NSFR of 75% or higher as at 31 December 2012.
The weighted average NSFR for the Group 1 bank sample improved slightly to 100% for Group 1 banks, compared to 99% at the June 2012 reporting date. For Group 2 banks, the average NSFR declined slightly to 99%, compared to 100% as of June 2012. Graph 14 shows the distribution of results for Group 1 and Group 2 banks; the thin red line indicates the 100% minimum requirement, the thick black horizontal lines inside the boxes indicate the median for the respective bank group.
A revised document has been issued in March 2014. http://www.bis.org/publ/bcbs278.htm

24 Basel III Monitoring Report September 2013
Net Stable Funding Ratio1 Graph 14
Per cent
1 The median value is represented by a thick horizontal line, with 50% of the values falling in the range shown by the box. The upper and lower end points of the thin vertical lines show the range of the entire sample. Banks with an NSFR above 150% are included in the calculation but are not shown in the graph.
Source: Basel Committee on Banking Supervision. See also Table A.15.
Banks in the sample had a shortfall of stable funding19 of €2.0 trillion at the end of December 2012, a decrease from €2.4 trillion at the end of June 2012, if banks were to make no changes whatsoever to their funding structure. This number is only reflective of the aggregate shortfall for banks that are below the 100% NSFR requirement and does not reflect any surplus stable funding at banks above the 100% requirement. Banks that are below the 100% required minimum have until 2018 to meet the standard and can take a number of measures to do so, including lengthening the term of their funding or reducing maturity mismatch.
19 The shortfall in stable funding measures the difference between balance sheet positions after the application of available
stable funding factors and the application of required stable funding factors for banks where the former is less than the latter.
A revised document has been issued in March 2014. http://www.bis.org/publ/bcbs278.htm

Basel III Monitoring Report September 2013 25
Statistical Annex1
Number of banks participating in the Basel III monitoring exercise Table A.1
Group 1 Group 2
Argentina 0 3
Australia 4 1
Belgium 1 2
Brazil 2 0
Canada 6 2
China 6 0
France 5 5
Germany 7 35
Hong Kong SAR 0 7
India 5 5
Indonesia 0 2
Italy 2 11
Japan 14 4
Korea 5 3
Luxembourg 0 1
Mexico 0 7
Netherlands 3 16
Russia 0 1
Saudi Arabia 3 0
Singapore 3 0
South Africa 3 3
Spain 2 4
Sweden 4 0
Switzerland 2 5
Turkey 6 0
United Kingdom 5 5
United States 13 0
Total 101 122
Source: Basel Committee on Banking Supervision.
1 Group 1 banks are those that have Tier 1 capital in excess of €3 billion and are internationally active. All other banks are
considered Group 2 banks. All data, including for previous reporting dates, reflect revisions received until 28 June 2013.
A revised document has been issued in March 2014. http://www.bis.org/publ/bcbs278.htm
26 Basel III Monitoring Report September 2013
CET1, Tier 1 and total capital ratios
In per cent Table A.2
Group 1 banks Group 2 banks
Current Basel III Current Basel III
CET1 Tier 1 Total CET1 Tier 1 Total CET1 Tier 1 Total CET1 Tier 1 Total
Max 24.5 24.5 27.1 20.1 20.1 20.1 111.2 111.2 111.2 111.0 111.0 111.0
75th percentile 13.4 14.4 17.3 11.7 11.8 13.1 14.4 15.1 17.5 14.6 14.6 15.3
Median 11.9 12.8 15.6 9.7 9.8 11.2 11.5 11.8 14.6 10.3 10.3 11.6
25th percentile 10.5 11.3 13.9 8.3 8.4 9.6 9.2 9.9 12.8 7.6 8.0 9.4
Min 7.6 8.1 10.8 2.5 2.5 2.5 5.0 6.3 9.3 0.0 2.1 2.1
Source: Basel Committee on Banking Supervision.
Average CET1, Tier 1 and total capital ratios
Consistent sample of banks, in per cent Table A.3
Group 1 banks Group 2 banks
Current Basel III Current Basel III
CET1 Tier 1 Total CET1 Tier 1 Total CET1 Tier 1 Total CET1 Tier 1 Total
H1 2011 10.2 11.5 14.1 7.1 7.4 8.6 10.4 11.2 14.7 8.8 9.1 11.1
H2 2011 10.4 11.6 14.1 7.7 8.0 9.2 10.4 11.1 14.6 8.7 9.1 11.0
H1 2012 10.9 12.0 14.5 8.5 8.8 9.9 10.9 11.4 14.7 9.0 9.5 11.3
H2 2012 11.5 12.6 15.2 9.2 9.4 10.6 10.4 10.8 14.3 8.8 9.2 11.1
Source: Basel Committee on Banking Supervision.
Estimated overall capital shortfalls1
In billions of euros, sample and exchange rates as at the reporting dates Table A.4
Group 1 banks Group 2 banks
Minimum Minimum plus buffer plus G-SIB surcharge
Minimum Minimum plus buffer
CET1 Add. Tier 1
Tier 2 CET1 Add. Tier 1
Tier 2 CET1 Add. Tier 1
Tier 2 CET1 Add. Tier 1
Tier 2
H1 2011 38.8 66.6 119.3 485.6 221.4 223.2 8.6 7.3 5.5 32.4 16.6 11.6
H2 2011 11.9 32.5 107.7 384.1 226.3 232.0 7.6 2.1 4.1 21.7 11.9 8.6
H1 2012 3.7 16.2 61.8 197.9 197.0 224.0 4.8 1.6 5.0 16.0 7.3 12.0
H2 2012 2.2 10.2 45.7 115.0 154.8 171.3 11.4 2.3 8.7 25.6 11.5 14.6 1 The figures for the minimum plus the capital conservation buffer also include the capital surcharge for G-SIBs as applicable.
Source: Basel Committee on Banking Supervision.
A revised document has been issued in March 2014. http://www.bis.org/publ/bcbs278.htm

Basel III Monitoring Report September 2013 27
Level of CET1 capital and CET1 capital raised
In billions of euros, consistent sample of banks, exchange rates as of 31 December 2012 Table A.5
Level of CET1 capital CET1 capital raised
Group 1 Of which:
G-SIBs Group 2 Group 1 Of which:
G-SIBs Group 2
H1 2011 2,059 1,098 209 41.2 12.5 6.2
H2 2011 2,182 1,155 214 26.8 15.7 8.0
H1 2012 2,378 1,267 223 31.3 19.7 2.4
H2 2012 2,496 1,312 224 29.2 14.3 5.6
Source: Basel Committee on Banking Supervision.
Structure of regulatory capital under the current national regime and Basel III
Consistent sample of banks, in per cent Table A.6
Group 1 banks Group 2 banks
Current Basel III Current Basel III
CET1 Add. Tier 1 Tier 2 CET1
Add. Tier 1 Tier 2 CET1
Add. Tier 1 Tier 2 CET1
Add. Tier 1 Tier 2
H1 2011 72.0 9.3 18.7 82.6 3.1 14.2 70.3 5.3 24.3 79.1 2.7 18.2
H2 2011 73.3 8.9 17.8 83.7 2.8 13.5 71.3 4.7 24.0 79.5 3.1 17.4
H1 2012 75.2 7.9 16.8 86.1 2.4 11.5 74.0 3.5 22.6 79.9 4.2 15.9
H2 2012 75.7 7.4 16.9 86.7 2.1 11.2 72.5 3.3 24.2 79.4 3.3 17.3
Source: Basel Committee on Banking Supervision.
A revised document has been issued in March 2014. http://www.bis.org/publ/bcbs278.htm

28 Basel III Monitoring Report September 2013
CET1 regulatory adjustments as a percentage of CET1 capital prior to adjustments
In per cent Table A.7
Num
ber o
f ba
nks
Goo
dwill
Inta
ngib
les
DTA
1
Fina
ncia
ls
DTA
abo
ve
thre
shol
d
Exce
ss a
bove
15
%2
Oth
er3
Tota
l
Group 1 banks 100 –12.4 –3.1 –2.6 –2.3 –1.2 –1.1 –2.8 –25.5
Change 2012H1 vs 2011H24
97 +0.9 +0.2 –0.1 –0.6 0.0 +0.2 +0.5 +1.1
Group 2 banks 116 –6.8 –2.3 –1.9 –5.3 –3.0 –1.6 –3.0 –23.9 1 DTA is the deferred tax assets that are deducted in full under Basel III (ie it excludes DTAs that are related to temporary differences, which are only deducted when they exceed a threshold). 2 Excess above 15% pertains to significant investments in the common shares of unconsolidated financial institutions, mortgage servicing rights, and DTAs due to timing differences that do not separately exceed the 10% category thresholds but in the aggregate exceed the 15% basket threshold. 3 Other includes deductions related to investment in own shares, shortfall of provisions to expected losses, cash flow hedge reserves, cumulative changes in fair value due to changes in own credit risk, net pension fund assets, securitisation gains on sale, mortgage servicing rights and deductions from Additional Tier 1 capital to the extent they exceed a bank’s Additional Tier 1 capital. 4 In percentage points based on consistent sample of banks that submitted data for both the December 2011 and June 2012 exercises. A plus symbol indicates an improvement (smaller deduction relative to December 2011) while a negative symbol indicates a deterioration (increased deduction relative to December 2011).
Source: Basel Committee on Banking Supervision.
Changes in risk-weighted assets versus Basel II
In per cent Table A.8
Number of banks Total1
Definition of capital2 CVA3 CCR4
Trading book1 50/50 threshold other
Group 1 banks 100 14.1 2.5 2.9 –1.5 4.5 1.5 4.2
Group 2 banks 116 7.4 3.4 1.9 –0.1 1.6 0.3 0.3 1 As data from most countries already include the RWA impact of the Basel 2.5 market risk standards, the incremental impact for changes in market RWA shown in this table has been estimated using the sum of the following elements relative to elements in place under Basel II: the proportion of internally modelled general and specific risk that is attributable to stress value-at-risk, the incremental risk capital charge (IRC), capital charges for the correlation trading portfolio, and capital charges under the standardised measurement method (SMM) for other securitisation exposures and nth-to-default credit derivatives. 2 Measures the change in risk-weighted assets as a result of proposed changes to the definition of capital. The column heading “other” includes the effects of lower risk-weighted assets for exposures that are currently included in risk-weighted assets but receive a deduction treatment under Basel III. The column heading “50/50” measures the increase in risk-weighted assets applied to exposures currently deducted under the Basel II framework that are risk-weighted at 1250% under Basel III, primarily certain securitisation exposures. The column heading “threshold” measures the increase in risk-weighted assets for exposures that fall below the 10% and 15% limits for CET1 deduction. 3 Measures the new capital charge for credit valuation adjustment (CVA) risk. 4 Measures the impact of the higher capital charge that results from applying a higher asset value correlation parameter against exposures to financial institutions under the IRB approaches to credit risk; and the impact of incorporating stressed parameters for effective expected positive exposure (EEPE). Banks have not been asked to provide data on the risk-weighted asset effects of capital charges for exposures to central counterparties (CCPs).
Source: Basel Committee on Banking Supervision.
A revised document has been issued in March 2014. http://www.bis.org/publ/bcbs278.htm

Basel III Monitoring Report September 2013 29
Approximate changes in risk-weighted assets versus Basel II1
In per cent Table A.9
Group 1 Group 2
Max 72.7 41.3
75th percentile 14.8 4.8
Median 9.1 2.1
25th percentile 3.1 0.5
Min -6.1 -5.5 1 As data from most countries already include the RWA impact of the Basel 2.5 market risk standards, the incremental impact for changes in market RWA shown in this table has been estimated using the sum of the following elements relative to elements in place under Basel II: the proportion of internally modelled general and specific risk that is attributable to stress value-at-risk, the incremental risk capital charge (IRC), capital charges for the correlation trading portfolio, and capital charges under the standardised measurement method (SMM) for other securitisation exposures and nth-to-default credit derivatives.
Source: Basel Committee on Banking Supervision.
Share in market risk capital charges
Group 1 banks1, in per cent Table A.10
Num
ber o
f ban
ks
Tota
l
SMM
2
Value-at-risk
IRC3
Correlation trading (CTP)
SMM
non
-CTP
5
Oth
er
Curr
ent
Stre
ss
Tota
l
Of which CR
M
Floo
r
SMM
4
Relative to total capital requirements
88 7.7 1.9 0.9 2.1 0.8 0.9 0.7 0.1 0.1 0.8 0.4
Relative to market risk capital requirements
88 100.0 24.8 11.1 26.7 10.6 11.2 8.9 1.3 0.9 10.8 4.9
1 Group 2 banks are not presented separately because the market risk requirements have a very minor influence on overall Group 2 bank risk-weighted assets. Some of these banks do not have any trading books at all and are therefore not subject to any related capital charges. 2 Capital charge according to the standardised measurement method for market risk. 3 Incremental risk capital charge. 4 Capital charge for exposures which are part of the correlation trading portfolio and subject to a capital charge according to the standardised measurement method. 5 Capital charge according to the standardised measurement method for securitisation exposures and nth-to-default credit derivatives which do not qualify for the correlation trading portfolio.
Source: Basel Committee on Banking Supervision.
Changes in risk-weighted assets for credit valuation adjustment (CVA) risk
In per cent Table A.11
Number
of banks
CVA vs credit RWA
Of which CVA vs total
RWA
Of which
Stand. method
Adv. Method
Stand. method
Adv. method
Group 1 banks 86 6.9 4.4 2.5 5.7 3.6 2.1
Group 2 banks 80 2.4 2.4 0.0 2.2 2.2 0.0
Source: Basel Committee on Banking Supervision.
A revised document has been issued in March 2014. http://www.bis.org/publ/bcbs278.htm
30 Basel III Monitoring Report September 2013
Current and Basel III Tier 1 leverage ratio
In per cent Table A.12
All banks Group 1 Group 2
Current Basel III Current Basel III Current Basel III
Max 20.9 20.7 11.8 11.8 20.9 20.7
75th percentile 6.2 5.9 5.7 5.6 6.7 6.5
Median 4.8 4.3 4.7 4.1 4.9 4.7
25th percentile 3.9 3.2 4.0 3.0 3.9 3.3
Min 1.1 0.8 2.4 0.8 1.1 0.9
Source: Basel Committee on Banking Supervision.
Basel III Tier 1 leverage ratios
Consistent sample of banks, in per cent Table A.13
All banks Group 1 Group 2
H1 2011 3.5 3.4 4.3
H2 2011 3.6 3.5 4.2
H1 2012 3.8 3.7 4.3
H2 2012 3.8 3.7 4.2 1 The figures for the minimum plus the capital conservation buffer also include the capital surcharge for G-SIBs as applicable.
Source: Basel Committee on Banking Supervision.
Tier 1 capital, risk-weighted assets and leverage ratio exposure
Consistent sample of banks, exchange rates as of 31 December 2012 Table A.14
Group 1 banks Group 2 banks
Tier 1 capital Risk-weighted
assets Leverage ratio
exposure Tier 1 capital
Risk-weighted assets
Leverage ratio exposure
H1 2011 100.0 100.0 100.0 100.0 100.0 100.0
H2 2011 105.5 98.7 102.6 102.9 103.7 104.6
H1 2012 114.3 97.1 106.0 108.8 104.9 107.7
H2 2012 120.3 94.8 110.3 108.2 108.0 110.6
H1 2011 = 100.
Source: Basel Committee on Banking Supervision.
A revised document has been issued in March 2014. http://www.bis.org/publ/bcbs278.htm

Basel III Monitoring Report September 2013 31
Liquidity Coverage Ratio and Net Stable Funding Ratio
In per cent Table A.15
Liquidity Coverage Ratio Net Stable Funding Ratio
Group 1 Group 2 Group 1 Group 2
Max 382.7 400.0 183.8 1349.0
75th percentile 141.2 294.4 109.0 117.0
Median 122.4 152.0 98.0 104.7
25th percentile 92.5 88.0 88.9 91.0
Min 40.1 0.0 34.2 37.4
Source: Basel Committee on Banking Supervision.
Comparison of pool of high-quality liquid assets to outflows and cap
All banks, in billions of euros Table A.16
Total liquid assets and inflows
Level 1 assets 8,155
Level 2A assets (post-factor) 893
Level 2B assets (post-factor) 175
Inflows (post-factor, after cap) 3,194
Total 12,416
Outflows and impact of cap
Outflows (post-factor) 10,870
Cap on Level 2 assets 42
Cap on Level 2B assets 17
Total 10,928
Source: Basel Committee on Banking Supervision.
A revised document has been issued in March 2014. http://www.bis.org/publ/bcbs278.htm

A revised document has been issued in March 2014. http://www.bis.org/publ/bcbs278.htm

Monitoring Report September 2013 33
Previous monitoring reports published by the Basel Committee
Results of the comprehensive quantitative impact study, December 2010 (www.bis.org/publ/bcbs186.htm).
Results of the Basel III monitoring exercise as of 30 June 2011, April 2012 (www.bis.org/publ/bcbs217.htm).
Results of the Basel III monitoring exercise as of 31 December 2011, September 2012 (www.bis.org/publ/bcbs231.htm).
Results of the Basel III monitoring exercise as of 30 June 2012, March 2013 (www.bis.org/publ/bcbs243.htm).
A revised document has been issued in March 2014. http://www.bis.org/publ/bcbs278.htm

A revised document has been issued in March 2014. http://www.bis.org/publ/bcbs278.htm

Monitoring Report September 2013 35
Basel III phase-in arrangements
Basel III phase-in arrangements
Shading indicates transition periods – all dates are as of 1 January.
2013 2014 2015 2016 2017 2018 As of
2019
Leverage ratio Parallel run
1 Jan 2013 – 1 Jan 2017 Disclosure starts 1 Jan 2015
Migration to Pillar 1
Minimum CET1 ratio 3.5% 4.0% 4.5% 4.5% 4.5% 4.5% 4.5%
Capital conservation buffer 0.625% 1.25% 1.875% 2.50%
G-SIB surcharge
Phase-in 1.0%–2.5%
Minimum common equity plus capital conservation buffer
3.5% 4.0% 4.5% 5.125% 5.75% 6.375% 7.0%
Phase-in of deductions from CET1 (including amounts exceeding the limit for DTAs, MSRs and financials)
20% 40% 60% 80% 100% 100%
Minimum Tier 1 capital 4.5% 5.5% 6.0% 6.0% 6.0% 6.0% 6.0%
Minimum total capital 8.0% 8.0% 8.0% 8.0% 8.0% 8.0% 8.0%
Minimum total capital plus capital conservation buffer
8.0% 8.0% 8.0% 8.625% 9.25% 9.875% 10.5%
Capital instruments that no longer qualify as Tier 1 capital or Tier 2 capital
Phased out over 10 year horizon beginning 2013
Liquidity coverage ratio 60% 70% 80% 90% 100%
Net stable funding ratio Introduce minimum standard
A revised document has been issued in March 2014. http://www.bis.org/publ/bcbs278.htm