Embed Size (px)
Citation preview
Basic Business Statistics, 11e © 2009 Prentice-Hall, Inc. Chap 1-1
Chapter 1
Introduction and Data Collection
Basic Business Statistics11th Edition
Basic Business Statistics, 11e © 2009 Prentice-Hall, Inc.. Chap 1-2
Learning Objectives
In this chapter you learn:
How Statistics is used in business The sources of data used in business The types of data used in business The basics of Microsoft Excel The basics of Minitab
Basic Business Statistics, 11e © 2009 Prentice-Hall, Inc.. Chap 1-3
Why Learn Statistics?
So you are able to make better sense of the ubiquitous use of numbers:
Business memos Business research Technical reports Technical journals Newspaper articles Magazine articles
Basic Business Statistics, 11e © 2009 Prentice-Hall, Inc.. Chap 1-4
What is statistics?
A branch of mathematics taking and transforming numbers into useful information for decision makers
Methods for processing & analyzing numbers
Methods for helping reduce the uncertainty inherent in decision making
Basic Business Statistics, 11e © 2009 Prentice-Hall, Inc.. Chap 1-5
Why Study Statistics?
Decision Makers Use Statistics To:
Present and describe business data and information properly Draw conclusions about large groups of individuals or items,
using information collected from subsets of the individuals or items.
Make reliable forecasts about a business activity Improve business processes
Basic Business Statistics, 11e © 2009 Prentice-Hall, Inc.. Chap 1-6
Types of Statistics
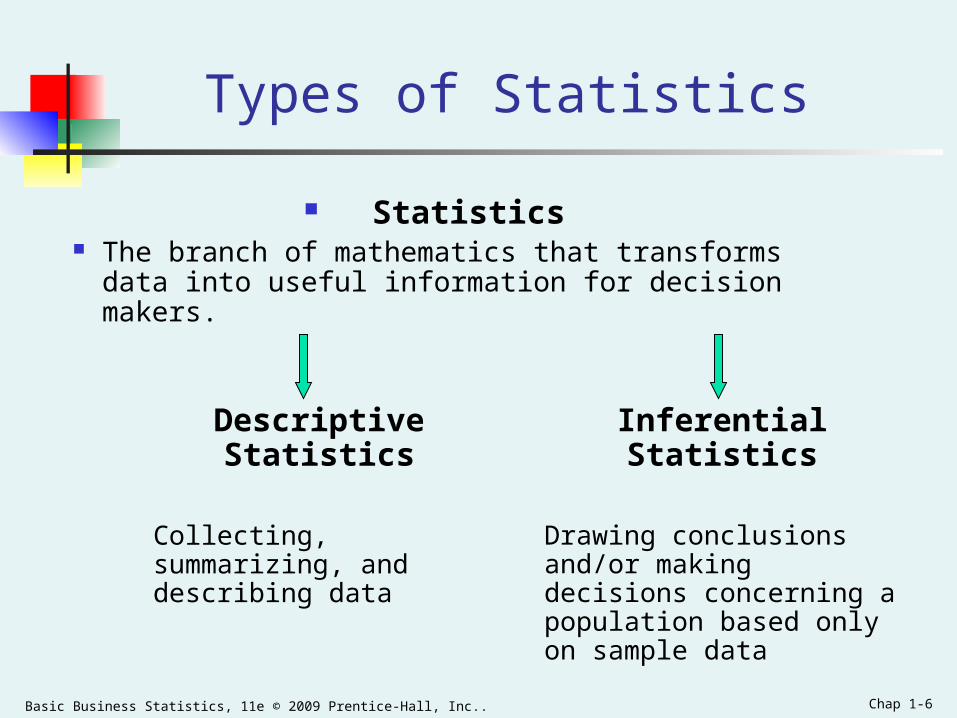
Statistics The branch of mathematics that transforms data into
useful information for decision makers.
Descriptive Statistics
Collecting, summarizing, and describing data
Inferential Statistics
Drawing conclusions and/or making decisions concerning a population based only on sample data
Basic Business Statistics, 11e © 2009 Prentice-Hall, Inc.. Chap 1-7
Descriptive Statistics
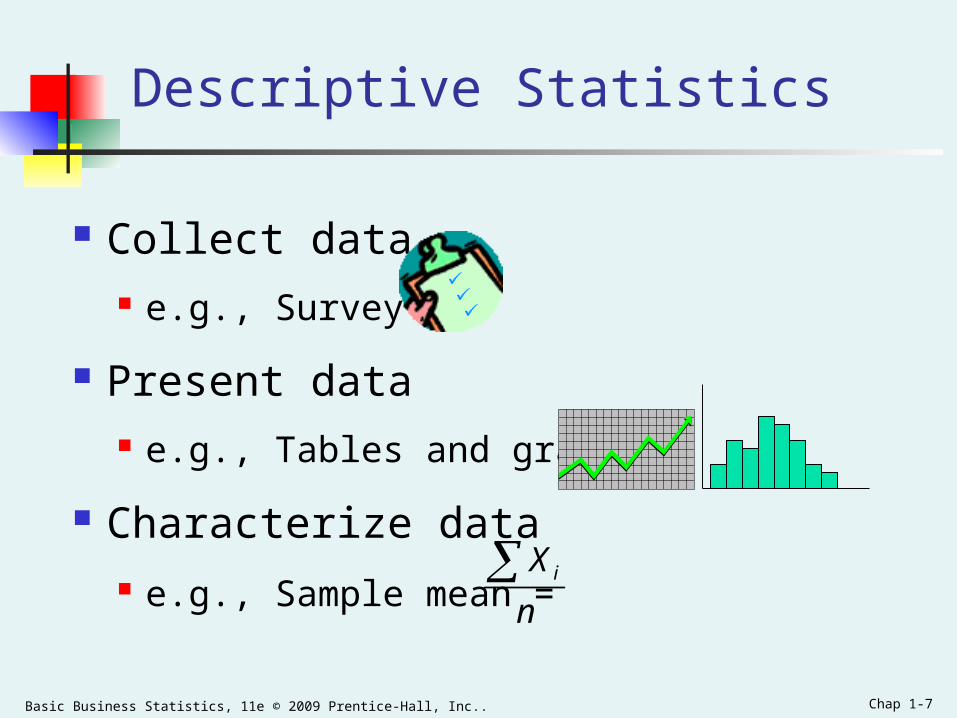
Collect data e.g., Survey
Present data e.g., Tables and graphs
Characterize data e.g., Sample mean =
iX
n
Basic Business Statistics, 11e © 2009 Prentice-Hall, Inc.. Chap 1-8
Inferential Statistics
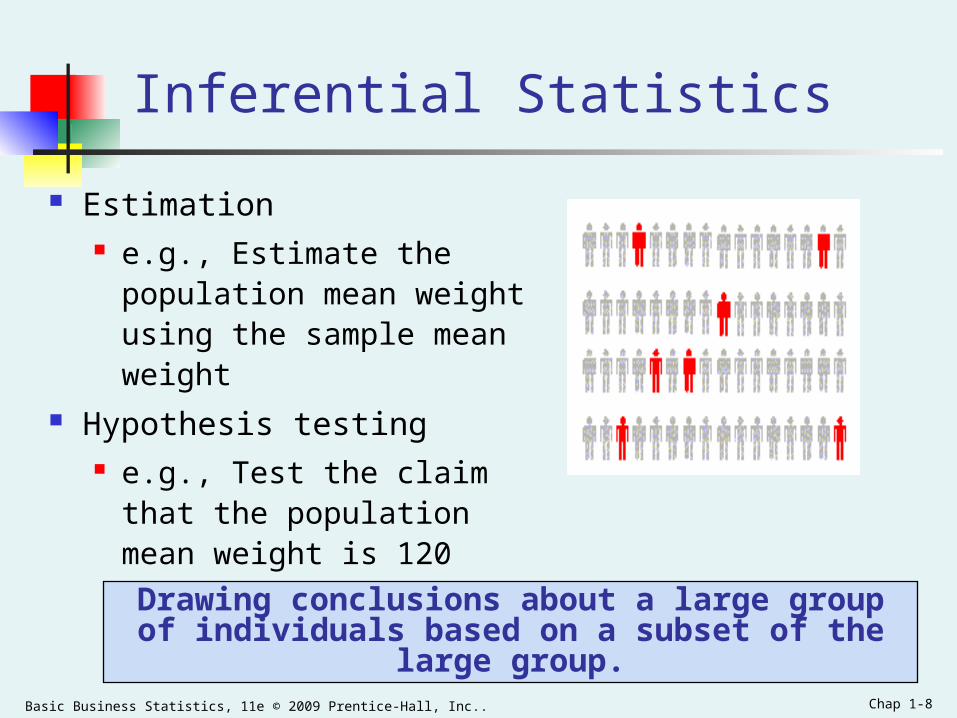
Estimation e.g., Estimate the population
mean weight using the sample mean weight
Hypothesis testing e.g., Test the claim that the
population mean weight is 120 pounds
Drawing conclusions about a large group of individuals based on a subset of the large group.
Basic Business Statistics, 11e © 2009 Prentice-Hall, Inc.. Chap 1-9
Basic Vocabulary of Statistics
VARIABLEA variable is a characteristic of an item or individual.
DATAData are the different values associated with a variable.
OPERATIONAL DEFINITIONSData values are meaningless unless their variables have operational definitions, universally accepted meanings that are clear to all associated
with an analysis.
Basic Business Statistics, 11e © 2009 Prentice-Hall, Inc.. Chap 1-10
Basic Vocabulary of Statistics
POPULATIONA population consists of all the items or individuals about which you want to draw a conclusion.
SAMPLEA sample is the portion of a population selected for analysis.
PARAMETERA parameter is a numerical measure that describes a characteristic of a population.
STATISTICA statistic is a numerical measure that describes a characteristic of a sample.
Basic Business Statistics, 11e © 2009 Prentice-Hall, Inc.. Chap 1-11
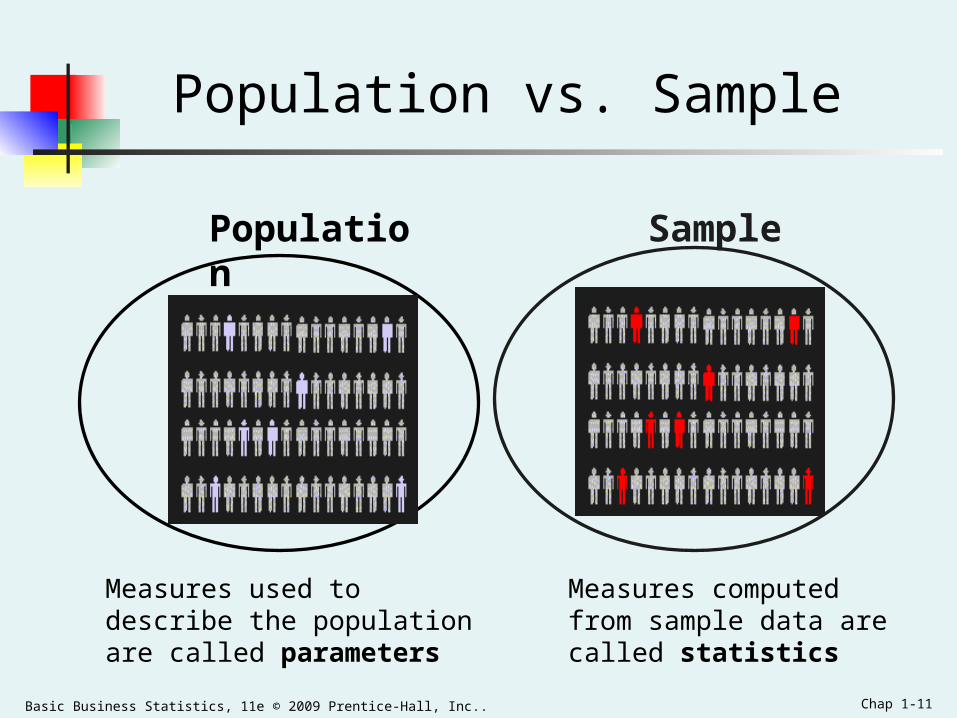
Population vs. Sample
Population Sample
Measures used to describe the population are called parameters
Measures computed from sample data are called statistics
Basic Business Statistics, 11e © 2009 Prentice-Hall, Inc.. Chap 1-12
Why Collect Data? A marketing research analyst needs to assess the
effectiveness of a new television advertisement.
A pharmaceutical manufacturer needs to determine whether a new drug is more effective than those currently in use.
An operations manager wants to monitor a manufacturing process to find out whether the quality of the product being manufactured is conforming to company standards.
An auditor wants to review the financial transactions of a company in order to determine whether the company is in compliance with generally accepted accounting principles.
Basic Business Statistics, 11e © 2009 Prentice-Hall, Inc.. Chap 1-13
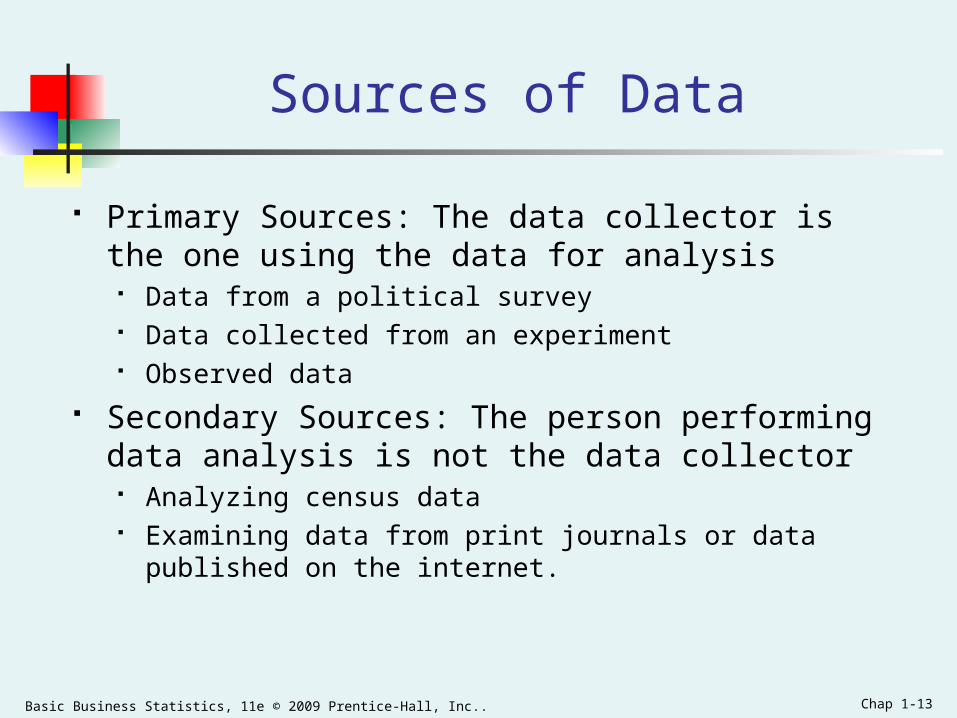
Sources of Data
Primary Sources: The data collector is the one using the data for analysis
Data from a political survey Data collected from an experiment Observed data
Secondary Sources: The person performing data analysis is not the data collector
Analyzing census data Examining data from print journals or data published on the internet.
Basic Business Statistics, 11e © 2009 Prentice-Hall, Inc.. Chap 1-14
Sources of data fall into four categories
Data distributed by an organization or an individual
A designed experiment
A survey
An observational study
Basic Business Statistics, 11e © 2009 Prentice-Hall, Inc.. Chap 1-15
Types of Variables
Categorical (qualitative) variables have values that can only be placed into categories, such as “yes” and “no.”
Numerical (quantitative) variables have values that represent quantities.
Basic Business Statistics, 11e © 2009 Prentice-Hall, Inc.. Chap 1-16
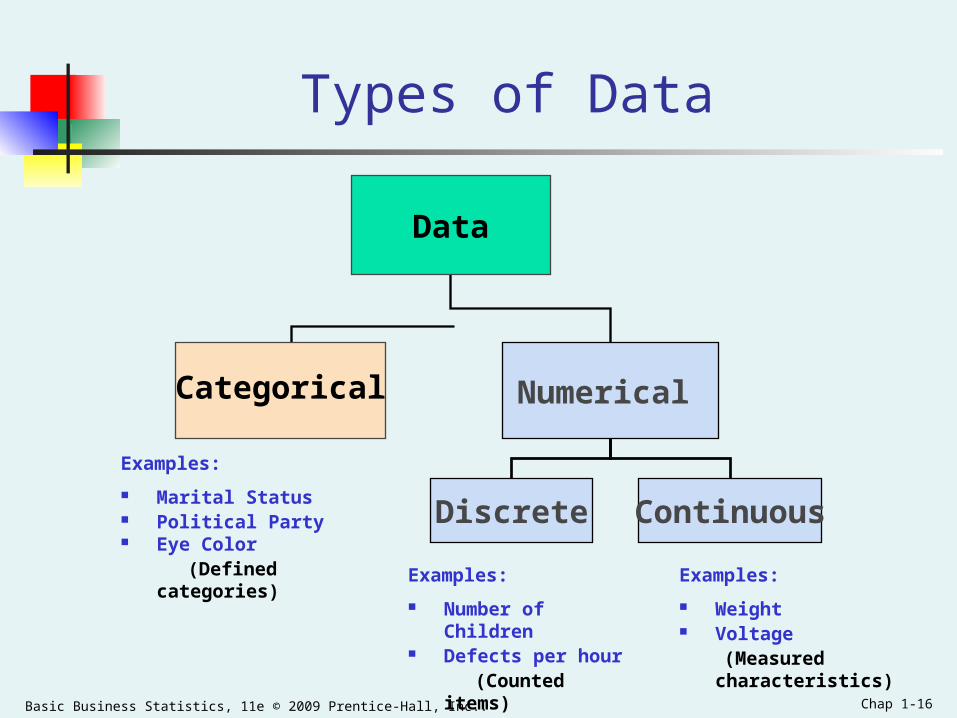
Types of Data
Data
Categorical Numerical
Discrete Continuous
Examples:
Marital Status Political Party Eye Color (Defined categories) Examples:
Number of Children Defects per hour (Counted items)
Examples:
Weight Voltage (Measured characteristics)
Basic Business Statistics, 11e © 2009 Prentice-Hall, Inc.. Chap 1-17
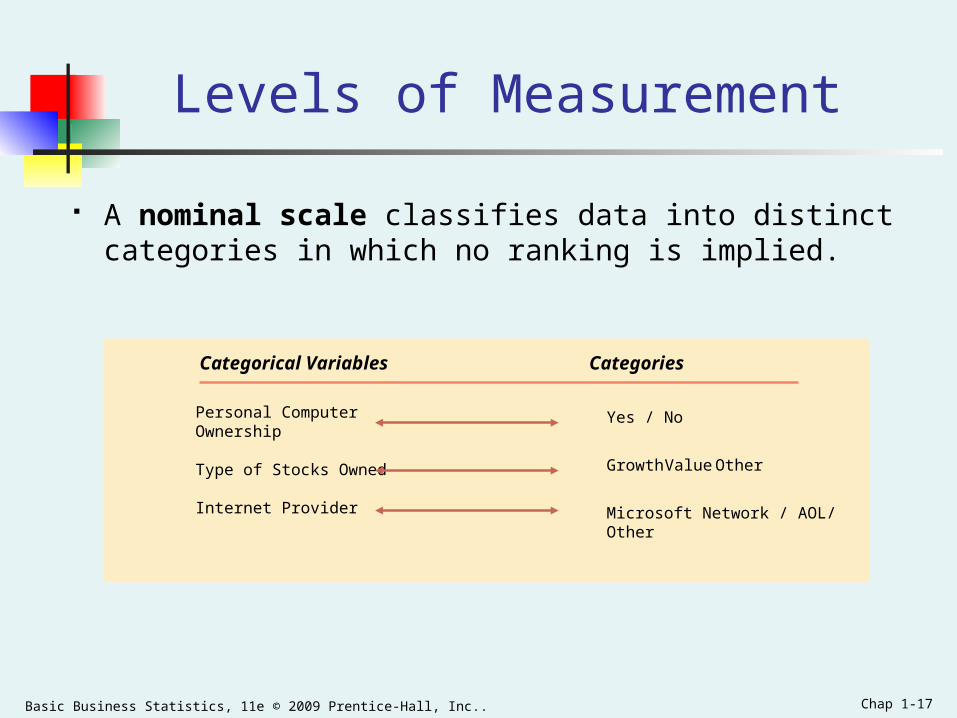
Levels of Measurement
A nominal scale classifies data into distinct categories in which no ranking is implied.
Categorical Variables Categories
Personal Computer Ownership
Type of Stocks Owned
Internet Provider
Yes / No
Microsoft Network / AOL/ Other
Growth Value Other
Basic Business Statistics, 11e © 2009 Prentice-Hall, Inc.. Chap 1-18
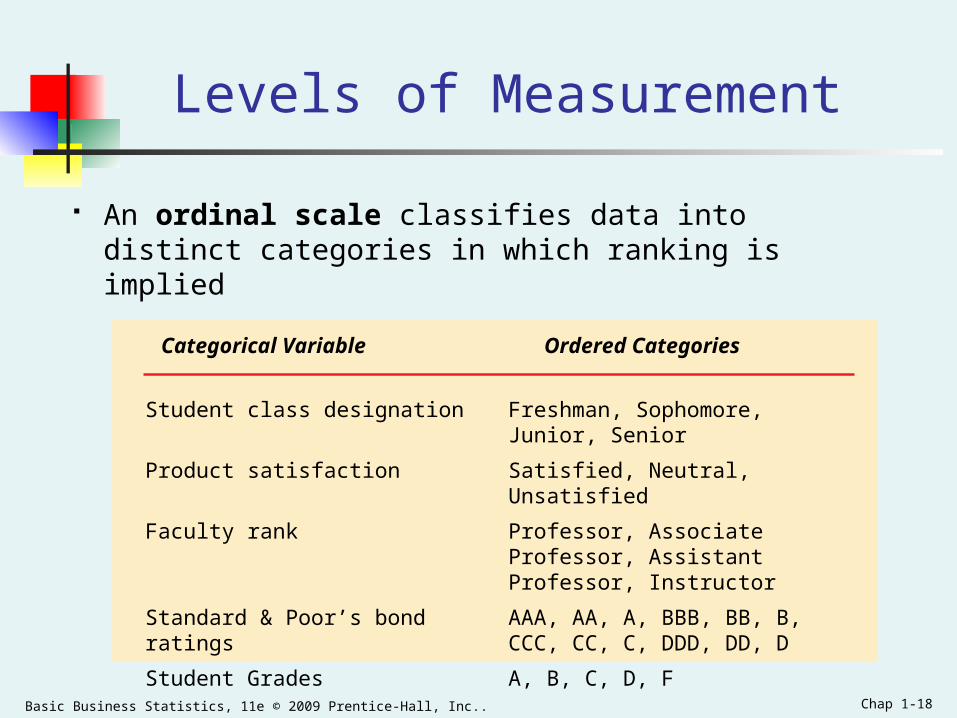
Levels of Measurement
An ordinal scale classifies data into distinct categories in which ranking is implied
Categorical Variable Ordered Categories
Student class designation Freshman, Sophomore, Junior, Senior
Product satisfaction Satisfied, Neutral, Unsatisfied
Faculty rank Professor, Associate Professor, Assistant Professor, Instructor
Standard & Poor’s bond ratings AAA, AA, A, BBB, BB, B, CCC, CC, C, DDD, DD, D
Student Grades A, B, C, D, F
Basic Business Statistics, 11e © 2009 Prentice-Hall, Inc.. Chap 1-19
Levels of Measurement
An interval scale is an ordered scale in which the difference between measurements is a meaningful quantity but the measurements do not have a true zero point.
A ratio scale is an ordered scale in which the difference between the measurements is a meaningful quantity and the measurements have a true zero point.
Basic Business Statistics, 11e © 2009 Prentice-Hall, Inc.. Chap 1-20
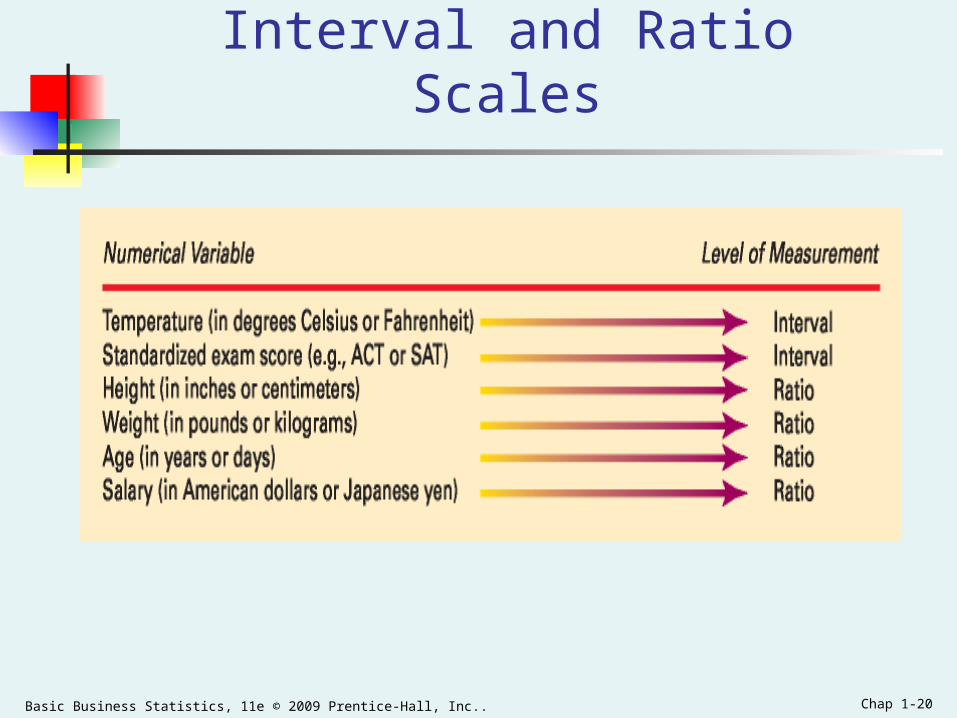
Interval and Ratio Scales
Basic Business Statistics, 11e © 2009 Prentice-Hall, Inc.. Chap 1-21
Personal Computer Programs Used For Statistics
Minitab A statistical package to perform statistical analysis Designed to perform analysis as accurately as possible
Microsoft Excel A multi-functional data analysis tool Can perform many functions but none as well as programs that
are dedicated to a single function.
Both Minitab and Excel use worksheets to store data
Basic Business Statistics, 11e © 2009 Prentice-Hall, Inc.. Chap 1-22
Minitab & Microsoft Excel Terms
When you use Minitab or Microsoft Excel, you place the data you have collected in worksheets.
The intersections of the columns and rows of worksheets form boxes called cells.
If you want to refer to a group of cells that forms a contiguous rectangular area, you can use a cell range.
Worksheets exist inside a workbook in Excel and inside a Project in Minitab.
Both worksheets and projects can contain both data, summaries, and charts.
Basic Business Statistics, 11e © 2009 Prentice-Hall, Inc.. Chap 1-23
You are using programs properly if you can
Understand how to operate the program
Understand the underlying statistical concepts
Understand how to organize and present information
Know how to review results for errors
Make secure and clearly named backups of your work
Basic Business Statistics, 11e © 2009 Prentice-Hall, Inc.. Chap 1-24
Chapter Summary
Reviewed why a manager needs to know statistics Introduced key definitions:
Population vs. Sample Primary vs. Secondary data types Categorical vs. Numerical data
Examined descriptive vs. inferential statistics Reviewed data types and measurement levels Discussed Minitab and Microsoft Excel terms
In this chapter, we have