Embed Size (px)
Citation preview

1
1© Wallace J. Hopp, Mark L. Spearman, 1996, 2000 http://factory-physics.com
Basic Factory Dynamics
Physics should be explained as simply as possible,but no simpler.
– Albert Einstein
2© Wallace J. Hopp, Mark L. Spearman, 1996, 2000 http://factory-physics.com
HAL Case
Large Panel Line: produces unpopulated printed circuit boards
Line runs 24 hr/day
Recent Performance:• throughput = 1,100 panels per day (45.8 panels/hr)
• WIP = 37,000 panels
• CT = 34 days (816 hr)
• customer service = 75% on-time delivery
What data do we need to decide?
How is HAL doing?
2
3© Wallace J. Hopp, Mark L. Spearman, 1996, 2000 http://factory-physics.com
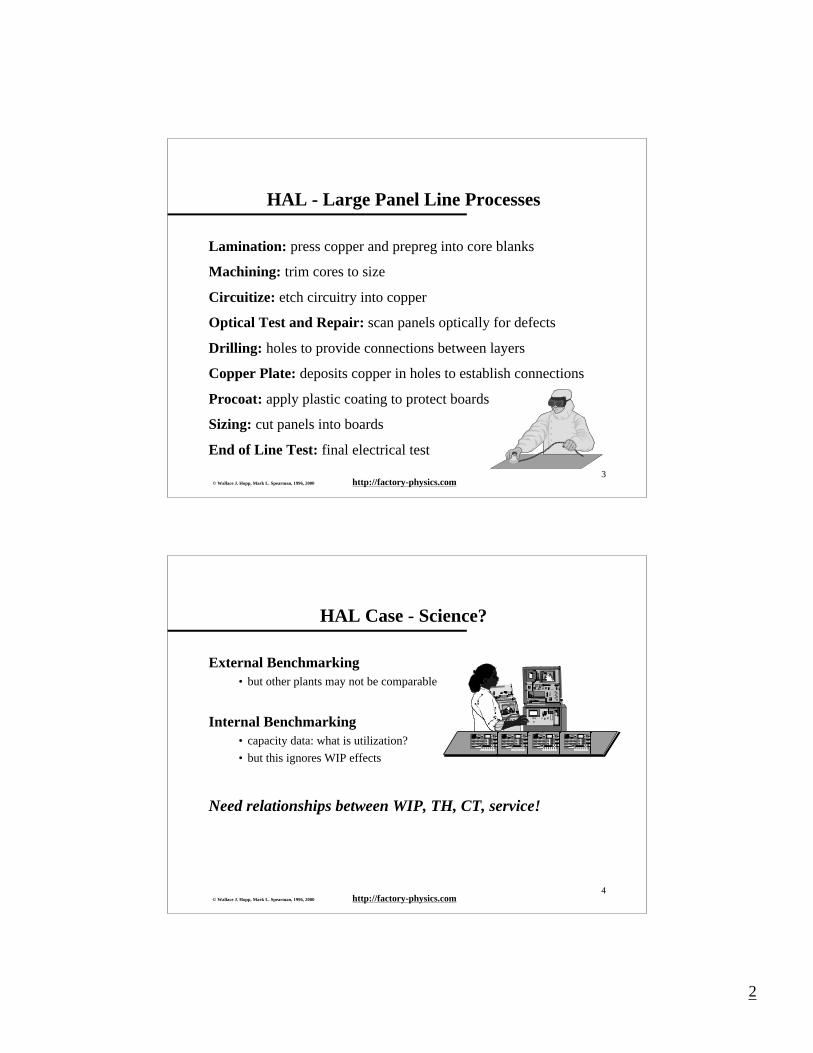
HAL - Large Panel Line Processes
Lamination: press copper and prepreg into core blanks
Machining: trim cores to size
Circuitize: etch circuitry into copper
Optical Test and Repair: scan panels optically for defects
Drilling: holes to provide connections between layers
Copper Plate: deposits copper in holes to establish connections
Procoat: apply plastic coating to protect boards
Sizing: cut panels into boards
End of Line Test: final electrical test
4© Wallace J. Hopp, Mark L. Spearman, 1996, 2000 http://factory-physics.com
HAL Case - Science?
External Benchmarking• but other plants may not be comparable
Internal Benchmarking• capacity data: what is utilization?
• but this ignores WIP effects
Need relationships between WIP, TH, CT, service!

3
5© Wallace J. Hopp, Mark L. Spearman, 1996, 2000 http://factory-physics.com
Definitions
Workstations: a collection of one or more identical machines.
Parts: a component, sub-assembly, or an assembly that moves through theworkstations.
End Items: parts sold directly to customers; relationship to constituent partsdefined in bill of material.
Consumables: bits, chemicals, gasses, etc., used in process but do notbecome part of the product that is sold.
Routing: sequence of workstations needed to make a part.
Order: request from customer.
Job: transfer quantity on the line.
6© Wallace J. Hopp, Mark L. Spearman, 1996, 2000 http://factory-physics.com
Definitions (cont.)
Throughput (TH): for a line, throughput is the average quantity of good(non-defective) parts produced per unit time.
Work in Process (WIP): inventory between the start and endpoints ofa product routing.
Raw Material Inventory (RMI): material stocked at beginning ofrouting.
Crib and Finished Goods Inventory (FGI): crib inventoryis material held in a stockpoint at the end of a routing; FGI is material held ininventory prior to shipping to the customer.
Cycle Time (CT): time between release of the job at the beginning of therouting until it reaches an inventory point at the end of the routing.

4
7© Wallace J. Hopp, Mark L. Spearman, 1996, 2000 http://factory-physics.com
Factory Physics
Definition: A manufacturing system is a network of processesthrough which parts flow and whose purpose is to generate profitnow and in the future.
Structure: Plant is made up of routings (lines), which in turn are madeup of processes.
Focus: Factory Physics is concerned with the network and flows at therouting (line) level.
8© Wallace J. Hopp, Mark L. Spearman, 1996, 2000 http://factory-physics.com
Parameters
Descriptors of a Line:
1) Bottleneck Rate (rb): Rate (parts/unit time or jobs/unit time) of theprocess center having the highest long-term utilization.
2) Raw Process Time (T0): Sum of the long-term average processtimes of each station in the line.
3) Congestion Coefficient ( ): A unitless measure of congestion.
• Zero variability case, = 0.
• “Practical worst case,” = 1.
• “Worst possible case,” = W0.
Note: we won’t use quantitatively,
but point it out to recognize that lineswith same rb and T0 can behave verydifferently.

5
9© Wallace J. Hopp, Mark L. Spearman, 1996, 2000 http://factory-physics.com
Parameters (cont.)
Relationship:
Critical WIP (W0): WIP level in which a line having no congestionwould achieve maximum throughput (i.e., rb) with minimum cycle time(i.e., T0).
W0 = rb T0
10© Wallace J. Hopp, Mark L. Spearman, 1996, 2000 http://factory-physics.com
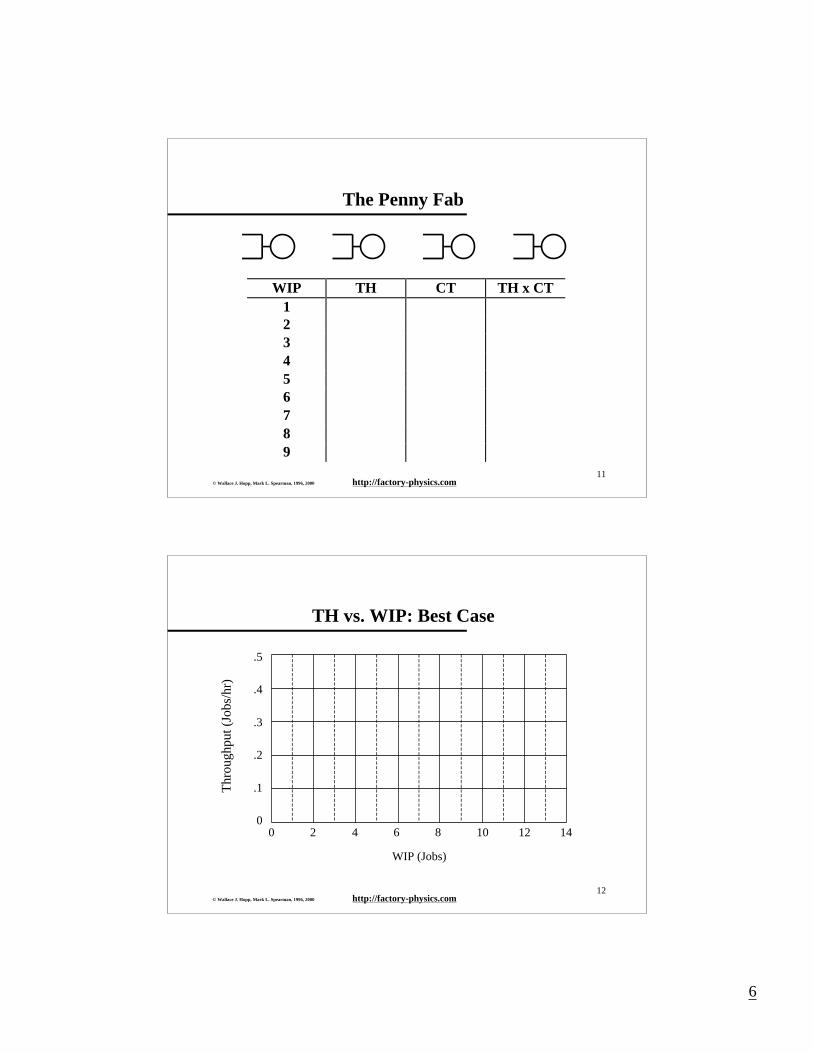
The Penny Fab
Characteristics:• Four identical tools in series.
• Each takes 2 hours per piece (penny).
• No variability.
• CONWIP job releases.
Parameters:rb =
T0 =
W0 =
=
0.5 pennies/hour
8 hours
0.5 8 = 4 pennies
0 (no variability, best case conditions)
6
11© Wallace J. Hopp, Mark L. Spearman, 1996, 2000 http://factory-physics.com
The Penny Fab
WIP TH CT TH x CT123456789
12© Wallace J. Hopp, Mark L. Spearman, 1996, 2000 http://factory-physics.com
TH vs. WIP: Best Case
Thr
ough
put (
Jobs
/hr)
0 2 4 6 8 10 12 140
.2
.4
.3
.5
.1
WIP (Jobs)
7
13© Wallace J. Hopp, Mark L. Spearman, 1996, 2000 http://factory-physics.com
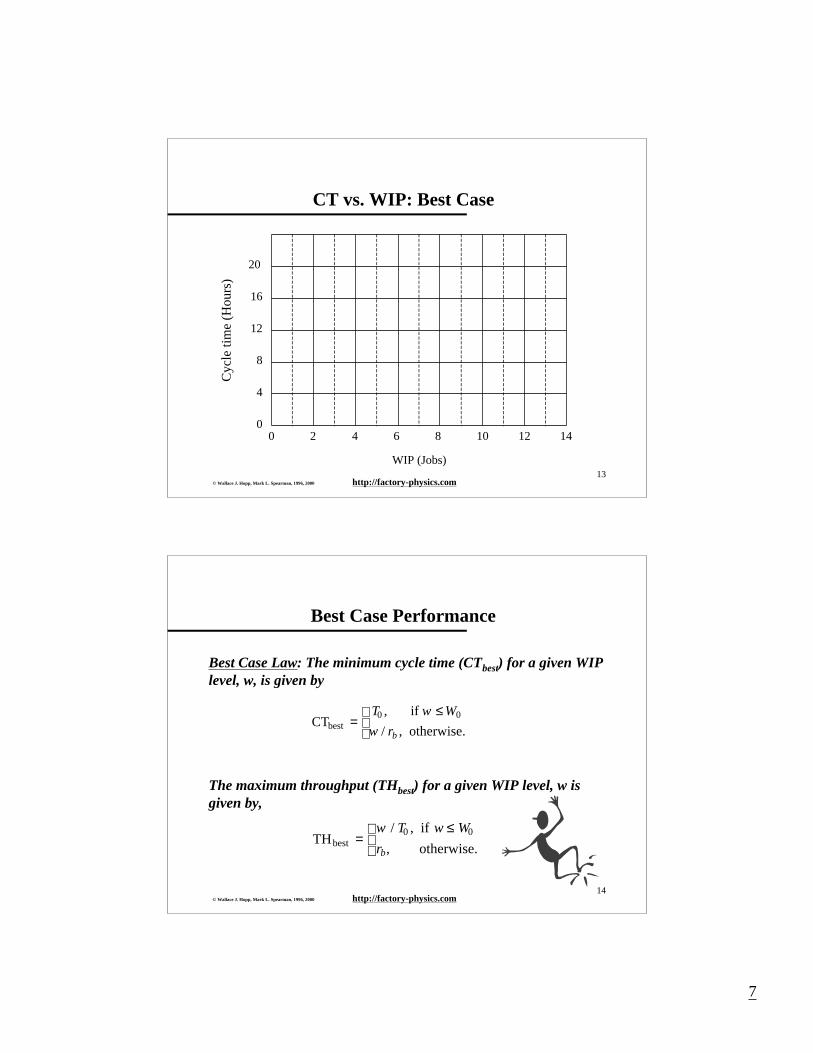
CT vs. WIP: Best CaseC
ycle
tim
e (H
ours
)
0 2 4 6 8 10 12 140
8
16
12
20
4
WIP (Jobs)
14© Wallace J. Hopp, Mark L. Spearman, 1996, 2000 http://factory-physics.com
Best Case Performance
Best Case Law: The minimum cycle time (CTbest) for a given WIPlevel, w, is given by
The maximum throughput (THbest) for a given WIP level, w isgiven by,
CTbest = T0 ,
w / rb ,
if w ≤ W0
otherwise.
THbest = w / T0 ,
rb,
if w ≤ W0
otherwise.

8
15© Wallace J. Hopp, Mark L. Spearman, 1996, 2000 http://factory-physics.com
Best Case Performance (cont.)
Example: For Penny Fab, rb = 0.5 and T0 = 8, so W0 = 0.5 × 8 = 4,
which are exactly the curves we plotted.
CTbest = 8,
2w,
if w ≤ 4
otherwise.
THbest = w / 8 ,
0.5,
if w ≤ 4
otherwise.
16© Wallace J. Hopp, Mark L. Spearman, 1996, 2000 http://factory-physics.com
A Manufacturing Law
Little's Law: The fundamental relation between WIP, CT, andTH over the long-term is:
Examples:• Checking WIP levels in cash flow analysis.
• Measure of cycle time (e.g., what is cycle time for an automobile?)
• FGI and planned inventory.
WIP = TH × CT
units =units
hr × hrs

9
17© Wallace J. Hopp, Mark L. Spearman, 1996, 2000 http://factory-physics.com
Penny Fab Two
10 hr
2 hr
5 hr 3 hr
18© Wallace J. Hopp, Mark L. Spearman, 1996, 2000 http://factory-physics.com
Penny Fab Two
StationNumber
Number ofMachines
ProcessTime
StationRate
1 1 2 hr j/hr
2 2 5 hr j/hr
3 6 10 hr j/hr
4 2 3 hr j/hr
rb = T0 = W0 =

10
19© Wallace J. Hopp, Mark L. Spearman, 1996, 2000 http://factory-physics.com
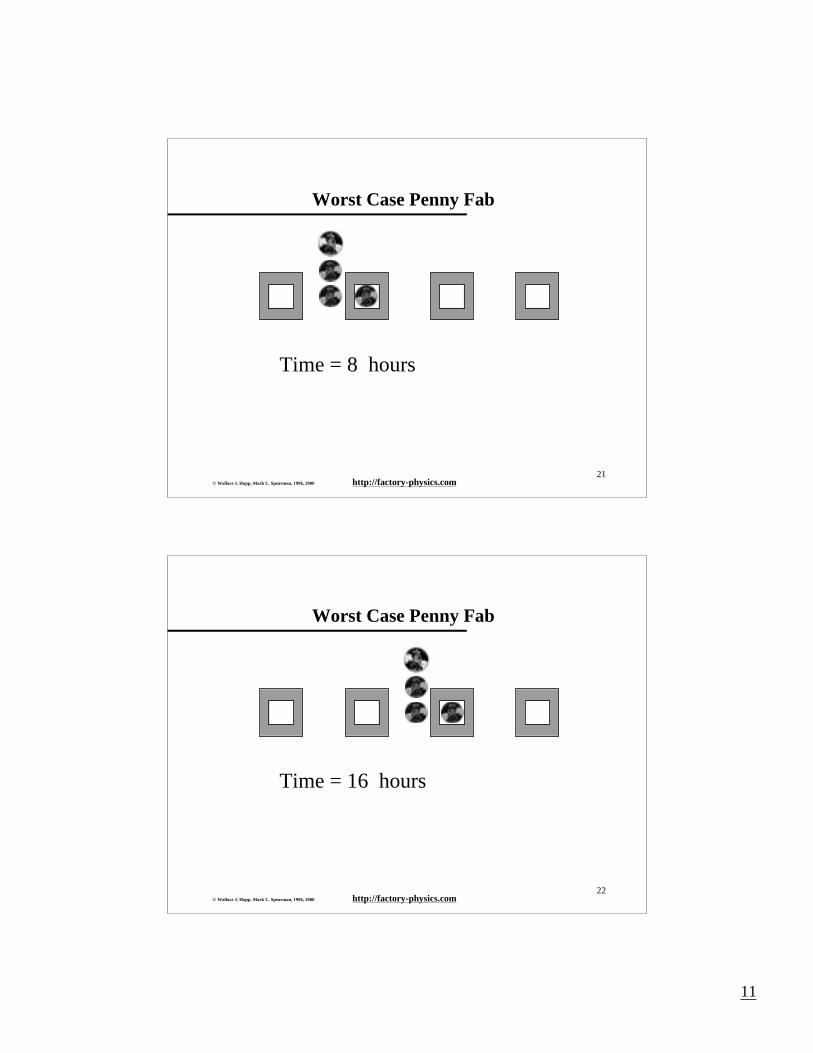
Worst Case
Observation: The Best Case yields the minimum cycle time andmaximum throughput for each WIP level.
Question: What conditions would cause the maximum cycle time andminimum throughput?
Experiment:• set average process times same as Best Case (so rb and T0 unchanged)
• follow a marked job through system
• imagine marked job experiences maximum queueing
20© Wallace J. Hopp, Mark L. Spearman, 1996, 2000 http://factory-physics.com
Worst Case Penny Fab
Time = 0 hours
11
21© Wallace J. Hopp, Mark L. Spearman, 1996, 2000 http://factory-physics.com
Worst Case Penny Fab
Time = 8 hours
22© Wallace J. Hopp, Mark L. Spearman, 1996, 2000 http://factory-physics.com
Worst Case Penny Fab
Time = 16 hours
12
23© Wallace J. Hopp, Mark L. Spearman, 1996, 2000 http://factory-physics.com
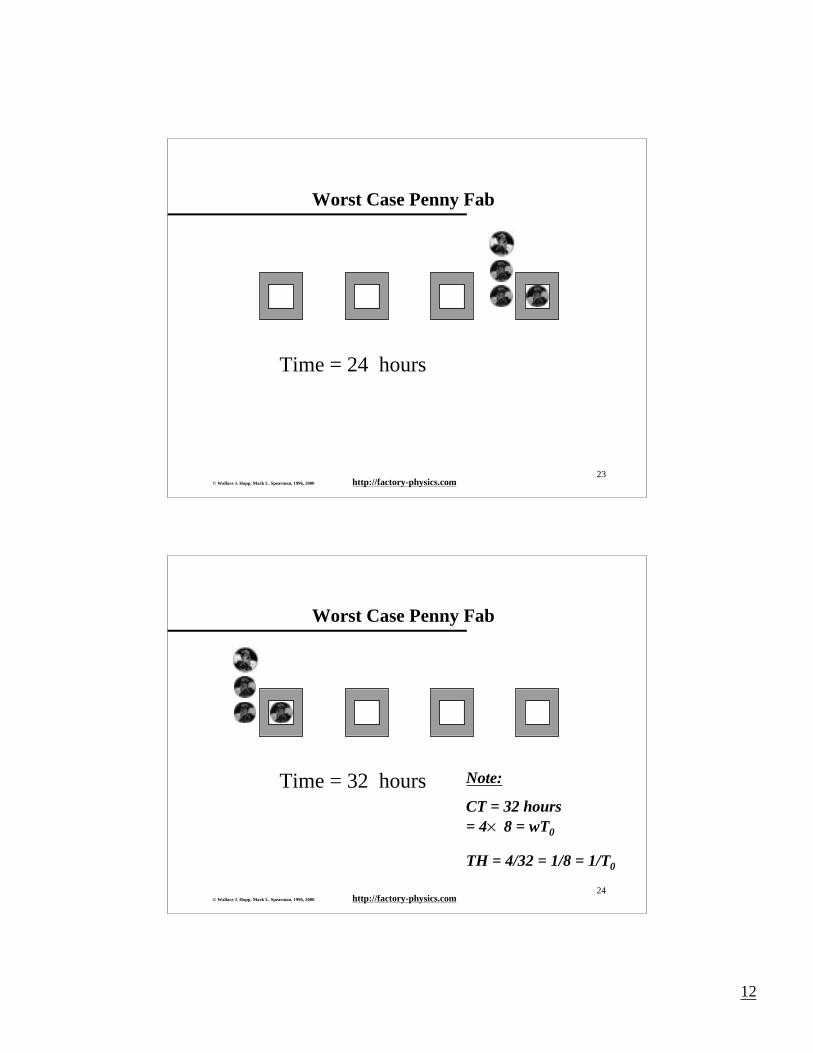
Worst Case Penny Fab
Time = 24 hours
24© Wallace J. Hopp, Mark L. Spearman, 1996, 2000 http://factory-physics.com
Worst Case Penny Fab
Time = 32 hours Note:
CT = 32 hours= 4 8 = wT0
TH = 4/32 = 1/8 = 1/T0
13
25© Wallace J. Hopp, Mark L. Spearman, 1996, 2000 http://factory-physics.com
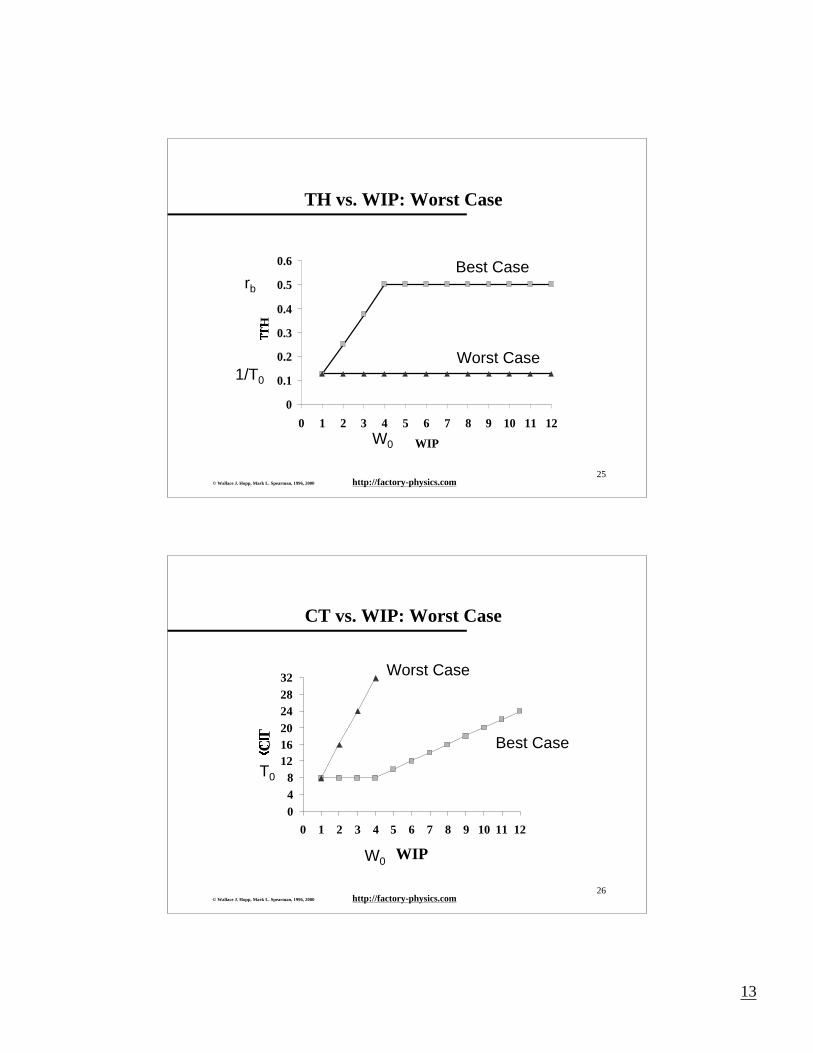
TH vs. WIP: Worst Case
0
0.1
0.2
0.3
0.4
0.5
0.6
0 1 2 3 4 5 6 7 8 9 10 11 12
WIP
TH
rb
W0
1/T0
Best Case
Worst Case
26© Wallace J. Hopp, Mark L. Spearman, 1996, 2000 http://factory-physics.com
CT vs. WIP: Worst Case
0
4
8
12
16
20
24
28
32
0 1 2 3 4 5 6 7 8 9 10 11 12
WIP
CT
T0
W0
Best Case
Worst Case
14
27© Wallace J. Hopp, Mark L. Spearman, 1996, 2000 http://factory-physics.com
Worst Case Performance
Worst Case Law: The worst case cycle time for a given WIP level,w, is given by,
CTworst = w T0
The worst case throughput for a given WIP level, w, is given by,
THworst = 1 / T0
Randomness? None - perfectly predictable, but bad!
28© Wallace J. Hopp, Mark L. Spearman, 1996, 2000 http://factory-physics.com
Practical Worst Case
Observation: There is a BIG GAP between the Best Case and WorstCase performance.
Question: Can we find an intermediate case that:• divides “good” and “bad” lines, and
• is computable?
Experiment: consider a line with a given rb and T0 and:• single machine stations
• balanced lines
• variability such that all WIP configurations (states) are equally likely

15
29© Wallace J. Hopp, Mark L. Spearman, 1996, 2000 http://factory-physics.com
PWC Example – 3 jobs, 4 stations
State Vector State Vector1 (3,0,0,0) 11 (1,0,2,0) 2 (0,3,0,0) 12 (0,1,2,0) 3 (0,0,3,0) 13 (0,0,2,1) 4 (0,0,0,3) 14 (1,0,0,2) 5 (2,1,0,0) 15 (0,1,0,2) 6 (2,0,1,0) 16 (0,0,1,2) 7 (2,0,0,1) 17 (1,1,1,0) 8 (1,2,0,0) 18 (1,1,0,1) 9 (0,2,1,0) 19 (1,0,1,1) 10 (0,2,0,1) 20 (0,1,1,1)
clumped up states
spread out states
Note: average WIP at any station is 15/20 = 0.75, so jobs are spread evenly between stations.
30© Wallace J. Hopp, Mark L. Spearman, 1996, 2000 http://factory-physics.com
Practical Worst Case
Let w = jobs in system, N = no. stations in line, and t = processtime at all stations:
CT(single) = (1 + (w-1)/N) t
CT(line) = N [1 + (w-1)/N] t
= Nt + (w-1)t
= T0 + (w-1)/rb
TH = WIP/CT
= [w/(w+W0-1)]rb
From Little’s Law

16
31© Wallace J. Hopp, Mark L. Spearman, 1996, 2000 http://factory-physics.com
Practical Worst Case Performance
Practical Worst Case Definition: The practical worst case (PWC)cycle time for a given WIP level, w, is given by,
The PWC throughput for a given WIP level, w, is given by,
where W0 is the critical WIP.
br
wT
1CT 0PWC
−+=
,1
TH0
PWC brwW
w
−+=
32© Wallace J. Hopp, Mark L. Spearman, 1996, 2000 http://factory-physics.com
TH vs. WIP: Practical Worst Case
0
0.1
0.2
0.3
0.4
0.5
0.6
0 1 2 3 4 5 6 7 8 9 10 11 12
WIP
TH
rb
W0
1/T0
Best Case
Worst Case
PWC“Good”
“Bad”

17
33© Wallace J. Hopp, Mark L. Spearman, 1996, 2000 http://factory-physics.com
CT vs. WIP: Practical Worst Case
0
4
8
12
16
20
24
28
32
0 1 2 3 4 5 6 7 8 9 10 11 12
WIP
CT
T0
W0
Best Case
Worst Case PWC
“Bad”
“Good”
34© Wallace J. Hopp, Mark L. Spearman, 1996, 2000 http://factory-physics.com
0
0.1
0.2
0.3
0.4
0.5
0 2 4 6 8 10 12 14 16 18 20 22 24 26
WIP
TH
Penny Fab Two Performance
Worst Case
Penny Fab 2
Best Case
Practical Worst Case
1/T0
rb
W0
Note: processtimes in PF2have var equalto PWC.
But… unlike PWC, it hasunbalancedline and multimachine stations.
18
35© Wallace J. Hopp, Mark L. Spearman, 1996, 2000 http://factory-physics.com
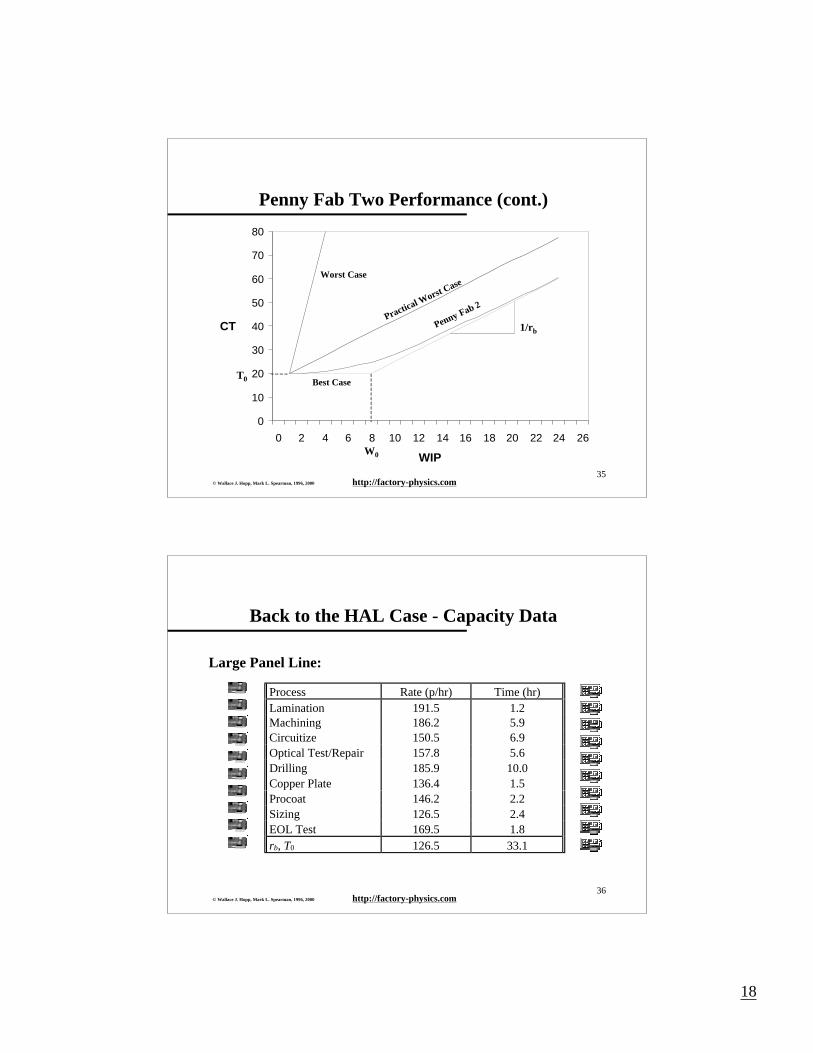
Penny Fab Two Performance (cont.)
0
10
20
30
40
50
60
70
80
0 2 4 6 8 10 12 14 16 18 20 22 24 26
WIP
CT
Worst Case
Penny Fab 2
Best Case
Practical Worst C
ase
T0
1/rb
W0
36© Wallace J. Hopp, Mark L. Spearman, 1996, 2000 http://factory-physics.com
Back to the HAL Case - Capacity Data
Large Panel Line:
Process Rate (p/hr) Time (hr)Lamination 191.5 1.2Machining 186.2 5.9Circuitize 150.5 6.9Optical Test/Repair 157.8 5.6Drilling 185.9 10.0Copper Plate 136.4 1.5Procoat 146.2 2.2Sizing 126.5 2.4EOL Test 169.5 1.8rb, T0 126.5 33.1

19
37© Wallace J. Hopp, Mark L. Spearman, 1996, 2000 http://factory-physics.com
HAL Case - Situation
Critical WIP: rbT0 = 126.5 × 33.1 = 4187
Actual Values:• CT = 34 days = 816 hours
• WIP = 37400 panels
• TH = 45.8 panels/hour
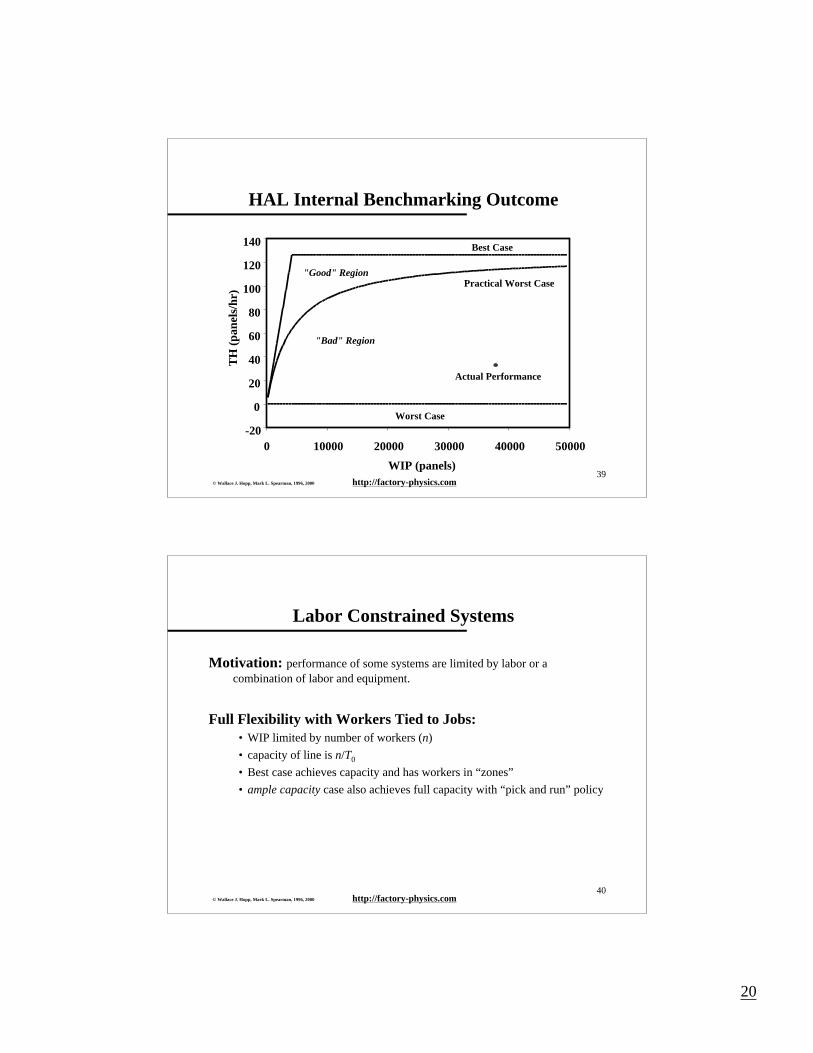
Conclusions:• Throughput is 36% of capacity
• WIP is 8.9 times critical WIP
• CT is 24.6 times raw process time
38© Wallace J. Hopp, Mark L. Spearman, 1996, 2000 http://factory-physics.com
HAL Case - Analysis
WIP Required for PWC to Achieve TH = 0.36rb:
TH Resulting from PWC with WIP = 37,400:
355,2)1187,4(64.0
36.0)1(
64.0
36.0
36.01
0
0
=−=−=
=−+
=
Ww
rrWw
wTH bb
8.1135.1261187,4400,37
400,37
10
=−+
=−+
= brWw
wTH
Much lower thanactual WIP!
Much higherthan actual TH!
Conclusion: actual system is much worse than PWC!
20
39© Wallace J. Hopp, Mark L. Spearman, 1996, 2000 http://factory-physics.com
HAL Internal Benchmarking Outcome
-20
0
20
40
60
80
100
120
140
0 10000 20000 30000 40000 50000
WIP (panels)
TH
(p
anel
s/h
r)Best Case
Practical Worst Case
Worst Case
Actual Performance
"Good" Region
"Bad" Region
40© Wallace J. Hopp, Mark L. Spearman, 1996, 2000 http://factory-physics.com
Labor Constrained Systems
Motivation: performance of some systems are limited by labor or acombination of labor and equipment.
Full Flexibility with Workers Tied to Jobs:• WIP limited by number of workers (n)
• capacity of line is n/T0
• Best case achieves capacity and has workers in “zones”
• ample capacity case also achieves full capacity with “pick and run” policy
21
41© Wallace J. Hopp, Mark L. Spearman, 1996, 2000 http://factory-physics.com
Labor Constrained Systems (cont.)
Full Flexibility with Workers Not Tied to Jobs:• TH depends on WIP levels
• THCW(n) ≤ TH(w) ≤ THCW(w)
• need policy to direct workers to jobs (focus on downstream is effective)
Agile Workforce Systems• bucket brigades
• kanban with shared tasks
• overlapping zones
• many others
42© Wallace J. Hopp, Mark L. Spearman, 1996, 2000 http://factory-physics.com
Factory Dynamics Takeaways
Performance Measures:• throughput• WIP• cycle time• service
Range of Cases:• best case• practical worst case• worst case
Diagnostics:• simple assessment based on rb, T0, actual WIP,actual TH• evaluate relative to practical worst case