Embed Size (px)
Citation preview
You may use these materials only for nonprofit educational purposes. Please give credit/cite appropriately.
1
Assessment Office (808) 956‐4283Hawai‘i Hall 107 2500 Campus Road, (808) 956‐6669Honolulu, HI 96822 manoa.hawaii.edu/assessment
BASIC TECHNIQUES IN USING EXCEL TO ANALYZE ASSESSMENT DATA
University of Hawai‘i at Mānoa 11/15/12
1
Mission: Improve Student Learning Through Program Assessment
2
You may use these materials only for nonprofit educational purposes. Please give credit/cite appropriately.
2
Assessment Office (808) 956‐4283Hawai‘i Hall 107 2500 Campus Road, (808) 956‐6669Honolulu, HI 96822 manoa.hawaii.edu/assessment
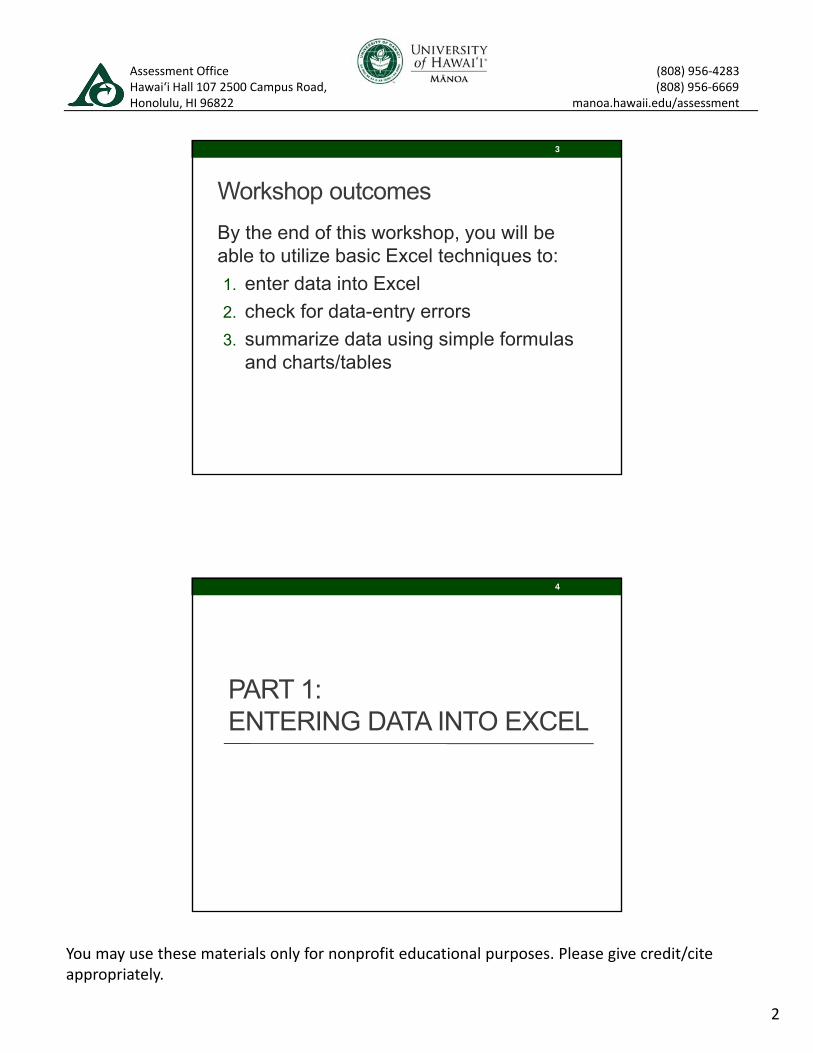
Workshop outcomes
By the end of this workshop, you will be able to utilize basic Excel techniques to:
1. enter data into Excel
2. check for data-entry errors
3. summarize data using simple formulas and charts/tables
3
PART 1:ENTERING DATA INTO EXCEL
4
You may use these materials only for nonprofit educational purposes. Please give credit/cite appropriately.
3
Assessment Office (808) 956‐4283Hawai‘i Hall 107 2500 Campus Road, (808) 956‐6669Honolulu, HI 96822 manoa.hawaii.edu/assessment
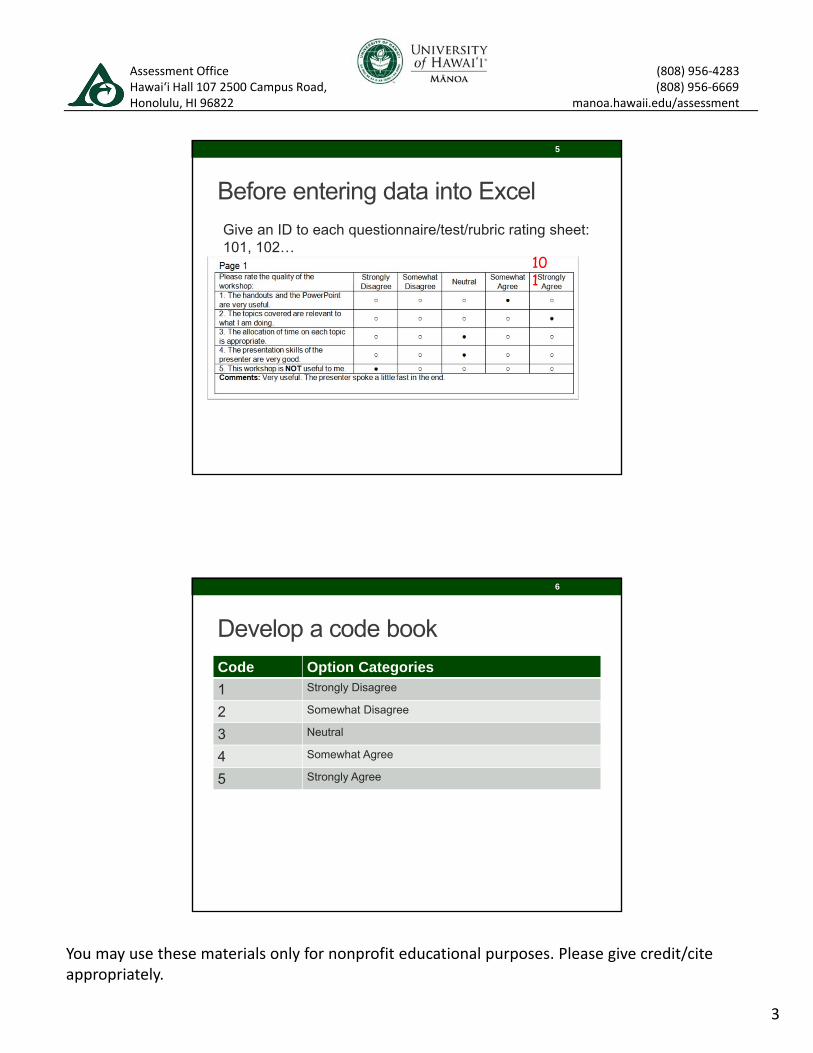
Before entering data into Excel
Give an ID to each questionnaire/test/rubric rating sheet: 101, 102…
101
5
Develop a code book
Code Option Categories
1 Strongly Disagree
2 Somewhat Disagree
3 Neutral
4 Somewhat Agree
5 Strongly Agree
6
You may use these materials only for nonprofit educational purposes. Please give credit/cite appropriately.
4
Assessment Office (808) 956‐4283Hawai‘i Hall 107 2500 Campus Road, (808) 956‐6669Honolulu, HI 96822 manoa.hawaii.edu/assessment
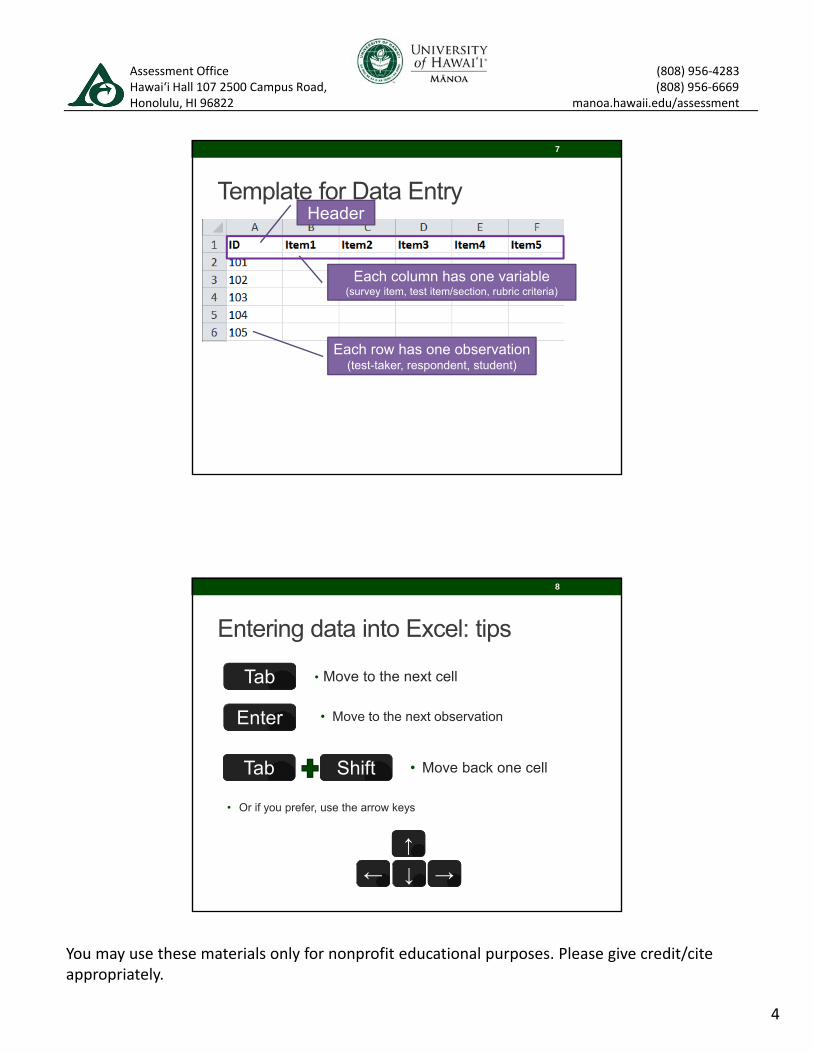
Template for Data EntryHeader
Each column has one variable (survey item, test item/section, rubric criteria)
Each row has one observation(test-taker, respondent, student)
7
Entering data into Excel: tips
• Move to the next cellTab
• Move to the next observationEnter
• Move back one cellShiftTab
• Or if you prefer, use the arrow keys
↑
← ↓ →
8
You may use these materials only for nonprofit educational purposes. Please give credit/cite appropriately.
5
Assessment Office (808) 956‐4283Hawai‘i Hall 107 2500 Campus Road, (808) 956‐6669Honolulu, HI 96822 manoa.hawaii.edu/assessment
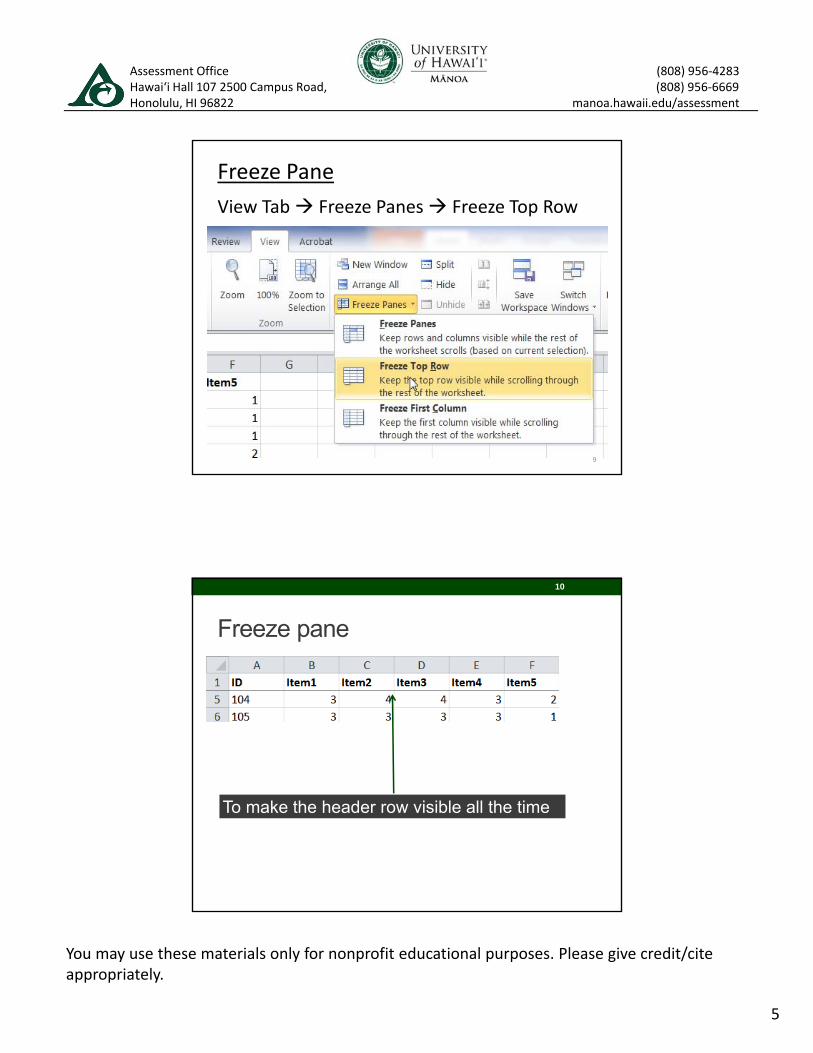
Freeze Pane
View Tab Freeze Panes Freeze Top Row
9
Freeze pane
To make the header row visible all the time
10

You may use these materials only for nonprofit educational purposes. Please give credit/cite appropriately.
6
Assessment Office (808) 956‐4283Hawai‘i Hall 107 2500 Campus Road, (808) 956‐6669Honolulu, HI 96822 manoa.hawaii.edu/assessment
Hands-on task 1
• Enter data from the five survey response sheets
• Remember:
1. Give each respondent an ID code
2. Follow the code book to enter data in Excel
3. One item per column
4. One respondent per row
5. Tab tab tab tab tab ENTER or ENTER
6. Freeze the top row
11
Additional resources
• Beauchemin, A. (2011) Microsoft Excel 2010 tutorial. Retrieved from http://www.goodwin.edu/computer_resources/pdfs/excel_2010_tutorial.pdf
• Chan, V. (2012). Working with data in Excel part 1: 10 Excel data entry tips everyone should know. Retrieved from http://www.launchexcel.com/excel-data-entry-power-tips/
12
You may use these materials only for nonprofit educational purposes. Please give credit/cite appropriately.
7
Assessment Office (808) 956‐4283Hawai‘i Hall 107 2500 Campus Road, (808) 956‐6669Honolulu, HI 96822 manoa.hawaii.edu/assessment
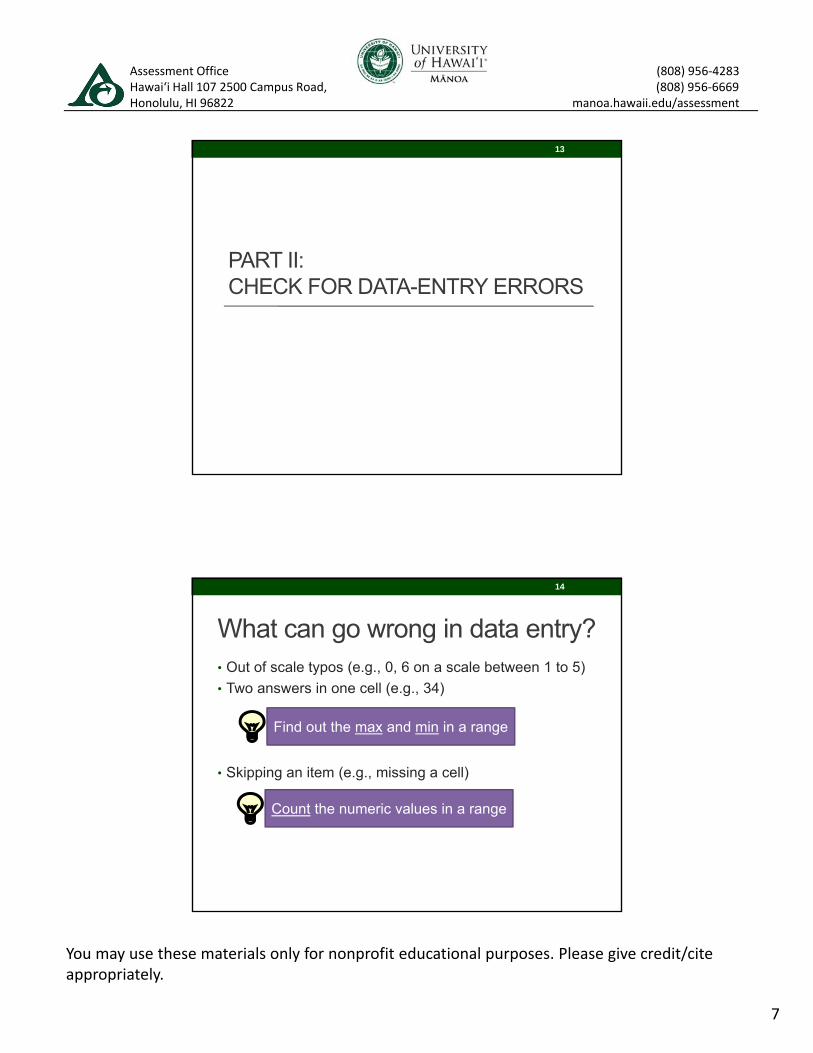
PART II:CHECK FOR DATA-ENTRY ERRORS
13
What can go wrong in data entry?• Out of scale typos (e.g., 0, 6 on a scale between 1 to 5)
• Two answers in one cell (e.g., 34)
• Skipping an item (e.g., missing a cell)
Find out the max and min in a range
Count the numeric values in a range
14
You may use these materials only for nonprofit educational purposes. Please give credit/cite appropriately.
8
Assessment Office (808) 956‐4283Hawai‘i Hall 107 2500 Campus Road, (808) 956‐6669Honolulu, HI 96822 manoa.hawaii.edu/assessment
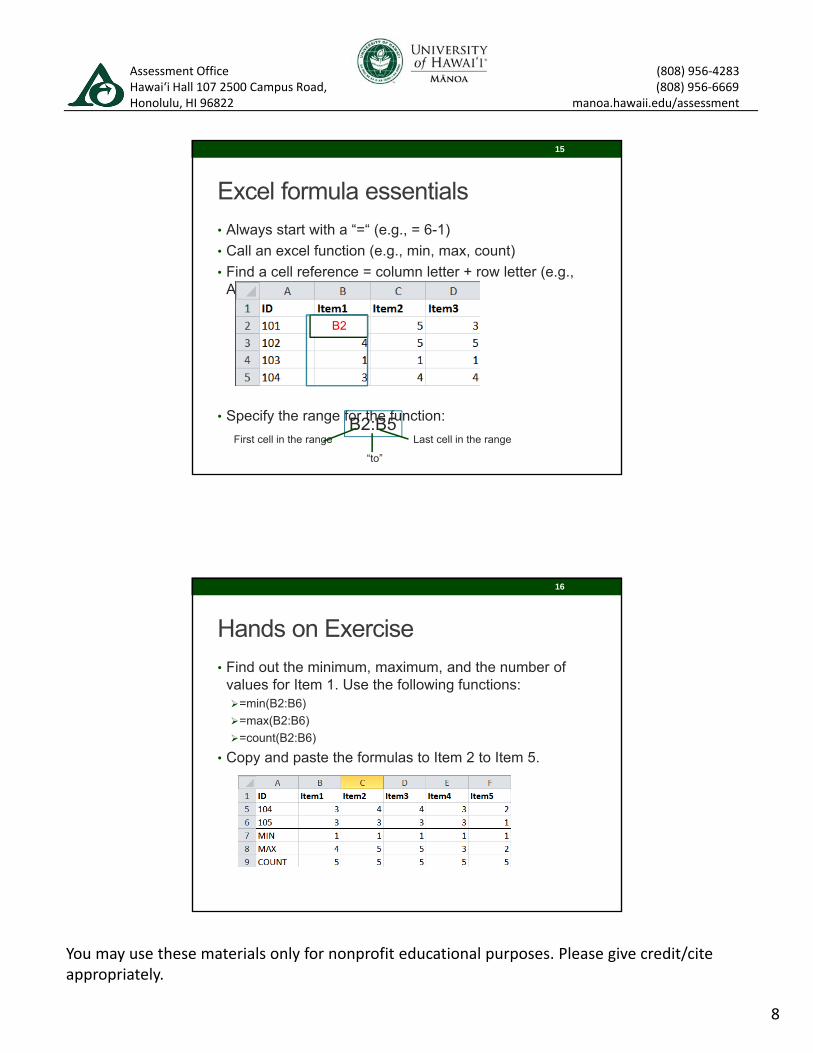
Excel formula essentials
• Always start with a “=“ (e.g., = 6-1)
• Call an excel function (e.g., min, max, count)
• Find a cell reference = column letter + row letter (e.g., A1)
• Specify the range for the function:
B2
B2:B5First cell in the range Last cell in the range
“to”
15
Hands on Exercise
• Find out the minimum, maximum, and the number of values for Item 1. Use the following functions:=min(B2:B6)
=max(B2:B6)
=count(B2:B6)
• Copy and paste the formulas to Item 2 to Item 5.
16
You may use these materials only for nonprofit educational purposes. Please give credit/cite appropriately.
9
Assessment Office (808) 956‐4283Hawai‘i Hall 107 2500 Campus Road, (808) 956‐6669Honolulu, HI 96822 manoa.hawaii.edu/assessment
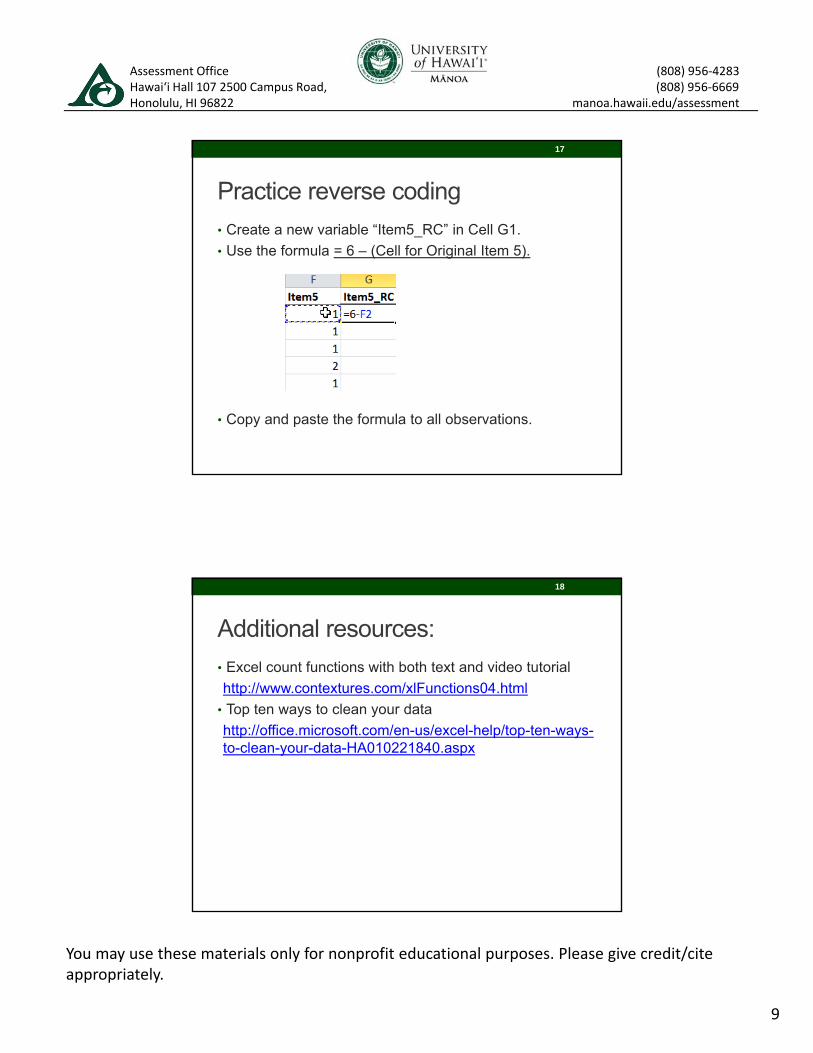
Practice reverse coding
• Create a new variable “Item5_RC” in Cell G1.
• Use the formula = 6 – (Cell for Original Item 5).
• Copy and paste the formula to all observations.
17
Additional resources:
• Excel count functions with both text and video tutorial
http://www.contextures.com/xlFunctions04.html
• Top ten ways to clean your data
http://office.microsoft.com/en-us/excel-help/top-ten-ways-to-clean-your-data-HA010221840.aspx
18
You may use these materials only for nonprofit educational purposes. Please give credit/cite appropriately.
10
Assessment Office (808) 956‐4283Hawai‘i Hall 107 2500 Campus Road, (808) 956‐6669Honolulu, HI 96822 manoa.hawaii.edu/assessment
PART III:SUMMARIZING DATA INTO A TABLE
19
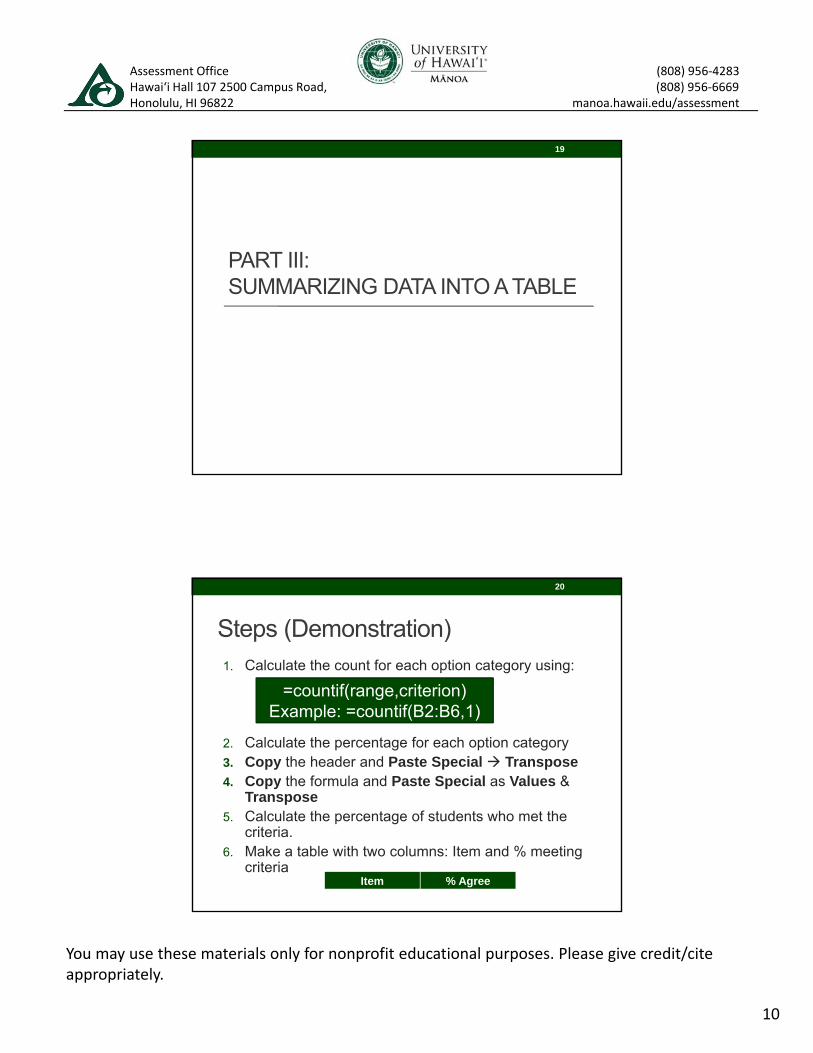
Steps (Demonstration)1. Calculate the count for each option category using:
2. Calculate the percentage for each option category3. Copy the header and Paste Special Transpose4. Copy the formula and Paste Special as Values &
Transpose5. Calculate the percentage of students who met the
criteria.6. Make a table with two columns: Item and % meeting
criteria
=countif(range,criterion)Example: =countif(B2:B6,1)
Item % Agree
20
You may use these materials only for nonprofit educational purposes. Please give credit/cite appropriately.
11
Assessment Office (808) 956‐4283Hawai‘i Hall 107 2500 Campus Road, (808) 956‐6669Honolulu, HI 96822 manoa.hawaii.edu/assessment
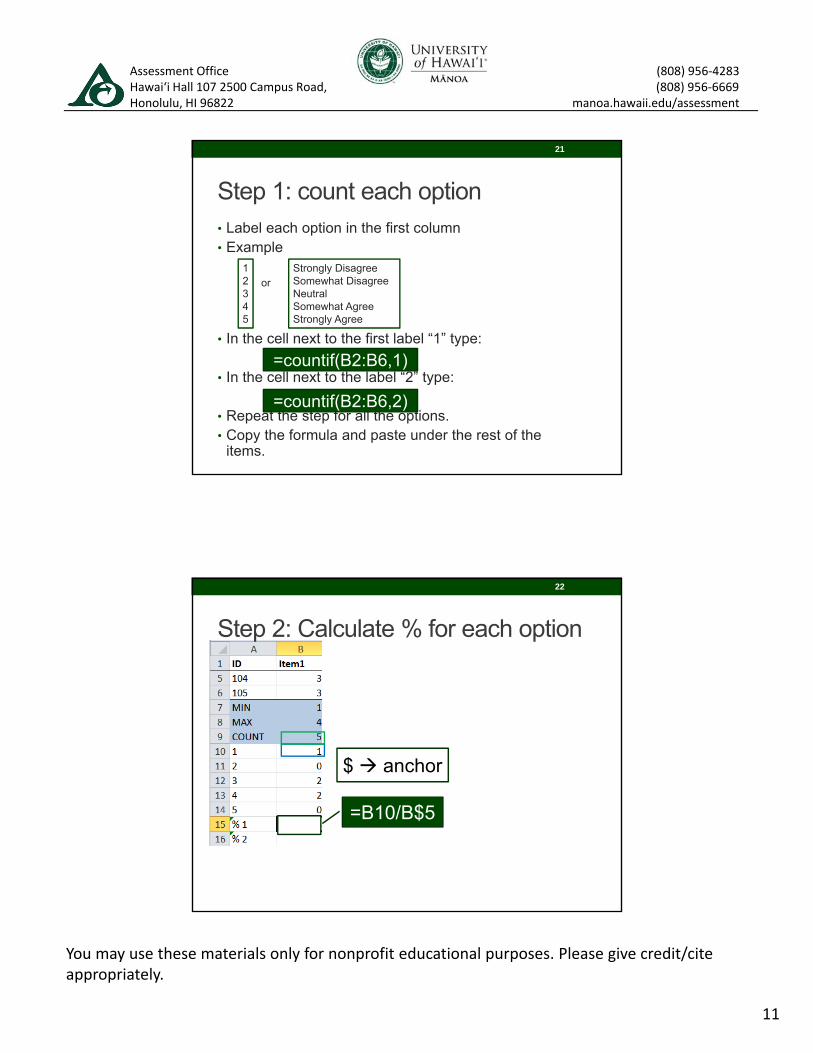
Step 1: count each option• Label each option in the first column • Example
or
• In the cell next to the first label “1” type:
• In the cell next to the label “2” type:
• Repeat the step for all the options.• Copy the formula and paste under the rest of the
items.
12345
Strongly DisagreeSomewhat DisagreeNeutralSomewhat AgreeStrongly Agree
=countif(B2:B6,1)
=countif(B2:B6,2)
21
Step 2: Calculate % for each option
=B10/B$5
$ anchor
22
You may use these materials only for nonprofit educational purposes. Please give credit/cite appropriately.
12
Assessment Office (808) 956‐4283Hawai‘i Hall 107 2500 Campus Road, (808) 956‐6669Honolulu, HI 96822 manoa.hawaii.edu/assessment
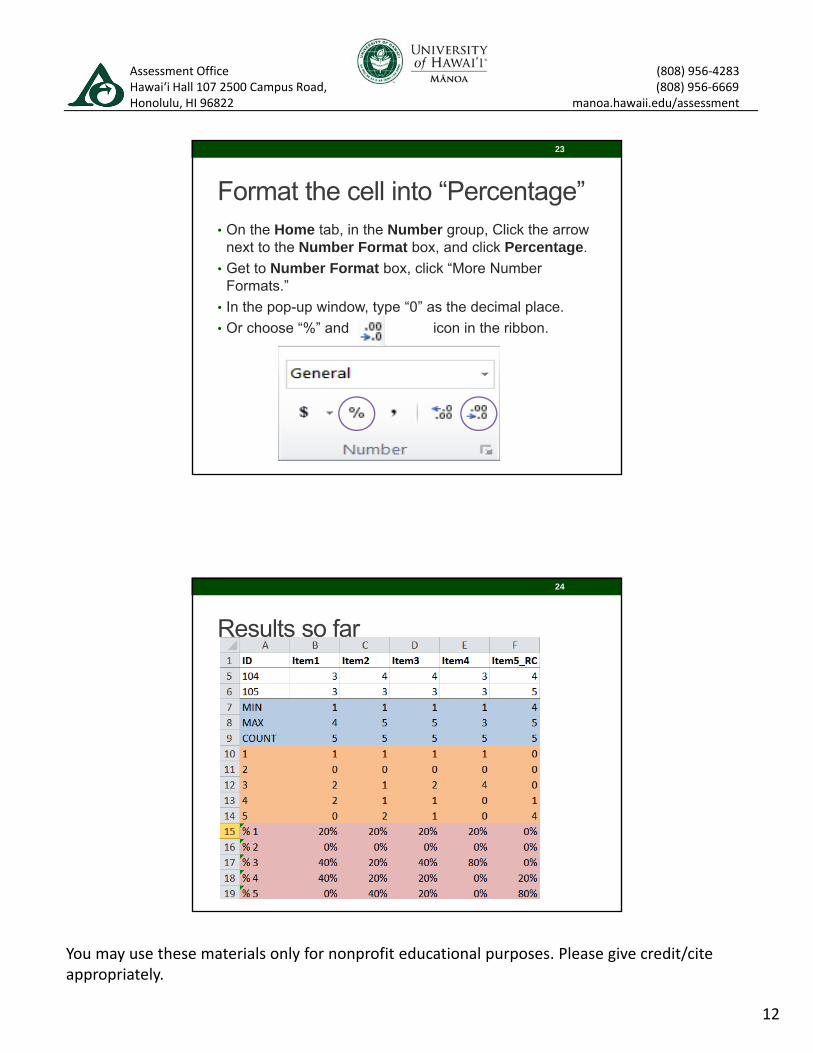
Format the cell into “Percentage”• On the Home tab, in the Number group, Click the arrow
next to the Number Format box, and click Percentage.
• Get to Number Format box, click “More Number Formats.”
• In the pop-up window, type “0” as the decimal place.
• Or choose “%” and icon in the ribbon.
23
Results so far
24
You may use these materials only for nonprofit educational purposes. Please give credit/cite appropriately.
13
Assessment Office (808) 956‐4283Hawai‘i Hall 107 2500 Campus Road, (808) 956‐6669Honolulu, HI 96822 manoa.hawaii.edu/assessment
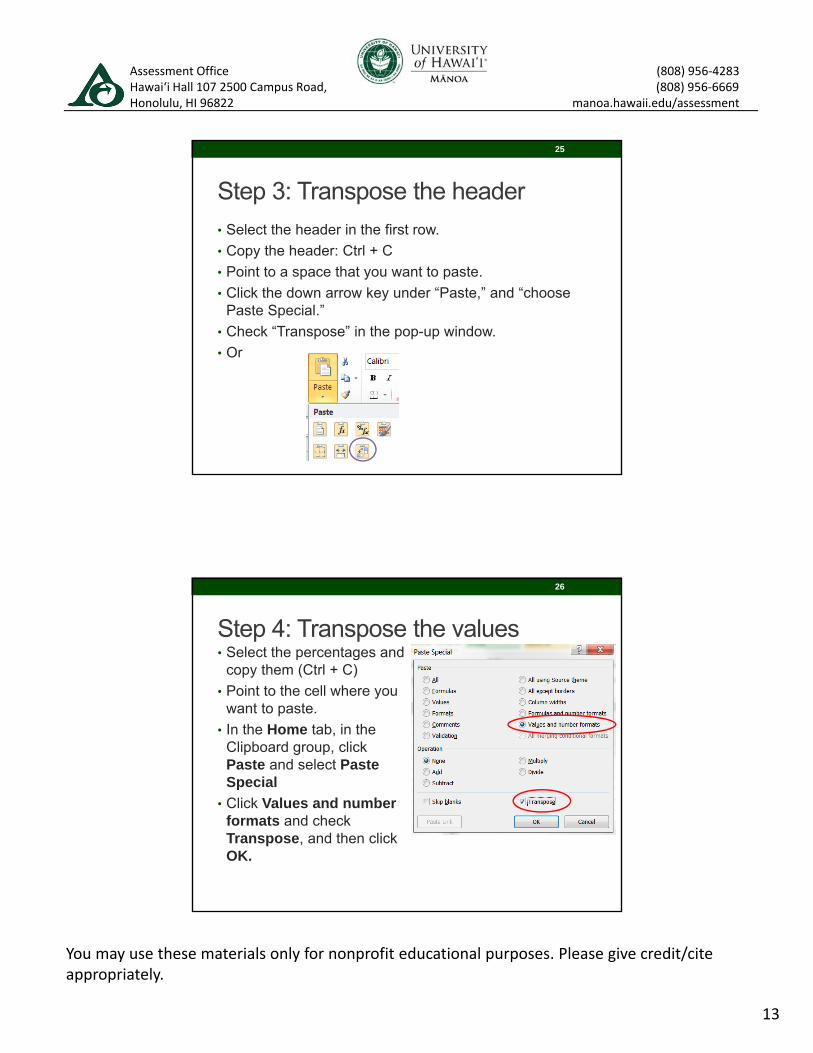
Step 3: Transpose the header
• Select the header in the first row.
• Copy the header: Ctrl + C
• Point to a space that you want to paste.
• Click the down arrow key under “Paste,” and “choose Paste Special.”
• Check “Transpose” in the pop-up window.
• Or
25
Step 4: Transpose the values• Select the percentages and
copy them (Ctrl + C)
• Point to the cell where you want to paste.
• In the Home tab, in the Clipboard group, click Paste and select Paste Special
• Click Values and number formats and check Transpose, and then click OK.
26
You may use these materials only for nonprofit educational purposes. Please give credit/cite appropriately.
14
Assessment Office (808) 956‐4283Hawai‘i Hall 107 2500 Campus Road, (808) 956‐6669Honolulu, HI 96822 manoa.hawaii.edu/assessment
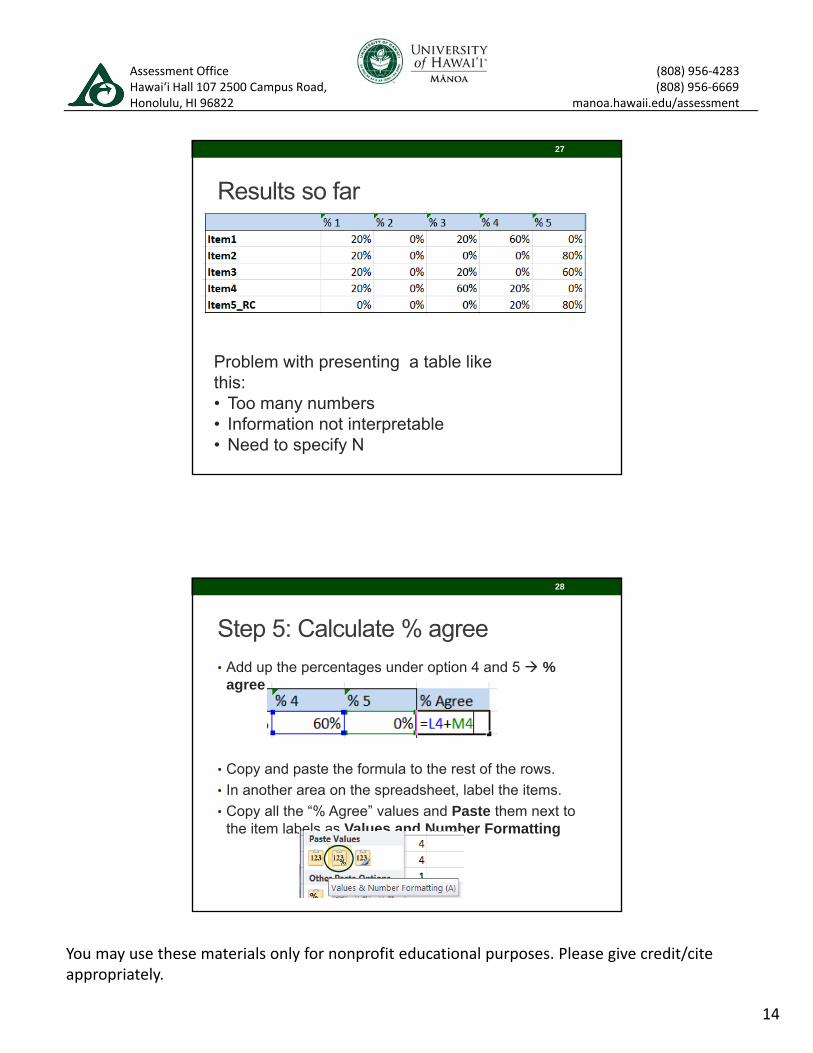
Results so far
Problem with presenting a table like this:• Too many numbers• Information not interpretable• Need to specify N
27
Step 5: Calculate % agree
• Add up the percentages under option 4 and 5 % agree
• Copy and paste the formula to the rest of the rows.
• In another area on the spreadsheet, label the items.
• Copy all the “% Agree” values and Paste them next to the item labels as Values and Number Formatting
28

You may use these materials only for nonprofit educational purposes. Please give credit/cite appropriately.
15
Assessment Office (808) 956‐4283Hawai‘i Hall 107 2500 Campus Road, (808) 956‐6669Honolulu, HI 96822 manoa.hawaii.edu/assessment
Results so far
29
Sort the % Agree values1. Go to the Home tab, in the Editing group, click Sort & Filter.2. In the drop-down menu, click Custom Sort.3. In the Sort pop-up window, check My data has headers; choose “% Agree” to Sort by. Select Largest to Smallest under Order.
30
You may use these materials only for nonprofit educational purposes. Please give credit/cite appropriately.
16
Assessment Office (808) 956‐4283Hawai‘i Hall 107 2500 Campus Road, (808) 956‐6669Honolulu, HI 96822 manoa.hawaii.edu/assessment
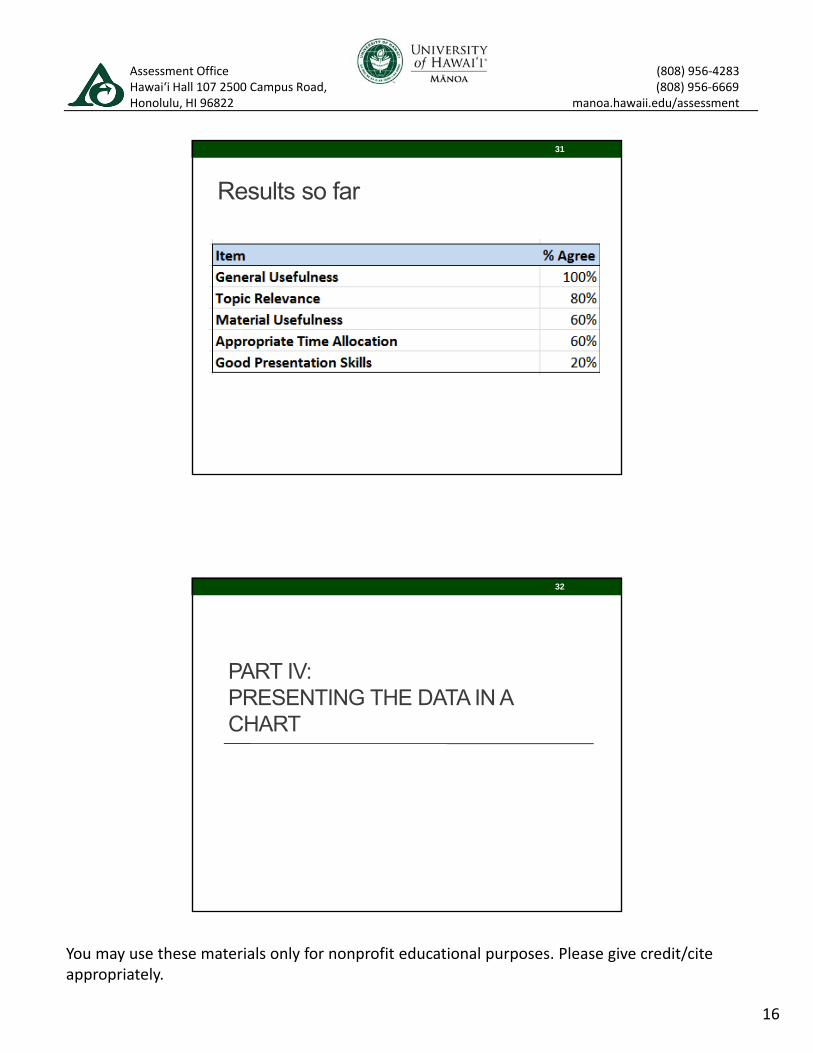
Results so far
31
PART IV: PRESENTING THE DATA IN A CHART
32

You may use these materials only for nonprofit educational purposes. Please give credit/cite appropriately.
17
Assessment Office (808) 956‐4283Hawai‘i Hall 107 2500 Campus Road, (808) 956‐6669Honolulu, HI 96822 manoa.hawaii.edu/assessment
Steps to create a chart
1. Select the cells with data and the header.
2. Go to the Insert tab, in the Charts
3. Click Column chart type, and then click the first subtype — 2D clustered column
4. Format the chart as desired
33
It looks like this:
34
You may use these materials only for nonprofit educational purposes. Please give credit/cite appropriately.
18
Assessment Office (808) 956‐4283Hawai‘i Hall 107 2500 Campus Road, (808) 956‐6669Honolulu, HI 96822 manoa.hawaii.edu/assessment
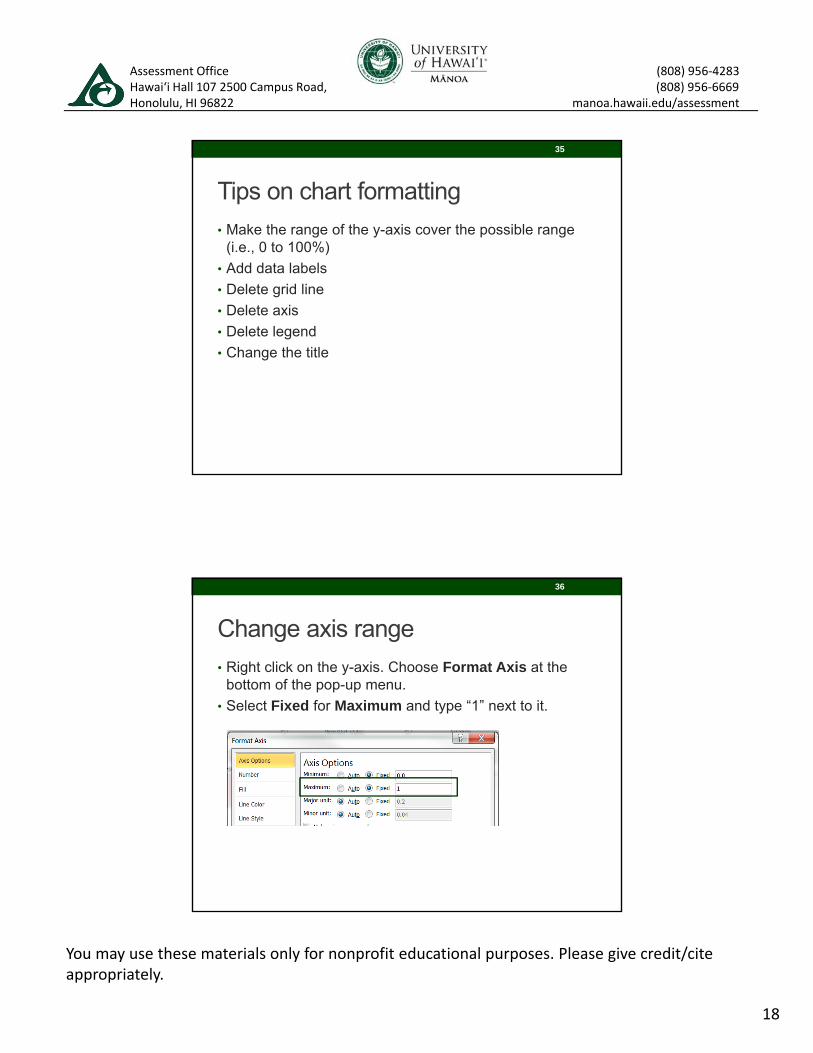
Tips on chart formatting
• Make the range of the y-axis cover the possible range (i.e., 0 to 100%)
• Add data labels
• Delete grid line
• Delete axis
• Delete legend
• Change the title
35
Change axis range
• Right click on the y-axis. Choose Format Axis at the bottom of the pop-up menu.
• Select Fixed for Maximum and type “1” next to it.
36

You may use these materials only for nonprofit educational purposes. Please give credit/cite appropriately.
19
Assessment Office (808) 956‐4283Hawai‘i Hall 107 2500 Campus Road, (808) 956‐6669Honolulu, HI 96822 manoa.hawaii.edu/assessment
Add data labels
• Right click on one of the value bars.
• Choose Add Data Labels in the pop-up menu.
37
Cleaned up chart
38
You may use these materials only for nonprofit educational purposes. Please give credit/cite appropriately.
20
Assessment Office (808) 956‐4283Hawai‘i Hall 107 2500 Campus Road, (808) 956‐6669Honolulu, HI 96822 manoa.hawaii.edu/assessment
Hands on Task
Open the data file: sample data_rubric.xlsx
Use the raw data in the first sheet and duplicate the results in the sheet: tables and charts.
39
QUESTIONS?
40
Assessment Office Hawai‘i Hall 107 2500 Campus Road, Honolulu, HI 96822
(808) 956-4283 (808) 956-6669
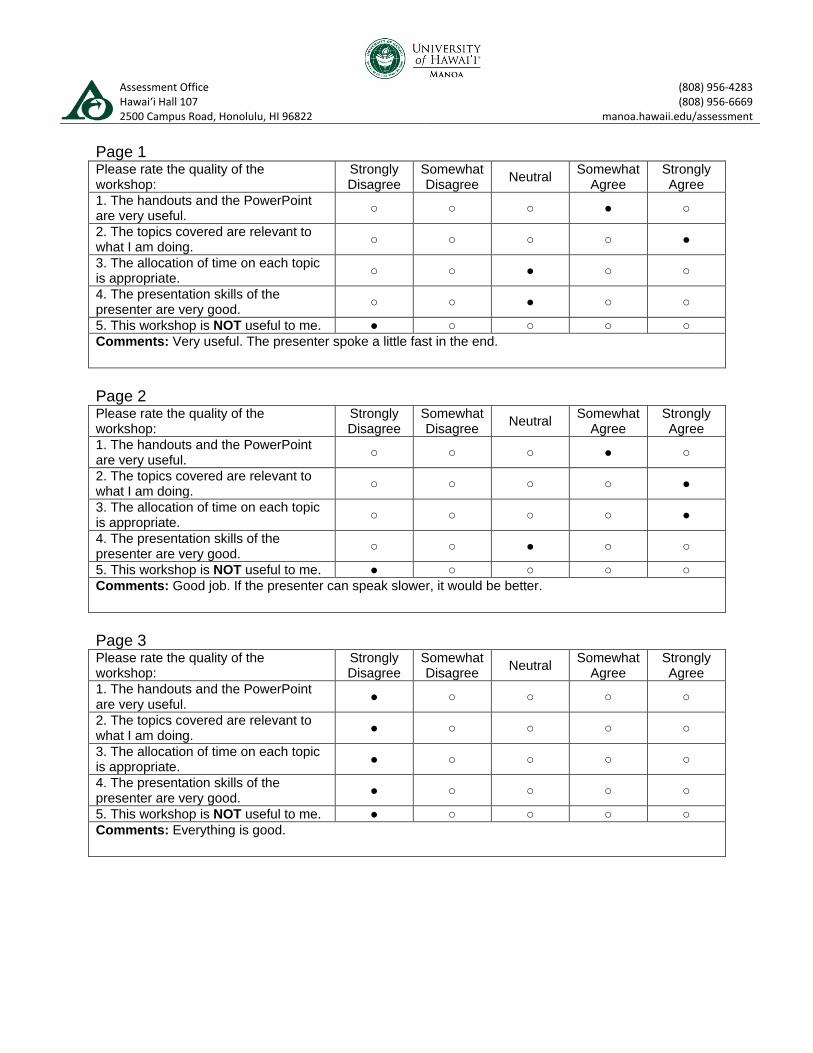
manoa.hawaii.edu/assessment Page 1 Please rate the quality of the workshop:
Strongly Disagree
Somewhat Disagree Neutral Somewhat
Agree Strongly Agree
1. The handouts and the PowerPoint are very useful. ○ ○ ○ ● ○
2. The topics covered are relevant to what I am doing. ○ ○ ○ ○ ●
3. The allocation of time on each topic is appropriate. ○ ○ ● ○ ○
4. The presentation skills of the presenter are very good. ○ ○ ● ○ ○
5. This workshop is NOT useful to me. ● ○ ○ ○ ○ Comments: Very useful. The presenter spoke a little fast in the end.
Page 2 Please rate the quality of the workshop:
Strongly Disagree
Somewhat Disagree Neutral Somewhat
Agree Strongly Agree
1. The handouts and the PowerPoint are very useful. ○ ○ ○ ● ○
2. The topics covered are relevant to what I am doing. ○ ○ ○ ○ ●
3. The allocation of time on each topic is appropriate. ○ ○ ○ ○ ●
4. The presentation skills of the presenter are very good. ○ ○ ● ○ ○
5. This workshop is NOT useful to me. ● ○ ○ ○ ○ Comments: Good job. If the presenter can speak slower, it would be better.
Page 3 Please rate the quality of the workshop:
Strongly Disagree
Somewhat Disagree Neutral Somewhat
Agree Strongly Agree
1. The handouts and the PowerPoint are very useful. ● ○ ○ ○ ○
2. The topics covered are relevant to what I am doing. ● ○ ○ ○ ○
3. The allocation of time on each topic is appropriate. ● ○ ○ ○ ○
4. The presentation skills of the presenter are very good. ● ○ ○ ○ ○
5. This workshop is NOT useful to me. ● ○ ○ ○ ○ Comments: Everything is good.

University of Hawai‘i at Mānoa Hawai‘i Hall 107 Assessment Office manoa.hawaii.edu/assessment
Page 4 Please rate the quality of the workshop:
Strongly Disagree
Somewhat Disagree Neutral Somewhat
Agree Strongly Agree
1. The handouts and the PowerPoint are very useful. ○ ○ ○ ● ○
2. The topics covered are relevant to what I am doing. ○ ○ ○ ○ ●
3. The allocation of time on each topic is appropriate. ○ ○ ○ ○ ●
4. The presentation skills of the presenter are very good. ○ ○ ○ ● ○
5. This workshop is NOT useful to me. ○ ● ○ ○ ○ Comments: the handouts are very good. The fonts on the PowerPoint are too small and too dense. It’s hard to read the PowerPoint. Page 5 Please rate the quality of the workshop:
Strongly Disagree
Somewhat Disagree Neutral Somewhat
Agree Strongly Agree
1. The handouts and the PowerPoint are very useful. ○ ○ ● ○ ○
2. The topics covered are relevant to what I am doing. ○ ○ ○ ○ ●
3. The allocation of time on each topic is appropriate. ○ ○ ○ ○ ●
4. The presentation skills of the presenter are very good. ○ ○ ● ○ ○
5. This workshop is NOT useful to me. ● ○ ○ ○ ○ Comments: Presenter needs to speak louder.
Code Book 1 - Strongly Disagree 2 - Somewhat Disagree 3 - Neutral 4 - Somewhat Agree 5 - Strongly Agree
You may use these materials only for nonprofit educational purposes. Please give credit/cite appropriately. 2