Embed Size (px)
Citation preview

Basics of GIS Floodplain Management and GIS Applications Zac Collins CFM, Sr. GIS Analyst, Atkins Bozeman, MT
2012 Montana Floodplain Resource Seminar

Class Agenda
2:30 – 3:30 Intro to Basic Elements and Terminology
3:30 – 3:40 Break 3:40 – 4:30 GIS exercise
4:30 – 5:00 Open Forum – Q&A

Dawson County, 2003 Yellowstone River Ice Jam
Because floods happen…

What is GIS?
4
● According to Environmental Systems Research Institute,
Inc. (ESRI) GIS “integrates hardware, software, and data for capturing, managing, analyzing, and displaying all forms of geographically referenced information.”
● A powerful software technology that allows a virtually unlimited amount of information to be linked to a geographic location.
● Allows a user to run analysis, simple and/or complex, on may different features within the map area.
(http://www.gis.com/whatisgis/index.html)

Types of GIS Features
5
● Three basic vector data types in GIS:
– Points
– Lines
– Polygons
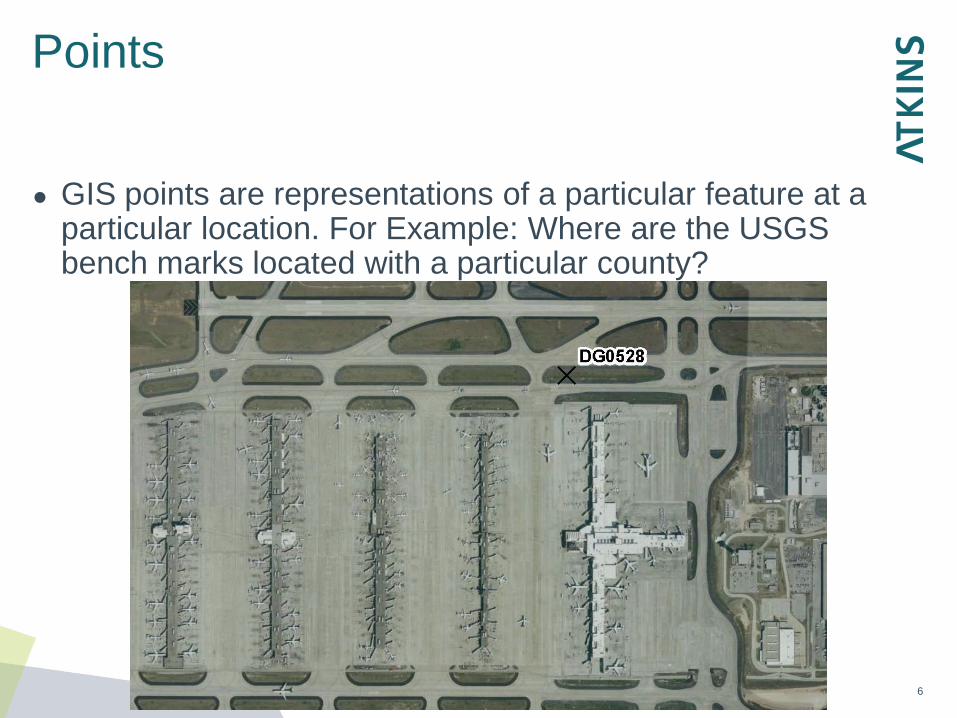
Points
6
● GIS points are representations of a particular feature at a particular location. For Example: Where are the USGS bench marks located with a particular county?

Lines
7
● GIS lines are representations of a particular features boundary. For Example: What does the stream line for Johns Creek look like?

Polygons
8
● GIS polygons are representations of a particular features boundary. For Example: Where does the political boundary for the City of Milton extend to?

Different Types of GIS Files
9
● Shapefiles
● Raster Data
● Feature Classes
Shapefiles
10
● Shapefiles are the files that make up a map
● ESRI shapefiles are made up of 3-7 different files when you look at then in Windows explorer
● DO NOT move or change the names of the files from Windows explorer. That is only to be done within ArcCatalog!!!!

Shapefiles
11

Raster Data
12
● Raster data model stores spatial information by representing the geographic space with grids
● The structure of raster data therefore consists of grids of cells that are made up of pixels. Like in a picture
● Pixel: Individual rectangular grids (picture element).

Raster Data
13

Feature Class
14
● Is the is similar to a shapefile with one BIG difference is that it is located within a geodatabase.
● A geodatabase is a “storage” container for GIS feature classes. Think of a file cabinet.

Projections
15
● A technique to depict with reasonable accuracy the spherical earth in two-dimensional media

Projections
16
Examples of a few map projections:
– Cylindrical projection – Conical projection.
● Projections are not absolutely accurate representation of geographic space.
● Characteristics of properties of map projections (impossible to preserve all at the same time for a large area):
– Angles (shapes) – Distance – Directions

Projections
17

What Makes up a GIS?
U.S. Geological Survey (USGS) digital line graph (DLG) data of roads. USGS DLG of riv USGS DLG of rivers. USGS digital elevation (DEM). USGS DLG of contour lines USGS scanned,Geo-rectified topographic map called a digital raster graphic USGS digital orthophoto quadrangle (DOQ). USGS geologic map
Data Layers Makes A GIS!

19
What is in the DFIRM Database?

GIS has Layers Digital Flood Insurance Rate Maps have Layers
Aerial Imagery
Elevation
Geodetic Control
Boundaries
Surface Waters
Transportation
Political Areas
Special Flood Hazard Areas
DFIRM
Geodatabase
& Map

Base Map Data
21
● Base Map Data is a part of the data that makes up the final DFIRM Database.
● Examples: – Aerial Photos – Stream Lines – Political Boundaries – PLSS Boundaries – Transportation Information – USGS Bench Marks
● Most Base Map data is collected from the local community

What is Done to the Data?
22
● When the Base Map data is collected it is “groomed” to meet FEMA DFIRM DB specification per Appendix L (Guidance for Preparing Draft Digital Data and DFIRM Database)
● Aerial photography is combined into a seamless image in
grayscale (black/white)
● Proper attribution is giving to the data so that it meets Appendix L format

Base Map Data in the DFIRM DB
23
Final DFIRM DB deliverables: • Water lines/Water Bodies • Transportation • Political Boundaries/Political Lines • PLSS Boundaries/PLSS Lines (if applicable) • DFIRM Panel Layout • USGS Quads • USGS Benchmarks • River Markers • Flooding Features

Flood Zone Data
24
The DFIRM DB delivers the following flooding related data: ● Flooding boundaries (Polygons/Lines)
● Base Flood Elevation (BFE) Lines (if applicable)
● Cross Section (XS) Lines (if applicable)
● Flooding Related structures (if applicable)
● Coastal Flooding Features (if applicable)

Finding Data
● Montana GIS Portal – http://gisportal.msl.mt.gov
● Geospatial One Stop – www.geodata.gov/
● The National Map – http://nationalmap.gov/
● GIS Data Hotlist from NRIS: – http://nris.mt.gov/gis/other.asp#fed

26
Inside the DFIRM Panel

Remember these Things were “Basic”
They have been modernized. So have maps…

Advantages of DFIRM Production ● Accurate flood hazard data is available in a
GIS format ● As new data becomes available, revision
process is simplified and expedited ● Flood hazard GIS layer can be put on top of
other GIS layers – tool for analysis and decision making

What is a Digital Flood Insurance Rate Map (DFIRM) ???

“100-Year Floodplain” Special Flood Hazard Areas (SFHAs)
Floodway
Floodplain permits are required in mapped floodway and SFHAs
Digital Flood Insurance Rate Map (DFIRM) Flathead County. 2006

Sample DFIRM

DFIRM vs. FIRM FIRM DFRIM

Flood Insurance Rate Maps (FIRMS) also referred to as Flood Maps

In a “100-Year” Floodplain or Special Flood Hazard Area there is a 1% chance of flooding in a one year period.
Special Flood Hazard Area 100-Year Floodplain

FEMA Map Modernization Program
● 5 –yr. program (2004-2009) ● Purposes:
– Convert Paper Maps to Digital Format: Geographic Information Systems (GIS) Digital Flood Insurance Rate Map (DFIRM) Database
– Perform new studies with funding available to address areas with mapping issues or no mapping.

How Does Map Modernization Work?
● Digitize Flood Insurance Rate Maps (FIRM)
● Produce GIS based maps called Digital Flood Insurance Rate Maps (DFIRM).
● Incorporate Existing Data Studies (XDS)
● Increase the accuracy
– Floodplain Boundary Standards (FBS) –increase floodplain boundary accuracy
– New updated engineering analysis (Hydrologic and Hydraulic)

Flood Map Modernization – What GIS data do you get?
DFIRM Database: ● Geo-referenced flood layer ● Base Map information: roads, streams, water
bodies, community political boundaries ● Aerial Imagery

DFIRM LAYERS ● Political Area S_POL_AR
● Political Line S_POL_LN
● Water Line S_WTR_LN
● Roads S_TRNSPORT_LN
● Firm Panels S_FIRM_PAN
● Base Flood Elevations S_BFE
● Cross Sections S_XS
● Structures S_GEN_STRUCT
● Benchmarks S_PERM_BMK
● PLSS Line S_PLSS_LN
● Flood Hazard Line * S_FLOOD_HAZ_LN
● Flood Hazard Polygon* S_FLOOD_HAZ_AR
● LOMR S_LOMR
● Public Land Survey System Dataset S_PLSS_LN & S_PLSS_AR
* Contains the flood way, 100 year and 500 year data

Risk MAP Program – What GIS data do you get?
Non-regulatory products: - Discovery report and geo-database - Flood Risk report and geo-database - Coordinated Needs Management System (CNMS) geo-
database Regulatory products: - DFIRM database

What is the benefit of having floodplain mapping information in a Geographic Information Systems format?

Community Parcel Map

Locations of Schools &
Hospitals

Combined with New Floodplains

Which Hospital
Should This School Use?
Is This Hospital Under Water?
Can They Even Get to Here??

FEMA Risk MAP Modernization Program ● 2010 ● Purposes:
– Convert Paper Maps to Digital Format: Geographic Information Systems (GIS) DFIRM Database
– Perform new studies with funding available to address areas with mapping issues or no mapping.
– Incorporate Mitigation Planning – Produce Non-Regulatory Flood Risk Information for Communities

Risk Assessment Mitigation
Planning
Risk Identification
Risk Communication
Analyze and depict risk so that Communities and the Public can understand their risk and make informed decisions to
safeguard or avoid that risk.
FEMA’s RiskMAP Strategy

Questions?
47